Reliability Estimation for a Digital Instrument and ... · firmware failure rates, and how to use...
10
RELIABILITY ESTIMATION FOR A DIGITAL INSTRUMENT AND CONTROL SYSTEM YANG YAGUANG 1* and SYDNOR RUSSELL 2 1 Office of Research, Nuclear Regulatory Commission, Rockville, 20850, USA 2 Office of Research, Nuclear Regulatory Commission, Rockville, 20850, USA * Corresponding author. E-mail : [email protected] Invited September14, 2011 Received September 07, 2011 Accepted for Publication March 10, 2012 1. INTRODUCTION Digital instrumentation and control (DI&C) systems are widely adopted in various industries, as their flexibility and ability to implement various functions can be used to monitor, analyze, and control complex systems automatically. It is anticipated that DI&C systems will replace the traditional analog instrumentation and control (AI&C) systems in future nuclear reactor designs. There is increasing interest in reliability and risk analyses for safety-critical DI&C systems in regulatory organizations, such as The United States Nuclear Regulatory Commission. Developing reliability models and reliability estimation methods for digital control and protection systems will involve every part of the DI&C system, such as the sensors, signal conditioning and processing components, transmission lines and digital communication systems, (digital to analog) D/A and (analog to digital) A/D converters, computer system, signal processing software, control and protection software, power supply system, and actuators. Some of these components are analog hardware, such as the sensors and actuators. Their failure mechanisms are well understood, and the traditional reliability model and estimation methods can be directly applied. However, many of these components include (a) digital hardware, such as boards, cards, or FPGAs (field- programmable gate arrays) which contain digital gates and/or memory composed of millions of transistors, capacitors, resistors, and associated communication links; (b) firmware which has software embedded into the digital hardware so that it can provide complex functions as desired; (c) system software such as Unix, Linux or Windows which coordinates the work of a system composed of digital hardware and firmware (boards and cards), and provides an interface for application users; and (d) application software which monitors (via sensors) and controls (via actuators) safety-related and non-safety- related nuclear power plant systems. To estimate the realibility of such a large system is challenging. In particular, the software needs special consideration because its failure mechanism is unique; the reliability estimation method for a software system should be different from that used for hardware. Owing to regulatory needs in the nuclear industry and the technical challenges, many attempts have been made to find practical ways to improve the software reliability and to estimate the reliability. Dennis Lawrence [1] discussed activities that should be carried out throughout the software life cycle. Parnas, Asmis, and Madey [2] emphasized documentation requirements and quality control, including testing and reviews. Leveson and Harvey [3] proposed software fault tree analysis method. However, the most extensively investigated software reliability method is the software reliability growth model [4]. Many statistics models, such as the exponential distribution, Poisson distribution, Weibell distribution, and Gamma distribution models have been considered, and many different scenarios have been discussed [5-8]. Nonetheless, there is no formed consensus on an ideal software reliability estimation method. In this paper, we propose a reliability estimation method for DI&C systems. At the system level, a fault tree model is suggested and Boolean algebra is used to obtain the minimal cut sets. At the component level, an exponential distribution is used to model hardware failures, and Bayesian estimation is suggested to estimate the failure rate. Additionally, a binomial distribution is used to model software failures, and a recently developed software reliability estimation method is suggested to estimate the software failure rate. The overall system reliability is then estimated based on minimal cut sets, hardware failure rates and software failure rates. KEYWORDS : Reliability, DI&C, Software Reliability, Fault Tree 1 NUCLEAR ENGINEERING AND TECHNOLOGY, VOL.44 NO.4 MAY 2012 http://dx.doi.org/10.5516/NET.04.2012.513
Transcript of Reliability Estimation for a Digital Instrument and ... · firmware failure rates, and how to use...

RELIABILITY ESTIMATION FOR A DIGITAL INSTRUMENTAND CONTROL SYSTEM
YANG YAGUANG1* and SYDNOR RUSSELL2
1Office of Research, Nuclear Regulatory Commission, Rockville, 20850, USA 2Office of Research, Nuclear Regulatory Commission, Rockville, 20850, USA *Corresponding author. E-mail : [email protected]
Invited September14, 2011Received September 07, 2011Accepted for Publication March 10, 2012
1. INTRODUCTION
Digital instrumentation and control (DI&C) systemsare widely adopted in various industries, as their flexibilityand ability to implement various functions can be used tomonitor, analyze, and control complex systems automatically.It is anticipated that DI&C systems will replace thetraditional analog instrumentation and control (AI&C)systems in future nuclear reactor designs. There is increasinginterest in reliability and risk analyses for safety-criticalDI&C systems in regulatory organizations, such as TheUnited States Nuclear Regulatory Commission.
Developing reliability models and reliability estimationmethods for digital control and protection systems willinvolve every part of the DI&C system, such as thesensors, signal conditioning and processing components,transmission lines and digital communication systems,(digital to analog) D/A and (analog to digital) A/Dconverters, computer system, signal processing software,control and protection software, power supply system,and actuators. Some of these components are analoghardware, such as the sensors and actuators. Their failuremechanisms are well understood, and the traditionalreliability model and estimation methods can be directlyapplied. However, many of these components include (a)digital hardware, such as boards, cards, or FPGAs (field-programmable gate arrays) which contain digital gatesand/or memory composed of millions of transistors,capacitors, resistors, and associated communicationlinks; (b) firmware which has software embedded into the
digital hardware so that it can provide complex functionsas desired; (c) system software such as Unix, Linux orWindows which coordinates the work of a system composedof digital hardware and firmware (boards and cards), andprovides an interface for application users; and (d)application software which monitors (via sensors) andcontrols (via actuators) safety-related and non-safety-related nuclear power plant systems. To estimate therealibility of such a large system is challenging. In particular,the software needs special consideration because its failuremechanism is unique; the reliability estimation methodfor a software system should be different from that usedfor hardware.
Owing to regulatory needs in the nuclear industry andthe technical challenges, many attempts have been madeto find practical ways to improve the software reliabilityand to estimate the reliability. Dennis Lawrence [1]discussed activities that should be carried out throughoutthe software life cycle. Parnas, Asmis, and Madey [2]emphasized documentation requirements and quality control,including testing and reviews. Leveson and Harvey [3]proposed software fault tree analysis method. However,the most extensively investigated software reliabilitymethod is the software reliability growth model [4]. Manystatistics models, such as the exponential distribution,Poisson distribution, Weibell distribution, and Gammadistribution models have been considered, and manydifferent scenarios have been discussed [5-8].Nonetheless, there is no formed consensus on an idealsoftware reliability estimation method.
In this paper, we propose a reliability estimation method for DI&C systems. At the system level, a fault tree model issuggested and Boolean algebra is used to obtain the minimal cut sets. At the component level, an exponential distribution isused to model hardware failures, and Bayesian estimation is suggested to estimate the failure rate. Additionally, a binomialdistribution is used to model software failures, and a recently developed software reliability estimation method is suggested toestimate the software failure rate. The overall system reliability is then estimated based on minimal cut sets, hardware failurerates and software failure rates.KEYWORDS : Reliability, DI&C, Software Reliability, Fault Tree
1NUCLEAR ENGINEERING AND TECHNOLOGY, VOL.44 NO.4 MAY 2012
http://dx.doi.org/10.5516/NET.04.2012.513
At the system level, several probabilistic reliabilityanalysis models of DI&C systems are discussed in IECstandard 61508 [9]. One of the widely used models in thenuclear industry is the fault tree/event tree model, whichwas first conceived by Watson [10] in 1961. This methodwas discussed in detail in [11]. It has had many applications,including some recent attempts to demonstrate a PRA(probabilistic risk analysis) for a digital instrumentationand control system [12] and for an ESBWR (economicsimplified boiling water reactor) PRA analysis describedin the ESBWR certification PRA document [13]. Becausethere is no consensus on a method of software reliabilityestimation despite the great efforts expended over the pastfew decades, software reliability is not addressed in [12]and software reliability is assumed to be some constant in[13], both of which are less than ideal.
In this paper, we propose a reliability estimationmethod for DI&C systems using a recently developedsoftware reliability estimation method and a traditionalhardware reliability estimation method. For the purposeof completeness, we will briefly describe the traditionalhardware reliability estimation method so that we can showhow this method is incorporated into the probabilisticreliability analysis of DI&C systems. Our main focus,however, is our own idea on how to model software failuresand how to estimate software reliability based on thesoftware failure model and test results, as well as how toevaluate overall the reliability of the DI&C systems.
The remainder of the paper is organized as follows.Section 2 presents the fault tree reliability model for DI&Csystems and explains the modeling procedures using asimple artificial example. Section 3 briefly discusses ahardware reliability model and failure rate estimationmethod. Section 4 introduces a software reliability modeland discusses in detail the software failure rate estimationmethod. Section 5 provides a reliability model and failurerate estimation method for firmware, which has softwareembedded into hardware. Section 6 presents the estimationmethod to determine the overall DI&C system failure rate.The last section gives the conclusions of this paper.
2. SYSTEM RELIABILITY MODEL
In this section, we discuss how the fault tree methodis applied to create a full reliability model of a digitalinstrumentation and control system, which includes bothsoftware and hardware.
The first consideration in building such a systemreliability model is the level of detail that is needed in thisreliability model. In theory, the more details the modelhas, the higher the level of fidelity the model will exhibit.However, this may not be realistic. For example, digitalcircuit boards can have millions of transistors. If weinclude all of these transistors, the model will be toocomplicated. Given that acceptance tests and pass/faildecisions are most likely conducted at the board level,we suggest that the level of detail should not be deeperthan the board level. All of the hardware and softwareshould be included, but the hardware and software shouldbe considered separately because the failure mechanismis different and the reliability models are different, as wewill discuss later.
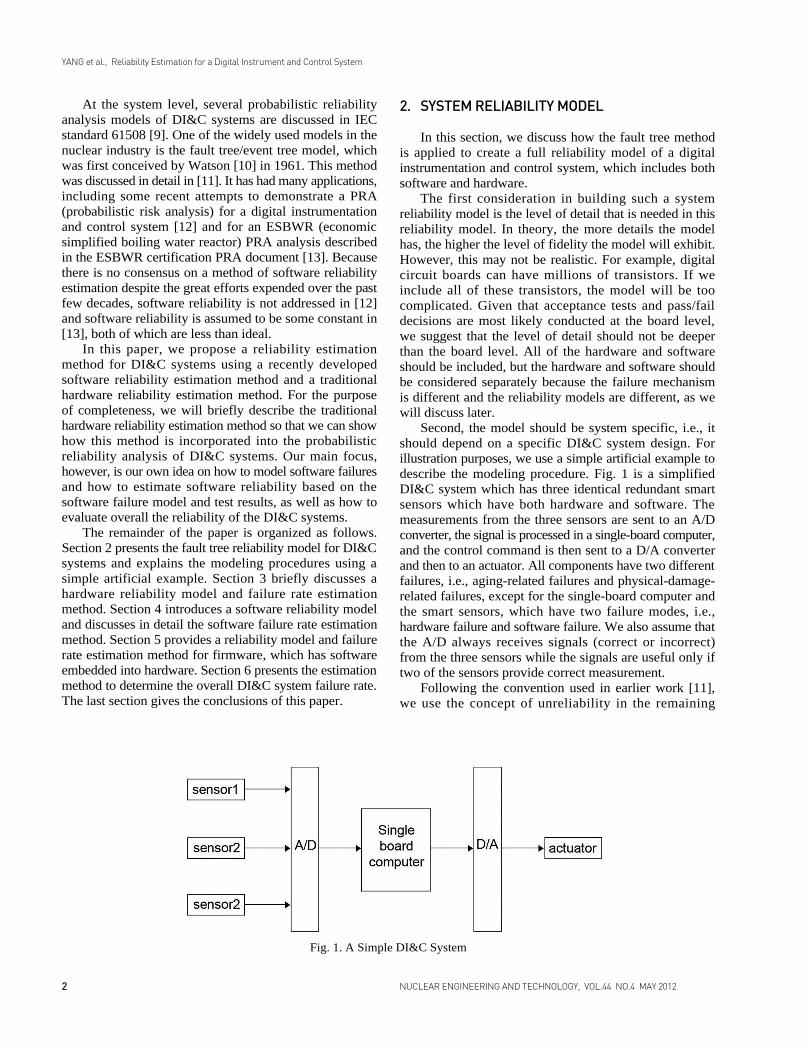
Second, the model should be system specific, i.e., itshould depend on a specific DI&C system design. Forillustration purposes, we use a simple artificial example todescribe the modeling procedure. Fig. 1 is a simplifiedDI&C system which has three identical redundant smartsensors which have both hardware and software. Themeasurements from the three sensors are sent to an A/Dconverter, the signal is processed in a single-board computer,and the control command is then sent to a D/A converterand then to an actuator. All components have two differentfailures, i.e., aging-related failures and physical-damage-related failures, except for the single-board computer andthe smart sensors, which have two failure modes, i.e.,hardware failure and software failure. We also assume thatthe A/D always receives signals (correct or incorrect)from the three sensors while the signals are useful only iftwo of the sensors provide correct measurement.
Following the convention used in earlier work [11],we use the concept of unreliability in the remaining
2 NUCLEAR ENGINEERING AND TECHNOLOGY, VOL.44 NO.4 MAY 2012
YANG et al., Reliability Estimation for a Digital Instrument and Control System
Fig. 1. A Simple DI&C System
3NUCLEAR ENGINEERING AND TECHNOLOGY, VOL.44 NO.4 MAY 2012
YANG et al., Reliability Estimation for a Digital Instrument and Control System
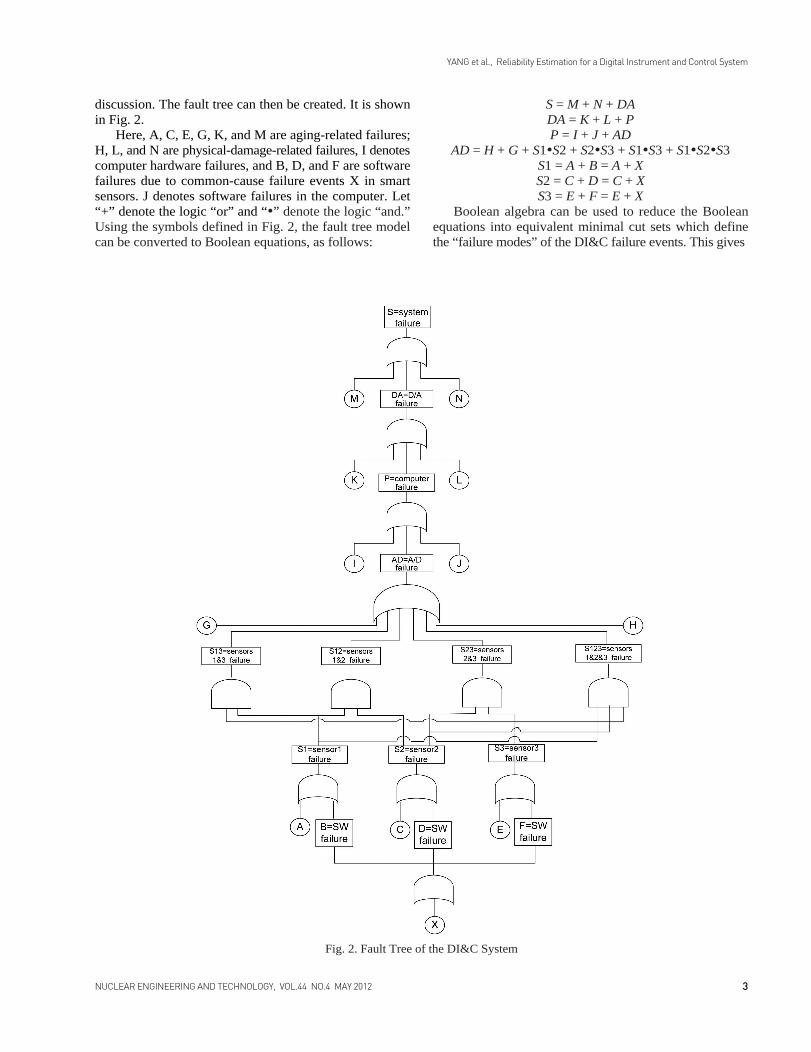
discussion. The fault tree can then be created. It is shownin Fig. 2.
Here, A, C, E, G, K, and M are aging-related failures;H, L, and N are physical-damage-related failures, I denotescomputer hardware failures, and B, D, and F are softwarefailures due to common-cause failure events X in smartsensors. J denotes software failures in the computer. Let“+” denote the logic “or” and “•” denote the logic “and.”Using the symbols defined in Fig. 2, the fault tree modelcan be converted to Boolean equations, as follows:
S = M + N + DADA = K + L + PP = I + J + AD
AD = H + G + S1•S2 + S2•S3 + S1•S3 + S1•S2•S3S1 = A + B = A + XS2 = C + D = C + XS3 = E + F = E + X
Boolean algebra can be used to reduce the Booleanequations into equivalent minimal cut sets which definethe “failure modes” of the DI&C failure events. This gives
Fig. 2. Fault Tree of the DI&C System

S = M + N + DA = N + M + L + K + P= N + M + L + K + J + I + G + H + S1•S2 + S2•S3 +
S1•S3 + S1•S2•S3= N + M + L + K + J + I + G + H + (A + X)•(C + X) +
(C + X)•(E + X)+ (A + X)•(E + X) + (A + X)•(C + X)•(E + X)= N + M + L + K + J + I + G + H + A•C + C•E + A•E + X
where the last expression represents the minimal cut sets.From the minimal cut sets, it becomes clear that the systemfailure can be caused by single failures, G, H, I, J, K, L, M,N, and X; and by double failures, (A • C), (A • E), (C • E).The evaluation of the minimal cut set (failure mode)probabilities and the system failure probability can bestraightforward if the component failure probabilities areobtained. It should be noted that this modeling methoddoes include a specific common-cause failure, i.e., whenB, D, and F, the software in smart sensors, fail at the sametime due to common-cause failure X.
More details on fault tree models can be found in theliterature [11] and one can always follow the standard givenin earlier work [9]. Very detailed examples [11] can alsobe accessed while creating a unique fault tree model. Inthe remainder of the paper, we assume that a fault tree fora specific DI&C system has been created, that minimal cutsets were obtained using Boolean algebra, and that singlefailure paths and multiple failure paths were given by theminimal cut sets. We will focus on the details of how toobtain the hardware failure rates, software failure rates,firmware failure rates, and how to use the failure rates andminimal cut sets to estimate the overall DI&C systemreliability.
3. HARDWARE COMPONENT FAILURE MODEL
3.1 Hardware Probabilistic Failure ModelIn the aforementioned study [11], the model for the
constant failure rate per hour, which has an exponentialdistribution, is suggested as a component failure model. Theadvantage of this model is its simplicity and the fact thatit characterizes the main feature of hardware failures; i.e.,the failure probability increases over time. For this model,the probability F(t) that the component experiences its firstfailure within time period t, given it is initially operation, is
The reliability R(t) is given by the following equation:
The density of the exponential distribution f (t) isgiven by
More complicated models, such as the Weibull andGamma failure distribution models can be used in a similarway [14], but they are not discussed in this paper because,
for the fault tree model, the exponential distribution isadequate [11, XI-10].
3.2 Hardware Failure Rate EstimationFor an exponential distribution, the failure rate λ for
different components can be found in various documents,such as [15-16]. However, most failure rate data collectionsare either too old or too small for real applications, andmany do not provide details on how the data were collectedand calculated [12]. Another means of obtaining the failurerate information is from hardware vendors, as theynormally conduct reliability tests of their products andmay have reasonably accurate failure rate estimations fortheir specific pieces of equipment. We recommend here aBayesian estimation method which can be used to estimatethe hardware failure rate either by vendors, systemintegrators, or by regulatory staff members. Let g(λ) be apriori distribution of the failure rate λ. Let n be the numberof the total tested hardware components and ti be the timewhen the i th hardware component fails in the test. Therefore,the average time for the hardware to fail in the test is
Using Bayesian principles, the posterior density of λ issourced from earlier work, as follows [17]:
For the sake of algebraic convenience, a conjugate prioriof gamma distribution is suggested for λ, which results in
where α can be interpreted as the number of prioriobservations and β as the sum of the prior observations.The posterior density has the form of a gamma distribution,as follows (see [18]):
The estimated failure rate –λ is the mean of (7), i.e.,
If α = 0.5, β = 0, and n = 1, (8) is the same as theformula given in earlier work [19]. However, we believethat (8) is a better formula for general cases because itresults from the assumption that the failure rate satisfiesan exponential distribution.
4. SOFTWARE COMPONENT FAILURE MODEL
Software failures are fundamentally different from
4 NUCLEAR ENGINEERING AND TECHNOLOGY, VOL.44 NO.4 MAY 2012
YANG et al., Reliability Estimation for a Digital Instrument and Control System
(1)
(2)
(3)
(7)
(4)
(8)
(6)
(5)
hardware failures. Typical hardware failures are due towear out or aging-related failures. Therefore, hardwarefailure models are based on a random failure time thatcan be described by exponential, Poisson, Weibull, orGamma distributions, for example. However, typicalsoftware failures are due to undetected human errors incertain parts of the software and failures are triggered bycombinations of specific events and input data sets. Afailure occurs when triggering events direct software toexecute a problematic part of the software and a triggeringdata set is in use. Therefore, software failure models basedon a random failure time may be inappropriate. Instead,we should consider software-specific failure characteristicswhile developing a useful software reliability model andintroducing a software reliability estimation method. Inparticular, we model the software failure probability usinga binomial distribution. If a piece of software containssome error(s), then there is a probability that the softwarewith error(s) will fail if some triggering event occurs andif a triggering data set is in use. Moreover, a test will catchthe failure when this occurs. The software failure rate isthen introduced according to the ratio of the executiontime of distributions faulty software that causes failure(s)and the total execution time.
Though there is no consensus on a method to be usedfor software reliability assessments, we believe that arecently developed test-based method is well suited forsoftware reliability estimations [20].
4.1 Flow Network Model of SoftwareIt was suggested in the referenced work [20] that the
structure of the software should be taken into considerationin software reliability assessments because (a) it reflectsthe individual software complexity, and (b) tests are notequally executed in every line of code. This lower levelof detail should give better reliability estimations thanthe black box model [21] because more information isused in the estimation. To simplify our presentation andsave space, we focus on single-thread software. For amulti-thread case, we refer the readers to the literature [22].
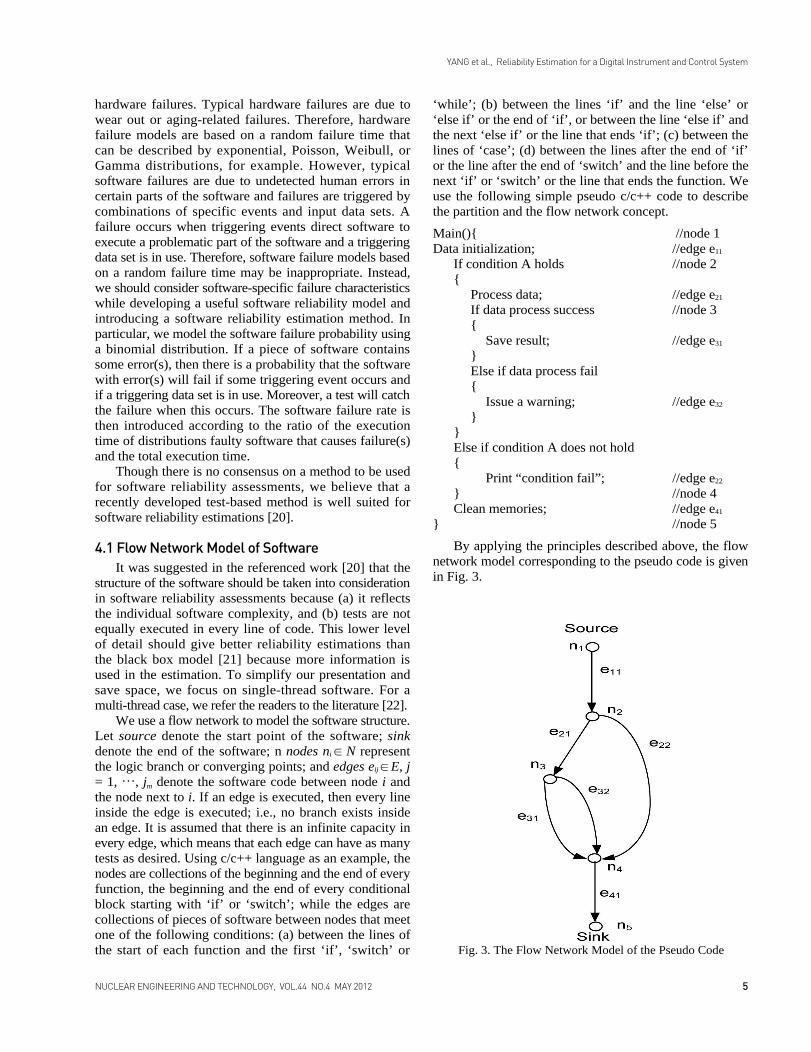
We use a flow network to model the software structure.Let source denote the start point of the software; sinkdenote the end of the software; n nodes ni ∈ N representthe logic branch or converging points; and edges eij ∈ E, j= 1, …, jm denote the software code between node i andthe node next to i. If an edge is executed, then every lineinside the edge is executed; i.e., no branch exists insidean edge. It is assumed that there is an infinite capacity inevery edge, which means that each edge can have as manytests as desired. Using c/c++ language as an example, thenodes are collections of the beginning and the end of everyfunction, the beginning and the end of every conditionalblock starting with ‘if’ or ‘switch’; while the edges arecollections of pieces of software between nodes that meetone of the following conditions: (a) between the lines ofthe start of each function and the first ‘if’, ‘switch’ or
‘while’; (b) between the lines ‘if’ and the line ‘else’ or‘else if’ or the end of ‘if’, or between the line ‘else if’ andthe next ‘else if’ or the line that ends ‘if’; (c) between thelines of ‘case’; (d) between the lines after the end of ‘if’or the line after the end of ‘switch’ and the line before thenext ‘if’ or ‘switch’ or the line that ends the function. Weuse the following simple pseudo c/c++ code to describethe partition and the flow network concept.
Main(){ //node 1Data initialization; //edge e11
If condition A holds //node 2{
Process data; //edge e21
If data process success //node 3{
Save result; //edge e31
}Else if data process fail{
Issue a warning; //edge e32
}}Else if condition A does not hold{
Print “condition fail”; //edge e22
} //node 4Clean memories; //edge e41
} //node 5
By applying the principles described above, the flownetwork model corresponding to the pseudo code is givenin Fig. 3.
5NUCLEAR ENGINEERING AND TECHNOLOGY, VOL.44 NO.4 MAY 2012
YANG et al., Reliability Estimation for a Digital Instrument and Control System
Fig. 3. The Flow Network Model of the Pseudo Code
6 NUCLEAR ENGINEERING AND TECHNOLOGY, VOL.44 NO.4 MAY 2012
YANG et al., Reliability Estimation for a Digital Instrument and Control System
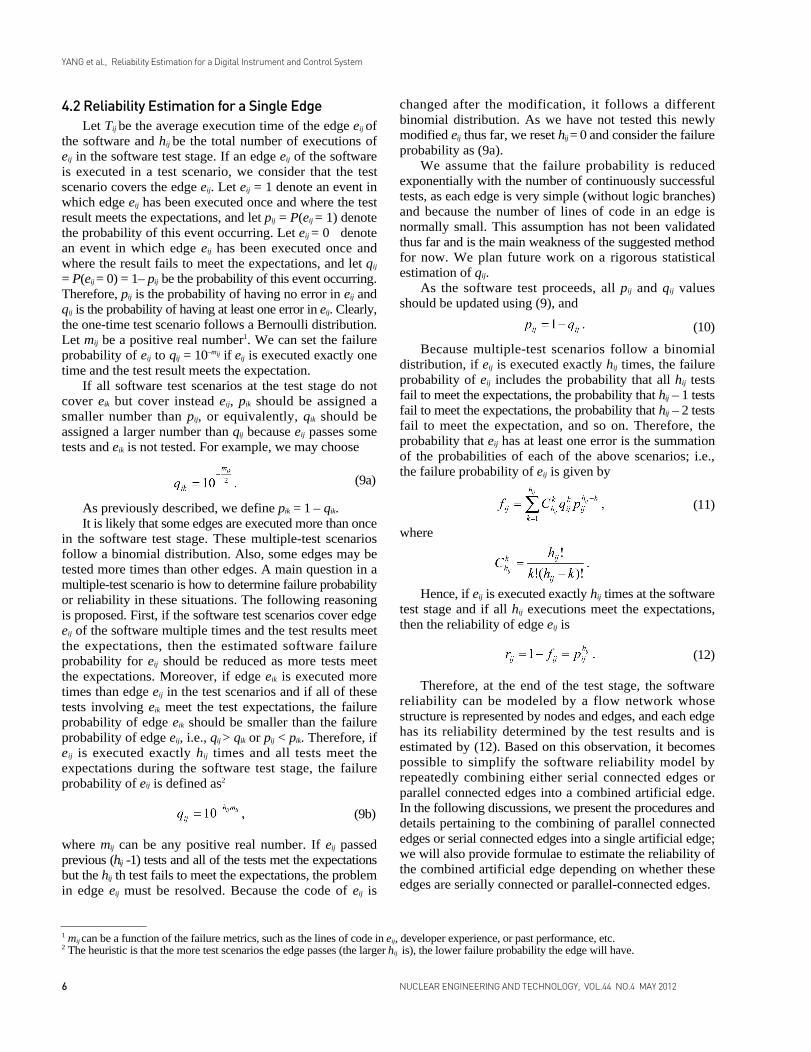
4.2 Reliability Estimation for a Single EdgeLet Tij be the average execution time of the edge eij of
the software and hij be the total number of executions ofeij in the software test stage. If an edge eij of the softwareis executed in a test scenario, we consider that the testscenario covers the edge eij. Let eij = 1 denote an event inwhich edge eij has been executed once and where the testresult meets the expectations, and let pij = P(eij = 1) denotethe probability of this event occurring. Let eij = 0 denotean event in which edge eij has been executed once andwhere the result fails to meet the expectations, and let qij
= P(eij = 0) = 1– pij be the probability of this event occurring.Therefore, pij is the probability of having no error in eij andqij is the probability of having at least one error in eij. Clearly,the one-time test scenario follows a Bernoulli distribution.Let mij be a positive real number1. We can set the failureprobability of eij to qij = 10–mij if eij is executed exactly onetime and the test result meets the expectation.
If all software test scenarios at the test stage do notcover eik but cover instead eij, pik should be assigned asmaller number than pij, or equivalently, qik should beassigned a larger number than qij because eij passes sometests and eik is not tested. For example, we may choose
As previously described, we define pik = 1 – qik.It is likely that some edges are executed more than once
in the software test stage. These multiple-test scenariosfollow a binomial distribution. Also, some edges may betested more times than other edges. A main question in amultiple-test scenario is how to determine failure probabilityor reliability in these situations. The following reasoningis proposed. First, if the software test scenarios cover edgeeij of the software multiple times and the test results meetthe expectations, then the estimated software failureprobability for eij should be reduced as more tests meetthe expectations. Moreover, if edge eik is executed moretimes than edge eij in the test scenarios and if all of thesetests involving eik meet the test expectations, the failureprobability of edge eik should be smaller than the failureprobability of edge eij, i.e., qij > qik or pij < pik. Therefore, ifeij is executed exactly hij times and all tests meet theexpectations during the software test stage, the failureprobability of eij is defined as2
where mij can be any positive real number. If eij passedprevious (hij -1) tests and all of the tests met the expectationsbut the hij th test fails to meet the expectations, the problemin edge eij must be resolved. Because the code of eij is
changed after the modification, it follows a differentbinomial distribution. As we have not tested this newlymodified eij thus far, we reset hij = 0 and consider the failureprobability as (9a).
We assume that the failure probability is reducedexponentially with the number of continuously successfultests, as each edge is very simple (without logic branches)and because the number of lines of code in an edge isnormally small. This assumption has not been validatedthus far and is the main weakness of the suggested methodfor now. We plan future work on a rigorous statisticalestimation of qij.
As the software test proceeds, all pij and qij valuesshould be updated using (9), and
Because multiple-test scenarios follow a binomialdistribution, if eij is executed exactly hij times, the failureprobability of eij includes the probability that all hij testsfail to meet the expectations, the probability that hij – 1 testsfail to meet the expectations, the probability that hij – 2 testsfail to meet the expectation, and so on. Therefore, theprobability that eij has at least one error is the summationof the probabilities of each of the above scenarios; i.e.,the failure probability of eij is given by
where
Hence, if eij is executed exactly hij times at the softwaretest stage and if all hij executions meet the expectations,then the reliability of edge eij is
Therefore, at the end of the test stage, the softwarereliability can be modeled by a flow network whosestructure is represented by nodes and edges, and each edgehas its reliability determined by the test results and isestimated by (12). Based on this observation, it becomespossible to simplify the software reliability model byrepeatedly combining either serial connected edges orparallel connected edges into a combined artificial edge.In the following discussions, we present the procedures anddetails pertaining to the combining of parallel connectededges or serial connected edges into a single artificial edge;we will also provide formulae to estimate the reliability ofthe combined artificial edge depending on whether theseedges are serially connected or parallel-connected edges.
(9a)
(11)
(9b)
(10)
(12)
1 mij can be a function of the failure metrics, such as the lines of code in eij, developer experience, or past performance, etc.2 The heuristic is that the more test scenarios the edge passes (the larger hij is), the lower failure probability the edge will have.

4.3 Reliability Estimation for Parallel EdgeFirst, for a block under node ni composed of jm parallel
connected edges, the total number of executions of allparallel connected edges eij during the test stage is
and the total execution time of all parallel connected edgeseij under node ni during the test stage is the summation ofthe execution time multiplied by the number of executionsof every edge, i.e.,
Given that edge eij has hij executions in the test stageand each parallel edge with multiple tests follows abinomial distribution,
holds for every parallel connected edge immediatelyunder node ni. As every edge in the parallel structure has itsown binomial distribution (pij + qij)hij and its own executiontime hijTij, the binomial distribution for the entire parallelstructure which has a total execution time of Ti should bea convex combination of the binomial distributions ofindividual edges weighted by ; i.e., an edge that has
longer execution time has a larger weight, and the summation
of all of the weights is Therefore, the distribution
of parallel edges should satisfy, considering (14) and(15), the following relationship:
Hence, immediately following (16), the reliability ofthe block composed of the parallel connected edges undernode ni is the event that every test has successfully passed.The probability of this event is given by
The number of executions of the combined artificialedge used in the next model reduction step is taken as thesummation of the number of the executions of all of theedges in the parallel block,
The equivalent execution time for the combinedartificial edge (from the parallel block) used in the next
model reduction step is
The same method can be applied to the parallelconnected blocks, including blocks that are reduced toartificial edges.
4.4 Reliability Estimation for Serial EdgeFor a block under node ni1 composed of nodes i1,…,is
and serially connected edges (there are no parallel connectededges in all nodes i1,…,is), the total number of executionsof all serially connected edges eij during the test stage ishi = hij for any i ∈ i1,…, is, and the total execution time ofall serially connected edges eij under node ni during the teststage is the summation of the execution time multipliedby the number of executions of every edge, i.e.,
Given that edge eij has exactly hij executions in thetest stage and each serial edge with multiple tests followsa binomial distribution,
holds for all serially connected edges immediately undernode ni1. For the serially connected edges, the reliabilityof the entire block is the product of the reliabilities of theindividual edges. Considering (21), the followingrelationship immediately holds:
Hence, the reliability of the block composed of seriallyconnected edges under node ni1 in the software is the eventthat every test has successfully passed. The probability ofthis event is given by
The number of executions of the combined artificialedge used in the next model reduction step is taken as thenumber of executions of any edge hij, where i ∈ i1,…, is, inthe serial block, and
The equivalent execution time for the combinedartificial edge (from the serial block) used in the nextmodel reduction step is
The same method can be applied to the seriallyconnected blocks, including blocks that are reduced toartificial edges.
7NUCLEAR ENGINEERING AND TECHNOLOGY, VOL.44 NO.4 MAY 2012
YANG et al., Reliability Estimation for a Digital Instrument and Control System
(13)
(14)
(18)
(20)
(21)
(22)
(23)
(25)
(24)
(19)
(15)
(16)
(17)

4.5 Overall Reliability Estimation of the SoftwareThe overall reliability of the software is estimated as
follows. First, construct the flow network as discussed inSection 4.1. As testing proceeds, repeatedly use (9-12) toupdate the reliability for each edge. The reliability ofeach edge is obtained when the test finishes. Given thereliabilities of all of the edges, one can use equations (16-19) to simplify parallel-connected edges into a singleartificial edge and use equations (22-25) to simplifyserially connected edges into a single artificial edge. Thesoftware reliability is obtained by repeating the processuntil all of the edges are combined into a single artificialedge. We then obtain the total equivalent test time T andthe software reliability R. An example is used to describethe process in the next subsection.
4.6 An ExampleThe pseudo c/c++ code example introduced in Section
4.1 is used to demonstrate how this software reliabilityestimation method works. The software partitioned as inFig. 4 (a) has five nodes and six edges. Assume also thatthree tests are conducted. The first test path is e11e21e31e41,the second test path is e11e21e32e41, and the third test path ise11e22e41. Assume further that the total test time is T = .00011hours and Tij = .00001 hours for every edge. Therefore,h11=h41=3, h21=2, and h22=h31=h32=1. Assume mij=2 for alledges; thus, p11=p41=0.999999, p31=p32=p22=0.99, andp21=0.9999. The following steps are used to obtain thereliability, starting from the blocks that are composed ofonly either parallel edges or serial edges:
• First, combining e31 and e32 gives T3=h31T31 + h32T32=
0.00002, ; using (17) for the parallel edges
e31 and e32, the flow network is reduced to Fig. 4 (b) with
R31=0.99. Using (18) and (19), we obtain
• Using (23) for the serial connection e21 and E31 to obtainthe combined edge, the flow network is reduced toFig. 4 (c) with R21=0.99992 * 0.992. Using (24) and (25),
we have =0.00002, and H21=h21=H31=2.
• Considering the parallel connection in Fig. 4 (c), T2=
H21T21 + h22T22=0.00005, and and using
(14) for the parallel connection E21 and e22, we reduce
Fig. 4 (c) to Fig. 4 (d) with
Using (18) and (19), we obtain and
• Finally using (23) for serial connection e1, E21, and e41,we have
4.7 Software Failure RateFor our analysis, the software failure rate can be
obtained from the reliability assuming time dependencyof the triggering conditions. Let T be the total test time.Let the software reliability be R during the total test time T ;
8 NUCLEAR ENGINEERING AND TECHNOLOGY, VOL.44 NO.4 MAY 2012
YANG et al., Reliability Estimation for a Digital Instrument and Control System
Fig. 4. Reliability Calculation Procedures
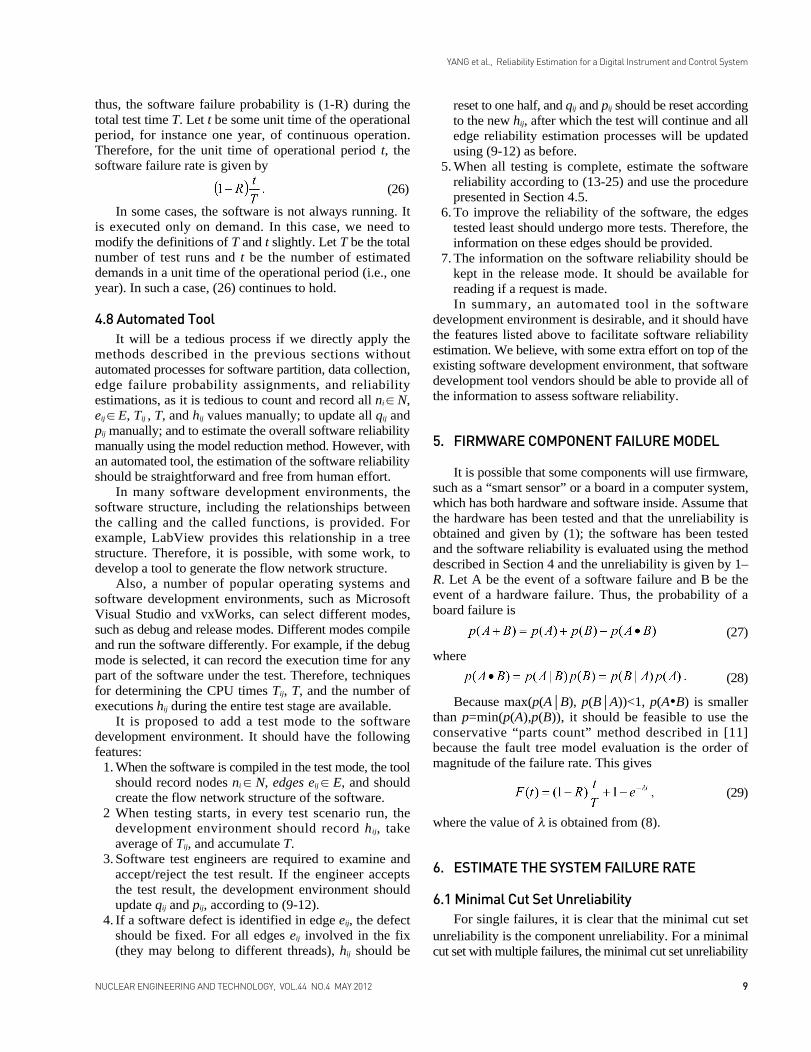
thus, the software failure probability is (1-R) during thetotal test time T. Let t be some unit time of the operationalperiod, for instance one year, of continuous operation.Therefore, for the unit time of operational period t, thesoftware failure rate is given by
In some cases, the software is not always running. Itis executed only on demand. In this case, we need tomodify the definitions of T and t slightly. Let T be the totalnumber of test runs and t be the number of estimateddemands in a unit time of the operational period (i.e., oneyear). In such a case, (26) continues to hold.
4.8 Automated ToolIt will be a tedious process if we directly apply the
methods described in the previous sections withoutautomated processes for software partition, data collection,edge failure probability assignments, and reliabilityestimations, as it is tedious to count and record all ni ∈ N,eij ∈ E, Tij , T, and hij values manually; to update all qij andpij manually; and to estimate the overall software reliabilitymanually using the model reduction method. However, withan automated tool, the estimation of the software reliabilityshould be straightforward and free from human effort.
In many software development environments, thesoftware structure, including the relationships betweenthe calling and the called functions, is provided. Forexample, LabView provides this relationship in a treestructure. Therefore, it is possible, with some work, todevelop a tool to generate the flow network structure.
Also, a number of popular operating systems andsoftware development environments, such as MicrosoftVisual Studio and vxWorks, can select different modes,such as debug and release modes. Different modes compileand run the software differently. For example, if the debugmode is selected, it can record the execution time for anypart of the software under the test. Therefore, techniquesfor determining the CPU times Tij, T, and the number ofexecutions hij during the entire test stage are available.
It is proposed to add a test mode to the softwaredevelopment environment. It should have the followingfeatures:
1. When the software is compiled in the test mode, the toolshould record nodes ni ∈ N, edges eij ∈ E, and shouldcreate the flow network structure of the software.
2 When testing starts, in every test scenario run, thedevelopment environment should record hij, takeaverage of Tij, and accumulate T.
3. Software test engineers are required to examine andaccept/reject the test result. If the engineer acceptsthe test result, the development environment shouldupdate qij and pij, according to (9-12).
4. If a software defect is identified in edge eij, the defectshould be fixed. For all edges eij involved in the fix(they may belong to different threads), hij should be
reset to one half, and qij and pij should be reset accordingto the new hij, after which the test will continue and alledge reliability estimation processes will be updatedusing (9-12) as before.
5. When all testing is complete, estimate the softwarereliability according to (13-25) and use the procedurepresented in Section 4.5.
6. To improve the reliability of the software, the edgestested least should undergo more tests. Therefore, theinformation on these edges should be provided.
7. The information on the software reliability should bekept in the release mode. It should be available forreading if a request is made.In summary, an automated tool in the software
development environment is desirable, and it should havethe features listed above to facilitate software reliabilityestimation. We believe, with some extra effort on top of theexisting software development environment, that softwaredevelopment tool vendors should be able to provide all ofthe information to assess software reliability.
5. FIRMWARE COMPONENT FAILURE MODEL
It is possible that some components will use firmware,such as a “smart sensor” or a board in a computer system,which has both hardware and software inside. Assume thatthe hardware has been tested and that the unreliability isobtained and given by (1); the software has been testedand the software reliability is evaluated using the methoddescribed in Section 4 and the unreliability is given by 1–R. Let A be the event of a software failure and B be theevent of a hardware failure. Thus, the probability of aboard failure is
where
Because max(p(AB), p(BA))<1, p(A•B) is smallerthan p=min(p(A),p(B)), it should be feasible to use theconservative “parts count” method described in [11]because the fault tree model evaluation is the order ofmagnitude of the failure rate. This gives
where the value of λ is obtained from (8).
6. ESTIMATE THE SYSTEM FAILURE RATE
6.1 Minimal Cut Set UnreliabilityFor single failures, it is clear that the minimal cut set
unreliability is the component unreliability. For a minimalcut set with multiple failures, the minimal cut set unreliability
9NUCLEAR ENGINEERING AND TECHNOLOGY, VOL.44 NO.4 MAY 2012
YANG et al., Reliability Estimation for a Digital Instrument and Control System
(26)
(29)
(27)
(28)
is simply determined by the multiplication of the unreliabilityof the components that are composed of the minimal cut set.
6.2 DI&C System UnreliabilityOnce we have determined the unreliability of all of
the minimal cut sets, the unreliability of the entire DI&Csystem is the summation of the unreliability of all theminimal cut sets because the probability of two or moreminimal cut sets occurring simultaneously is negligible[11, XI-19]. As indicated in Section 2, this method hasthe capability to handle common-cause failures.
7. CONCLUSIONS
In this paper, we proposed a systematic method toestimate the reliability of DI&C systems. A fault tree is usedto model DI&C system unreliability, and common-causefailures can easily be treated in this model. Boolean algebrais used to derive the minimal cut sets. An exponentialdistribution is used to model hardware reliability. Bayesianestimation is used to estimate hardware failure rates. Abinomial distribution and flow network are used to modelsoftware reliability, and testing is used to estimate thesoftware failure rates. Using the hardware failure rates andthe software failure rates, the firmware failure rates canbe obtained by the parts-count method. These failure ratescan be used to calculate the minimal cut set unreliability.Finally, the DI&C system unreliability can be obtainedby the summation of all of the unreliability measures ofthe minimal cut sets.
ACKNOWLEDGMENTSThe authors would like to thank three anonymous
reviews for their valuable comments, which lead tosignificant improvements to the presentation of the paper.
REFERENCES_______________________________[ 1 ] J. Dennis Lawrence, “Software Reliability and Safety in
Nuclear Reactor Protection Systems”, US Nuclear RegulatoryCommission, NUREG/CR-6001, 1993.
[ 2 ] David Lorge Parnas, G. J. K. Asmis, and Jan Madey,“Assessment of safety-critical software in nuclear powerplants,” Nuclear Safety, Vol. 32, No. 2 pp.189-198 (1991).
[ 3 ] N. G. Leveson, P. R. Harvey, “Analyzing software safety,”IEEE Trans. On Software Engineering, Vol. 9, pp. 569-579, (1983).
[ 4 ] W. Farr, “Software Reliability Modeling Survey”, inHandbook of Software Reliability Engineering, Edited byMichael R. Lyu, IEEE Computer Society Press andMcGraw-Hill Book Company, pp71-117, 1996.
[ 5 ] S. Kuo, C. Huang, and M. Lyu, “Framework for modelingsoftware reliability, using various testing-efforts and fault-
detection rate,” IEEE Transactions on Reliability, Vol. 50,pp.310-320, 2001.
[ 6 ] H. Okamura, M. Ando, and T. Dohi, “A generalized gammasoftware reliability model,” Systems and Computers inJapan, Vol. 38, pp81-90, 2007.
[ 7 ] W. Wang, T. Hemminger, and M. Tang, “A moving averageNon-Homogeneous Poisson Process Reliability GrowthModel to Account for Software with Repair and SystemStructure,” IEEE Transactions on Reliability, Vol. 56, No.3 pp. 411-421, (2007).
[ 8 ] C. Huang and C. Lin, “Software Reliability Analysis byConsidering Fault Dependency and Debugging Time Lag,”IEEE Transactions on Reliability, Vol. 55, No. 2 pp. 436-450, (2006).
[ 9 ] IEC standard, IEC 61508 (all parts): Functional safety ofelectrical/electronic/programmable electronic safety-relatedsystems, 2008.
[ 10 ] H. A. Watson, “Launch control safety study,” Bell TelephoneLabs, Murray Hill, NJ USA, 1961.
[ 11 ] W. E. Vesely, F. F. Goldberg, N. H. Roberts, and D. F.Haasl, “Fault tree handbook,” US Nuclear RegulatoryCommission, NUREG-0492, 1981.
[ 12 ] T. L. Chu, G. Martine-Guridi, M. Yue, and P. Samanta,“Traditional probabilistic risk assessment methods fordigital system,” US Nuclear Regulatory Commission,NUREG/CR-6962, 2008.
[ 13 ] S. C. Bhatt and R. C. Wachowiak “ESBWR certificationprobabilistic risk assessment,” GE-Hitachi Nuclear Energy,NEDO-33201, Revision 2, 2007.
[ 14 ] A. E. Green and A. J. Bounme, Reliability technology,Wiley-Interscience, London, (1972).
[ 15 ] U.S. Nuclear Regulatory Commission, “Reactor safetystudy-an assessment of accident risks in U.S. commercialnuclear power plant”, NUREG-75/014, October, 1975.
[ 16 ] Department of Defense, “Reliability prediction of electronicequipment, Notice 2,” MIL-HDBK-217F, 1995.
[ 17 ] S. J. Press, Bayesian statistics: principles, models, andapplications, John Wiley & Sons, New York, (1989).
[ 18 ] A. Elfessi and D. M. Eineke, “A Bayesian look at classicalestimation: the exponential distribution,” Journal of StatisticsEducation, 2001, [online] 9(1). http://www.amstat.org/publications/jse/v9n1/elfessi.html
[ 19 ] J. H. Bickel, “Risk Implications of Digital Reactor ProtectionSystem Operating Experience,” Reliability Engineering &System Safety, Vol. 93, pp107-124 (2008).
[ 20 ] Y. Yang, “A flow network model for software reliabilityassessment,” Proceedings of 6th American nuclear societyinternational topical meeting on nuclear plant instrumentation,control, and human-machine interface technologies (2009),Knoxville, April 5-9, 2009.
[ 21 ] T. L. Chu, M. Yue, G. Martinez-Gruidi, and J. Lehner,Review of quantitative software reliability methods, BNL-94074-2010, Brookhaven National Laboratory (2010).
[ 22 ] Y. Yang and R. Sydnor, “Multi-threads software reliabilityestimation based on test results and software structure,”Proceedings of 10th international probabilistic safetyassessment and management conference (2010), Seattle,June 7-11, 2010.
10 NUCLEAR ENGINEERING AND TECHNOLOGY, VOL.44 NO.4 MAY 2012
YANG et al., Reliability Estimation for a Digital Instrument and Control System