Reliability assessment of concrete structures Software package under development: -Project GA...
16
Reliability assessment of concrete structures Software package under development: - Project GA 1O3/02/1030 (Czech Grand Agency) - International project SARA BUT, Faculty of Civil Engineering, Brno Cervenka Consulting, Prague BOKU and TU Vienna
-
Upload
osborne-dennis -
Category
Documents
-
view
215 -
download
2
Transcript of Reliability assessment of concrete structures Software package under development: -Project GA...

Reliability assessment of concrete structures
Software package under development:- Project GA 1O3/02/1030 (Czech Grand Agency)
- International project SARA
BUT, Faculty of Civil Engineering, Brno
Cervenka Consulting, Prague
BOKU and TU Vienna

SARA studio
ATENA
FREET
Modular concept
ATENA Interface

NNononlinelineaar r fracture mechanics fracture mechanics – – FEM FEM software ATENA (Červenka Consulting)software ATENA (Červenka Consulting)
NNononlinelineaar r fracture mechanics fracture mechanics – – FEM FEM software ATENA (Červenka Consulting)software ATENA (Červenka Consulting)
• SBETA material model for concrete damage: 2D failure criterion• Tension:
– nonlinear fracture mechanics, exponential softening – smeared cracks: fictitious crack approach, crack band theory– two crack models: fixed and rotated cracks
• Compression: – non-linear behaviour including softening (crushing)– compressive strength reduction after crack propagation
• Shear: – shear strength reduction of cracked concrete
• Solution methods (equations of equilibrium): – Newton Raphson, Arc-length.
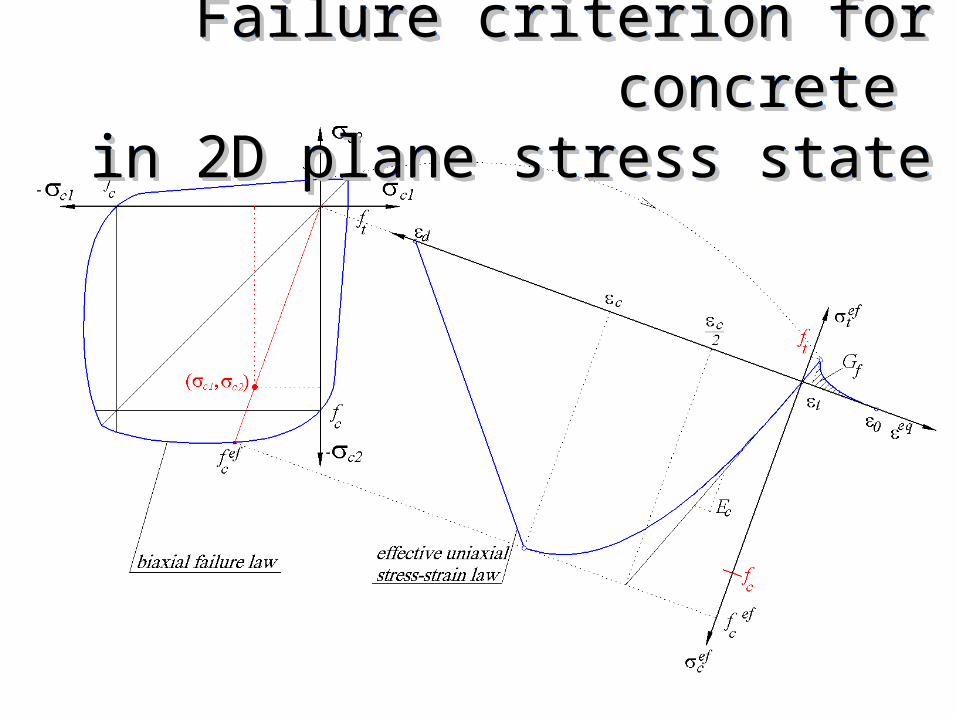
Failure criterion for concrete Failure criterion for concrete in in 2D 2D plane stress stateplane stress state
Failure criterion for concrete Failure criterion for concrete in in 2D 2D plane stress stateplane stress state
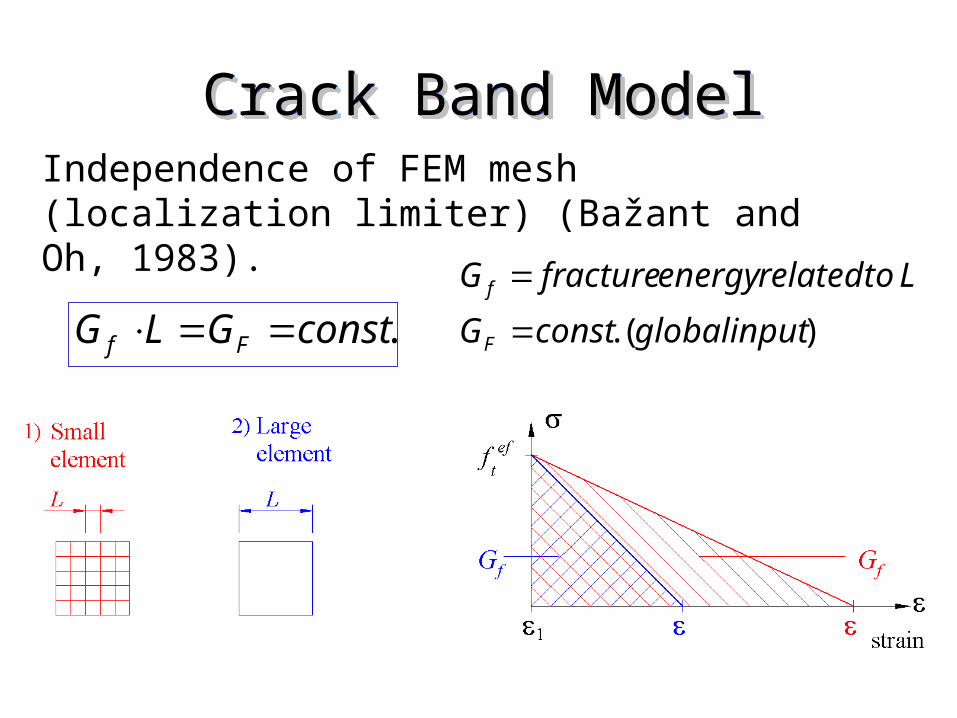
Crack Band ModelCrack Band ModelCrack Band ModelCrack Band Model
Independence of FEM mesh (localization limiter) (Bažant and Oh, 1983).
.constGLG Ff )(. inputglobalconstG
LtorelatedenergyfractureG
F
f

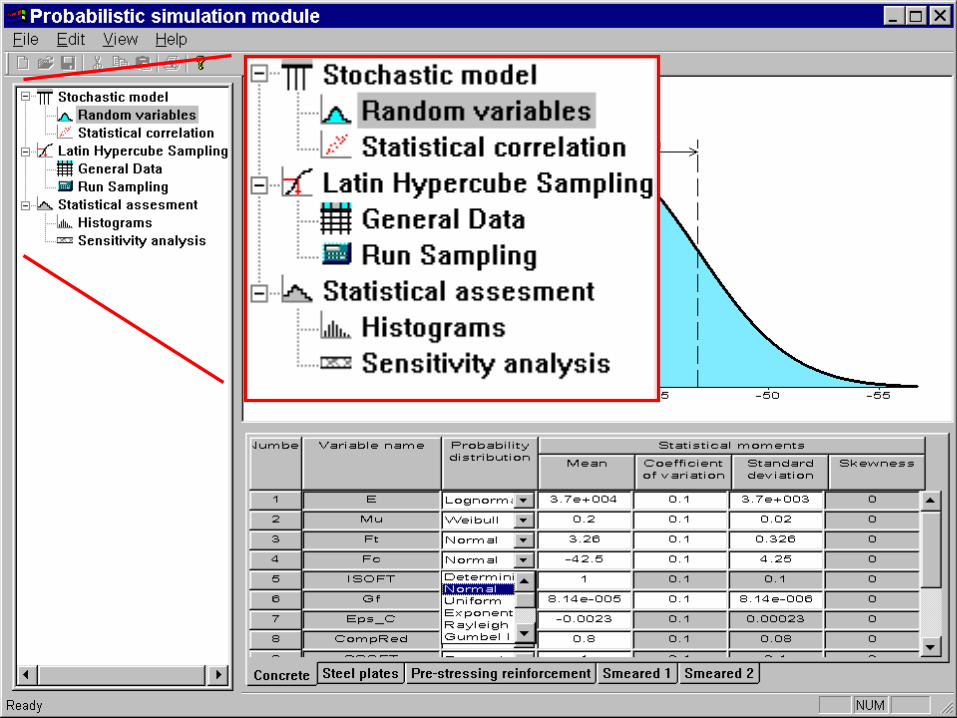
• Uncertainties modelling - random variables by PDF, described by mean value, variance and other statistical parameters.
• Statistical simulation - random input parameters are generated according to their PDF using LHS.
• Generated realizations of random parameters are then used as inputs for ATENA computational model. The complex nonlinear solution is performed and results (response) are saved.
• Previous two steps are repeated N-times (N is the number of simulations used).
• Statistical assessment - the resulting set of structural responses is statistically evaluated: Mean value, variance, coefficient of skewness, histogram, empirical cumulative probability density function of structural response, etc.
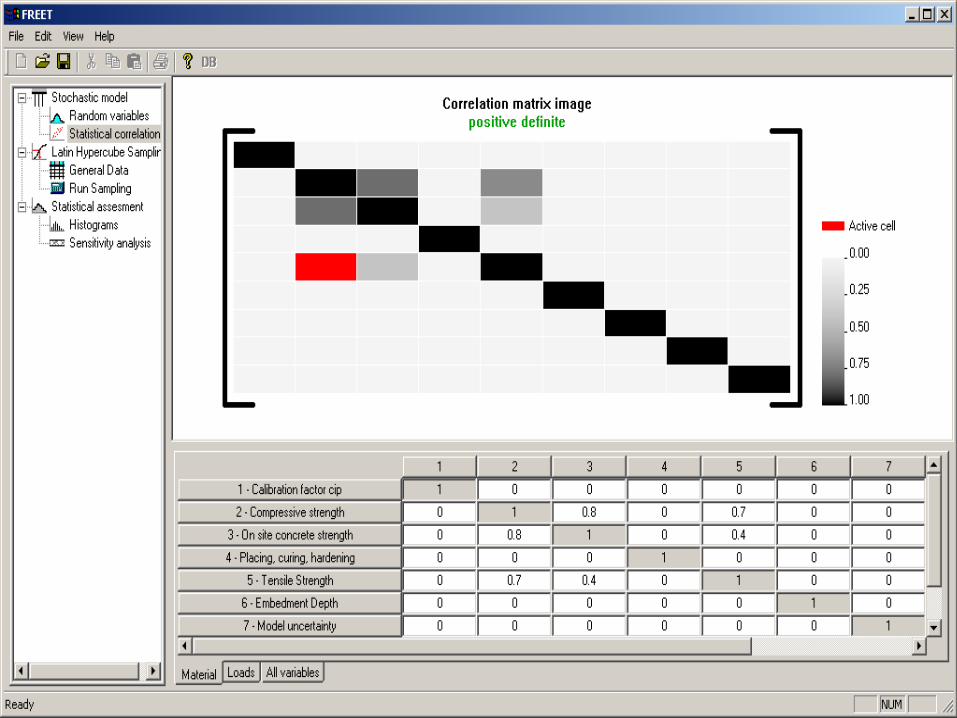
Probabilistic module -Probabilistic module - FREET FREET implementation into ATENAimplementation into ATENA
Probabilistic module -Probabilistic module - FREET FREET implementation into ATENAimplementation into ATENA


Practical example - PORR bridge in Vienna
SARA studio
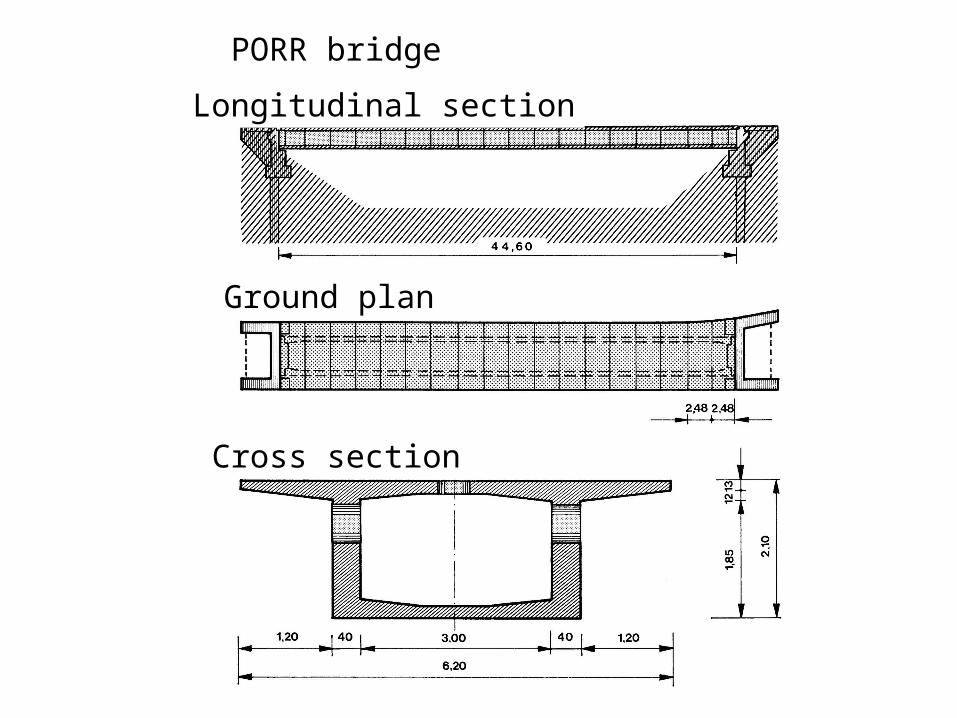
Longitudinal section
Ground plan
Cross section
PORR bridge

Variable Ec ft fc Gfc
Ec 1 0.7 0.9 0.5 0.9ft 0.77 1 0.8 0.9 0.6fc 0.83 0.82 1 0.6 0.9Gf 0.69 0.83 0.75 1 0.5c 0.84 0.77 0.83 0.69 1
Table 2: Correlation matrix for concrete properties
Random variable description Symbol Units Mean value COV Distribution type Reference Concrete grade B500Modulus of elasticity Ec GPa 36.95 0.15 Lognormal 6
Poisson's ratio - 0.2 0.05 Lognormal EstimationTensile strength ft MPa 3.257 0.18 Weibull 6
Compressive strength fc MPa 42.5 0.10 Lognormal 6,7
Specific fracture energy Gf N/m 81.43 0.20 Weibull 8
Uniaxial compressive strain c - 0.0023 0.15 Lognormal 6
Reduction of strength cRed - 0.8 0.06 Rectangular EstimationCritical comp displacement wd m 0.0005 0.10 Lognormal EstimationSpecific material weight MN/m3 0.023 0.10 Normal 9
Prestressing strandsModulus of elasticity Es GPa 200.0 0.03 Lognormal 10
Yield stress fy MPa 1600.0 0.07 Lognormal 10
Prestressing force F MN 21.85 0.04 Normal 9
Area of strands As m2 0.0237 0.001 Normal 9
Table 1: Statistical properties of random variablesTable 1: Statistical properties of random variables

Correlation between variablesusing simulated annealing
Variable Ec ft fc Gf εc
Ec 1 0.7 0.9 0.5 0.9ft 0.77 1 0.8 0.9 0.6fc 0.83 0.82 1 0.6 0.9Gf 0.69 0.83 0.75 1 0.5εc 0.84 0.77 0.83 0.69 1
upper triangle - presribed correlation matrixlower triangle - generated correlation matrix
(8 samples)

Left -Load-deflection curves (8 samples), right - Histogram of ultimate loads (32 samples)
0.0
0.5
1.0
1.5
2.0
2.5
3.0
3.5
-0.05 0.00 0.05 0.10 0.15 0.20 0.25 0.30 0.35 0.40 0.45
deflection [m]
load
[M
N]
D1
D2
D3
D4
D5
D6
D7
D8
D mean
Mean value Variance Standard deviation Coeff. of variation Number of samples[MN] [MN] [MN] -
8 2.52 0.0707 0.266 0.10532 2.51 0.0649 0.255 0.102
Table 3: Estimation of basic statistical parameters of the ultimate load

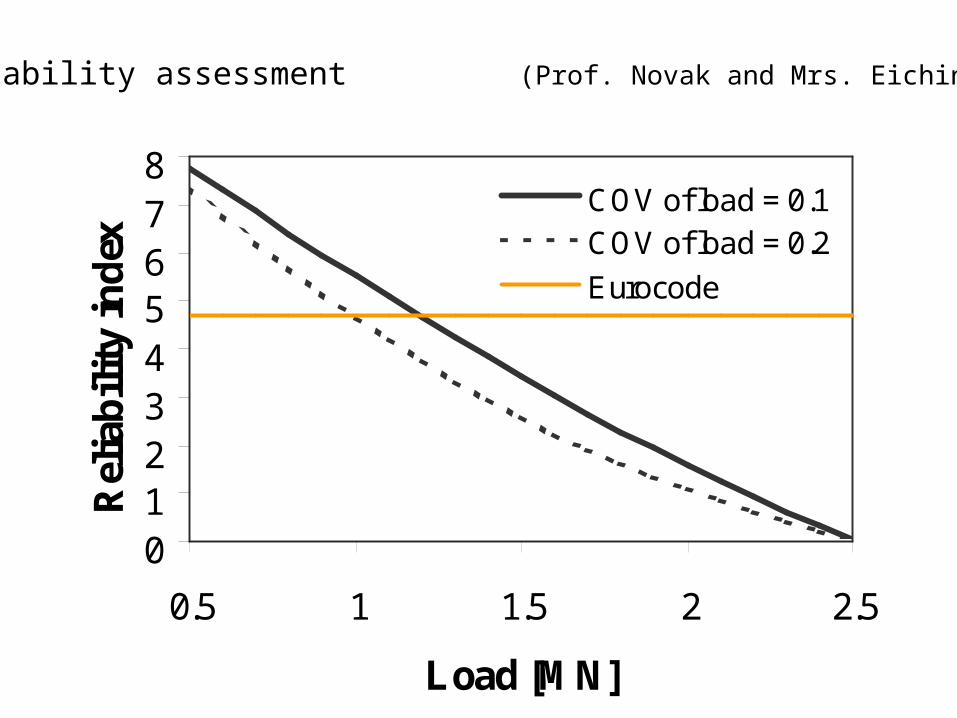
012345678
0.5 1 1.5 2 2.5
Load [MN]
Rel
iab
ilit
y in
dex
COV of load = 0.1COV of load = 0.2
Eurocode
Reliability assessment (Prof. Novak and Mrs. Eichinger)