Reliability Arguments in Classrooms University of New … · Reliability Arguments in Classrooms...
31
Reliability Arguments in Classrooms Jay Parkes Tilia Giron University of New Mexico Paper presented at the Annual Meeting of the National Council on Measurement in Education, San Francisco, CA. Correspondence regarding this paper should be addressed to: Jay Parkes, Educational Psychology Program, 120 Simpson Hall, University of New Mexico, Albuquerque, NM 87131- 1246. e-mail: [email protected]
-
Upload
truongtruc -
Category
Documents
-
view
212 -
download
0
Transcript of Reliability Arguments in Classrooms University of New … · Reliability Arguments in Classrooms...

Reliability Arguments in Classrooms
Jay Parkes
Tilia Giron
University of New Mexico
Paper presented at the Annual Meeting of the National Council on Measurement in Education,
San Francisco, CA.
Correspondence regarding this paper should be addressed to: Jay Parkes, Educational
Psychology Program, 120 Simpson Hall, University of New Mexico, Albuquerque, NM 87131-
1246. e-mail: [email protected]

Making Reliability Arguments in Classrooms
Reliability methodology needs to evolve as validity has done into an argument supported by
theory and empirical evidence. Nowhere is the inadequacy of current methods more visible than
in classroom assessment. Reliability arguments would also permit additional methodologies for
evidencing reliability in classrooms. It would liberalize methodology beyond reliability
coefficients and agreement indices enabling and encouraging more creative yet disciplined
approaches to supporting reliability.
But how does a teacher actually make a reliability argument and, more specifically, support it
with evidence? Where is reliability – stability and consistency -- evident in the organic and all-
too-human day-to-day operations of a classroom? This paper outlines reliability arguments and
shows examples of them with a collaborative project, in assigning a homework grade on a report
card, and in discussing behavioral issues with a parent in a parent-teacher conference.
Making Reliability Arguments in Classrooms
In a 2003 special issue of Educational Measurement: Issues and Practice, Brookhart
called for the development of “classroometrics” (p. 8), measurement theory that works in, and
grows out of, classrooms. She rightfully acknowledged that extant measurement theories and
practice developed out of large-scale testing and are thus ill-fitting in classrooms. We
wholeheartedly agree and have taken on the challenge of imagining what reliability methodology
would look like were it to grow out of classrooms.
But why don’t existing reliability theory and methodologies fit in classrooms very well?
They do not fit because they were developed in situations of “assessment of learning” while
classrooms should be using “assessment for learning” or “assessment as learning” paradigms
(Earl, 2003). That has a couple of philosophical and theoretical aspects to it with very practical
implications in classrooms.
Philosophically and theoretically, how both “assessment” and “learning” have evolved
needs to be understood to see why there’s no longer a good fit of “assessment of learning”
methodologies in “assessment for/as learning” classrooms. As Shepherd (2000) has explained in
more depth, the early days of measurement methodology were also the early days of atomistic
views of learning. Measurement models that fit in “assessment of learning” situations are
sampling procedures that demand independent probes of learning along unidimensional
constructs (Parkes, under review). It’s “dipstick” assessment (Brookhart, 2003) and fits well with
a view of learning as atomistic and cumulative. But, though we’ve come to understand learning
much differently from that (cf. Shepherd, 2000), and though we’ve come to different formats of
assessment that match that definition of learning (Willson, 1991), the psychometric methods

have not also developed. That leaves us with rich definitions of learning being used in
classrooms with authentic, complex assessments, and no sanctioned means of demonstrating the
quality of those assessments. Or rather, the acceptable means available to us to make that
demonstration are so ill-fitting that the assessments don’t appear of quality (Brookhart, 2003).
That places teachers in a very precarious situation. They must either use forms of assessment that
don’t represent their views of learning and don’t measure the learning targets they set for their
students in order that they may be “valid and reliable” or they must do what they professionally
feel is best and rely solely on their intuition and judgment that their assessments are of quality.
Neither is appealing.
From a very practical perspective, methods like Cronbach’s alpha, information functions,
kappa coefficients, and Φ coefficients are not being used, and, let’s face it, will not be used in
everyday classroom settings. Teachers do not use these techniques even when they are trained in
them; and there’s good reason to suggest they should not be trained in them (Stiggins, 1991).
Second, even if teachers were proficient in their use, they do not fit the organic nature of the
assessment demands in everyday classrooms.
The Evolution of Reliability
So how do we extricate ourselves from between this rock and a hard place? It is time for
reliability methodologies to evolve as validity has already done. What was once expressed solely
as a correlation coefficient has grown and changed to an argument that is supported by evidence
(AERA, APA, & NCME, 1999). Reliability, however, has not seen that level of evolution. There
have undeniably been great developments in reliability methodologies – we have lots of choices
there – but the fundamental concept of reliability, the theoretical construct, has not seen much
change. It is still largely defined by its methodologies. Given that these methodologies were

developed largely in large-scale testing situations, they have put strict limits on what “reliable”
means in general but in classrooms particularly.
The first step in this evolution of reliability is to separate the concept of reliability from
the procedures used to evidence it. In large part, the psychometric community has come to
conflate the methodologies used to evidence reliability with the important measurement,
scientific and social values of accuracy, dependability, consistency, stability, and precision. It is
not uncommon to hear that the reliability coefficient is the reliability of a set of scores (or, even
more anachronistically, the reliability of a test) (cf. Brennan, 1998; Thompson & Vacha-Haase,
2000). That is distinctly not the case. The difference can be highlighted in considering the
question, “Can a one-item test be reliable?” The conceptual answer is, “Sure! One question can
be reliable.” The methodological answer is, “Well, we need some kind of replication before we
can estimate its reliability.” In other words, at least two items would have to be used, or the same
item asked on two occasions, or two raters must respond to the single item before an estimate of
the reliability can be made (Brennan, 1998). So the reliability of a one item test and the
methodology for estimating that reliability are distinctly different.
That first step is important because our assertion that reliability methodologies do not fit
in classrooms is sometimes construed to mean that reliability has no place in classrooms. But
that’s a product of the conflation of reliability as a value and reliability as a method. In
classrooms, the values of consistency, accuracy, stability, dependability and precision are just as
important and as relevant as they are in any other part of society (not just to psychometricians).
The methods of evidencing those values don’t fit.
If the values are important but the existing methodologies aren’t going to be employed,
how do teachers show that the decisions they and their students make are accurate, dependable,

etc? Why not let teachers (or anyone, for that matter) do with reliability what is standard practice
in validation and make an argument supported by evidence. We think it is time for the Reliability
Argument (Parkes, under review) to come to classrooms.
The Makings of a Reliability Argument
What, then, are the components of a reliability argument? There are six:
1. A value base in the social and scientific values of dependability, consistency, accuracy,
etc.
2. Clear statements of the purpose and the context of the assessment.
3. The definition of a replication in the particular assessment.
4. A determination of the tolerance or level of reliability needed.
5. The evidence.
6. The Judgment: Pulling it all together
Let us take each in turn to explain in general how a reliability argument is built. Then we
will move to three examples of reliability arguments in ordinary classroom situations.
The Value Base
Which of the several synonyms for reliability is most applicable in a particular classroom
assessment situation? There are some occasions, like feedback to parents about behavior when
consistency of occurrences might be most aligned with the information. At other times, the
consensus among peers might constitute reliability. So the teacher’s job is to identify exactly
what reliability means in a given assessment situation. Which values are most important?
Clear statements of purpose and context
Why a teacher is assessing students is an important component of a reliability argument
because it dictates the strength and amount of reliability evidence and the complexity of the
argument. In the cursory assessment of on-task behavior that teachers do when students are set to
a task, there’s no need for a very strong argument with lots of formal evidence because the
assessment is quick and the consequences slight at any given moment. For a large assignment,
however, that might comprise a large portion of a course grade, the need for an explicit
collection of evidence and argument is more of an issue.
Context also matters a great deal. This is actually the Achilles’ heel of traditional
reliability methodology as applied to classroom settings. Contextual effects on performance are
actually considered error in traditional reliability methodology. In a classroom, however, context
is nearly everything (Brookhart, 2003). Contextual factors like what story a student is reading
will affect their comprehension of that story. So as a classroom teacher hears a student reading
from different books as she compiles a running record of reading comprehension, she needs to be
able to take that into consideration as she forms her judgment. In a writing portfolio, students
might be asked to write about their writing in order to give readers some context about their
writing. What were they trying to achieve in their writing? That piece of context might change
the reader’s judgment about the piece.
What constitutes a replication?
The bedrock of traditional reliability methods is replication (Brennan, 2001), and either
something is a replication or it isn’t. The nuanced, organic situations classroom teachers
encounter are not that cut and dried. For example, when looking at peer feedback on group-work
skills, a teacher needs to read the comments and view the scores while understanding the
particular perspective of the student filling out the form. How do the two students (rater and

rated) get along? Which is more proficient with the content? What’s happening in their lives
today? The teacher needs to be able to take one comment at face value, see a kernel of truth
behind another, and dismiss a third in reaching his conclusion about the student’s group-work
skills. In other words, the teacher must be able to make judgments about which feedback is a
replication, in the traditional sense, and how to weight those replications. That is, not every
rating should be counted as a replication nor should every replication carry equal weight.
Traditional reliability methods index the presence of inconsistency across replications. Teachers
need to explore why there is inconsistency across replications.
Tolerance: How reliable does it have to be?
To some extent, this is an extension of the discussion above about purpose. Depending on
the purpose of the assessment information, the requisite level of reliability changes. Smith (2003)
expresses this as sufficiency of information, how much information does a teacher need to make
a reliable decision. In an assessment with little consequence at the moment, there’s great
tolerance for error. In assessments with great consequence, there’s less tolerance for error.
The Evidence
What kinds of information will the teacher provide to support her judgment that the
assessment decision is reliable? All of the current methodologies are possibilities, though, as we
said earlier, not likely to be used in classrooms. We are thinking mainly of narrative evidence for
classroom teachers. For example, the teacher may explain why some peer ratings were
considered more heavily than others when conferencing with a student about her collaboration
skills. In his comments about the writing portfolio, the teacher may explain the consistency with
which the student made comma errors.
The Judgment: How reliable is it?

The final step is pulling together all of these issues and making a judgment that the
decision is a reliable one. The evidence is considered against the tolerance/ purpose and within a
context and a decision made about the degree of consistency, dependability, or accuracy of the
judgment.
Examples of Reliability Arguments in Classrooms
This has been a somewhat antiseptic exposition thus far. Let’s move into some
classrooms and look at three different situations that would tax current reliability methodologies
and yet are fairly commonplace in an everyday classroom: the assessment of a collaborative
project, assigning a homework grade for a marking period, and discussing behavioral issues with
a parent in a parent-teacher conference. We’ll outline a scenario for each and then make the
reliability argument for each.
Scenario A: The Collaborative Project1
Ms. Baca’s fifth grade class of 24 students at Justin Otter Elementary School is working
on an integrated unit around the theme of plants. It is early spring, so the students go outside on
the school grounds and in pairs select a living plant specimen. Over a period of 2 months,
students observe the changes taking place with their specimens. They record the changes through
a series of measurements and by photographing them with digital cameras.
Each week students photograph the plant parts and measure and record the length and
width of the bud. They also learn how to input numbers into the computer to produce graphs that
illustrate not only the size of the bud but the difference in size. They then graph the width and
length of the bud.
1 This example is adapted from a lesson plan downloaded on 2/7/06 from http://www.kodak.com/global/en/consumer/education/lessonPlans/lessonPlan143.shtml

Each week they analyze the plant changes, write a two-paragraph description of them and
present in small groups of four the changes as well as what their predictions are for the plant the
upcoming week. The team members in the group provide each other feedback on their
descriptions. At the end of the two months, each student produces a written report about their
observations, and the group does a presentation to the class about what has happened with their
plant.
The grade for this project will consist of three parts: a grade for each student’s written
report, a grade on the group presentation, and a grade for each individual on their collaborative
skills.
Written Report – This is scored by Ms. Baca using the Scientific Report Rubric (see
Appendix A). The rubric is available to students from the beginning of the project. This
represents 50% of the project grade.
Group Presentation – This is scored by Ms. Baca and by classmates using the Lab
Presentation Rubric with comments (see Appendix A). The rubric is available to students
from the beginning of the project. A “trimmed average” (dropping the highest and lowest
ratings) of these scores represents 30% of the project grade.
Collaboration Skills – At least once each week, each student rates his or her partner on the
Collaboration Rubric (see Appendix A) and includes comments in reference to the small
group work. At least twice during the unit, Ms. Baca also completes the rubric on each
student. An average of all of these scores represents 20% of the project grade, but the earlier
scores are weighted less than the later scores, and she drops the lowest set of scores.
Scenario A: The Reliability Argument

How reliable is the overall project score? Here’s what the reliability argument might look
like.
The Value Base. The total project score is a composite of three separate scores, and the
value inherent in each is different. For the written report, the value is consistency across the
different reports. Ms. Baca doesn’t wish to be lenient for some and harsh for others or to permit
any of the known rater effects to impact her scoring. With the group presentation scores, the
value is consistency or stability across different raters. And for the collaboration scores, the value
is consensus.
Purpose and Context. The purpose of the overall score is to contribute to a student’s
grade primarily in science. Given the amount of time involved, we might infer that it will be a
substantial portion of the grade.
Context has an impact on all three components of the assessment. For the written report,
Ms. Baca is aware that context is working against her. She’ll use all of the advice she got in her
classroom assessment class to prevent rater effects from having undue influence on students’
scores. She knows that seeing the students’ names, the order in which she reads the reports, and
her own comfort with the rubric all may introduce error into the scoring process. For the group
presentation rubrics, she knows that having students rate each others’ presentations is a good
way for them to continue to internalize the criteria of a good presentation. She also knows that
there won’t be uniform understandings of the rubric among the students, that some students will
be more attentive than others to the presentations, and that the typical friendships and animosities
among classmates will all influence their scores, which is why she uses the trimmed mean
approach. Finally, with the peer ratings of collaboration skills, she knows that the vagaries of
daily life in the classroom mean that any particular student will be better on some days than on

others and that students’ collaboration skills will improve as they do collaborate. That is why
she’s weighting later scores more than earlier ones. She also knows that interpersonal dimensions
play a role. So she asks students to write a justification for their ratings on the back of each
rubric. This confronts them with the criteria for good collaboration; holds them to a standard of
giving evidence for their judgment; and provides her with additional context information when
looking at the scores.
Replication. In the group project scores and in the collaboration scores the replication
comes as raters. There is also a replication of occasion in the collaboration scores. Ms. Baca has
built in the “trimming” to cull ratings that may be inaccurate due to some bias. With the written
report, replications come as Ms. Baca is reading each report looking for instances of Procedures,
for example. Though there is a section of the report labeled “procedures”, she isn’t viewing it as
a single instance of procedure but rather is evaluating each statement within it. So the replication
comes as she identifies instances within the procedures section from which she draws a
conclusion regarding the quality of the procedures section.
Tolerance. Since this likely represents a large portion of a student’s grade, the overall
score needs to be reliable. There is a need for this to be one of the more reliable judgments that
Ms. Baca makes.
Evidence. Ms. Baca actually has quite a bit of evidence to present. She has all of the
scores from the rubrics as well as the comments from them. She also has all of the procedures
she has used – the trimmed means, the scoring procedures themselves, and the procedures for
writing comments.
Judgment. In the end, Ms. Baca can look at the scores and determine that they are
reliable. She could argue that she designed her procedures to enhance the accuracy and stability
of the scores throughout. She’d mention that she trained students in the use of the rubrics, that
she required them to justify their scores, that she used a variety of techniques like having
students put their names on the backs of their written reports to mask the students’ identities.
Then she could move on to describe the way she trimmed means to prevent bias from influencing
the average scores. And, in the end, she satisfies herself, her students, and anyone else who asks
that she’s reached a reliable score for their overall project.
Scenario B: The Homework Grade
Miss Claudia Martinez is a 9th grade math teacher in an urban high school in a large
metropolitan area. She intends to teach her students the basics of geometry – which is among the
state standards for 9th graders in her state. From her work with the students thus far, she knows
that these students have fear and anxiety over math and a block around math. Consequently,
Miss Martinez has decided to initially approach geometry in a way that helps these students feel
more comfortable with the content before moving on to more complex concepts. Also some of
her students are English Language Learners; she has decided to take nothing for granted and is
introducing basic math language at the same time. One way she is doing this is by introducing
cultural phrases, or appropriate math slang, if you will, through these lessons.
The Unit Plan Outline with corresponding Homework Assignments:
1st lesson – Geometry is all around us.
HW: She distributes list of everyday math phrases and students have to find out what
each of those phrases means. Extra credit if they can generate additional math phrases and
explain their meanings.
2nd lesson – Why is geometry relevant? A discussion of applicability of math to
lives/home.

HW: Students to list 10 items at home and describe their math attributes. Extra credit if
they list 10 more.
3rd lesson – Introduction (lecture) to permeability of math in objects use/encounter in
daily lives.
HW: Students to list 10 items at home and describe their math attributes. Extra credit if
they list 10 more.
4th lesson – Discussion on underlying trigonometric and geometric concepts: numbers,
formulas and shapes.
HW: Students are to bring 10 objects/or their representations into class that contain
representative shapes found in geometry.
5th lesson – Review of numbers, formulas and shapes.
HW: Students identify trigonometric and geometric shapes on homework sheet and check
it with their math buddy.
6th lesson - Discussion of shapes of buildings or structures and how and where they
fit/don’t trigonometric principles and geometric shapes.
HW: Students are to bring in pictures or drawings of any buildings or structures that they
particularly like or don’t that fit geometric shapes and indicate type of shape. Extra credit if they
identify who originally/later designed/redesigned it along with current use and background and
how that design/shape fits the use.
7thlesson - Introduction of points, lines, rays and line segments.
HW: Students are to identify whether the objects/drawings on the homework sheet are
points, lines, rays or line segments.
8th lesson - Introduction of lines as parallel, intersecting or perpendicular.

HW: Students are to identify each pair of lines on the homework sheet. Extra credit if
they bring in outside examples of parallel, intersecting or perpendicular pairs of lines.
9th lesson - Introduction of angles as either acute, obtuse, straight or right.
HW: Students are to identify each angle on the homework sheet. Extra credit if students
can bring in outside examples of objects containing acute, obtuse and straight or right angles
identifying them correctly.
10th lesson - Introduction of angles and lines together: Triangles and types.
HW: On their homework sheets, students are to identify triangles as either isosceles,
scalene or equilateral; angles as acute, obtuse, straight or right; lines as parallel, intersecting or
perpendicular; and calculate sizes of angles as indicated.
For this particular marking period, homework will represent 35% of the grade; exams and
quizzes will make up 30% of the grade; and, in-class projects and assignments will constitute the
remaining 35%. Miss Martinez explained that while exams were important, she considered
regular daily and consistent performance in class and out of class as a somewhat better indicator
of their level of understanding and knowledge of math concepts than exam performance. For
herself, she also believed emphasis on daily work would be a more consistent effort and
performance motivator.
Miss Martinez would calculate students’ homework grades as follows. There were 10
homework lessons worth a total of 205 possible homework points. The first 9 homework lessons
were each worth 20 points. Of those 20 points, 18 points or 90% could be earned if homework
was complete, correct and submitted on time. If students had errors or incompletes on their
homework, corrected and turned them in the next class, they would receive the same amount of
credit as if they turned in a perfect homework sheet the first day. Students were able to self

assess on 10% of their grade, or 2 points. (By self-assessment, Miss Martinez wanted to
encourage them to (1) consciously evaluate their level of understanding and performance and (2)
understand that they had some control over their learning). The last assignment was worth 25
points in part because the homework was a bit more demanding and she wanted points to be
commensurate with the assignment. Late homework – without her approval – was an automatic
minus 5 points per day. While 5 points or 25% was a significant penalty, she thought it was
crucial for their mastery to keep up with assignments on a regular basis. Extra credit could count
for as much as but not more than 10% of their total homework grade. Anyone confirmed
cheating would receive an automatic zero for that assignment.
Scenario B: The Reliability Argument
This is perhaps an all too real scenario that should have the measurement specialists in
fits. And we admit that, reliability aside, Miss Martinez could improve on these procedures. Be
that as it may, how reliable is the homework grade? Here’s how Miss Martinez might proceed:
The Value Base. The value here is probably accuracy. Consistency doesn’t make sense
because each assignment is different and is subject to all kinds of influences. But accuracy of
what? Is this homework grade supposed to represent mathematical knowledge? Is it an effort
score? Is it a participation grade? This needs to be spelled out, too, if Miss Martinez is to make a
compelling reliability argument.
Purpose and Context. The purpose is to assign 35% of a marking period grade for a
course. In terms of context, homework represents a classic example. How does the teacher know
if the student actually did the work, under what conditions, and with what assistance? Given
Miss Martinez’s procedures, she doesn’t. She could be doing brief quizzes to see if students
know in class what they seem to know through the homework. She could ask them to take the

first three minutes of class to write an explanation of some of their answers. This would help her
to understand the context a little better.
Replication. Within each assignment, the replication is the different items. If the
construct is effort or participation, then each assignment is a replication. Actually, each redo, if a
student decides to do one, is a further replication.
Tolerance. Miss Martinez has allocated 35% of the marking period grade to homework,
which is a sizable chunk. So she needs to be able to justify these scores.
Evidence. Miss Martinez needs first to articulate the construct this grade is meant to tap.
From the procedures put in place – the redo’s and the extra credit – it sounds like an effort score.
If that’s so, then she can point to the number of times students redo assignments or extra credit as
evidence of the score’s reliability. As evidence, she can also point to the procedures she has in
place – the summing of scores and the redo and extra credit policies. She also has the number of
assignments across which she is building a judgment – more assignments would mean more
reliability in Spearman-Brown fashion.
Judgment. When a student asks Miss Martinez for a justification of his homework score,
she can point to the various policies and components that went into that score and can explain
why the score is accurate.
Scenario C: The Parent-Teacher Conference
Willard Gibson has 26 parent teacher conferences scheduled today and tomorrow at
Tramway Middle School, located in a northwest suburb of a major Midwestern metropolitan
city. Report card conferences were demanding, but armed with support for the grades/markings
that students receive, he feels positive and confident. He teaches middle school Language Arts
and will be holding parent teacher conferences for students in his homeroom class. Most of the

students’ families were middle class and had evidenced keen interest in their children’s progress.
He has one student this year in class who is new to the area and a bit of a concern.
Later that day, Terese Rodriguez, a single parent, rushes in from work in the city to her
son’s middle school, nervously trying to find the right room, meet her son, Jamie, for her first
parent teacher conference of the year. Mr. Gibson meets them in the hallway outside his room,
introduces himself and shakes her hand. In the classroom, it is obvious he is prepared for them.
There on a table are two booklets with Jamie’s name; one for her and one for the teacher.
All together, they first go through samples of Jamie’s school work since the beginning of
year, then Willard reviews Jamie’s report card with Terese and Jamie. She sees that the
accumulated sample materials demonstrated that her son seemed to have earned the marks he
got. Mostly he was doing well academically, but he could have done a bit better, and Jamie
agreed, but that was about what she had expected. Having just moved to town last summer,
Terese was concerned with his personal adjustment in school and tells Willard that. At that point,
he refers her to the section of the standards-based report card labeled “Successful Learner
Behaviors”. He also shows her a separate booklet entitled “CARE -Classroom Skills &
Strengths”, an acronym, he explains, for Conduct, Attitude, Respect and Effort. These are
behaviors, attitudes and skills that are not included in traditional grades, he explained, but which
are related to and have an important impact on a student’s learning and are thus represented on
the standards-based report card. Jamie had a “Not Proficient’ on these categories. Terese, visibly
distressed, wants to know why her son did not get a “Proficient’, or at least a ‘Working Toward
Proficiency’.
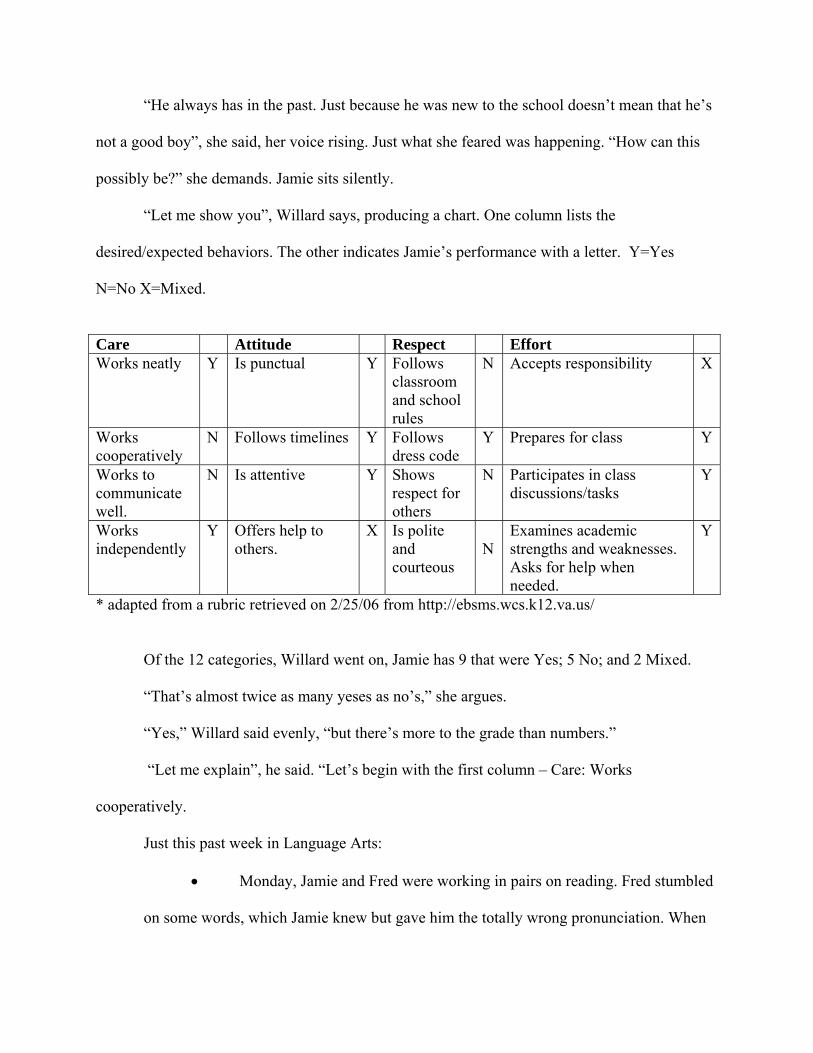
“He always has in the past. Just because he was new to the school doesn’t mean that he’s
not a good boy”, she said, her voice rising. Just what she feared was happening. “How can this
possibly be?” she demands. Jamie sits silently.
“Let me show you”, Willard says, producing a chart. One column lists the
desired/expected behaviors. The other indicates Jamie’s performance with a letter. Y=Yes
N=No X=Mixed.
Care Attitude Respect Effort Works neatly Y Is punctual Y Follows
classroom and school rules
N Accepts responsibility X
Works cooperatively
N Follows timelines Y Follows dress code
Y Prepares for class Y
Works to communicate well.
N Is attentive Y Shows respect for others
N Participates in class discussions/tasks
Y
Works independently
Y Offers help to others.
X Is polite and courteous
N
Examines academic strengths and weaknesses. Asks for help when needed.
Y
* adapted from a rubric retrieved on 2/25/06 from http://ebsms.wcs.k12.va.us/
Of the 12 categories, Willard went on, Jamie has 9 that were Yes; 5 No; and 2 Mixed.
“That’s almost twice as many yeses as no’s,” she argues.
“Yes,” Willard said evenly, “but there’s more to the grade than numbers.”
“Let me explain”, he said. “Let’s begin with the first column – Care: Works
cooperatively.
Just this past week in Language Arts:
• Monday, Jamie and Fred were working in pairs on reading. Fred stumbled
on some words, which Jamie knew but gave him the totally wrong pronunciation. When

Fred mispronounced them badly, Jamie started cracking up. He deliberately gave him the
wrong pronunciation.
• Wednesday, he and Maria were working in pairs on writing composition.
They were to be reading each other’s work and offering suggestions for improvement.
When Maria accidentally dropped her paperwork, Jamie picked it up, then deliberately
dropped it again scattering her papers even further.
Look at the second column: Offers help to others.
• Unasked in homeroom last Friday, Jamie helped Robert put his coat on.
He had his right arm in a sling and was having trouble. That was nice of Jamie. The
problem is you never know with him what he’s going to do.
• Jamie is excellent in vocabulary and when Fred was having trouble
reading and comprehending some new words, Jamie explained their meaning, then
without provocation shoved him. What kind of help is that?
Under the next category, Respect:
• I want you to understand, Jamie has demonstrated some very positive
behavior.
He invited Donnie, a student with Downs syndrome, to sit at his work table
yesterday and helped him throughout the lesson.
• Another day this week, he pulled two goldfish out of the aquarium and put
them on my desk. He and the other boys thought it was really funny.”
Willard explains that although the majority of markings were positive, Jamie had a ‘Not
Proficient’, because he had demonstrated a pattern of behavior of deliberately trying to hurt,
embarrass or make fun of the other kids. “Working Towards Proficiency indicates effort; Jamie

doesn’t show that. Rather, he’s nice as with Robert or Donnie when he feels like it, and not nice
when he feels like it. He’s a smart kid but has a problem with interpersonal relations. This
particular grade reflects that. When his behavior changes, the grade can change”, Willard said.
“I see”, she nodded.
Scenario C: The Reliability Argument
We’ve actually just observed Mr. Gibson making a reliability argument. Let’s
deconstruct it.
The Value Base. Mr. Gibson is working with the value of consensus. He has a variety of
evidence and is building consensus.
Purpose and Context. He explains that the standards-based report card is the purpose. He
also goes to great lengths to explain some of the contexts in which he observed Jamie’s behavior.
Replication. For each of the grades he’s assigned, Willard is able to discuss two or three
events that go into his judgment. The weakness here is that there’s no apparent system to ensure
that the replications are representative of Jamie’s overall behavior. This seems to be whatever
Willard seemed to notice.
Tolerance. Since these marks go onto a report card, again, there’s a need for them to be
reliable and for them to be some evidence of that.
Evidence. Willard has his notes to refer to about the instances he mentions. He also has
the table. His argument would be strengthened if we knew more about how he decides to note
these occurrences. Is he doing this for all of his students? Is he using some system to ensure that
he’s getting an unbiased sample of behavior?
Judgment. Finally, we see him pull it all together. He is able to discuss how, in the midst
of conflicting information, he was weighting events and interpreting them to make his judgment.

We also see here, though, one of the weaknesses of making an argument when there is a power
differential. Terese defers to Mr. Gibson in the end even though some of what he says probably
supports her assertion that Jamie is making progress and should be graded “Working toward
proficiency.”
Caveats and Comments
We’ve tried through this paper to imagine what reliability might look like were it to grow
out of classrooms or were it to come from philosophical, theoretical and practical underpinnings
more suited to classrooms. There are many shortcomings to our effort. For example, though
we’ve picked examples that don’t easily fit a traditional reliability methodology, we still haven’t
illustrated an exemplar of “assessment as learning”, where instruction and assessment are more
than seamless, where both assessment and learning are occurring simultaneously. We also have
re-discovered the wisdom of the old adage that it’s easier to be a critic than a creator. It is simple
to see where traditional reliability methodology does not fit in classrooms but far harder to
develop a system to augment or replace it. This paper, then, is an initial foray not a final product.
It amounts to a thought experiment.
There are also two other caveats we’d like to discuss in some more depth. First, if
teachers aren’t availing themselves of current methods, will they explicitly make reliability
arguments in their classrooms? Second, as we’ve worked on these scenarios we keep seeing a
very blurry line between reliability and validity.
Will teachers really do this?
The short answer is: No. Not explicitly, anyway. Classroom assessment textbooks are not
going to be adding a chapter about making reliability arguments. But that doesn’t mean the idea
should not be refined and deepened. One of the insights we had while working on these scenarios

is that there’s more to reliability than estimating it at the end of a measurement procedure. The
measurement community has developed item-writing rules, for example, to maximize reliability.
Those item-writing rules can be learned by teachers without them being able to describe the
effects of double-barreled items on Cronbach’s alpha. In other words, we as measurement
specialists need to think about what kinds of evidence might be brought to a reliability argument
and then work backwards to practices that teachers could adopt.
On the one hand, teachers may already be intuiting reliability arguments as they assess.
Since reliability is a social and scientific value that is important well beyond the classroom, then
it is reasonable to assume that teachers have it as some inherent part of their value systems. But
our work with a class on classroom assessment tells us that that’s happening in only a hit-and-
miss fashion. We need to work towards teachers being more explicit and systematic in their
thinking about reliability.
Where’s the line between reliability and validity?
The other issue we’ve run into is that reliability and validity are linked in ways that are
more complex and nuanced than “reliability is prerequisite to validity”. For example, are the
scores on Miss Martinez’s ten homework assignments not the same because the “true score” is
different for each one or because the students’ effort isn’t constant across the ten assignments?
The answer is both. But the first is a validity issue and the second is a reliability issue. The point
is that both effects will cause an inconsistency in scores that would show up in any numerical
index of reliability, and yet the underlying effects are both reliability and validity concerns. As
we worked, we found it difficult at times not to be lapping over into validity territory. But is that
a bad thing?
Stiggins (2001) and others have argued for teachers to learn about “high quality
assessments” rather than about “reliability and validity”. We agree and feel that amongst the
measurement community we should work at developing the concept of a reliability argument, but
then backtrack to practices that teachers can actually employ.
Next Steps
So where should the development of reliability argument specifically and of
“classroometrics” in general go from here? There are both theoretical and practical directions.
Our exploration leads us to conclude that measurement theorists need to continue to
conceptualize what reliability and validity are in “assessment for learning” and in “assessment as
learning”. No doubt the values of reliability and validity remain important, but, in an assessment
situation that is simultaneously a learning situation, where do they affect the process?
Once we have some idea of what it means to speak of the reliability of “assessment as
learning” where often the “outcome” isn’t a score but a comment or suggestion that immediately
gets folded back into the work, then we need to move on to how those could be built in to
procedures that could then be taught to teachers. We should also be thinking about “training the
trainer”, writing for and developing resources for those who will teach teachers about
assessment.
If we’re serious about fundamentally changing classrooms so that high-powered
assessment is going on, powerful formative assessment (Black, Harrison, Lee, Marshall &
Wiliam, 2004), “assessment for learning” and “assessment as learning”, then we also need to
acknowledge that classroom assessment isn’t so much its own discipline as the overlap of many
disciplines of which educational measurement is one. And then this discussion should move
forward with representatives from those many disciplines (e.g. educational psychology,

curriculum & instruction, educational philosophy, etc.) so that our theoretical development is as
rich and multifaceted as the “assessment as learning” we hope to champion.

References
American Educational Research Association, American Psychological Association, &
National Council on Measurement in Education. (1999). Standards for Educational and
Psychological Testing. Washington , DC : AERA.
Black, P., Harrison, C., Lee, C., Marshall, B., & Wiliam, D. (2004). Working inside the
black box: Assessment for learning in the classroom. Phi Delta Kappan, 86(1), 9-21.
Brennan, R. L. (1998). Misconceptions at the intersection of measurement theory and
practice. Educational Measurement: Issues and Practice, 17(1), 5-9, 30.
Brennan, R. L. (2001). An essay on the history and future of reliability from the
perspective of replications. Journal of Educational Measurement, 38(4), 295-317.
Brookhart, S. M. (2003). Developing measurement theory for classroom assessment
purposes and uses. Educational Measurement: Issues and Practice,22(4), 5 – 12.
Earl, L. M. (2003). Assessment as learning: Using classroom assessment to maximize
student learning. Thousand Oaks, CA: Corwin Press.
Parkes, J. (under review). The evolution of reliability from sampling theory to the
reliability argument. Educational Measurement: Issues and Practice.
Shepard, L. A. (2000). The role of assessment in a learning culture. Educational
Researcher, 29 (7), 4 - 14.
Smith, J. K. (2003). Reconsidering reliability in classroom assessment and grading.
Educational Measurement: Issues and Practice, 22(4), 26 – 33.
Stiggins, R. J. (1991). Relevant classroom assessment training for teachers. Educational
Measurement: Issues and Practice, 10(1), 7 – 12.

Stiggins, R. J. (2001). Student-involved classroom assessment (3rd ed.). Upper Saddle
River, NJ: Prentice-Hall.
Thompson, B. & Vacha-Haase, T. (2000). Psychometrics is datametrics: The test is not
reliable. Educational and Psychological Measurement, 60(2), 174-195.
Willson, V. L. (1991). Performance assessment, psychometric theory and cognitive
learning theory: Ships crossing in the night. Contemporary Education, 62(4), 250-254.

Appendix A: Scoring Rubrics for the Collaborative Project

Making Reliability Arguments in Classrooms 29
Scientific Report Rubric
Beginning 1 Developing 2 Accomplished 3 Exemplary 4 Score
Introduction Does not give any information
about what to expect in the report.
Gives very little information. Gives too much information--more like a summary.
Presents a concise lead-in to the report.
Research Does not answer any questions suggested in the template. Answers some questions.
Answers some questions and includes a few other interesting
facts.
Answers most questions and includes many other
interesting facts.
Procedure Not sequential, most steps are missing or are confusing.
Some of the steps are understandable; most are confusing and lack detail.
Most of the steps are understandable; some lack detail
or are confusing.
Presents easy-to-follow steps which are logical and
adequately detailed.
Data & Results Data table and/or graph missing information and are inaccurate.
Both complete, minor inaccuracies and/or illegible
characters.
Both accurate, some ill-formed characters.
Data table and graph neatly completed and totally
accurate.
Conclusion
Presents an illogical explanation for findings and does not address any of the questions suggested in the
template.
Presents an illogical explanation for findings and
addresses few questions.
Presents a logical explanation for findings and addresses some of
the questions.
Presents a logical explanation for findings
and addresses most of the questions.
Grammar & Spelling
Very frequent grammar and/or spelling errors. More than two errors. Only one or two errors. All grammar and spelling
are correct.
Attractiveness Illegible writing, loose pages.
Legible writing, some ill-formed letters, print too small
or too large, papers stapled together.
Legible writing, well-formed characters, clean and neatly
bound in a report cover, illustrations provided.
Word processed or typed, clean and neatly bound in a report cover, illustrations
provided.
Total
* adapted from a rubric found on 3/6/06 at http://edweb.sdsu.edu/triton/tidepoolunit/Rubrics/reportrubric.html

Making Reliability Arguments in Classrooms 30
Lab Presentation Rubric
Frequent and proper use of scientific terminology appropriate for the lab. 1
strongly disagree 2 3 somewhat agree 4 5
strongly agree Data collection was within expected norms, explanations were given where they deviated.
1 strongly disagree 2 3
somewhat agree 4 5 strongly agree
Conclusion is appropriate for the data collected and shows a strong grasp of the scientific concepts. 1
strongly disagree 2 3 somewhat agree 4 5
strongly agree Powerpoint presentation followed good presentation rules.
1 strongly disagree 2 3
somewhat agree 4 5 strongly agree
The presentation was complete with graphs and charts where appropriate. Check the parts present.
Purpose _____ Materials List ______ Procedures _____ Data and Observations _____ Calculations _____ Questions____ Conclusion ______
1 strongly disagree 2 3
somewhat agree 4 5 strongly agree
The response to questions were carefully thought out and well reasoned. 1
strongly disagree 2 3 somewhat disagree 4 5
strongly agree * This rubric was adapted from one retrieved on 3/6/06 from http://www2.gsu.edu/~mstnrhx/457/rubric.htm

Making Reliability Arguments in Classrooms 31
Collaboration Rubric
Beginning 1 Developing 2 Accomplished 3 Exemplary 4 Score
Contribute
Research & Gather Information
Does not collect any information that relates to the topic.
Collects very little information--some relates to the topic.
Collects some basic information--most relates to the topic.
Collects a great deal of information--all relates to the topic.
Share Information Does not relay any information to teammates.
Relays very little information--some relates to the topic.
Relays some basic information--most relates to the topic.
Relays a great deal of information--all relates to the topic.
Be Punctual Does not hand in any assignments. Hands in most assignments late. Hands in most assignments on
time. Hands in all assignments on time.
Take Responsibility
Fulfill Team Role's Duties
Does not perform any duties of assigned team role. Performs very little duties. Performs nearly all duties. Performs all duties of assigned team
role.
Participate in Science Conference
Does not speak during the science conference.
Either gives too little information or information which is irrelevant to topic.
Offers some information--most is relevant.
Offers a fair amount of important information--all is relevant.
Share Equally Always relies on others to do the work.
Rarely does the assigned work--often needs reminding.
Usually does the assigned work--rarely needs reminding.
Always does the assigned work without having to be reminded.
Value Others' Viewpoints
Listen to Other Teammates
Is always talking--never allows anyone else to speak.
Usually doing most of the talking--rarely allows others to speak.
Listens, but sometimes talks too much. Listens and speaks a fair amount.
Cooperate with Teammates Usually argues with teammates. Sometimes argues. Rarely argues. Never argues with teammates.
Make Fair Decisions Usually wants to have things their way.
Often sides with friends instead of considering all views. Usually considers all views. Always helps team to reach a fair
decision.
Total
* adapted from a rubric retrieved on 3/6/06 from http://edweb.sdsu.edu/triton/tidepoolunit/Rubrics/collrubric.html