Reliability and validity of the Self-Report Version of the ...
24
1 Reliability and validity of the Self-Report Version of the Apathy Evaluation Scale in First-Episode Psychosis: Concordance with the Clinical Version at Baseline and 12 Months Follow-up Ann Faerden a* ; Siv Hege Lyngstad a , Carmen Simonsen a ; Petter Andreas Ringen a ; Oleg Papsuev d ; Ingrid Dieset a ; Ole A Andreassen a,b Ingrid Agartz b,c Stephen R Marder e ; Ingrid Melle a,b a Clinic of mental health and addiction, Oslo University Hospital, Ulleval, 0407 Oslo, Norway; b NORMENT KG Jebsen Centre for Psychosis Research, Institute of Clinical Medicine, University of Oslo, 0318 Oslo, Norway; c Diakonhjemmet Hospital, 0319 Oslo, Norway; d Outpatient Psychiatry and Organization of Psychiatric Care Dept. of Moscow Research Institute of Psychiatry; e Semel Institute for Neuroscience, University of California in Los Angeles * To whom correspondence should be addressed; Section for acute psychiatry; Clinic of mental Health and addiction, Building 32, Oslo University Hospital, Ulleval, 0407 Oslo, Norway, email: [email protected]
Transcript of Reliability and validity of the Self-Report Version of the ...

1
Reliability and validity of the Self-Report Version of the Apathy Evaluation Scale in First-Episode Psychosis: Concordance with the Clinical Version at Baseline and 12 Months Follow-up Ann Faerdena*; Siv Hege Lyngstada, Carmen Simonsena; Petter Andreas Ringena; Oleg Papsuevd; Ingrid Dieseta; Ole A Andreassena,b Ingrid Agartzb,c Stephen R Mardere; Ingrid Mellea,b aClinic of mental health and addiction, Oslo University Hospital, Ulleval, 0407 Oslo, Norway; b NORMENT KG Jebsen Centre for Psychosis Research, Institute of Clinical Medicine, University of Oslo, 0318 Oslo, Norway; cDiakonhjemmet Hospital, 0319 Oslo, Norway; dOutpatient Psychiatry and Organization of Psychiatric Care Dept. of Moscow Research Institute of Psychiatry; e Semel Institute for Neuroscience, University of California in Los Angeles * To whom correspondence should be addressed; Section for acute psychiatry; Clinic of mental Health and addiction, Building 32, Oslo University Hospital, Ulleval, 0407 Oslo, Norway, email: [email protected]

2
ABSTRACT
Negative symptoms have traditionally been assessed based on clinicians’ observations. The
subjective experience of negative symptoms in people with psychosis may bring new insight.
The Apathy Evaluation Scale (AES) is commonly used to study apathy in psychosis and has
corresponding self-rated (AES-S) and clinician-rated (AES-C) versions. The aim of the
present study was to determine the validity and reliability of the AES-S by investigating its
concordance with the AES-C. Eighty-four first-episode (FEP) patients completed the
shortened 12-item AES-S and AES-C at baseline (T1) and 12 months (T2). Concordance was
studied by degree of correlation, comparison of mean scores, and change and difference
between diagnostic groups. The Positive and Negative Symptom Scale (PANSS) was used to
study convergent and discriminative properties. High concordance was found between AES-S
and AES-C at both T1 and T2 regarding mean values, change from T1 to T2, and the
proportion with high levels of apathy. Both versions indicated high levels of apathy in FEP,
while associations with PANSS negative symptoms were weaker for AES-S than AES-C.
Controlling for depression did not significantly alter results. We concluded that self-rated
apathy in FEP patients is in concordance with clinician ratings, but in need of further study.
Key words: psychosis; negative symptoms; apathy; amotivation; self-report; clinician-rating
1. Introduction

3
Understanding negative symptoms is a major challenge in schizophrenia research and
treatment (Kirkpatrick et al., 2006; Montgomery and van Zwieten-Boot, 2007; Marder and
Galderisi, 2017). Methodological improvements of assessments may help research, and one
possible solution could be to include self-reports. However, nearly all studies of negative
symptoms have relied on assessments made by observers; relatively few have evaluated the
subjective experience of people with psychosis (Selten et al., 1993; Park et al., 2012; Llerena
et al., 2013; Engel and Lincoln, 2016; Dollfus et al., 2016). The contents of the negative
syndrome in psychotic disorders consist of the five subdomains of apathy/avolition,
anhedonia, asociality, alogia and affective flattening (Kaiser et al., 2017), which cluster into
the two separate factors of 1) amotivation/apathy and 2) expressive deficit (Marder &
Galderisi, 2017). Apathy and anhedonia are internal experiences and, therefore, more
accessible and suitable for self-reporting than observation-based expressive deficits
(Andreasen N.C., 1990; Marder & Galderisi, 2017).
Apathy is common in psychotic disorders and has been found to be a strong
contributor to a poor outcome from the first episode throughout the course of the illness
(Kiang et al., 2001; Roth et al., 2004; Faerden et al., 2010; Evensen et al., 2012; Fervaha et
al., 2015). Marin et al. defines apathy as a “lack of motivation and goal directed behavior”
(Marin, 1991). This definition is the conceptual basis for the Apathy Evaluation Scale (AES)
(Marin et al., 1991), which, in addition to psychosis, has been used to study apathy across a
number of different disorders, including Parkinson’s disease, multiple sclerosis, Alzheimer’s,
and stroke (Andersson S. et al., 1999; Lueken et al., 2007; Sagen,U. et al., 2010b; Santangelo
et al., 2014; Raimo et al., 2014). The AES is found to have sound psychometric qualities
(Weiser and Garibaldi, 2015; Radakovic et al., 2015) and exists in two otherwise identical
versions, a clinician-rated AES-C and a self-report AES-S (Marin et al., 1991). The existence
of two modes of reporting can provide insight into the subjective experience of apathy in
people with psychosis and their relationship to external observations.
Self-reports can be developed through direct involvement with the target group (Rose
et al., 2011; Evans et al., 2012; Dollfus et al., 2016) or by adjusting an established observer-
based scale (Park et al., 2012). Only minor adjustments were made when a self-report version
of the Clinical Assessment Interview for Negative Symptoms (CAINS) (Blanchard et al.,
2011), the CAINS-SR, was used (Park et al., 2012; Llerena et al., 2013; Engel & Lincoln,
2016). However, of the two subscales making up the CAINS, only the subscale Motivation
and Pleasure (i.e., apathy/anhedonia) was found to have a satisfactory concurrent validity with
the clinician-rated measure of the same domain and not the expression subscale (Park et al.,
2012). The AES-S is also developed as an adaptation of the existing clinician-rated scale

4
(Marin et al., 1991). To our knowledge, the AES-S has only been used in one former study of
persons with psychosis (Evensen et al., 2012), yet how the self- report relates to the
clinicians’ assessments remains to be investigated. Since self-reports are easier to use for
screening purposes, it is of interest to see if the AES-S can be used to screen for high levels of
apathy.
The AES-C has shown good psychometric properties in people with psychosis, both in
first-episode patients (Faerden et al., 2008) and in patients with longer durations of illness
(Kiang et al., 2001). As expected, the AES-C shows strong associations with measures of
negative symptoms made by traditional rating scales (Kiang et al., 2001; Faerden et al., 2010;
Foussias et al., 2011; Konstantakopoulos et al., 2011). We have previously reported that 50%
of first-episode psychosis (FEP) patients have high levels of apathy at the start of treatment as
measured by the AES-C, with even higher levels of apathy in patients diagnosed within the
narrow schizophrenia spectrum (Faerden et al., 2010). Levels of apathy in both groups of
patients were more strongly associated with concurrent poor functioning (Faerden et al.,
2010) and also better predicted future poor functioning in a 1-year follow-up of the same
study sample (Faerden et al., 2013).
Negative symptoms are traditionally divided into primary and secondary symptoms,
where the primary are thought to be related to neurobiological underpinnings, and the
secondary are influenced by other sources of negative symptom-like features, such as
depression, positive symptoms, and medication side effects (Kirschner et al., 2017). Apathy
and depression have overlapping clinical features, including reduced initiative and lack of
energy, which makes differentiation a challenge (Marin et al., 1993). The original definition
states that the apathetic features should not be “due to emotional distress” to avoid a potential
overlap with depression (Marin et al., 1991). However, because depression is a common
feature in FEP (Romm et al., 2010), this criterion is often not applicable. Three of the four
recently published studies of self-reports of negative symptoms found a significant association
between negative symptoms and depression (Park et al., 2012; Engel & Lincoln, 2016;
Dollfus et al., 2016), with the only exception a study by Llerena et al. (2013). Therefore, it is
important to explore how both depression and other contributors to secondary negative
symptoms, such as positive symptoms, may influence self-reports of apathy in FEP
(Kirschner et al., 2017). Finally, patients’ self-reports can differ from the evaluation of others
because of a lack of insight into the illness and its consequences, and the effect of insight
should thus be accounted for.
The aim of this study was to assess the concordance of the psychometric, convergent,
and discriminative properties of the AES-S in FEP patients by comparing the AES-S and the

5
AES-C. This was accomplished by investigating the following at both baseline and at 1-year
follow-up: 1) Does the AES-S have the same psychometric properties as the AES-C? 2) Is
there concordance in mean apathy scores, changes over time, and differences between
diagnostic groups? 3) What are the convergent and discriminative properties in relation to the
different PANSS symptom factors, and to what extent do depression, positive symptoms, and
lack of insight influence the association to PANSS negative symptoms? 4) Can the AES-S be
used to screen for high levels of apathy that is in concordance with the AES-C?
2. Methods
2.1 Participants
The present study included 84 FEP patients who completed both the AES-S and the
AES-C at baseline and at 1-year follow-up. All participants are part of the ongoing
Thematically Organized Psychosis (TOP) study in Oslo, Norway, consecutively recruited
from specialized inpatient and outpatient psychiatric health services serving three out of six
catchment areas in Oslo. Inclusion took place between July 2004 and June 2006, and
participants met the following criteria: age between 18 and 65 years, a first episode of
psychosis, and a DSM-IV diagnosis of schizophrenia, schizophreniform disorder, or
schizoaffective disorder (constituting Group 1: Schizophrenia spectrum disorders); affective
disorder with mood incongruent psychotic symptoms or bipolar I disorder (constituting Group
2: Affective psychotic disorders); and psychosis not otherwise specified, delusional disorder,
or brief psychotic disorder (constituting Group 3: Other psychotic disorders). Patients were
eligible for inclusion in the study up to 1 year following the start of first treatment.
This study includes the 84 participants who completed the AES-S and AES-C at both
baseline and at the 1-year follow-up. A total of 124 took part in the 1- year follow up, but 40
of these were eliminated from the current study due to incomplete assessments by the AES-S
or the AES-C, totaling this study to 84. There were no significant differences between the 124
participants and the 84 including the analyses regarding gender, age, level of education,
duration of untreated psychosis (DUP), PANSS symptoms, or diagnostic distribution.
2.2 Assessment
6
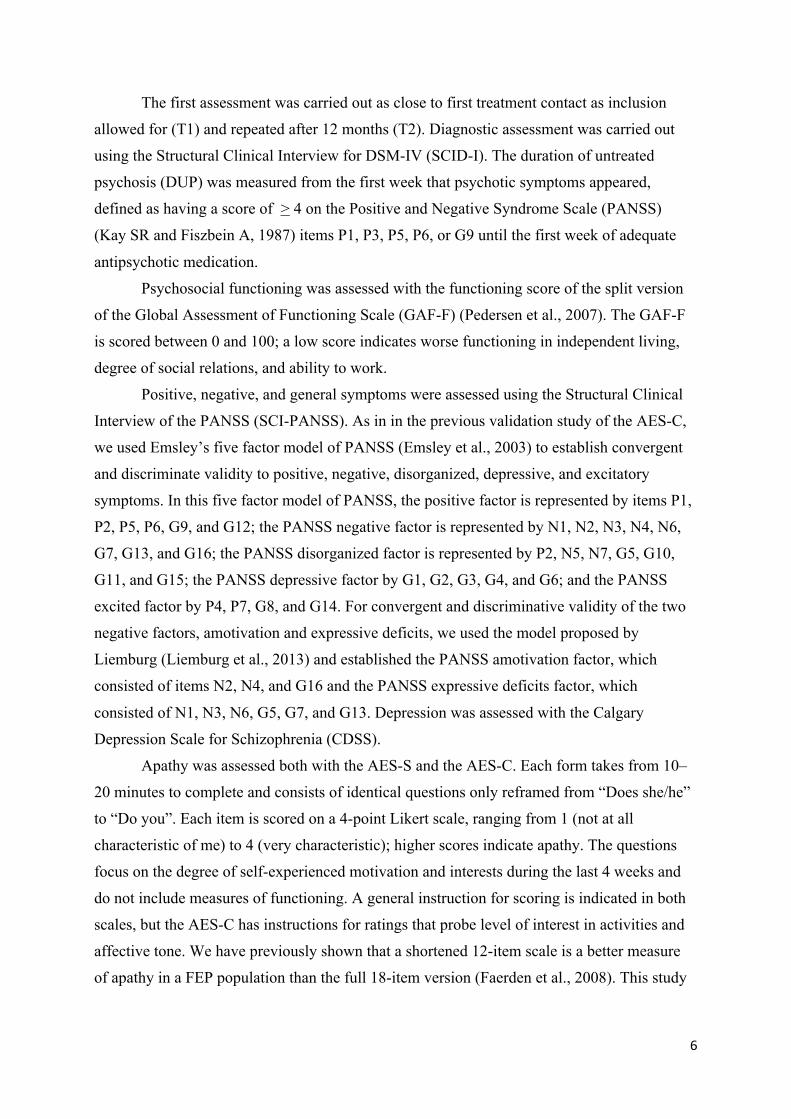
The first assessment was carried out as close to first treatment contact as inclusion
allowed for (T1) and repeated after 12 months (T2). Diagnostic assessment was carried out
using the Structural Clinical Interview for DSM-IV (SCID-I). The duration of untreated
psychosis (DUP) was measured from the first week that psychotic symptoms appeared,
defined as having a score of > 4 on the Positive and Negative Syndrome Scale (PANSS)
(Kay SR and Fiszbein A, 1987) items P1, P3, P5, P6, or G9 until the first week of adequate
antipsychotic medication.
Psychosocial functioning was assessed with the functioning score of the split version
of the Global Assessment of Functioning Scale (GAF-F) (Pedersen et al., 2007). The GAF-F
is scored between 0 and 100; a low score indicates worse functioning in independent living,
degree of social relations, and ability to work.
Positive, negative, and general symptoms were assessed using the Structural Clinical
Interview of the PANSS (SCI-PANSS). As in in the previous validation study of the AES-C,
we used Emsley’s five factor model of PANSS (Emsley et al., 2003) to establish convergent
and discriminate validity to positive, negative, disorganized, depressive, and excitatory
symptoms. In this five factor model of PANSS, the positive factor is represented by items P1,
P2, P5, P6, G9, and G12; the PANSS negative factor is represented by N1, N2, N3, N4, N6,
G7, G13, and G16; the PANSS disorganized factor is represented by P2, N5, N7, G5, G10,
G11, and G15; the PANSS depressive factor by G1, G2, G3, G4, and G6; and the PANSS
excited factor by P4, P7, G8, and G14. For convergent and discriminative validity of the two
negative factors, amotivation and expressive deficits, we used the model proposed by
Liemburg (Liemburg et al., 2013) and established the PANSS amotivation factor, which
consisted of items N2, N4, and G16 and the PANSS expressive deficits factor, which
consisted of N1, N3, N6, G5, G7, and G13. Depression was assessed with the Calgary
Depression Scale for Schizophrenia (CDSS).
Apathy was assessed both with the AES-S and the AES-C. Each form takes from 10–
20 minutes to complete and consists of identical questions only reframed from “Does she/he”
to “Do you”. Each item is scored on a 4-point Likert scale, ranging from 1 (not at all
characteristic of me) to 4 (very characteristic); higher scores indicate apathy. The questions
focus on the degree of self-experienced motivation and interests during the last 4 weeks and
do not include measures of functioning. A general instruction for scoring is indicated in both
scales, but the AES-C has instructions for ratings that probe level of interest in activities and
affective tone. We have previously shown that a shortened 12-item scale is a better measure
of apathy in a FEP population than the full 18-item version (Faerden et al., 2008). This study
7
also uses a shortened AES-S, taking out the same six items as in the shortened AES-C; the
latter of which is used as the “gold standard.”
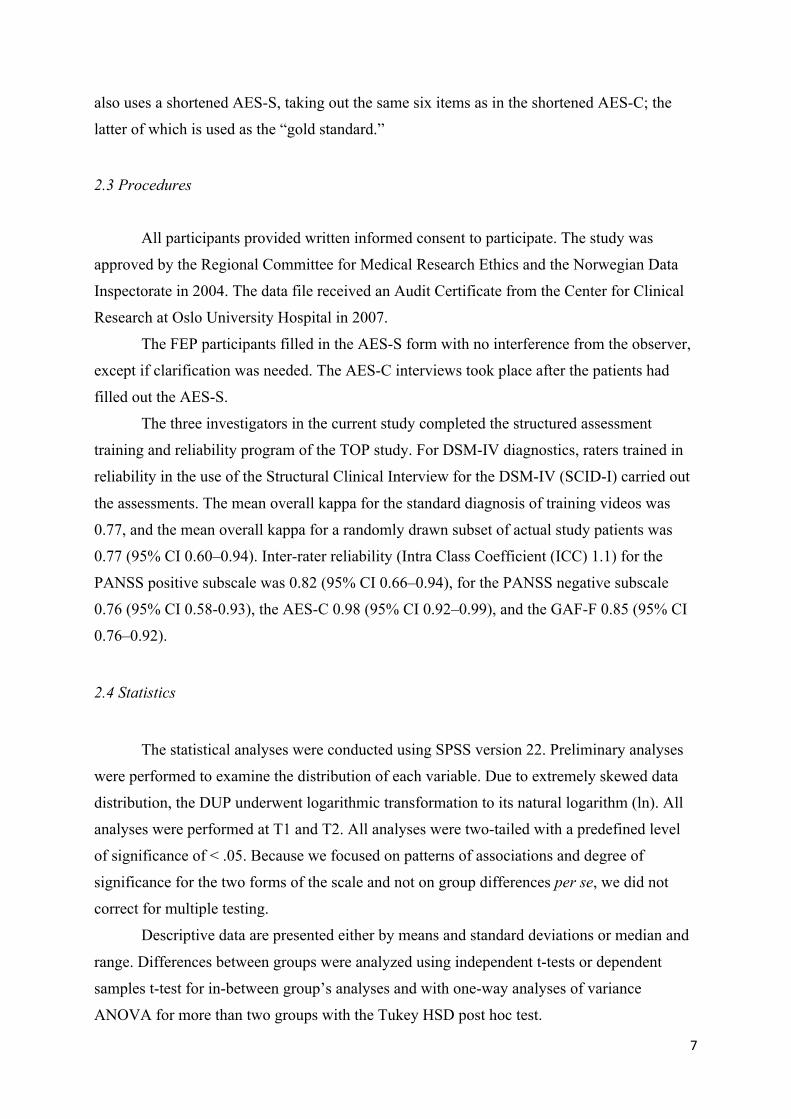
2.3 Procedures
All participants provided written informed consent to participate. The study was
approved by the Regional Committee for Medical Research Ethics and the Norwegian Data
Inspectorate in 2004. The data file received an Audit Certificate from the Center for Clinical
Research at Oslo University Hospital in 2007.
The FEP participants filled in the AES-S form with no interference from the observer,
except if clarification was needed. The AES-C interviews took place after the patients had
filled out the AES-S.
The three investigators in the current study completed the structured assessment
training and reliability program of the TOP study. For DSM-IV diagnostics, raters trained in
reliability in the use of the Structural Clinical Interview for the DSM-IV (SCID-I) carried out
the assessments. The mean overall kappa for the standard diagnosis of training videos was
0.77, and the mean overall kappa for a randomly drawn subset of actual study patients was
0.77 (95% CI 0.60–0.94). Inter-rater reliability (Intra Class Coefficient (ICC) 1.1) for the
PANSS positive subscale was 0.82 (95% CI 0.66–0.94), for the PANSS negative subscale
0.76 (95% CI 0.58-0.93), the AES-C 0.98 (95% CI 0.92–0.99), and the GAF-F 0.85 (95% CI
0.76–0.92).
2.4 Statistics
The statistical analyses were conducted using SPSS version 22. Preliminary analyses
were performed to examine the distribution of each variable. Due to extremely skewed data
distribution, the DUP underwent logarithmic transformation to its natural logarithm (ln). All
analyses were performed at T1 and T2. All analyses were two-tailed with a predefined level
of significance of < .05. Because we focused on patterns of associations and degree of
significance for the two forms of the scale and not on group differences per se, we did not
correct for multiple testing.
Descriptive data are presented either by means and standard deviations or median and
range. Differences between groups were analyzed using independent t-tests or dependent
samples t-test for in-between group’s analyses and with one-way analyses of variance
ANOVA for more than two groups with the Tukey HSD post hoc test.

8
Since this current study compares the 12-item version of the AES-C to the AES-S, we
test the homogeneity of the 12-item AES-S by reporting the item-total correlation. Reliability
of the 12-item AES-S was examined by calculating the internal consistency using Cronbach’s
alfa (α) coefficient, which ranges from 0 to 1, with a value > .7 considered as acceptable.
Strength of relationships between variables was assessed using Pearson’s correlation
coefficient (r) for the study of concordance, convergent, and discriminate validity. Degree of
correlation was defined according to Cohen, where r < .3 is weak, r = .3 - .5 is moderate, and r
> .5 is strong (Cohen J., 1988). Shared variance was estimated by the square value of r and
converted to percentage variance by multiplying by 100.
Concordance between the AES-S and the AES-C was examined by degree of bivariate
correlation, comparing mean values, changes in scores, and differences in mean values
between diagnostic groups. External convergence were examined between the AES-S and the
two PANSS negative factors: PANSS amotivation and PANSS expressive deficits factor, and
the seven PANSS negative items. Discriminate validity was examined to the other four
PANSS symptoms factors of positive, disorganized, depressive and excitative. We
hypothesized to find the the strongest correlation to the PANSS amotivation factor and
PANSS items N2 and N4, in line with the previous study of the AES-C (Faerden et al., 2008)
and with a moderate correlation to the PANSS depressive factor and weak or nonsignificant to
other PANSS symptom factors.
To control for emotional distress and to be in accordance with Marin`s definition of
apathy (Marin et al., 1991), we did partial correlation analyses, controlling for depression. We
also controlled for other possible secondary sources e.g. positive symptoms and (lack of)
insight. To control for depression, we used the CDSS; for positive symptoms, we used the
PANSS positive factor as defined above; and for insight, we used PANSS item G12 (Lack of
judgment and insight). We expected that the results would not be significantly altered.
Differences in strength of correlations were determined by Fisher`s Z transformation of r,
according to Cohen (Cohen J., 1988)
A cut-off score of > 27, based on the mean value + 2SD found in a healthy comparison
group, has been used in previous studies with the AES-C to discriminate between high and
low levels of apathy (Faerden et al., 2008). With this cut-off value, we used receiver operating
characteristic (ROC) analysis and measured area under the curve (AUC) to study if the AES-S
could accurately discriminate between high and low levels of apathy as assessed with the
AES-C. An AUC of 1 is considered a perfect test, .80 – .90 good, .70 – .80 fair, .60 –.70 poor,
and .50 – .60 worthless. We calculated sensitivity and specificity with the AES-C using cross
tabs calculations.
9
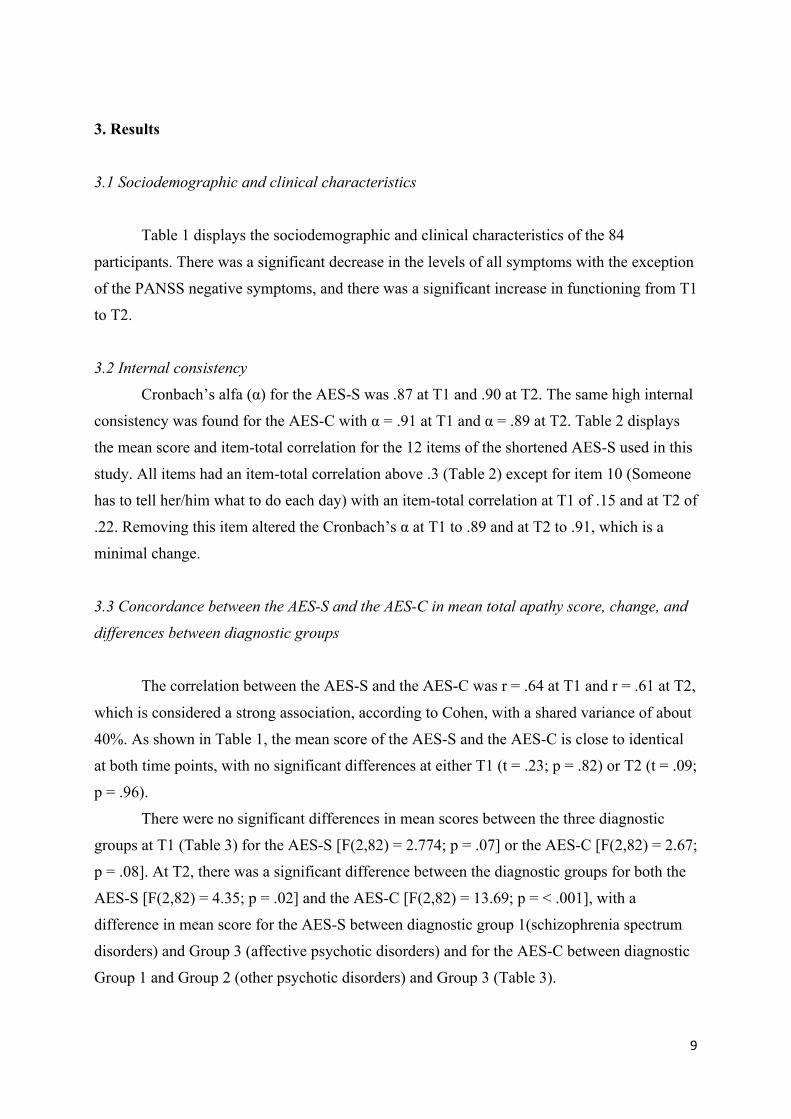
3. Results
3.1 Sociodemographic and clinical characteristics
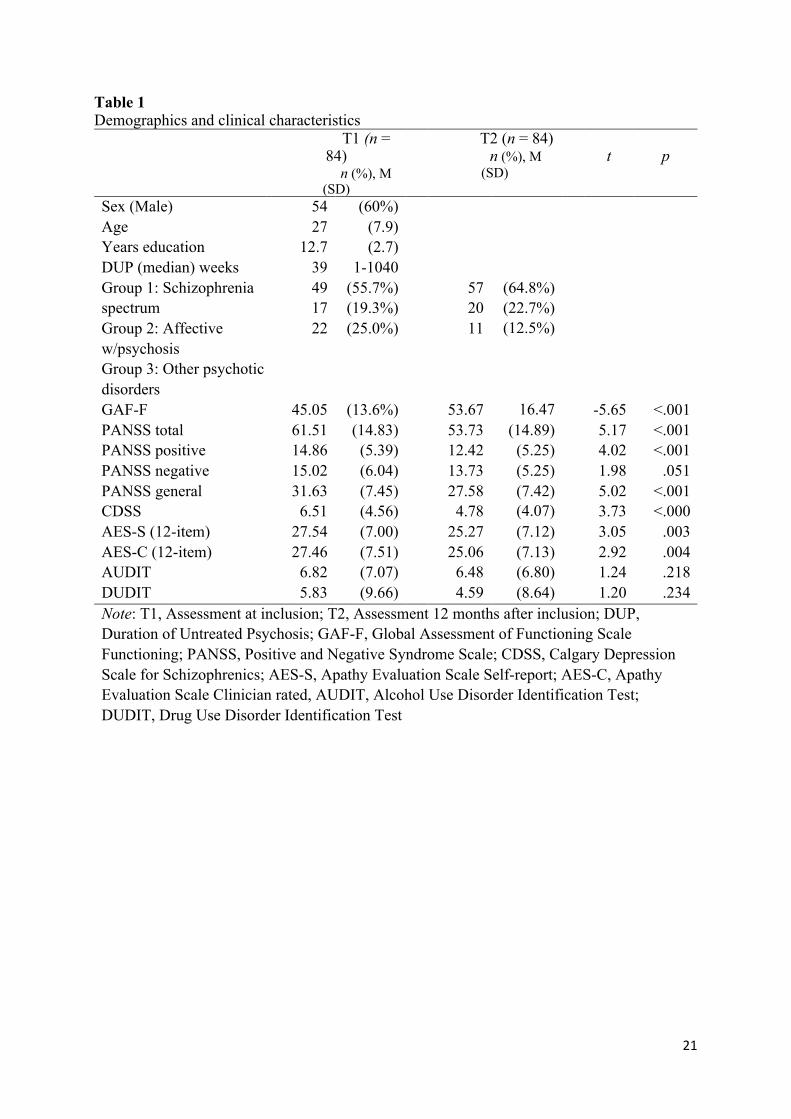
Table 1 displays the sociodemographic and clinical characteristics of the 84
participants. There was a significant decrease in the levels of all symptoms with the exception
of the PANSS negative symptoms, and there was a significant increase in functioning from T1
to T2.
3.2 Internal consistency
Cronbach’s alfa (α) for the AES-S was .87 at T1 and .90 at T2. The same high internal
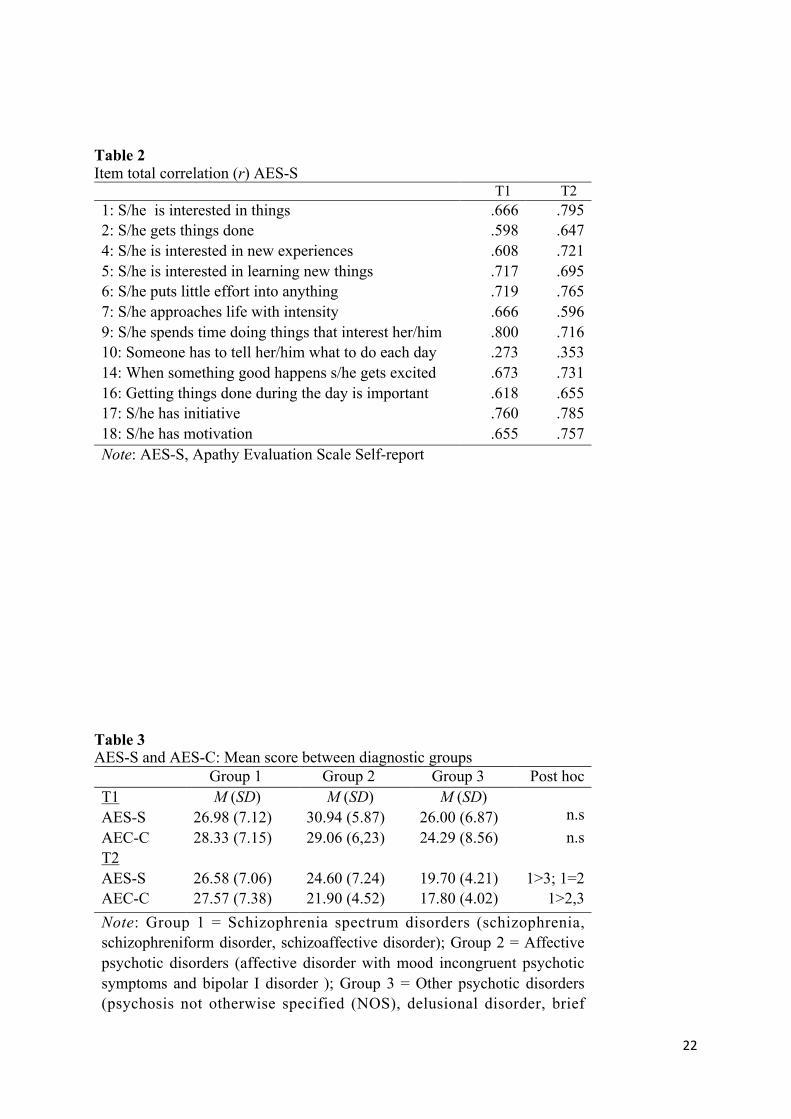
consistency was found for the AES-C with α = .91 at T1 and α = .89 at T2. Table 2 displays
the mean score and item-total correlation for the 12 items of the shortened AES-S used in this
study. All items had an item-total correlation above .3 (Table 2) except for item 10 (Someone
has to tell her/him what to do each day) with an item-total correlation at T1 of .15 and at T2 of
.22. Removing this item altered the Cronbach’s α at T1 to .89 and at T2 to .91, which is a
minimal change.
3.3 Concordance between the AES-S and the AES-C in mean total apathy score, change, and
differences between diagnostic groups
The correlation between the AES-S and the AES-C was r = .64 at T1 and r = .61 at T2,
which is considered a strong association, according to Cohen, with a shared variance of about
40%. As shown in Table 1, the mean score of the AES-S and the AES-C is close to identical
at both time points, with no significant differences at either T1 (t = .23; p = .82) or T2 (t = .09;
p = .96).
There were no significant differences in mean scores between the three diagnostic
groups at T1 (Table 3) for the AES-S [F(2,82) = 2.774; p = .07] or the AES-C [F(2,82) = 2.67;
p = .08]. At T2, there was a significant difference between the diagnostic groups for both the
AES-S [F(2,82) = 4.35; p = .02] and the AES-C [F(2,82) = 13.69; p = < .001], with a
difference in mean score for the AES-S between diagnostic group 1(schizophrenia spectrum
disorders) and Group 3 (affective psychotic disorders) and for the AES-C between diagnostic
Group 1 and Group 2 (other psychotic disorders) and Group 3 (Table 3).
10
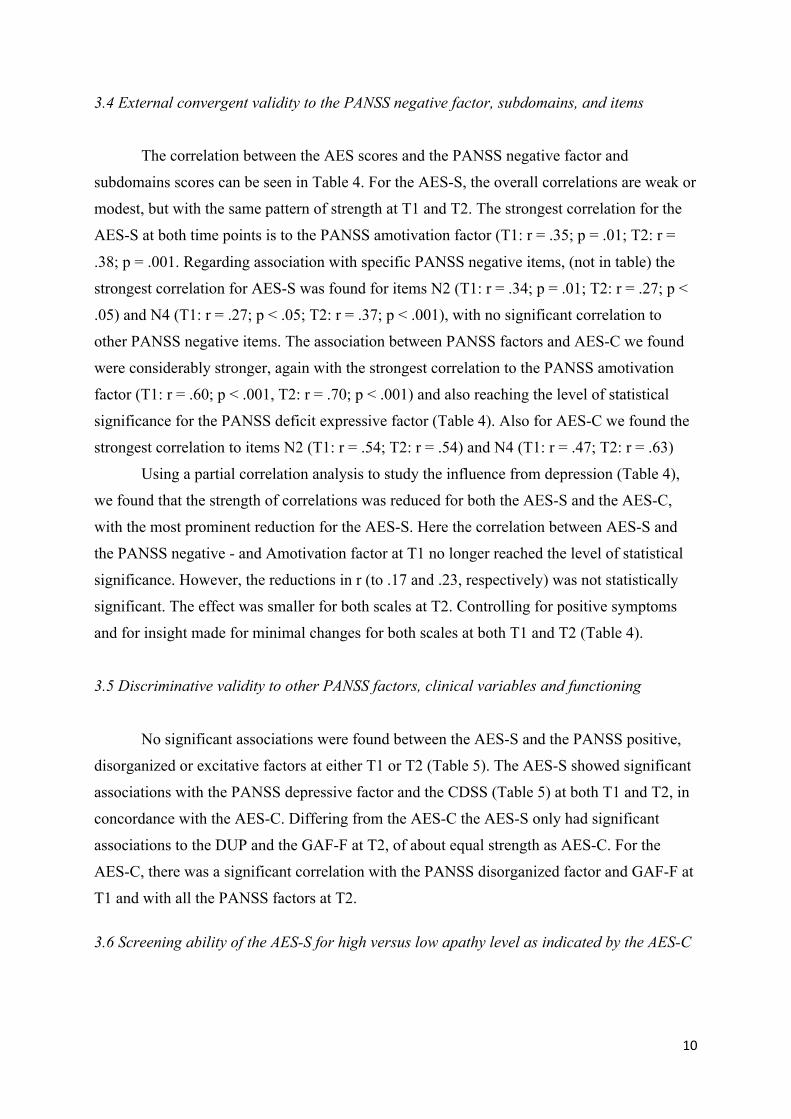
3.4 External convergent validity to the PANSS negative factor, subdomains, and items
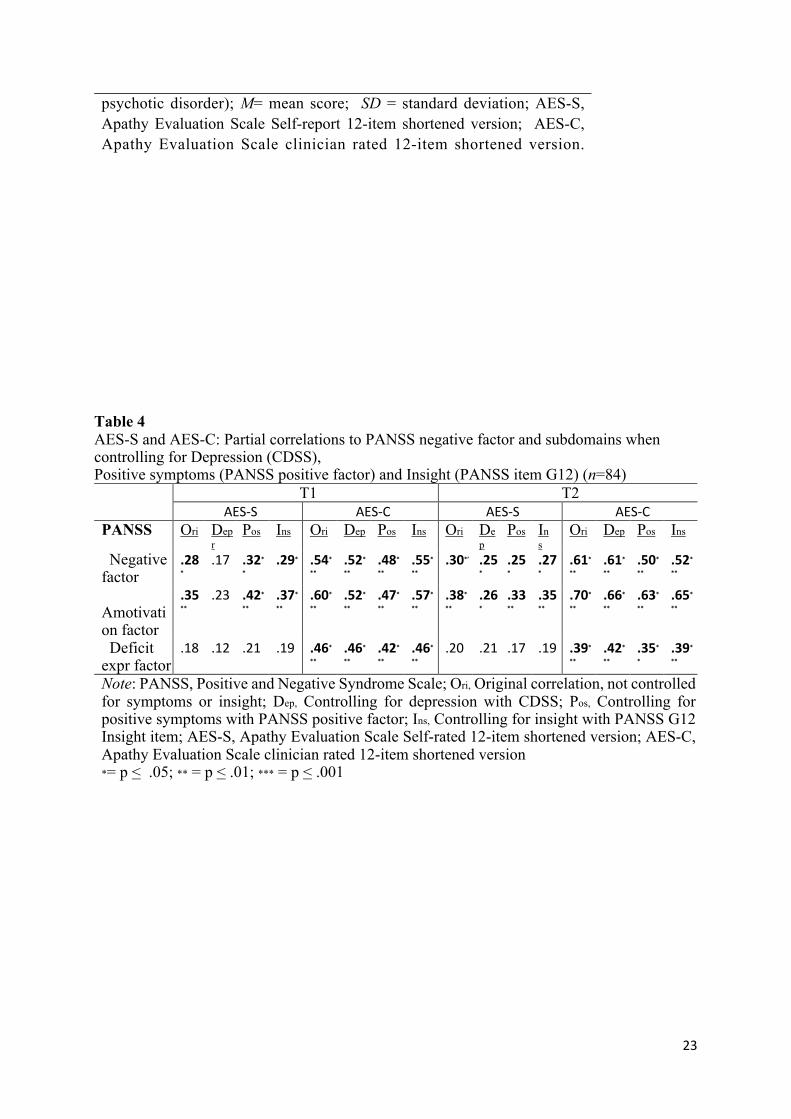
The correlation between the AES scores and the PANSS negative factor and
subdomains scores can be seen in Table 4. For the AES-S, the overall correlations are weak or
modest, but with the same pattern of strength at T1 and T2. The strongest correlation for the
AES-S at both time points is to the PANSS amotivation factor (T1: r = .35; p = .01; T2: r =
.38; p = .001. Regarding association with specific PANSS negative items, (not in table) the
strongest correlation for AES-S was found for items N2 (T1: r = .34; p = .01; T2: r = .27; p <
.05) and N4 (T1: r = .27; p < .05; T2: r = .37; p < .001), with no significant correlation to
other PANSS negative items. The association between PANSS factors and AES-C we found
were considerably stronger, again with the strongest correlation to the PANSS amotivation
factor (T1: r = .60; p < .001, T2: r = .70; p < .001) and also reaching the level of statistical
significance for the PANSS deficit expressive factor (Table 4). Also for AES-C we found the
strongest correlation to items N2 (T1: r = .54; T2: r = .54) and N4 (T1: r = .47; T2: r = .63)
Using a partial correlation analysis to study the influence from depression (Table 4),
we found that the strength of correlations was reduced for both the AES-S and the AES-C,
with the most prominent reduction for the AES-S. Here the correlation between AES-S and
the PANSS negative - and Amotivation factor at T1 no longer reached the level of statistical
significance. However, the reductions in r (to .17 and .23, respectively) was not statistically
significant. The effect was smaller for both scales at T2. Controlling for positive symptoms
and for insight made for minimal changes for both scales at both T1 and T2 (Table 4).
3.5 Discriminative validity to other PANSS factors, clinical variables and functioning
No significant associations were found between the AES-S and the PANSS positive,
disorganized or excitative factors at either T1 or T2 (Table 5). The AES-S showed significant
associations with the PANSS depressive factor and the CDSS (Table 5) at both T1 and T2, in
concordance with the AES-C. Differing from the AES-C the AES-S only had significant
associations to the DUP and the GAF-F at T2, of about equal strength as AES-C. For the
AES-C, there was a significant correlation with the PANSS disorganized factor and GAF-F at
T1 and with all the PANSS factors at T2. 3.6 Screening ability of the AES-S for high versus low apathy level as indicated by the AES-C
11
Based on a cut-off score for being apathetic of > 27, the AES-S identified 51% of
participants at baseline and 41% at follow-up as apathetic; the corresponding figures for the
AES-C were 57% and 44%. Based on a cut-off score of > 27 for the AES-C used as the gold
standard, the AUC for the AES-S at T1 was .77 (.67– .88), considered fair, and at T2, the
AUC was .82 (.73 – .92), considered good. This cut-off score gives a sensitivity of 68.1% and
a specificity of 67.6% at T1 and a sensitivity of 75.7% and specificity 85.1% at T2.
4. Discussion
4.1 Main findings
The main finding of this study is that persons with FEP can give a valid and reliable
self-report of apathy using the AES-S, closely corresponding to the clinicians’ evaluation
using the AES-C. We found a high concordance between the AES-S and the AES-C regarding
mean values, change from baseline to follow-up, and proportion with high apathy scores. The
AES-S did not show the same degree of external validity towards the clinician-rated PANSS
negative symptoms as the AES-C, but the two scales share the same pattern of significance
for correlations with the PANSS negative factors and items, which also are stable over time.
This gives support for the previously argued notion that the phenomena captured by the
PANSS do not fully represent the current definition of apathy (Marin, 1991; Kaiser et al.,
2017).The strength of the correlation between apathy and depression is equal for the AES-S
and the AES-C. Controlling for degree of depression did not influence this association to a
significant degree. However, the T1 association between AES-S and PANSS negative- and
amotivation factors did no longer reach the level of statistical significance.
4.2 Concordance between AES-S and AES-C
This study found that the 12-item shortened AES-S had sound psychometric properties
over a 12-month period with a high Cronbach’s alfa at the same level as the AES-C. The same
high Cronbach’s alfa was also found in all other studies reporting on the AES-S, including the
original by Marin (Marin et al., 1991) in addition to in chronic patients with psychosis
(Evensen et al., 2012) and in studies of other neuropsychiatric disorders (Raimo et al., 2014;
Sagen,U. et al., 2010a; Santangelo et al., 2014). The correlation between the AES-S and the
AES-C is strong with a shared variance of about 40%, in line with Marin and Guercio et al.’s
results (Marin et al., 1991; Guercio et al., 2015). A shared variance of 40% is also at the

12
highest level of reports for associations between self-ratings and clinician ratings in mental
health assessments, as reported by the National Patient-Reported Outcomes Measurement
Information system (PROMIS) for Mental Health Research (Riley et al., 2011). Moreover,
our result is of the same magnitude as that of the three different studies comparing self- and
clinician-rated versions of the MAP subfactor of the CAINS (Park et al., 2012; Llerena et al.,
2013; Engel & Lincoln, 2016). Furthermore, contrary to what is often expected, participants
with schizophrenia had a valid sense of being apathetic, in that they scored themselves with a
higher mean score than did participants in the other two diagnostic groups, in line with the
clinicians`s assessment. The results from the CAINS-MAP studies as cited above and the
present findings show that people with psychosis can validly self-report apathy and
amotivation.
The AES has been subject to factor analysis within a wide range of disorders. Except
for one study, these studies have revealed three factors: one major apathy factor and two
minor factors (Raimo et al., 2014; Sagen,U. et al., 2010a; Santangelo et al., 2014). Sagen et al.
compared the factor structure of the AES across different disorders, including patients from
the current study, and found 10 shared items for the AES-S and the AES-C in the main apathy
factor (Sagen,U. et al., 2010a). In the current study, we only found that one item (item 10) of
the shortened 12-item AES-S had low item-total correlation. This item is not one of the ten
shared items from Sagen’s study. Deleting this item did not change psychometric properties.
In Sagen’s study, the number of participants was in the lower end of what is suitable for a
factor analysis, and should, therefore, be repeated in a larger group to improve insight into the
number of items that best represents the AES-S in FEP patients. 4.3 The AES-S and external validity based on the PANSS negative symptoms
Compared to the AES-S, the AES-C had a stronger correlation with the PANSS
negative symptoms. Also, as hypothesized, the AES-S had the strongest correlation with the
PANSS amotivation factor and the items N2 and N4 representing apathy. Shared variance
with the PANSS amotivation factor was, however, lower than expected: only 12–14%
compared to 36–49% for the AES-C. The same weak external validity between the AES-S
and the PANSS negative symptoms was also found in studies of more chronic patients (Kiang
et al., 2001; Sagen,U. et al., 2010a; Evensen et al., 2012). External validity was not tested in
the self-rating studies of CAINS, but Dollfus et al., found a shared variance of 40% between
the SNS and the Scale for Assessment of Negative Symptoms (SANS) (Dollfus et al., 2016).
The better result may be due to the unique patient involvement in developing the SNS or that
13
the SANS represents negative symptoms more in line with patient perceptions than the
PANSS.
The lower correlation between the PANSS negative symptoms and the AES-S, as
compared to the AES-C, may have different explanations. First, there may be a bias based in
the same clinician rating both the PANSS and the AES-C. Moreover, the PANSS is currently
not regarded as the best assessment of negative symptoms (Kaiser et al., 2017; Marder &
Galderisi, 2017; Lincoln et al., 2017), and it has fewer items covering apathy than newer
negative symptom scales, such as the Brief Negative Symptoms Scale (BNSS) (Kirkpatrick et
al., 2011) and the CAINS (Kring et al., 2013). Finally, the awareness of apathy may vary
more amongst people in general, including patients, than amongst research clinicians who are
trained to provide high inter-rater agreement.
4.4 The AES-S and the influence from depression, positive symptoms, and a lack of insight
As expected, the current study found significant associations between the AES-S and
depression, which is also reported in three of the four newly published studies on self-
reporting negative symptoms (Park et al., 2012; Engel & Lincoln, 2016; Dollfus et al., 2016;
Llerena et al., 2013). It should be noted that the strength of these correlations are of equal
magnitude for the AES-S and the AES-C, and stronger at T2 than at T1. In the partial
correlation analysis controlling for depression, only the strength of associations between the
AES-S and PANSS negative and amotivation factor were reduced and this reduction was not
statistically significant. Controlling for depression had also no significant influence on
strength of correlations between AES-C and PANSS negative symptoms. Taken together
these results give support to the notion that apathy and depression are two separate
phenomena with some common features, also when using self-reports (Marin et al., 1993;
Simon et al., 2010; Morch-Johnsen et al., 2015; Hollocks et al., 2015). As hypothesized, we
also found that self-reports of apathy were minimally influenced by positive symptoms and
also that a lack of insight did not influence results. This was also found for the AES-C.
4.5 The AES-S and associations to other clinical variables and psychosocial functions
Regarding other clinical variables selected for the study, we only found significant
correlations between the AES-S and the DUP at T2. High levels of self-reported negative
symptoms and especially apathy in at-risk (Demjaha et al., 2012; Valmaggia et al., 2013) and
14
healthy young populations (Dominguez et al., 2009) have been found to predict a transition to
psychosis. We have in a previous report from this study shown that enduring high AES-C
scores (at T1 and T2) was independently associated with a long DUP and poor functioning
(Faerden et al., 2010). These preliminary results regarding the AES-S and its association to
the DUP are in need of further exploration.
We found a weaker association between the GAF-F and the AES-S than for the GAF-
F and the AES-C, with no shared variance at T1 and increasing to 24% at T2. One explanation
may be the degree of insight and expectations into one’s own functioning, where poor
functioning may be more acceptable to FEP patients than to the clinician. However, the
clinicians may also be biased as the same person did all assessments. The use of a more
specific functional assessment, including self-reports, may help clinicians understand how
self-reported apathy may be associated with different aspects of functioning.
4.6 Screening for high levels of apathy using the AES-S
The proportion with high levels of apathy was the same, regardless of using the AES-S
or the AES-C. The AUC for the AES-S versus the AES-C was fair to good with a cut-off
score of > 27. Yet, this cut off did not yield acceptable sensitivity or specificity at T1 for the
AES-S to screen for high levels, but at T2, the sensitivity and specificity were more
satisfactory. It would be of interest to explore if a shorter version of the AES-S or another cut-
off value for high apathy could improve sensitivity at T1. The number of participants in this
study did, however, not allow for such explorations.
5. Limitations
The main limitations of this study are that the clinician was not blind to other
assessments when scoring the AES-C. The number of participants is at the lower end for
sound interpretations. We have used the PANSS negative symptoms, which was developed
more than 40 years ago, for external validation. The representation of the different negative
symptoms, such as apathy, in the PANSS are limited and not in line with the current concept
and definitions.
6. Conclusions
15
This is the first study to investigate an apathy self-report scale in participants with
FEP. Moreover, it is the first follow-up study to investigate self-reports of negative
symptoms. We found similar properties for self-report and clinician assessment of apathy, but
also some differences that are in need of further investigation. The concordance between the
AES-S and the AES-C is strong and demonstrates that people with FEP can validly self-report
apathy. It is important to understand the limits of the concordance between self-rating and
clinician rating, but also to value those differences that can complement our understanding of
psychosis. More work should be carried out to refine the AES-S and understand its strengths
and shortcomings in people with psychosis. This should include patients with a longer
duration of illness for a fuller understanding of how self-reports can be used and how apathy
is perceived during different stages of illness. Investigating the associations between the AES-
S and other self-reporting scales, such as the SNS and the MAP-SR, will be valuable for a
deeper understanding of the patient`s perception of apathy and reduced motivation. It is also
of interest to study how the AES-S is associated to the new negative symptoms scales CAINS
and BNSS to understand more of the modest to non-significant associations between the AES-
S and the PANSS negative symptoms.
Role of funding source
This study was supported by a study grant from the Division of Mental Health and
Addiction at the Oslo University Hospital, Ulleval, the Research Council of Norway, The KG
Jebsen Stiftelsen, the South-Eastern Norway Regional Health Authority, Josef and Haldis
Andresen’s Grant, and the Emil Strays Grant. The funding sources had no further role in study
design, in the collection, analysis, and interpretation of data, in the writing of the report, or the
decision to submit the paper for publication.
Conflict of interest
The authors have declared that there are no conflicts of interest in relation to the
subject of this study.
Authors` contributions
AF: study design, collecting data, analysis, drafting and revising the manuscript. SHL:
discussion and revision of manuscript; CS: discussion and revision of manuscript, PAR:

16
discussion and revision of manuscript; OP: discussion and revision of manuscript; ID:
discussion and revision of manuscript; OAA: conception of the study and revision of
manuscript; IA: conception of the study and revising the manuscript; SRM: conception of
study, discussion and revision of manuscript IM: conception of the study, study design, data
analysis and revising the manuscript. All authors contributed to and have approved of the final
version of the manuscript. Reference List
Andersson S., Krogstad J.M., Finset A., 1999. Apathy and depressed mood in aquired brain damage:
relationship to lesion localization and psychophysiological reaction. Psychol. Med. 29, 447-56.
Andreasen N.C., 1990. Schizophrenia: Positive and Negative Symptoms and Syndromes, Modern Problems of Pharmocopsychiatry, Basel.
Blanchard,J.J., Kring,A.M., Horan,W.P., Gur,R., 2011. Toward the next generation of negative symptom assessments: the collaboration to advance negative symptom assessment in schizophrenia. Schizophr. Bull. 37, 291-299.
Cohen J., 1988. Statistical Power Analysis for the behavioural Sciences, Second edition ed. lawrence Erbaum Associates, Publishers, Hillsdale, New Jersey.
Demjaha,A., Valmaggia,L., Stahl,D., Byrne,M., McGuire,P., 2012. Disorganization/cognitive and negative symptom dimensions in the at-risk mental state predict subsequent transition to psychosis. Schizophr. Bull. 38, 351-359.
Dollfus,S., Mach,C., Morello,R., 2016. Self-Evaluation of Negative Symptoms: A Novel Tool to Assess Negative Symptoms. Schizophr. Bull. 42, 571-578.
Dominguez,M.D., Wichers,M., Lieb,R., Wittchen,H.U., van,O.J., 2009. Evidence That Onset of Clinical Psychosis Is an Outcome of Progressively More Persistent Subclinical Psychotic Experiences: An 8-Year Cohort Study. Schizophr. Bull.
Emsley,R., Rabinowitz,J., Torreman,M., 2003. The factor structure for the Positive and Negative Syndrome Scale (PANSS) in recent-onset psychosis. Schizophr. Res. 61, 47-57.
Engel,M., Lincoln,T.M., 2016. Motivation and Pleasure Scale-Self-Report (MAP-SR): Validation of the German version of a self-report measure for screening negative symptoms in schizophrenia. Compr. Psychiatry 65, 110-115.
Evans,J., Rose,D., Flach,C., Csipke,E., Glossop,H., McCrone,P., Craig,T., Wykes,T., 2012. VOICE: developing a new measure of service users' perceptions of inpatient care, using a participatory methodology. J. Ment. Health 21, 57-71.
Evensen,J., Rossberg,J.I., Barder,H., Haahr,U., Hegelstad,W., Joa,I., Johannessen,J.O., Larsen,T.K., Melle,I., Opjordsmoen,S., Rund,B.R., Simonsen,E., Sundet,K., Vaglum,P., Friis,S.,
17
McGlashan,T., 2012. Apathy in first episode psychosis patients: a ten year longitudinal follow-up study. Schizophr. Res. 136, 19-24.
Faerden,A., Barrett,E.A., Nesvag,R., Friis,S., Finset,A., Marder,S.R., Ventura,J., Andreassen,O.A., Agartz,I., Melle,I., 2013. Apathy, poor verbal memory and male gender predict lower psychosocial functioning one year after the first treatment of psychosis. Psychiatry Res. 210, 55-61.
Faerden,A., Finset,A., Friis,S., Agartz,I., Barrett,E.A., Nesvag,R., Andreassen,O.A., Marder,S.R., Melle,I., 2010. Apathy in first episode psychosis patients: one year follow up. Schizophr. Res. 116, 20-26.
Faerden,A., Nesvag,R., Barrett,E.A., Agartz,I., Finset,A., Friis,S., Rossberg,J.I., Melle,I., 2008. Assessing apathy: the use of the Apathy Evaluation Scale in first episode psychosis. Eur Psychiatry 23, 33-39.
Fervaha,G., Foussias,G., Agid,O., Remington,G., 2015. Motivational deficits in early schizophrenia: prevalent, persistent, and key determinants of functional outcome. Schizophr. Res. 166, 9-16.
Foussias,G., Mann,S., Zakzanis,K.K., van,R.R., Agid,O., Remington,G., 2011. Prediction of longitudinal functional outcomes in schizophrenia: the impact of baseline motivational deficits. Schizophr. Res. 132, 24-27.
Guercio,B.J., Donovan,N.J., Munro,C.E., Aghjayan,S.L., Wigman,S.E., Locascio,J.J., Amariglio,R.E., Rentz,D.M., Johnson,K.A., Sperling,R.A., Marshall,G.A., 2015. The Apathy Evaluation Scale:
18
A Comparison of Subject, Informant, and Clinician Report in Cognitively Normal Elderly and Mild Cognitive Impairment. J. Alzheimers. Dis. 47, 421-432.
Hollocks,M.J., Lawrence,A.J., Brookes,R.L., Barrick,T.R., Morris,R.G., Husain,M., Markus,H.S., 2015. Differential relationships between apathy and depression with white matter microstructural changes and functional outcomes. Brain 138, 3803-3815.
Kaiser,S., Lyne,J., Agartz,I., Clarke,M., Morch-Johnsen,L., Faerden,A., 2017. Individual negative symptoms and domains - Relevance for assessment, pathomechanisms and treatment. Schizophr. Res. 186, 39-45.
Kay SR, Fiszbein A,O.L., 1987. The positive and negative syndrome Scale (PANSS) for schizophrenia. Schizophr. Bull. 16, 261-276.
Kiang,M., Christensen,B.K., Remington,G., Kapur,S., 2001. Apathy in schizophrenia: clinical correlates and association with functional outcome. Schizophr. Res. 63, 79-88.
Kirkpatrick,B., Fenton,W.S., Carpenter,W.T., Jr., Marder,S.R., 2006. The NIMH-MATRICS consensus statement on negative symptoms. Schizophr. Bull. 32, 214-219.
Kirkpatrick,B., Strauss,G.P., Nguyen,L., Fischer,B.A., Daniel,D.G., Cienfuegos,A., Marder,S.R., 2011. The brief negative symptom scale: psychometric properties. Schizophr. Bull. 37, 300-305.
Kirschner,M., Aleman,A., Kaiser,S., 2017. Secondary negative symptoms - A review of mechanisms, assessment and treatment. Schizophr. Res. 186, 29-38.
Konstantakopoulos,G., Ploumpidis,D., Oulis,P., Patrikelis,P., Soumani,A., Papadimitriou,G.N., Politis,A.M., 2011. Apathy, cognitive deficits and functional impairment in schizophrenia. Schizophr. Res. 133, 193-198.
Kring,A.M., Gur,R.E., Blanchard,J.J., Horan,W.P., Reise,S.P., 2013. The Clinical Assessment Interview for Negative Symptoms (CAINS): final development and validation. Am. J. Psychiatry 170, 165-172.
Liemburg,E., Castelein,S., Stewart,R., van der Gaag,M., Aleman,A., Knegtering,H., 2013. Two subdomains of negative symptoms in psychotic disorders: established and confirmed in two large cohorts. J. Psychiatr. Res. 47, 718-725.
Lincoln,T.M., Dollfus,S., Lyne,J., 2017. Current developments and challenges in the assessment of negative symptoms. Schizophr. Res. 186, 8-18.
Llerena,K., Park,S.G., McCarthy,J.M., Couture,S.M., Bennett,M.E., Blanchard,J.J., 2013. The Motivation and Pleasure Scale-Self-Report (MAP-SR): reliability and validity of a self-report measure of negative symptoms. Compr. Psychiatry 54, 568-574.
Lueken,U., Seidl,U., Volker,L., Schweiger,E., Kruse,A., Schroder,J., 2007. Development of a short version of the Apathy Evaluation Scale specifically adapted for demented nursing home residents. Am. J. Geriatr. Psychiatry 15, 376-385.
Marder,S.R., Galderisi,S., 2017. The current conceptualization of negative symptoms in schizophrenia. World Psychiatry 16, 14-24.

19
Marin,R.S., 1991. Apathy: a neuropsychiatric syndrome. J. Neuropsychiatry Clin. Neurosci. 3, 243-254.
Marin,R.S., Biedrzycki,R.C., Firinciogullari,S., 1991. Reliability and validity of the Apathy Evaluation Scale. Psychiatry Res. 38, 143-162.
Marin,R.S., Firinciogullari,S., Biedrzycki,R.C., 1993. The sources of convergence between measures of apathy and depression. Journal of Affective Disorders. 28, 117-124.
Montgomery,S.A., van Zwieten-Boot,B., 2007. ECNP consensus meeting. Negative, depressive and cognitive symptoms of schizophrenia. Nice, March 2004. Eur. Neuropsychopharmacol. 17, 70-77.
Morch-Johnsen,L., Nesvag,R., Faerden,A., Haukvik,U.K., Jorgensen,K.N., Lange,E.H., Andreassen,O.A., Melle,I., Agartz,I., 2015. Brain structure abnormalities in first-episode psychosis patients with persistent apathy. Schizophr. Res. 164, 59-64.
Park,S.G., Llerena,K., McCarthy,J.M., Couture,S.M., Bennett,M.E., Blanchard,J.J., 2012. Screening for negative symptoms: preliminary results from the self-report version of the Clinical Assessment Interview for Negative Symptoms. Schizophr. Res. 135, 139-143.
Pedersen,G., Hagtvet,K.A., Karterud,S., 2007. Generalizability studies of the Global Assessment of Functioning-Split version. Compr. Psychiatry 48, 88-94.
Radakovic,R., Harley,C., Abrahams,S., Starr,J.M., 2015. A systematic review of the validity and reliability of apathy scales in neurodegenerative conditions. Int. Psychogeriatr. 27, 903-923.
Raimo,S., Trojano,L., Spitaleri,D., Petretta,V., Grossi,D., Santangelo,G., 2014. Apathy in multiple sclerosis: a validation study of the apathy evaluation scale. J. Neurol. Sci. 347, 295-300.
Riley,W.T., Pilkonis,P., Cella,D., 2011. Application of the National Institutes of Health Patient-reported Outcome Measurement Information System (PROMIS) to mental health research. J. Ment. Health Policy Econ. 14, 201-208.
Romm,K.L., Rossberg,J.I., Berg,A.O., Barrett,E.A., Faerden,A., Agartz,I., Andreassen,O.A., Melle,I., 2010. Depression and depressive symptoms in first episode psychosis. J. Nerv. Ment. Dis. 198, 67-71.
Rose,D., Evans,J., Sweeney,A., Wykes,T., 2011. A model for developing outcome measures from the perspectives of mental health service users. Int. Rev. Psychiatry 23, 41-46.
Roth,R.M., Flashman,L.A., Saykin,A.J., McAllister,T.W., Vidaver,R., 2004. Apathy in schizophrenia: reduced frontal lobe volume and neuropsychological deficits. Am. J. Psychiatry 161, 157-159.
Sagen,U., Faerden,A., Haug,T., Melle,I., Finset,A., Dammen,T., 2010a. Are there common core features of apathy in different neuropsychiatric samples as assessed by the Apathy Evaluation Scale? Nord. J. Psychiatry 64, 49-57.
Sagen,U., Finset,A., Moum,T., Morland,T., Vik,T.G., Nagy,T., Dammen,T., 2010b. Early detection of patients at risk for anxiety, depression and apathy after stroke. Gen. Hosp. Psychiatry 32, 80-85.
20
Santangelo,G., Barone,P., Cuoco,S., Raimo,S., Pezzella,D., Picillo,M., Erro,R., Moccia,M., Pellecchia,M.T., Amboni,M., Santangelo,F., Grossi,D., Trojano,L., Vitale,C., 2014. Apathy in untreated, de novo patients with Parkinson's disease: validation study of Apathy Evaluation Scale. J. Neurol. 261, 2319-2328.
Selten,J.P., Sijben,N.E., van den Bosch,R.J., Omloo-Visser,J., Warmerdam,H., 1993. The subjective experience of negative symptoms: a self-rating scale. Compr. Psychiatry 34, 192-197.
Simon,J.J., Biller,A., Walther,S., Roesch-Ely,D., Stippich,C., Weisbrod,M., Kaiser,S., 2010. Neural correlates of reward processing in schizophrenia--relationship to apathy and depression. Schizophr. Res. 118, 154-161.
Valmaggia,L.R., Stahl,D., Yung,A.R., Nelson,B., Fusar-Poli,P., McGorry,P.D., McGuire,P.K., 2013. Negative psychotic symptoms and impaired role functioning predict transition outcomes in the at-risk mental state: a latent class cluster analysis study. Psychol. Med. 43, 2311-2325.
Weiser,M., Garibaldi,G., 2015. Quantifying motivational deficits and apathy: a review of the literature. Eur. Neuropsychopharmacol. 25, 1060-1081.
21
Table 1 Demographics and clinical characteristics T1 (n =
84) n (%), M
(SD)
T2 (n = 84) n (%), M
(SD)
t
p
Sex (Male) 54 (60%) Age 27 (7.9) Years education 12.7 (2.7) DUP (median) weeks 39 1-1040 Group 1: Schizophrenia spectrum Group 2: Affective w/psychosis Group 3: Other psychotic disorders
49 17 22
(55.7%) (19.3%) (25.0%)
57 20
11
(64.8%) (22.7%) (12.5%)
GAF-F 45.05 (13.6%) 53.67 16.47 -5.65 <.001 PANSS total PANSS positive PANSS negative PANSS general
61.51 14.86 15.02 31.63
(14.83) (5.39) (6.04) (7.45)
53.73 12.42 13.73 27.58
(14.89) (5.25) (5.25) (7.42)
5.17 4.02 1.98 5.02
<.001 <.001
.051 <.001
CDSS 6.51 (4.56) 4.78 (4.07) 3.73 <.000 AES-S (12-item) AES-C (12-item)
27.54 27.46
(7.00) (7.51)
25.27 25.06
(7.12) (7.13)
3.05 2.92
.003
.004 AUDIT DUDIT
6.82 5.83
(7.07) (9.66)
6.48 4.59
(6.80) (8.64)
1.24 1.20
.218
.234 Note: T1, Assessment at inclusion; T2, Assessment 12 months after inclusion; DUP, Duration of Untreated Psychosis; GAF-F, Global Assessment of Functioning Scale Functioning; PANSS, Positive and Negative Syndrome Scale; CDSS, Calgary Depression Scale for Schizophrenics; AES-S, Apathy Evaluation Scale Self-report; AES-C, Apathy Evaluation Scale Clinician rated, AUDIT, Alcohol Use Disorder Identification Test; DUDIT, Drug Use Disorder Identification Test
22
Table 2 Item total correlation (r) AES-S T1 T2 1: S/he is interested in things .666 .795 2: S/he gets things done .598 .647 4: S/he is interested in new experiences .608 .721 5: S/he is interested in learning new things .717 .695 6: S/he puts little effort into anything .719 .765 7: S/he approaches life with intensity .666 .596 9: S/he spends time doing things that interest her/him .800 .716 10: Someone has to tell her/him what to do each day .273 .353 14: When something good happens s/he gets excited .673 .731 16: Getting things done during the day is important .618 .655 17: S/he has initiative .760 .785 18: S/he has motivation .655 .757 Note: AES-S, Apathy Evaluation Scale Self-report
Table 3 AES-S and AES-C: Mean score between diagnostic groups Group 1 Group 2 Group 3 Post hoc T1 AES-S
M (SD) 26.98 (7.12)
M (SD) 30.94 (5.87)
M (SD) 26.00 (6.87)
n.s
AEC-C 28.33 (7.15) 29.06 (6,23) 24.29 (8.56) n.s T2 AES-S 26.58 (7.06) 24.60 (7.24) 19.70 (4.21) 1>3; 1=2 AEC-C 27.57 (7.38) 21.90 (4.52) 17.80 (4.02) 1>2,3 Note: Group 1 = Schizophrenia spectrum disorders (schizophrenia, schizophreniform disorder, schizoaffective disorder); Group 2 = Affective psychotic disorders (affective disorder with mood incongruent psychotic symptoms and bipolar I disorder ); Group 3 = Other psychotic disorders (psychosis not otherwise specified (NOS), delusional disorder, brief
23
psychotic disorder); M= mean score; SD = standard deviation; AES-S, Apathy Evaluation Scale Self-report 12-item shortened version; AES-C, Apathy Evaluation Scale clinician rated 12-item shortened version.
Table 4 AES-S and AES-C: Partial correlations to PANSS negative factor and subdomains when controlling for Depression (CDSS), Positive symptoms (PANSS positive factor) and Insight (PANSS item G12) (n=84) T1 T2
AES-S AES-C AES-S AES-C PANSS Ori Dep
r Pos Ins Ori Dep Pos Ins Ori De
p Pos In
s Ori Dep Pos Ins
Negative factor
.28*
.17 .32*
* .29* .54*
** .52*
** .48*
** .55*
** .30*’ .25
* .25*
.27*
.61*
** .61*
** .50*
** .52*
** Amotivation factor
.35**
.23 .42*
** .37*
** .60*
** .52*
** .47*
** .57*
** .38*
** .26*
.33**
.35**
.70*
** .66*
** .63*
** .65*
**
Deficit expr factor
.18 .12 .21 .19 .46*
** .46*
** .42*
** .46*
** .20 .21 .17 .19 .39*
** .42*
** .35*
* .39*
** Note: PANSS, Positive and Negative Syndrome Scale; Ori, Original correlation, not controlled for symptoms or insight; Dep, Controlling for depression with CDSS; Pos, Controlling for positive symptoms with PANSS positive factor; Ins, Controlling for insight with PANSS G12 Insight item; AES-S, Apathy Evaluation Scale Self-rated 12-item shortened version; AES-C, Apathy Evaluation Scale clinician rated 12-item shortened version *= p < .05; ** = p < .01; *** = p < .001

24
Table 5 Correlations (r) between AES-S and AES-C and clinical variables assessed at intake and at 12 months T1 T2 AES-S AES-C AES-S AES-C
Gender (male) .03 .15 .22 .30** Age .02 -.03 .04 .07 PAS total Childhood Early Youth Late youth
.20 .14 .17
.15 .13 .16
.16 .17 .14
.17 .12 .13
Years of education -.02 -.08 -.17 -.17 DUP (ln) .13 .11 .36** .41*** GAF-F -.13 -.46*** -.49*** -.64*** PANSS factors
Positive Disorganized Depressive Excitative
-.07 -.09 .29* -.16
.14 .27* .26* -.10
.21 .17 .48*** .08
.43*** .45*** .48*** .06
CDSS .42*** .42*** .54*** .46*** Note: AES-S, Apathy Evaluation Scale Self-report 12-item shortened version; AES-C, Apathy Evaluation Scale clinician rated 12-item shortened version; PANSS, Positive and Negative Syndrome Scale; CDSS, Calgary Depression Scale for Schizophrenics; PAS, Premorbid Assessment of functioning Scale; DUP(ln), Duration of Untreated Psychosis logarithmic transformed; GAF-F, Global Assessment of Functional Scale Functioning score. *= p < .05; ** = p < .01; *** = p < .001