Energy Corridor Planning for Increased Electrical Grid Reliability

IN9700848
BARC/1997/E/001
RELIABILITY ANALYSIS OF ELECTRICAL POWER SUPPLY SYSTEMS OF INDIAN PRESSURISED HEAVY WATER REACTORS
byR. K. Saraf and A. K. Babar
Reactor Safety Division and
V. V. S. Sanyasi Rao Health Physics Division
1997
VOL 2 8 Ns 1 9
BA
RC
/1997/E/001

BAR
C/1
99 7/
E/0
01 BARC/1997/E/G0I
GOVERNMENT OF INDIA ATOMIC ENERGY COMMISSION
RELIABILITY ANALYSIS OF ELECTRICAL POWER SUPPLY
SYSTEMS OF INDIAN PRESSURISED HEAVY WATER REACTORS
byR.K. Saraf and A.K. Babar
Reactor Safety Division
and
V.V.S. Sanyasi Rao Health Physics Division
BHABHA ATOMIC RESEARCH CENTRE MUMBAI, INDIA
1997

BARC/1997/E/001
BIBLIOGRAPHIC DESCRIPTION SHEET FOR TECHNICAL REPORT (as per IS : 9400 - 1980>
01 Security classification : Unc1assified
02 Distribution : External
03 Report status : New
04 Series i BARC External
05 Report type : Technical Report
06 Report No. : BARC/1997/E/OOl
07 Part No. or Volume No. s
08 Contract No. i
10 Title and subtitle : Reliability analysis of electrical power supply systems of Indian Pressurised Heavy Water Reactors
11 Collation : 39 p., 10 tabs., 12 figs.
13 Project No. :
20 Personal author (s) : (1) R.K. Saraf; A.K. Babar;(2) V.V.S. Sanyasi Rao
21 Affiliation of author (s) : Reactor Safety Division, Bhabha Atomic Research Centre, Mumbai; (2) HealthPhysics Division, Bhabha AtomicResearch Centre, Mumbai
22 Corporate author(s) s Bhabha Atomic Research Centre,Mumbai—400 085
23 Originating unit : Reactor Safety Division, BARC,Mumbai
24 Sponsor(s) Name i Department of Atomic Energy
Type z Government
30 Date of submission : January 1997
31 Pub1ication/Issue date February 1997
contd...(1A)
(ii)

(ii )
40 Publisher/Distributor : Head, Library Bhabha Atomic
and Information Division, Research Centre, Mumbai
42 Form of distribution : Hard Copy
50 Language of text : English
51 Language of summary : English
52 No. of references :
53 Given data on s
60 Abstract : Electrical power supply is essential for the operation of process as well as safety systems of a Nuclear Power Plant (NPP >. Hence it is necessary to ensure that the systems needed to provide power are highly reliable. A reliablity analysis of both the class IV and class III power supply systems has been carried out for a standard 220 MWe Pressurised Heavy Water Reactor (PHWR) under construction and a 500 MWe unit under design. In addition, simultaneous failure of off—site (grid supply) and on-site (station and emergency supplies) power has been found to be a deciding factor in risk assessment studies of many NPPs. The report also includes a station blackout analysis based on the data on frequency and duration of class IV failures at Tarapur. It is observed that common cause failures (grid station interaction) in class IV and class III (diesel generators) are dominant contributors. Such reliability studies have been carried out using PSAPACK and MARKOV methods to obtain an idea of the contributions of various systems to plant safety and helping in accident management aspect
70 Keywords/Descriptors : PHWR TYPE REACTORS; FAULT TREE ANALYSIS;RELIABILITY; POWER SUPPLIES; MARKOV PROCESS; FAILURE MODE ANALYSIS; FAILURES; POWER RANGE 100-1000 MW
71 Class hjp. : INIS Subject Category : E3400
99 Supplementary elements :

Contents
1 Objective 22 Scope 23 power supply systems at Indian PHWRs 2
3.1 Class IV Power 33.2 Class III Power 33.3 Class II Power 43.4 Class l Power 4
4 Reliability Analysis 44.1 Reliability Indices 44.2 Methods of Analysis 5
4.2.1 Fault Tree Analysis 54.2.2 Markov Models 5
5 Data 66 Quantification 7
6.1 220 MWe PHWR Power Supply System 76.1.1 Class IV Power Supply 76.1.2 Class III Power Supply 7
6.2 500 MWe PHWR Electrical Power Supply System 86.2.1 Class IV Power Supply 86.2.2 Class III Power Supply 9
7 Blackout analysis 107.1 Frequency Evaluation of SB 11
8 Acknowledgements 11

List of Tables
Table 1 Component Description and Codes 13Table 2 Failure Mode Code 15Table 3 Component Failure Data (Class IV Failure
Frequency evaluation)16
Table 4 Minimal Cutsets and its Contribution to System Failure (Class IV Failure Probability Calculation)
16
Table 5 Component Failure Probability Data (Class IV Failure Probability Calculation)
17
Table 6 Minimal Cutsets and its Contribution to System Failure (Class IV unavailability)
17
Table 7 Component Failure Probability Data (Class III) 18Taole 8 Minimal Cutsets and its Contribution to System
Failure (Class III)19
Table 9 System Unavailabilities (500 MWe System) 20Table 10 System Failure Frequencies (500 MWe System) 20

List of Figures
Fig.1: Kaiga ARP Electrical Power Supply 21Fig.2: Line Diagram tor 500 MWe PHWR Class IV Power Supply 22
System - Scheme IFig.3: Line Diagram for 500 MWe PHWR Class IV Power Supply 23
System - Scheme IIFig.4: Line Diagram for 500 MWe PHWR Class III Power Supply 24
SystemFig.5: Fault Tree for 200 MWe PHWR Class IV Power Supply 25
FailureFig.6: Fault Tree for 220 MWe PHWR Class III Power Supply 26
FailureFig.7: Fault Tree For 500 MWe PHWR Class IV Power Failure 27
(Scheme I)Fig.8: Fault Tree For 500 MWe PHWR Class IV Power Failure 29
(Scheme II)Fig.9: Fault Tree For 500 MWe PHWR Class III Power Failure 31
Fig. 10: Blackout Analysis 32Fig.11: Blackout Analysis (220 MWe Unit) 33Fig.12: Blackout Analysis (500 MWe Unit) 34

Reliability Analysis of Electrical Power supply Systems
of Indian Pressurised Heavy Water Reactors
1 Objective:Electrical power supply is essential in the operation of
process as well as safety systems of any nuclear power plant (NPP). Hence it is necessary to ensure that the systems needed to provide power are highly reliable. In this study, the power supply Systems of Indian Pressurised Heavy Water Reactors (PHWRs ) are examined from the reliability point of view. In addition, simultaneous failure of off-site (grid supply) and on-site (Station and emergency supplies) power supplies (station black out) has been found to be a deciding factor in ensuring safety of NPPs in many countries. The susceptibility of Indian PHWRs is also examined for the occurrence of such station blackout situations. These studies help in strengthening safety of the plant by (1) incorporating design modifications to improve the reliability/availability of the power supply systems and (2) providing additional mitigating systems or procedures to handle the consequences resulting from station blackout; thus leading to accident management aspects of the plant.
2 Scope:The scope of the study includes :
(a) a brief description of power supply arrangement(b) the reliability analyses of the power supply system and(c) station blackout (simultaneous failure of off site and on-site power supplies) analysis for the Indian PHWRs.
The study does not attempt to cover the class-II and class I power supply systems since failure of emergency power supply for a period exceeding about 30 minutes would render these supplies usually ineffective.
3 Power Supply Systems at Indian PHWRs:The electrical power supply system of Indian PHWRs consists of
four classes. These are designated in descending order of reliability. The duration of interruption which may be tolerated is, however, in the ascending order. Class I is a DC power source where as all others are AC sources.
2

3.1 Class IV Power:Class IV power is supplied from two sources (i) the grid through
start up transformer and (ii) the station generator through unit transformer. In 220 MWe units the start-up transformers receive the supply from 220 KV grid (through feeders). However, in 500 MWe plants, which are under construction the start-up transformers are envisaged to receive the supply from 400 KV grid through interconnecting transformer whenever there is 220 KV supply failure in scheme 1. In scheme II of 500 MWe plants unit transformers receive the supply from 400 KV grid through generator transformers whenever station generation is affected. Thus the 500 MWe class IV system is envisaged to have an additional off-site source compared to 220 MWe plants. The line diagrams of the power supply are shown in figures I (for 220 MWe power supply ) and 2 and 3 (for 500 MWe power supply system schemes 1 and 2).
3.2 Class III Power :Class III power supply is derived from Class IV buses through
unit auxiliary transformers. In 220 MWe units there are two class-111 buses (P & Q). Whenever Class IV is unavailable, these buses are fed from dedicated standby diesel generators (DCs) of 100% capacity each. There arc three standby DCs. These DCs start automatically on failure of class IV power supply through emergency transfer scheme. Two of the DCs supply power to the buses to which they are connected. In case of failure/unavailability of any of these two DCs, the third DG can be connected automatically to any of the two class III buses. In case only one DG is available the tic breaker between the buses P and Q closes automatically (on sensing low voltage on one of the buses)
In 500 MWe units the class III power supply system is divided into 2 divisions. Each division consists of two buses. Normally the class III buses are fed from respective class IV power buses. Whenever class IV power is unavailable 50 % capacity DGs, connected one each to the four buses start automatically and supply power to the class 111 loads. Whenever a DG in a division is not available the corresponding bus gets supply from the healthy bus in the same division (through the tie breaker between the buses). The inter-division tie breaker can be closed manually whenever both the DGs in the same division are not available. The class 111 loads are connected to the buses in such a way that failure of any bus (in 220 MWe unit) or division (in 500 MWe unit) will not affect the performance of systems needed to ensure safety of the plant.The line diagrams for class III power supply arrangements are also shown in figs.l and 4.
3

3.3 Class II Power:Class II Power is derived from class III buses through ACVRs
and MGs/inverters. In 220 Mwe units, on loss of class III power MG/invciters draw power from batteries (class I) and continue to feed class II buses (S and T) till the batteries are fully discharged. Thus the availability of class II power is controlled by battery rating under station blackout conditions. Whenever ACVRs or MGs/inverters are unavailable, class If buses can be fed from the respective class III buses through tie breakers. A tie breaker is provided between the class 11 buses to ensure uninterrupted power at both the buses.
3.4 Class I power:Class I power is derived from class III buses through ACVRs
and is backed up by batteries which are on float charge.In 500 MWe units, the class II and class I arrangements in each
of the two divisions are similar to those of 220 MWe units described above. Control power needed for the various instrumentation systems is derived from class III power buses. Separate ACVRs, MGs/inverters and battery backup exist for control AC and DC power supplies.
4 Reliability Analysis:Class IV and class III power supply systems are analysed from
the reliability point of view. Class II and Class I power sources are not suited for meeting the long term needs of safety equipment and hence are not considered any further in this study.
4.1 Reliability Indices:Class IV power supply system is a support system. This is
required for the normal operation of the power plant. Any failure/interruption in class IV power results in a reactor trip and activates demands on the safety systems which include emergency power supply system as well. Thus the reliability index for class IV power supply system is the failure frequency (number of failures per year). In certain situations in NPPs the availability of class IV power is also an important factor. This is characterised by unavailability, which is another index of reliability.
Class III power supply system is a standby system which is activated whenever there is class IV power failure. For this system, the
4

applicable reliability index is unavailability which includes the probability of failure on demand of this system.
4.2 Methods of Analysis:The methods of analysis adopted in this study are outlined below.
4.2.1 Fault Tree Analysis:Fault tree is an event logic diagram relating component failures to
a particular system failure. In fault tree construction, the system failure is taken as top event, and successive subordinate or subsystems that contribute to the occurrence of the top event are identified and linked to the top event by logic gates (AND, OR etc.). The subordinate events are developed further. This process is continued till the event beyond which development is neither possible nor necessary and where the failure data is available.
Fault tree provides a pictorial display of failure chain which is useful in the reliability evaluation of the system. It also gives an insight into the weak/critical parts of the system being investigated and provides scope for design modifications for enhanced reliability. Fault trees were constructed for the class III power supply systems and were used in the unavailability evaluation of 220 and 500 MWe systems. The fault trees for these systems are shown in figures 5 and 6 (for 220 Mwe systems) and 7, 8 and 9 (for 500 Mwe systems).
4.2.2 Markov Models:A system that consists of several components, each having a
constant hazard rate and repair time, is a simple multi-state system since each component in the system can be either in operation or under repair or even in standby. This sort of model is called Markov chain model. The important feature of Markov model is that transition probability from one state to another depends only on that particular state and is completely independent of all earlier states.
While using the model for reliability analysis, a state transition diagram can be drawn incorporating the transition rates from any given state to various other states. From the transition diagram, the rate of change of state (occupancy) probabilities are given by first order differential equations. Solution of these differential equations either by using state transition matrix or by Laplace transforms gives out the state probabilities. Then the reliability of the system is found out by adding all the success state probabilities.
5

Reliability R(t) = L Success state probabilityoo
Mean Time To Failure (MTTF) = J R(t) dt0
= 1/ Failure rate of the system
5 Data:For the quantification of system failure rate and
unavailability, component failure data is needed. The data is derived from operating experience of PWRs and BWRs (WASH- 1400). Studies carried out on specific components, where sufficient operating experience is available from Indian PHWRs, indicate that the generic data can be applied directly for the estimation of system reliability indices.
In presenting the component failure data and minimal cutsets (MCS), a component coding system is employed. The details of the component code are as follows:
a) System code: The first two characters of the component code refer to the system to which the component belongs. In this report C4 and C3 are used to represent class IV and class III power supplies respectively.
b) Component description code: Maximum of three characters are employed in describing the component. The list of component description codes adopted is presented in table 1.
c) Failure mode code: The last character in the component code, in general, represents the mode of failure of the component under consideration. Common cause failures, however, are represented as CCF in the failure mode code (without any consideration to the mode of failure). The details of the failure mode code are given in table 2.
d) Component identification code: The component identification number as referred in the engineering drawings/system flow sheets is included in between the component description code and failure mode code.
For quantifying the fault trees, PSAPACK, an IAEA software package was employed. For the system failure rate evaluations, a computer program MARKOV was developed. This is based on the Markov-Model described earlier in section 4.2.2.
6
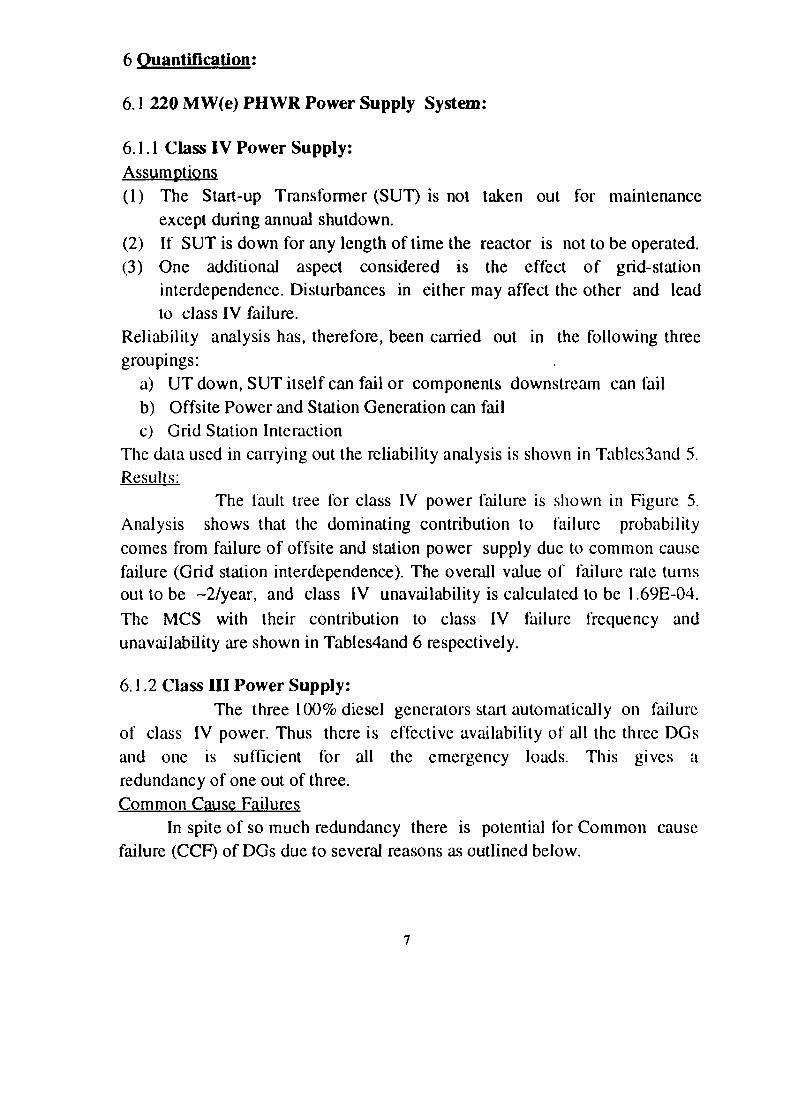
6 Quantification:
6.1 220 MW(e) PHWR Power Supply System:
6.1.1 Class IV Power Supply:Assumptions(1) The Start-up Transformer (SUT) is not taken out for maintenance
except during annual shutdown.(2) If SUT is down for any length of time the reactor is not to be operated.(3) One additional aspect considered is the effect of grid-station
interdependence. Disturbances in either may affect the other and lead to class IV failure.
Reliability analysis has, therefore, been carried out in the following three groupings:
a) UT down, SUT itself can fail or components downstream can failb) Offsite Power and Station Generation can failc) Grid Station Interaction
The data used in carrying out the reliability analysis is shown in Tables3and 5. Results:
The fault tree for class IV power failure is shown in Figure 5. Analysis shows that the dominating contribution to failure probability comes from failure of offsite and station power supply due to common cause failure (Grid station interdependence). The overall value of failure rate turns out to be -2/year, and class IV unavailability is calculated to be 1.69E-04. The MCS with their contribution to class IV failure frequency and unavailability are shown in Tables4and 6 respectively.
6.1.2 Class III Power Supply:The three 100% diesel generators start automatically on failure
of class IV power. Thus there is effective availability of all the three DGs and one is sufficient for all the emergency loads. This gives a redundancy of one out of three.Common Cause Failures
In spite of so much redundancy there is potential for Common cause failure (CCF) of DGs due to several reasons as outlined below.
7
i. Design Features: Location of DCs, control panels and power supply bus, starting air supply, lubricating oil, water cooling system etc.
ii. Human Error: Single crew for test and maintenance (T&M) for all DCs, inadequate T&M procedures and lack of supervision of T&M activities.
iii. Operating Environment: High temperature and high humidity, vibration in DG room and so on.
Assumption:As per Technical Specifications, if any one of the three diesel engine
generators is not operable, the remaining two diesel generators shall be started and load tested daily for one hour. However, the effect of this is not considered in the analysis.
Results:The fault tree for class III power failure is shown in Figure 6. The
failure data used in the analysis is shown in Table 7 and the MCS with their contributions are shown in Table 8. The main contributor to failure probability is common cause failure (3% of demand failure probability of a DG i.e. .03 x .03 = .0009). The overall value of unavailability turns out to be ~1.0E-3
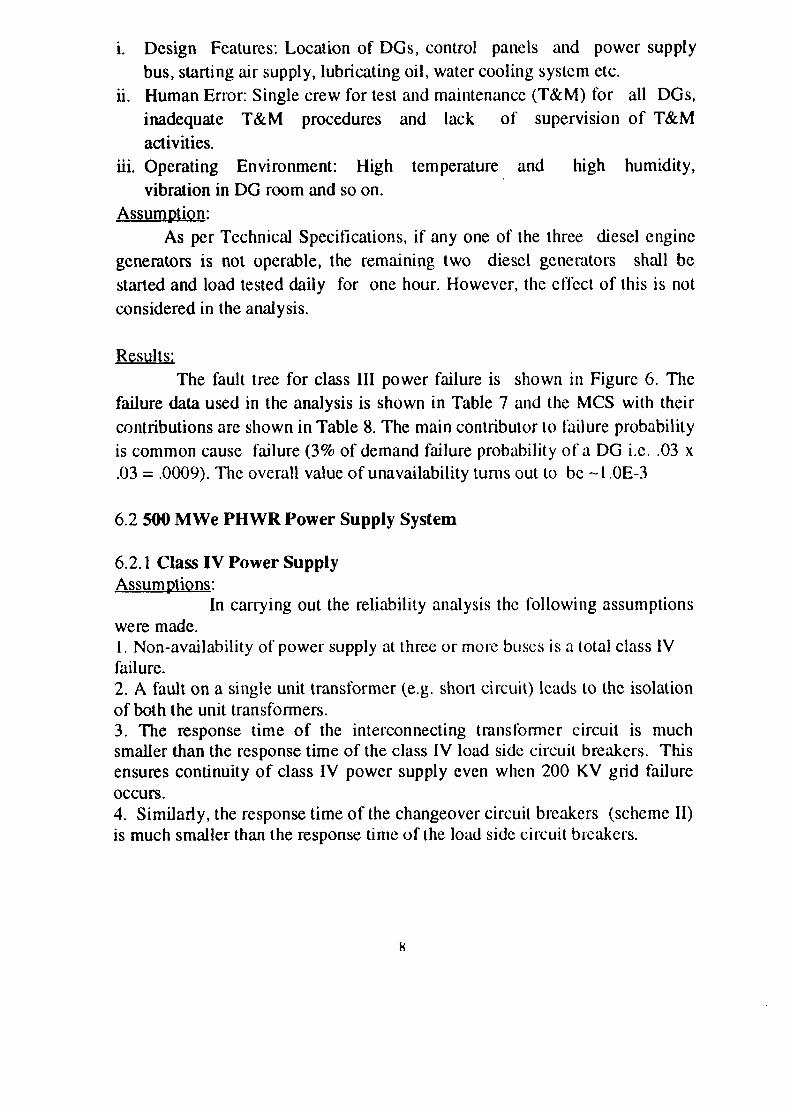
6.2 500 MWe PHWR Power Supply System
6.2.1 Class IV Power Supply Assumptions:
In carrying out the reliability analysis the following assumptionswere made.1. Non-availability of power supply at three or more buses is a total class IV failure.2. A fault on a single unit transformer (e.g. short circuit) leads to the isolation of both the unit transformers.3. The response time of the interconnecting transformer circuit is much smaller than the response time of the class IV load side circuit breakers. This ensures continuity of class IV power supply even when 200 KV grid failure occurs.4. Similarly, the response time of the changeover circuit breakers (scheme II) is much smaller than the response time of the load side circuit breakers.
K

5. Loss of power supply to both the buses in a division constitutes a division supply failure.
With the above assumption a reliability analysis was carried out for both the schemes I and II. The reliability criterion considered in the analysis was total Class IV power failure. In evaluating the cutsets and for both the schemes I and II the FTAP option of the PSAPACK (an IAEA program for PSA analysis) was used. For calculating the frequency of the total class IV failure, the program MARKOV based on the Markov model of the system was used. The data required for carrying out the analysis is taken from the MAPS safety report and is presented in the table 3. Since there is one more source of power (400 KV supply) available to the station (which can be switched on before the load side circuit breakers respond) and the station can operate on the house load for sufficiently long time, the grid station interaction factor (fraction of the occasions one failure leads to the other) is likely to be low. However, a sensitivity analysis of the Class IV supply failure frequency to the grid station interaction factor was also carried out. It is found from this study that the effect of the grid station interaction is not significant in both the schemes I and II.
Results:The fault trees drawn for the above cases considered arc shown in
figures 7 and 8. The evaluation of the fault trees was carried out using the FTAP program of the PSAPACK. The unavailabilities for both the schemes for total Class IV failure are presented in the table 9. Among the two schemes, scheme II is found to be better than scheme I. The total class IV failure frequencies also indicate the same trend. In both the cases, the system failure frequency has a value less than 0.1 per year. The frequencies as pointed out earlier, are less sensitive to the assumed value of the grid station interaction factor. The values of the system failure frequency for the assumed values of the grid station interaction factor are shown in table 10.
6.2.2 Class III Power Supply:Assumptions:Reliability criteria considered for Class 111 power is loss of supply to three or more 6.6 KV buses. In carrying out the reliability analysis of Class III power supply, the following assumptions were made.1. Minimum two DCs are required for the availability of Class 111 power supply.
9

2. Common cause failure of the two DCs in a division is significant as all the support systems for the DCs in one division are entirely independent of those for the DCs in the other division.3. Manual operation of the interdivision tie breaker is not considered. By keeping it manual, the susceptibility to CCF of both the divisions is eliminated.
Results:With the above assumptions, a fault tree for the class 111 6.6 KV
supply failure is constructed and is shown in figure 9. As in the case of Class IV, FTAP version of the PSAPACK is used for the unavailability evaluation. The unavailability of the system is shown in table 9. To study the effect of control supplies to DCs, four types of control supply arrangements to the DCs were considered. These arei. Each DG has its own control supplyii. The DGs in each division have the same common control supplyiii. The DGs in division 1 have common control supply andiv. The DGs in division 2 have common control supply.
It can be seen (Table 9) that the above different control power supply arrangements do not have much effect on the predicted class III system unavailability.
7 Blackout Analysis:
Station blackout (SB) is identified as the total loss of AC power at the station. This would result from the loss of both class IV and class III power supplies. The likelihood that a SB (for a time period ‘t’) will not progress to core damage situation will depend upon the reliability and capability of decay heat removal systems that are not dependent upon the normal emergency AC power sources. Thus, the frequency of SB is calculated based on the following equation.
Frequency of SB = Frequency of class IV power failure*Unavailability of class III power *Probability of nonrecovery of class IV power in time ‘f * Probability of non recovery of class III power in time ‘t’
Here ‘f is also referred as the coping time.
In a PHWR, the safety system for decay heat removal during station blackout is fire fighting water system (FFS) for emergency feed to the
10

steam generators (SGs). This system is expected to maintain the flow through the SGs through out the coping time/duration of SB. Thus the coping time depends upon the capability of FFS and the secondary steam relief system operation during SB.
7.1 Frequency evaluation of SB:
Based on the reliability analysis of class IV and class HI power supply systems, the following data has been used in the calculations.(i) Class IV power failure frequency = 1 per year (based on the performance of Western grid in India)(ii) Class III power unavailability = 1 .Oe^f based on the assumption that a single DG would be adequate for meeting the blackout requirements. For 235 MWe units, however, a value of 1 .Oe-3 has been used.(iii) In order to calculate the probability of revival of class IV power in time ‘t’, data as shown in table 11 has been used. This is based on duration of class IV power outages observed at Tarapur Atomic Power Station site during the period 1969-94. Based on the analysis of the data, it is seen that the duration follows a lognormal distribution with a median value of 35 minutes and a mean of 66 minutes.(iv) DG revival times of 8 hours, 12 hours and 16 hours have been considered for sensitivity purpose.
Based on such data, a complementary probability of SB exceeding a given time 'f has been calculated and the results are shown in the figure 10 , For the 220 MWe unit, the evaluated class IV failure frequency and the class III unavailability are found to be high (around 2.0 per year and 1.0e-3) compared to the above values. The station blackout frequency for this system is shown in figure 11. Similar evaluations for 500 MWe unit are shown in figure 12. The class IV failure frequency evaluated for this system is around 0.1 per year and the class III unavailability is around 1.0e-4.
8,0 Acknowledgments:
The authors arc thankful to Dr. V. Venkat Raj, Associate Director, Reactor Design & Development Group (RDDG), for his keen interest in this work. Thanks are also due to Shri H.S Kushwaha, Head, Reactor Safety Division (RSD), and Shri S. Krishnamony, Head, Health Physics Division (HPD) for their constant encouragement in carrying out this work. The authors wish to thank Dr. V.K. Jain (RSD) for the valuable suggestions

provided during the period of this work. The help rendered by the staff of the Drawing Office of RDDG and shri Kapil Deo Singh of HPD is gratefully acknowledged.
12
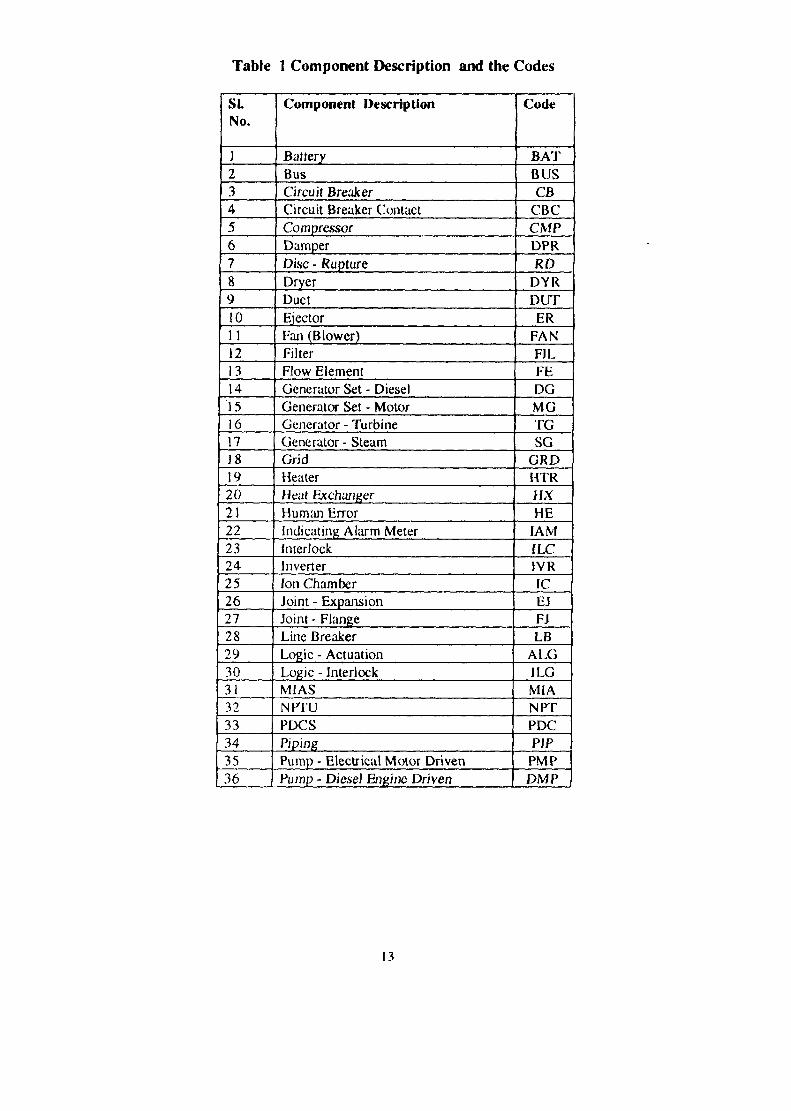
Table 1 Component Description and the Codes
SLNo.
Component Description Code
1 Battery BAT2 Bus BUS3 Circuit Breaker CB4 Circuit Breaker Contact CBC5 Compressor CMP6 Damper DPR7 Disc - Rupture RD8 Dryer DYR9 Duct OUT10 Ejector ER11 Fan (Blower) FAN12 Filter F1L13 Flow Element FE14 Generator Set - Diesel DG15 Generator Set - Motor MG16 Generator - Turbine TG17 Generator - Steam SG18 Grid GRD19 Heater HTR20 Heat Exchanger HX21 Human Error HE22 Indicating Alarm Meter IAM23 Interlock ILC24 Inverter 1VR25 ion Chamber 1C26 Joint - Expansion EJ27 Joint - Flange FJ28 Line Breaker LB29 Logic - Actuation A LG30 Logic - interlock JLG31 MIAS MIA32 NPI’U NPr33 PDCS PDC34 Piping PIP35 Pump - Electrical Motor Driven PMP36 Pump - Diesel Engine Driven DMP
13

SLNo. Component Description Code
37 Relay Contact RC38 Relay - Time Delay TDR39 RTD RTD40 Strainer STR41 Switch - Hand HS42 Switch - Level LS43 Switch - Pressure PS44 Tank TK45 Transformer TR46 Transformer - Start Up SUT47 Transformer - Unit UT48 Transmitter - Activity AT49 Transmitter - Differential Pressure DPT50 Transmitter - Flow FT51 Transmitter - Level LT52 Transmitter - Pressure PT53 Tube TUB54 Valve - Air Operated AOV55 Valve - Bellow Seal (Globe) GV56 Valve - Check CUV57 Valve - Control CV58 Valve - Diaphragm DV59 Valve - Instrumental Relief IRV60 Valve - Manual V61 Valve - Motor Operated MOV62 Valve - Pressure Reducing PRV63 Valve - Relief Valve RV64 Valve - Spring operated safety relief SRV
14

Table 2 Failure Mode Code
SI. No. , Failure Mode Code
1 All modes A2 Degraded B3 Failure to change position C4 Failure to remain in position D5 Fail to close E6 Fail to open 07 Fail to function F8 Short to ground G9 Short circuit H10 Open Circuit 111 Plug/Rupture J12 Plug Q13 Spurious function K14 Fail to run R15 Fail to start S16 Other critical faults X17 Leakage/External leak Y18 Rupture T19 Internal leak L20 Human error Z21 Maintenance M22 Fail to energise (relay) P23 Fail to deenergeise N24 Fail to remain closed U25 Fail to close NC * (relay
contact)I
26 Fail to open NC (relay contact) 227 Fail to close NO** (relay
contact)3
28 Fail to open NO (relay contact) 4
* Normally Closed
** Normally Opened
15

TABLE 3 Component Failure Data (Class IV Failure Frequency Calculation)
SI No. Component Name Failure Rate/ Error Repair DeviationStd. Probability Factor Time (Mrs)
1 C4GS1A 1.5100e+00/yr 3.0000 0.000000 0.00002 C4UTRM 1.4000e-01 3.0000 0.000000 0.00003 C4GRIDF 3.0000e+00/yr 3.0000 0.330000 1.00004 C4SUTRF 2.0000e-02/yr 3.0000 24.000000 2.00005 C4RTRF 6.0000e+00/yr 3.0000 36.000000 3.00006 ' C4TGF 4.0000e+00/yr J .5000 36.000000 3.0000
...» C4UTRF 2.0000e-02/yr 3.0000 24.000000 2.0000.8 C4CB452D 1.0000e-02/yr 3.0000 4.000000 1.00009 C4BUSABA 2.0000e-01/yr 10.0000 24.000000 2.0000JO C4CB451D J.0000e-02/yr 3.0000 4.000000 1.000011 C4BUSGHA 2.0000e-01/yr 10.0000 24.000000 2.0000
12 C4CB484D J.0000e-02/yr 3.0000 4.000000 1.000013 C4CB486D 1.0000e-02/yr 3.0000 4.000000 1.0000
TABLE 4 Minimal Cut Sets and Its % Contribution to the System Failure
SI.No.
No.Como.
Component Names FailureProb.
% Contribution
1 1 C4GS1A 1.510E+00 73.34402 .2 C4UTRM C4GR/DF 4.200E-0I 20.40033 2 C4GR1DF C4RTRF 7.465E-02 3.62594 2 C4GRIDF C4TGF 4.977E-02 2.41735 2 C4UTRM C4SUTRF 2.800E-03 0.13606 2 C4SUTRF C4RTRF 8.2I9E-04 0.03997 2 C4SUTRF C4TGF 5.479E-04 0.02668 2 C4GR1DF C4UTRF I.666E-04 0.00819 3 C4UTRM C4BUSABA C4BUSGHA 3.068E-05 0.001510 2 C4SUTRF C4UTRF 2.I92E-06 0.000111 3 C4UTRM C4CB452D C4BUSGHA 8.950E-07 0.000012 3 C4UTRM C4BI/SABA C4CB484D 8.950E-07 0.000013 3 C4UTRM C4BUSABA C4CB486D 8.950E-07 0.000014 3 C4UTRM C4CB451D C4BUSGHA 8.950E-07 0.0000
Class IV Failure Frequency (Point value) 2,05879/Year
16
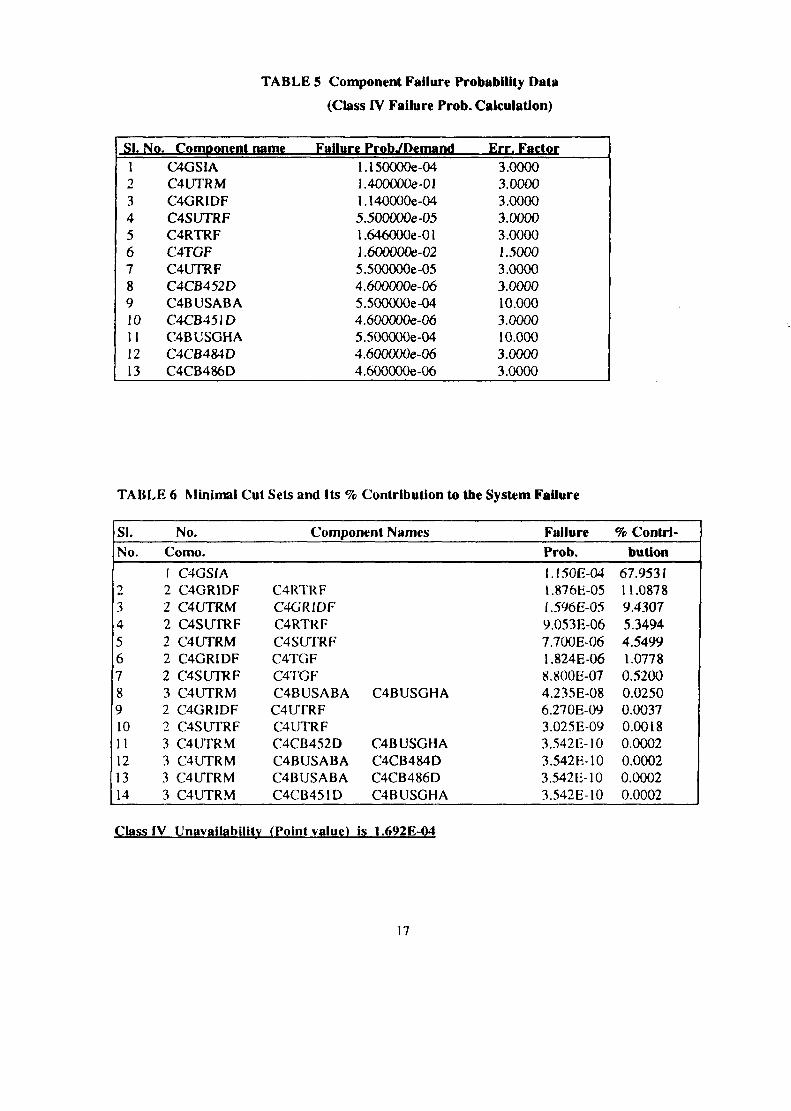
TABLE 5 Component Failure Probability Data
(Class IV Failure Prob. Calculation)
SI. No. Component name Failure ProbJDemand Err. Factor1 C4GSLA 1.150000e-04 3.00002 C4UTRM 1.400000e-01 3.00003 C4GRIDF 1.140000e-04 3.00004 C4SUTRF 5.500000e-05 3.00005 C4RTRF 1.646000c-01 3.00006 C4TGF 1.600000e-02 1.50007 C4UTRF 5.500000e-05 3.00008 C4CB452D 4.600000e-06 3.00009 C4BUSABA 5.500000e-04 10.00010 C4CB451D 4.600000e-06 3.000011 C4BUSGHA 5.500000e-04 10.00012 C4CB484D 4.600000e-06 3.000013 C4CB486D 4.600000e-06 3.0000
TABLE 6 Minimal Cut Sets and Its % Contribution to the System Failure
SI. No. Component Names Failure % Contri-No. Como. Prob. button
1 C4GSIA I.I50E-04 67.95312 2 C4GR1DF C4RTRF 1.876E-05 11.08783 2 C4UTRM C4GR1DF I.596E-05 9.43074 2 C4SUTRF C4RTRF 9.053E-06 5.34945 2 C4UTRM C4SUTRF 7.700E-06 4.54996 2 C4GR1DF C4TGF 1.824E-06 1.07787 2 C4SUTRF C4TGF 8.800E-07 0.52008 3 C4UTRM C4BUSABA C4BUSGHA 4.235E-08 0.02509 2 C4GRIDF C4UTRF 6.270E-09 0.003710 2 C4SUTRF C4UTRF 3.025E-09 0.001811 3 C4UTRM C4CB452D C4BUSGHA 3.542E-10 0.000212 3 C4UTRM C4BUSABA C4CB484D 3.542E-10 0.000213 3 C4UTRM C4BUSABA C4CB486D 3.542 E-10 0.000214 3 C4UTRM C4CB451D C4BUSGHA 3.542E-10 0.0002
Class IV Unavailability (Point value) is 1.692E-04
17

TABLE 7 Component Failure Probability Data
SI. No. Component name Failure ProbJDemand Err. Factor
1 C3DGCCF1 9.000000e-04 3.00002 C3DG3M 4.000000e-02 3.00003 C3DG1M 4.000000e-02 3.00004 . C3DG2M 4.0000000-02 3.00005 C3DG1S 3.000000e-02 3.00006 C3CB351E 1.000000e-03 3.00007 C3CB353E 1.000000e-03 3.00008 C3BUSDA 5.500000e-03 10.00009 C3DG2S 3.000000e-02 3.000010 C3CB378E 1.000000e-03 3.000011 C3CB387E 1.0000006-03 3.000012 C3BUSEA 5.500000e-03 10.000013 C3DG3S 3.0000006-02 3.000014 C3CB381E 1.000000e-03 3.000015 C3CB384E 1.000000e-03 3.000016 C3BCSFA 5.500000e-03 10.000017 C3BUSE1F 1.1000006-03 10.000018 C3DG2F 3.4200006-03 3.000019 C3BUSE2F 1.1000006-03 10.000020 C3DG3F 3.4200006-03 3.000021 C3BUSE3F 1.1000006-03 10.000022 C3DG1F 3.420000e-03 3.0000
18

TABLE 8 Minimal Cut Sets and Its % Contribution to the System Failure
SI. No. Component Names Failure % Contri-No. Como. Prob. but ion1 1 C3DGCCF1 9.000E-04 92.49742 3 C3DGIS C3DG2S C3DG3S 2.700E-05 2.77493 3 C3DG1S C3BUSEA C3DG3S 4.950E-06 0.50874 3 C3BUSDA C3DG2S C3DG3S 4.950E-06 0.50875 3 C3DG1S C3DG2S C3BUSFA 4.950E-06 0.50876 3 C3DG2M C3DG3S 03 DG IF 4.104E-06 0.42187 3 C3DG3M C3DG1S C3DG2F 4.104E-06 0.42188 3 C3DGJM C3DG2S C3DG3F 4.104E-06 0.42189 3 C3DG2M C3DG3S C3BUSE3 1.320E-06 0.135710 3 C3DG3M C3DG1S C3BUSE1F 1.320E-06 0.135711 3 C3DG1M C3DG2S C3BUSE2F 1.320E-06 0.135712 3 C3BUSDA C3BUSEA C3DG3S 9.075E-07 0.093313 3 C3DG1S C3BUSEA C3BUSFA 9.075E-07 0.093314 3 C3BUSDA C3DG2S C3BUSFA 9.075E-07 0.093315 3 C3DG1S C3CB378E C3DG3S 9.000E-07 0.092516 3 C3DG1S C3CB387E C3DG3S 9.000E-07 0.092517 3 C3CB351E C3DG2S C3DG3S 9.000E-07 0.092518 3 C3CB353E C3DG2S C3DG3S 9.000E-07 0.092519 3 C3DG1S C3DG2S C3CB381E 9.000E-07 0.092520 3 C3DG1S C3DG2S C3CB384E 9.000E-07 0.092521 3 C3DG2M C3BUSFA C3DG1F 7.524E-07 0.077322 3 C3DG3M C3BUSDA C3DG2F 7.524E-07 0.077323 3 C3DG1M C3BUSEA C3DG3F 7.524E-07 0.077324 3 C3DG2M C3BUSFA C3BUSE3F 2.420E-07 0.024925 3 C3DG3M C3BUSDA C3BUSE1F 2.420E-07 0.024926 3 C3DG1M C3BUSEA C3BUSE2F 2.420E-07 0.024927 3 C3BUSDA C3BUSEA C3BUSFA 1.664E-07 0.017128 3 C3CB351E C3BUSEA C3DG3S 1.650E-07 0.017029 3 C3CB353E C3BUSEA C3DG3S 1.650E-07 0.017030 3 C3BUSDA C3CB378E C3DG3S 1.650E-07 0.017031 3 C3BUSDA C3CB387E C3DG3S 1.6501007 0.017032 3 C3DG1S C3BUSEA C3CB381E 1.6501007 0.017033 3 C3BUSDA C3DG2S C3CB381E 1.6501007 0.017034 3 C3DG1S C3BUSEA C3CB384E l .650E-07 0.017035 3 C3BUSDA C3DG2S C3CB384E 1.650E-07 0.017036 3 C3DG1S C3CB378E C3BUSFA 1.6501007 0.017037 3 C3DG1S C3CB387E C3BUSFA 1.650E-07 0.017038 3 C3CB351E C3DG2S C3BUSFA 1.650E-07 0.017039 3 C3CB353E C3DG2S C3BUSFA 1.650E-07 0.017040 3 C3DG2M C3CB38IE C3DG1F 1.368E-07 0.0141
Class III System Failure Probability (Point value) 9.7300044*-04

Table 9 System Unavailabilities
S.No System Unavailability (Per Demand)
1 Total Class iV(Scheme /) 8.69*10’
2 Total Class IV(Scheme 11) 5.08*10'
3 Class III
3a DG control supplies different 8.13*10'
3b Control supplies same to each division 9.87*10'
3c DG control supplies same division 1 9.01*10'
3d DG control supplies same division 2 9.01*10'
Table 10 System Failure Frequencies
S.No. Grid Station Failure Frequency (per year)InteractionFactor Scheme I Scheme II
1 0.01 0.086 0.0232 0.10 0.085 0.0233 0.20 0.084 0.0234 0.30 0.0831 0.02355 0.40 0.0822 0.02366 0.5 0.0814 0.0237
20

CRID
T»
UMIT2
6.6 k V
CLASS
IV
6.6k
III
FXG.l-KHlGfl RPR ■ ELECTRICAL POWER SUPPLY

CB1
8400KV
SWICHYARD220KV
SWICHYARD
CGI 53 cb2I>38
CB3
TR
6TR V 40
■'-OJ.'.T
TR42
TR43
Dul
BOO
CB10BUS BOBUS BA BUS BCBUS BB
CS31 CB30
BUS B5 BUS BSBUS B2 BUS B4BUS B3BUS B1
CBS
Fig. 2: Line Diagram for 500 MW(e) PHWR Class IVPower Supply System - Scheme I

cbi
b400KV
5VICHYRRD220KV
SWICHYARD
91 E<] cs2C><I“■
8tr
CB3
J.f.T
. «^IX
TR43
G QTR 10
TR 42
MOf
L--k__________
EKNiL
BOD
I ?
i I 1___1CBS
BUS BA 1 : , BUS !bb1 i
^ V V CM r COtXH
Klcei
z:iL
Cl
<
BUS scr' r , BUS BDY
(D *T-V
-7 . rx
ulxc:
ou cove:l—■
WpagOKigBUS B1 BUS B2 BUS B3 BUS B4 BUS B5
Fig.3: Line Diagram for 500 MW(e) PHWR Class IVPower Supply System - Scheme II
23 CBS
ig)CB30

X)
SUPPLY FROM CLASS IV 6.6 Kv BUSBA
ABB
CB41
CAB 4
CA31
■AAA*I? ©
6.6 KVLINE 83-1-
□G1
CABS CRB6
CB39
BUS 1
CB32 CB33
AAA*BC
A60
CB43 N-^0G2
N83-2
m 0
CB450CAB7 CAB8
BUS 2
CB310CB311
CB34 CB35 lx|83--= BUS 3
mCB312 CB313 CB314 V7 V7CB31S^ IZW
CAB 15
r-AAA*^OG3 CB47^X
CRB9 CAB 10
—i CB37*-CB36 "><
7 J
B3-4 BUS 4
i—AAA*
J
CAB 11
CB316 CB3I7
case
TR3-1 TR3-2 TR3-3 TR3-4
CB319 M
415 V LINE B3-S
BUS 1
CB321
CB320
B3-6
CB322 CB323
CAB 16
’tR3-5
CB25
CBS 1B
CAB 17
TR3-6
0
BUS 2B3-7
BUS 3
CB324
B3-B-
CB32B
BUS 4
Fig. 4: Line Diagram for 500 MW(e) PHWR Class inPower Supply System

CLASS IV
2.05/yr
0.124/y,UT DOWN
SUT FAIL GENERATION0.423/yi
STATION POWERDFFSITE POWERUTRM
GRIDF SUTRF
GRIDFSUTRF
RTRF
:B451D CB452D BUSABA CB484D C8486D BUSGHA
Fig.5: Fault Tree for 220 MW(e) PHWR Class IVPower Supply Failure

to<n
POWER
SUPPLY FAILURE
CLASS
9.7E-04
INDEPENDANT FAILURE DGCCFMAINTENANCECONTRIBUTION
4.5E-05 2.4E-D59.0E-04
DGCCF1
C5378E CB3S7E BUSEADG2S
B551E CB353E BUSDA
DG1M
DG2FBU5E1ACE381E CB384EDG3S BUS FA
Fig.6: Fault Tree for 220 MW(e) PHWR Class HIPower Supply Failure

OPERATION
aGRID 200
60SUT SUT1 RGB
POWER
6
200 KV
400KV
CLASS IV POWER FAILURE (SCH.l)
——1- - - - - -TRANSFORMER
BLOCK
1. . . . '=MAINTENANCE
=□
BUSESA
66r _6,6 3'4
GENERATOR
SUT
a
AA6666UTl UT2 reaC- TG
TOR
GENERATOR GRID
UTS FAILS 1 v )
C41 C42 C43 C44
GEN,FAILS
__1 GEN /\ GRID /X C A DOWN / X\DaVN / YCZT
UTl1
UT2
O A66666 666606 A66
ACT. ICT1CT1CT 400KV SUT SUT SUT SUT SUT SUT c- .....LOGIC CB1 CBS LINE DUCT! CB1 CB11 CBS CBS1 DUCTS CB 0UCT CUCT
FIG.7: FAULT TREE FOR 500 MWe PHWRCLASS IV POWER FAILURE (Scheme 1)

TRANSFORMERBLOCK
T
SUTBLOCK
UTBLOCK
SUT SUT SUT SUT SUT SUT W WWW w1 w W W W W W WWW DUCT1 CB1 CB11 DUCT2 CB2 CB21 Jr. UT1 UT1 UT1 UT2 UT2 UT2 UT1 UT1 UT1 UT2 UT2UT2 Jr.
BREAKER CB DUCT CB DUCT CB DUCT CB DUCT BREAKEF

toto
OPERATION
Z3GRID 200
6 66 GRID SUT SUT
PCB _ 5
CLASS IV POWER FAILURE (SCH.2)
TRANSFORMERBLOCK
BUSES MAINTENANCE
GENERATOR 400KV
A256606C41C42 C43 C44
IGENERATOR GRID
----- T------------------ 1 i ____ i___ —i
6 0 GEN.FAILS
to 67)
UT2
So g£m LJQ i,GRID
DOWN
_ GEM KV DOWN FAILS
SUT SUT SUT SUT GEN. GENE- REAC- LINE 400KV UT1 400KV DUCT! CB1 DUCT2 CB2 CB RATOR TOR CB LINE FAILS
3L 66UT2 GEN.
FAILS
I0KV KV DOWN FAILS
FIG.8: FAULT TREE FOR 500 MWe PHWRCLASS IV POWER FAILURE (Scheme 2)

TRANSFORMERBLOCK
/R\—CZ
Q Z3
(ao
SUTlSUT1
UT1 UT1 UT2 UT2
UT1 UT1 UT2 UT2 UT2 UT2 UT2 UT1 UT1 UT1 SUT SUT SUT SUT CB TRCB CB DUCT2 TR.CB DUCT1 DUCT1 CB1 CB2 DUC1
SUT SUT SUT SUT DUCT1 CB CB DUCT2
TR1 TR2

CCFDIVISION I
DG CB C32 CONTROL SUPPLY
CCFDIVISION II
DIVISION IIDIVISION I
DG CCF MAINTENANCE
CLASS III POWER FAILURE
CONTROL DG CB BUS DG DG DG CB BUS CONTROL SUPPLY MAIN- MAIN- SUPPLY
DG CB BUS CONTROL SUPPLY
TENANCE TENANCE
FIG, 9.-FAULT TREE FDR 500 MVe PHVR CLASS III ROVER FAILURE

Bla
ckou
t Fre
quen
cy p
er y
ear
IE-04
IE-05
IE-06
IE-07
IE-080 100 200 300 400 500 600 700 800
Time (minutes)^ DG Down Time^ 8 HRS —12 HRS 16HRSj
Fig. 10: Blackout Analysis
32

Bla
ckou
t Fre
quen
cy pe
r yea
rIE-02
IE 03
IE-04
IE-05
IE-060 100 200 300 400 500 600
Time (minutes)( DG Down Time "X^ 8 HRS —12 HRS 16HRSj
Fig. 11: Blackout Analysis (220 MWe Unit)
33

Bla
ckou
t Fre
quen
cy p
er y
ear
IE-05
IE-06
IE-07
IE-08
IE-090 100 200 300 400 500 600 700 800
Time (minutes)^ DG Down Time x--8 HRS —12 HRS 16 HRSy
Fig. 12: Blackout Analysis (500 MWe Unit)
34

Published by : Dr. M. R. Balakrishnan, Head Library & Information Services Division Bhabha Atomic Research Centre, Mumbai - 400 085, INDIA.