
Releases of unignited liquid hydrogen - Health and … by the Health and Safety Laboratory for the...
37
Prepared by the Health and Safety Laboratory for the Health and Safety Executive 2014 Health and Safety Executive Releases of unignited liquid hydrogen RR986 Research Report
Transcript of Releases of unignited liquid hydrogen - Health and … by the Health and Safety Laboratory for the...

Prepared by the Health and Safety Laboratory for the Health and Safety Executive 2014
Health and Safety Executive
Releases of unignited liquid hydrogen
RR986Research Report
grahamschofield
Typewritten Text

M Royle and D Willoughby Health and Safety LaboratoryHarpur HillBuxtonDerbyshire SK17 9JN
In the long term the key to the development of a hydrogen economy is a full infrastructure to support it, which includes means for the delivery and storage of hydrogen at the point of use, eg at hydrogen refuelling stations for vehicles. As an interim measure to allow the development of refuelling stations and rapid implementation of hydrogen distribution to them, liquid hydrogen is considered the most efficient and cost effective means for transport and storage.
The Health and Safety Executive (HSE) have commissioned the Health and Safety Laboratory (HSL) to identify and address issues relating to bulk liquid hydrogen transport and storage and update/develop guidance for such facilities. The second phase of the project involved experiments on unignited and ignited releases of liquid hydrogen (HSE RR987) and computational modelling of the unignited releases (HSE RR985). This position paper details the experiments performed to investigate spills of unignited liquid hydrogen at a rate of 60 litres per minute. Concentration of hydrogen in air, thermal gradient in the concrete substrate, liquid pool formation and temperatures within the pool were measured and assessed. The results of the experimentation will inform the wider hydrogen community and contribute to the development of more robust modelling tools. The results will also help to update and develop guidance for codes and standards.
This report and the work it describes were funded by the Health and Safety Executive. Its contents, including any opinions and/or conclusions expressed, are those of the authors alone and do not necessarily reflect HSE policy.
Releases of unignited liquid hydrogen
HSE Books
Health and Safety Executive

© Crown copyright 2014First published 2014
You may reuse this information (not including logos) free of charge in any format or medium, under the terms of the Open Government Licence. To view the licence visit www.nationalarchives.gov.uk/doc/open-government-licence/, write to the Information Policy Team, The National Archives, Kew, London TW9 4DU, or email [email protected].
Some images and illustrations may not be owned by the Crown so cannot be reproduced without permission of the copyright owner. Enquiries should be sent to [email protected].
ii

iii
CONTENTS
EXECUTIVE SUMMARY .............................................................................................. V
1. INTRODUCTION ................................................................................................... 1
1.1 Background ...................................................................................................... 1
1.2 Aims .................................................................................................................. 1
1.3 Report ............................................................................................................... 1
2. TEST FACILITY .................................................................................................... 2
2.1 Test facility ....................................................................................................... 2
2.2 LH2 tanker ........................................................................................................ 3
2.3 Release rig ........................................................................................................ 4
2.4 Test protocol .................................................................................................... 6
3. INSTRUMENTATION AND DATA PROCESSING ................................................ 7
3.1 Visual records .................................................................................................. 7
3.2 Meteorological monitoring .............................................................................. 7
3.3 Data logging ..................................................................................................... 7
3.4 Hydrogen detection .......................................................................................... 8
3.5 Ground level pool thermocouples .................................................................. 8
3.6 Thermocouples embedded in concrete .......................................................... 9
4. TEST SETUP ...................................................................................................... 10
4.1 Concentration sensor locations for tests 5, 6 and 7 .................................... 10
4.2 Ground level pool thermocouples ................................................................ 11
4.3 Embedded thermocouples ............................................................................ 11
4.4 Concentration sensor locations for test 10 .................................................. 12
5. TEST PROGRAMME AND PARAMETERS ........................................................ 13
5.1 Test parameters ............................................................................................. 14
5.2 Weather conditions ........................................................................................ 14

iv
6. RESULTS ............................................................................................................ 15
6.1 Test 5 – horizontal ground release ............................................................... 15
6.2 Test 6 – vertically downward release 100 mm above the ground ............... 18
6.3 Test 7 horizontal release 860 mm above the ground .................................. 20
6.4 Test 10 vertically downward release 100 mm above the ground ................ 21
7. DISCUSSION ...................................................................................................... 23
7.1 Release behaviour - general observations ................................................... 23
7.2 Hydrogen cloud dispersion ........................................................................... 23
7.3 Pool formation ................................................................................................ 23
7.4 Pool extent ...................................................................................................... 24
7.5 ‘Solid deposit’ ................................................................................................. 24
7.6 Spills into free air ........................................................................................... 25
7.7 Spill behaviour ............................................................................................... 25
7.8 Hydrogen concentrations ............................................................................. 25
8. MAIN FINDINGS ................................................................................................. 26
9. REFERENCES .................................................................................................... 27

v
EXECUTIVE SUMMARY
If the hydrogen economy is to progress, more hydrogen fuelling stations are required. In the
short term, in the absence of a hydrogen distribution network, these fuelling stations will have to
be supplied by liquid hydrogen road tanker. Such a development will increase the number of
tanker offloading operations significantly and these may need to be performed in close
proximity to the general public.
The aim of this work is to identify and address hazards relating to the storage and transport of
bulk liquid hydrogen (LH2) that are associated with hydrogen refuelling stations located in
urban environments. Experimental results will inform the wider hydrogen community and
contribute to the development of more robust modelling tools. The results will also help to
update and develop guidance for codes and standards.
The first phase of the project was to develop an experimental and modelling strategy for the
issues associated with liquid hydrogen spills; this was documented in HSL report XS/10/06[1]
.
The second phase of the project was to produce a position paper on the hazards of liquid
hydrogen which was published in 2009, XS/09/72[2]
. This was also published as a HSE research
report RR769 in 2010[3]
.
This report details experiments performed to investigate spills of liquid hydrogen at a rate of 60
litres per minute. Measurements were made on unignited releases which included concentration
of hydrogen in air, thermal gradient in the concrete substrate, liquid pool formation and
temperatures within the pool. Computational modelling of the unignited releases has been
undertaken at HSL and reported in MSU/12/01 [4]
. Ignited releases of hydrogen have also been
performed as part of this project; the results and findings from this work are reported in
XS/11/77[5]
.


1
1. INTRODUCTION
1.1 BACKGROUND
The 'Hydrogen Economy' is gathering pace internationally and now in the UK. Over the last
year a number of vehicle related demonstration projects have appeared linked into the 2012
Olympics. While in the long term the key to the development of a hydrogen economy is a full
infra structure to support it, a short bridging option for Hydrogen Refuelling Stations
particularly, is the bulk storage and transport of cryogenic hydrogen, referred to in industry as
LH2 (liquid hydrogen). LH2 storage and transport are currently the most efficient and cost
effective means of rapidly implementing hydrogen distribution. This will result in a moderately
large inventory (e.g. 3 tonnes) local storage of LH2. Although cryogenic liquid storage has been
used safely for many years in secure and regulated industrial sites, its use in relatively
congested, highly populated urban areas presents a new set of problems in relation to security,
safety and associated planning. Although there is previous work by NASA[6]
on LH2 relating to
its spill behaviour, it is old and was performed in low humidity desert environment. In addition,
it does not cover issues around leakage and combustion behaviour thoroughly as these problems
were managed by the controls that can be put in place in an isolated specialist facility on the
large remote sites used.
Research is needed to identify and address issues relating to bulk LH2 storage facilities
associated with hydrogen refuelling stations located in urban environments. The existing
guidance requires updating and developing for new LH2 storage facilities that are beginning to
appear in new challenging environments.
1.2 AIMS
Particular issues relating to LH2 include its spill behaviour both as a liquid and vapour, its
general combustion properties including flame speed and ignition behaviour as a cool/dense
vapour and the complications of this associated with layering effects. LH2 has a low boiling
temperature and associated ability to condense out and even solidify oxygen from air to produce
a potentially self igniting energetic cocktail of LH2 & liquid or solid oxygen.
This series of experiments was intended to determine the range of hazards from a realistic
release of LH2, for example, spill rates which are consistent with a hose transfer operation.
A number of distinct areas of spill behaviour were investigated:
Hydrogen dispersion from unignited spills
On ground liquid pool formation
Spills into free air
Pool formation with respect to storage conditions
1.3 REPORT
This report is a factual record of the tests undertaken and of the measurements recorded.

2
2. TEST FACILITY
2.1 TEST FACILITY
This section provides a description of the test facility and LH2 supply system.
The location of the facility was situated at the Frith Valley site at the Health and Safety
Laboratory in Buxton; see Figures 1 and 2.
Figure 1 Spill area and release facility
Figure 2 Test area and surrounding terrain

3
The facility included:
Concrete pad, measuring 32 m in diameter
Liquid hydrogen tanker containing 2.5 tonnes of hydrogen
20 metre long, 1” vacuum insulated flexible liquid line
Liquid bypass line to vent
Nitrogen and hydrogen packs for system purge and tanker operation
Local instrument cabin containing the signal conditioning units and data logging system
and control plc;
Remote control room (300 m from the firing pad) with video displays of the trials area
and the networked control system.
6 metre high vent stack to vent excess hydrogen
A P&ID of the release system can be seen at Figure 3.
LH2 Tanker
Purge supply Vent stack
Vapour line to ventH2N2
Water drain
PI
Vacuum insulated flexibleliquid line
Release point (1" nominal bore)
Valve remote PLC
Liquid bypassline to vent
Note: Valves in tanker subsystem greatly simplified full system specification property of BOC
All remote valves nitrogen actuated
Figure 3 P&ID of the release facility
2.2 LH2 TANKER
The liquid hydrogen release system comprises a 2.5 tonne liquid hydrogen tanker, 20 metres of
one inch vacuum insulated hose, a release valve station with bypass purge and release valves, a
liquid hydrogen bypass hose and a 6 metre high vent stack to vent excess hydrogen.

4
The tanker is an ISO tank container provided by BOC, the tanker contains up to 2.5 tonnes of
liquid hydrogen in a vacuum insulated internal tank surrounded by an outer jacket containing
liquid nitrogen see (Figure 4). The tanker is fitted with vent valves such that the pressure within
the tanker can be lowered. It is also provided with a liquid hydrogen / air heat exchanger such
that the pressure in the tanker can be raised. In use, LH2 is allowed to flow into the heat
exchanger where it vapourises, the vapour is then fed into the vapour space in the tanker in
order to pressurise the liquid hydrogen. The tanker is fitted with a bursting disc rated at 12
bar(g) to protect against overpressurisation.
Figure 4 Liquid hydrogen tanker
2.3 RELEASE RIG
As delivered, the hydrogen within the tanker is normally at around 4 bar(g) pressure and as such
it is super heated relative to its atmospheric boiling point of 20K. To achieve a liquid spill of the
contents at atmospheric pressure without excessive flash vaporisation thereby encouraging
pooling, the tanker is first depressurised to atmospheric pressure by venting hydrogen from the
vapour space above the liquid. This cools the remaining liquid hydrogen within the tanker to its
atmospheric boiling point. Some liquid hydrogen is then allowed to flow into the hydrogen / air
heat exchanger where it vaporises, this hydrogen vapour is fed to the top of the tanker in order
to pressurise the liquid hydrogen such that it will flow out of the tanker when the release valve
is opened. Releases of liquid hydrogen made using this system at approximately 1 bar(g) gave a
flow rate of approximately 60 litres per minute.
Photographs showing the release pipework, vent stack and LH2 tanker can be seen at Figures
5(a) through to 5(c) respectively.

Figure 5(a) Connection to liquid hydrogen trailer
Figure 5(b) 20 m of 1” nominal bore vacuum line (release pipework)
5

6
Figure 5(c) Remotely operated valves to deliver hydrogen to the release point
2.4 TEST PROTOCOL
After purging all the liquid hydrogen pipe-work with nitrogen and then warm hydrogen, the
manual valve on the tanker is opened fully, the actuated valve on the tanker is then opened and
the connection between the tanker and the vacuum hose is checked for leaks. The bypass valve
to the vent stack is opened and when the pipe-work has sufficiently cooled (as evidenced by
liquid air running off the surfaces of the un-insulated portions of the vent pipe), the release
valve is opened allowing liquid hydrogen to flow out of the release pipe onto the concrete pad.
7
3. INSTRUMENTATION AND DATA PROCESSING
A brief description of the general instrumentation is given in this section. Specific information
regarding sensor details, mode of operation and location can be found in section 4 under test set
up.
3.1 VISUAL RECORDS
Video cameras at standard video speed of 25 frames per second were used to monitor and record
selected trials. Two cameras were used one to give a cross wind view and the other to give an
alternative view at 90° to the first camera.
3.2 METEOROLOGICAL MONITORING
The wind speed and direction was recorded at close proximity to the release point using an
ultra-sonic anemometer. Air temperature and relative humidity were also measured at the edge
of the release pad by a Vector Instruments weather station.
3.3 DATA LOGGING
The weather station outputs and were logged on a laptop connected via the USB port to a
Datashuttle USB56 manufactured by IOtech Inc. This system is capable of measuring up to 28
channels at a resolution of up to 22 bits. During the trials, the computer was programmed to
record data at a frequency of 0.5 Hz. Multipliers and offsets were programmed into the data
collection software such that the recorded sensors read in engineering units.
The thermocouples were logged on a laptop connected via the USB port to a Datashuttle
USB3005 manufactured by IOtech Inc. This system is capable of measuring up to 32
differential channels at a resolution of up to 16 bits. During the trials the computer was
programmed to record data at a frequency of 100 Hz. Multipliers and offsets were programmed
into the data collection software such that the recorded sensors read in engineering units.
3.3.1 Data logger calibration
The data shuttles were supplied from new with a factory calibration certificate traceable to NIST
standards.

8
3.4 HYDROGEN DETECTION
3.4.1 Hydrogen concentration sensors
Two methods were used to measure hydrogen concentrations, one method via oxygen depletion
and the other via temperature within the cloud using thermocouples, see Figure 6. The oxygen
depletion sensors were severely affected, initially by the condensed water vapour within the
hydrogen cloud and subsequently by the low temperatures experienced. Therefore the use of
these sensors was discontinued for subsequent trials.
For the rest of the tests only temperature measurements were made within the cloud and an
adiabatic mixing assumption was used to derive the H2 concentration from the temperatures.
This calculation was corrected for relative humidity for each test. The thermocouples used were
type E, 1 mm diameter stainless steel sheathed with insulated junctions.
Figure 6 O2 sensor and thermocouple used for temperature measurement in cloud
3.5 GROUND LEVEL POOL THERMOCOUPLES
The thermocouples were type E, 1 mm diameter, 10 cm long stainless steel sheathed with
insulated junctions. They were mounted into a frame and spaced 100 mm apart in a horizontal
line. The frame was placed in line with the release with the first thermocouple 500 mm from the
release point. The tips of the thermocouples were in contact with the surface of the concrete, see
Figures 7 and 8.

9
Figure 7 Pool thermocouples
Figure 8 Tip of thermocouple in relation to
concrete surface
3.6 THERMOCOUPLES EMBEDDED IN CONCRETE
Three type E, 1.5mm diameter, stainless steel sheathed thermocouples were embedded into the
concrete at depths of 10mm, 20mm and 30mm (see Figure 9) at a distance of 150cm from the
release point and offset 20cm from the centre line of the release.
Figure 9 Embedded thermocouples

10
4. TEST SETUP
4.1 CONCENTRATION SENSOR LOCATIONS FOR TESTS 5, 6 AND 7
Thirty sensors were positioned at a range of heights and distances from the release point in line
with the wind direction, the wind direction for each test is detailed in section 6. The exact
positions (distance, heights and thermocouple numbers) can be seen at Table 1. A drawing
showing the test layout can be seen at Figure 10.
Height (m) 0.25 0.75 1.25 1.75 2.25 2.75
Mount
number
Distance (m)
from release
TC No TC No TC No TC No TC No TC No
1 1.5 10 11 12 16 17 18
2 3.0 7 8 9 22 23 24
3 4.5 1 2 3 28 29 30
4 6.0 4 5 6 21 19 20
5 7.5 13 14 15 25 26 27
Table 1 Sensor locations
Embedded thermocouplesRelease
point
Concentration sensor
mount numbers.
32 metre concrete pad
1
234
5
Pool thermocouples
16.5m
9m
NOT DRAWN TO SCALE
0°N
Concentration sensors were moved round to
aline with the wind direction at the time
of each release
Figure 10 Test layout

11
4.2 GROUND LEVEL POOL THERMOCOUPLES
The thermocouples were mounted into a frame 100mm apart in a horizontal line and the frame
placed in line with the release. The number and positions of the thermocouples are detailed
below.
TC No Distance from release point (m)
1 0.5
2 0.6
3 0.7
4 0.8
5 0.9
6 1.0
7 1.1
8 1.2
9 1.3
10 1.4
11 1.5
12 1.6
13 1.7
14 1.8
15 1.9
16 2.0
17 2.1
18 2.2
19 2.3
20 2.4
21 2.5
22 2.6
23 2.7
24 2.8
4.3 EMBEDDED THERMOCOUPLES
Three thermocouples were embedded into the concrete at depths of 10mm, 20mm, and 30mm at
a distance of 150cm from the release point and 20cm offset from centre line.
TC No Depth (mm)
1 10
2 20
3 30
12
4.4 CONCENTRATION SENSOR LOCATIONS FOR TEST 10
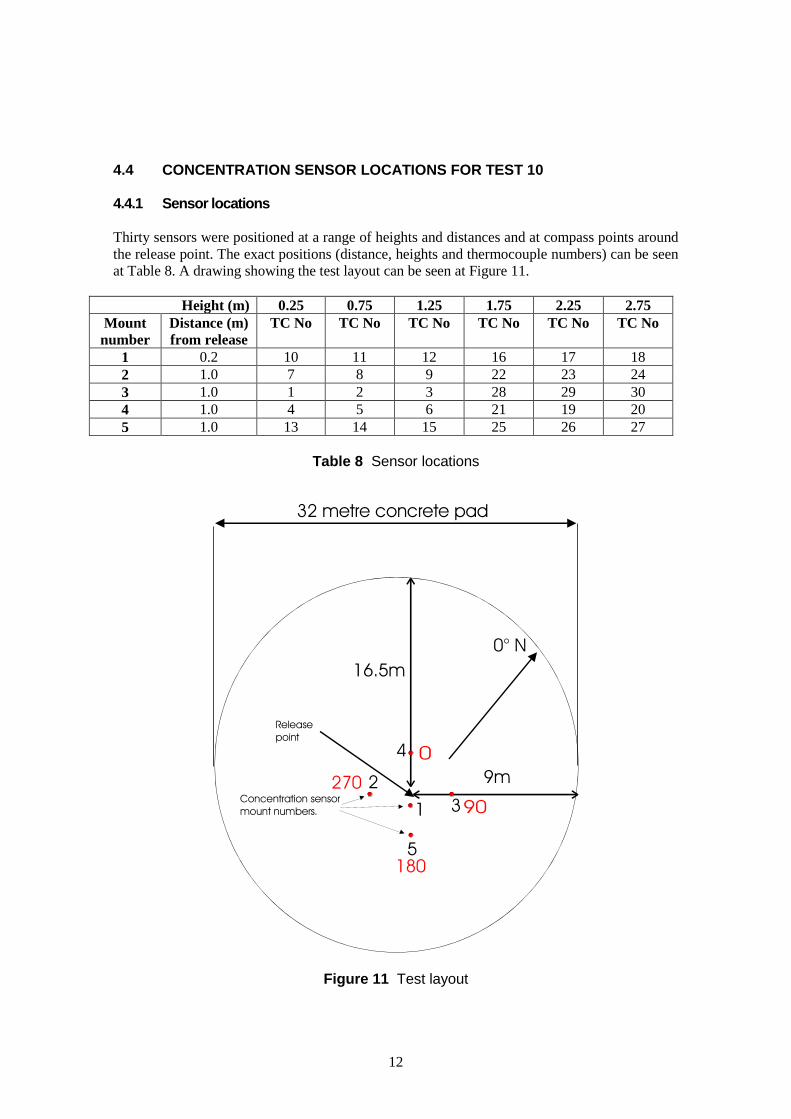
4.4.1 Sensor locations
Thirty sensors were positioned at a range of heights and distances and at compass points around
the release point. The exact positions (distance, heights and thermocouple numbers) can be seen
at Table 8. A drawing showing the test layout can be seen at Figure 11.
Height (m) 0.25 0.75 1.25 1.75 2.25 2.75
Mount
number
Distance (m)
from release
TC No TC No TC No TC No TC No TC No
1 0.2 10 11 12 16 17 18
2 1.0 7 8 9 22 23 24
3 1.0 1 2 3 28 29 30
4 1.0 4 5 6 21 19 20
5 1.0 13 14 15 25 26 27
Table 8 Sensor locations
Release
point
32 metre concrete pad
16.5m
9m2
4
3
5
1
Concentration sensor
mount numbers.
0° N
180
270
Figure 11 Test layout

13
5. TEST PROGRAMME AND PARAMETERS
The work plan involved releases of liquid hydrogen at a fixed rate of 60 litres per minute for
different durations. The release height and orientation was varied see Figures 12, 13 and 14.
Table 9 gives the test numbers and details (test numbers 8 & 9 were aborted due to adverse
weather and equipment failure). The sensor positions were changed to reflect the release
conditions see sections 4.1 and 4.4. Initially a large number of scoping tests were performed to
see if a pool formation could be established, to validate operating procedures, check
instrumentation location and function and to train personnel in the operation of the facility.
These tests do not form part of this report.
Test
number
Release height Release orientation Test
Duration
(s)
5 Onto ground Horizontal 248
6 100 mm above ground Vertically downwards 561
7 860 mm above ground Horizontal 305
10 100 mm above ground Vertically downwards 215
Table 9 Test number and release orientation
Figure 12 Horizontal ground release
Figure 13 Horizontal release 860 mm
above ground

14
Figure 14 Vertical release 100 mm above ground
5.1 TEST PARAMETERS
The nominal storage pressure was measured immediately upstream of the release valve with the
tanker valve open and the release valve closed. The nominal release pressure was measured
immediately upstream of the release valve with the release valve open. The release rate, nominal
storage pressure and release pressure for all the tests are given below in Table 2.
Release rate
(l/m)
Nominal storage
pressure (barg)
Nominal release
pressure (barg)
60 1 0.2
Table 2 Test parameters
5.2 WEATHER CONDITIONS
The weather conditions at the time of the release for each test were recorded, see Section 6. The
wind direction and speed were measured at close proximity to the release, 86 cm from the
ground. The wind direction is relative to north 0°, see Figures 10 and 11 (test layout). Tests
were not carried out during periods of precipitation, high winds or in the event of the wind
direction taking the hydrogen plume back over the tanker.

15
6. RESULTS
6.1 TEST 5 – HORIZONTAL GROUND RELEASE
The hydrogen was released along the ground (see Figure 12). The weather conditions during the
release are summarised below.
Relative
humidity
(%)
Temperature
(° C)
Wind
speed
m/s
Wind
direction
68 10.3 2.7 274*
* Wind direction in degrees from the North = 0° Wind direction from the south = 180°
The temperatures at various depths into the concrete can be seen at figure 15.
Figure 15 Embedded thermocouples
Temperatures recorded at the surface of the concrete for the first eight thermocouples during the
release can be seen at figure 16. The thermocouple measurements taken in contact with the
ground show a degree of sub-cooling is occurring as the hydrogen is released and evaporates
with temperatures as low as 16K being recorded. In addition steps are evident in the temperature
traces as the temperature increases after the release has ended. This is indicative of the melting
and boiling of the condensed air.

16
Figure 16 Temperatures at concrete surface (pool thermocouples)
The pool dimensions (pool spread) following the release can be estimated from Figure 17, the
pool measured approximately 4 metres in length and 1 metre in width.
Figure 17 Liquid pool spread

17
A plot showing measured concentrations at varying distances and at a fixed height of 0.25m
from the release point can be seen at Figure 18. Note that the hydrogen sensors are positioned
for each test such that they were in line with the wind direction see section 4.1 and section 6.
0.0
10.0
20.0
30.0
40.0
50.0
60.0
100 200 300 400 500 600
Vo
lum
e %
hyd
rog
en
Time (s)
60l/m release Date: 17/09/10 File: lh2unig05.xls
1.5m
3.0m
4.5m
6.0m
7.5m
Valve open
Valve closed
Figure 18 Hydrogen concentrations at varying distances from the release at a fixed
height of 0.25 m
Figure 19 shows the hydrogen cloud passing through the sensors during the release.
Figure 19 Hydrogen cloud passing through the sensors

18
6.2 TEST 6 – VERTICALLY DOWNWARD RELEASE 100 mm ABOVE THE GROUND
The hydrogen was released at a height of 100 mm vertically downwards to provide a release
configuration where the momentum of the jet was removed on contact with the ground. The
weather conditions during the release are summarised below.
Relative
humidity (%)
Temperature
(° C)
Wind
speed
m/s
Wind
direction
68 10.4 4.0 280*
* Wind direction in degrees from the North = 0° Wind direction from the south = 180°
Figure 21 shows the liquid hydrogen during the release and the build up of a solid deposit.
Figure 21 Liquid hydrogen during the release
After the release, the size and spread of the pool could easily be seen on the concrete pad, see
Figure 22. The pool was estimated to be about 2.14 m wide and 1.3m long.

19
Figure 22 Pool extent and spread following the release
A plot showing measured hydrogen concentrations at varying distances and at a fixed height of
0.25m from the release point can be seen at Figure 23.
60l/m release Date: 17/09/10 File: lh2unig06.xls
0.0
5.0
10.0
15.0
20.0
25.0
30.0
300 400 500 600 700 800 900 1000 1100 1200
Time (s)
Vo
lum
e %
hy
dro
gen
tc10-1.5m
tc7-3.0m
tc1-4.5m
tc04-6m
tc13-7.5m
Figure 23 Hydrogen concentrations at varying distances from the release at a fixed height
of 0.25 m

20
6.3 TEST 7 HORIZONTAL RELEASE 860 mm ABOVE THE GROUND
This test arrangement was used to check whether rain out occurred when liquid hydrogen was
released as a free jet. The weather conditions during the release are summarised below.
Relative
humidity (%)
Temperature
(°)
Wind speed
m/s
Wind
direction*
65 11.5 2.9 297
* Wind direction from the North = 0° Wind direction from the south = 180°
A photo of the free jet during the release can be seen in Figure 24.
Figure 24 Liquid hydrogen free jet
A plot showing the measured hydrogen concentrations at varying heights and at a fixed distance
of 1.50 m from the release point can be seen at Figure 25. The momentum of the free jet at the
release point keeps the hydrogen jet buoyant at around one metre above the ground. Further
away from the release point at approximately 1.5 m the hydrogen begins to move closer to the
ground (see figure 24). When the valve is closed the hydrogen begins to rise again which
accounts for the increase in concentration measured at the 0.75m sensor position after the
release was terminated.

21
Figure 25 Hydrogen concentrations at varying heights and at a fixed distance of 1.50 m from the release
6.4 TEST 10 VERTICALLY DOWNWARD RELEASE 100 mm ABOVE THE GROUND
As the orientation of the release was directed down onto the ground it was decided to change the
sensor arrangement (see Figure 11) so that hydrogen concentrations could be measured omni-
directionally rather than uni-directionally.
The weather conditions during the release are summarised below.
Wind speed
m/s
Wind direction *
Relative
humidity (%)
Temperature
(° C)
1.4 65 87 4.3
* Wind direction from the North = 0° Wind direction from the south = 180°
A plot showing measured hydrogen concentrations at fixed distance of 1.0 metre from the
release point and at a height of 0.25 metres can be seen at figure 26, the sensor located at
position 200 mm from the release was faulty for this test.
A plot showing measured hydrogen concentrations at fixed distance of 1.0 metre from the
release point and at a height of 2.75 metres can be seen at figure 27. TC 18 was located at a
distance of 200 mm from the release and at a height of 2.75 metres.
60l/m release Date: 17/09/10 File: lh2unig07.xls
0.0
10.0
20.0
30.0
40.0
50.0
60.0
70.0
300 400 500 600 700
Time (s)
Vo
lum
e %
hy
dro
ge
n
0.25m
0.75m
1.25m
1.75m
2.25m
2.75m
Valve open
Valve closed

22
Figure 26 Hydrogen concentrations at a height of 0.25m and at a fixed distance of 1.0 m from the release
Figure 27 Hydrogen concentrations at a height of 2.75 m and at a fixed distance of 1.0 m and 0.2 m (tc 18) from the release
The plots show that at one metre from the release point the maximum concentrations were
recorded are at a height of 0.25 m.
60l/m release Date: 17/09/10 File: lh2unig10.xls
0.0
10.0
20.0
30.0
40.0
50.0
60.0
70.0
100 200 300 400 500 600
Time (s)
Vo
lum
e %
hy
dro
ge
n
tc04-1.0m 0°
tc1- 1.0m 90°
tc13-1.0m 180°
tc7-1.0m 270°
60l/m release Date: 17/09/10 File: lh2unig10.xls
0.0
10.0
20.0
30.0
40.0
50.0
60.0
70.0
100 200 300 400 500 600
Time (s)
Vo
lum
e %
hy
dro
ge
n
tc04-1.0m 0°
tc1- 1.0m 90°
tc13-1.0m 180°
tc7-1.0m 270°
60l/m release Date: 17/09/10 File: lh2unig10.xls
0.0
5.0
10.0
15.0
20.0
25.0
100 200 300 400 500 600
Time (s)
Vo
lum
e %
hy
dro
ge
n
tc20-1.0m 0°
tc30-1.0m 90°
tc18-200mm 180°
tc25-1.0m 180°
tc24-1.0m 270°
23
7. DISCUSSION
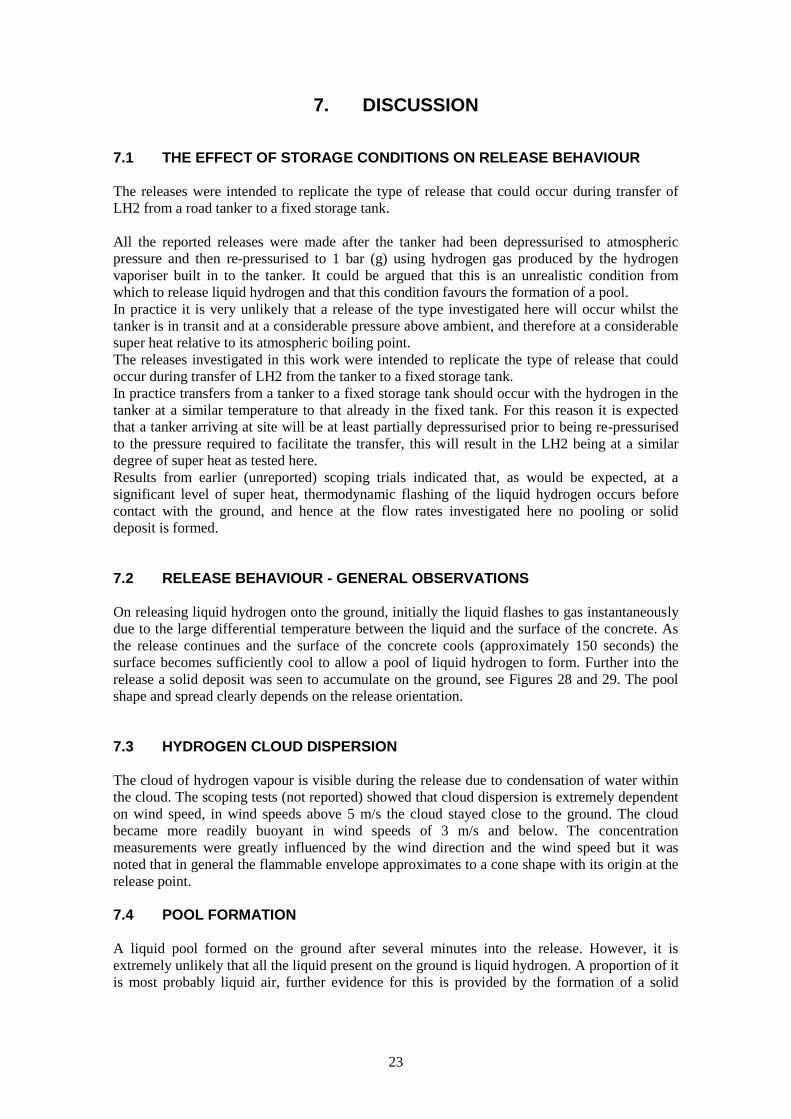
7.1 THE EFFECT OF STORAGE CONDITIONS ON RELEASE BEHAVIOUR
The releases were intended to replicate the type of release that could occur during transfer of
LH2 from a road tanker to a fixed storage tank.
All the reported releases were made after the tanker had been depressurised to atmospheric
pressure and then re-pressurised to 1 bar (g) using hydrogen gas produced by the hydrogen
vaporiser built in to the tanker. It could be argued that this is an unrealistic condition from
which to release liquid hydrogen and that this condition favours the formation of a pool.
In practice it is very unlikely that a release of the type investigated here will occur whilst the
tanker is in transit and at a considerable pressure above ambient, and therefore at a considerable
super heat relative to its atmospheric boiling point.
The releases investigated in this work were intended to replicate the type of release that could
occur during transfer of LH2 from the tanker to a fixed storage tank.
In practice transfers from a tanker to a fixed storage tank should occur with the hydrogen in the
tanker at a similar temperature to that already in the fixed tank. For this reason it is expected
that a tanker arriving at site will be at least partially depressurised prior to being re-pressurised
to the pressure required to facilitate the transfer, this will result in the LH2 being at a similar
degree of super heat as tested here.
Results from earlier (unreported) scoping trials indicated that, as would be expected, at a
significant level of super heat, thermodynamic flashing of the liquid hydrogen occurs before
contact with the ground, and hence at the flow rates investigated here no pooling or solid
deposit is formed.
7.2 RELEASE BEHAVIOUR - GENERAL OBSERVATIONS
On releasing liquid hydrogen onto the ground, initially the liquid flashes to gas instantaneously
due to the large differential temperature between the liquid and the surface of the concrete. As
the release continues and the surface of the concrete cools (approximately 150 seconds) the
surface becomes sufficiently cool to allow a pool of liquid hydrogen to form. Further into the
release a solid deposit was seen to accumulate on the ground, see Figures 28 and 29. The pool
shape and spread clearly depends on the release orientation.
7.3 HYDROGEN CLOUD DISPERSION
The cloud of hydrogen vapour is visible during the release due to condensation of water within
the cloud. The scoping tests (not reported) showed that cloud dispersion is extremely dependent
on wind speed, in wind speeds above 5 m/s the cloud stayed close to the ground. The cloud
became more readily buoyant in wind speeds of 3 m/s and below. The concentration
measurements were greatly influenced by the wind direction and the wind speed but it was
noted that in general the flammable envelope approximates to a cone shape with its origin at the
release point.
7.4 POOL FORMATION
A liquid pool formed on the ground after several minutes into the release. However, it is
extremely unlikely that all the liquid present on the ground is liquid hydrogen. A proportion of it
is most probably liquid air, further evidence for this is provided by the formation of a solid
24
deposit. This deposit is thought to consist of either solid oxygen, nitrogen or a combination of
the two with liquid hydrogen trapped within the matrix. This phenomenon will be investigated
further during the ignited phase of the project.
7.5 POOL EXTENT
Once the pool was established the extent of the pool remained constant throughout the release.
This could be an equilibrium effect at this flow rate. To establish more information regarding
pool extent releases with different flow rates would need to be investigated. The vertical
releases resulted in an approximately circular pool around the impact point whereas the
horizontal release resulted in an elongated pool commensurate with the release direction and
momentum.
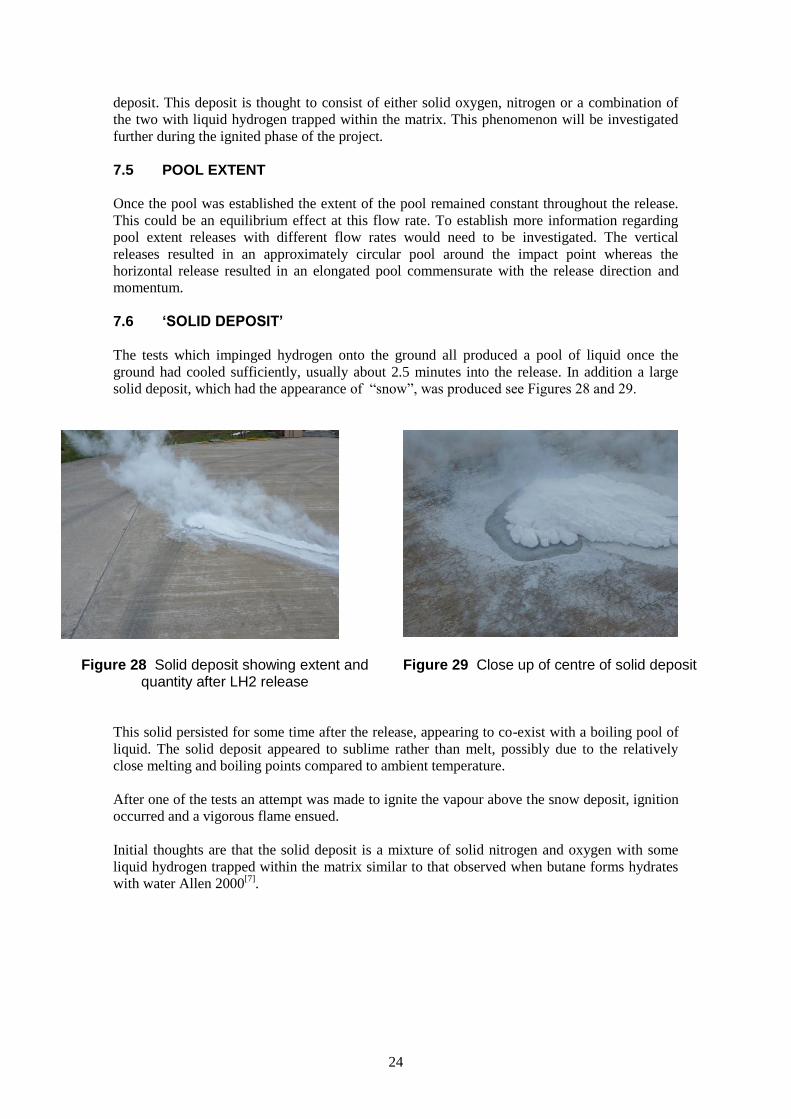
7.6 ‘SOLID DEPOSIT’
The tests which impinged hydrogen onto the ground all produced a pool of liquid once the
ground had cooled sufficiently, usually about 2.5 minutes into the release. In addition a large
solid deposit, which had the appearance of “snow”, was produced see Figures 28 and 29.
Figure 28 Solid deposit showing extent and quantity after LH2 release
Figure 29 Close up of centre of solid deposit
This solid persisted for some time after the release, appearing to co-exist with a boiling pool of
liquid. The solid deposit appeared to sublime rather than melt, possibly due to the relatively
close melting and boiling points compared to ambient temperature.
After one of the tests an attempt was made to ignite the vapour above the snow deposit, ignition
occurred and a vigorous flame ensued.
Initial thoughts are that the solid deposit is a mixture of solid nitrogen and oxygen with some
liquid hydrogen trapped within the matrix similar to that observed when butane forms hydrates
with water Allen 2000[7]
.

25
7.7 SPILLS INTO FREE AIR
A release was made into free air in order to determine whether rain out occurred under these
conditions. No rain out was evident from the free jet however, when the jet impinged on one of
the instrument supports a small amount of liquid was observed to fall to the ground. This liquid
may have been liquid air.
7.8 SPILL BEHAVIOUR
The storage conditions for the LH2 reported releases were manipulated to create the best
conditions for pool formation to occur. To achieve these, the tanker was depressurised to
atmospheric pressure in order to cool the liquid hydrogen to its atmospheric boiling point. The
tanker was then repressurised to 1 bar(g) with cold hydrogen vapour to enable the releases to be
made. During the scoping trials some releases were made from the tanker in its delivery state,
i.e at a pressure of 3.5 bar(g) . Under these conditions with the hydrogen superheated relative to
its atmospheric boiling point no liquid pool or solid deposit was formed.
7.9 HYDROGEN CONCENTRATIONS
The concentration contour graph shown in Figure 30 represents a snapshot of experimental data
from a typical horizontal release at ground level. The graph was generated using measured
hydrogen concentration data at various heights and distances from the release point. The red line
represents the 4% concentration contour (LFL) and the green line the 30% concentration
contour (stoichiometric). The graph gives an estimate of hydrogen concentrations at a specific
time during the release when the wind direction was such that the hydrogen cloud passed
through the sensors.
Figure 30 Liquid hydrogen free jet

26
8. MAIN FINDINGS
The release of liquid hydrogen in contact with a concrete surface can give rise to
pooling of liquid once the substrate is sufficiently cooled.
Release of liquid hydrogen in close proximity to a concrete surface can result in
subcooling due to vapourisation.
The release of liquid hydrogen at a rate consistent with the failure of a 1 inch transfer
line produces a flammable mixture at least nine metres downwind of the release point.
The release of hydrogen at its atmospheric boiling point onto a concrete surface
produces a solid deposit of oxygen and nitrogen once the substrate is sufficiently
cooled.
The solid deposit of ‘oxygen/nitrogen/air’ appears to trap liquid hydrogen within its
matrix producing a potentially hazardous mixture.
A release of 60 litres per minute of liquid hydrogen into free air 860 mm above the
ground results in total evaporation, i.e there is no rain-out of liquid.
27
9. REFERENCES
(1) Willoughby D, Royle M, 2010. Experimental / modelling strategy for issues associated
with liquid hydrogen spills, HSL report XS/10/06
(2) Pritchard D K, Rattigan W M, 2009. Hazards of liquid hydrogen: Position paper, HSL
report XS/09/72
(3) Pritchard, D.K., 2010. Hazards of liquid hydrogen – position paper. HSE 2010 Research
Report RR769, Sudbury: HSE Books.
(4) Batt, R, Webber D.M, 2012 Modelling of Liquid Hydrogen Spills HSL report
MSU/2012/01
(5) Hall, J. 2012 Ignited releases of liquid hydrogen, HSL report XS/11/77
(6) Witcofski, R.D. Experimental Measurements of the Clouds Formed by Liquid
Hydrogen Spills, CPIA-Publication 348. In JANNAF Safety and Environmental
Protection Subcommittee Meeting, Kennedy Space Centre, Florida, November 1981,
191-206
(7) Allen, J.T. 2000 Characteristics of impinging flashing jets, HSL report FS/00/02

Published by the Health and Safety Executive 02/14

Releases of unignited liquid hydrogen
Health and Safety Executive
RR986
www.hse.gov.uk
In the long term the key to the development of a hydrogen economy is a full infrastructure to support it, which includes means for the delivery and storage of hydrogen at the point of use, eg at hydrogen refuelling stations for vehicles. As an interim measure to allow the development of refuelling stations and rapid implementation of hydrogen distribution to them, liquid hydrogen is considered the most efficient and cost effective means for transport and storage.
The Health and Safety Executive (HSE) have commissioned the Health and Safety Laboratory (HSL) to identify and address issues relating to bulk liquid hydrogen transport and storage and update/develop guidance for such facilities. The second phase of the project involved experiments on unignited and ignited releases of liquid hydrogen (HSE RR987) and computational modelling of the unignited releases (HSE RR985). This position paper details the experiments performed to investigate spills of unignited liquid hydrogen at a rate of 60 litres per minute. Concentration of hydrogen in air, thermal gradient in the concrete substrate, liquid pool formation and temperatures within the pool were measured and assessed. The results of the experimentation will inform the wider hydrogen community and contribute to the development of more robust modelling tools. The results will also help to update and develop guidance for codes and standards.
This report and the work it describes were funded by the Health and Safety Executive. Its contents, including any opinions and/or conclusions expressed, are those of the authors alone and do not necessarily reflect HSE policy.


