relatorio de estabilidade financeira – novembro/2006 ... · institutions in net pro fi ts rose...
49
November 2006 | Financial Stability Report | 31 2.1 Introduction This chapter concentrates on discussing the risks to which National Financial System (SFN) member institutions are exposed, the composition and evolution of their assets, liabilities and net worth, including analysis of results and their adjustment to operational limits. To facilitate this presentation, the SFN was subdivided into two systems 10 : the banking system, composed of financial institutions included in consolidated banking segment I, consolidated banking segment II and consolidated banking segment III; and nonbanking system. Utilizing the June 2006 database, the report “Top 50 Banks” 11 shows that banking system assets corresponded to 99.1% of the SFN total, representing an increase of 0.1 p.p. compared to the end of the second half of 2005. The number of institutions remained stable at 1,544 and 1,551, respectively, in June and December 2005, compared to 1,553 at the end of the second half of 2005. Participation of these institutions in net profits rose from 97.9% in December 2005 to 98.5% in June of this year. Though net worth and total deposits remain concentrated in the banking system, demonstrating that the financial system is composed essentially of banks, the participation of the nonbanking system in overall SFN assets dropped 0.1 p.p. In the banking system, the first group, known as consolidated banking segment I and composed of 104 institutions, accounted for the highest share of SFN assets, with 85.9%. Compared to the previous half-year period, slight reductions 2 National Financial System supervision 10/ See box “Concepts and Methodologies”, pages 68 to 72. 11/ A quarterly electronic Bacen publication (http://www.bcb.gov.br/fis/TOP50/ingl/TOP502006060I.asp) The cutoff date for formation of the database does not coincide with that used in this report. This may result in differences in balances. Distribution of segments – SFN June, 2006 Itemization Number of % Total assets % institutions (R$ billion) Total of the SFN 1 883 1 816 Banking 1 553 82.5 1 799 99.1 consolidated I 104 5.5 1 560 85.9 consolidated II 30 1.6 212 11.7 consolidated III 1 419 75.4 27 1.5 Non-banking 330 17.5 17 0.9 Source: 50 banks in Brazil by total assets Distribution of segments – SFN June, 2006 R$ billion Itemization Net % Net % Total % worth profit/loss deposit Total of the SFN 180 22 721 Banking 174 96.5 22 98.5 718 99.6 consolidated I 143 79.4 18 80.0 670 92.9 consolidated II 25 14.0 4 16.7 36 4.9 consolidated III 6 3.1 0 2.4 12 1.6 Non-banking 6 3.5 0 1.5 3 0.4 Source: 50 banks in Brazil by total assets
Transcript of relatorio de estabilidade financeira – novembro/2006 ... · institutions in net pro fi ts rose...

November 2006 | Financial Stability Report | 31
2.1 Introduction
This chapter concentrates on discussing the risks to which National Financial System (SFN) member institutions are exposed, the composition and evolution of their assets, liabilities and net worth, including analysis of results and their adjustment to operational limits.
To facilitate this presentation, the SFN was subdivided into two systems10: the banking system, composed of fi nancial institutions included in consolidated banking segment I, consolidated banking segment II and consolidated banking segment III; and nonbanking system.
Utilizing the June 2006 database, the report “Top 50 Banks”11 shows that banking system assets corresponded to 99.1% of the SFN total, representing an increase of 0.1 p.p. compared to the end of the second half of 2005. The number of institutions remained stable at 1,544 and 1,551, respectively, in June and December 2005, compared to 1,553 at the end of the second half of 2005. Participation of these institutions in net profi ts rose from 97.9% in December 2005 to 98.5% in June of this year.
Though net worth and total deposits remain concentrated in the banking system, demonstrating that the fi nancial system is composed essentially of banks, the participation of the nonbanking system in overall SFN assets dropped 0.1 p.p.
In the banking system, the fi rst group, known as consolidated banking segment I and composed of 104 institutions, accounted for the highest share of SFN assets, with 85.9%. Compared to the previous half-year period, slight reductions
2National Financial System supervision
10/ See box “Concepts and Methodologies”, pages 68 to 72.11/ A quarterly electronic Bacen publication (http://www.bcb.gov.br/fi s/TOP50/ingl/TOP502006060I.asp) The cutoff date for formation of the database does
not coincide with that used in this report. This may result in differences in balances.
Distribution of segments – SFNJune, 2006
Itemization Number of % Total assets %
institutions (R$ billion)
Total of the SFN 1 883 1 816
Banking 1 553 82.5 1 799 99.1
consolidated I 104 5.5 1 560 85.9
consolidated II 30 1.6 212 11.7
consolidated III 1 419 75.4 27 1.5
Non-banking 330 17.5 17 0.9
Source: 50 banks in Brazil by total assets
Distribution of segments – SFNJune, 2006
R$ billion
Itemization Net % Net % Total %
worth profit/loss deposit
Total of the SFN 180 22 721
Banking 174 96.5 22 98.5 718 99.6
consolidated I 143 79.4 18 80.0 670 92.9
consolidated II 25 14.0 4 16.7 36 4.9
consolidated III 6 3.1 0 2.4 12 1.6
Non-banking 6 3.5 0 1.5 3 0.4
Source: 50 banks in Brazil by total assets

32 | Financial Stability Report | November 2006
occurred in participation in net worth, dropping from 79.6% to 79.4%; in net profi ts, falling from 85.7% to 80%; and in total deposits, dropping from 93.3% to 92.9%.
In the last four half-year periods, the increase in the participation of credit unions in total SFN assets has been signifi cant, with 1.2% and 1.3%, respectively, against June and December 2004, rising to 1.5% in the second half of 2005. Though still incipient, these numbers demonstrate the growing importance of credit unions. In the last six months, these institutions increased the balance of their portfolios 8.7%, accounting for approximately 1.6% of total credit operations granted in the country.
Banking institutions continued channeling their investments into loan operations, albeit at a lesser growth rate than in the second half of 2005. Investments in stocks and securities dropped 0.1%, totaling R$444.8 billion. These operations expanded less than the volume of resources channeled into credits, with a total balance of R$664 billion, or 9% positive growth.
According to the Infl ation Report Volume 8 – Number 2/2006, growth in bank operations targeted to the credit segment refl ects recent increases in loans referenced to nonearmarked resources, with growth in operations with both individual borrowers and corporate entities. The upturn in lending to individual borrowers was driven by improved family income and was mostly concentrated under personal loans, particularly payroll-deducted loans. This loan modality, which reached a total of R$39.3 billion in April 2006, accounted for 48.8% of the personal loan portfolio or, in other words, 18.5% of total credits targeted to individual borrowers.
As internal demand has intensifi ed, generating a considerably more dynamic pace of sustained economic activity, business fi nancing has also expanded. Consequently, the ratio between the overall volume of fi nancial system loans and GDP reached 32.6% in May 2006, against 28.3% in May 2005 and 25.5% in May 2004.
2.2 Balance sheet structure
2.2.1 Assets
In the fi rst half of 2006, SFN assets evolved 8.4%, closing at R$1,816 billion. For the most part, this growth refl ected credit portfolio expansion, R$52.1 billion, and an increased volume of interbank liquidity investments, R$34.5 billion
Loans and lease operationsBanking-consolidated III by control type
7.0
7.8
8.6
9.4
10.2
11.0
Dec2004
Jun2005
Dec Jun2006
R$ billion
Credit operations
0
90
180
270
360
450
Jan-00
%
Credit operations
0.0
2.0
4.0
6.0
8.0
10.0
Jan-00
%
#REF!
Principais aplicações - SFN
-5.0
-2.0
1.0
4.0
7.0
10.0
Jun2002
Dez2002
Jun2003
Dez
%
Tít l l biliá i i t t d i ti
Main investments – SFNVariation in the semester
-1.6
1.2
4.0
6.8
9.6
12.4
Jun2004
Dec Jun2005
Dec Jun2006
%
Credit operations Securities and derivatives
Assets – SFN
1 000
1 170
1 340
1 510
1 680
1 850
Dec2004
Jun2005
Dec Jun2006
R$ billion
0
2
4
6
8
10
%
Assets Growth rate

November 2006 | Financial Stability Report | 33
(18.9%), particularly repo operations, R$37.4 billion (30.5%), in detriment to interbank deposits, which declined 19.9% to R$9 billion. Mention should also be made of growth in other assets, R$41.6 billion (14.3%). In this case, the highlights were growth in the exchange portfolio, R$25.6 billion (43%) and in tax credits, R$5.4 billion (17.6%).
The assets of consolidated banking segment I totaled R$1,560 billion, for growth of R$130.2 billion (9.1%) compared to the previous half-year period. A breakdown according to types of stock control indicates that 35.7% belonged to state-owned banks, 42.2% to private national banks and 22.1% to foreign banks. The participation levels of these institutions changed very little in relation to December 2005. Basically, the share held by private banks increased 0.6 p.p. and that in the hands of foreign banks rose 0.1 p.p., with a proportional reduction in the participation of state-owned banks.
On June 30, 2006, the assets of the 10, 20 and 50 largest banks accounted for 79.5%, 91.3% and 98.5% of total consolidated banking segment I assets. The slight drop in the percentage held by two groups was offset by growth in the third, since no signifi cant changes occurred in the participation of the 50 largest banks compared to the fi gures for the previous half-year period.
The major investments included in overall SFN assets were credit portfolios, with 37.9% (37.9% in December 2005), followed by stocks and securities and derivative instruments, with 24.5% (26.6% in December 2005).
In June 2006, the institutions belonging to consolidated banking segment I held the equivalent of R$413 billion in stocks and securities and derivative instruments or, in other words, 92.9% of the SFN total (94% in December 2005). The largest share of stocks and securities and derivatives was concentrated once again in public banks, 49.5% (48.3% in December 2005), while national private banks and foreign banks reduced their participation levels to 28.4% and 22.1% of the total, respectively, against 29.6% and 22.2% in December 2005. It is important to stress that state-owned banks carried a very high position as a result of restructuring processes implemented at state government banks, and the fact that these banks act as executors of government policies.
Analyzed individually, the SFN stock and security portfolio totaled R$414 billion, down 0.5% in the half-year period. In December 2005, the Stocks and Securities (TVM) stock of consolidated banking segment I totaled R$391 billion,
AssetsBanking-consolidated I by control type
14
20
26
32
38
44
Dec2004
Jun2005
Dec Jun2006
%
Government owned banks Domestic private banks Foreign banks
Main investments – SFNJune, 2006
13.2%
37.9%
18.3%
6.1%
24.5%
Cash and floating + Repo-reverse repoSecurities and derivativesCredit operationsOther assetsFixed assets
Assets – Banking-consolidated ITop banks
%
Itemization 2004 2005 2006
Dec Jun Dec Jun
Top 10 79.2 78.8 79.4 79.5
Top 20 91.2 91.1 91.5 91.3
Top 50 98.1 98.2 98.4 98.5
Securities and derivatives Banking-consolidated I by control type
5
15
25
35
45
55
Dec2004
Jun2005
Dec Jun2006
%
Government owned banks Domestic private banks Foreign banks

34 | Financial Stability Report | November 2006
down 1.6% in the six-month period. Analysis shows that the reduction was concentrated under securities to be negotiated, which dropped to 15.5% in the period, representing 35.7% of the total portfolio (41.5% in December 2005). Papers available for sale and held to maturity increased 13.8% and 1.8%, respectively, representing 36.2% and 28.2% of the portfolio total, against 31.3% and 27.2%.
When examined according to bank segments segregated by types of control, the TVM portfolio classifi cation structure registered highly different configurations. While state-owned banks concentrated their investments in papers held to maturity, 46.8%, private national banks held the largest share of their investments in securities to be negotiated, 57.4%, and foreign banks targeted their resources mainly into securities available for sale, 51.8%.
The SFN credit portfolio, totaling R$688 billion12, posted strong 8.2% growth in the second half. This was mostly a consequence of increased operations with individual borrowers, driven by growth in operations with individual borrowers, at the same time in which payroll-deducted loans and auto fi nancing expanded rapidly.
Loans and discounted invoices and fi nancing are the major credit modalities registered at the SFN, representing 39% and 34.3% of the total credit portfolio, respectively.
Credit operations registered by consolidated banking segment I member institutions totaled R$574 billion, corresponding to 83.5% of the SFN credit portfolio (82.7% in December 2005). Of this total, public banks held 31% (30.5% in December 2005), private national banks accounted for 46.7% (46.5% in December 2005), and foreign banks held 22.2% (22.9% in December 2005). Foreign banks posted the lowest rate of credit portfolio growth in the half-year period (5.9%), against 9.6% for private national banks and 8.1% for foreign banks.
2.2.2 Liabilities
Liabilities represented 90.1% of the origins of SFN resources and totaled R$1,636 billion at the end of June 2006,
12/ Refers to aggregation of accounting balances registered in fi nancial conglomerates and independent institutions and, therefore, also includes information on the classifi ed credit portfolio of subsidiaries and offi ces abroad belonging to institutions that are part of Brazilian fi nancial conglomerates. One should stress that the amount stated concerns the gross credit portfolio or, in other words, without deducting provisions for nonperforming loans totaling approximately R$43.7 billion, stated under the heading of other assets in the graph “Main Investments – SFN”, page 33.
Securities Banking-consolidated I
0
20
40
60
80
100
Dec2004
Jun2005
Dec Jun2006
%
Trading book Available for sale Held to maturity
SecuritiesBanking-consolidated I
%
Itemization1/ Trading Available Held to
book2/ for sale maturity3/
Banks
government owned 22.6 30.6 46.8
domestic private 57.4 35.1 7.5
foreign 39.9 51.8 8.3
1/ Control type.2/ Acquired with the intention to be actively and frequently negotiated.3/ Exists intention and financial capacity to keep them until the expiration.
Credit operations – SFN
450
500
550
600
650
700
Dec2004
Jun2005
Dec Jun2006
R$ billion
8
9
10
11
12
13
%
Credit operations Growth rate
November 2006 | Financial Stability Report | 35
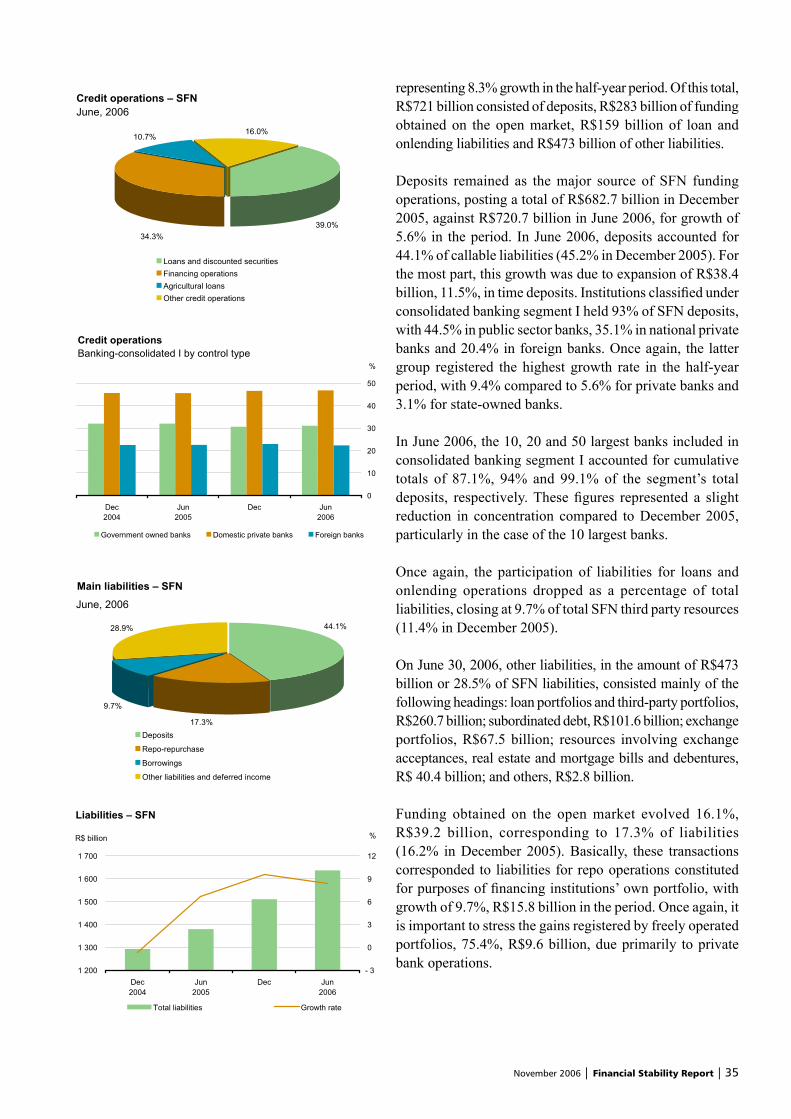
representing 8.3% growth in the half-year period. Of this total, R$721 billion consisted of deposits, R$283 billion of funding obtained on the open market, R$159 billion of loan and onlending liabilities and R$473 billion of other liabilities.
Deposits remained as the major source of SFN funding operations, posting a total of R$682.7 billion in December 2005, against R$720.7 billion in June 2006, for growth of 5.6% in the period. In June 2006, deposits accounted for 44.1% of callable liabilities (45.2% in December 2005). For the most part, this growth was due to expansion of R$38.4 billion, 11.5%, in time deposits. Institutions classifi ed under consolidated banking segment I held 93% of SFN deposits, with 44.5% in public sector banks, 35.1% in national private banks and 20.4% in foreign banks. Once again, the latter group registered the highest growth rate in the half-year period, with 9.4% compared to 5.6% for private banks and 3.1% for state-owned banks.
In June 2006, the 10, 20 and 50 largest banks included in consolidated banking segment I accounted for cumulative totals of 87.1%, 94% and 99.1% of the segment’s total deposits, respectively. These fi gures represented a slight reduction in concentration compared to December 2005, particularly in the case of the 10 largest banks.
Once again, the participation of liabilities for loans and onlending operations dropped as a percentage of total liabilities, closing at 9.7% of total SFN third party resources (11.4% in December 2005).
On June 30, 2006, other liabilities, in the amount of R$473 billion or 28.5% of SFN liabilities, consisted mainly of the following headings: loan portfolios and third-party portfolios, R$260.7 billion; subordinated debt, R$101.6 billion; exchange portfolios, R$67.5 billion; resources involving exchange acceptances, real estate and mortgage bills and debentures, R$ 40.4 billion; and others, R$2.8 billion.
Funding obtained on the open market evolved 16.1%, R$39.2 billion, corresponding to 17.3% of liabilities (16.2% in December 2005). Basically, these transactions corresponded to liabilities for repo operations constituted for purposes of fi nancing institutions’ own portfolio, with growth of 9.7%, R$15.8 billion in the period. Once again, it is important to stress the gains registered by freely operated portfolios, 75.4%, R$9.6 billion, due primarily to private bank operations.
Main liabilities – SFN
17.3%
9.7%
28.9% 44.1%
Deposits
Repo-repurchase
Borrowings
Other liabilities and deferred income
June, 2006
Credit operationsBanking-consolidated I by control type
0
10
20
30
40
50
Dec2004
Jun2005
Dec Jun2006
%
Government owned banks Domestic private banks Foreign banks
Credit operations – SFNJune, 2006
16.0%10.7%
39.0%34.3%
Loans and discounted securitiesFinancing operationsAgricultural loansOther credit operations
Liabilities – SFN
1 200
1 300
1 400
1 500
1 600
1 700
Dec2004
Jun2005
Dec Jun2006
R$ billion
- 3
0
3
6
9
12
%
Total liabilities Growth rate

36 | Financial Stability Report | November 2006
2.2.3 Net worth
Net SFN worth grew from R$164.1 billion on December 31, 2005 to R$179.88 in June 2006, 9.6% growth in the half-year period, due mainly to profi t retentions by the institutions involved. This percentage was well above the 6.2% fi gure registered in the previous six months.
The net worth of institutions included in consolidated banking segment I, R$143 billion in June 2006, expanded 8.5% in the period, representing 79.3% of the SFN’s own resources, distributed among national private banks, with 51.1%; foreign banks, with 23.9%; and public banks, with 25%. Foreign bank participation diminished, falling 1.3 p.p. in the fi rst half of 2006.
2.3 Results
2.3.1 Composition and evolution
In the fi rst half of 2006, net SFN profi ts totaled R$22.2 billion, against R$18.2 billion in the previous half-year period. Basically, profi ts were composed of the results of fi nancial intermediation and revenues earned on services. Growth of 22.1% compared to the second half of 2005 was primarily a result of expanded revenues on services, R$1.6 billion or 6.7% in the period, coupled with increased revenues on stock participation, R$1.1 billion or 31.3%.
The result of financial intermediation, R$48.7 billion, remained practically stable, with growth of just 0.3% over the previous half-year period.
Revenues on fi nancial intermediation totaled R$140 billion, composed predominantly of income on credit and leasing operations, with 58.3% (59.1% in the second half of 2005). No signifi cant changes were registered under this heading in the second half of 2005. The second group of intermediation revenues involved operations with stocks and securities, declining from 33.9% of the total in the second half of 2005 to 32.5% in the six-month period ended in June 2006.
Outlays on funding operations totaled R$58 billion, absorbing 41.3% of revenues on fi nancial intermediation (42.1% in the previous six months). For the most part, these outlays consisted of expenditures on time deposits (36%) and repo operation (33.4%). Spending on provisions for nonperforming loans totaled R$15.9 billion and continued
Deposits – SFN
500
550
600
650
700
750
Dec2004
Jun2005
Dec Jun2006
R$ billion
3
5
7
9
11
13
%
Deposits Growth rate
DepositsBanking-consolidated I by control type
10
18
26
34
42
50
Dec2004
Jun2005
Dec Jun2006
%
Government owned banks Domestic private banks Foreign banks
Total deposits – Banking-consolidated ITop banks
%
Itemization 2004 2005 2006
Dec Jun Dec Jun
Top 10 86.9 87.2 87.6 87.1
Top 20 94.8 94.7 94.8 94.0
Top 50 99.2 99.2 99.1 99.1
Net worth – SFN
135
145
155
165
175
185
Dec2004
Jun2005
Dec Jun2006
R$ billion
5
6
7
8
9
10
%
Net worth Growth rate

November 2006 | Financial Stability Report | 37
as the second most signifi cant expenditure category under intermediation, absorbing 11.3% of intermediation revenues against 10.2% in the previous half year period.
SFN revenues on services provided increased 6.7% to R$23.8 billion, corresponding to 56.2% of administrative outlays, against 51.8% in the previous half-year period. Another factor that helped improve this indicator was the 1.4% reduction in administrative outlays in the half-year period. Of these, 46.3% referred to personnel and the remainder to other administrative expenditures.
The net profi ts of consolidated banking segment I expanded 14.1% compared to the previous six months, closing at R$17.8 billion. This result corresponded to 80% of SFN profi ts, against 86% in the previous half-year period. In this case, the heaviest concentration was found in national private banks, with 56%, while public sector banks accounted for 33.8% and foreign banks for 10.2%.
In the first half of 2006, the financial intermediation result posted by consolidated banking segment I member institutions increased R$2.4 billion, 5.4%, accounting for 95.6% of the SFN total. Just as in the case of net profi ts, these operations were concentrated in private national banks, 45.7%, up 1.4 p.p. compared to the previous half-year period. Foreign banks accounted for 23.7% or one percentage point more than in the previous half-year period, indicating a continued rise in the participation of this group. State-owned banks performed in precisely the opposite manner, as the participation of fi nancial intermediation declined 2.4 p.p. to 30.6%.
2.3.2 Operational costs and rate of return
Operational cost is found by dividing administrative outlays by the sum total of the result of fi nancial intermediation and revenues on services provided. In the fi rst half of 2006, this result declined slightly, remaining at practically the same level as in the half-year period ended in June 2005, with 58.5% followed by 60.7% in the six-month period ended in December 2005. More than the slight growth registered in fi nancial intermediation and service revenues, the improved performance of this indicator refl ects stability in administrative outlays, including a decline in personnel expenditures.
In the fi rst half of 2006, foreign banks registered the best results in terms of operational cost reductions. This segment generated the strongest growth in fi nancial intermediation
Net worthBanking-consolidated I by control type
15
23
31
39
47
55
Dec2004
Jun2005
Dec Jun2006
%
Government owned banks Domestic private banks Foreign banks
Net profit/loss – SFN
8
11
14
17
20
23
Dec2004
Jun2005
Dec Jun2006
R$ billion
0
6
12
18
24
30
%
Net profit/loss Growth rate
Net interest revenue – SFNGrowth rate
35
38
41
44
47
50
Dec2004
Jun2005
Dec Jun2006
R$ billion
0
3
6
9
12
15
%
Net interest revenue Growth rate
Administrative expenses and service charges
9
16
23
30
37
44
Dec2004
Jun2005
Dec Jun2006
R$ billion%
48
50
52
54
56
58
Administrative expensesService chargesCoverage ratio

38 | Financial Stability Report | November 2006
revenues (10.1%), coupled with the largest reduction in administrative outlays (3.1%). Consequently, this segment posted an operational cost reduction of 8.7 p.p. (59.6%). On the other hand, the segment of state-owned banks was the only one to register a reduction in intermediation revenues in absolute terms and, therefore, the highest operational costs among the three groups, with 65.9% against 67.8% in the previous half-year period. Finally, private national banks continued with the lowest operational costs in the SFN, with 49.6% compared to 53.1% in the previous half-year period.
With respect to consolidated banking segment I profi tability indices, the results were the best in the last fi ve years. Due mainly to excellent growth in net profi ts (14.1%), consolidated banking segment I annualized returns on net worth (RSPL) continued the 23.7% growth trend in the second half of 2005, moving to 24.9% in the fi rst half of 2006. The index that refl ects the ratio between net profi ts and assets (RSAT) also expanded, moving from 2.2% per year to 2.3% per year.
Among the various segments, public banks registered the highest level of profi tability over net worth in the fi rst half of 2006, registering 33.7% per year against 26.5% per year in the previous half-year period. This increase in profi tability was mainly due to the segment’s R$ 869 million creditor position under the Income Tax and Social Contribution, compared to a debtor position of R$ 2,233 million in the second half of 2005. Despite this, private national banks were still the most profi table in terms of assets, with 3% per year against 2.9% per year in the previous half-year period, clearly corroborating the positive outlook as regards the effi ciency demonstrated by the operational cost indicator. In foreign banks, however, improvement in the result of intermediation and the ratio of service revenues to administrative outlays did not generate growth in profi tability on net worth or on assets. Quite to the contrary, these indices reached 10.6% and 1% respectively, down 6 p.p. and 0.8 p.p. in the half-year period. In contrast to the public bank segment, the major cause of variations in profi tability among foreign banks were increased outlays on the Income Tax and Social Contribution with R$ 1,045 million or 529% in the half-year period.
When one considers the 50 largest banks, returns on assets closed at the same level as consolidated banking segment I, with 2.3%, practically identical to the 2.1% fi gure registered in the second half of 2005. Returns on net worth of the 50 largest banks increased from 24% to 25.4% and, once again, were driven by improvements in the profi tability of the 10 largest institutions, moving from 25.9% in the previous half-year period to 28%.
Net profit/lossBanking-consolidated I by control type
0
2
4
6
8
10
Dec2004
Jun2005
Dec Jun2006
R$ billion
Government owned banks Domestic private banksForeign banks
Net interest revenueBanking-consolidated I by control type
0
10
20
30
40
50
Dec2004
Jun2005
Dec Jun2006
%
Government owned banks Domestic private banks Foreign banks
Operating costs – SFN
55
57
59
61
63
65
Dec2004
Jun2005
Dec Jun2006
%
-10
-7
-4
-1
2
5
Operating costs Growth rate
Operating costs Banking-consolidated I by control type
48.0
54.4
60.8
67.2
73.6
80.0
Dec2004
Jun2005
Dec Jun2006
%
Government owned banks Domestic private banks
Foreign banks

November 2006 | Financial Stability Report | 39
2.4 Capital and limits
In order to bring its activities into line with the best international supervision practices, Bacen has closely followed the recommendations of the Basel Committee in that which concerns the setting of operational limits to be followed by SFN member institutions.
Among these, the major recommendations involve the Compatibility Limit of Base Capital (PR) with the degree of Asset, Liability and Clearing Account risk (Required Net Worth – PLE) and the Fixed Asset Limit.
2.4.1 Basel Capital Ratio
One of the major objectives of capital allocation is to ensure that institutions maintain suffi cient capital resources to protect them from situations of technical insolvency or, in other words, negative base capital, provoked by possible signifi cant and unexpected losses in assets exposed to risk, thus minimizing the risk to which creditors are exposed.
Current regulations determine that PR must be greater than PLE. In international terms, the ratio between these two variables is known as the Basel Capital Ratio. In the Brazilian case, banks must have a ratio above 11%13. To make this analysis more understandable, we will utilize this approach as the major analysis parameter.
This topic presents an analysis of the adequacy of SFN institutions and segments to the Basel Capital Ratio, from the perspective of PR and PLE evolution.
Evolution
In June 2006, the SFN Basel Capital Ratio was 18.3%, 7.3 p.p. above the minimum limit required in Brazil. In the previous 24 months, the ratio oscillated between 17.5% and 19%.
National Financial System PR reached R$219.7 billion, up 12.5% over the previous half-year period. Among the components, Tier I Capital expanded 9.4% and Tier II Capital
13/ Credit unions not affi liated to central credit unions must comply with a Basel Capital Ratio greater than 15% while, in the case of development agencies, the level is greater than 30%. The participation of these institutions is very small in both PR and PLE of the aggregate SFN.
Rate of return1/
Banking-consolidated I%
Itemization 2004 2005 2006
Dec Jun Dec Jun
Banks
Government owned
Return on
Equity 21.5 24.9 26.5 33.7
Assets 1.3 1.5 1.7 2.2
Domestic private
Return on
Equity 26.2 24.6 25.9 27.3
Assets 3.0 2.8 2.9 3.0
Foreign
Return on
Equity 6.1 8.6 16.6 10.6
Assets 0.8 1.0 1.8 1.0
Banking-consolidated I
Return on
Equity 19.4 20.4 23.7 24.9
Assets 1.9 1.9 2.2 2.3
1/ Annual taxes.
Return on assets – Banking-consolidated I1/
Top banks%
Itemization 2004 2005 2006
Dec Jun Dec Jun
Top 10 2.1 2.2 2.2 2.4
Top 20 1.9 2.0 2.2 2.2
Top 50 1.9 1.9 2.1 2.3
1/ Annual taxes.
Return on equity – Banking-consolidated I1/
Top banks%
Itemization 2004 2005 2006
Dec Jun Dec Jun
Top 10 23.3 24.2 25.9 28.0
Top 20 20.9 22.1 25.4 25.4
Top 50 20.0 20.9 24.0 25.4
1/ Annual taxes.

40 | Financial Stability Report | November 2006
increased 27.1%. As a result, the participation of Tier II Capital in PR increased 2.2 p.p. to a level of 19.8%.
With increases in all four components, the PLE of the SFN expanded 11.2% to a level of R$132.3 billion, compared to the previous half-year period.
Here, it is important to underscore growth of approximately 10% or R$ 10.5 billion in Assets Weighted by Risk (APR) and an increase of approximately 30% or R$1.1 billion in capital requirements for fi xed rate interest risk, compared to the half-year period ended in December 2005.
With respect to APR, the sharpest impact occurred under assets weighted at 100%, mainly as a result of practically identical growth in loan volume when the results for the last two half-year periods are compared.
Concentration of PR and PLE
In order to analyze the concentration of PR and PLE in the SFN, institutions were listed in decreasing order according to the amounts registered in each one of the PR and PLE components. Later on, participation levels were aggregated and then segregated among the 5, 10, 20 and 50 institutions with the largest amounts in each of the components.
In June 2006, slight alterations were registered in terms of concentration in these components, compared to the previous half-year period in all of the different brackets. At this point, one should highlight that:
a) under PR, increases of concentration were registered in all of the different brackets, particularly 1.9 p.p. growth in the bracket of the fi ve largest institutions. Tier II Capital remains the most heavily concentrated, with a reduction of 3.6 p.p. in the same bracket and stability in the others;
b) under PLE, small increases were registered in all of the different brackets with the strongest upturns among the 10 and 50 largest institutions, with 0.5 p.p. and the 0.3 p.p. As regards capital requirements for exchange risk, reductions occurred in all of the various brackets. Here, emphasis should be given to the 6.7 p.p. reduction in the bracket of the fi ve largest institutions, precisely that with the highest concentration.
Basel capital ratioSFN
17.5
17.8
18.1
18.4
18.7
19.0
Jun2004
Sep Dec Mar2005
Jun Sep Dec Mar2006
Jun
%
Evolution of capital base and required net worth1/
R$ million
Itemization 2005 2006 Half-year
Dec Jun change
Value % Value % %
Capital base 195 333 100.0 219 706 100.0 12.5
Tier I 161 127 82.5 176 232 80.2 9.4
Tier II 34 206 17.5 43 474 19.8 27.1
Required net worth 119 025 100.0 132 297 100.0 11.2
Assets 105 829 88.9 116 403 88.0 10.0
Interest rate 3 732 3.1 4 854 3.7 30.0
Exchange rate 6 583 5.5 7 861 5.9 19.4
Swap 2 881 2.4 3 181 2.4 10.4
1/ The required net worth represents the minimum capital base demanded by the Banco Central do Brasil.
Capital base and required net worth – Concentration1/
June, 2006%
Itemization Number of financial institutiions
5 10 20 50
Capital base 56.0 74.2 84.1 91.6
Tier I 50.6 69.4 81.1 90.0
Tier II 81.4 95.9 98.3 99.8
Required net worth 57.0 77.6 87.8 94.9
Assets 57.1 78.4 87.7 94.6
Interest rate 53.1 72.7 85.5 95.3
Exchange rate 84.5 95.1 98.4 100.0
Swap 62.5 82.8 95.8 99.8
1/ Participation of the financial institutions in the total of the SFN by item.

November 2006 | Financial Stability Report | 41
PR and PLE composition by segment
Composed of public sector banks, private banks and foreign banks, consolidated banking segment I registered a Basel Capital Ratio of 17.3%, down 0.1 p.p. compared to December 2005. This consolidated segment accounts for 79.2% of total PR and 83.8% of PLE, broken down as follows:
a) Public sector banks – Registered growth of 11% in PR and 13.2% in PLE, with a Basel Capital Ratio of 19.7%, corresponding to a reduction of 0.4 p.p. compared to December 2005. In the case of PR, Tier I Capital expanded 9.5% and Tier II Capital grew 15%. Consequently, the participation of Tier II Capital increased 1 p.p., rising to 28.2%. Evaluation of capital requirements at the component level shows a reduction of R$30 million exclusively in swaps and a larger absolute increase in APR, totaling R$2.2 billion, coupled with a sharper relative increase in exchange risk with 506.9% or R$620 million.
b) Private sector banks – Posted growth of 14.8% in PR and 14.6% in PLE, with a Basel Capital Ratio of 17%, the same level as in the previous half-year period. With regard to PR, Tier I Capital and Tier II Capital increased 11.2% and 34.8%, respectively. Consequently, the participation of Tier II Capital expanded 2.7 p.p., rising to 18.1%. In the case of PLE, there was a reduction in the component of swap credit risk and increases in the other components. The sharpest absolute growth occurred under capital requirements for assets weighted by risk, R$5.9 billion.
c) Foreign banks – Showed growth of 7.1% in PR and 8.7% in PLE, with a Basel Capital Ratio of 15.4%, refl ecting a reduction of 0.2 p.p. compared to December 2005. In PR, Tier I Capital rose 2% and Tier II Capital rose 75%. As a result, the participation of Tier II Capital expanded 4.4 p.p., reaching 11.3%. In PLE, the component of interest rate credit risk declined, while the other components increased. The largest absolute growth occurred under capital requirements for assets weighted by risk, R$1.3 billion or 5.8%.
Consolidated banking segment II – In June 2006, the Basel Capital Ratio of consolidated banking segment II reached 21.6%, up 3 p.p. compared to December 2005. This segment is responsible for 15.7% of total PR and 13.3% of National Financial System PLE.
Capital base – ComponentsJune, 2006
R$ million
Itemization No. Capital base BCR1/
Total Tier I Tier II
Total of the SFN 1 805 219 706 176 232 43 474 18.3
Banking
consolidated I 101 174 109 140 320 33 789 17.3
Banks
government
owned 12 48 392 34 760 13 632 19.7
domestic
private 56 87 935 72 041 15 894 17.0
foreign 33 37 782 33 519 4 264 15.4
consolidated II 32 34 648 25 101 9 547 21.6
consolidated III 1 395 5 617 5 545 72 33.8
Non-banking 277 5 332 5 266 66 31.8
1/ Basel capital ratio.
Required net worth – ComponentsJune, 2006
R$ million
Itemization Total Assets Interest Exchange Swap
rate rate
Total of the SFN 132 297 116 403 4 854 7 861 3 181
Banking
consolidated I 110 846 95 507 4 533 7 767 3 038
Banks
government
owned 26 955 25 079 874 743 259
domestic
private 56 895 47 805 2 054 6 316 720
foreign 26 996 22 624 1 605 708 2 059
consolidated II 17 606 17 177 210 86 133
consolidated III 1 829 1 759 70 0 0
Non-banking 2 016 1 959 40 7 9

42 | Financial Stability Report | November 2006
Consolidated banking segment III – In June 2006, the Basel Capital Ratio of consolidated banking segment III, composed of 1,395 credit unions, responsible for 2.6% of total PR and 1.4% of PLE, reached 33.8%, up 0.1 p.p. compared to the previous half-year.
Consolidated nonbanking segment – In June 2006, the Basel Capital Ratio of the consolidated nonbanking segment, composed of 277 institutions responsible for 2.4% of total PR and 1.5% of PLE, totaled 31.8%, down 5.8 p.p. compared to December 2005.
Noncompliance with Basel limits
On base date June 2006, 1,805 institutions were analyzed. Of this total, only 63 (3.5%) were noncompliant with Resolution 2099/1994. However, these institutions represent a very small share of overall SFN institutions. Capital infl ows of R$ 215.3 million, corresponding to less than 0.1% of the SFN’s total PR, would be required to offset the total defi ciencies of these institutions.
a) Consolidated banking segment I – No noncompliant institutions.
b) Consolidated banking segment II – No noncompliant institutions.
c) Consolidated banking segment III – Total of 55 noncompliant credit unions, compared to 43 in December 2005. The amount required to offset this defi ciency was R$37.8 million. The segment was responsible for 17.6% of total defi ciencies and for 87.3% of overall noncompliant institutions.
d) Consolidated nonbanking segment – Total of eight noncompliant institutions. The amount of capital required to offset the defi ciency was R$177.5 million. This segment accounted for 82.4% of total defi ciencies and 12.7% of noncompliant institutions
2.4.2 Fixed asset limit
The major objectives of this limit are to ensure that third party resources are not invested in fi xed assets and that institutions operate with a minimum percentage of their own capital. According to the terms of Resolution 2,669/1999,
Fixed assets to equity ratioSFN
25.0
25.7
26.4
27.1
27.8
28.5
Jun2004
Sep Dec Mar2005
Jun Sep Dec Mar2006
Jun
%
Evolution of capital base and fixed assetsSFN
35
75
115
155
195
235
Jun2004
Sep Dec Mar2005
Jun Sep Dec Mar2006
Jun
R$ billion
Capital Base Fixed Assets

November 2006 | Financial Stability Report | 43
the maximum level of commitment of Adjusted Base Capital (PRA) in relation to fi xed assets (AP) is 50%.
This topic presents an analysis of the adequacy of SFN institutions and segments to the Fixed Asset Limit, with emphasis on AP and PRA.
Evolution
In the period from June 2004 to June 2006, the Fixed Asset Ratio of the SFN segments registered slight growth of 0.7 p.p., with fl uctuations between 28% in January 2006 and 25.5% in April 2006, until reaching a level of 27.4% on the base date under analysis, corresponding to 22.6 p.p. leeway in relation to the maximum permitted by the regulations.
In the cases of AP and PRA, the components of this index in the 24 previous months posted increases of 38.5% and 35.6%, respectively. Small upward fl uctuations occurred in January 2006, with 6.8%, with downward fl uctuations in April 2006 under AP. In the case of PRA, the largest fl uctuations in the 24 previous months occurred in October 2005, with growth of 4.2% and a reduction of 0.7% in December 2004.
Composition of Permanent Assets and Adjusted Base Capital by segment
Consolidated banking segment I – In June 2006, the Fixed Asset Ratio of consolidated banking segment I reached 27.8%, down 0.8 p.p. compared to December 2005. This segment accounts for 79.2% of total National Financial System PRA and 80.2% of AP.
a) Public banks – Growth of 11% in PRA and Reduction of 3.7% in AP with a Fixed Asset Ratio of 17.1%, refl ecting a reduction of 2.6 p.p. to compared to December 2005.
b) Private Banks – Growth of 14.8% in PRA and 17.1% in AP, with a Fixed Asset Ratio of 37.3%, refl ecting an increase of 0.7 p.p. compared to December 2005.
c) Foreign Banks – Growth of 7% in PRA and 6.5% reduction in AP, with a Fixed Asset Ratio of 19.4%, corresponding to a reduction of 2.8 p.p. compared to December 2005.
Consolidated Banking Segment II – In June 2006, the Fixed Asset Ratio of Consolidated Banking Segment II reached 30.8%, up 8.7 p.p. compared to December 2005. This
Adjusted capital base and fixed assetsBanking system
Itemization Number Adjusted Fixed Fixed
of capital assets1/ assets to
institutions base1/ equity ratio2/
Dec Jun Dec Jun Dec Jun Dec Jun
Total of the SFN 1 817 1 805 194 219 52 60 26.7 27.4
Banking
consolidated I
Banks 104 101 155 173 44 48 28.6 27.8
government
owned 13 12 44 48 9 8 19.7 17.1
domestic
private 57 56 76 87 28 33 36.6 37.3
foreign 34 33 35 37 8 7 22.2 19.4
consolidated II 31 32 29 35 7 11 22.1 30.8
consolidated III 1 396 1 395 5 6 1 1 16.5 16.2
Non-banking 286 277 5 5 0 0 4.5 5.8
1/ R$ billion.2/ The maximum allowed is 50%.

44 | Financial Stability Report | November 2006
segment is responsible for 15.8% of total PRA and 17.7% of SFN AP.
Consolidated Banking Segment III – In June 2006, the Fixed Asset Ratio of Consolidated Banking Segment III, composed of 1,395 credit unions, responsible for 2.6% of total PRA and 1.5% of National Financial System AP, reached 16.2%, down 0.3 p.p. compared to December 2005.
Consolidated Nonbanking Segment – In June 2006, the Fixed Asset Ratio of the Consolidated Nonbanking Segment, which is composed of 277 institutions responsible for 2.4% of total PRA and 0.5% of National Financial System AP, closed at 5.8%, representing an increase of 1.3 p.p. compared to December 2005.
Noncompliance with the Fixed Asset Limit
On the base date under analysis, 94 (5.2%) of the 1,805 institutions evaluated had AP of more than 50% of PRA or, in other words, were noncompliant with this limit. To offset the total defi ciencies of these institutions, an insignifi cant amount of capital would be required, R$117.7 million (less than 0.1% of National Financial System PRA).
a) Consolidated banking segment I – There was one noncompliant institution, with a defi ciency of R$25.9 million to be offset, representing 22% of total defi ciencies and 1.1% of the number of noncompliant institutions.
b) Consolidated banking segment II – No noncompliant institutions.
c) Consolidated banking segment III – There were 71 noncompliant institutions, with R$24.9 million in deficiencies to be offset, reflecting 21.2% of total defi ciencies and 75.5% of noncompliant institutions.
d) Consolidated nonbanking segment – There were 22 noncompliant institutions with overall defi ciencies of R$66.9 million, accounting for 56.8% of total defi ciencies and 23.4% of noncompliant institutions.

November 2006 | Financial Stability Report | 45
2.5 Risks
2.5.1 Loan operations
In the fi rst six months of 2006, 99% of SFN credit operations were carried out by the banking system14 and the remaining 1% by the nonbanking system. Consolidated banking segment I, which is dominated by fi nancial institutions with commercial portfolios, accounted for 84% of the total banking system credit portfolio, compared to 83.3% in December 2005.
At the end of the fi rst half of 2006, the internal volume of SFN loan operations15 reached R$664 billion, up 8.7% compared to the previous half-year period. The ratio between overall SFN credits and GDP closed the period at 32.6%, against 31.4% last December. This ratio stood at 29% just one year ago. Growth in the loan operations of consolidated banking segment I accounted for 91.6%, or R$48.8 billion, of total growth in SFN loans in the half-year period. Loans to individual borrowers were the major drivers underlying this growth, particularly personal loans and auto loans. Aside from this, one must also stress the accounting impact of exchange variations in the fi rst half of 2006 – decline of 7.5% in the American dollar against the real – on the balance of operations denominated in foreign currency. According to data from the Central Bank Credit Information System (SCR), this balance reached R$61.3 billion at the end of June 2006.
Broken down by capital control, the volume of credits granted by private banks under national stock control reached R$ 257.9 billion in June 2006, raising the participation of consolidated banking segment I in the overall loan stock from 46.3% to 46.7%. Using the same base date, the volume of loans held by public sector banks totaled R$ 168.4 billion, with relative participation of 30.5% or 0.2 p.p. more than in the previous six months. Finally, foreign bank portfolios accounted for R$126.4 billion, as participation in the consolidated banking segment I loan total dropped from 23.6% to 22.9%.
The stock of credits granted by foreign agencies and subsidiaries of fi nancial conglomerates headquartered in Brazil increased 1.7% in the half-year period, reaching a total of R$37.2 billion last June. This fi gure represented a
14/ As defi ned in the item Concepts and Methodologies (Concept – Item “a”, page 73) 15/ As defi ned in the item Concepts and Methodologies (Methodology – Item “b”, page 73).
Credit operations – Domestic and abroadJune, 2006
R$ million
Itemization Domestic Abroad Eliminated1/ Consolidated
credit credit credit
operations operations operations
Total of the SFN 664 023 37 229 -12 870 688 383
Banking 657 553 37 229 -12 870 681 912
consolidated I
Banks 552 637 37 229 -12 870 576 997
government
owned 168 357 15 412 -5 587 178 182
domestic private 257 873 17 549 -6 910 268 512
foreign 126 407 4 268 - 372 130 303
consolidated II 94 095 0 0 94 095
consolidated III 10 820 0 0 10 820
Non-banking 6 471 0 0 6 471
1/ Eliminations of credit operations realized in the country and abroad between financial institutions owned by the same financial conglomerate.
Credit operationsConsolidated I by control type
90
124
158
192
226
260
Dec2004
Jun2005
Dec Jun2006
R$ billion
Government owned banks Domestic private banks
Foreign private banks
Top conglomerates/banksParticipation in the credit of the consolidated I
%
Itemization 2005 2006
Dec Jun
10 largest 84.0 84.0
20 largest 93.4 93.3
50 largest 98.9 99.0

46 | Financial Stability Report | November 2006
reduction in the participation of these resources in total SFN consolidated credit operations from 5.8% to 5.4%.
The stock of credit operations of the 10 largest fi nancial conglomerates included in consolidated banking segment I totaled R$464.2 billion in June 2006, with participation of 84% of the consolidated total, the same level as in December 2005. The share held by private banks increased 0.5 p.p., shifting from 31.1% to 31.6%, while the participation of foreign banks dropped from 20.4% to 20% and that of private national banks slipped from 48.5% to 48.4%. Analysis of the 50 largest fi nancial conglomerates indicates that the concentration level remained unchanged at 99%.
The volume of loans targeted to individual borrowers continued on the robust growth trajectory that marked the fi rst half of 2006, with 11.4% compared to 6.7% in the volume of loans held by corporate entities. As a result the overall participation of this sector increased from 43% to 44% of loans registered at the SCR. In terms of loan operation distribution, individual borrowers accounted for the same 93% level registered in December 2005. Corporate entities, in turn, were responsible for 56% of value and 7% of quantity. The increase in the participation of individual borrowers in total SFN loans refl ected a positive performance under personal loans, which accounted for 37.7% of growth in loans to individual borrowers. These operations mainly involved payroll-deducted loans, auto loans (21.5%), real estate loans (10.7%) and leasing operations (10.5%).
At the end of June 2006, consolidated banking segment I was clearly the most important within the overall SFN, accounting for 34.7% of loan operations in the bracket of R$5,000 to R$100,000, as well as 24.5% of the bracket from R$1 million to R$50 million. In December 2005, these brackets accounted for 33.9% and 24.8% of the segment’s loan operations. On the same date, public banks, which are also included in consolidated banking segment I, were heavily concentrated in the bracket from R$5,000 to R$100,000, with 43.7%. Among the various segments, the participation of private banks was the most balanced, with signifi cant participation in corporate operations, from R$1 million to R$50 million, with 28.9% for private national banks and 27% for foreign banks. In the case of consolidated banking segment II, in which the National Bank of Economic and Social Development (BNDES) accounted for 71.6% of the total, operations tended to migrate from the bracket above R$50 million to the bracket of R$1 million to R$50 million. This is evident in the fact that the participation of the fi rst bracket dropped from 50.5% to 46% while that of
Credit operationsIndividuals and legal entities participation
%
Itemization 2005 2006
Dec Jun
Quantity Loans and Quantity Loans and
leases leases
portfolio portfolio
Total 100.0 100.0 100.0 100.0
Individuals 93.2 43.8 93.3 44.8
Banking
consolidated I 81.0 39.2 90.7 41.3
Banks
government
owned 19.7 14.8 20.5 15.1
domestic private 39.6 15.6 45.0 16.9
foreign 21.7 8.7 25.1 9.3
consolidated II 10.2 2.8 0.2 1.7
consolidated III 1.2 1.3 1.5 1.4
Non-banking 0.9 0.4 0.9 0.4
Legal entities 6.8 56.2 6.7 55.2
Banking
consolidated I 6.5 42.2 6.4 41.9
Banks
government
owned 2.5 10.0 2.6 10.2
domestic private 3.1 22.0 3.0 22.0
foreign 0.9 10.2 0.9 9.7
consolidated II 0.2 13.2 0.2 12.5
consolidated III 0.1 0.3 0.2 0.3
Non-banking 0.0 0.6 0.0 0.5
Credit operations in value range%
Range (R$) Banking Non-
consolidated I consolidated II consolidated III banking
2005 2006 2005 2006 2005 2006 2005 2006
Dec Jun Dec Jun Dec Jun Dec Jun
Under 5
thousand 21.4 21.7 7.1 0.8 22.0 23.7 18.8 19.9
5 to 100
thousand 33.9 34.7 11.0 11.7 60.4 58.5 18.5 18.8
100 thousand
to 1 million 14.7 14.3 8.5 9.4 15.1 15.3 33.2 34.7
1 to 50
millions 24.8 24.5 22.9 32.1 2.5 2.5 24.9 22.8
Over 50
millions 5.1 4.9 50.5 46.0 0.0 0.0 4.6 3.8

November 2006 | Financial Stability Report | 47
the latter bracket rose from 22.9% to 32.1%. With respect to consolidated banking segment II, participation in the bracket of amounts below R$5,000 dropped from 7.1% to 0.8%, due mainly to reclassifi cation of one fi nancial institution very active on the retail market to consolidated banking segment I. No signifi cant alterations were registered in the distribution of loans by value brackets in the other SFN consolidated banking segments.
Operations written-off as losses16
The volume of credits written-off as losses in the SFN increased 6.2% in the fi rst half of 2006, moving from R$48.2 billion to R$51.2 billion. Despite this increase, the ratio of total losses to overall SFN loans dropped from 7.9% to 7.7% in the period. With the exception of consolidated banking segment II, which managed to reduce losses by R$1 billion, from R$5.6 billion to R$4.6 billion, the losses registered by the other segments increased. Here, for example, private national banks posted an increase of R$1.8 billion, while the losses registered by foreign banks increased R$1.3 billion. It is important to stress that the 27.8% growth in the volume of losses registered by consolidated banking segment III, which includes credit unions, was caused by a sharp increase in the number of institutions covered by the SCR as of June 2006. More specifi cally, these institutions increased from approximately 700 to about 1300 credit unions.
Joint liabilities17
The volume of joint liabilities expanded 19.6% between December 2005 and June 2006, posting a total of R$88.6 billion. Relative participation in the SFN loan portfolio rose from 12.1% in the previous period to 13.3%. Consolidated banking segment I accounted for 97.2% of the change in the volume of joint liabilities registered in the SCR, refl ecting growth of R$14.1 billion. Here, the highlights were national private banks, accounting for 72% of this increase or R$10.2 billion. Joint liabilities assumed in credit assignments, corresponding to 14.8% of overall SFN joint liabilities, increased 32.9% in the half year period, as against 17.6% growth in joint liabilities with guarantees. Strong growth in credit assignment operations with joint liabilities targeted
16/ For the updated historical series, see page 65.17/ For the updated historical series, see page 66.
Credit operations in value rangeConsolidated I by control type
%
Range (R$) Government Private
owned domestic foreign
2005 2006 2005 2006 2005 2006
Dec Jun Dec Jun Dec Jun
Under 5
thousand 23.0 22.4 20.6 21.2 20.8 21.8
5 to 100
thousand 43.0 43.7 29.4 30.2 31.0 32.0
100 thousand
to 1 million 14.1 13.6 15.2 14.8 14.6 14.0
1 to 50
millions 15.7 15.8 28.8 28.9 28.8 27.0
Over 50
millions 4.2 4.6 5.9 5.0 4.7 5.2
Write-offs – SFNR$ million
Itemization Write-offs Write-offs from
within 12 months 13 to 48 months
2005 2006 2005 2006
Dec Jun Dec Jun
Total of the SFN 16 656 18 368 31 500 32 782
Banking
consolidated I 15 102 16 964 26 290 28 096
Banks
government
owned 6 848 6 333 7 586 8 655
domestic private 4 730 6 176 11 490 11 820
foreign 3 525 4 455 7 214 7 621
consolidated II 1 060 756 4 518 3 876
consolidated III 143 194 211 258
Non-banking 352 454 482 552
Percentage1/ 2.7% 2.8% 5.2% 4.9%
1/ Percentage of write-offs in relation to the SFN's credit operations.

48 | Financial Stability Report | November 2006
mainly to large-scale fi nancial institutions is explained by the need for alternative sources of funding on the part of medium size institutions.
Largest SFN debtors
The balance of the active loan portfolios of the 100 largest SFN debtors increased 3.2% in the half-year period, moving from R$81.2 billion in December 2005 to R$ 83.8 billion in June 2006. With this performance, which was well below growth in overall SFN loan operations in the same period of time, the share of total SFN loan operations held by the 100 largest clients dropped from 13.3% to 12.6%.
Average provisions for the group of the 100 largest SFN debtors dropped 0.3 p.p. in the fi rst half of 2006, moving from 3.2% to 2.9%. This result contrasted sharply with the behavior of average overall SFN provisions, which increased 0.4 p.p., moving from 6.4% to 6.8%, compared to the December 2005 position. Taken together, consolidated banking segment II and national private banks accounted for 71% of total credits held by the 100 largest SFN debtors.
The distribution of this group into debt brackets indicates strong growth in the balances held by the 51st to 100th largest debtors, with expansion of 9.3% in the half-year period, representing approximately 85% of the total growth registered by this group. In terms of average provisions, the bracket between the 11th and 20th largest debtors showed the greatest discrepancy, as the indicator rose 5.1 p.p., moving from 1% in December 2005 to 6.1% at the end of June 2006.
Distribution of the 100 largest debtors by economic sector
Following the example of previous half-year periods, the sector of electricity generation and distribution held the largest debt balance with 22% of the group’s total active loan portfolio, for a reduction of 2 p.p. compared to December 2005. Other leading sectors in the half-year period were telecommunications, with 11.6% of the group, and paper and pulp production, with 6.8%. The performance of these two sectors represented a reduction of 1.5 p.p. in the group’s overall participation in the fi rst case and an increase of 1.3 p.p. in the latter, compared to December 2005. As far as average provisions of these sectors are concerned, within the group analyzed, public administration, defense and social security and land transportation were the economic sectors
Joint liabilities – SFNR$ million
Itemization Endorsements Joint liabilities with
and sureties credit garanted
2005 2006 2005 2006
Dec Jun Dec Jun
Total of the SFN 64 207 75 502 9 844 13 081
Banking
consolidated I 62 167 73 601 9 687 12 374
Banks
government
owned 9 482 12 179 341 367
domestic private 32 418 40 001 8 912 11 551
foreign 20 267 21 421 435 456
consolidated II 558 833 9 8
consolidated III 952 1 022 8 11
Non-banking 529 45 139 689
Percentage1/ 10.5% 11.3% 1.6% 2.0%
1/ Percentage of joint liabilities in relation to the SFN's credit operations.
Largest debtorsR$ billion
Debtors 2005 2006
Dec Jun
Portfolio1/ Debt2/ Average3/ Portfolio1/ Debt2/ Average3/
100 largests 81.2 95.9 3.2 83.8 101.0 2.9
1º - 10º largest 21.3 25.2 0.5 21.1 26.0 0.4
11º - 20º largest 12.3 13.5 1.0 11.9 13.6 6.1
21º - 50º largest 24.1 29.5 6.7 25.0 28.2 4.3
51º - 100º largest 23.6 27.7 3.2 25.8 33.1 2.0
Total SFN 610.7 732.9 6.4 664.2 803.8 6.8
1/ Loans and lease operations. 2/ Portfolio + joint liabilities + write-offs.3/ Average provision – % (portfolio).

November 2006 | Financial Stability Report | 49
with the highest risk levels, registering average provisions of 18% and 20.3%, respectively.
Classifi cation of loan operations
Analysis of loan operation risk classifi cation distribution between December 2005 and June 2006 showed a drop in the participation of levels AA and A from 25.3% to 24.6% and from 38.1% to 37.3%, respectively. In contrast, the participation of levels B and C increased from 16.6% to 17.4% and from 10% to 10.3%, in the same order. Another important shift was the 0.5 p.p. rise in the participation of loan operations classifi ed under levels E-H, with 7% of total SFN credits, the highest level registered among the various base dates analyzed.
With the changes that occurred in credit operation risk classifi cations, the minimum provision to be set aside by SFN fi nancial institutions rose 0.4 p.p., from 5.6% in December 2005 to 6% last June, according to the parameters defi ned in Resolution 2,682/1999.
With respect to credit operations granted by branches abroad, the total came to R$21.5 billion at the end of June 2006. Distribution by risk level refl ected moderate growth in the half-year period, with 64.5% at level AA, 35.1% at levels A-C and 0.3% at levels E-H. The minimum provision required for these operations remained stable at 0.4% compared to the previous period.
Migration matrix and loan classifi cation
The analysis of the migration matrix is not included in this report. The reason for this is that the database of the former Risk Center (CRC), which was discontinued in December 2005, was replaced by the new SCR. This process required alterations in the migration matrix calculation methodology, which is now being refi ned.
Delinquency
The delinquency analysis covers operations considered fully matured or, in other words, operations with arrears of more than 90 days. In this context, the volume of delinquent credits in the SFN reached R$24.7 billion at the end of June 2006, for an increase of approximately 12%, or R$2.7 billion compared to December 2005. The delinquency indicator,
Credit operations by levels of risk – SFN%
Levels of risk 2004 2005 2006
Dec Jun Dec Jun
AA 24.3 23.2 25.3 24.6
A 36.9 38.2 38.1 37.3
B 18.5 18.5 16.6 17.4
C 9.8 10.1 10.0 10.3
D 4.1 4.1 3.5 3.4
E 1.3 1.2 1.3 1.5
F 0.9 0.9 1.0 1.0
G 0.8 0.9 0.9 1.0
H 3.4 3.0 3.3 3.5
Total 100.0 100.0 100 100.0
Largest debtorsBanks by control type
R$ billion
Itemization 2005 2006
Dec Jun
Portfolio1/ Debt2/Average3/ Portfolio1/ Debt2/ Average3/
100 largests 81.2 95.9 3.2 83.8 101.0 2.9
Banking
consolidated I 45.9 59.9 0.9 48.5 65.1 0.5
Banks
government
owned 10.3 10.7 1.4 12.5 13.0 0.9
domestic
private 24.3 32.5 0.9 25.1 35.8 0.5
foreign 11.3 16.7 0.4 10.9 16.3 0.2
consolidated II 34.7 35.2 6.3 34.4 34.9 6.3
consolidated III - - - - - -
Non-banking 0.5 0.7 0.8 0.9 1.1 0.5
1/ Loans and lease operations.2/ Portfolio + joint liabilities + write-offs.3/ Average provision – % (portfolio).

50 | Financial Stability Report | November 2006
ratio between the credit stock in arrears and total SFN credits, remained stable at 3.6%. It is important to stress that the default rate in consolidated banking segment II dropped from 2.5% to 0.9%, a reduction of R$1.4 billion. This decrease was concentrated under BNDES operations and clearly impacted the delinquency rate for the SFN as a whole, offsetting growth in this indicator for national private banks, from 3.5% to 4%, and for foreign banks, from 3.5% to 4.1%.
Provisions
The balance of provisions set aside by fi nancial institutions to offset nonperforming loans totaled R$46.8 billion at the end of June 2006, an increase of 15.3% compared to the December 2005 balance. The ratio between overall provisions and total SFN credit operations increased 0.4 p.p. in the period, shifting from 6.4% in December 2005 to 6.8% last June. Public sector banks, included under consolidated banking segment I, were the institutions that had the greatest impact on this result, accounting for 41.6% of the increase in SFN provisions. This result refl ected 0.6 p.p. growth in the indicator for this group, followed by private national banks, with 32.6% of the increase in SFN provisions and a rise of 0.3 p.p. in the ratio of provisions set aside to the credit portfolio of the segment.
Provisions set aside/minimum provision
Calculated on the basis of credit operation risk classifi cation, the ratio between the indicators of provisions set aside and minimum provisions demonstrates that overall SFN provisions at the end of the fi rst half of 2006 were 13.3% greater than the minimum provision required by Resolution 2,682/1999, compared to 14.3% in the previous half-year period. Private national banks took the most conservative position, with provisions 29.2% greater than the minimum requirement. In contrast, the non-banking segment had the worst ratio with less than 18%.
2.5.2 Exposure in foreign currencies and gold
Evolution of net exposure in the basket of currencies of SFN member institutions in the period extending from January to June 2006 is shown below. This analysis does not include BNDES data, since that institution would be considered
Largest debtors – Economic sectors100 largest debtors – June, 2006
R$ billion
Itemization Portfolio1/ Debt2/ Average3/
Total – 100 largest debtors 83.8 101.0 2.9 Total – 20 biggest sectors 73.3 86.9 2.8 Eletric energy production and distribution 18.5 19.6 0.6 Telecommunication 9.7 12.1 0.4 Cellulose, paper and paper products
manufacturing 5.7 7.7 0.3 Production of vehicles, pickups and
utilitarians 5.5 7.7 1.2 Public administration, defense and
social security 5.5 5.5 18.0 Non-specialized retailing 4.2 4.9 0.3 Overland transportation 3.7 3.8 20.3 Production of resins and elastomers 2.5 2.8 0.5 Slaughter and preparation of meat and
fish products 2.2 3.1 0.4 Financial intermediation, excluding
insurance and private pension plan 2.1 4.2 0.4 Production of tobacco products 1.9 1.9 0.4 Aircraft manufacturing, assembling
and repairing 1.7 1.9 0.2 Siderurgy 1.7 2.0 0.2 Personal care and home care whosesale 1.5 1.5 0.5 Production of organic chemistry products 1.3 1.6 0.4 Extraction of metallic ores 1.3 1.6 0.2 Metallurgy of non-iron metals 1.3 1.4 0.0 Trucks and buses production 1.1 1.1 0.2 Crude oil - extraction and correlated
activities 1.0 1.2 0.3 Auxiliary activities to transportation and
travel agencies 1.0 1.0 0.2 Others 10.5 14.2 3.7
1/ Loans and lease operations.2/ Portfolio + joint liabilities + write-offs.3/ Average provision – % (portfolio).
Default/credit operationsConsolidated I by control type
2.9
3.2
3.5
3.8
4.1
4.4
Dec2004
Jun2005
Dec Jun2006
%
Government owned banks Domestic private banks
Foreign private banks

November 2006 | Financial Stability Report | 51
atypical for this type of analysis. The data were elaborated in aggregate form and grouped by segment. Information from July and August 2006 were considered only when relevant facts occurred.
The highlights of the period were as follows:
a) increased net exposure mainly in dollars among institutions holding short positions. This increase was caused primarily by three institutions from the national private segment and was particularly strong in July and August 2006;
b) increase in the overall volumes of both long and short positions of the basket, with the dollar representing 92% in both positions;
c) reduction in the use of the prerogative of considering part of net worth as a short position, principally in the segment of private foreign institutions, with the consequent reduction in net long exposure.
Net exposure in the basket of currencies
Expressed in real, net exposure of the basket of currencies registered a short position during the entire half-year period, with an average of R$8.2 billion, well above the short position registered in the previous period, R$41.2 million. The sharpest growth occurred in January and April, with expansion from R$1.5 billion in the short position on January 2, 2006 to R$11 billion short on June 30, 2006. The highest exposure level reached R$12.9 billion on May 29, 2006. The major currency in the basket was the United States dollar, with 87.2%.
Expressed in dollars, the same exposure showed an average short position of US$3.8 billion, a figure significantly higher than the US$20.3 million short position posted in the previous period. Exposure increased US$3.8 billion, moving from US$1.3 billion on January 2, 2006 to US$5.1 billion on June 30, 2006.
In the fi rst two months of the year, the rate of exchange of the real against the dollar dropped from R$2.33/US$ on January 2, 2006 to R$2.11/US$ on March 3, 2006. From that point forward through May 5, the rate declined steadily, albeit at a considerably less intense pace than in the fi rst two months of the year, falling to R$2.05/US$, the low point of the period. In the same month, the rate of exchange of the real against
Provision/credit operationsConsolidated I by control type
4
5
6
7
8
9
Dec2004
Jun2005
Dec Jun2006
%
Government owned banks Domestic private banks
Foreign private banks
Constituted provision versus required provision1/
%
Itemization 2005 2006
Dec Jun
Provision Provision
constituted required2/ constituted required2/
Total of the SFN 6.4 5.6 6.8 6.0
Banking
consolidated I 6.3 5.5 6.8 6.0
Banks
government
owned 8.1 7.5 8.7 8.2
domestic private 5.9 4.6 6.2 4.8
foreign 4.8 4.6 5.6 5.3
consolidated II 6.5 6.1 6.5 5.8 consolidated III 5.0 4.5 5.4 5.0
Non-banking 12.7 11.4 9.1 11.1
1/ Comparison between constituted provision percentage and required provision percentage. 2/ By classification (Res. 2.682/99-Bacen).

52 | Financial Stability Report | November 2006
the dollar rose sharply once again, reaching R$2.39/dollar on May 24, the highest level of the period.
The rate of exchange of the real against the euro accompanied changes in the dollar rate, dropping sharply in the fi rst two months of the year from R$2.76/euro on January 2, 2006 to R$2.52/euro on February 17, the lowest level of the period. The highest rate in the period was R$3.03/euro on May 24, 2006, coinciding with the date of the sharpest rise in the rate of the real against the dollar.
Viewed separately, the net exposures of institutions in long and short positions in the basket followed the same tendency in effect at the end of the previous half-year period, registering a reduction in long exposure and growth in short exposure. This trend was more intense in the fi rst two months of the year, as the net exposure of institutions holding short positions increased US$2.5 billion, moving from US$4.1 billion on January 2, 2006 to US$6.6 billion on February 17, 2006. In the fi rst half of 2006, total growth in the net exposure of institutions holding short positions reached US$2.4 billion, closing the period with US$6.5 billion. In the same period, net exposure of institutions with long positions declined to US$ 1.4 billion, dropping from US$2.8 billion to US$1.4 billion.
The increase in the net exposure of institutions holding short positions was heavily concentrated in three institutions from the private national segment. This was the major determining factor underlying growth in the net short exposure of the basket in the period. In a less relevant manner, the reduction in net long exposure was concentrated in one institution from the foreign segment and two from the national private segment. This performance also contributed to the behavior of net exposure.
Volume of long and short positions in the basket of currencies
Particular mention should be made of the strong increase in the volumes of long and short positions in the basket of currencies in the fi rst half of 2006, moving from US$153.6 billion to US$177.2 billion and from US$ 154.9 billion to US$182.3 billion, respectively, with peaks always toward the end of each month. The average values were US$179.2 billion and US$183 billion, both of which were greater than the average values registered in the previous period: US$159.6 billion and US$159.7 billion. In absolute terms, the US$27.4 billion increase in the short position was
Default versus constituted provision1/
%
Itemization 2005 2006
Dec Jun
Default Provision Default Provision
constituted constituted
Total of the SFN 3.5 6.4 3.6 6.8
Banking
consolidated I 3.6 6.3 4.0 6.8
Banks
government
owned 3.9 8.1 3.9 8.7
domestic private 3.5 5.9 4.0 6.2
foreign 3.5 4.8 4.1 5.6
consolidated II 2.5 6.5 0.9 6.5 consolidated III 2.0 5.0 2.5 5.4
Non-banking 8.4 12.7 10.1 9.1
1/ Comparison between default percentage and constituted provision percentage.
Net exposure
-14.0
-10.4
-6.8
-3.2
0.4
4.0
7.7 2005
8.17 9.28 11.10 12.22 2.1 2006
3.16 4.28 6.9 7.21 8.31
Billion
R$ US$
Exchange rate for dollar and euro
2.00
2.22
2.44
2.66
2.88
3.10
7.7 2005
8.17 9.28 11.10 12.22 2.1 2006
3.16 4.28 6.9 7.21 8.31
R$/US$
Dollar Euro

November 2006 | Financial Stability Report | 53
US$3.8 billion greater than the US$23.6 increase in the long position. As mentioned in the previous item, this was the factor responsible for changes in the net exposure of the basket. The dollar accounted for 92% of both long and short positions during the period.
Starting in early July, the volume of these positions increased steadily through the end of August. Average long and short positions in the July-August period were US$182.1 billion and US$187.4 billion, respectively, with respective peaks of US$201.1 billion in the long position and US$206.1 billion in the short position, both on August 30, 2006.
Net exposure of the basket of currencies
In terms of net exposure, changes occurred in the profi le of the basket of currencies. Differently from the previous period, when the euro accounted for the major share with an average of 51.3%, participation of the dollar rose from 43.7% in the previous period to 87.2% in the half-year period under analysis. Not only did total value remain short, but even increased during the period, rising US$3.7 billion, from US$1.9 billion to US$5.6 billion.
The percentage of net exposure in euro, 10.6%, fell sharply when compared to the previous half-year period, 51.3%. Total value was always long, with an average of US$492 billion compared to US$467 billion in the second half of 2005.
Starting in early July, net short exposure in dollars rose sharply through August, reaching US$6.8 billion on July 26, 2006. The average in that month was US$6.1 billion.
Practically the entirety of net exposure in the basket was composed of dollars and euros, with an average of 97.8%, slightly more than in the previous period, 95%. The yen, gold, pound and franc accounted for an average of just 2.2% in the basket, with average net short exposures of US$47.4 billion, US$14.1 million, US$12.3 billion and US$6.2 million, respectively.
When one analyzes institutions with net long exposure compared to those with net short exposure separately, in terms of dollars and euros, the tendency registered toward the end of the previous period intensifi ed. Starting in January, long exposures in dollars declined, while short exposures rose sharply. Net exposures in euro remained stable. The alterations with the largest volume occurred under net short exposure in dollars, with US$2.5 billion,
Volume of currency basket's positions
140
154
168
182
196
210
7.7 2005
8.17 9.28 11.10 12.22 2.1 2006
3.16 4.28 6.9 7.21 8.31
US$ billion
Long Short
Net exposure – Currencies of currency basket
-8
-6
-4
-2
0
2
7.7 2005
8.17 9.28 11.10 12.22 2.1 2006
3.16 4.28 6.9 7.21 8.31
US$ billion
Dollar Euro Yen Pound Gold Franc
Currency basket´s composition – Comparison of the twolast semesters
%
Currencies Average 2nd Accrued Average 1st Accrued
semester semester
of 2005 of 2006
Euro 51.3 51.3 10.9 10.9
Dollar 43.7 95.0 86.8 97.8
Yen 3.0 98.0 1.3 99.1
Pound 1.2 99.2 0.5 99.6
Franc 0.2 99.4 0.1 99.7
Gold 0.6 100.0 0.3 100.0
Net exposure – Long and short in currency basket
-8.0
-5.6
-3.2
-0.8
1.6
4.0
7.7 2005
8.17 9.28 11.10 12.22 2.1 2006
3.16 4.28 6.9 7.21 8.31
US$ billion
Short Long

54 | Financial Stability Report | November 2006
moving from US$4.5 billion on January 2, 2006 to US$7 billion on June 30, 2006.
Net exposure in currencies not included in the basket
The net average exposure of currencies not included in the basket was US 249.9 million. On average, this exposure represented 5.5% of the net exposure of the basket and remained in a long position during the entire period.
Net exposure in the basket by segment
In the period extending from January 2 to June 30, 2006, the segment of private national banks registered the highest average net exposure in the period, with a US$4.4 billion short position in the basket, well above the US$2.7 billion fi gure for the previous period. This tendency toward growth in the short position had already been noted as of December of the previous period.
On the other hand, the segment of foreign banks registered the second highest average net exposure in the basket of currencies. In this case, the segment held a long position with a tendency toward decline. This average came to US$710.7 million or less than the US$2.3 billion position of the previous period.
More specifi cally, the tendency toward decline in the long position in the net exposure of foreign banks, mentioned in the previous paragraph, shifted into a short position as of early July, remaining there during practically all of July and August, with an average of R$199.2 million.
Following the example of the previous period, the segment of public banks began the half-year period with net long exposure. The average through March 24, 2006 was US$141.4 million. Starting at that point, net exposure reversed course and shifted into a short position. The average for the April-June period was US$309.1 million.
Between January and June 2006, the PL-Short of the foreign bank segment declined from US$1.9 billion to US$928 million, with an average of US$1.6 billion. This reduction was strongly concentrated in two institutions, one of which was later acquired by a conglomerate from the private national segment.
Currency basket´s composition – Net exposures
0
20
40
60
80
100
7.7 2005
8.17 9.28 11.10 12.22 2.1 2006
3.16 4.28 6.9 7.21 8.31
%
Dollar Euro Yen Pound Gold Franc
Net exposure – Long and short dollar and euro positions
-9.0
-6.2
-3.4
-0.6
2.2
5.0
7.7 2005
8.17 9.28 11.10 12.22 2.1 2006
3.16 4.28 6.9 7.21 8.31
US$ billion
Dollar long Dollar short Euro long Euro short
Net exposure by segment
-6.0
-4.2
-2.4
-0.6
1.2
3.0
7.7 2005
8.17 9.28 11.10 12.22 2.1 2006
3.16 4.28 6.9 7.21 8.31
US$ billion
Government owned Domestic private Foreign
Foreign banks segment
-1.3
-0.4
0.5
1.4
2.3
3.2
7.7 2005
8.17 9.28 11.10 12.22 2.1 2006
3.16 4.28 6.9 7.21 8.31
US$ billion
Net exposure Net exchange rate exposure

November 2006 | Financial Stability Report | 55
With respect to the segment of national private banks, the PL-Short also declined in the period, dropping from US$348.7 billion to US$265.7 billion, with an average of US$265.7 billion or considerably less than the US$497.3 billion position in the previous period.
Therefore, institutions from both segments diminished utilization of the right to consider part of their net worth as a short position, particularly in the case of the foreign private segment which sharply reduced its long position.
Consequently, the tendency evident toward the end of the previous period was confi rmed, with simultaneous increases in the short position of banks from the private national segment and a reduction in the long position of foreign banks. In this way, one can explain the strong growth in the net exposure of the basket during the entire fi rst half of 2006.
Volume of long and short positions in the basket by segment
Despite the fl uctuations that occurred, all segments posted sharp increases in their positions during the period, with the exception of public banks which posted less substantial increases.
The segment of private national banks posted the largest increases under both long and short positions. Long positions increased US$10.4 billion, moving from US$60.3 billion to US$70.7 billion in the fi rst half of 2006, while short positions rose US$12 billion, shifting from US$63 billion to US$75 billion in the same period. The fact that the increase in short positions was greater than the increase in long positions explains the reduction in the net long exposure of the segment during the period under consideration.
Mention should also be made of positive growth in the average long and short positions of foreign banks, compared to the previous six-month period. In average terms, the volume of long positions increased US$6.9 billion, rising from US$71.2 billion in the second half of 2005 to US$78.1 billion in the fi rst half of 2006. The volume of short positions increased US$8.4 billion, moving from US$68.9 billion to US$77.3 billion in the same period.
Domestic private banks segment
-6.0
-4.6
-3.2
-1.8
-0.4
1.0
7.7 2005
8.17 9.28 11.10 12.22 2.1 2006
3.16 4.28 6.9 7.21 8.31
US$ billion
Net exposure Net exchange rate exposure
Short net exposure by segment
-7 000
-5 600
-4 200
-2 800
-1 400
0
20057.7 8.17 9.28 11.10 12.22
20062.1 3.16 4.28 6.9 7.21 8.31
US$ million
Domestic private Foreign Government owned
Net long exposure by segment
0.0
0.7
1.4
2.1
2.8
3.5
7.7 2005
8.17 9.28 11.10 12.22 2.1 2006
3.16 4.28 6.9 7.21 8.31
US$ billion
Government owned Domestic private Foreign
Volume of positions by segment
20
38
56
74
92
110
7.7 2005
8.17 9.28 11.10 12.22 2.1 2006
3.16 4.28 6.9 7.21 8.31
US$ billion
Foreign long Foreign short
Domestic private long Domestic private short
Government owned long Government owned short

56 | Financial Stability Report | November 2006
SFN concentration
On January 2, 2006, 121 institutions provided information to the Central Bank of Brazil regarding their exchange exposure, as required by current regulations. Of this total, 86 belonged to the banking macrosegment and 35 belonged to the non-banking segment. A breakdown of the institutions that provided information shows that 74 belong to the private national segment, 38 to the foreign segment and 9 to the segment of public banks. On June 30, 2006, the number of informing institutions did not change. The only alteration between the two dates involved distribution of the institutions, with 85 belonging to the banking macro segment and 36 to the nonbanking macro segment. On the other hand, the segment of private national banks showed 75 institutions, with 37 in the segment of private foreign banks. No changes occurred in the segment of public banks.
Among SFN institutions, the concentration of the volume of long positions in the basket remained constant from January 2 to June 30, 2006. Five institutions accounted for an average of 55% of the total. When the 10, 20 and 30 institutions with the largest positions are analyzed, they accounted for 75%, 93% and 98%, practically equivalent to the results registered in the previous period.
Institutions with net long exposure showed greater concentration and fl uctuations. The average percentages in this case were 75%, 89%, 97% and 99% for the 5, 10, 20 and 30 institutions with the largest exposures. These percentages were also quite close to those posted in the previous period.
Institutions with net short exposures were even more concentrated and registered sharper fluctuations. The average percentages in this case were 92%, 98%, 99% and 100% for the 5, 10, 15 and 20 institutions with the largest exposures. These results were slightly higher than those of the previous period.
The graph “Analysis of net short positions” shows that the sum total of the net exposure of institutions with short positions increased during the entire period. The average for the period was 296.3% of the sum total of net exposure of the institutions holding long positions, compared to 101.9% in the previous period. This period is calculated as having begun on January 2, 2006, with 144.4%, closing on June 30, 2006, with 463.6%.
Average of volumes by segment US$ billion
Itenization 2nd semester of 2005 1st semester of 2006Long Short Long Short
Foreign 71.2 68.9 78.1 77.3
Domestic private 60.3 63.0 70.7 75.0
Government owned 28.3 28.0 30.8 30.9
Financial institutions concentration by long positions volume
45
56
67
78
89
100
9.12005
10.11 11.22 12.29 2.62006
3.17 4.27 6.6 7.14 8.22
%
5 FIs 10 FIs 20 FIs 30 FIs 50 FIs
Concentration of financial institutions with long net exposure
60
68
76
84
92
100
9.12005
10.11 11.22 12.29 2.62006
3.17 4.27 6.6 7.14 8.22
%
5 FIs 10 FIs 20 FIs 30 FIs 50 FIs
Concentration of financial institutions with short net exposure
84.0
87.2
90.4
93.6
96.8
100.0
9.12005
10.11 11.22 12.29 2.62006
3.17 4.27 6.6 7.14 8.22
%
5 FIs 10 FIs 15 FIs 20 FIs 25 FIs

November 2006 | Financial Stability Report | 57
The average percentage of the number of institutions with net short exposure compared to overall SFN institutions that provided information on their exposure to the Central Bank was 31.6%, compared to 25.7% in the previous period. This means that both the number of institutions with short positions and the sum total of exposures increased sharply. One should also stress that the increase in net short exposure was heavily concentrated in just three institutions from the private national segment.
This position intensifi ed even further as of July 2006 through August 2006, as the sum total of net exposure of these institutions peaked at 829% on August 11. The average of the two-month period came to 497%. This peak was caused by strong growth in net short exposure of institutions from the foreign segment on that date.
2.6 Stress scenarios
Stress scenarios are simulations designed to assess capital adequacy in relation to the Basel capital ratio on a specifi ed date, in situations of unexpected losses or, in other words losses not covered by provisions. In this way, one measures the capacity of the PR of SFN banking institutions to withstand changes in PLE caused by signifi cant fl uctuations in credit, exchange rate and fi xed interest risks. PLE is a measuring rod of system risk, since the risks and their proportions are taken into account in its calculation.
Based on the results of these impacts, two major points are analyzed: a) whether institutions would fi nd themselves in situations of technical insolvency or, in other words, negative net worth; and b) whether there is a need for further capitalization of these institutions in order to continue operating within the parameters of the Basel limits.
These scenarios were not applied to all institutions, since the Central Bank does not obligate all of them to remit such information. The exceptions are institutions that operate below a certain minimum limit, since risk in this case would be negligible, and institutions that do not have credit portfolios.
For purposes of analysis, four stress scenarios were constructed considering fluctuations in fixed interest rates and exchange rates and downgrading in the risk classifi cation of credit operations viewed either individually or simultaneously. Data from end-June 2006 were used in this analysis.
Analysis of financial institutions with short net exposure
15
182
349
516
683
850
7.7 2005
8.17 9.28 11.10 12.22 2.1 2006
3.16 4.28 6.9 7.21 8.31
%
$ short Number of institutions
Stress scenariosNumber of financial institutions and conglomerates
Itemization Exchange or interest rate Credit risk
A1/ B2/ A1/ B2/
Banking
consolidated I 83 18 97 4
Banks
government owned 10 2 12 0
private 73 16 85 4
domestic 42 14 54 2
foreign 31 2 31 2
consolidated II 16 16 26 6
Total 99 34 123 10
1/ Number of institutions included in the stress test.2/ Number of institutions not included in the stress test.

58 | Financial Stability Report | November 2006
Based on data drawn from accounting, exchange exposure and fi xed interest rate exposure, the results and respective tax effects were calculated for each scenario and PR, PLE and the Basel capital ratio were recalculated.
2.6.1 Universe analyzed
One hundred and thirty three banking institutions (consolidated banking segments I and II) were chosen for purposes of application of the stress scenarios. Of this total, 128 had information in at least one of the factors analyzed, with 99 submitting information on market risk (interest and/or exchange) and 123 on credit risk.
2.6.2 Credit risk stress
The objective of credit risk stress is to measure the impact of deterioration in fi nancial institution loan portfolios on capital adequacy levels.
For purposes of this stress, balance sheet data are used – classifi ed portfolio – and the classifi cations of all of the fi nancial institution’s clients are downgraded two levels. The new classifi cation is then utilized to obtain a new level of required provisions. One then subtracts current provisions from this result in order to arrive at the required increase in provisions. Following that, the effect of the increase in provisions is calculated taking due account of the impact of tax credits on PLE and PR. The impact on the Basel capital ratio is then calculated.
2.6.3 Interest and exchange rate stress
The selected scenario was that which registered the largest result between calculations based on two risk models, Value-at-Risk (VaR) (parametric model) and the hybrid model (nonparametric model).
The upward scenario consisted of: a) increase of R$0.4664/US$ in the rate of exchange, moving from R$2.1643/US$ to R$2.6307/US$; and b) alteration in the forward interest rate futures structure with an increase of 5.83 p.p. for vertices of 21, 42, 63 and 126 days; 5.91 p.p. for the vertex of 252 days; and 5.64 p.p. for vertices of 504 and 756 days.
The downward scenarios showed: a) drop of R$0.2985/US$ in the rate of exchange, moving from US$2.1643/US$ to R$1.8658/US$; and b) alteration in the forward interest rate
Stress test – Initial situationJune, 2006
Itemization Basel capital ratio ranges
Lower than 11 Higher than 11 Total
Banking consolidated I Banks government owned Number of institutions - 12 12 Basel capital ratio (%) - 19.7 19.7 domestic private Number of institutions - 56 56 Basel capital ratio (%) - 17.0 17.0 foreign Number of institutions - 33 33 Basel capital ratio (%) - 15.4 15.4
consolidated II Number of institutions - 32 32 Basel capital ratio (%) - 21.6 21.6
Total Number of institutions - 133 133 Basel capital ratio (%) - 17.9 17.9

November 2006 | Financial Stability Report | 59
futures structure with a reduction of 3.22 p.p. for the vertices of 21, 42, 63 and 126 days; 3.17 p.p. for the vertex of 252 days and 3.48 p.p. for the vertices of 504 and 756 days.
As far as PLE is concerned, the results of rate fl uctuations were considered only in the value of requirements for market risk (interest + exchange), without changing APR. In the case of PR, the fi nancial effect of exchange variations on net exposure and of interest rate fl uctuations on the fi nancial fl ows of institutions were considered.
2.6.4 Evaluation of results
2.6.4.1 Initial situation
In June 2006, the 133 selected institutions had PR of R$208.8 billion and PLE corresponding to US$ 128.5 billion, respectively, corresponding to 99.85% of PR and 99.98% of PLE of the National Financial System as a whole, with a Basel capital ratio of 17.9%. On that date, none of the institutions in the universe analyzed had a ratio of less than the regulatory minimum limit of 11%.
2.6.4.2 Upward stress scenarios
Increased credit risk
Growth in credit risk would reduce the Basel capital ratio to 15.1% as a result of a reduction in PR from R$208.8 billion to R$176.2 billion and a strong increase in PLE from R$128.5 billion to R$128.6 billion, an increase of R$108.5 million.
No institution would be classifi ed as technically insolvent. Nonetheless, 21 institutions would be noncompliant and in need of capitalization equivalent to R$1.3 billion or 1% of PLE prior to the simulation.
a) Public banks – Reduction of 5.1 p.p. in the Basel capital ratio (19.7% to 14.6%), due to the R$12.6 billion or 26% cutback in PR, coupled with an increase of R$42 million or 0.2% in PLE. Of the 12 institutions subjected to the stress test, none had a ratio below the regulatory minimum.
b) National private banks – Reduction in the Basel capital ratio equivalent to 2.1 p.p., from 17% to 14.9%, as a result of a decrease of R$11 billion or 12.5% in PR and growth of R$36.7 million or 0.1% in PLE. Of the 54 institutions subjected to the stress test, eight were in need
Credit risk stress testIncrease in the credit risk
Itemization Basel capital ratio ranges
Lower than 11 Higher than 11 A1/ Total
Banking
consolidated I
Banks government owned Number of institutions - 12 - 12 Basel capital ratio (%) - 14.6 - 14.6 domestic private Number of institutions 8 46 2 56 Basel capital ratio (%) 10.5 15.3 180.1 14.9 foreign Number of institutions 4 27 2 33 Basel capital ratio (%) 9.8 13.7 34.5 13.5
consolidated II Number of institutions 9 17 6 32 Basel capital ratio (%) 7.2 20.2 35.9 18.9
Total Number of institutions 21 102 10 133 Basel capital ratio (%) 9.6 15.4 38.1 15.1
1/ Number of institutions not included in the stress test.

60 | Financial Stability Report | November 2006
of capitalization totaling R$245 million or 0.2% of PLE prior to the simulation.
c) Foreign banks – Reduction of 1.9 p.p. in the Basel capital ratio, from 15.4% to 13.5%, due to the drop of R$4.6 billion or 12.2% in PR and growth of R$15.4 billion or 0.1% in PLE. Of the 31 institutions subjected to the stress test, four required total capitalization of R$272.4 million or 0.2% of PLE prior to the simulation.
d) Consolidated banking segment II – Reduction of 2.7 p.p. in the Basel capital ratio from 21.6% to 18.9%, due to the reduction of R$4.4 billion or 12.6% in PR and to growth of R$14.5 million or 0.1% in PLE. Of the 26 institutions subjected to the stress test, eight required capitalization totaling R$750.7 million or 0.6% of PLE prior to the simulation.
In the simulation of the previous half-year period, 19 institutions were considered noncompliant on base date December 2005.
Increased interest and exchange rates
The increase in interest and exchange rates would reduce the Basel capital ratio to 12.9% as a result of a reduction in PR to R$197.1 billion, with R$10.1 billion referring to the interest rate scenario and R$1.5 billion to the exchange scenario, coupled with an increase in PLE to R$168.3 billion, of which R$30.6 billion referred to the interest rate scenario and R$9.2 billion to the exchange scenario.
In this scenario, no institutions would be considered technically insolvent. However, 30 institutions would be noncompliant requiring total capitalization of R$18.3 billion or 14.3% of PLE prior to the simulation.
a) Public banks – Reduction of 4.7 p.p. in the Basel capital ratio from 19.7% to 15% due to a R$1.9 billion or 4% cutback in PR and an increase of R$7.1 billion in PLE or 26.3%. Of the 10 institutions subjected to the stress test, two required capitalization totaling R$780.6 million or 0.6% of PLE prior to the simulation.
b) National private banks – Reduction of 5.1 p.p. in the Basel capital ratio from 17% to 11.9% as a result of the R$6.2 billion or 7.1% cutback in PR and the R$18.9 billion or 33.2% increase in PLE. Of the 42 institutions subjected
Higher interest and foreign exchange rates stress test
Itemization Basel capital ratio rangesLower than 11Higher than 11 A1/ Total
Banking
consolidated I
Banks government owned Number of institutions 2 8 2 12 Basel capital ratio (%) 8.0 15.6 38.6 15.0 domestic private Number of institutions 16 26 14 56 Basel capital ratio (%) 9.0 15.8 77.2 11.9 foreign Number of institutions 8 23 2 33 Basel capital ratio (%) 8.0 16.5 53.3 9.7
consolidated II Number of institutions 4 12 16 32 Basel capital ratio (%) 8.8 20.2 25.7 19.5
Total Number of institutions 30 69 34 133 Basel capital ratio (%) 8.6 16.7 40.7 12.9
1/ Number of institutions not included in the stress test.

November 2006 | Financial Stability Report | 61
to the stress test, 16 would require capitalization totaling R$8.7 billion, or 6.8% of PLE prior to the simulation.
c) Foreign banks – Reduction of 5.7 p.p. in the Basel capital ratio from 15.4% to 9.7% due to the R$3.4 billion or 8.9% reduction in PR and the R$18.9 billion or 44.5% increase in PLE. Of the 31 institutions subjected to the stress test, eight would require a total of R$8.5 billion in capitalization or 6.6% of PLE before the simulation.
d) Consolidated banking segment II – Reduction of 2.1 p.p. in the Basel capital ratio from 21.6% to 19.5% caused by a reduction of R$201.2 million or 0.6% of TR and growth of R$1.8 billion or 10.4% in PLE. Of the 16 institutions subjected to the stress test, four required overall capitalization of R$320.6 billion or 0.2% of PLE before the simulation.
Thirty one institutions were considered noncompliant in the simulation carried out in the previous half-year period, base date December 2005.
Increased interest rates, exchange rates and credit risk
The increase in interest rates, exchange rates and credit risk would reduce the Basel capital ratio to 10.6%, as a result of reduction of PR to R$164.5 billion or 21.2% and growth in PLE to R$168.4 billion or 31.1%.
In this scenario, no institutions would be classified as technically insolvent. Nonetheless, 49 institutions would be noncompliant and would require capitalization of R$31.4 billion or 24.5% of PLE prior to the simulation.
a) Public banks – Reduction of 8.8 p.p. in the Basel capital ratio from 19.7% to 10.9% due to a reduction of R$14.5 billion or 30% of PR and growth of R$7.1 billion or 26.5% in PLE. Of the 12 institutions subjected to the stress test, six required capitalization worth R$4.3 billion or 3.3% of PLE before the simulation.
b) National private banks – Reduction of 6.7 p.p. in the Basel capital ratio from 17% to 10.3%, due to a reduction of R$17.2 billion or 19.6% in PR and growth of R$18.9 billion or 33.2% in PLE. Of the 54 institutions subjected to the stress test, 20 required capitalization totaling R$13.9 billion or 10.8% of PLE prior to the simulation.
Higher interest and foreign exchange rates andcredit risk stress test
Itemization Basel capital ratio rangesLower than 11 Higher than 11 A1/ Total
Banking
consolidated I
Banks government owned Number of institutions 6 6 - 12 Basel capital ratio (%) 9.2 17.2 - 10.9 domestic private Number of institutions 20 34 2 56 Basel capital ratio (%) 7.8 14.4 180.1 10.3 foreign Number of institutions 12 21 - 33 Basel capital ratio (%) 7.0 15.4 - 8.4
consolidated II Number of institutions 11 18 3 32 Basel capital ratio (%) 6.7 19.1 152.5 17.0
Total Number of institutions 49 79 5 133 Basel capital ratio (%) 7.9 16.2 167.8 10.7
1/ Number of institutions not included in the stress test.

62 | Financial Stability Report | November 2006
c) Foreign banks – Reduction of 7 p.p. in the Basel capital ratio from 15.4% to 8.4% as a result of a reduction of R$7.9 billion or 21% in PR and an increase of R$12 billion or 44.6% in PLE. Of the 33 institutions subjected to the test, 12 required capitalization worth R$11.9 billion or 9.2% of PLE prior to the simulation.
d) Consolidated banking segment II – Reduction of 4.6 p.p. in the Basel capital ratio from 21.6% to 17%, generated by a R$4.6 billion or 13.1% cutback in PR and growth of R$1.8 billion or 10.5% in PLE. Of the 29 institutions subjected to the test, 11 required capitalization totaling R$1.4 billion or 1.1% of PLE prior to the simulation.
Fifty-three institutions were considered noncompliant in the simulation carried out in the previous half-year period, base date December 2005.
2.6.4.3 Downward stress scenarios
Lower interest and exchange rates
The reduction in interest and exchange rates would reduce the Basel capital ratio to 15.8% as a consequence of the increase of PR to R$216.6 billion, with R$6.5 billion referring to the interest rate scenario and R$1 billion to the exchange rate scenario and of the increase in PLE to R$150.8 billion, with R$18 billion referring to the interest rate scenario and R$4.3 billion to the exchange rate scenario.
In this scenario no institutions would be technically insolvent. However, seven institutions would be noncompliant, requiring total capitalization of R$316.6 million or 0.2% of PLE before simulation.
a) Public banks – Reduction of 2.2 p.p. in the Basel capital ratio from 19.7% to 17.5% due to growth of R$1.2 billion or 2.6% in PR and R$4.2 billion or 15.6% in PLE. Of the 10 institutions subjected to the stress test, none would have ratios below the regulatory minimum.
b) National private banks – Reduction of 1.8 p.p. in the Basel capital ratio from 17% to 15.2% due to growth of R$3.9 billion or 4.5% in PR and R$9.6 billion or 16.9% in PLE. Of the 42 institutions subjected to the stress test, three required capital injections totaling R$52.2 million or 0.04% of PLE before simulation.
Lower interest and foreign exchange rates stress test
Itemization Basel capital ratio ranges
Lower than 11 Higher than 11 A1/ Total
Banking
consolidated I
Banks
government owned
Number of institutions - 10 2 12
Basel capital ratio (%) - 17.4 38.6 17.5
domestic private
Number of institutions 3 39 14 56
Basel capital ratio (%) 10.5 14.9 77.2 15.2
foreign
Number of institutions 2 29 2 33
Basel capital ratio (%) 10.8 13.8 53.3 12.8
consolidated II
Number of institutions 2 14 16 32
Basel capital ratio (%) 10.5 20.6 26.1 20.4
Total
Number of institutions 7 92 34 133
Basel capital ratio (%) 10.7 16.0 41.1 15.8
1/ Number of institutions not included in the stress test.

November 2006 | Financial Stability Report | 63
c) Foreign banks – Reduction of 2.6 p.p. in the Basel capital ratio from 15.4% to 12.8% due to the R$2.1 billion or 5.7% increase in PR and the R$7.2 billion or 26.8% rise in PLE. Of the 31 institutions tested, two would require capitalization of R$225.2 million or 0.18% of PLE prior to the simulation.
d) Consolidated banking segment II – Reduction of 1.3 p.p. in the capital ratio from 21.7% to 20.4%, as a result of the R$135.2 million or 0.4% increase in PR and the R$1.2 billion or 6.7% rise in PLE. Of the 16 institutions tested, two would require capitalization totaling R$39.3 million or 0.03% of PLE, prior to the simulation.
Six institutions were considered noncompliant in the simulation carried out in the previous half-year period, base date December 2005.
2.7 Conclusion
Driven by internal demand, maintenance of the pace of economic activity clearly ratifi es the growth trend in the Brazilian economy, with direct impacts on the volume of credit offered by the SFN.
Operations with stocks and bonds declined in the half-year period. Banks continued targeting their resources into loan operations. Steady positive growth in these operations revealed a strong performance in nonearmarked portfolios, particularly personal loans. Growth in credit was sustained primarily by payroll-deducted loans. The volume of SFN credits has grown sharply and, in recent half-year periods, relative participation in GDP has followed an upward curve, moving from 25.5% in May 2004 to 32.6% in May 2006.
Net SFN profi ts increased 22.1% compared to the previous half-year period. Basically, this result refl ected growth in income on credit operations and service revenues in a total amount of R$ 23.8 billion, 56.2% of administrative outlays. Foreign banks registered the sharpest percentage drop in operational costs. The major banks registered annual returns of 24.9% on net worth, following an upward trend in recent months.
In the last 24 months, the Basel capital ratio fl uctuated between 17.5% and 19%, well above the minimum limit required by the rules now in effect in Brazil. Stress tests produced satisfactory results, confirming indications evident in recent years according to which SFN institutions

64 | Financial Stability Report | November 2006
have suffi cient levels of capital and net worth to withstand possible extreme fl uctuations in interest rates, exchange rates and loan portfolio quality levels. Despite the highly improbable hypothesis of insolvency, some institutions could be considered noncompliant in terms of operational limits. These results were obtained in the context of a 12% rise in the volume of delinquent loans in the half-year period.

November 2006 | Financial Stability Report | 65
Write-Offs – Historical Series of SCR
In function of the migration of the old Credit Risk Center (CRC) for the current Credit Information System (SCR), that it started to consider the operations written-off to 48 months (previously it was considered up to 60 months), as well as identifying the joint liabilities for cession of credit, we divulge annexes with historical data of operations written-off to 12 months and between 12 and 48 months, and sums of joint liabilities with collateral and joint liabilities with cession of credit.

66 | Financial Stability Report | November 2006

November 2006 | Financial Stability Report | 67

68 | Financial Stability Report | November 2006
Concepts
a) Cosif: Accounting Plan of SFN institutions.
b) National Financial System: For the purposes of this report, this concept is restricted to institutions authorized to operate by Banco Central do Brasil – with the exception of group purchasing pool administrators – independently of whether they are or are not grouped into conglomerates.
c) Banking system: encompasses banking conglomerates and independent banking institutions, as defi ned below.
d) Nonbanking system: includes leasing companies, stock and security brokerage companies, credit, fi nance and investment companies, fi nancial conglomerates, real estate credit companies and savings and loan associations, security distribution companies and mortgage companies.
e) Independent banking institutions I: fi nancial institutions that operate as commercial banks, multiple banks with commercial portfolios or savings banks that are not part of conglomerates, referring to Cosif documents 4010 and 4016.
f) Independent banking institutions II: Financial institutions of the multiple bank type without commercial portfolios, investment banks and development banks that are not part of conglomerates.
g) Independent nonbanking institutions: other fi nancial institutions, except those classifi ed as independent banking institutions I or II and credit unions.
h) Banking conglomerate: grouping of fi nancial institutions that consolidate their fi nancial statements, utilizing Cosif documents 4040 and 4046.
i) Banking conglomerate I: conglomerate in which at least one institution is a commercial bank or multiple bank with a commercial portfolio.
j) Banking conglomerate II: conglomerate in which there are no commercial banks and multiple banks with commercial portfolios, but that have at least one institution of the multiple bank type without a commercial portfolio, investment bank and development bank.
k) Nonbanking conglomerate: conglomerate of fi nancial institutions not classifi ed within the concepts of banking conglomerate I or II.
Concepts and Methodologies

November 2006 | Financial Stability Report | 69
l) Consolidated SFN: corresponds to the aggregation of all the documents considered. Should not be confused with or compared to other statistics published by Banco Central do Brasil, which deal with information on each institution in the different SFN segments.
m) Consolidated banking segment I: grouping of the accounting positions of the banking institutions of the type banking conglomerate I and independent banking institutions I.
n) Consolidated banking segment II: grouping of the accounting positions of the banking institutions of the type banking conglomerate II and independent banking institutions II.
o) Consolidated banking segment III: grouping of the accounting positions of credit unions.
p) Type of control: identifi es the origin of the capital control of banking conglomerates or independent banking institutions. Subdivided into the following segments:
1. public;2. national private;3. foreign.
q) Base Capital (PR): for purposes of calculating operational limits, this concept is defi ned as the sum total of Net Worth and asset and liability accounts as itemized below:
1. Tier I Capital – arithmetic result of the balances of the accounting headings: net worth, credit or income accounts, debtor income accounts. For fi nal calculation purposes, the following should also be excluded: revaluation reserves, contingency reserves and special profi t reserves related to obligatory non distributed dividends, deducting the amounts referring to noncumulative preferred shares and redeemable preferred shares;
2. Tier II Capital – Arithmetic result of the balances of the following accounting headings: revaluation reserve, contingency reserve, special profi t reserves for all obligatory non distributed dividends, noncumulative preferred shares and redeemable preferred shares; eligible subordinate debts and hybrid capital and debt instruments limited to the volume of Tier I, among other restrictions.
r) Adjusted Capital Base (PRA): defi ned as the PR used for purposes of calculating the Fixed Asset Ratio, as defi ned in letter l, subitem I.
s) Required Net Worth (PLE): calculated on the basis of credit and market risks (exchange and preset interest) and swap operations, as described in item “c” of the methodology. Represents the minimum amount required for PR, with the objective of withstanding the risks existent in the capital structure.
t) Basel Capital Ratio: concept defi ned by the Basel Committee which recommends a minimum ratio of 8% between PR and total assets weighted by risk, as demanded by current regulations. In Brazil, the minimum required ratio as of December 2002 is 11% for central credit unions and single credit unions affi liated to central credit unions, 15% for all other credit unions, 30% for development agencies and 11% for all other fi nancial institutions.
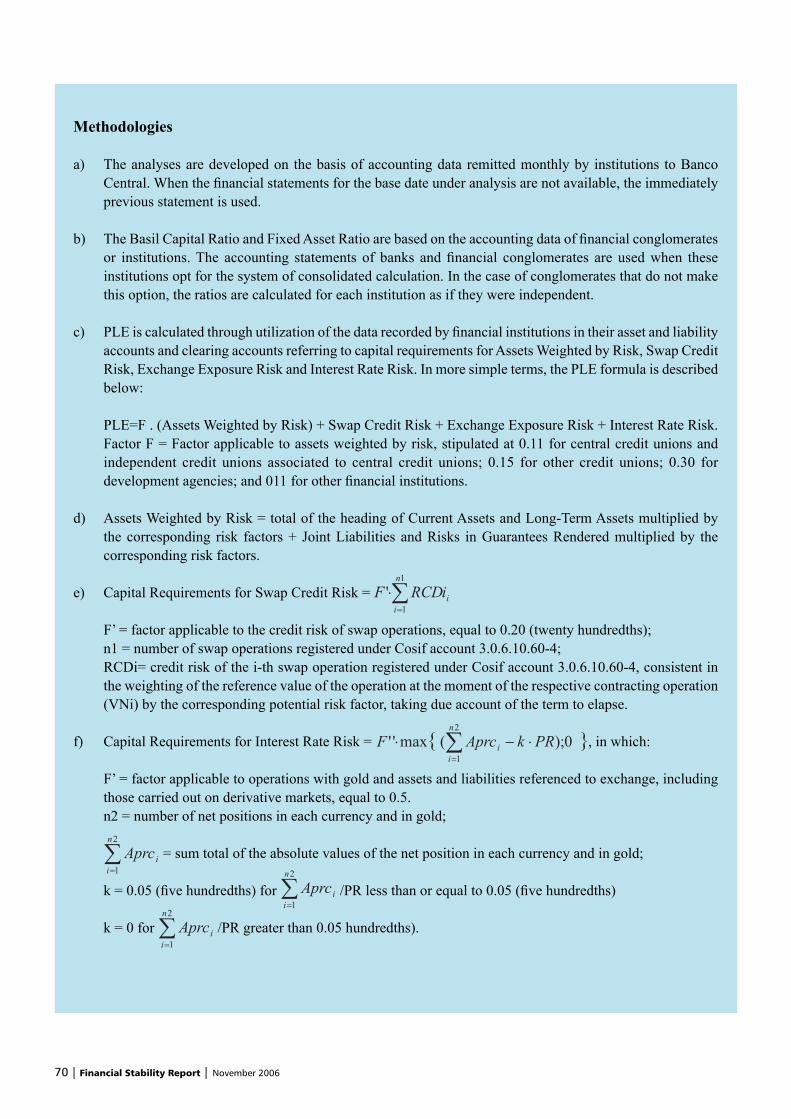
70 | Financial Stability Report | November 2006
Methodologies
a) The analyses are developed on the basis of accounting data remitted monthly by institutions to Banco Central. When the fi nancial statements for the base date under analysis are not available, the immediately previous statement is used.
b) The Basil Capital Ratio and Fixed Asset Ratio are based on the accounting data of fi nancial conglomerates or institutions. The accounting statements of banks and fi nancial conglomerates are used when these institutions opt for the system of consolidated calculation. In the case of conglomerates that do not make this option, the ratios are calculated for each institution as if they were independent.
c) PLE is calculated through utilization of the data recorded by fi nancial institutions in their asset and liability accounts and clearing accounts referring to capital requirements for Assets Weighted by Risk, Swap Credit Risk, Exchange Exposure Risk and Interest Rate Risk. In more simple terms, the PLE formula is described below:
PLE=F . (Assets Weighted by Risk) + Swap Credit Risk + Exchange Exposure Risk + Interest Rate Risk. Factor F = Factor applicable to assets weighted by risk, stipulated at 0.11 for central credit unions and
independent credit unions associated to central credit unions; 0.15 for other credit unions; 0.30 for development agencies; and 011 for other fi nancial institutions.
d) Assets Weighted by Risk = total of the heading of Current Assets and Long-Term Assets multiplied by the corresponding risk factors + Joint Liabilities and Risks in Guarantees Rendered multiplied by the corresponding risk factors.
e) Capital Requirements for Swap Credit Risk =
F’ = factor applicable to the credit risk of swap operations, equal to 0.20 (twenty hundredths); n1 = number of swap operations registered under Cosif account 3.0.6.10.60-4; RCDi= credit risk of the i-th swap operation registered under Cosif account 3.0.6.10.60-4, consistent in
the weighting of the reference value of the operation at the moment of the respective contracting operation (VNi) by the corresponding potential risk factor, taking due account of the term to elapse.
f) Capital Requirements for Interest Rate Risk = , in which:
F’ = factor applicable to operations with gold and assets and liabilities referenced to exchange, including those carried out on derivative markets, equal to 0.5.
n2 = number of net positions in each currency and in gold;
= sum total of the absolute values of the net position in each currency and in gold;
k = 0.05 (fi ve hundredths) for /PR less than or equal to 0.05 (fi ve hundredths)
k = 0 for /PR greater than 0.05 hundredths).

November 2006 | Financial Stability Report | 71
g) Capital Requirements for Interest Rate Risk = , in which:
n3 = number of shares representative of the value of PLE for coverage of interest rate market risk in a specifi c currency/basis of earnings;Eci = Share representative of the value of PLE for coverage of interest rate market risk in a specifi c currency/basis of earnings.
h) Basel Capital Ratio = .
i) The values presented in the texts and tables have been rounded off. However, their percentage changes refl ect the original fi gures, considering all of the decimal places.
j) The Fixed Assets Limit indicates the percentage of commitment of PRA in relation to Permanent Assets. The maximum limit permitted is 50%.
k) The following formula is used to obtain the Fixed Assets Ratio:
Fixed Assets Ratio =
I. For calculation of the PRA
Tier I Capital(+) Tier II Capital(-) Stock Exchange Capital Securities(-) Commodities and Futures Market Capital Securities(-) Cetip Capital Securities(-) (-) Stocks and Quotas of Clearing and Custody Companies linked to Exchanges(-) (-) Provisions for Losses in Capital Securities*(-) Capital Securities – Others*(-)Premiums in Acquisitions of Capital Securities*(=) PRA
II. For calculation of Fixed Assets
Fixed(-) Fixed Assets Leased(-) Losses in Leasings to be Paid(-)(-)Accumulated Amortizations of Deferred – Losses in Leasings to be Paid(-) Stock Exchange Capital Securities(-) Commodities and Futures Exchange Capital Securities(-) Cetip Capital Securities(-) Stocks and Quotas of Clearing and Custody Companies Linked to Exchanges(-)(-) Provision for Losses in Stocks and Quotas of Clearing and Custody Companies Linked to Exchange(-)(-) Provision for Losses in Capital Securities*
72 | Financial Stability Report | November 2006
(-) Capital Securities – Others*(-) Premiums in Acquisitions of Capital Securities*(=) Fixed Assets to Fixed Assets Ratio
All references to Fixed Assets in this paper concern Fixed Assets to Fixed Assets Ratio.
* Since the “Provision for Losses in Capital Securities” refers to all the headings of fi xed capital, as well as premiums, it was determined that it would only be included in calculations of Adjusted PR and Fixed Assets – Investment when its absolute value exceeds the sum of the headings “Capital Securities – Others” and “Premiums in Acquisitions of Capital Securities”. In these cases, the value of the provision to be considered is limited to the amount that exceeds the sum total of the balance of “Capital Securities – Others”, with the balance of “Premiums in Acquisitions of Capital Securities”.

November 2006 | Financial Stability Report | 73
Credit operations
Concept
a) Banking system: encompasses independent banking institutions and banking conglomerates and is distributed into the following categories: consolidated banking segment I, consolidated banking segment II and consolidated banking segment III, as defi ned under items “e” to “j” and “n” to “q” of pages 68 and 69 of this Report.
b) Nonbanking system: composed of leasing companies, credit, finance and investment companies, among others, that do not belong to fi nancial conglomerates in which the lead component is a banking institution.
c) Minimum provision: the provision calculated according to the minimum parameters defined by Resolution 2,682, dated December 22, 1999.
d) Default: concept in line with the international standard of nonperformance loans, encompassing credits matured for more than 90 days.
e) Constituted provision: the stock of provisions stated in the balance sheets of fi nancial institutions.
Methodology
a) The volumes of National Financial System (SFN) credit operations were calculated on the basis of documents (balance sheets and Credit Risk Center records) and were aggregated according to member institutions and also on the basis of documents provided by independent fi nancial institutions.
b) Refers to the volume of credit effectively granted by the SFN to economic agents in Brazil excluding, therefore, the amounts granted by Brazilian bank branches and subsidiaries headquartered abroad. Credit operations contracted by microentrepreneur credit companies are also excluded.
Concepts and Methodologies – Credit Operations

74 | Financial Stability Report | November 2006
Exchange exposure
According to current rules, exchange exposure is defi ned as the net value resulting from positions held in assets and liabilities1 referenced to variations in the value of exchange and gold assumed by fi nancial institutions and their directly and indirectly controlled entities, including positions on derivative markets and the exchange market itself. Exchange exposure is calculated separately in each currency and converted into reals.
Derivative markets include positions in futures, forward operations, options, swaps and commodities in which the value of the contract is subject to changes in foreign currency or gold values. The determination of assets and liabilities is not clearly defi ned for these instruments, making it necessary to accompany them through the use of extra-accounting documents.
The exchange market is the environment in which the foreign currencies used to back the other items referenced to them are negotiated. The institutions are duly authorized by Banco Central do Brasil and must comply with specifi c limits that are not discussed in this chapter. Purchases and sales of foreign currency require accounting records under specifi c headings in the National Financial System Institutions Accounting Plan (Cosif) which are also taken into consideration in calculating exchange exposure.
Defi nitions
Long exposure: The sum total of the assets exposed to exchange risk that increase in national currency value and of the liabilities that decrease in value as a result of devaluation of the national currency in relation to other currencies.
Short exposure: the sum total of the assets exposed to exchange risk that decrease in national currency value and of the liabilities that increase in value as a result of devaluation of the national currency in relation to other currencies. (Defi nitions: Circular 2,894/1999)
Exposure limit: the net exposure of the institutions as defi ned above and may not be greater than 30% of Base Capital (PR) – Circular 3,156/2002.
Concepts and Methodologies – Exchange Exposure
1/ All of the asset and liability statement items in some way related to the value of the foreign currency or gold are considered, such as credit operations, securities, investments abroad, credit lines utilized abroad and others.

November 2006 | Financial Stability Report | 75
The exchange exposure of the institution is obtained through the sum total of exchange exposure in each currency in the module:
Exchange Exposure = .
In which I = currency
Circular 3217 dated December 23, 2003, later substituted by Circular 3229, dated March 25, 2004, instituted the concept of “basket of currencies”, making it possible to offset contrary positions in United States dollars, euros, pounds sterling, yen, Swiss francs and gold, in the place of the sum total of the modules of each one.
According to current rules, the share of foreign capital included in the Base Capital of fi nancial institutions may, on the basis of a request submitted to Banco Central do Brasil, be considered as an institution’s exchange exposure and is designated the PLA-V (Adjusted Net Worth – Short). However, this provision was not adopted in this Report, since the objective is to demonstrate the real exposure of the institutions defi ned as Net Exposure, which is calculated through the following formula:
Net Exposure = .
Calculation of the participation of net exposures of the currencies in the basket
In order to avoid distortions, calculation of the participation in the basket of currencies of each one of the currencies included in it is done through utilization of its module, as shown below:
Net exposure module of each currency in the basket/ ∑ Module of the net exposures of the currencies of the basket.
This formula results in the daily participation of the net exposure of each currency included in the basket, which is the basis for the fi nal average of the period.

76 | Financial Stability Report | November 2006
Stress scenarios
For purposes of credit risk stress, the classifi cation of all clients of fi nancial institutions are downgraded two levels, based on balance sheet data – ranked portfolio. A new provision requirement is obtained as a result of the new classifi cation. Real provisions are subtracted from this result in order to determine the required increase in provisions. After that, the impact of the increased provision on PLE and PR is calculated, thus revealing the impact on the Basel capital ratio.
For purposes of identifying the parameters used in market risk stress scenarios (preset interest and exchange rates), we utilized the largest value obtained through application of the two models: VaR and Hybrid. With regard to VaR the basic methodology is the RiskMetrics methodology which operates on the basis of the hypothesis of normal behavior for the algorithm of the returns of the variables under analysis. In its turn, the hybrid model utilizes historic data but does not draw hypotheses on the distribution of the returns of the variables analyzed, making use of the technique of exponential smoothing – combining several characteristics of the VaR, of RiskMetrics – and of the historic simulation methods.
For these two models, the confi dence level of 99.6% (equivalent to one error per year) and a period of position maintenance of ten business days are utilized. With regard to the technique of exponential smoothing, which has the purpose of attributing greater weight to more recent observations, diverse factors of decline between 0.9 and one were utilized. Basically, these factors generate equal weights for all the days of the series, noting that only decline factors between 0.9 and 1 were used for the rate reductions scenarios. On each date on which the calculation is made, a series of data encompassing the fi rst business day of January 1999 to the business day immediately prior to the calculation date is used, and the exponential decline chosen is that which generates the largest result.
In applying market risk stress to the PLE, the results of fl uctuations in the rates were considered only in the amount of the requirement for market risk (interest + exchange), without altering Assets Weighted by Risk (APR). In PR, the fi nancial impact of exchange variations on net exposure and of changes in interest rates on fi nancial fl ows of the institutions were considered.
Concepts and Methodologies – Stress Scenarios

November 2006 | Financial Stability Report | 77
The RiskMetrics methodology (1994) was developed by the J.P. Morgan fi nancial institution and proposes that value-at-risk (VaR) be calculated through the following equation:
, in which
VMTM Is the value of the assets marked-to-market on date t;Zα is the quantile of the normal distribution equivalent to the degree of confi dence of the estimate of VaR;Ht is the conditional volatility on date t for the asset;Δt is the time interval chosen for calculating VaR.
Principal underlying hypothesis is that of log-normality of asset pricesl.
In order to estimate conditional volatility, RiskMetrics recommends utilization of the Exponentially Weighted Moving Average (EWMA), as shown in the equation below:
, in which
rt is the return of the asset for period t, defi ned as rt=1n(Pt/Pt-1), in which Pt price of λ asset in t;λ is the decline factor, so that 0 < λ < 1.
The most commonly used EWMA formulation in fi nancial series allows for the hypothesis that the average of the λ daily returns of the assets is equal to zero2.
With respect to the decline factor, RiskMetrics suggests λ =0.94 for daily data. However, models exist for the choice of optimum λ, such as the maximum verisimilitude and the principle of average squares. The value of λ close to one reproduces the stylized fact of the volatility being highly persistent.
In the forecast of EWMA, the conditional variants of the returns is composed of two terms. The fi rst [λht-1] is composed of a self-regressive term that expresses the temporal dependence of the return variance, the stylized fact present in fi nancial series. The second [{1-λ)] represents the contribution of the most recent observation (innovation) for the estimated variance.
Riskmetrics Methodology to Calculating Value-at-Risk
1/ It should also be noted that to utilize the time root to convert from one VaR calculation horizon to another, it is admitted that the prices are log-normally distributed and follow a Markov process.
2/ RiskMetrics also presents the equation in which a median of return different from zero is admitted.

78 | Financial Stability Report | November 2006
The calculation of the VaR of the portfolio is given by:
, in which
VaR is the vector n x 1 containing the VaR of each asset in the portfolio, and n is the number of instruments in the portfolio;VaR’ is the vector 1 x n, vector transposed from vector VaR;ρ is the matrix nxn containing the correlations among the assets included in the portfolio
The correlation on day t among the assets i and j is calculated through the following formula:
, in which
h(i.j),t denotes the conditional covariance i and j on date t, which possesses the same principle of conditional variance calculation, and is obtained by the formula:
.

November 2006 | Financial Stability Report | 79
This box synthesizes the work of Boudoukh et al., published in the Resenha BM&F 122/1998, utilized to calculate value-at-risk in interest and exchange rate stress scenarios. Classifi ed as the hybrid model, this approach consists in recognizing the existent trade-offs in the different methods utilized to calculate value-at-risk and combine these methodologies in such a way as to optimize these trade-offs, while seeking to preserve their respective advantages.
The best known and most commonly used methodologies for calculating value-at-risk consist of the technique of exponential smoothing (the classic example is the RiskMetrics methodology) which uses decreasing weights for past returns, making it possible to perceive the behavior of volatility and historic simulation which ignores hypotheses on the distribution of the returns and utilizes the empirical percentages of the historic distribution of the returns.
The hybrid approach combines these two approaches. The approach of historic simulation uses equal weights to calculate conditional distribution. The proposal is that of using declining weights for past data with these weightings being calculated in a manner similar to the method of exponential smoothing
On making this combination, two undesirable properties of the traditional methods are put aside. On the one hand, the approach of exponential smoothing assumes a multivaried normality, which causes problems as a result of the heavy tails that are found in most fi nancial assets. The historic simulation approach neglects hypotheses on distribution but assumes constant weights for observations of the sampling. The latter hypothesis is quite unrealistic, since the information contained in the returns on current distribution diminishes over time.
In this way, the hybrid approach consists of applying decreasing weights to past returns and encountering the appropriate percentage of this weighted empirical distribution in time. Boudoukh et al. tested the hybrid model for the rate of exchange of the German mark per United States dollar, the spot price of Brent type petroleum, Standard & Poor’s 500 index and a generic index of Brady Bonds (J.P. Morgan Brady Bond Index) and concluded that the empirical results show that the hybrid model is superior to the other two, principally in the case of data with heavy tails such as those of the series of petroleum prices and Brady bonds.
Hybrid Approach to Calculating Value-at-Risk

![ADAPTABILIDADE E ESTABILIDADE DE HÍBRIDOS …unicentroagronomia.com/destino_arquivo/alessandra_z._pfann[1].pdf · methodologies, the hybrids 30F36, AS1579, AG8021 and 30B39 presented](https://static.fdocuments.us/doc/165x107/5aa2374f7f8b9a07758cc165/adaptabilidade-e-estabilidade-de-hbridos-1pdfmethodologies-the-hybrids-30f36.jpg)