Relationships between Water Vapor Path and …aos.wisc.edu/~lback/wvpprecip.pdfRelationships between...
12
1APRIL 2004 1517 BRETHERTON ET AL. q 2004 American Meteorological Society Relationships between Water Vapor Path and Precipitation over the Tropical Oceans CHRISTOPHER S. BRETHERTON Department of Atmospheric Sciences, University of Washington, Seattle, Washington MATTHEW E. PETERS Department of Applied Mathematics, University of Washington, Seattle, Washington LARISSA E. BACK Department of Atmospheric Sciences, University of Washington, Seattle, Washington (Manuscript received 14 August 2003, in final form 17 October 2003) ABSTRACT The relationship between water vapor path W and surface precipitation rate P over tropical oceanic regions is analyzed using 4 yr of gridded daily SSM/I satellite microwave radiometer data. A tight monthly mean relationship P (mm day 21 ) 5 exp[11.4(r 2 0.522)] for all tropical ocean regions and seasons is found between P and a column-relative humidity r obtained by dividing W by the corresponding saturation water vapor path. A similar relation, albeit with more scatter, also holds at daily time scales, and can be interpreted as a moisture adjustment time scale of 12 h for convective rainfall to affect humidity anomalies on 300-km space scales. Cross-spectral analysis shows statistically significant covariability of actual and r-predicted precipitation at all frequencies, with negligible phase lag. The correlation of actual and r-predicted precipitation exceeds 0.5 on intraseasonal and longer time scales. The SSM/I retrievals of W and P are found to be skillful even at daily time scales when compared with in situ radiosonde and radar-derived area-averaged precipitation data from Kwajalein Island, but the microwave estimates of daily P scatter considerably about the radar estimates (which are considered to be more reliable). Using the radar-derived precipitation in combination with microwave-derived W yields a daily r–P relationship at Kwajalein similar to that derived solely from microwave measurements, but with somewhat less P associated with the highest values of r. This emphasizes that the absolute calibration of the r–P relationship is somewhat dependent on the datasets used to derive r and especially P. Nevertheless, the results provide a useful constraint on conceptual models and parameterizations of tropical deep convection. 1. Introduction As known to scientists and nonscientists alike, it tends to be humid when and where there is sustained deep convective rainfall. Raymond (2000) even investigated the large-scale dynamical consequences of a bulk pa- rameterization of tropical rainfall rate P in terms of a vertically integrated moisture deficit from saturation. However, there has been comparatively little quantita- tive investigation of the relation of P to humidity and its vertical structure, and how this relationship depends on the time and space scales under consideration. Analyses of radiosonde data from various tropical locations have shown that episodes of deep convection are followed by increases in mid- to upper-tropospheric relative humidity, while a relatively moist low- to mid- Corresponding author address: Christopher S. Bretherton, De- partment of Atmospheric Sciences, University of Washington, Box 351640, Seattle, WA 98195-1640. E-mail: [email protected] troposphere helps initiate tropical deep convection (e.g., Numaguti et al. 1995; Ushiyama et al. 1995; Yoneyama and Fujitani 1995; Johnson and Lin 1997; Brown and Zhang 1997; Sherwood 1999; Sherwood and Wahrlich 1999; Sobel et al. 2004). Zeng (1999) showed how sup- plementary use of satellite-derived column water vapor path W could be used to improve predictions of tropical rainfall from infrared brightness temperature. The data analyzed by these authors did not permit them to attempt a comprehensive observational assess- ment of relationships between P and humidity on dif- ferent time scales. In this study, we use 4 years of daily microwave retrievals of P and W over the entire tropical ocean to examine this issue—enough samples in time and space to clearly identify any correlation between these variables. At daily time scales, P (and to a lesser extent W ) are undersampled at any location and subject to potentially serious retrieval biases; to test their ro- bustness we use a dataset including several months of radiosonde and ground-based radar-derived area-aver-
-
Upload
phungduong -
Category
Documents
-
view
217 -
download
4
Transcript of Relationships between Water Vapor Path and …aos.wisc.edu/~lback/wvpprecip.pdfRelationships between...

1 APRIL 2004 1517B R E T H E R T O N E T A L .
q 2004 American Meteorological Society
Relationships between Water Vapor Path and Precipitation over the Tropical Oceans
CHRISTOPHER S. BRETHERTON
Department of Atmospheric Sciences, University of Washington, Seattle, Washington
MATTHEW E. PETERS
Department of Applied Mathematics, University of Washington, Seattle, Washington
LARISSA E. BACK
Department of Atmospheric Sciences, University of Washington, Seattle, Washington
(Manuscript received 14 August 2003, in final form 17 October 2003)
ABSTRACT
The relationship between water vapor path W and surface precipitation rate P over tropical oceanic regionsis analyzed using 4 yr of gridded daily SSM/I satellite microwave radiometer data. A tight monthly meanrelationship P (mm day21) 5 exp[11.4(r 2 0.522)] for all tropical ocean regions and seasons is found betweenP and a column-relative humidity r obtained by dividing W by the corresponding saturation water vapor path.A similar relation, albeit with more scatter, also holds at daily time scales, and can be interpreted as a moistureadjustment time scale of 12 h for convective rainfall to affect humidity anomalies on 300-km space scales.Cross-spectral analysis shows statistically significant covariability of actual and r-predicted precipitation at allfrequencies, with negligible phase lag. The correlation of actual and r-predicted precipitation exceeds 0.5 onintraseasonal and longer time scales.
The SSM/I retrievals of W and P are found to be skillful even at daily time scales when compared with insitu radiosonde and radar-derived area-averaged precipitation data from Kwajalein Island, but the microwaveestimates of daily P scatter considerably about the radar estimates (which are considered to be more reliable).Using the radar-derived precipitation in combination with microwave-derived W yields a daily r–P relationshipat Kwajalein similar to that derived solely from microwave measurements, but with somewhat less P associatedwith the highest values of r. This emphasizes that the absolute calibration of the r–P relationship is somewhatdependent on the datasets used to derive r and especially P. Nevertheless, the results provide a useful constrainton conceptual models and parameterizations of tropical deep convection.
1. Introduction
As known to scientists and nonscientists alike, it tendsto be humid when and where there is sustained deepconvective rainfall. Raymond (2000) even investigatedthe large-scale dynamical consequences of a bulk pa-rameterization of tropical rainfall rate P in terms of avertically integrated moisture deficit from saturation.However, there has been comparatively little quantita-tive investigation of the relation of P to humidity andits vertical structure, and how this relationship dependson the time and space scales under consideration.
Analyses of radiosonde data from various tropicallocations have shown that episodes of deep convectionare followed by increases in mid- to upper-troposphericrelative humidity, while a relatively moist low- to mid-
Corresponding author address: Christopher S. Bretherton, De-partment of Atmospheric Sciences, University of Washington, Box351640, Seattle, WA 98195-1640.E-mail: [email protected]
troposphere helps initiate tropical deep convection (e.g.,Numaguti et al. 1995; Ushiyama et al. 1995; Yoneyamaand Fujitani 1995; Johnson and Lin 1997; Brown andZhang 1997; Sherwood 1999; Sherwood and Wahrlich1999; Sobel et al. 2004). Zeng (1999) showed how sup-plementary use of satellite-derived column water vaporpath W could be used to improve predictions of tropicalrainfall from infrared brightness temperature.
The data analyzed by these authors did not permitthem to attempt a comprehensive observational assess-ment of relationships between P and humidity on dif-ferent time scales. In this study, we use 4 years of dailymicrowave retrievals of P and W over the entire tropicalocean to examine this issue—enough samples in timeand space to clearly identify any correlation betweenthese variables. At daily time scales, P (and to a lesserextent W) are undersampled at any location and subjectto potentially serious retrieval biases; to test their ro-bustness we use a dataset including several months ofradiosonde and ground-based radar-derived area-aver-
1518 VOLUME 17J O U R N A L O F C L I M A T E
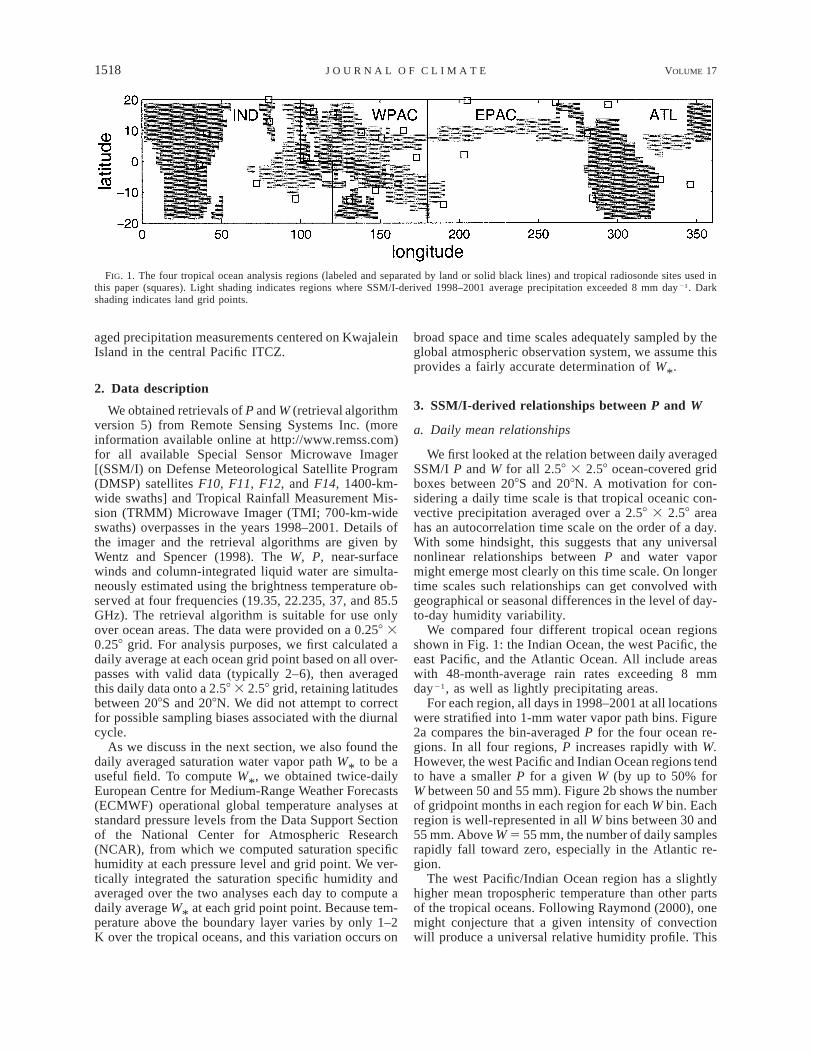
FIG. 1. The four tropical ocean analysis regions (labeled and separated by land or solid black lines) and tropical radiosonde sites used inthis paper (squares). Light shading indicates regions where SSM/I-derived 1998–2001 average precipitation exceeded 8 mm day 21. Darkshading indicates land grid points.
aged precipitation measurements centered on KwajaleinIsland in the central Pacific ITCZ.
2. Data description
We obtained retrievals of P and W (retrieval algorithmversion 5) from Remote Sensing Systems Inc. (moreinformation available online at http://www.remss.com)for all available Special Sensor Microwave Imager[(SSM/I) on Defense Meteorological Satellite Program(DMSP) satellites F10, F11, F12, and F14, 1400-km-wide swaths] and Tropical Rainfall Measurement Mis-sion (TRMM) Microwave Imager (TMI; 700-km-wideswaths) overpasses in the years 1998–2001. Details ofthe imager and the retrieval algorithms are given byWentz and Spencer (1998). The W, P, near-surfacewinds and column-integrated liquid water are simulta-neously estimated using the brightness temperature ob-served at four frequencies (19.35, 22.235, 37, and 85.5GHz). The retrieval algorithm is suitable for use onlyover ocean areas. The data were provided on a 0.258 30.258 grid. For analysis purposes, we first calculated adaily average at each ocean grid point based on all over-passes with valid data (typically 2–6), then averagedthis daily data onto a 2.58 3 2.58 grid, retaining latitudesbetween 208S and 208N. We did not attempt to correctfor possible sampling biases associated with the diurnalcycle.
As we discuss in the next section, we also found thedaily averaged saturation water vapor path W* to be auseful field. To compute W*, we obtained twice-dailyEuropean Centre for Medium-Range Weather Forecasts(ECMWF) operational global temperature analyses atstandard pressure levels from the Data Support Sectionof the National Center for Atmospheric Research(NCAR), from which we computed saturation specifichumidity at each pressure level and grid point. We ver-tically integrated the saturation specific humidity andaveraged over the two analyses each day to compute adaily average W* at each grid point point. Because tem-perature above the boundary layer varies by only 1–2K over the tropical oceans, and this variation occurs on
broad space and time scales adequately sampled by theglobal atmospheric observation system, we assume thisprovides a fairly accurate determination of W*.
3. SSM/I-derived relationships between P and W
a. Daily mean relationships
We first looked at the relation between daily averagedSSM/I P and W for all 2.58 3 2.58 ocean-covered gridboxes between 208S and 208N. A motivation for con-sidering a daily time scale is that tropical oceanic con-vective precipitation averaged over a 2.58 3 2.58 areahas an autocorrelation time scale on the order of a day.With some hindsight, this suggests that any universalnonlinear relationships between P and water vapormight emerge most clearly on this time scale. On longertime scales such relationships can get convolved withgeographical or seasonal differences in the level of day-to-day humidity variability.
We compared four different tropical ocean regionsshown in Fig. 1: the Indian Ocean, the west Pacific, theeast Pacific, and the Atlantic Ocean. All include areaswith 48-month-average rain rates exceeding 8 mmday21, as well as lightly precipitating areas.
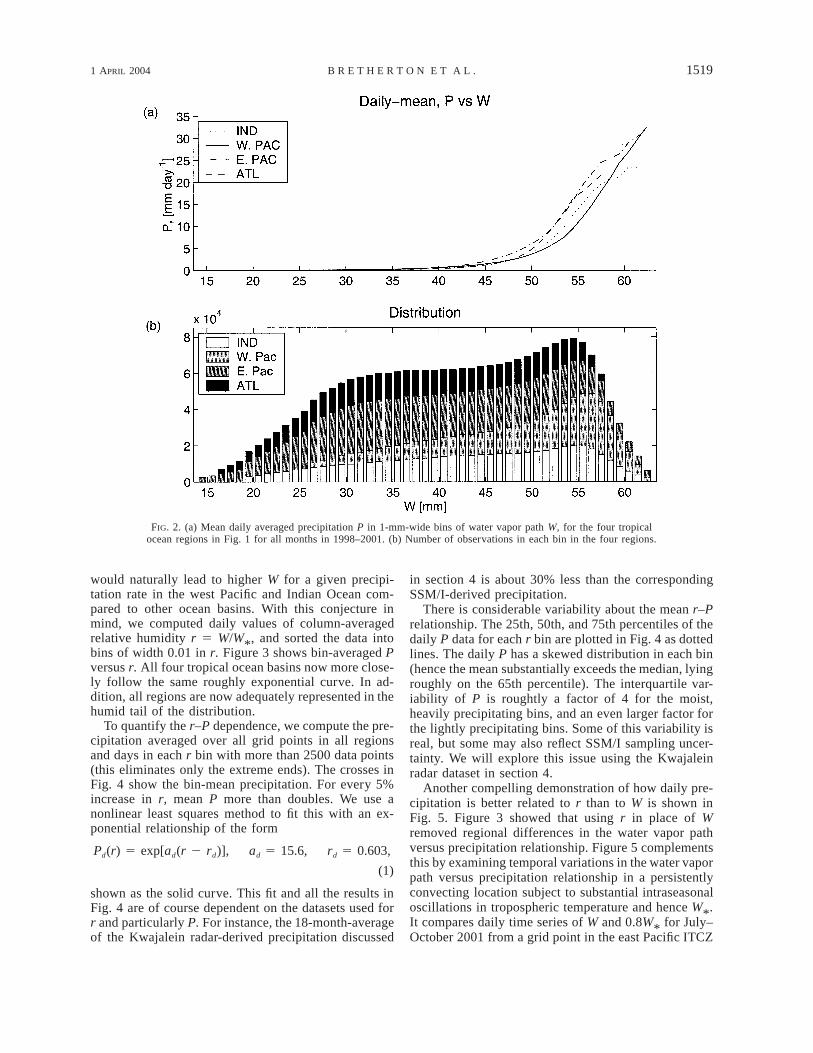
For each region, all days in 1998–2001 at all locationswere stratified into 1-mm water vapor path bins. Figure2a compares the bin-averaged P for the four ocean re-gions. In all four regions, P increases rapidly with W.However, the west Pacific and Indian Ocean regions tendto have a smaller P for a given W (by up to 50% forW between 50 and 55 mm). Figure 2b shows the numberof gridpoint months in each region for each W bin. Eachregion is well-represented in all W bins between 30 and55 mm. Above W 5 55 mm, the number of daily samplesrapidly fall toward zero, especially in the Atlantic re-gion.
The west Pacific/Indian Ocean region has a slightlyhigher mean tropospheric temperature than other partsof the tropical oceans. Following Raymond (2000), onemight conjecture that a given intensity of convectionwill produce a universal relative humidity profile. This
1 APRIL 2004 1519B R E T H E R T O N E T A L .
FIG. 2. (a) Mean daily averaged precipitation P in 1-mm-wide bins of water vapor path W, for the four tropicalocean regions in Fig. 1 for all months in 1998–2001. (b) Number of observations in each bin in the four regions.
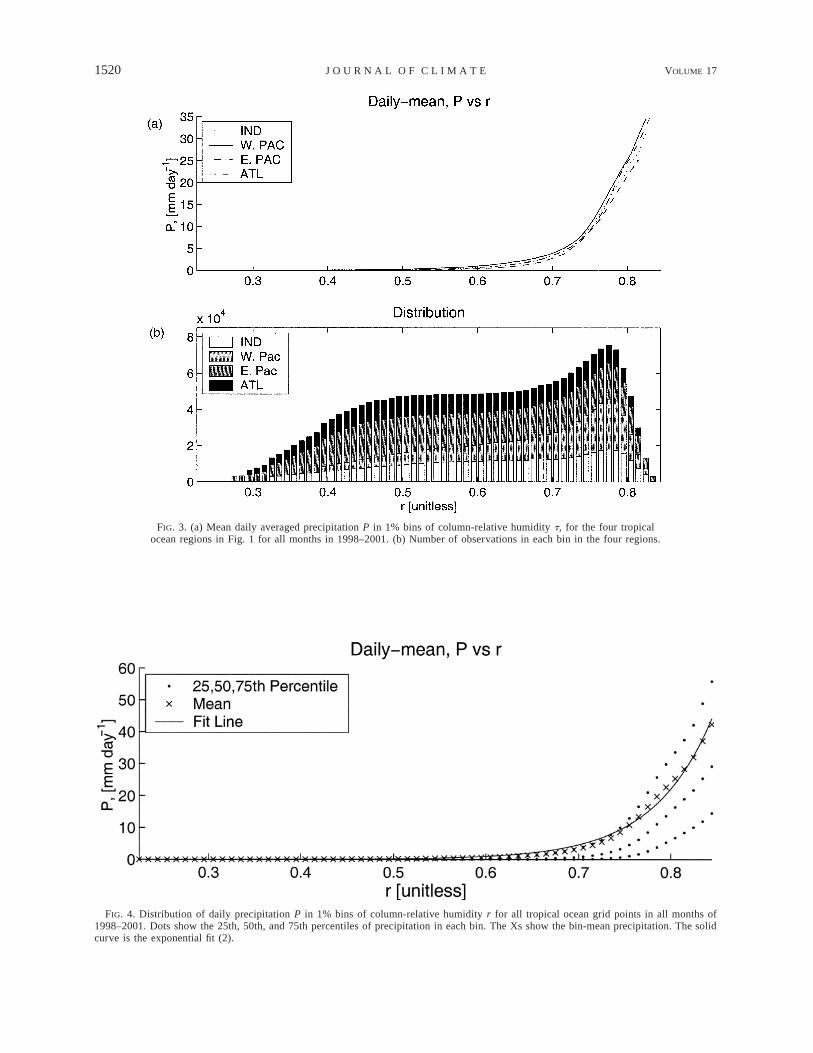
would naturally lead to higher W for a given precipi-tation rate in the west Pacific and Indian Ocean com-pared to other ocean basins. With this conjecture inmind, we computed daily values of column-averagedrelative humidity r 5 W/W*, and sorted the data intobins of width 0.01 in r. Figure 3 shows bin-averaged Pversus r. All four tropical ocean basins now more close-ly follow the same roughly exponential curve. In ad-dition, all regions are now adequately represented in thehumid tail of the distribution.
To quantify the r–P dependence, we compute the pre-cipitation averaged over all grid points in all regionsand days in each r bin with more than 2500 data points(this eliminates only the extreme ends). The crosses inFig. 4 show the bin-mean precipitation. For every 5%increase in r, mean P more than doubles. We use anonlinear least squares method to fit this with an ex-ponential relationship of the form
P (r) 5 exp[a (r 2 r )], a 5 15.6, r 5 0.603,d d d d d
(1)
shown as the solid curve. This fit and all the results inFig. 4 are of course dependent on the datasets used forr and particularly P. For instance, the 18-month-averageof the Kwajalein radar-derived precipitation discussed
in section 4 is about 30% less than the correspondingSSM/I-derived precipitation.
There is considerable variability about the mean r–Prelationship. The 25th, 50th, and 75th percentiles of thedaily P data for each r bin are plotted in Fig. 4 as dottedlines. The daily P has a skewed distribution in each bin(hence the mean substantially exceeds the median, lyingroughly on the 65th percentile). The interquartile var-iability of P is roughtly a factor of 4 for the moist,heavily precipitating bins, and an even larger factor forthe lightly precipitating bins. Some of this variability isreal, but some may also reflect SSM/I sampling uncer-tainty. We will explore this issue using the Kwajaleinradar dataset in section 4.
Another compelling demonstration of how daily pre-cipitation is better related to r than to W is shown inFig. 5. Figure 3 showed that using r in place of Wremoved regional differences in the water vapor pathversus precipitation relationship. Figure 5 complementsthis by examining temporal variations in the water vaporpath versus precipitation relationship in a persistentlyconvecting location subject to substantial intraseasonaloscillations in tropospheric temperature and hence W*.It compares daily time series of W and 0.8W* for July–October 2001 from a grid point in the east Pacific ITCZ
1520 VOLUME 17J O U R N A L O F C L I M A T E
FIG. 3. (a) Mean daily averaged precipitation P in 1% bins of column-relative humidity t, for the four tropicalocean regions in Fig. 1 for all months in 1998–2001. (b) Number of observations in each bin in the four regions.
FIG. 4. Distribution of daily precipitation P in 1% bins of column-relative humidity r for all tropical ocean grid points in all months of1998–2001. Dots show the 25th, 50th, and 75th percentiles of precipitation in each bin. The Xs show the bin-mean precipitation. The solidcurve is the exponential fit (2).

1 APRIL 2004 1521B R E T H E R T O N E T A L .
FIG. 5. Daily time series of SSM/I-derived W and ECMWF-derived 0.8W*
for Jul–Oct 2001 from a grid point in the east Pacific ITCZ(108N, 1258W). SSM/I-derived W is only plotted on heavily precipitating days (P . 8 mm day21).
(108N, 1258W). The W is only plotted on ‘‘heavily pre-cipitating’’ days with P exceeding 8 mm day21. Ac-cording to Fig. 4, these days should typically have 0.75, W/W* , 0.8. In fact, their Ws predominantly lie justbelow the W 5 0.8W* curve, and generally rise and fallin proportion to the intraseasonal variations in W*. Atthis location, the low-frequency swings in W are slightlylarger than those in 0.8W*. This suggests that the r–Prelationship may have some slight but interesting spa-tiotemporal dependence, perhaps due to different ther-modynamic conditions, wind shear and convective or-ganization, stratiform/convective precipitation ratio,surface fluxes, etc.
b. Monthly mean relationships
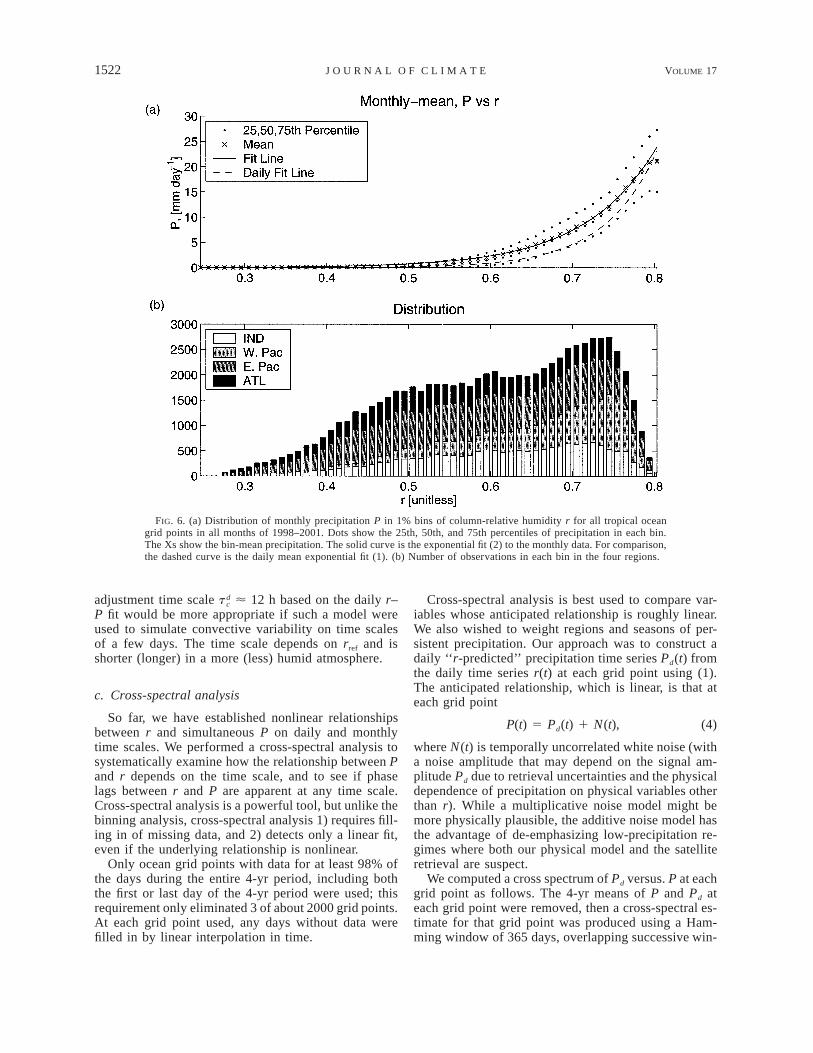
The daily mean analysis can be repeated with monthlymean binning. As before, normalizing W into column-mean relative humidity r reduces systematic interbasindifferences at high precipitation rates. The binned data,shown in Fig. 6, again can be fit by an exponential:
P (r) 5 exp[a (r 2 r )], a 5 11.4, r 5 0.522.m m m m m
(2)
The monthly mean fit Pd(r) (solid curve) rises slightlyless abruptly with monthly r than its daily counterpart(dashed curve). As one might expect, the monthly Phas a less skewed distribution with a narrower spreadbetween the 25th and 75th percentiles (630% at highprecipitation rates).
The monthly relation (2) between P and r can actuallybe derived from the corresponding daily relationship (1)as follows. For each day of a given month and everygrid point, we can use the daily r to predict the dailyP. We can then average the r and daily predicted P overthe month. The bin average of the latter versus monthlyaverage r almost exactly reproduces our monthly meanr–P relationship. In different regions, we find that the
monthly r–P relationship varies slightly due to differentlevels of typical daily variability in r within individualmonths. To the extent that the r within a given fluidcolumn only evolves ‘‘slowly’’ from day to day, so willits propensity to precipitate, that is, r may induce a weakday-to-day thermodynamic ‘‘memory’’ in P. However,P is sensitive to changes in r as small as a few hun-dredths, so precipitation, evaporation, and differentialadvection keep this memory quite short.
From our r–P relationships, we can define a convec-tive moisture adjustment time scale tc for use in moistadjustment parameterizations of cumulus convection insimple models. A time scale derived from the monthlyr–P relationship is appropriate for models of the quasi-steady seasonal tropical mean circulation such as theQuasi-equilibrium Tropical Circulation Model (QTCM)of Neelin and Zeng (2000) and simplifications thereof(e.g., Sobel 2003; Sobel and Gildor 2004). This is be-cause these models typically do not explicitly simulatethe large daily transients in convection. Instead they aretuned to produce a nearly steady-state solution that re-sembles a seasonal-mean climate and circulation. Toderive such a time scale, suppose that r is increasedfrom a typical reference value rref by a small amountdr, while column temperature changes insignificantly,so W* remains constant. The increased r raises the pre-cipitation rate by dP 5 dr dP/dr(rref). We define tc asthe time scale over which the precipitation increasewould remove the excess water vapor dW 5 W*dr fromthe column. Assuming reference values of saturationwater vapor path 5 72 mm and rref 5 0.72 typicalrefW*of regions of active tropical convection (the latter is themodal value of monthly mean r in the frequency plotin Fig. 6b), we obtain
refdW W*mt 5 5 ø 16 h. (3)c dP dP /dr(r )m ref
An analogous and slightly shorter convective moisture
1522 VOLUME 17J O U R N A L O F C L I M A T E
FIG. 6. (a) Distribution of monthly precipitation P in 1% bins of column-relative humidity r for all tropical oceangrid points in all months of 1998–2001. Dots show the 25th, 50th, and 75th percentiles of precipitation in each bin.The Xs show the bin-mean precipitation. The solid curve is the exponential fit (2) to the monthly data. For comparison,the dashed curve is the daily mean exponential fit (1). (b) Number of observations in each bin in the four regions.
adjustment time scale ø 12 h based on the daily r–dt c
P fit would be more appropriate if such a model wereused to simulate convective variability on time scalesof a few days. The time scale depends on rref and isshorter (longer) in a more (less) humid atmosphere.
c. Cross-spectral analysis
So far, we have established nonlinear relationshipsbetween r and simultaneous P on daily and monthlytime scales. We performed a cross-spectral analysis tosystematically examine how the relationship between Pand r depends on the time scale, and to see if phaselags between r and P are apparent at any time scale.Cross-spectral analysis is a powerful tool, but unlike thebinning analysis, cross-spectral analysis 1) requires fill-ing in of missing data, and 2) detects only a linear fit,even if the underlying relationship is nonlinear.
Only ocean grid points with data for at least 98% ofthe days during the entire 4-yr period, including boththe first or last day of the 4-yr period were used; thisrequirement only eliminated 3 of about 2000 grid points.At each grid point used, any days without data werefilled in by linear interpolation in time.
Cross-spectral analysis is best used to compare var-iables whose anticipated relationship is roughly linear.We also wished to weight regions and seasons of per-sistent precipitation. Our approach was to construct adaily ‘‘r-predicted’’ precipitation time series Pd(t) fromthe daily time series r(t) at each grid point using (1).The anticipated relationship, which is linear, is that ateach grid point
P(t) 5 P (t) 1 N(t),d (4)
where N(t) is temporally uncorrelated white noise (witha noise amplitude that may depend on the signal am-plitude Pd due to retrieval uncertainties and the physicaldependence of precipitation on physical variables otherthan r). While a multiplicative noise model might bemore physically plausible, the additive noise model hasthe advantage of de-emphasizing low-precipitation re-gimes where both our physical model and the satelliteretrieval are suspect.
We computed a cross spectrum of Pd versus. P at eachgrid point as follows. The 4-yr means of P and Pd ateach grid point were removed, then a cross-spectral es-timate for that grid point was produced using a Ham-ming window of 365 days, overlapping successive win-
1 APRIL 2004 1523B R E T H E R T O N E T A L .
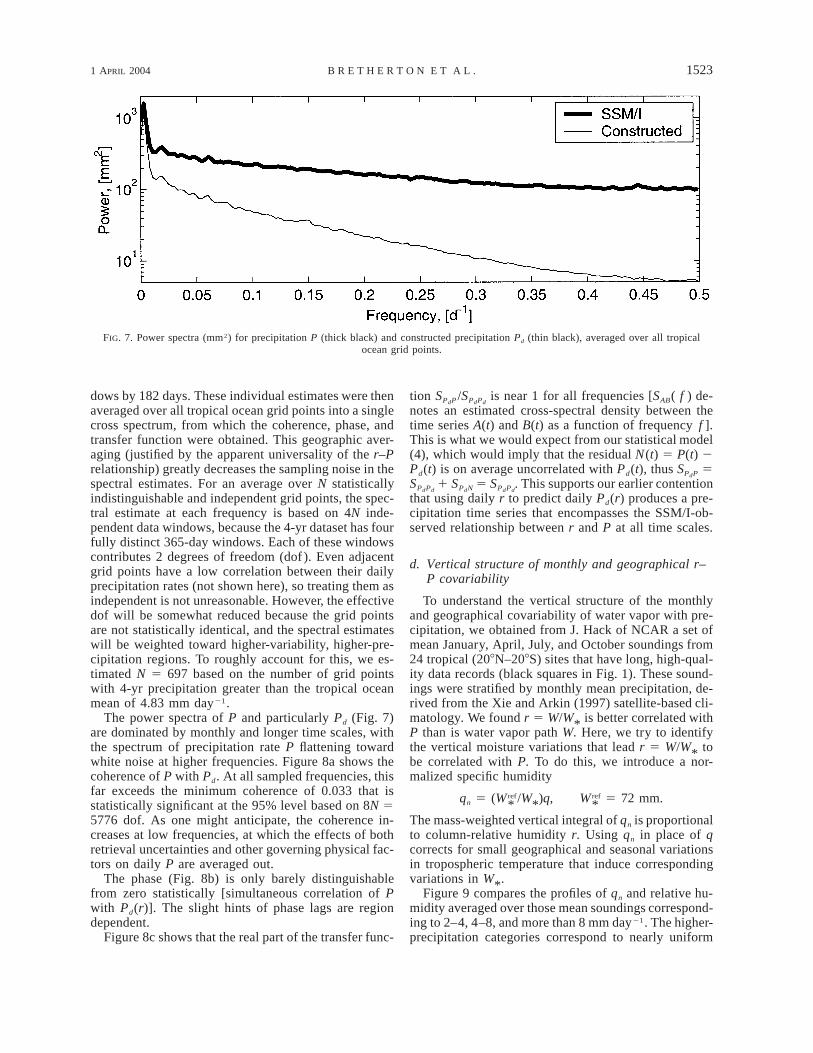
FIG. 7. Power spectra (mm2) for precipitation P (thick black) and constructed precipitation Pd (thin black), averaged over all tropicalocean grid points.
dows by 182 days. These individual estimates were thenaveraged over all tropical ocean grid points into a singlecross spectrum, from which the coherence, phase, andtransfer function were obtained. This geographic aver-aging (justified by the apparent universality of the r–Prelationship) greatly decreases the sampling noise in thespectral estimates. For an average over N statisticallyindistinguishable and independent grid points, the spec-tral estimate at each frequency is based on 4N inde-pendent data windows, because the 4-yr dataset has fourfully distinct 365-day windows. Each of these windowscontributes 2 degrees of freedom (dof ). Even adjacentgrid points have a low correlation between their dailyprecipitation rates (not shown here), so treating them asindependent is not unreasonable. However, the effectivedof will be somewhat reduced because the grid pointsare not statistically identical, and the spectral estimateswill be weighted toward higher-variability, higher-pre-cipitation regions. To roughly account for this, we es-timated N 5 697 based on the number of grid pointswith 4-yr precipitation greater than the tropical oceanmean of 4.83 mm day21.
The power spectra of P and particularly Pd (Fig. 7)are dominated by monthly and longer time scales, withthe spectrum of precipitation rate P flattening towardwhite noise at higher frequencies. Figure 8a shows thecoherence of P with Pd. At all sampled frequencies, thisfar exceeds the minimum coherence of 0.033 that isstatistically significant at the 95% level based on 8N 55776 dof. As one might anticipate, the coherence in-creases at low frequencies, at which the effects of bothretrieval uncertainties and other governing physical fac-tors on daily P are averaged out.
The phase (Fig. 8b) is only barely distinguishablefrom zero statistically [simultaneous correlation of Pwith Pd(r)]. The slight hints of phase lags are regiondependent.
Figure 8c shows that the real part of the transfer func-
tion S /S is near 1 for all frequencies [SAB( f ) de-P P P Pd d d
notes an estimated cross-spectral density between thetime series A(t) and B(t) as a function of frequency f ].This is what we would expect from our statistical model(4), which would imply that the residual N(t) 5 P(t) 2Pd(t) is on average uncorrelated with Pd(t), thus S 5P Pd
S 1 S 5 S . This supports our earlier contentionP P P N P Pd d d d d
that using daily r to predict daily Pd(r) produces a pre-cipitation time series that encompasses the SSM/I-ob-served relationship between r and P at all time scales.
d. Vertical structure of monthly and geographical r–P covariability
To understand the vertical structure of the monthlyand geographical covariability of water vapor with pre-cipitation, we obtained from J. Hack of NCAR a set ofmean January, April, July, and October soundings from24 tropical (208N–208S) sites that have long, high-qual-ity data records (black squares in Fig. 1). These sound-ings were stratified by monthly mean precipitation, de-rived from the Xie and Arkin (1997) satellite-based cli-matology. We found r 5 W/W* is better correlated withP than is water vapor path W. Here, we try to identifythe vertical moisture variations that lead r 5 W/W* tobe correlated with P. To do this, we introduce a nor-malized specific humidity
ref refq 5 (W /W )q, W 5 72 mm.n * * *The mass-weighted vertical integral of qn is proportionalto column-relative humidity r. Using qn in place of qcorrects for small geographical and seasonal variationsin tropospheric temperature that induce correspondingvariations in W*.
Figure 9 compares the profiles of qn and relative hu-midity averaged over those mean soundings correspond-ing to 2–4, 4–8, and more than 8 mm day21. The higher-precipitation categories correspond to nearly uniform

1524 VOLUME 17J O U R N A L O F C L I M A T E
FIG. 8. Cross spectra of daily SSM/I P and Pd(r): (a) coherence (dashed line demarcates the 95%-significancethreshold), (b) phase, (c) real part of transfer function.
moistening between the surface and 500 mb; above thislevel the relative humidity perturbations remain large,but the qn perturbations rapidly decrease. Even withoutnormalizing by W*, very similar results would be ob-tained. As expected from (2), a unit increase in monthlyprecipitation is associated with a much smaller increasein qn(p) in atmospheric columns that are already moremoist and rainy than in drier columns.
e. Vertical structure of daily r–P covariability
We used radiosonde data from the TRMM KwajaleinExperiment (KWAJEX; 23 July–15 September 1999),together with coincident area-averaged precipitation de-rived from the TRMM C-band ground validation radarat Kwajalein, to determine how the vertical moistureprofile varies with precipitation at a specific location atdaily time scales. During KWAJEX, frequent soundingswere taken at five sites within 150 km of KwajaleinIsland (8.78N, 167.78W). Four of these sites were onvery small islands; the other was a ship, so these sound-ings may be considered representative of an activelyconvecting region of the tropical ocean. As describedby Sobel et al. (2004), the KWAJEX soundings werecombined into a daily-mean all-site composite sounding,which is what we use here.
The Kwajalein radar made a volume scan every 10min. For each scan, Houze et al. (2003, manuscript sub-mitted to J. Hydrometeor.) derived rain maps with 2-km horizontal resolution out to 150-km radius aroundKwajalein over a 6-month period using a carefully cal-ibrated rainfall–reflectivity relationship. Beyond the150-km range, the lowest elevation (0.58) scans startnear the freezing level of 4.5 km, which prevents thisapproach from being extended farther. These rain mapswere area-averaged and daily averaged to derive area-averaged daily precipitation P(t).
We binned the daily mean KWAJEX soundings intocategories of P, and calculated average soundings of qn
for each category. We then subtracted the overall meanKWAJEX qn sounding to get category-average pertur-bation soundings. Figure 10 shows the profiles of qn andrelative humidity perturbations for each category.
The profiles show a strong increase of qn and relativehumidity with precipitation rate in the midtroposphere.Below 900 mb, qn is insensitive to P, presumably dueto rapid turbulent interactions with a sea surface of near-ly constant temperature. Again, almost identical resultsare obtained without normalizing by W*.
The sensitivity of these vertical qn profiles is some-what different than was seen in the climatologicalsoundings of Fig. 9, which included a range of locations

1 APRIL 2004 1525B R E T H E R T O N E T A L .
FIG. 9. Radiosonde-derived profiles of normalized monthly meanspecific humidity ( /W
*)q (left curves) and relative humidity (rightrefW
*curves), bin averaged by monthly mean Xie–Arkin precipitation (mmday21). The profiles are derived from Jan, Apr, Jul, and Oct clima-tologies at the 24 long-term radiosonde sites in 208S–208N shown inFig. 1.
FIG. 10. Daily mean KWAJEX radiosonde-derived perturbation (a)normalized specific humidity and (b) relative humidity profiles binaveraged by daily mean radar-derived precipitation rate (mm day21).
spanning a range of sea surface temperatures (SSTs). Inthat case, there was a general correlation of SST withboth P and near-surface q, so qn shows a stronger near-surface dependence on P. If we had more sonde sites,or a reanalysis that had highly accurate humidity pro-files, it would be interesting to stratify the climatologicaldataset into narrow SST ranges, then separately bin qn
against P for each SST to see if this removes the de-pendence of boundary layer qn on P, producing a ver-tical profile more similar to the KWAJEX daily varia-tions.
4. Validation using KWAJEX data
Passive microwave channels are well-suited to reli-able determination of W (Staelin et al. 1976), except inlocalized regions of intense precipitation (which areprobably anomalously moist, so could produce a smallsystematic underestimate of W if masked out to avoidcontaminating the retrieval.) The retrieval of precipi-tation from SSM/I is more uncertain. The algorithm usedby Remote Sensing Systems was designed to minimizecross talk among the retrieved parameters, and in par-ticular to remove the water vapor contribution from thebrightness temperature before computing the rain rate.Wentz (1997) showed the error in retrieved W (whencompared against radiosonde soundings) is uncorrelatedwith the retrieved P. This suggests that significant cor-
relations between W and P in our SSM/I dataset areunlikely to be due purely to the retrieval algorithm.
One may ask whether the retrieved P can really beused as a proxy for daily mean P on a 2.58 scale. Thereare large random retrieval errors inherent in the empir-ical algorithm to determine P for pixels in a given swath.Furthermore, the daily mean is derived from only 2–6instantaneous swaths per day, and convection evolvesrapidly. At a lesser level, the same concern also appliesto W.
There is an extensive literature regarding errors inmicrowave precipitation retrievals (e.g., Wentz 1997;Kummerow and Giglio 1994) and undersampling biases(e.g., Morrissey and Janowiak 1996). However, therehas been a dearth of long in situ radar datasets over thetropical ocean for validation; this has been a majorTRMM motivation for maintaining the Kwajaleinground validation radar since 1999. Thus, we comparedtwo area-averaged daily precipitation datasets derivedfrom the Kwajalein radar with the daily SSM/I data.The first was the 150-km-radius dataset discussed in

1526 VOLUME 17J O U R N A L O F C L I M A T E
FIG. 11. Time series from 26 Jul to 14 Sep 1999 of Kwajalein radar-derived daily precipitation averaged over 150- and 240-km-radiuscircles and daily averaged SSM/I P over a collocated rectangular region of intermediate size.
FIG. 12. Comparison of daily averaged KWAJEX all-site composite radiosonde and SSM/I water vapor path from 26 Jul to 14 Sep 1999.
section 3e, available for July–December 1999. The sec-ond was an estimate of precipitation area averaged overa larger 240-km-radius circle. This was derived usinga cruder method (as described below), but was availablefor three Kwajalein rainy seasons (July–December,1999–2001) instead of one, courtesy of Dr. S. Yuter.Every 10 min, the radar made an 0.58 elevation scanwith a low pulse repetition frequency that extended itsmaximum range to 240 km. For each such scan, weestimated the area-averaged P (mm day21) over this240-km circle as a constant multiple c 5 91 of the areafraction A(t) of this scan covered by echo exceeding 20dBZ. The multiplier c was obtained by regressing thisarea fraction versus the simultaneous area-averaged pre-cipitation derived by Houze et al. over the smaller 150-km circle for July–December 1999.
For comparison with these radar-derived precipitationdatasets, the SSM/I data were averaged over the closesttwo 2.58 3 2.58 grid boxes to Kwajalein, centered at8.758N, 168.758W, and 8.758N, 166.258W. This regioncontains most of the 150-km-radius circle centered on
Kwajalein, but lies mainly inside the 240-km-radius cir-cle.
Figure 11 shows this comparison for the KWAJEXperiod. The two radar datasets generally (though notinvariably) track each other very closely, with a cor-relation coefficient exceeding 0.9 over July–December1999, their overlap period. Hence, using exactly over-lapping areas to compare area-averaged daily precipi-tation in this region appears not to be crucial. This jus-tifies comparing the 240-km radar dataset with the twoSSM/I grid boxes even though the two do not exactlyspan the same area. Also, use of the area-fraction meth-od for precipitation estimation (for which we have thelonger data record) appears adequately accurate for thiswork.
Figure 11 shows that SSM/I captures most of theheaviest daily rainfall events despite its temporal un-dersampling. It tends to significantly overpredict thelarge rain events (with considerable scatter) and under-estimate the intervening light shower activity, with aroughly 40% overestimate of the time-mean precipita-

1 APRIL 2004 1527B R E T H E R T O N E T A L .
FIG. 13. (a) Daily 240-km radius area-averaged Kwajalein radar-derived precipitation for Jul–Dec 1999–2001 vs SSM/I-derived r,binned by r bins of width 0.02. Dots show the 25th, 50th, and 75thpercentiles of precipitation in each bin. The Xs show the bin-meanprecipitation. The dashed curve is the SSM/I-derived exponential fit(1); (b) as in (a), but with SSM/I-derived Kwajalein-area precipita-tion; (c) bin frequency.
tion compared to radar. Over the full 18-month com-parison period, the correlation coefficient between thedaily 240-km radar and SSM/I precipitation is 0.69 anda cross-spectral analysis shows coherence exceeding 0.5(the 95% statistical significance level is 0.25) at all pe-riods down to the Nyquist period of 2 days. At periodslonger than 4 days the coherence is higher, 0.7 or more.This comparison gives us confidence that SSM/I-basedprecipitation in individual grid boxes is meaningful evendown to periods of a few days.
Figure 12 shows a comparison over the same twomonths of daily W from SSM/I with rawinsonde ob-servations from KWAJEX. Each daily sonde-derivedwater vapor path is an average of all sonde ascents(typically 15–30) during the day at four small islandsand a ship, all scattered within 160 km of the Kwajaleinradar each day (Sobel et al. 2004). Based on simulta-neous comparisons between sites, we estimate the ran-dom sampling uncertainty in the daily average sondewater vapor path to be 0.7 mm. The correlation ofSSM/I and sonde water vapor path over the KWAJEXperiod, 25 July–14 September 1999, was 0.82. Together,Figs. 11 and 12 lend credibility to SSM/I-derived re-lationships between P and W or r.
We used the 18 months of 240-km radar data to con-struct the distribution of daily radar-derived area-aver-aged P after binning by SSM/I-derived r, shown in Fig.13a. Because both of these are comparatively accurateproducts, we hope this plot represents the true relation-ship of P to r on daily time scales and 300-km spacescales better than if we used SSM/I-derived daily pre-cipitation (Fig. 13b). The latter plot matches the globalocean r–P fit (1) quite well, confirming that the r–Prelationship in the Kwajalein region is typical of thewarm tropical oceans.
Figure 13a shows a slower increase of bin-mean Pwith r than Fig. 13b. This may reflect the SSM/I ten-dency to overestimate strong precipitation events whileunderestimating weak area-averaged precipitation ratesaround Kwajalein. There is also much less scatter(smaller 75th–25th percentile spread) of the radar-de-rived P about its bin mean than with the SSM/I P. Largerandom retrieval errors on the daily SSM/I P are likelyartificially broadening its distribution for a given r. Fig-ure 13c shows that we have sampled the range 0.7 ,r , 0.8 with at least 50 samples bin21. Signals at drierr, such as the secondary maximum of P at r 5 0.67seen in both Figs. 13a,b are uncertain due to inadequatesampling.
Although we have not done this, a somewhat similaranalysis could be done over the global tropical oceanusing the TRMM Precipitation Radar (PR) and TMI-derived r to build up a plot like Fig. 4. The TRMMsampling is less frequent and the PR footprint is muchsmaller than SSM/I, but the PR-derived rainfall is pre-sumably more accurate than microwave estimates ondaily time scales and is always obtained in a regionsimultaneously scanned by TMI.
5. Conclusions
Four years of daily SSM/I retrievals were used to lookfor relationships between tropical oceanic rainfall P andwater vapor path W on daily to seasonal time scales.
1528 VOLUME 17J O U R N A L O F C L I M A T E
Relationships that hold across all tropical ocean regionsand seasons can be found if W is divided by the saturatedwater vapor path (derived from the column temperatureprofile) to obtain a column-relative humidity r 5 W/W*. For monthly (‘‘m’’) and daily (‘‘d’’) data, these canbe fit to the form Pm,d 5 exp[am,d(r 2 rm,d)]; the choicesof constants are different for daily than for monthly data.The scatter around these fits was characterized usingplots of quartiles of the distribution of P in bins of r.The monthly fit can be obtained from the daily fit andthe observed distribution of daily r found in a givenmonth and location.
Cross-spectral analysis shows that at all periods from2 to 180 days, P and the predicted daily Pd(r) are almostexactly in phase, and are strongly correlated with almostno phase lag, though with more scatter at short, partic-ularly at low frequencies. Radiosonde composites showthe increased r at higher rainfall rates is due to a broadspecific humidity increase between 400 and 850 hPa ondaily time scales. The precipitation-related humidityanomalies extend down to the surface for monthly timescales.
That more convective rainfall should be associatedwith a more humid atmosphere is no surprise, but whenquantified, this is an appealing test of convective pa-rameterizations in weather and climate prediction mod-els. In particular, it suggests that deep convective pa-rameterizations that relax the humidity to a fixed ref-erence profile [e.g., the Betts–Miller scheme (Betts1986)] might perform better if the reference relativehumidity profile were adjusted to be precipitation de-pendent. Alternatively, these schemes should use amoisture adjustment time scale tc of roughly 12 h forhorizontal grid spacings on the order of 300 km, how-ever, their temperature profile may be adjusted. This tc
is much larger than the time scale of 1–2 h that hastypically been used (Betts 1986).
Acknowledgments. This work was sponsored byNASA Grants NAGS5-10624 and NAG5-9657, andNSF Grant DMS-0139794. An earlier SSM/I dataset thatgot this work started was obtained from Chelle Gen-temann of Remote Sensing Systems. The SSM/I datasetanalyzed here was also obtained from Remote SensingSystems, sponsored in part, by NASA’s Earth ScienceInformation Partnerships (ESIP): a federation of infor-mation sites for earth science; and by the NOAA/NASAPathfinder Program for early EOS products; principalinvestigator: Frank Wentz. Dr. Sandra Yuter kindly pro-vided us with 240-km echo area fraction time series forthe Kwajalein radar scans. The radiosonde dataset wasprovided by James Hack and Mark Stevens of NCAR.
Discussions with Dave Raymond helped inspire thiswork.
REFERENCES
Betts, A. K., 1986: A new convective adjustment scheme. Part I:Observational and theoretical basis. Quart. J. Roy. Meteor. Soc.,112, 677–691.
Brown, R. G., and C. Zhang, 1997: Variability of midtroposphericmoisture and its effect on cloud-top height distribution duringTOGA COARE. J. Atmos. Sci., 54, 2760–2774.
Johnson, R. H., and X. Lin, 1997: Episodic trade wind regimes overthe western Pacific warm pool. J. Atmos. Sci., 54, 2020–2034.
Kummerow, C., and L. Giglio, 1994: A passive microwave techniquefor estimating rainfall and vertical structure information fromspace. Part II: Applications to SSM/I data. J. Appl. Meteor., 33,19–34.
Morrissey, M. L., and J. E. Janowiak, 1996: Sampling-induced con-ditional biases in satellite climate-scale rainfall estimates. J.Appl. Meteor., 35, 541–548.
Neelin, J. D., and N. Zeng, 2000: A quasi-equilibrium tropical cir-culation model—Formulation. J. Atmos. Sci., 57, 1741–1766.
Numaguti, A., R. Oki, K. Nakamura, K. Tsuboki, N. Misawa, T. Aisai,and Y.-M. Kodama, 1995: 4–5-day-period variation and low-level dry air observed in the equatorial western Pacific duringthe TOGA-COARE IOP. J. Meteor. Soc. Japan, 73, 267–290.
Raymond, D. J., 2000: Thermodynamic control of tropical rainfall.Quart. J. Roy. Meteor. Soc., 126, 889–898.
Sherwood, S. C., 1999: Convective precursors and predictability inthe tropical west Pacific. Mon. Wea. Rev., 127, 2977–2991.
——, and R. Wahrlich, 1999: Observed evolution of tropical deepconvective events and their environment. Mon. Wea. Rev., 127,1777–1795.
Sobel, A. H., 2003: On the coexistence of an evaporation minimumand precipitation maximum in the warm pool. J. Climate, 16,1003–1009.
——, and H. Gildor, 2003: A simple time-dependent model of SSThot spots. J. Climate, 16, 3978–3992.
——, S. E. Yuter, C. S. Bretherton, and G. N. Kiladis, 2004: Large-scale meteorology and deep convection during TRMM KWA-JEX. Mon. Wea. Rev., 122, 422–444.
Staelin, D. H., K. F. Kunzi, R. L. Pettyjohn, R. K. L. Poon, and R.W. Wilcox, 1976: Remote sensing of atmospheric water vaporand liquid water with the Nimbus 5 microwave spectrometer. J.Appl. Meteor., 15, 1204–1214.
Ushiyama, T., S. Satoh, and K. Takeuchi, 1995: Time and spatialvariations of mesoscale rainfalls and their relation to the large-scale field in the western tropical Pacific. J. Meteor. Soc. Japan,73, 379–392.
Wentz, F. J., 1997: A well-calibrated ocean algorithm for SSM/I. J.Geophys. Res., 102, 8703–8718.
——, and R. W. Spencer, 1998: SSM/I rain retrievals within a unifiedall-weather ocean algorithm. J. Atmos. Sci., 55, 1613–1627.
Xie, P., and P. A. Arkin, 1997: Global precipitation: A 17-year month-ly analysis based on gauge observations, satellite estimates, andnumerical model outputs. Bull. Amer. Meteor. Soc., 78, 2539–2558.
Yoneyama, K., and T. Fujitani, 1995: The behavior of dry westerlyair associated with convection observed during the TOGA-COARE R/V Natsushima cruise. J. Meteor. Soc. Japan, 73, 291–304.
Zeng, X., 1999: The relationship among precipitation, cloud-top tem-perature, and precipitable water over the Tropics. J. Climate, 12,2503–2514.