Relationships Between Leaf Nitrogen and Limitations
12
Relationships between leaf nitrogen and limitations of photosynthesis in canopies of Solidago altissima Philipp Egli a * , Bernhard Schmid b a Swiss Federal Institute for Forest, Snow and Landscape Research (WSL), CH-8903 Birmensdorf, Switzerland. b Institut für Umweltwissenschaften, University of Zurich, Winterthurerstr. 190, CH-8057 Zürich, Switzerland. Received January 4, 1999; revised May 14, 1999; accepted July 12, 1999 Abstract — Vertical distribution patterns of light, leaf nitrogen, and leaf gas exchange through canopies of the clonal perennial Solidago altissima were studied in response to mowing and fertilizer application in a field experiment. Consistent with the distribution of light, average leaf nitrogen content followed a ‘smooth’ exponential decline along the fertilized stands both in control and mown plots. The nitrogen profile along the unfertilized stands in mown plots, however, was ‘disrupted’ by high-nitrogen leaves at the top of shorter ramets that only reached intermediate strata of the canopies. Hence, in these stands leaf nitrogen was significantly increased in short ramets compared with tall ramets for a given light environment, suggesting suboptimal stand structure but not necessarily suboptimal single-ramet architecture. However, at least under the climatic conditions observed during measurements, such disrupture had no substantial effect on stand productivity: model calculations showed that vertical distribution patterns of leaf nitrogen along ramets only marginally influenced the photosynthetic performance of ramets and stands. This is explained by the observed photosynthesis-nitrogen relationship: the rate of photosynthesis per unit amount of leaf nitrogen did not increase with leaf nitrogen content even under saturating light levels indicating that leaf photosynthesis was not nitrogen limited during the measurement periods. Nevertheless, our study indicates that consideration of how architecture(s) of adjacent individual plants interact could be essential for a better understanding of the trade-offs between individual and canopy characteristics for maximizing carbon gain. Such trade-offs may end up in a suboptimal canopy structure, which could not be predicted and understood by classical canopy optimization models. © 1999 Éditions scientifiques et médicales Elsevier SAS Canopy structure / carbon limitation / individual vs. stand optimization / light distribution / nitrogen limitation / photosynthesis 1. INTRODUCTION Leaves within a canopy experience very different light environments which is reflected by characteristic distribution patterns of photosynthetic activity. Foliar nitr ogen content is anot her impo rtant factor link ed wit h ph oto sy nth esis. Th is is indicated by th e wel l known positive correlation between the nitrogen con- tent of a leaf and its photosynthetic activity under saturating photosynt hetically active photon flux densi- ties [6, 8, 9, 10, 11, 13, 29, 30 ]. If the ni tr og en allocation to leaves within a canopy were to match their light interception, then foliar nitrogen content should be higher in well illuminated leaves at the top than in shaded leaves at th e bo tt om of a ca no py . Generally, the overall productivity of a plant stand sho uld be op timize d wh en the distri but ion of leaf nitrogen ideally tracks that of light [7, 16, 18, 19, 20]. However, in stands where plants differ in height, the upper (younger) leaves of shorter plants may occupy the same position in the light gradient as the older (lower) leaves of taller plants. Given the effect of leaf age on lea f nit rog en content, wit h you nge r lea ves having higher nitrogen contents than older ones [16, 29], the ‘smooth’ exponential decline in the vertical distribution of leaf nitrogen may be ‘disrupted’ by high-nitrogen leaves at the top of shorter ramets in such stands [5]. More generally, optimization at the stand level may be in ‘conflict’ with optimization at th e rame t le vel [23], an is sue th at has no t be en considered in classical canopy optimization models (e.g. [ 7, 12, 18, 19]). To address this question, we studied height distri- butions of light and leaf nitrogen as well as correla- tions between leaf nitrogen and single-leaf gas ex- cha ng e cha rac ter ist ics in a nat ura l po pul ation of * Corr espon ding author (fax: +41 1 739 2215; e-mail: philipp.eg li@ws l.ch) Acta Oecologica 20 (5) (1999) 559−570 / © 1999 Éditions scientifiques et médicales Elsevier SAS. All rights reserved.
-
Upload
agustine-christela-melviana -
Category
Documents
-
view
217 -
download
0
Transcript of Relationships Between Leaf Nitrogen and Limitations

8/10/2019 Relationships Between Leaf Nitrogen and Limitations
http://slidepdf.com/reader/full/relationships-between-leaf-nitrogen-and-limitations 1/12
Relationships between leaf nitrogen and limitationsof photosynthesis in canopies of Solidago altissima
Philipp Egli a*, Bernhard Schmid b
a Swiss Federal Institute for Forest, Snow and Landscape Research (WSL), CH-8903 Birmensdorf, Switzerland.b Institut für Umweltwissenschaften, University of Zurich, Winterthurerstr. 190, CH-8057 Zürich, Switzerland.
Received January 4, 1999; revised May 14, 1999; accepted July 12, 1999
Abstract — Vertical distribution patterns of light, leaf nitrogen, and leaf gas exchange through canopies of the clonal perennial Solidago
altissima were studied in response to mowing and fertilizer application in a field experiment. Consistent with the distribution of light, average
leaf nitrogen content followed a ‘smooth’ exponential decline along the fertilized stands both in control and mown plots. The nitrogen profilealong the unfertilized stands in mown plots, however, was ‘disrupted’ by high-nitrogen leaves at the top of shorter ramets that only reachedintermediate strata of the canopies. Hence, in these stands leaf nitrogen was significantly increased in short ramets compared with tall rametsfor a given light environment, suggesting suboptimal stand structure but not necessarily suboptimal single-ramet architecture. However, at leastunder the climatic conditions observed during measurements, such disrupture had no substantial effect on stand productivity: model calculationsshowed that vertical distribution patterns of leaf nitrogen along ramets only marginally influenced the photosynthetic performance of ramets andstands. This is explained by the observed photosynthesis-nitrogen relationship: the rate of photosynthesis per unit amount of leaf nitrogen didnot increase with leaf nitrogen content even under saturating light levels indicating that leaf photosynthesis was not nitrogen limited during themeasurement periods. Nevertheless, our study indicates that consideration of how architecture(s) of adjacent individual plants interact could beessential for a better understanding of the trade-offs between individual and canopy characteristics for maximizing carbon gain. Such trade-offsmay end up in a suboptimal canopy structure, which could not be predicted and understood by classical canopy optimization models. © 1999Éditions scientifiques et médicales Elsevier SAS
Canopy structure / carbon limitation / individual vs. stand optimization / light distribution / nitrogen limitation / photosynthesis
1. INTRODUCTION
Leaves within a canopy experience very differentlight environments which is reflected by characteristicdistribution patterns of photosynthetic activity. Foliarnitrogen content is another important factor linkedwith photosynthesis. This is indicated by the wellknown positive correlation between the nitrogen con-
tent of a leaf and its photosynthetic activity undersaturating photosynthetically active photon flux densi-ties [6, 8, 9, 10, 11, 13, 29, 30]. If the nitrogenallocation to leaves within a canopy were to matchtheir light interception, then foliar nitrogen contentshould be higher in well illuminated leaves at the topthan in shaded leaves at the bottom of a canopy.Generally, the overall productivity of a plant standshould be optimized when the distribution of leaf nitrogen ideally tracks that of light [7, 16, 18, 19, 20].
However, in stands where plants differ in height, theupper (younger) leaves of shorter plants may occupythe same position in the light gradient as the older(lower) leaves of taller plants. Given the effect of leaf age on leaf nitrogen content, with younger leaveshaving higher nitrogen contents than older ones [16,29], the ‘smooth’ exponential decline in the verticaldistribution of leaf nitrogen may be ‘disrupted’ byhigh-nitrogen leaves at the top of shorter ramets insuch stands [5]. More generally, optimization at thestand level may be in ‘conflict’ with optimization atthe ramet level [23], an issue that has not beenconsidered in classical canopy optimization models(e.g. [7, 12, 18, 19]).
To address this question, we studied height distri-butions of light and leaf nitrogen as well as correla-tions between leaf nitrogen and single-leaf gas ex-change characteristics in a natural population of
* Corresponding author (fax: +41 1 739 2215; e-mail: [email protected])
Acta Oecologica 20 (5) (1999) 559−570 / © 1999 Éditions scientifiques et médicales Elsevier SAS. All rights reserved.

8/10/2019 Relationships Between Leaf Nitrogen and Limitations
http://slidepdf.com/reader/full/relationships-between-leaf-nitrogen-and-limitations 2/12
Solidago altissima L., which shows considerablevariation in ramet height [28]. S. altissima is a clonal,herbaceous perennial which forms unbranched, annualabove-ground ramets that grow out from short, over-wintering rhizomes. The species has been introducedfrom North America to Europe about 300 yearsago [33] and for the past 100 years has become highlyinvasive. To better understand the relationship be-tween leaf nitrogen and photosynthetic productivity,we subjected the population of S . altissima to experi-mental manipulation which involved yearly mowing inlate summer and fertilizer addition. Mowing wasapplied to manipulate the leaf area and the canopystructure of the plant stands; fertilizer was added tomanipulate leaf nitrogen content. Based on the mea-surements made in the experimental part, we con-structed a mechanistic model scaling up from single-leaf photosynthesis to daily carbon gain of individualramets of S . altissima. The model was used to assessthe effects of the changed plant architecture undermowing on ramet productivity and to examine whetherthere is a conflict between ramet and stand optimiza-tion in this species.
2. MATERIALS AND METHODS
2.1. Experimental design and measurements
Solidago altissima is native to North America andhas become one of the most successful plant invadersin Central Europe in the course of the 20th century.The study presented here was carried out at anold-field site located near Basle, Switzerland(47°30’ N, 7°36’ E, altitude 280 m, see [28] for furtherinformation). It was part of a project which examined
the invading potential of this species under differentexperimental manipulations, i.e. yearly mowing andnutrient addition. The experimental design had arandomized block structure with three blocks contain-ing two plots each (10 × 16 m; figure 1). From1987–1991, one plot in each block was mown yearlyin late summer and the other one was left undisturbed(referred to as mown and control plots in the follow-ing). Above-ground plant parts of Solidago altissimaand all co-occurring species were cut at a height of 5 cm and removed from the mown plots. In April 1991in each plot, four ‘stands’ of 2 × 2 m were randomlyselected ( figure 1) and two of them fertilized with
liquid N-P-K fertilizer (0.8 g N⋅
m
–2
, 0.3 g P⋅
m
–2
,0.7 g K⋅m–2) at monthly intervals from March–May1991 and with ‘slow release’ granular N-P-K(8 g N⋅m–2, 4 g P⋅m–2, 8 g K⋅m–2) in June 1991. Thefollowing three data sets were collected in 1990 and1991.
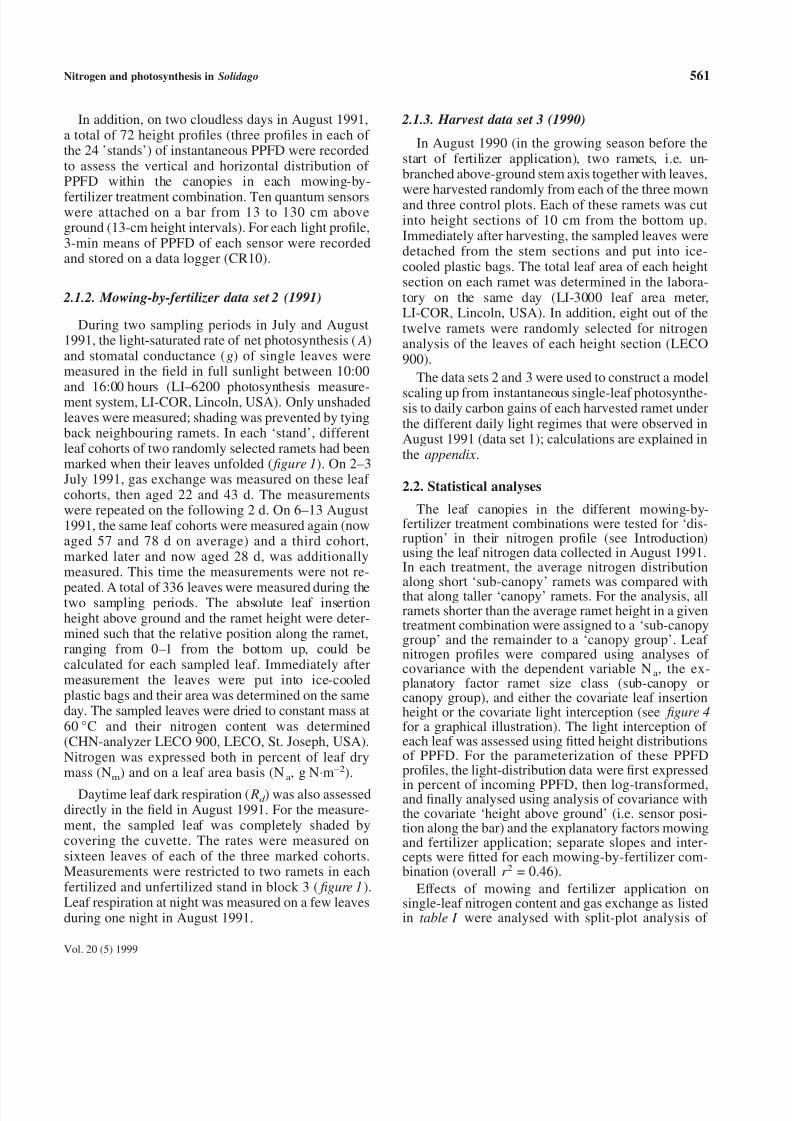
2.1.1. Microclimatic measurements (data set 1)
Photosynthetically active photon flux density(PPFD, µmol quanta⋅m–2
⋅s–1) at the top of the canopy,air temperature at 40 cm above ground, and soiltemperature and soil water potential at 10 cm belowthe soil surface were measured at the field site
throughout the study period ( figure 1). Soil waterpotential was assessed with cylindrical soil moistureblocks (Delmhorst 227, Campbell Scientific, SuttonBonington, England). Temperature probes and mois-ture blocks were placed in one mown and one adjacentcontrol plot outside the ‘stands’ established in 1991(see figure 1 for sensor locations). Microclimate mea-surements were taken every 30 s and the hourly meanswere continuously stored on a data logger (CR10,Campbell Scientific, Sutton Bonington, England).
Figure 1. Sketch of the studysite: blocks, plots (control andmown; established in 1987) andstands (unfertilized and fertil-ized; established in 1991) werearranged in a split-plot design.See text for further explanations.
560 P. Egli, B. Schmid
Acta Oecologica
8/10/2019 Relationships Between Leaf Nitrogen and Limitations
http://slidepdf.com/reader/full/relationships-between-leaf-nitrogen-and-limitations 3/12

8/10/2019 Relationships Between Leaf Nitrogen and Limitations
http://slidepdf.com/reader/full/relationships-between-leaf-nitrogen-and-limitations 4/12
variance. The nitrogen data were log-transformed forthe analyses because they were log-normally distrib-uted; means predicted from analysis of variance were
back-transformed from log-scale. Statistical tests (F -tests) were made at the levels given by the hierarchicalstructure of the experimental layout, e.g. mowingeffects were tested against plot effects, whereas fertil-izer effects and mowing-by-fertilizer interactions weretested against stand effects. The relative position of each leaf along the ramet (ranging from 0–1 from thebottom up) was included as a covariate in theseanalyses in order to assess height variations of N
m, N
a,
A, g and Rd . Finally, multiple linear regression was
used to assess the effects of Na and g on A. The aboveanalyses were used to parameterize the relationshipslisted in step 1 in the appendix.
3. RESULTS
3.1. Microclimate at the study site
Thirty-day running means of air and soil tempera-ture as recorded in one control and one mown plotduring the growing season 1991 are shown in figure 2aand b, respectively. Air temperatures were similar inthe two plots, whereas soil temperature was higher in
Table I. Split-plot analysis of variance for leaf nitrogen concentration (Nm, in % of leaf dry mass), leaf nitrogen content per unit leaf area (Na,g N⋅m–2), light-saturated rate of photosynthesis ( A), and stomatal conductance (g). Photosynthesis and conductance were measured simultaneouslyin each sampled leaf (n = 336). The nitrogen data were log-transformed for the analyses. Each term in the analyses (terms of interest in bold)was tested at the relevant error level given by the hierarchic structure of the mowing-by-fertilizer experiment (see section 2.2). The relativeposition of each leaf along the ramet was included as a covariate; nitrogen declined exponentially from the top downwards along the leaf population of the ramets as shown by the linear decreases on the log-scale. Mean squares (MS) and F -probabilities are listed; levels of
significance: * P < 0.05; ** P < 0.01; *** P < 0.001.
df Nm Na A g
MS Sign. MS Sign. MS Sign. MS Sign.
Source of variation
Date (July or August 1991) 1 3.547 * 9.931 * 94.2 n.s. 1.726 n.s.
Block
Effect pooled across dates (main effect) 2 0.280 n.s. 0.263 n.s. 129.4 ** 0.111 ***
Separate effects for July and August(interaction with time)
2 0.061 n.s. 0.050 n.s. 285.3 ** 0.274 *
Mowing
Effect pooled across dates 1 0.179 n.s. 0.660 n.s. 60.7 * 0.120 ***
Separate effects for July and August 1 0.177 n.s. 0.182 n.s. 267.0 **1
0.126 n.s.Plot
Effect pooled across dates 2 0.202 n.s. 0.121 n.s. 0.6 n.s. < 0.001 n.s.
Separate effects for July and August 2 0.052 n.s. 0.062 n.s. 2.4 n.s. 0.029 n.s.
Fertilizer
Effect pooled across dates 1 4.391 *** 3.388 ** 235.7 * < 0.001 n.s.
Separate effects for July and August 1 0.001 n.s. 0.069 n.s. 0.2 n.s. 0.007 n.s.
Mowing-by-fertilizer interaction
Effect pooled across dates 1 0.011 n.s. 0.034 n.s. 130.1 n.s. 0.328 *
Separate effects for July and August 1 0.628 ** 0.556 * 10.9 n.s. 0.088 n.s.
Stand
Effect pooled across dates 16 0.185 ** 0.232 * 48.7 * 0.069 n.s.
Separate effects for July and August 16 0.046 ** 0.073 n.s. 19.2 n.s. 0.039 **
Ramet (separate effects for each of the threereplicated measurements per ramet)
96 0.019 n.s. 0.066 *** 15.4 *** 0.015 ***
Relative position of the leaf along the ramet
(ranging from 0–1 from the bottom up)1 3.614 *** 3.917 *** 737.0 *** 0.191 ***
Residual 191 0.019 0.028 6.0 0.004
Total 335 0.068 0.108 18.1 0.022
1 Positive effect of mowing in August (+35 %) but not in July.
562 P. Egli, B. Schmid
Acta Oecologica
8/10/2019 Relationships Between Leaf Nitrogen and Limitations
http://slidepdf.com/reader/full/relationships-between-leaf-nitrogen-and-limitations 5/12
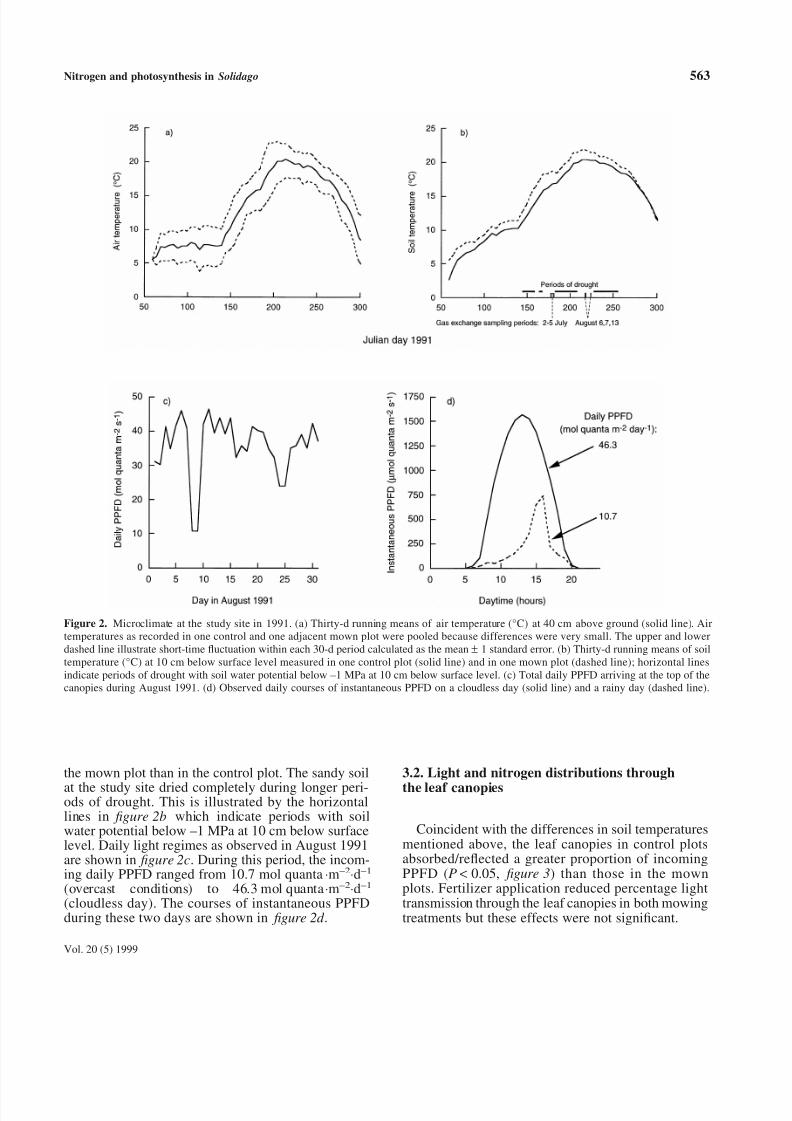
the mown plot than in the control plot. The sandy soil
at the study site dried completely during longer peri-ods of drought. This is illustrated by the horizontallines in figure 2b which indicate periods with soilwater potential below –1 MPa at 10 cm below surfacelevel. Daily light regimes as observed in August 1991are shown in figure 2c. During this period, the incom-ing daily PPFD ranged from 10.7 mol quanta⋅m–2
⋅d–1
(overcast conditions) to 46.3 mol quanta⋅m–2⋅d–1
(cloudless day). The courses of instantaneous PPFDduring these two days are shown in figure 2d .
3.2. Light and nitrogen distributions through
the leaf canopies
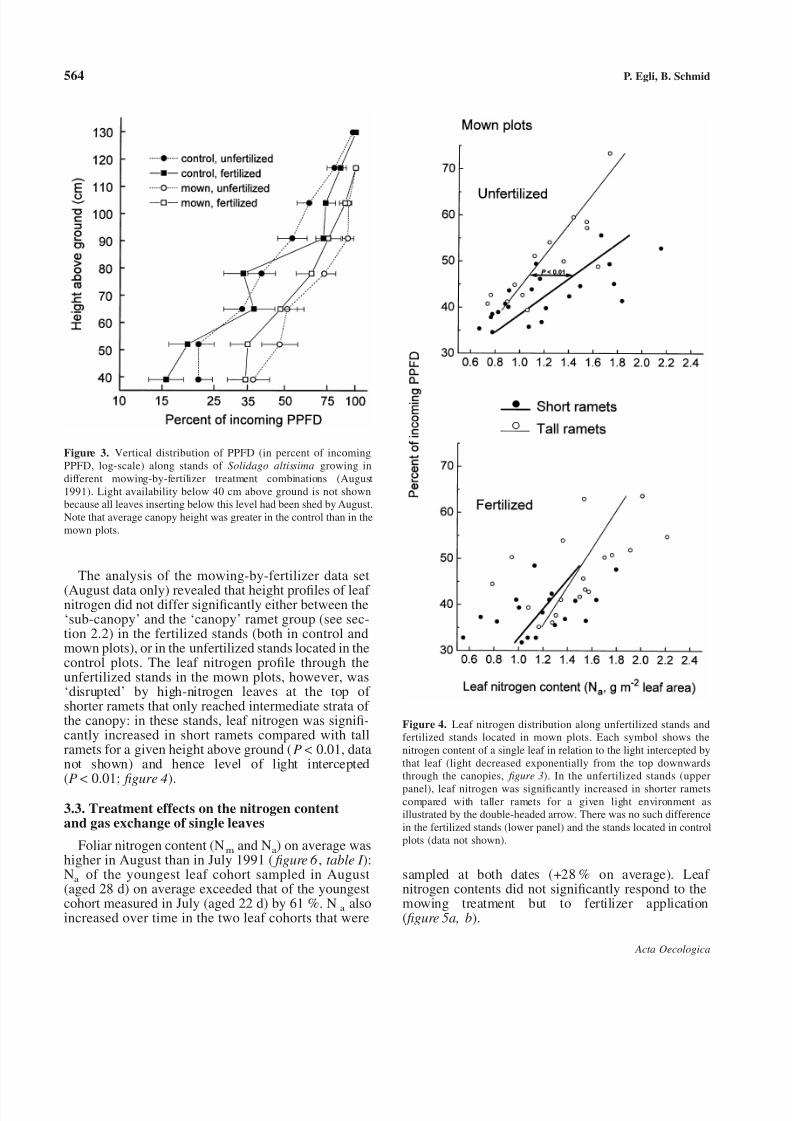
Coincident with the differences in soil temperaturesmentioned above, the leaf canopies in control plotsabsorbed/reflected a greater proportion of incomingPPFD (P < 0.05, figure 3) than those in the mownplots. Fertilizer application reduced percentage lighttransmission through the leaf canopies in both mowingtreatments but these effects were not significant.
Figure 2. Microclimate at the study site in 1991. (a) Thirty-d running means of air temperature (°C) at 40 cm above ground (solid line). Airtemperatures as recorded in one control and one adjacent mown plot were pooled because differences were very small. The upper and lowerdashed line illustrate short-time fluctuation within each 30-d period calculated as the mean ± 1 standard error. (b) Thirty-d running means of soiltemperature (°C) at 10 cm below surface level measured in one control plot (solid line) and in one mown plot (dashed line); horizontal linesindicate periods of drought with soil water potential below –1 MPa at 10 cm below surface level. (c) Total daily PPFD arriving at the top of thecanopies during August 1991. (d) Observed daily courses of instantaneous PPFD on a cloudless day (solid line) and a rainy day (dashed line).
Nitrogen and photosynthesis in Solidago 563
Vol. 20 (5) 1999
8/10/2019 Relationships Between Leaf Nitrogen and Limitations
http://slidepdf.com/reader/full/relationships-between-leaf-nitrogen-and-limitations 6/12
The analysis of the mowing-by-fertilizer data set
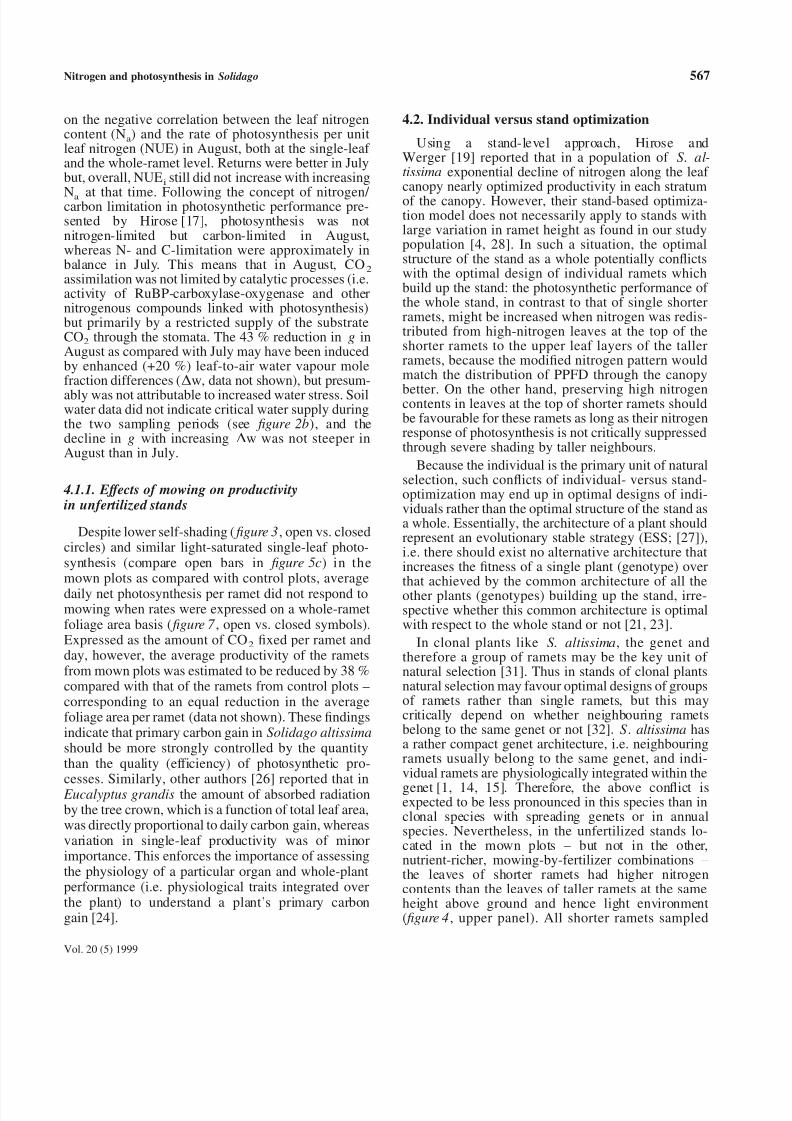
(August data only) revealed that height profiles of leaf nitrogen did not differ significantly either between the‘sub-canopy’ and the ‘canopy’ ramet group (see sec-tion 2.2) in the fertilized stands (both in control andmown plots), or in the unfertilized stands located in thecontrol plots. The leaf nitrogen profile through theunfertilized stands in the mown plots, however, was‘disrupted’ by high-nitrogen leaves at the top of shorter ramets that only reached intermediate strata of the canopy: in these stands, leaf nitrogen was signifi-cantly increased in short ramets compared with tallramets for a given height above ground (P < 0.01, datanot shown) and hence level of light intercepted
(P <
0.01; figure 4).3.3. Treatment effects on the nitrogen contentand gas exchange of single leaves
Foliar nitrogen content (Nm
and Na) on average was
higher in August than in July 1991 ( figure 6 , table I ):N
a of the youngest leaf cohort sampled in August
(aged 28 d) on average exceeded that of the youngestcohort measured in July (aged 22 d) by 61 %. N
a also
increased over time in the two leaf cohorts that were
sampled at both dates (+28 % on average). Leaf nitrogen contents did not significantly respond to themowing treatment but to fertilizer application( figure 5a, b).
Figure 3. Vertical distribution of PPFD (in percent of incomingPPFD, log-scale) along stands of Solidago altissima growing indifferent mowing-by-fertilizer treatment combinations (August1991). Light availability below 40 cm above ground is not shownbecause all leaves inserting below this level had been shed by August.Note that average canopy height was greater in the control than in themown plots.
Figure 4. Leaf nitrogen distribution along unfertilized stands andfertilized stands located in mown plots. Each symbol shows thenitrogen content of a single leaf in relation to the light intercepted bythat leaf (light decreased exponentially from the top downwardsthrough the canopies, figure 3). In the unfertilized stands (upper
panel), leaf nitrogen was significantly increased in shorter rametscompared with taller ramets for a given light environment asillustrated by the double-headed arrow. There was no such differencein the fertilized stands (lower panel) and the stands located in controlplots (data not shown).
564 P. Egli, B. Schmid
Acta Oecologica

8/10/2019 Relationships Between Leaf Nitrogen and Limitations
http://slidepdf.com/reader/full/relationships-between-leaf-nitrogen-and-limitations 7/12
Light-saturated leaf photosynthesis ( A) did not dif-fer significantly between the two sampling dates (ta-ble I ). Figure 5c illustrates the positive main effects(pooled across sampling dates) of mowing and fertil-izer on A as listed in table I ; in fact, both were due tothe marked response of A to fertilizer application inmown plots (although the mowing-by-fertilizer inter-action was not significant). Average stomatal conduc-
tance (g) was reduced by 43 % in August comparedwith July. Mowing interacted significantly with fertil-izer application, when effects were pooled across bothsampling dates: g did not respond to mowing inunfertilized stands but showed a positive response infertilized stands ( figure 5d ; note also the oppositeresponse of g to fertilizer application in control ascompared with mown plots).
Daytime leaf dark respiration ( Rd ) did not varysignificantly among the different treatment combina-
tions. Nevertheless, there was a trend towards in-creased Rd in fertilized stands ( figure 5e). Similar towhat was observed for leaf nitrogen, A and g (table I ),
Rd declined from the upper to the lower leaves alongthe ramet (P < 0.01, linear regression). Respiration atnight was below 1 µmol CO2⋅m
–2⋅s–1.
3.4. Relationships between leaf nitrogen content
and gas exchange A responded positively to N
a (P < 0.001; r 2 = 0.13,
linear regression). The ‘explained’ variance increasedfrom 13 to 32 % if separate regression lines were fittedto the July and August data ( figure 6 ; P < 0.001 for thedate-by-nitrogen interaction). As noted above, A onaverage was not increased in the August sampledespite higher leaf nitrogen contents. In consequence,average instantaneous nitrogen-use efficiency (NUE
i,
rate of photosynthesis per unit amount of leaf nitro-
Figure 5. Nitrogen content (a, b) and gas exchange characteristics (c–e) of single leaves of Solidago altissima growing in unfertilized (open bars)or fertilized stands (hatched bars) located in control and mown plots. Values are pooled across the two sampling periods in July and August 1991.Means are given together with their common standard error (standard error of the mowing-by-fertilizer interaction calculated from split-plotanalysis of variance); n = 84 leaves for each mowing-by-fertilizer treatment combination except day time dark respiration (n = 12). See table I
for significant treatment effects.
Nitrogen and photosynthesis in Solidago 565
Vol. 20 (5) 1999

8/10/2019 Relationships Between Leaf Nitrogen and Limitations
http://slidepdf.com/reader/full/relationships-between-leaf-nitrogen-and-limitations 8/12
gen) was lower in August (7.9 µmol CO2⋅g
–1 N⋅s–1)than in July (12.1 µmol CO2⋅g
–1 N⋅s–1). The interceptof the linear regression of A on Na did not differsignificantly from zero in July ( figure 6 ) indicating nosystematic change of NUEi with increasing leaf nitro-gen content at that time. In August, however, NUE i
was negatively correlated with Na as shown by thepositive intercept of the regression line. A was also positively correlated with g (r 2 = 0.51,
linear regression). Na and g together ‘explained’ 67 %
of the total variation in A if both effects were pooledacross the two sampling periods. The two effects werenot purely additive since the proportion of explainedvariance increased significantly (P < 0.001) when theproduct of g and N
a was added to the regression
model. This interaction means that the responsivenessof A to foliar nitrogen content increased with increas-ing g. Hence, the difference in the nitrogen response of photosynthesis between July and August coincidedwith the difference in g between these two dates (seeabove).
3.5. Model calculations of integrated ramet carbongain
The daily ramet carbon gain per ramet leaf area(mol CO2⋅m
–2⋅day–1, daily net photosynthesis in the
following) provides a measure of the efficiency of daily ramet photosynthesis. Figure 7 shows plots of calculated daily net photosynthesis versus average Na
per ramet at two different cumulated daily PPFDs asobserved in August 1991 (see figure 2d ). The slopes of
the dashed lines in the figure (i.e. tangent α) equaldaily ramet nitrogen use efficiency (NUEd,
mol CO2⋅g–1 N per ramet and day) for a given daily
PPFD and average Na per ramet. The figure shows that
NUEd was negatively correlated with ramet N
a even at
high daily PPFD, i.e. decreasing slopes of the dashedlines with increasing foliar nitrogen contents. Esti-mated daily carbon gain per ramet ranged from 8.8 to26.7 mmol CO
2⋅d–1 (data not shown) and was very
closely correlated with the total foliage area per ramet(r 2 = 0.96, linear regression with n = 8 ramets), butnot significantly with daily net photosynthesis; thelatter two traits were not significantly correlated witheach other.
4. DISCUSSION
4.1. Limitations to photosynthesis
Nitrogen investments into the photosynthetic appa-ratus were paid back only in part by increased photo-synthesis under field conditions during the samplingperiods in July and August 1991. This conclusion rests
Figure 6. Light-saturated leaf photosynthesis as function of leaf nitrogen content measured under field conditions in July and August1991, respectively. Separate regression lines are fitted to the July andAugust data (overall r 2 = 0.32).
Figure 7. The relationship between the average leaf nitrogen contentper ramet and the estimated rate of daily net photosynthesis perramet. Rates were assessed for each of four unfertilized ramets fromcontrol plots (closed symbols) and mown plots (open symbols; noestimates for fertilized plants). Daily net photosynthesis was calcu-lated for two different observed daily light regimes (see values fordaily PPFD and figure 2d ). The slope of the dashed lines indicatesdaily nitrogen-use efficiency (NUEd) expressed as mol CO2 assimi-lated per g leaf nitrogen and day (see text for further explanations).
566 P. Egli, B. Schmid
Acta Oecologica
8/10/2019 Relationships Between Leaf Nitrogen and Limitations
http://slidepdf.com/reader/full/relationships-between-leaf-nitrogen-and-limitations 9/12
on the negative correlation between the leaf nitrogencontent (N
a) and the rate of photosynthesis per unit
leaf nitrogen (NUE) in August, both at the single-leaf and the whole-ramet level. Returns were better in Julybut, overall, NUE
i still did not increase with increasing
Na at that time. Following the concept of nitrogen/ carbon limitation in photosynthetic performance pre-sented by Hirose [17], photosynthesis was notnitrogen-limited but carbon-limited in August,whereas N- and C-limitation were approximately inbalance in July. This means that in August, CO2
assimilation was not limited by catalytic processes (i.e.activity of RuBP-carboxylase-oxygenase and othernitrogenous compounds linked with photosynthesis)but primarily by a restricted supply of the substrateCO2 through the stomata. The 43 % reduction in g inAugust as compared with July may have been inducedby enhanced (+20 %) leaf-to-air water vapour molefraction differences (∆w, data not shown), but presum-
ably was not attributable to increased water stress. Soilwater data did not indicate critical water supply duringthe two sampling periods (see figure 2b), and thedecline in g with increasing ∆w was not steeper inAugust than in July.
4.1.1. Effects of mowing on productivityin unfertilized stands
Despite lower self-shading ( figure 3, open vs. closedcircles) and similar light-saturated single-leaf photo-synthesis (compare open bars in figure 5c) in themown plots as compared with control plots, averagedaily net photosynthesis per ramet did not respond tomowing when rates were expressed on a whole-rametfoliage area basis ( figure 7 , open vs. closed symbols).Expressed as the amount of CO
2 fixed per ramet and
day, however, the average productivity of the rametsfrom mown plots was estimated to be reduced by 38 %compared with that of the ramets from control plots –corresponding to an equal reduction in the averagefoliage area per ramet (data not shown). These findingsindicate that primary carbon gain in Solidago altissimashould be more strongly controlled by the quantitythan the quality (efficiency) of photosynthetic pro-
cesses. Similarly, other authors [26] reported that in Eucalyptus grandis the amount of absorbed radiationby the tree crown, which is a function of total leaf area,was directly proportional to daily carbon gain, whereasvariation in single-leaf productivity was of minorimportance. This enforces the importance of assessingthe physiology of a particular organ and whole-plantperformance (i.e. physiological traits integrated overthe plant) to understand a plant’s primary carbongain [24].
4.2. Individual versus stand optimization
Using a stand-level approach, Hirose andWerger [19] reported that in a population of S. al-tissima exponential decline of nitrogen along the leaf canopy nearly optimized productivity in each stratumof the canopy. However, their stand-based optimiza-tion model does not necessarily apply to stands withlarge variation in ramet height as found in our studypopulation [4, 28]. In such a situation, the optimalstructure of the stand as a whole potentially conflictswith the optimal design of individual ramets whichbuild up the stand: the photosynthetic performance of the whole stand, in contrast to that of single shorterramets, might be increased when nitrogen was redis-tributed from high-nitrogen leaves at the top of theshorter ramets to the upper leaf layers of the tallerramets, because the modified nitrogen pattern wouldmatch the distribution of PPFD through the canopy
better. On the other hand, preserving high nitrogencontents in leaves at the top of shorter ramets shouldbe favourable for these ramets as long as their nitrogenresponse of photosynthesis is not critically suppressedthrough severe shading by taller neighbours.
Because the individual is the primary unit of naturalselection, such conflicts of individual- versus stand-optimization may end up in optimal designs of indi-viduals rather than the optimal structure of the stand asa whole. Essentially, the architecture of a plant shouldrepresent an evolutionary stable strategy (ESS; [27]),i.e. there should exist no alternative architecture thatincreases the fitness of a single plant (genotype) overthat achieved by the common architecture of all theother plants (genotypes) building up the stand, irre-spective whether this common architecture is optimalwith respect to the whole stand or not [21, 23].
In clonal plants like S. altissima, the genet andtherefore a group of ramets may be the key unit of natural selection [31]. Thus in stands of clonal plantsnatural selection may favour optimal designs of groupsof ramets rather than single ramets, but this maycritically depend on whether neighbouring rametsbelong to the same genet or not [32]. S . altissima hasa rather compact genet architecture, i.e. neighbouringramets usually belong to the same genet, and indi-vidual ramets are physiologically integrated within the
genet [1, 14, 15]. Therefore, the above conflict isexpected to be less pronounced in this species than inclonal species with spreading genets or in annualspecies. Nevertheless, in the unfertilized stands lo-cated in the mown plots – but not in the other,nutrient-richer, mowing-by-fertilizer combinations –the leaves of shorter ramets had higher nitrogencontents than the leaves of taller ramets at the sameheight above ground and hence light environment( figure 4, upper panel). All shorter ramets sampled
Nitrogen and photosynthesis in Solidago 567
Vol. 20 (5) 1999
8/10/2019 Relationships Between Leaf Nitrogen and Limitations
http://slidepdf.com/reader/full/relationships-between-leaf-nitrogen-and-limitations 10/12

8/10/2019 Relationships Between Leaf Nitrogen and Limitations
http://slidepdf.com/reader/full/relationships-between-leaf-nitrogen-and-limitations 11/12
REFERENCES
[1] Abrahamson W.G., McCrea K.D., Nutrient and biomass allo-cation in Solidago altissima: effects of two stem gallmakers,fertilization, and ramet isolation, Oecologia 68 (1986)174–180.
[2] Anten N.P.R., Werger M.J.A., Canopy structure and nitrogendistribution in dominant and subordinate plants in a densestand of Amaranthus dubius L. with a size hierarchy of individuals, Oecologia 105 (1996) 30–37.
[3] Anten N.P.R., Miyazawa K., Hikosaka K., Nagashima H.,Hirose T., Leaf nitrogen distribution in relation to leaf age andphoton flux density in dominant and subordinate plants indense stands of a dicotyledonous herb, Oecologia 113 (1998)314–324.
[4] Egli P., An individual-based analysis of annual shoot and standdevelopment in the invading species Solidago altissima L.,Ph.D. thesis, University of Basel, Basel, 1994.
[5] Egli P., Schmid B., Beziehung zwischen Struktur und Dy-namik von Blattpopulationen und Sprosswachstum, in:Schmid B., Stöcklin J. (Eds.), Populationsbiologie der Pflan-
zen, Birkhäuser Verlag, Basel, 1991, pp. 179–200.[6] Evans J.R., Nitrogen and photosynthesis in the flag leaf of
wheat (Triticum aestivum L.), Plant Physiol. 72 (1983)297–302.
[7] Field C., Allocating leaf nitrogen for the maximization of carbon gain: leaf age as a control of the allocation program,Oecologia 56 (1983) 341–347.
[8] Field C., Mooney H.A., Leaf age and seasonal effects on light,water, and nitrogen use efficiency in a California shrub,Oecologia 56 (1983) 348–355.
[9] Field C., Mooney H.A., The photosynthesis-nitrogen relation-ship in wild plants, in: Givnish T.J. (Ed.), On the Economy of Plant Form and Function, Cambridge University Press, Cam-bridge, 1986, pp. 25–55.
[10] Field C., Merino J., Mooney H.A., Compromises between
water-use efficiency and nitrogen-use efficiency in five speciesof California evergreens, Oecologia 60 (1983) 84–94.[11] Gulmon S.L., Chu C.C., The effects of light and nitrogen on
photosynthesis, leaf characteristics, and dry matter allocationin the chaparral shrub Diplacus aurantiacus, Oecologia 49(1981) 207–212.
[12] Gutschick V.P., Wiegel F.W., Optimizing the canopy photo-synthetic rate by patterns of investment in specific leaf mass,Am. Nat. 132 (1988) 67–86.
[13] Harrington R.A., Brown B.J., Reich P.B., Ecophysiology of exotic and native shrubs in southern Wisconsin, I. Relation-ship of leaf characteristics, resource availability, and phenol-ogy to seasonal patterns of carbon gain, Oecologia 80 (1989)356–367.
[14] Hartnett D.C., Bazzaz F.A., Physiological integration amongintraclonal ramets in Solidago canadensis, Ecology 64 (1983)779–788.
[15] Hartnett D.C., Bazzaz F.A., The integration of neighbourhoodeffects by clonal genets in Solidago candensis L., J. Ecol. 73(1985) 415–427.
[16] Hikosaka K., Terashima I., Katoh S., Effects of leaf age,nitrogen nutrition and photon flux density on the distributionof nitrogen among leaves of a vine ( Ipomoea tricolor Cav.)grown horizontally to avoid mutual shading of leaves, Oeco-logia 97 (1994) 451–457.
[17] Hirose T., Nitrogen use efficiency and growth of Polygonum
cuspidatum Sieb. et Zucc., Ann. Bot. 54 (1984) 695–704.[18] Hirose T., Werger M.J.A., Maximizing daily canopy photo-synthesis with respect to leaf nitrogen allocation pattern in thecanopy, Oecologia 72 (1987) 520–526.
[19] Hirose T., Werger M.J.A., Nitrogen use efficiency ininstantaneous and daily photosynthesis of leaves in the canopyof a Solidago altissima stand, Physiol. Plant. 70 (1987)215–222.
[20] Hirose T., Werger M.J.A., Canopy structure and leaf nitrogendistribution in a stand of Lysimachia vulgaris L. as influencedby stand density, Oecologia 77 (1988) 145–150.
[21] Hollinger D.Y., Canopy organization and foliage photosyn-thetic capacity in a broad-leaved evergreen montane forest,Funct. Ecol. 3 (1989) 53–62.
[22] Johnson I.R., Thornley J.H.M., A model of instantaneous and
daily canopy photosynthesis, J. Theor. Biol. 107 (1984)531–545.[23] King D.A., The adaptive significance of tree height, Am. Nat.
135 (1990) 809–828.[24] Küppers M., Die Bedeutung des Wechselspiels von Photosyn-
these, Blattpopulation und pflanzlicher Architektur für Wach-stum und Konkurrenzkraft, in: Schmid B., Stöcklin J. (Eds.),Populationsbiologie der Pflanzen, Birkhäuser Verlag, Basel,1992, pp. 165–178.
[25] Leuning R., Cromer R.N., Rance S., Spatial distributions of foliar nitrogen and phosphorus in crowns of Eucalyptus
grandis, Oecologia 88 (1991) 504–510.[26] Leuning R., Wang Y.P., Cromer R.N., Model simulations of
spatial distributions and daily totals of photosynthesis in Eucalyptus grandis, Oecologia 88 (1991) 494–503.
[27] Maynard Smith J., Evolution and the theory of games, Am.Sci. 64 (1976) 41–45.
[28] Meyer A., The experimental demography of clonal plants: acase study of the invading species Solidago altissima L., Ph.D.thesis, University of Basel, Basel, 1992.
[29] Mooney H.A., Field C., Gulmon S.L., Bazzaz F.A., Photosyn-thetic capacity in relation to leaf position in desert versusold-field annuals, Oecologia 50 (1981) 109–112.
[30] Natr L., Influence of mineral nutrition on photosynthesis andthe use of assimilates, in: Cooper J.P. (Ed.), Photosynthesisand Productivity in Different Environments, Cambridge Uni-versity Press, London, 1975, pp. 537–555.
[31] Sackville Hamilton N.R., Schmid B., Harper J.L., Life historyconcepts and the population biology of clonal organisms,Proc. R. Soc. Lond. B 232 (1987) 35–57.
[32] Schmid B., Bazzaz F.A., Crown construction, leaf dynamics,
and carbon gain in two perennials with contrasting architec-ture, Ecol. Monogr. 64 (1994) 177–203.
[33] Weber E., Schmid B., Das Neophytenproblem, Diss. Bot. 196(1993) 209–227.
Nitrogen and photosynthesis in Solidago 569
Vol. 20 (5) 1999

8/10/2019 Relationships Between Leaf Nitrogen and Limitations
http://slidepdf.com/reader/full/relationships-between-leaf-nitrogen-and-limitations 12/12
Appendix. Upscaling from single-leaf to whole-ramet photosynthesis.
Daily carbon gains of unfertilized ramets taken from
control and mown plots (n = 4 ramets per treatment,data set 3) were assessed in four steps. In essence, theleaf population of each of these ramet was approxi-mated by a series of horizontal sections of 10 cm, eachcomprised of leaves of homogenous photosyntheticcharacteristics.
– Data set 2 was used to parameterize relationshipsbetween leaf nitrogen content (N
a), leaf gas exchange,
and leaf insertion height. Analyses were restricted tothe data from unfertilized stands (as mentioned above,the ‘modelled’ ramets were taken from unfertilizedstands), and the parameter estimates were pooledacross the two measurement periods in July andAugust 1991. (i) The stomatal conductance (g) and thedaytime respiration ( Rd ) of a single leaf were ex-pressed as functions of its relative position along theramet (i.e. leaf insertion height/ramet height). Follow-ing the outcomes of these statistical analyses, separateintercepts were assessed for the control and mowingtreatment for g, while a common intercept was fittedfor Rd ; for both traits a common slope parameter wasfitted to both mowing treatments. (ii) The rate of thelight-saturated net photosynthesis of a leaf ( A) asrealized under field conditions was expressed as afunction of its Na and g using multiple linear regres-
sion (see also section 3.4).The above functions were established to assess A
and Rd of each 10-cm height section on each harvestedramet (data set 3): first, the relative position of eachheight section along the ramet (i.e. height above-ground/ramet height) was used to estimate g and Rd foreach single section. Then calculated g was combinedwith N
a as determined for each section to assess A.
– We used a non-rectangular hyperbolic func-tion [22] to describe the response of leaf gross photo-synthesis (Pg, µmol CO
2⋅m–2 leaf area⋅s–1) to PPFD ( I ,
µmol quanta⋅m–2⋅s–1):
Pg = u I + Ag − u I + Ag 2− 4uh IAg 1/2 / 2h 1
The shape of this function is determined by thefollowing parameters: light-saturated gross photosyn-thesis ( Ag), quantum yield (, the initial slope of thecurve, µmol CO
2⋅µmol–1 quanta), and a convexity
parameter (θ, a dimensionless parameter indicating thedegree of curvature, 0 ≤ θ ≤ 1). Ag was assessedseparately for each height section on each harvestedramet as the sum of A plus Rd which were estimated inthe first step. However, common values of and θ
were used for all height sections and ramets. Forpractical reasons, these values were not assesseddirectly in the population investigated. Instead, andθ were estimated by fitting hyperbolas to light re-sponse data from a garden experiment with cultivatedSolidago altissima [5]: = 0.056 µmol CO2⋅µmol–1
quanta, θ = 0.900.
– The light response function as established specifi-cally for each 10-cm height section on each ramet inthe second step was linked with horizontal variation of PPFD within each height section (data set 1) to esti-mate the instantaneous rates of CO
2 uptake of each of
these sections. Horizontal variation of PPFD withineach height section was assessed by calculating sepa-rate frequency distributions of PPFD for each heightsection of the canopies (separately for control andmown plots). For each of these distributions, the PPFDvalues were first expressed in percent of incomingPPFD ( I o) and then classified into PPFD-classes with aclass-width of 10 %.
Given a specific value of I o, instantaneous net CO2
uptake (µmol⋅s–1) of each height section on each rametwas obtained by the weighted mean of the rate of photosynthesis realized over all PPFD classes:
Pheight section = 0−10 %
I
90−100 %
f I * area * P I * Io , 2
where I is PPFD-class in percent of I o, f I the relativefrequency of each PPFD-class, area the total leaf areaof the specific height section (and ramet), and P I*Io therate of instantaneous net photosynthesis calculated foreach absolute value of PPFD (= [ I /100]* I o) in the firsttwo steps. Integrating rates of instantaneous photosyn-thesis over all height sections yielded instantaneousramet carbon gains.
– Finally, the microclimatic data on temporal varia-
tion of I o (hourly means) as recorded in August 1991( figure 2c) were used to integrate hourly ramet carbongains over each day during this period. Leaf darkrespiration at night was set to 0.5 µmol CO
2⋅m–2⋅s–1
which is about the average value of the night time ratesmeasured in August 1991 (there were no significantdifferences between treatments).
570 P. Egli, B. Schmid
Acta Oecologica