Relationships between Health of Alaska Native … health provisioning, monitoring ... standards for...
4
U.S. Department of the Interior U.S. Geological Survey Fact Sheet 2013–3066 July 2013 Printed on recycled paper Composition of subsistence harvest (in percent) by rural Alaska residents Other fish 21 4 Birds and eggs 3 Salmon 34 Shellfish 3 Land mammals 22 Marine mammals 13 Wild plants water safety to all Alaskans and supports a strong contaminants monitoring system in the State. Concerns about the distribution and concentrations of potential contaminants in wild subsistence foods (Berner, 2009) and the safety of wild foods spurred development of the GIS Native Health Project to inform discussions among environmental scientists, health professionals, and community leaders about potential pathways of contaminant transport into rural food and water supplies. A series of ArcGIS maps were produced to provide a basis for ANTHC and ADEC- EH discussions with community leaders and to help scientists refine key health and climate effects hypotheses for future study. Alaska Natives depend on local natural resources for nutritional and, for many, spiritual health. As a result, public health in Alaska is strongly influenced by the relationship between people and their surrounding physical, chemical, and biological environments. Alaska is vast with diverse wildlife and plant communities that are valued as subsistence foods (fig. 1). These resources are supported by equally diverse ecosystems and their underpinning landforms and geologies. The U.S. Geological Survey (USGS) is attempting to integrate physical, chemical, and biological information to better describe current (2013) environments and project scenarios for the future. Integrating ecological data into the public health dialogue is challenging for the more than 280 rural communities of Alaska. This fact sheet reviews a recent USGS effort, the Geographic Information System (GIS) Native Health Project, to better incorporate scientific information into such dialogue. Figure 1. Wild foods harvested by rural Alaska residents (Alaska Department of Fish and Game, 2010). Alaska Natives comprise 19 percent of the population of the State of Alaska (Norris and others, 2010). About two- thirds of Alaska Natives reside in rural communities with no road connections to major urban population centers. Rural communities often rely on subsistence foods, the safety of which is integral to community health. Relationships between Health of Alaska Native Communities and Our Environment: Phase I - Exploring and Communicating The Partnership Since 2007, the USGS has collaborated with the Alaska Native Tribal Health Consortium (ANTHC), a leader in Alaska Native health provisioning, monitoring, and education, under a Memorandum of Understanding. This effort jointly explores ANTHC’s rural community health and biomonitoring records against a background of long-term environmental datasets on geology, water quality, landforms, and fish and wildlife developed by USGS and collaborators. USGS and ANTHC joined other partners to form the Alaska Interagency Ecosystem Health Working Group (now called the One Health Group) to exchange ideas and data on interconnections between ecosystem conditions and human and wildlife health (Shasby, 2009). Recently USGS and ANTHC collaborated with the Alaska Department of Environmental Conservation’s Division of Environmental Health (ADEC-EH). ADEC-EH provides standards for environmental protection and food and drinking Moose on the Selawik River. Drying salmon in Nondalton.
Transcript of Relationships between Health of Alaska Native … health provisioning, monitoring ... standards for...

U.S. Department of the InteriorU.S. Geological Survey
Fact Sheet 2013–3066 July 2013
Printed on recycled paperPrinted on recycled paper
tac13-5203_fig01
Composition of subsistence harvest (in percent) by rural Alaska residents
Other fish21
4Birds and eggs 3
Salmon34
Shellfish3
Land mammals22
Marine mammals13
Wild plants
water safety to all Alaskans and supports a strong contaminants monitoring system in the State. Concerns about the distribution and concentrations of potential contaminants in wild subsistence foods (Berner, 2009) and the safety of wild foods spurred development of the GIS Native Health Project to inform discussions among environmental scientists, health professionals, and community leaders about potential pathways of contaminant transport into rural food and water supplies. A series of ArcGIS maps were produced to provide a basis for ANTHC and ADEC-EH discussions with community leaders and to help scientists refine key health and climate effects hypotheses for future study.
Alaska Natives depend on local natural resources for nutritional and, for many, spiritual health. As a result, public health in Alaska is strongly influenced by the relationship between people and their surrounding physical, chemical, and biological environments. Alaska is vast with diverse wildlife and plant communities that are valued as subsistence foods (fig. 1). These resources are supported by equally diverse ecosystems and their underpinning landforms and geologies. The U.S. Geological Survey (USGS) is attempting to integrate physical, chemical, and biological information to better describe current (2013) environments and project scenarios for the future. Integrating ecological data into the public health dialogue is challenging for the more than 280 rural communities of Alaska. This fact sheet reviews a recent USGS effort, the Geographic Information System (GIS) Native Health Project, to better incorporate scientific information into such dialogue.
Figure 1. Wild foods harvested by rural Alaska residents (Alaska Department of Fish and Game, 2010).
Alaska Natives comprise 19 percent of the population of the State of Alaska (Norris and others, 2010). About two-thirds of Alaska Natives reside in rural communities with no road connections to major urban population centers. Rural communities often rely on subsistence foods, the safety of which is integral to community health.
Relationships between Health of Alaska Native Communities and Our Environment: Phase I - Exploring and Communicating
The PartnershipSince 2007, the USGS has collaborated with the Alaska Native Tribal Health Consortium (ANTHC), a leader in Alaska Native health provisioning, monitoring, and education, under a Memorandum of Understanding. This effort jointly explores ANTHC’s rural community health and biomonitoring records against a background of long-term environmental datasets on geology, water quality, landforms, and fish and wildlife developed by USGS and collaborators. USGS and ANTHC joined other partners to form the Alaska Interagency Ecosystem Health Working Group (now called the One Health Group) to exchange ideas and data on interconnections between ecosystem conditions and human and wildlife health (Shasby, 2009).
Recently USGS and ANTHC collaborated with the Alaska Department of Environmental Conservation’s Division of Environmental Health (ADEC-EH). ADEC-EH provides standards for environmental protection and food and drinking Moose on the Selawik River.
Drying salmon in Nondalton.
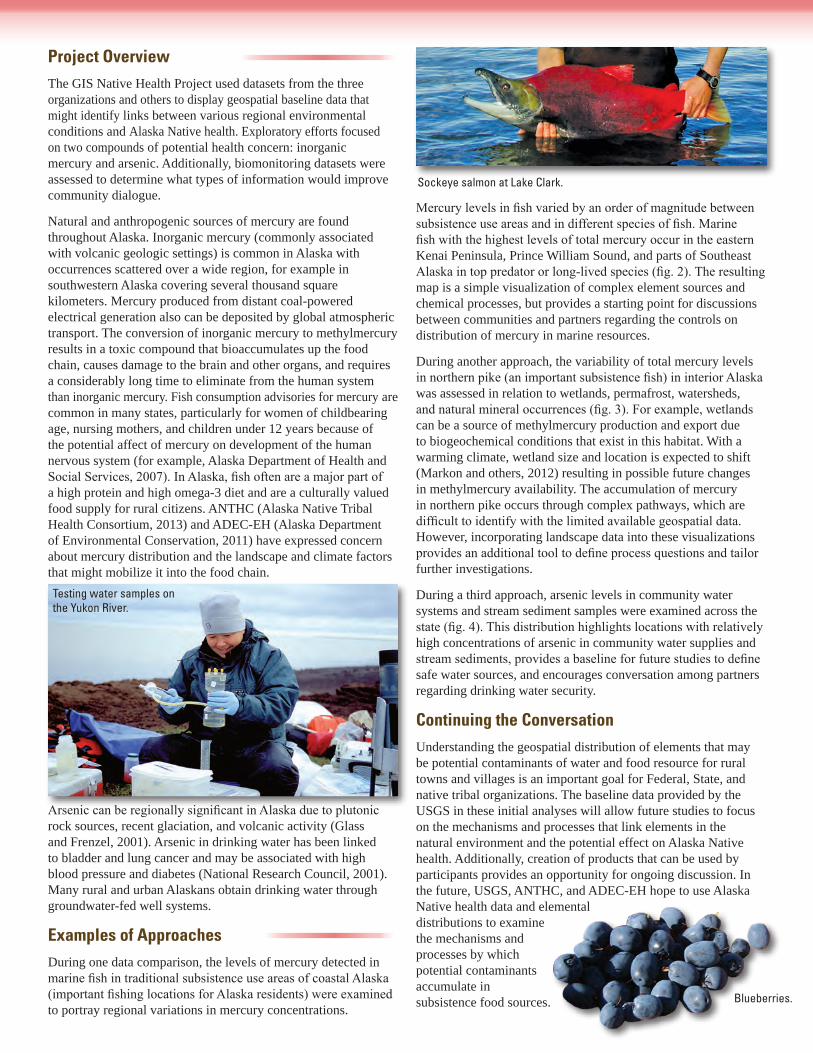
Testing water samples onthe Yukon River.
Project OverviewThe GIS Native Health Project used datasets from the three organizations and others to display geospatial baseline data that might identify links between various regional environmental conditions and Alaska Native health. Exploratory efforts focused on two compounds of potential health concern: inorganic mercury and arsenic. Additionally, biomonitoring datasets were assessed to determine what types of information would improve community dialogue.
Natural and anthropogenic sources of mercury are found throughout Alaska. Inorganic mercury (commonly associated with volcanic geologic settings) is common in Alaska with occurrences scattered over a wide region, for example in southwestern Alaska covering several thousand square kilometers. Mercury produced from distant coal-powered electrical generation also can be deposited by global atmospheric transport. The conversion of inorganic mercury to methylmercury results in a toxic compound that bioaccumulates up the food chain, causes damage to the brain and other organs, and requires a considerably long time to eliminate from the human system than inorganic mercury. Fish consumption advisories for mercury are common in many states, particularly for women of childbearing age, nursing mothers, and children under 12 years because of the potential affect of mercury on development of the human nervous system (for example, Alaska Department of Health and Social Services, 2007). In Alaska, fish often are a major part of a high protein and high omega-3 diet and are a culturally valued food supply for rural citizens. ANTHC (Alaska Native Tribal Health Consortium, 2013) and ADEC-EH (Alaska Department of Environmental Conservation, 2011) have expressed concern about mercury distribution and the landscape and climate factors that might mobilize it into the food chain.
Arsenic can be regionally significant in Alaska due to plutonic rock sources, recent glaciation, and volcanic activity (Glass and Frenzel, 2001). Arsenic in drinking water has been linked to bladder and lung cancer and may be associated with high blood pressure and diabetes (National Research Council, 2001). Many rural and urban Alaskans obtain drinking water through groundwater-fed well systems.
Examples of ApproachesDuring one data comparison, the levels of mercury detected in marine fish in traditional subsistence use areas of coastal Alaska (important fishing locations for Alaska residents) were examined to portray regional variations in mercury concentrations.
Mercury levels in fish varied by an order of magnitude between subsistence use areas and in different species of fish. Marine fish with the highest levels of total mercury occur in the eastern Kenai Peninsula, Prince William Sound, and parts of Southeast Alaska in top predator or long-lived species (fig. 2). The resulting map is a simple visualization of complex element sources and chemical processes, but provides a starting point for discussions between communities and partners regarding the controls on distribution of mercury in marine resources.
During another approach, the variability of total mercury levels in northern pike (an important subsistence fish) in interior Alaska was assessed in relation to wetlands, permafrost, watersheds, and natural mineral occurrences (fig. 3). For example, wetlands can be a source of methylmercury production and export due to biogeochemical conditions that exist in this habitat. With a warming climate, wetland size and location is expected to shift (Markon and others, 2012) resulting in possible future changes in methylmercury availability. The accumulation of mercury in northern pike occurs through complex pathways, which are difficult to identify with the limited available geospatial data. However, incorporating landscape data into these visualizations provides an additional tool to define process questions and tailor further investigations.
During a third approach, arsenic levels in community water systems and stream sediment samples were examined across the state (fig. 4). This distribution highlights locations with relatively high concentrations of arsenic in community water supplies and stream sediments, provides a baseline for future studies to define safe water sources, and encourages conversation among partners regarding drinking water security.
Continuing the ConversationUnderstanding the geospatial distribution of elements that may be potential contaminants of water and food resource for rural towns and villages is an important goal for Federal, State, and native tribal organizations. The baseline data provided by the USGS in these initial analyses will allow future studies to focus on the mechanisms and processes that link elements in the natural environment and the potential effect on Alaska Native health. Additionally, creation of products that can be used by participants provides an opportunity for ongoing discussion. In the future, USGS, ANTHC, and ADEC-EH hope to use Alaska Native health data and elemental distributions to examine the mechanisms and processes by which potential contaminants accumulate in subsistence food sources.
Sockeye salmon at Lake Clark.
Blueberries.

tac13-5203_fig02
SitkaSitka
Kodiak
Juneau
Ketchikan
AnchorageValdez
0 100 200 MILES50
0 100 200 KILOMETERS50
Gulf of Alaska
Cook
Inlet
Prince William Sound
Southeast Alaska
Nome
NortonSound
0 25 50 MILES
0 25 50 KILOMETERS
Bering Sea
Unalaska
Dillingham
BristolBay
0 150 300 MILES75
0 150 300 KILOMETERS75
The Aleutians, Bering Sea and Bristol Bay
130°W140°W150°W
60°N
55°N
Digital shaded-relief image from Riehle and others (1997)
170˚W
55˚N
160˚W
165˚W65˚N
Subsistence harvest areas of marine fish and mercury concentrations
Marine fish sampling locationsAtka mackerelPacific codKelp greenlingRed Irish lordYellow Irish lordLingcodPollockBlack rockfish
Dusky rockfish
Quillback rockfishRougheye rockfishYelloweye rockfishSablefishSalmon shark
Pacific Ocean perch
Total mercury, in parts per million0.0000 - 0.10000.1010 - 0.25000.2501 - 0.50000.5010 - 1.0000
1.0100 - 2.0740
Major rivers
Major towns
Subsistence harvest areas
EXPLANATION
tac13-5203_fig 03
G U L F O F A L A S K A
R US
SI
A
C A N A D A
AR
C T I C O C E A N
0 150 300 MILES75
0 150 300 KILOMETERS75
Wetlands
Major rivers
Lakes
Pike sampling locations
Total mercury in pike, in parts per million
0.00000 - 0.21000
0.21001 - 0.39000
0.39001 - 0.60500
0.85601 - 1.35670
Mercury levels in northern pike in relation to wetlands and mineral occurences
Mineral occurrences, prospects or mines containing mercury or associated elements
0.60501 - 0.85600
EXPLANATION
140°W160°W180° 70°N
60°N
Figure 2. Mercury concentrations in marine fish in relation to traditional subsistence harvest areas in southern Alaska, 2002–08. Fish data from the Alaska Department of Environmental Conservation, Alaska Department of Fish and Game, National Marine Fisheries Service, National Oceanic and Atmospheric Administration, and the International Pacific Halibut Commission, written communs., 2010.
Figure 3. Mercury concentrations in samples collected from northern pike in relation to wetlands and mineral occurrences in Alaska, 2001–08. Data on mercury levels in northern pike provided by Alaska Department of Fish and Game, U.S. Fish and Wildlife Service, and Lake and Peninsula Borough, written communs., 2009.

tac13-5203_fig 04
Nome
Kobuk
SitkaKodiak
Bethel
Barrow
Valdez
Juneau
McGrath
Gambell
Unalaska
Fairbanks
Ketchikan
Anchorage
Dillingham
Unalakleet
Point Hope
Fort Yukon
Prudhoe Bay
R US
SI
A
G U L F O F A L A S K A
C A N A D A
AR
C T I C O C E A N
0 300 600 MILES150
0 300 600 KILOMETERS150
Arsenic levels in community water systems and stream sediments
Arsenic in water—Data fromwater sources, in micrograms per liter. Maximum value shown only. If all values equal 0, then most recent data shown only.
Less than 50 parts per million
Greater than 50 parts per million
Arsenic in sediments—Data from sediment sources, in parts per million. Sieve: 150
EXPLANATION
00.1 – 55.1 – 1010.1 – 2020.1 – 5050.1 – 100100.1 – 200
Lakes
Major rivers
Cities and villages
120°W140°W160°W180°
65°N
55°N
Alaska Department of Environmental Conservation, 2011, Mercury in Alaska: Alaska Department of Environmental Conservation Web site, accessed July 9, 2013, at http://dec.alaska.gov/eh/mercury/.
Alaska Department of Fish and Game, 2010, Subsistence in Alaska—A Year 2010 Update: Alaska Department of Fish and Game, Division of Subsistence, accessed October 21, 2012, at http://www.adfg.alaska.gov/static/home/library/pdfs/subsistence/subsistence_overview2010.pdf.
Alaska Department of Health and Social Services, 2007, Fish consumption advice for Alaskans—A risk management strategy to optimize the public’s health—Executive summary: Department of Health and Social Services State of Alaska Epidemiology Bulletin, 1 p., accessed July 9, 2013, at http://www.epi.hss.state.ak.us/bulletins/docs/b2007_29.pdf.
Alaska Native Tribal Health Consortium, 2013, Maternal Organics Monitoring Study (MOMS): Alaska Native Tribal Health Consortium Web site, accessed July 9, 2013, at http://www.anthc.org/chs/ces/moms/.
Berner, J.E., 2009, Climate change and contaminants in subsistence foods: Presentation to EPA Tribal Science Council, accessed April 11, 2013, at http://www.epa.gov/osp/tribes/pres/webinar091210p.pdf.
Glass R.L., and Frenzel, S.A., 2001, Distribution of arsenic in water and streambed sediments, Cook Inlet, Alaska: U.S. Geological Survey Fact Sheet 083-01, 4 p. (Also available at http://pubs.usgs.gov/fs/fs-083-01/.)
Markon, C.J., Trainor, S.F., and Chapin, F.S., III, eds., 2012, The United States National Climate Assessment—Alaska Technical Regional Report: U.S. Geological Survey Circular 1379, 148 p.
National Research Council, 2001, Arsenic in drinking water—2001 update: National Academy Press, 242 p.
Norris, Tina, Vines, P.L., and Hoeffel, E.M., 2012, The American Indian and Alaska Native population—2010: U.S. Census Bureau 2010 Census Briefs, 21 p., accessed April 11, 2013, at http://www.census.gov/prod/cen2010/briefs/c2010br-10.pdf.
Riehle, J.R., and others, 1997, Digital shaded-relief image of Alaska: U.S. Geological Survey IMAP 2585. (Also available at http://pubs.er.usgs.gov/publication/i2585.)
Shasby, Mark, 2009, Alaska Interagency Ecosystem Health Work Group: U.S. Geological Survey Fact Sheet 2009-3072, 2 p.
Smith, S.M., 2013, National geochemical database: U.S. Geological Survey Open-File Report 97-492. (Also available at http://pubs.usgs.gov/of/1997/ofr-97-0492/.)
Other current USGS projects include a study with the Yukon River Intertribal Watershed Council to understand the biogeochemistry of mercury—including its cycling, transport, and export—by comparing two watersheds in the interior of Alaska; and a project with ANTHC to analyze community water sources for villages in Alaska to identify algal toxins. Continued partnership will allow studies such as these to refine the processes involved in element distribution and bioaccumulation—connections that are important to the organizations involved, and to the health of rural communities and Alaska Natives.
The USGS Student Interns in Support of Native American Relations Program, the Global Climate Change Internships for Tribes Program, and the USGS Alaska Regional Director’s Office supported this project.
Figure 4. Arsenic levels in samples collected from community water systems and stream sediments in Alaska. Water data (samples from 1985 and 1993–2007) were provided by the Alaska Native Tribal Health Consortium, written commun., 2008. Sediment samples (from 1899, 1967–88, 1992, and 2000–2004) from Smith (2013).
Author: Durelle SmithFor more information: Regional Director for Alaska
U.S. Geological Survey 4210 University Dr., Anchorage, AK 99508 http://alaska.usgs.gov, 907-786-7000
Publishing support provided by the U.S. Geological SurveyTacoma Publishing Service Center
References Cited