
Relationship Between Working Capital Management and ...
55
RELATIONSHIP BETWEEN WORKING CAPITAL MANAGEMENT AND FINANCIAL PERFORMANCE OF MANUFACTURING FIRMS IN KENYA BY: JASPHER NYACHIEO NDEGE D63/72576/2014 A RESEARCH PROJECT REPORT SUBMITTED IN PARTIAL FULFILMENT OF THE REQUIREMENT FOR THE AWARD OF THE DEGREEE OF MASTER OF SCIENCE (MSC) IN FINANCE OF THE UNIVERSITY OF NAIROBI NOVEMBER 2016
Transcript of Relationship Between Working Capital Management and ...
RELATIONSHIP BETWEEN WORKING CAPITAL MANAGEMENT AND
FINANCIAL PERFORMANCE OF MANUFACTURING FIRMS IN KENYA
BY:
JASPHER NYACHIEO NDEGE
D63/72576/2014
A RESEARCH PROJECT REPORT SUBMITTED IN PARTIAL FULFILMENT
OF THE REQUIREMENT FOR THE AWARD OF THE DEGREEE OF MASTER
OF SCIENCE (MSC) IN FINANCE OF THE UNIVERSITY OF NAIROBI
NOVEMBER 2016
ii
DECLARATION
This research project is my original work and has not been presented for a degree in any
other university or college.
Signature ……………………………………. Date …………………………………..
Jaspher Nyachieo Ndege
REG NO D63/72576/2014
This research project has been submitted for examination with my approval as a
University Supervisor.
Mr. Mohammed Mwachiti
Lecturer, Department of Finance and Accounting
University of Nairobi
Signature …………………………………….. Date …………………………………….

iii
ACKNOWELDGEMENT
I wish to express my sincere gratitude to my supervisor Mr. Mwachiti for his useful
guidance that enabled me to complete this research project in time.

iv
DEDICATION
This research project is dedicated to dear mum Peris Moraa for laying a strong foundation
to my life. Secondly, my special dedication to my dear daughter Joyvashti Moraa and
dear son Faegan Ndege who always remained my source of joy, inspiration, motivation
and desire to outshine through scholastically. I am proud to have you.
v
TABLE OF CONTENTS
DECLARATION............................................................................................................... ii
DEDICATION.................................................................................................................. iv
LIST OF ABBREVIATIONS ......................................................................................... ix
ABSTRACT ....................................................................................................................... x
CHAPTER ONE: INTRODUCTION ............................................................................. 1
1.1 Background of the Study ........................................................................................... 1
1.1.1 Working Capital Management ............................................................................ 2
1.1.2 Financial Performance ........................................................................................ 3
1.1.3 Relationship between Working Capital Management and Financial
Performance ........................................................................................................ 4
1.1.4 Manufacturing Firms in Kenya........................................................................... 5
1.2 Research Problem ...................................................................................................... 6
1.3 Objective of the study ............................................................................................... 7
1.4 Value of the Study ..................................................................................................... 7
CHAPTER TWO: LITERATURE REVIEW ................................................................ 9
2.1 Introduction ............................................................................................................... 9
2.2 Theoretical Literature ................................................................................................ 9
2.2. Cash Conversion Cycle Theory .......................................................................... 10
2.2.2 Transaction Cost Economics Theory ................................................................ 11
2.2.4 Resource Based Theory .................................................................................... 13
2.3 Empirical Literature ................................................................................................ 14
2.4 Determinants of Financial Performance .................................................................. 17
2.4.1 Risk Management ............................................................................................. 17
2.4.2 Firm Characteristics of Policies ........................................................................ 18
2.4.3 Ownership Structure ......................................................................................... 18
2.4.5 Liquidity ........................................................................................................... 19
2.6 Summary of the Literature ...................................................................................... 22
CHAPTER THREE: RESEARCH METHODOLOGY ............................................. 23
3.1 Introduction ............................................................................................................. 23
3.2 Research Design ...................................................................................................... 23
vi
3.3 Target Population .................................................................................................... 23
3.4 Sample ..................................................................................................................... 24
3.5 Data Collection Procedures ..................................................................................... 24
3.6 Data Analysis and Presentation ............................................................................... 25
CHAPTER FOUR: DATA ANALYSIS, INTERPRETATION AND FINDINGS ... 27
4.1 Introduction ............................................................................................................. 27
4.2 Descriptive Statistics ........................................................................................... 27
4.3 Regression Analysis ............................................................................................ 29
CHAPTER FIVE: SUMMARY, CONCLUSIONS AND RECOMMENDATIONS 32
5.1 Introduction ............................................................................................................. 32
5.2 Summary of Findings and Interpretations ............................................................... 32
5.3 Conclusions ............................................................................................................. 33
5.3 Policy Recommendations ........................................................................................ 34
5.4 Limitations of the Study .......................................................................................... 34
REFERENCES ................................................................................................................ 36
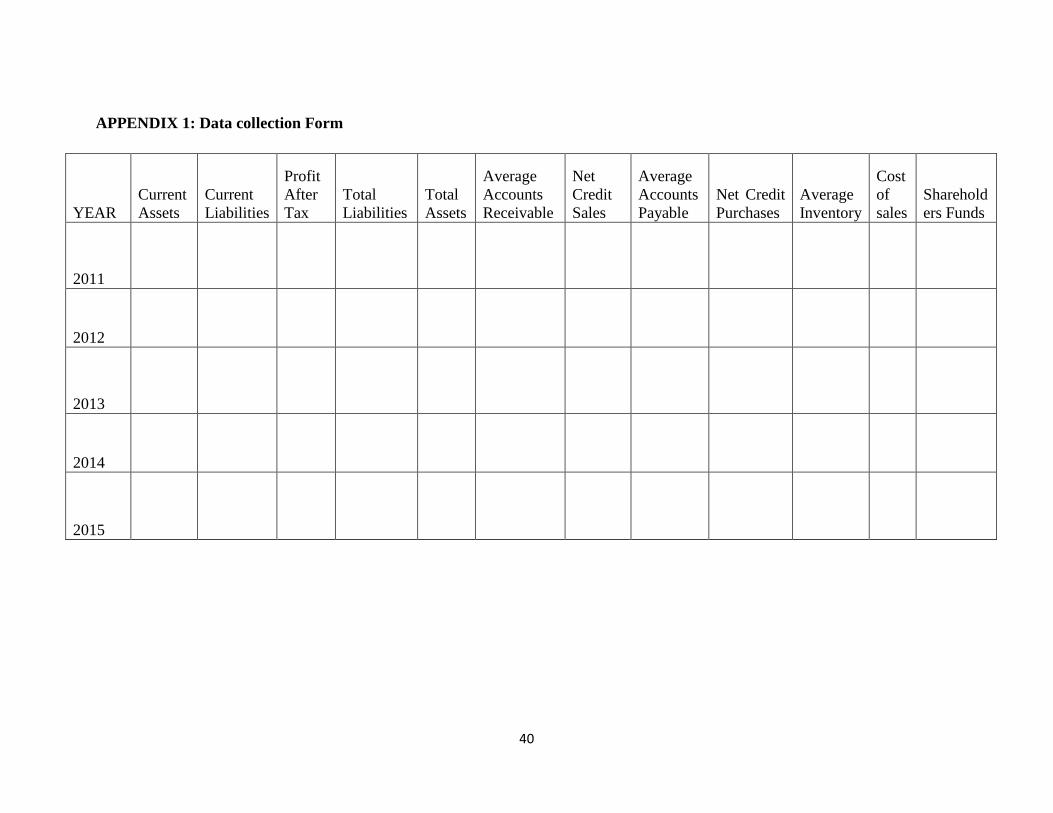
APPENDIX 1: Data collection Form ................................................................................ 40
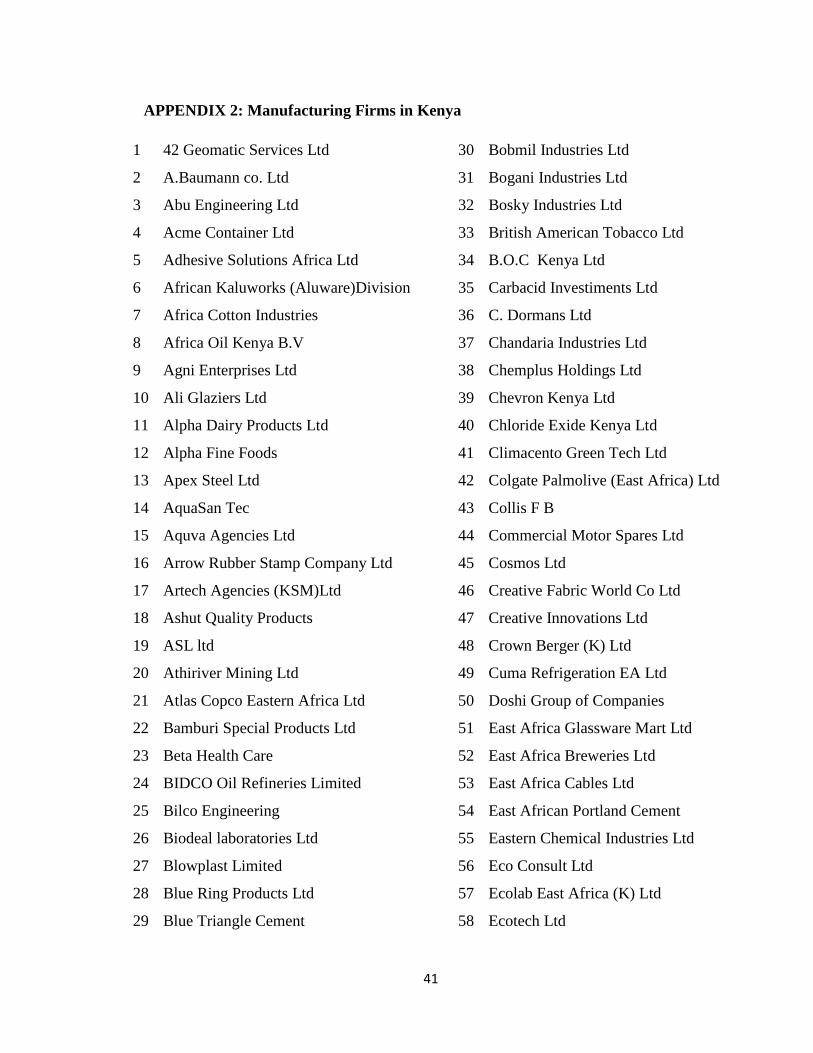
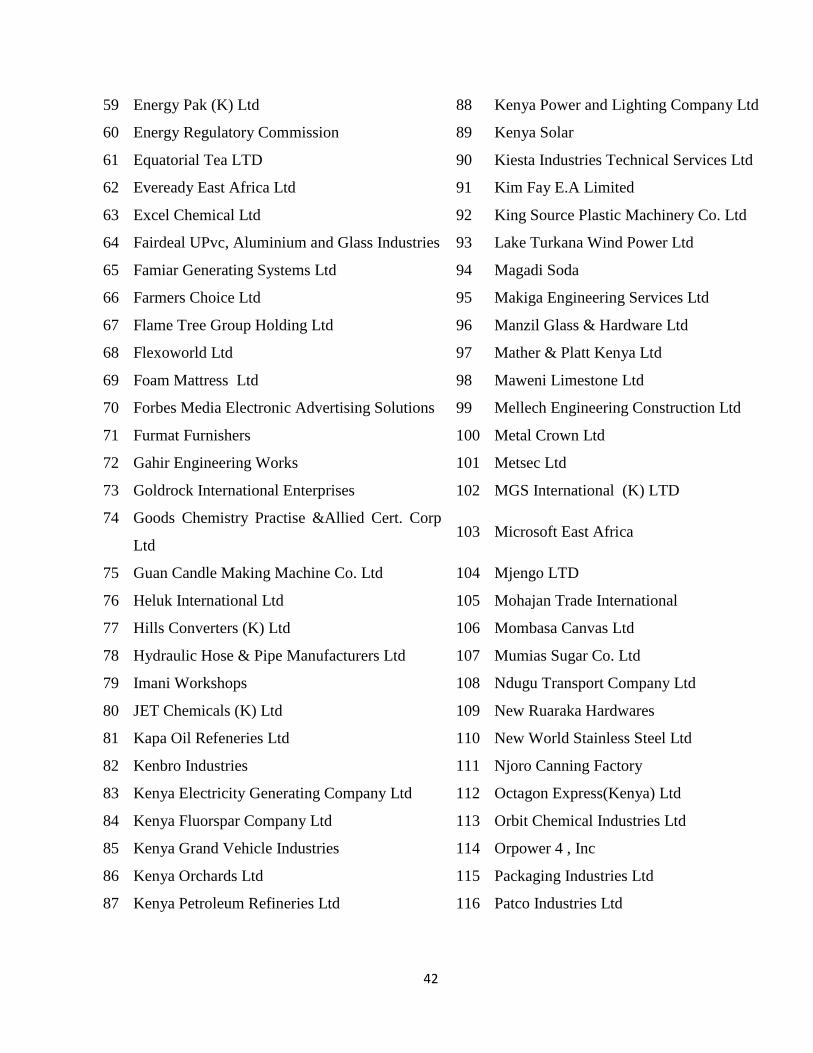
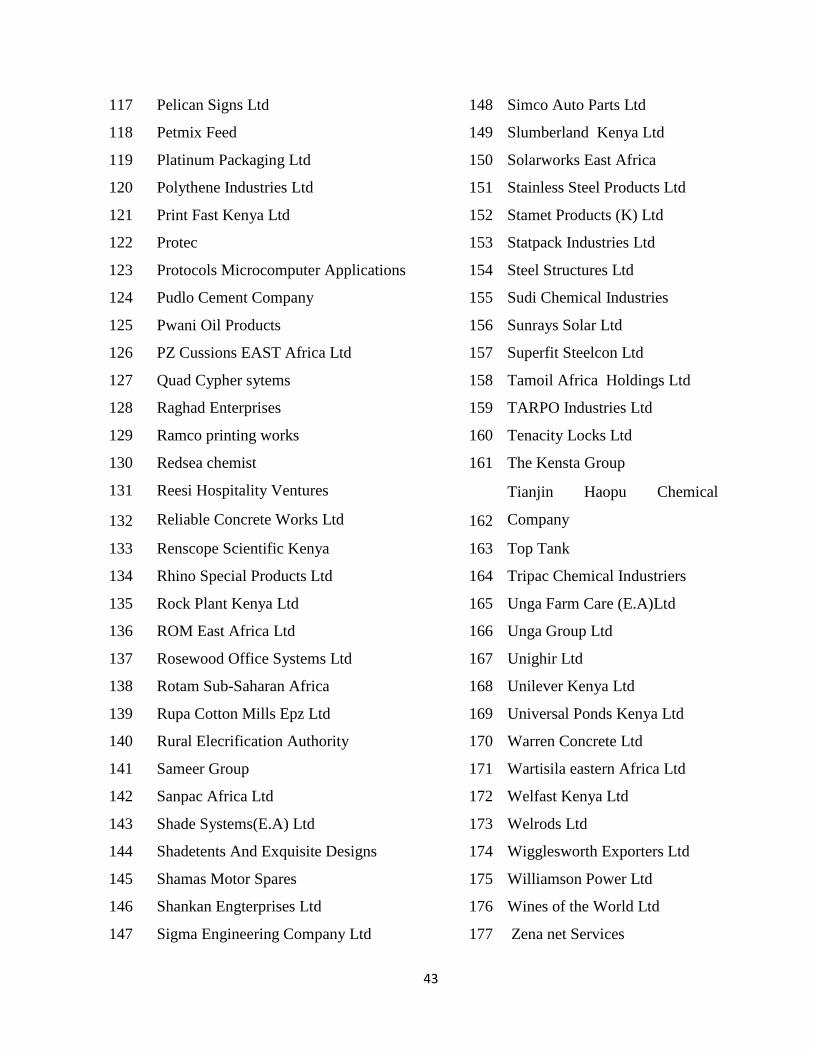
APPENDIX 2: Manufacturing Firms in Kenya ................................................................ 41
APPENDIX 3: Descriptive summaries ............................................................................. 44
vii
LIST OF TABLE
Table 4.1: Summary of the Statistics of performance Variables ...................................... 27
Table 4.2: correlation Analysis ......................................................................................... 28
Table 4.3: Goodness of fit ................................................................................................. 29
Table 4.4: Parameter Estimates ......................................................................................... 29
Table 4.5: Working capital management verses financial performance of firms ............. 30

viii
LIST OF FIGURES
Figure 2.1 Conceptual framework .................................................................................... 21
ix
LIST OF ABBREVIATIONS
ACP - Average Collection Period
APP - Average Payment Period
ACP - Average Collection Period
CCC - Cash Conversion Cycle
ITR - Inventory Turnover Ratio
IO - Industrial Organization
MP - Market Power
NSE - Nairobi Securities Exchange
PPP - Public Private Partnership
ROA - Return on Assets
ROE - Return on Equity
SEZs - Special Economic Zones
WCM - Working Capital Management
x
ABSTRACT
Financial performance is influenced by management of current assets and liabilities.
These current assets can be described as the assets which will be turned into physical
cash in a year, if the business runs smoothly, outside of having to suffer a decrease in
value, or disturbing the running of the company. The study employed both descriptive
and inferential analysis. Descriptive analysis shows the relevant aspects of the
phenomena under consideration. Inferential analysis study employs Pearson correlation,
the generalized multivariate linear regression analysis and the Chi-square statistics.
Initially the study determined the performance of the financial performance variables
under consideration that were debt ratio, average payment period, average collection
period, inventory turnover period and cash conversion ratio. Their mean, standard
deviation, minimum and maximum values were determined. The Pearson correlation
result shows that manufacturing firms’ financial performance has a significant association
with current ratio, average payment period, inventory turnover period and cash
conversion ratio. The results indicated that current ratio, average Payment Period (in
Days), inventory turnover period and cash conversion period had statistically significant
influence on the financial performance of manufacturing firms. Evaluating whether
working capital management has a relationship on financial performance of
manufacturing companies in Kenya with a Pearson coefficient of 17.700 and p-value of
0.007 shows a strong, significant, positive dependence between working capital
management and financial management of companies in Kenya. Therefore, centering on
these findings the research fails to accept the null proposition that there is no relationship
between working capital management and financial performance of companies in Kenya
and accepts the alternative proposition that there exists an association between working
capital management and financial management of companies in Kenya.
1
CHAPTER ONE: INTRODUCTION
1.1 Background of the Study
The management of performance impacts liquidity together with cost-effectiveness of the
company as far as economic strategy is concerned. Performance management is
influenced by the issues brought about by the management of current assets and
liabilities. These current assets can be described as the assets which will be turned into
physical cash in a year, if the business runs smoothly, outside of having to suffer a
decrease in value, or disturbing the running of the company. Examples are cash,
marketable stocks and bonds and shares, account to be taken in and inventory. Current
liabilities on the other hand are the liabilities ought to be paid at the beginning from the
current assets or from the company’s earnings within a year of a normal business course.
The fundamental current liabilities include bills and accounts payable, expenses due, and
bank overdraft. Proficient performance management is a fundamental part of the total
strategy of the corporation to optimize investors’ value. In this research I have selected
manufacturing companies on the NSE listing ranging over five years from 2011-2015.
Some of the influences of variables on the management of operational capital include;
current ratio, debt ratio, cash conversion period, accounts payable time, accounts
receivable time, inventory ratio and liquidity will be used for analysis.
2
1.1.1 Working Capital Management
Performance management influences mainly the firm’s administration of both current
assets and liabilities. Financial choices that are extended have been the main
concentration of corporate finance, and they include, firm’s assessments, the choices for
investment, dividend guidelines and the structure for the capital. Smith (1980)
determined short-term assets as those assets whose life expectations are planned to be
decided after a financial year, and they are also said to be a firms current assets. The
above mentioned short-term assets and liabilities are vital components to the overall
assets, and should therefore be meticulously and methodically investigated due to the
pivotal part they play in the company’s profitability, worth and risk.
For a manufacturing firm, the cycle of cash conversion indicates the length of time it
requires for an investment in raw materials to be ultimately realized as a cash receipt after
sale of the manufactured product. This series could be broken into several time points.
The period of time it takes: Between ordering and receipt of raw materials, for trade
creditors to be paid, for finished goods held in stock to be sold. Assuming no time lag
between the raising of sales and purchase orders and their execution the cash conversion
cycle can be determined by:
CCC = Operating Cycle (OC) – Average Payment Period (APP)
Or
CCC = AAI + ACP – APP

3
A wide and refined understanding into the expertise of capital management that is
operational is identified by a maximum level of assets, payables and receivables, whereby
overall stocks and cost of opportunities are reduced and cycles of cash exchange
revaluated. In as much as the flows in financials emanating from the stocks and
receivables is considered by the operating cycle, it greatly ignores the flows in financials
emanating from the accounts payable. In this situation, (Richards and Loughlin 1980)
indicates that the cycle of cash exchange that looks at all important movement of cash
emanates from the performance. According to Gentry, Vaidyanathan, and Wai (1990)
they proposed a cycle of conversion that is weighted which considers as well both the
financial movements and the sum of money allocated to the stages of each cycle.
1.1.2 Financial Performance
Over time, the degree of the firm’s performance can be described in terms of overall loss
and profit. Analyzing the firm’s administrative performance makes it possible for
decision-makers to evaluate the outcome of business plans and actions in an impartial
financial term. The term financial performance outlines the level to which the financial
goals are achieved or being achieved, and is pertinent to the management of financial
risk. It is the procedure of analyzing the outcome of the company’s guidelines in financial
terms, and also utilized to evaluate the general financial well-being of the firm, while at
the same time contrasting companies in the same industry (Eshna, 2012).
Questions concerning the financial status of a company are of major interest to
companies, administrators, stockholders, lenders, and tax authorities. These can only be
answered by undertaking a financial evaluation of a company, and this includes the
utilization of financial statements. These financial statements refer to a compilation of
4
information arranged under a rational and coherent accounting routine. The main function
of these statements is to impart a comprehension of some of the company’s financial
factors. As in the matter concerning Balance Sheet, it may indicate the financial status,
and a sequence of actions as in the matter concerning an income statement. The above
two indicates to an overall financial statement (Eshna, 2012).
1.1.3 Relationship between Working Capital Management and Financial
Performance
A company’s management of the working capital has become identified as a significant
aspect of financial management. The procedures of managing working capital comprises
of decisions on the sum and a combination of current assets, and how to fund them. It
also includes decisions on facets of cash investments, the preservation of a particular
level of assets and administering receivable and payable accounts. The management of
working capital main objective is to arrive at and maintain a maximum balance amid
every part of the working capital (Gitmen, 2009).
The accomplishment of a business hugely relies on the financial administrators capability
to efficiently supervise the payables, the list of assets and receivable (Filbeck and
Krueger, 2005). The funds to be utilized for expanding projects can either be decreased or
increased by companies through reducing the amount held up in the current assets. A
good amount of time and effort have been set aside by financial administrators to elevate
the degrees of current assets and liabilities, from minimal to best (Lamberson, 1995).
5
According to Van Horne and Wachowicz (2004), an excess degree of current assets bears
an adverse impact on the profitability of the company, while on the other side a low
degree might lead to weak levels of liquidity causing problems while sustaining a smooth
performance. Conventional ideas on working capital are the net of current assets and
liabilities. The idea of corporate liquidity is not represented precisely by the above
definition due to the fact that the constituents of working capital have varying degrees of
liquidity, as some have a financial characteristic with a liquidity that is high, while others
have a non-financial characteristic with a liquidity that is low. Therefore, the working
capital can be classified in financial and non-financial.
According to Shalman and Cox (1985) financial components was divided into Net
Liquidity Balance (NLB), and non-financial into Working Capital Requirement (WCR).
The liquidity however, of NLB varies from that of WRC they are in any case they are
connected. An example of this is the reductions in time of receivable accounts, will only
reduce WCR and NLB at the same time increasing the value of cash. A short term
guarantee of time can be performed by organizations in the event of a high sum of
working capital therefore, an effective management of capital market influences short
term performance, together with long term performance.
1.1.4 Manufacturing Firms in Kenya
Manufacturing can be defined as a variety of human actions aimed at the application of
industrial manufacture, whereby raw material are turned into finished products at a huge
scale. It involves adding value to a product intended for sale or utilization. The same
finished products can be used to manufacture other complicated products. In Kenya, the
6
manufacturing industry has continued to develop since the late 1990’s and the country
has a location advantage as the portal and a launching platform to markets in countries in
East Africa that are landlocked. There are about 177 manufacturing firms Kenya. Some
of the more common manufacturing companies include; Agricultural and Horticultural
products, Small-scale consumer goods like plastics and textiles, Aluminium, Cement, Oil
refinery and Lead.
1.2 Research Problem
The management of working capital is pertinent due to its influence on the financial
performance of the company, its risk, and therefore its worth (Smith, 1980). The
maintenance of high degrees of inventory decreases the cost of potential interruptions in
the process of production, or losing the business because of scarce products, reduction in
the cost of supply, and guard against price variations, and other benefits (Blinder and
Manccini, 1991). The bestowment of trade credit supports the sales of the company in
many ways. They act as an efficient method for price reduction, (Brennan, Maksimovic
and Zechner, 1988; Petersen and Rajan, 1997), encourages clients to obtain goods when
the demands are low (Emery, 1987), enables the clients to examine the goods received
and guarantee that the services agreed upon have been conducted (Smith, 1987), and
finally, assists companies to establish strong connections with their clients (Smith and
Smith, 1999). The accomplishment of a business hugely relies on the financial
administrators capability to efficiently supervise the payables, the list of assets and
receivable (Filbeck and Krueger, 2005).
7
It is important for manufacturing companies to have sufficient administration of working
capital. This is largely due to the reason that insufficient working capital to insure its
responsibilities will often lead to financial insolvency, which is the inability to pay their
debts, legal issues, liquidation and possible bankruptcy. The management of working
capital is basically a procedure for accounting with a primary concern on the preservation
of an adequate equilibrium between the current assets and liabilities of a firm. A working
capital management that is efficient permits manufacturing companies to both insure their
financial responsibilities and increase their profits. Management of working capital often
indicates the management of accounts payable, receivables and finally inventories. The
utilization of significant performance ratio by the working capital like the collection ratio,
the working capital ratio, and inventory turnover ratio are usually to assist in the
identification of sections that need attention so as to preserve liquidity and profitability.
1.3 Objective of the study
The goal for this research is to establish the relationship between the management of
working capital and financial performance of manufacturing companies in Kenya.
1.4 Value of the Study
In the vent that a firm has insufficient working capital to insure its responsibilities will
often lead to financial insolvency, which is the inability to pay their debts, legal issues,
liquidation and possible bankruptcy. It is therefore important for manufacturing
companies to have sufficient administration of working capital.
8
This research is anticipated to give a more improved comprehension of the guidelines for
the formulation of plans on the administration of working capital and its effects on
profitability particularly in Kenya’s emergent markets.
The results of the research will equally be of importance to administrators in companies
when deciding what strategies to use concerning the management of working capital for
the purpose of improving the company’s performance. With changes in business
conditions especially economic conditions, the study will give insight into the effective
way of managing working capital for firms to improve performance. It will also help
policy makers to put in place new policies and regulations concerning working capital
management.
9
CHAPTER TWO: LITERATURE REVIEW
2.1 Introduction
In chapter two, we shall examine the studies that had been conducted by other researchers
along this topic. The chapter will address; various theories of Working capital
management, empirical literature, determinants of financial performance, conceptual
framework and Summary of the literature. A number of researchers have analyzed the
management of working capital and financial ratios as a part, in any event, few have
analysed the specifics of working capital guidelines. An examination of management of
working capital guidelines in 32 industries that are non-financial in the United States of
America was done by Filbeck and Krueger (2005) and they emphasized the significance
of an effective management of working capital. A major distinction was exhibited in the
outcomes of the study between industries that have for a long time been practicing
working capital.
2.2 Theoretical Literature
This chapter will discuss relevant literature on management of working capital and how it
relates to financial performance of manufacturing firms. This hence will build an
understanding on the theme of the study. Various theories have been considered on
working capital management, they include: cash conversion theory, transaction cost
economic theory operations cycle theory and resource based theory and are explained
below.
10
2.2. Cash Conversion Cycle Theory
This theory depicts the interface amid the constituents of working capital and the cash
flow within a firm, and it can be utilized to decide on the sum of money required for any
degree of sales. This theory is utilized as an inclusive evaluation of working capital due
to its ability to showcase the time delay between the amounts spent for purchasing the
raw materials and when the cash for the finished products was being collected (Padachi,
2006). When a company’s short term assets and liabilities are continually managed, this
will eventually participate in the accomplishment of the company. It is believed that those
firms whose long term views are developing and have a sound bottom line often cannot
be able to pay all debts the good management of liquidity (Jose and Lancaster, 1996).
The cycle of cash conversion was built by Gitman (1974) as a component of operating
cycle which can be computed through the addition of inventory period to the period of
accounts receivable, and later making a subtraction of the accounts payable. The main
concern is on the amount of time between obtaining the staple material and the influx of
money from the selling of finished products. It also corresponds to the amount of days of
planned activities in which financing is required. According to (Jose and Lancaster,
1996), the cycle of cash conversion of CCC compounds both the information on the
statement of income and the balance sheet to make quantification with time measure, and
this is functioning assessment of management of liquidity. The accurate method hence is
to make a comparison of a particular company to the establishment to which it works
within (Hutchinson, 2007). The length of the CCC is provided by;
11
CCC = Inventory days + Trade receivables days − Trade payables days
As Arnold (2008) found out, the more brief the CCC is, the less resources required by a
firm, and the more extended the CCC is, then the investments will be complicated. An
extended CCC however could cause a growth in sales thereby leading to a high
profitability. This extended CCC on the other hand would also cause high investments
and could continue to incline further than the advantages of the elevated profitability.
2.2.2 Transaction Cost Economics Theory
This theory references to the transaction as the fundamental unit of evaluation and
maintains that the comprehension of cutting back transactional cost will be pertinent to
the examination of companies. This theory can be enforced both to the decisions of an
effective delimitation as exists between companies and the market and the arrangement of
internal transactions. The determination of a maximum degree of inventory should be
done based on an exchange between the costs and advantages connected with the degree
of inventory. The cost of ordering and the carrying costs are comprised in the holding
cost of inventory. The ordering costs is connected to the purchase of inventory, which is
inclusive of the preparation of a purchase form, reception, examination and registering
the products accepted.
On the contrary, the cost of carrying includes the maintenance of inventory and comes
about because of the cost of storing inventory and other opportunity costs. A number of
reasons exist for the high and low degrees of inventory and these reasons is dependant
highly on the type of business the firm is in. One of the simplest reasons for the
12
management of inventory is the cost, which is established on theory of Transaction Cost
Economics (TCE) (Emery and Marques, 2011). For the companies to have a competitive
vantage point, they must reduce their costs, and they can achieve this through
maintaining the costs of inventory at a logical low degree.
2.2.3 Operating Cycle Theory
Richards and Laughlin (1980) developed this theoretical approach were they focused
their attention at looking at management of working capital and its individual elements.
The liquidity flow concept development is through the extension of the analysis of static
balance sheet to identify the capability of liquidation coverage of the value including
measures of income statement of the operating activity of a firm. Specifically, receivable
accounts and measures of the inventory turnover when incorporated into the concept of
operating cycle gives a more precise perception of management of liquidity than the
solvency indicators which are the current and acid taste ratio.
Westen and Eugene (1979) sys that the extra measures of liquidity have a clear
understanding that anticipations of life of some components of working capital is
dependent on how much production, distribution and collection are either un-
synchronized and non-instantaneous. The frequency of conversion of receivable
investment that is of average into cast through an indicator-account receivable turnover.
when policies in collection and credit change, the average of the distinguished receivable
balance that annual sales of a firm relatively maintain is impacted. When more liberal
terms are granted by a company, there is creation of a large and likely less liquid,
receivable current investment in customers except when there is a proportionate increase
13
in sales that makes receivables increase. Liquidity that is potentially deteriorating is
reflected by receivable turnover that is lower and a receivable collection period that is
extended. A firm will attain higher ratios in currency and acid-test though choices that
aim at maintaining larger average receivables investments with time (Richards and
Laughlin, 1980). Operating cycle length of a company is approximated by turnover
cumulative days for receivable accounts and investment inventory. When these turnover
assets are incorporated into the concept of operating cycle of the conversation period of
current assets providing a liquidity indicator of the firm that although incomplete, is more
realistic.
2.2.4 Resource Based Theory
The survival of business and profitability of entity is based on resources, whether human
or material. There is need for differentiating capabilities from resources when company
stock resources are being taken. Resources are a vital analyzing unit since they are
production process unit. Examples of resource that a company possess include capital
equipment, employee skills, brand names, patents, finance etc. when firm operate
independently, its productive resource are few. If resources will be productive there that
to be team cooperation and coordination, which is shown by the teams’ capability to act
on a variety of tasks. Thus, as put across by Grant (2001), a company’s capability is
defined by available resources. This model is inclusive of individual manager’s cognitive
ability to make sure that short-term working capital is managed effectively (Alvarez &
Busenitz, 2001). Therefore, any company manager contain resources that are individual-
specific that aim at facilitating and ensuring new opportunities are recognized, that the
resources are effectively assembled, payments being mad are psyched and receivable
14
recovering as a way of making sure that working capital is effectively managed and thus
the company’s profitability.
2.3 Empirical Literature
Empirical literature discusses what other scholars have discussed based on the general
objective of the study. A lot of researches have been conducted studying working capital
from a variety of angles and spheres. The ones outlined below were practical to our
study. According to Eljelly, (2004), he clarified that an effective management of liquidity
includes the planning and the control of both current assets and liabilities in a way that
gets rid of the uncertainty of being unable to accomplish short terms responsibilities that
are due, and prevents making extreme investments on the assets.
The connection between liquidity and profitability was assessed, as computed by the
current ratio and the gap in cash on a sample unit of connected equity firms through the
utilization of the regression analysis and correlation on Saudi Arabia. The research
identified that the cycle of cash exchange was of more significant as an evaluation of
liquidity than on the current ratio that impacts profitability. The variable of size was
identified to bear a more important impact on profitability at the level of the
establishment. The outcomes were steady, and bore significant effects for the
management of liquidity in a number of Saudi firms. In the Saudi sample analyzed, at
first, it was evident that there existed an adverse connection between profitability and the
signals for liquidity like current ratio, and gap in cash.
15
The research indicated a high degree of diversities between companies, while talking
about the assessment of liquidity. According to (Deloof, 2003), he indicated that a lot of
companies had a great sum of money invested in the working capital. We can hence
expect, that with this kind of management of the working capital, it will have an
important effect on the company’s profitability. Through the utilization of the regression
analysis and correlation, an important adverse connection was discovered between gross
operational income and the amount of days, the accounts receivables, the inventories, and
the accounts payable of companies in Belgian. Based on the outcomes above, he
proposed that the administrators could make value for their stockholders through the
reduction of the amount of days, the accounts receivable, the inventories, and the
accounts payable, to a logical minimum. The adverse connection between the accounts
payable and the profitability of a company is coherent with the outlook that companies
that make less profits wait for longer periods prior to making payments on their bills.
A suggestion was made by Filbeck and Krueger (2005) that companies ought to be able
to make a reduction in the cost for financing and or make an increase in the cash
attainable for expanding the firm through the minimization of the sum of cash help up in
current assets. Significant variation and changes were uncovered in the assessment of
working capital between establishments beyond time. An evaluation of the connection
between working capital and the profitablility of pharmaceuticals firms in India was done
by (Chakraborty, 2008). He made an indication of the two different schools of thoughts
on this particular matter; in one of them, the concept of working capital is not a factor for
enhancing profitability and an adverse connection may exist between them. In the other,
16
investments in the working capital is important in enhancing corporate profitability, and
not before there is a least amount of investment of working capital, then products and
sales cannot be well kept. An examination of the strategic management of working
capital and its function in the development of corporate strategy was done by
Chakraborty and Bandopadhyay (2007), which in the end ensured the company’s
survival. The multidimensional effect of the decisions of the strategic current assets and
decisions of the strategic current liabilities on the firm’s performance was emphasized.
Researchers within our country have also researched the management of capital
management and financial performance. An observation was made by Nyakundi (2003),
on the guidelines of the management of working capital amid Kenya’s public firms.
Through utilizing a simple linear regression, he came to a conclusion that there existed no
connection between the management of working capital and profitability. A study
conducted by Kithii (2008) analyzed the connection between the management of working
capital and profitability of firms on the NSE listing. Through using a Pearson‘s moment
correlation of co-efficient, she uncovered an important adverse connection between the
cycle of cash exchange and profitability. Mutungi (2010) studied the connection between
management of working capital and the financial performance of Kenyan oil marketing
companies. From the correlation analysis, the study concluded an existence of aggressive
working capital policy in the oil sector. A study conducted by Mathuva (2010),
discovered conflicting proof with the supervision of inventories in Kenya. He according
to him, firms their levels of inventories so as to make a reduction in the cost of potential
halt in production, and the probability of insufficient staple material. Also, a high level of
17
inventory makes a reduction in the cost of supply and guards against varying price
changes induced by changing factors in the macroeconomic.
2.4 Determinants of Financial Performance
The performance of a company is significant not only to the investors, but also to the
shareholders and the overall economy. Returns on the investments are of great value to
the investors, and a company that is performing exceptionally, will bring high and long
term profits on their investments. Apart from that, the profitability of a firm, in terms of
financial, will eventually benefit its employees, and bring about an improved quality of
their products to their clients. The more a company acquires profits, the more the
investments, thereby leading to increased employment opportunities and improve their
income. A number of research have been conducted so as to identify the variety of
financial components of performance, but up to now, no model has been identified that
can capture the utmost degree of diversity. The determinants involved in financial
performance can be said to comprise of management of risk, the arrangement of
ownership, the structure of capital and liquidity, and finally, the company’s policies
attributes.
2.4.1 Risk Management
The outcome of the firm usually stipulates the worth of the market, and the degree to
which the firm is exposed to uncertainties will lead to alteration of the market value. This
will impact on a firm’s performance. Firms that take a lot of risks, will at most times only
draw in clients who love to take risks. It will be fair if risk and returns are managed for
18
investors to get that return which is connected and anticipated with the uncertainties
which they have.
2.4.2 Firm Characteristics of Policies
There are particular traits of a company that are connected to high performance. These
traits are inclusive of the size, the rate of growth, dividends, liquidity and sales. Big
companies draw in better qualified administrators and employees who then make a
contribution to the performance of the company. In as much as many researches have
been carried out on the individual determining factor of a company’s performance, very
few have accounted for all the components. A study was conducted byYasseret al.
(2011), examining the impact of board characteristics on the performance of a company,
and Wahla et al.(2012) assessed the effect of the structure of ownership on the
performance of a company.
2.4.3 Ownership Structure
As discussed above on the theory of agency, if the company’s administrators owned
equity in the firm, then they would be more inclined to increase the returns of the
stakeholders (Dutta, 1999). According to Jensen et al. (1992), the diversification of
administrators could prove to be costly. This theory of the structure of ownership has
been examined empirically on a variety of incidents, and it turned out that the internal
ownership usually resulted in the long term performance of a company (Reddy, 2010)
19
2.4.4 Capital Structure
This is among the most significant components which influences the generation of funds.
In every establishment, a good amount of resources be it land, capital employment or
labor is needed. The ratio of debt and equity financing is referred to as the capital
structure. In the event that a company utilizes more debt to finance, then it becomes at
risk of facing bankruptcy.
2.4.5 Liquidity
This term is used to depict the ease at which assets can be converted to cash. Due to the
ease with which money can be utilized it is hence described as the most liquid asset. For a
firm to run smoothly, a certain sum of cash is needed so as to handle sudden costs, make
their usual payments, and purchase staple material that is utilized in production.
According to Smith, 1980; Raheman and Masr, (2007), the quandary that arises from the
management of working capital is the desire to attain the longed for tradeoff between
liquidity and the profitability of the company.
Pertaining to the risk and return theory, the more risky the investment is, then the more
profit it will yield. Therefore, companies that have an elevated level of liquidity of
working capital may bear low uncertainties and low profitability. In contrast, firms that
bear a depleted level of liquidity of working capital, face a high level of uncertainty
therefore resulting in a high financial performance.
20
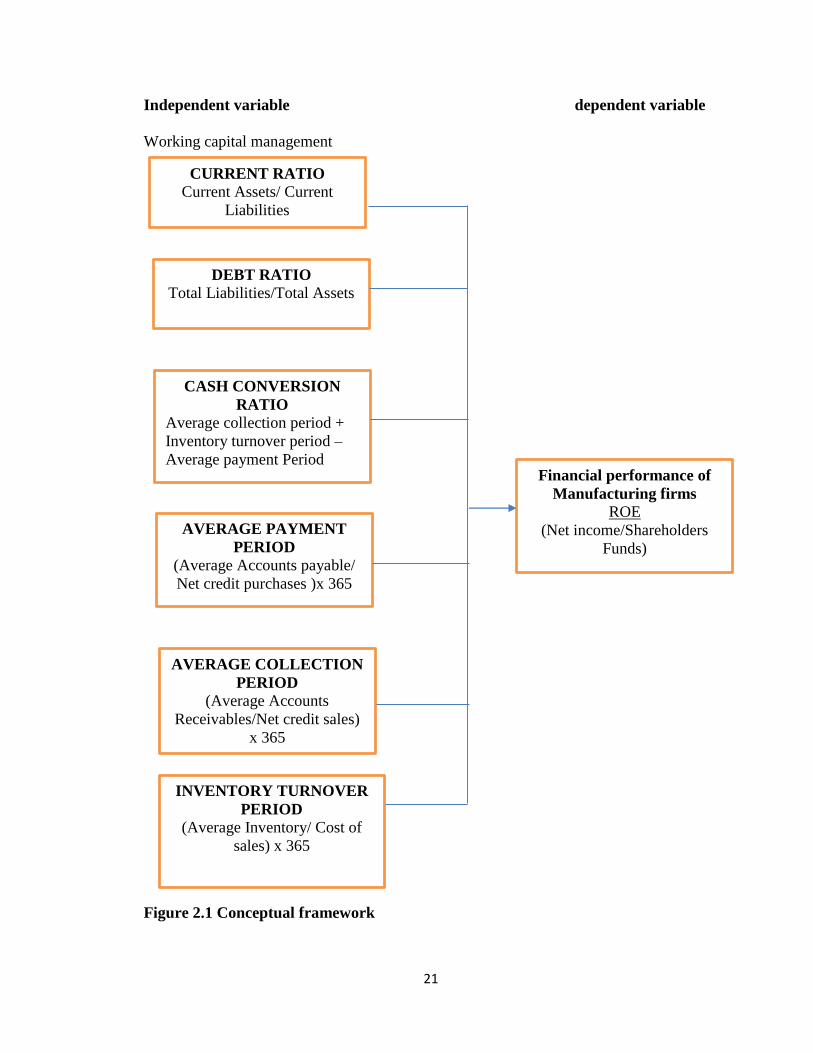
2.5 Conceptual Framework
The conceptual frame work of the study will be derived as per the views of different
authors. According to Encyclopedia Britannica (2010, a conceptual framework ascribes
to a number of concepts that are extensively explained, arranged in order to give focus,
rational and an instrument for blending and explanation of information, and is at most
times describes in abstract via word models). On this study the conceptual framework
involves the connection between management of working capital and financial
performance of manufacturing companies. The above literature review led to the
following conceptual model, that show the connection between the independent variable
(Working Capital Management) and the dependent variable (Financial Performance of
Manufacturing Firms)
21
Independent variable dependent variable
Working capital management
Figure 2.1 Conceptual framework
CURRENT RATIO
Current Assets/ Current
Liabilities
DEBT RATIO
Total Liabilities/Total Assets
CASH CONVERSION
RATIO
Average collection period +
Inventory turnover period –
Average payment Period Financial performance of
Manufacturing firms
ROE
(Net income/Shareholders
Funds)
AVERAGE PAYMENT
PERIOD
(Average Accounts payable/
Net credit purchases )x 365
AVERAGE COLLECTION
PERIOD
(Average Accounts
Receivables/Net credit sales)
x 365
INVENTORY TURNOVER
PERIOD
(Average Inventory/ Cost of
sales) x 365
22
2.6 Summary of the Literature
The literature reviews in this chapter present an elaborate and detail linkage between the
dependent and independent variables in the study. Risk management, Firm characteristics
of policies, Ownership structure, Capital structure and liquidity management are
supported by planning; controlling indicators that will be viewed as elements of
profitability and that management of the working capital has a direct relationship with a
company’s financial performance.
However, no research from the literature has been capable to create a structure that will
help administrators to develop a maximum working capital under a variety of
establishments. The literature and the research instead indicates an efficient level without
unavoidably indicating the same degree or how to establishing it. Not a lot of researches
have been carried out in the overall situation of Kenya that touches on the management of
working capital; according to the empirical studies it indicates that not a lot has been
done to settle on the connection between working capital and financial performance.
23
CHAPTER THREE: RESEARCH METHODOLOGY
3.1 Introduction
In this chapter, the research design and methodology that was utilized to meet the
objectives of the study are presented. It stipulates the systematic research procedure and
techniques the researcher applied when collecting and analyzing the data. These steps
include; research design, target population, the techniques for collecting data, analyzing
data and presentation and variables.
3.2 Research Design
The research adopted a descriptive research design. Descriptive research case study is
used to develop snapshots of specific observable events of concern, because big samples
are at most times involved. This involved a meticulous planning of events so as to depict
what is taking place or what took place. It is mostly applicable where the aim of the study
is to depict the attributes of particular items, and make estimations of the size of
individuals who conduct themselves in particular ways, and develop certain
prognostications. The design is ideal for this study given the need to collect information
on the connection between working capital and profitability, (Orodho, 2009).
3.3 Target Population
The target population of the study will be 177 manufacturing Firms in Kenya (Appendix
2).
24
3.4 Sample
According to (Nachmias & Nachemias, 2004), the researchers usually chose a sampling
unit based on his feelings and thoughts so as to attain a portion that seems to be a
representative of the entire population. In this case, the probability of a certain unit being
chosen as a sample relies on the judgments of the researchers that are subjective. To
arrive at the representatives sample of the study by Cochran( 1963) later simplified by
Yamane (1967) will be used.
The formula is n=N/1+N (e)2
Whereby n represents the size of the sample, N representing total the size of the
population, and e being the degree of accuracy which is at a 95% level of confidence.
Then the sample size of the study will be ,
n=177/1+177(.05)2 n=123
3.5 Data Collection Procedures
In this research, secondary data was utlized. Jewel (2001), indicated secondary data
as information that was collected for other reasons other than the primary one and
may require adjusting and validating prior to being utilized. All the information that
was collected by review of documents, annual reports of the manufacturing firms and
published books of accounts, therefore financial information of manufacturing firms
in Kenya was derived out of the balance sheets and income and expenditure
statements and other relevant document. Data collection form (See appendix 1).
25
3.6 Data Analysis and Presentation
The information gathered was assessed through quantitative data analysis techniques so
as to determine the degree to which the main study variables are related namely Current
ratio, Debt ratio, and cycle of cash conversion, Average period of Payment, period of
Inventory turnover and period of Average collection. Whereas qualitative technique was
used for analyzing the on inferential statistics, the quantitative techniques will be use of
descriptive statistic. In addition, the data that was collected was subjected to thorough
screening to ensure normality, coded and tabulated for easy understanding, for example
the researcher organized, edited and interpreted qualitative data, so as to examine,
describe and compare the associations and relationships between the main indicators of
the study variables. The statistical package for social sciences (SPSS) was used to
establish the actual relationship between the two sets of study variables .The researcher
ensured that the appropriate and relevant statistical techniques was used to analyze each
item ( Saunders et al, 2008) .
The ANOVA technique in the study determined the effect of the model ∞0.05 level of
significance. Quantitative analysis of data was used since it well suits secondary data (
Leavy , 2004) .The financial ratios for both the independent and the dependent variables
was computed through SPSS to get the results. Data was represented using tables and
regression analysis was used for conclusions.
The researcher used the multivariate regression model below to analyze the data.
Y= β0+β1X1+ β2X2+β3X3+ β4X4 + β5X5+ β6X6 +
26
Where Y=is the Return On Equity to measure financial the performance of manufacturing
firms
X1= Current Ratio
X2= Debt Ratio
X3= Cash Conversion Ratio
X4= Average payment Period
X5= Inventory turnover period
X6 =Average collection Period
β0= Constant term,
β0-------β6= was used to measure the dependent variable (Y) to unit change in the predictor
variables.
𝜺 =is the error term for all variables influencing performance
Significance tests: at 95% confidence level or at 5% degree of significance.
27
CHAPTER FOUR: DATA ANALYSIS, INTERPRETATION AND FINDINGS
4.1 Introduction
In this chapter, a descriptive and conclusive assessment of data is provided. This was
utilized to help the study in describing relevant aspects of the phenomena which are being
considered. An estimation of the connection between the management of working capital
and financial performance of manufacturing firms are made by the regression. Also the
chi square test statistics was used in examining if working capital management is
suggestively distinctive from that of the company’s financial performance.
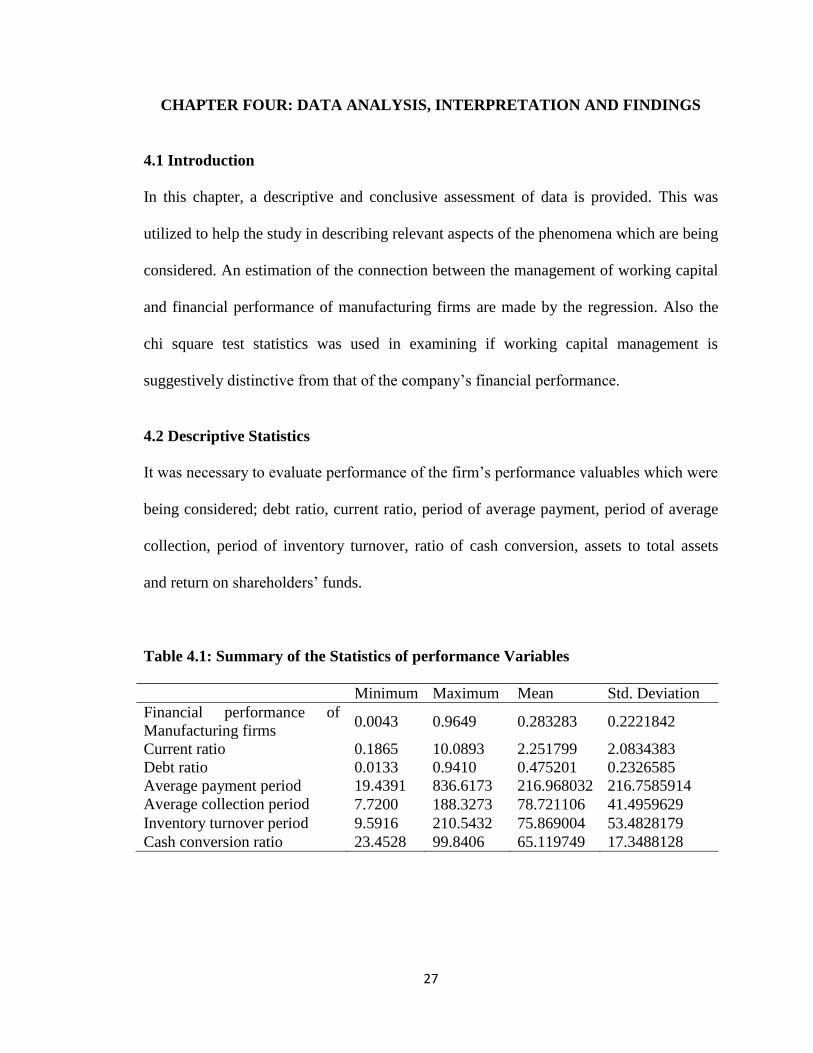
4.2 Descriptive Statistics
It was necessary to evaluate performance of the firm’s performance valuables which were
being considered; debt ratio, current ratio, period of average payment, period of average
collection, period of inventory turnover, ratio of cash conversion, assets to total assets
and return on shareholders’ funds.
Table 4.1: Summary of the Statistics of performance Variables
Minimum Maximum Mean Std. Deviation
Financial performance of
Manufacturing firms 0.0043 0.9649 0.283283 0.2221842
Current ratio 0.1865 10.0893 2.251799 2.0834383
Debt ratio 0.0133 0.9410 0.475201 0.2326585
Average payment period 19.4391 836.6173 216.968032 216.7585914
Average collection period 7.7200 188.3273 78.721106 41.4959629
Inventory turnover period 9.5916 210.5432 75.869004 53.4828179
Cash conversion ratio 23.4528 99.8406 65.119749 17.3488128
28
Table 4.1 shows summary statistics of all variable utilized in the model. It provides
information on mean and the standard deviation per variable. From the findings Current
ratio and debt ratio are averagely 2.25 and 0.475 respectively, average payment period
was (217 days), average collection period (79 days), inventory turnover ratio
(76 days), cash conversation ratio was 65 days, while overall return on equity was 0.28.
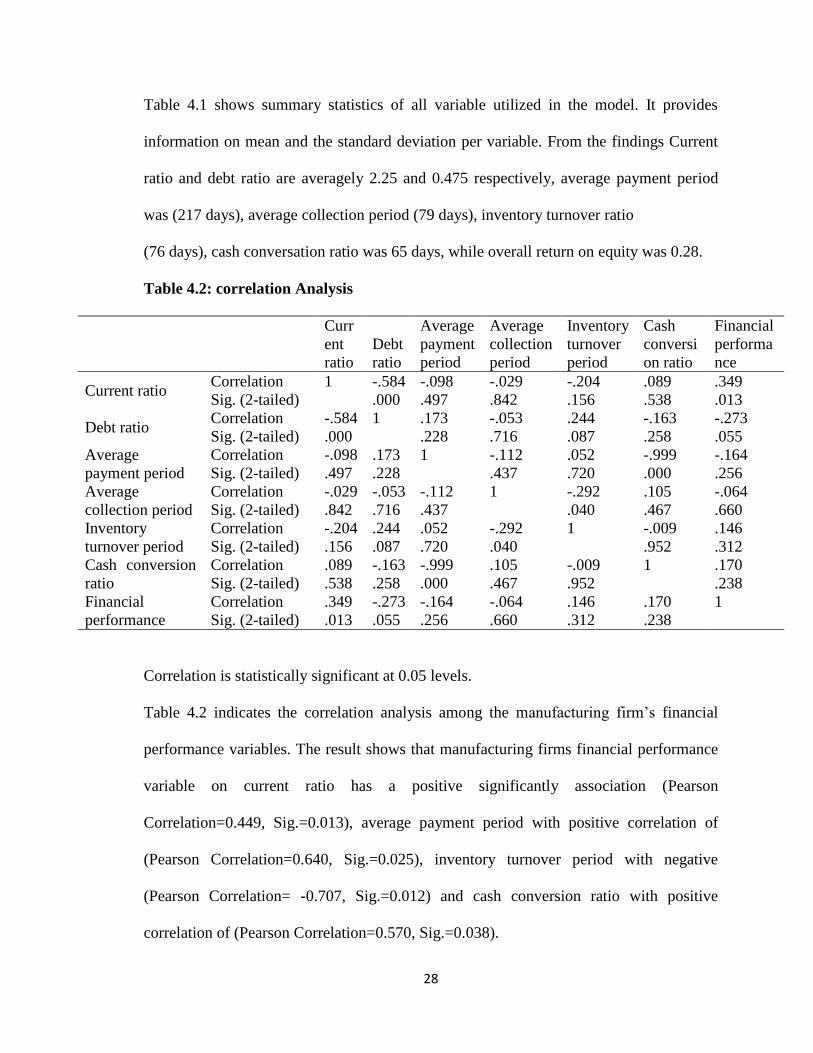
Table 4.2: correlation Analysis
Curr
ent
ratio
Debt
ratio
Average
payment
period
Average
collection
period
Inventory
turnover
period
Cash
conversi
on ratio
Financial
performa
nce
Current ratio Correlation 1 -.584 -.098 -.029 -.204 .089 .349
Sig. (2-tailed) .000 .497 .842 .156 .538 .013
Debt ratio Correlation -.584 1 .173 -.053 .244 -.163 -.273
Sig. (2-tailed) .000 .228 .716 .087 .258 .055
Average
payment period
Correlation -.098 .173 1 -.112 .052 -.999 -.164
Sig. (2-tailed) .497 .228 .437 .720 .000 .256
Average
collection period
Correlation -.029 -.053 -.112 1 -.292 .105 -.064
Sig. (2-tailed) .842 .716 .437 .040 .467 .660
Inventory
turnover period
Correlation -.204 .244 .052 -.292 1 -.009 .146
Sig. (2-tailed) .156 .087 .720 .040 .952 .312
Cash conversion
ratio
Correlation .089 -.163 -.999 .105 -.009 1 .170
Sig. (2-tailed) .538 .258 .000 .467 .952 .238
Financial
performance
Correlation .349 -.273 -.164 -.064 .146 .170 1
Sig. (2-tailed) .013 .055 .256 .660 .312 .238
Correlation is statistically significant at 0.05 levels.
Table 4.2 indicates the correlation analysis among the manufacturing firm’s financial
performance variables. The result shows that manufacturing firms financial performance
variable on current ratio has a positive significantly association (Pearson
Correlation=0.449, Sig.=0.013), average payment period with positive correlation of
(Pearson Correlation=0.640, Sig.=0.025), inventory turnover period with negative
(Pearson Correlation= -0.707, Sig.=0.012) and cash conversion ratio with positive
correlation of (Pearson Correlation=0.570, Sig.=0.038).
29
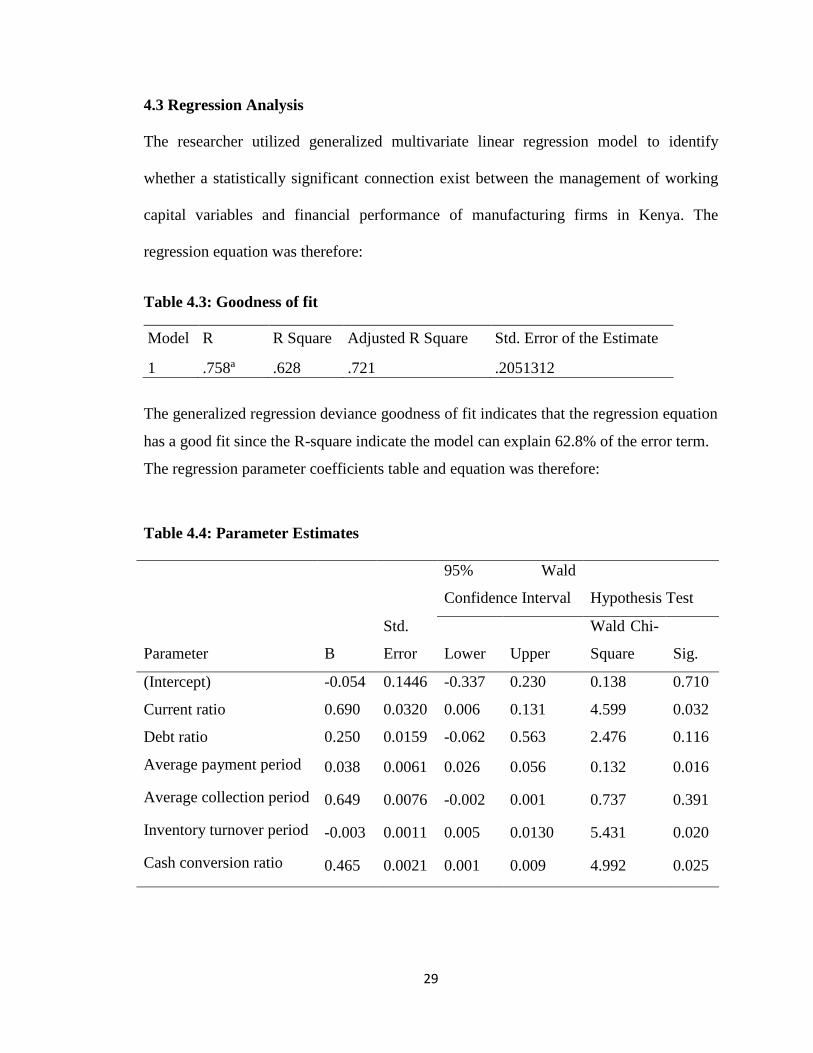
4.3 Regression Analysis
The researcher utilized generalized multivariate linear regression model to identify
whether a statistically significant connection exist between the management of working
capital variables and financial performance of manufacturing firms in Kenya. The
regression equation was therefore:
Table 4.3: Goodness of fit
Model R R Square Adjusted R Square Std. Error of the Estimate
1 .758a .628 .721 .2051312
The generalized regression deviance goodness of fit indicates that the regression equation
has a good fit since the R-square indicate the model can explain 62.8% of the error term.
The regression parameter coefficients table and equation was therefore:
Table 4.4: Parameter Estimates
Parameter B
Std.
Error
95% Wald
Confidence Interval Hypothesis Test
Lower Upper
Wald Chi-
Square Sig.
(Intercept) -0.054 0.1446 -0.337 0.230 0.138 0.710
Current ratio 0.690 0.0320 0.006 0.131 4.599 0.032
Debt ratio 0.250 0.0159 -0.062 0.563 2.476 0.116
Average payment period 0.038 0.0061 0.026 0.056 0.132 0.016
Average collection period 0.649 0.0076 -0.002 0.001 0.737 0.391
Inventory turnover period -0.003 0.0011 0.005 0.0130 5.431 0.020
Cash conversion ratio 0.465 0.0021 0.001 0.009 4.992 0.025

30
From table 4.4 above, when all factors are taken into account current ratio (B=0.690,
Sig.=0.032), average Payment Period (in Days)(B=0.038, Sig.=0.016), inventory turnover
period(B=-0.003, Sig.=0.020) and cash conversion period(B=0.465, Sig.=0.025)had a
statistically important influence on the financial performance of manufacturing
companies. The Standardized Beta Coefficients (B) gives a unit measure of each
variables contribution in the model. The larger the Standardized Beta Coefficients (B)
implies a bigger influence per unit change on financial performance of manufacturing
firms. The 95% Wald confidence interval and Sig. (p values) show significance at 0.05
level of importance of each predictor variable.
The model for the financial performance of manufacturing firms from the regression
equation that indicates the contribution in the model by each of the independent variables
is;
Financial performance = -0.054+0.690current ratio+ 0.250debt ratio+0.038average
payment period+ 0.649average collection period- 0.003 inventory turnover period+
0.465cash conversion ratio
Table 4.5: Working capital management verses financial performance of firms
Financial performance of firms
Working capital management Pearson correlation 17.700
Sig. 0.007
N 10
A Pearson coefficient of 17.700 and p-value of 0.007 shows a strong, significant, positive
dependence between management of working capital and the financial performance of
Kenyan companies. Therefore, centering on these results the research fails to
31
acknowledge the existence of a null hypothesis and that there is no connection between
working capital management and financial performance of companies in Kenya and
accepts the alternative theory that there exists an association between working capital
management and the financial performance of Kenyan companies.
32
CHAPTER FIVE: SUMMARY, CONCLUSIONS AND RECOMMENDATIONS
5.1 Introduction
This chapter summarizes the study and creates deductions based on the findings
uncovered. Suggestions from the results and the fields of additional studies are presented.
The section presents the results from the research in comparison with what was noted by
other researchers in the literature review.
5.2 Summary of Findings and Interpretations
The study utilized two kinds of data analysis tools i.e. descriptive analysis, and inferential
analysis. Descriptive analysis describes the relevant aspects of the phenomena (mean,
standard deviation, maximum and minimum) being considered and indicates itemized
data about every important variable. Inferential analysis, the study employs Pearson
correlation, the generalized multivariate linear regression analysis and the Chi-square
statistics. Initially the study determined the performance of the financial performance
variables under consideration that were debt ratio, current ratio, period of average
payment, period of average collection, period of inventory turnover, ratio of cash
conversion. Their mean, standard deviation, minimum and maximum values were
determined.
The Pearson correlation result shows that manufacturing firms’ financial performance has
statistically significant association on current ratio, period of average payment, period of
average collection, period of inventory turnover, ratio of cash conversion.
33
The results indicated that account current ratio (B=0.690, Sig.=0.032), average Payment
Period (in Days) (B=0.038, Sig.=0.016), inventory turnover period(B=-0.003,
Sig.=0.020) and cash conversion period (B=0.465, Sig.=0.025) had a statistically
significant influence on the financial performance of manufacturing companies.
Evaluating whether management of working capital has a relationship on financial
performance of manufacturing companies in Kenya. A Pearson coefficient of 17.700 and
p-value of 0.007 shows a strong, significant, positive dependence between management
of working capital and the financial performance of Kenyan companies. Therefore,
centering on these results the research fails to acknowledge the existence of a null
hypothesis and that there is no connection between working capital management and
financial performance of companies in Kenya and accepts the alternative theory that there
exists an association between working capital management and the financial performance
of Kenyan companies.
5.3 Conclusions
The research scrutinized the relationship between management of working capital and
financial performance of manufacturing firms in Kenya. Information was analyzed
utilizing both descriptive and inferential statistics for the period of 2011 to 2015. Current
ratio, Average payment period, cash conversion cycle shows significant positive
influence on Return to Equities. Inventory turnover has negative statistical relationship
with Return on Equities. This shows that decisions made on how to manage current assets
and liabilities will affect financial performance of manufacturing firms in Kenya.
34
5.3 Policy Recommendations
The research advocates that companies ought to involve a good relationship with those
companies which offer periods of long credit and clients with period of short payment.
The study also advocates that there be an appropriate system of managing inventory to
prevent overstocking of inventory which could result in efficient outcome in
manufacturing firms. All of the above will truncate the cycle of exchanging cash, which
will result to improved profitability. The study also recommends that manufacturing
firms should administrate their working capital competently for them to acquire
maximum profitability.
5.4 Limitations of the Study
The main objective of the research was to determine the influence of the management of
working capital and financial performance of manufacturing companies in Kenya, due to
this most companies considered some of the information too sensitive and confidential
and thus were not convinced that the research was just for academic purposes only and
may not be used for other purposes.
The findings of the study may be used as a reference to manufacturing companies in
developing countries since they face almost the same challenges due to prevailing
economic situations as opposed to challenges faced in developed countries. Because
working capital keeps on changing from one period to another as per prevailing economic
situations, the findings may not truly reflect the influence of the management of working
capital and financial performance for the period under review. Firms should file their
financial returns annually to the registrar of companies, where those who need such
statements can easily access them. Another major limitation was that the study found
35
financial statements for years 1997 – 2001 from the registrar of companies, due to
changes in economic circumstances; the study didn’t use such information.
5.5 Suggestion for Further Studies
There is need to carry out studies on the management of working capital and financial
performance of manufacturing companies but incorporate more financial variables such
as Return on Assets, cash to current assets and also consider economic situations in the
country. Further studies should also be carried for a longer time period, as this will help
in detecting developments or changes in characteristics of the population and sequence of
events. In addition, both private and public companies should be obliged legally to
provide information especially that required for academic purposes as this will give more
evidence to policy makers to make necessary commendations.
36
REFERENCES
Afza, T., &Nazir, M. S. (2007).Working Capital Approaches and Firm’s
Returns. Pakistan Journal of Commerce and Social Sciences, 1(1), 25-36.
Afza, T., &Nazir, M. S. (2009). Impact of Aggressive Working Capital Management
Policy on Firms’ Profitability. The IUP Journal of Applied Finance, 15(8),
20-30.
Alipour, M. (2011). Working Capital Management and Corporate Profitability: Evidence
from Iran. World Applied Sciences Journal, 12 (7), 1093-1099.
Alvarez, S.A. &Busenitzs, L.W. (2001).Resource-Based theory. Journal of Management,
2(6) 755-775.
Basu, A., Lal, R., Srinivasan, V. &Staelin, R. (1985). Sales force compensation plans: An
Agency Theoretic Perspective. Marketing Science, 4, 267-291.
Bieniasz, A. &Golas, Z. (2011). The Influence of Working Capital Management on the
Food Industry Enterprises Profitability. Contemporary Economics, 5(4),
68-81.
Brigham, E.F. & Houston, J.F. (2007).Essentials of Financial Management, (4th ed.),
Singapore, Thompson Publishers.
Deloof, M. (2003). Does Working Capital Management Affect Profitability of Belgian
Firms? Journal of Business Finance & Accounting, 30(3&4), 573-5 87.
Eljelly, A. 2004. “Liquidity-Profitability Tradeoff: An empirical Investigation in An
Emerging Market”, International Journal of Commerce & Management, 14(2),
48 - 61.
Filbeck, G., & Krueger, T. M. (2005). An analysis of working capital management results
across industries. Mid-American Journal of Business, 20(2), 10-17.
37
Howorth, C., & Westhead, P. (2003). The focus of working capital management in UK
small firms. Management Accounting Research 14, 94-111.
Lamberson, M. (1995). Changes in working capital of small firms in relation to changes
in economic activity. Mid-American Journal of Business, 10(2).
Lazaridis, I., &Tryfonidis, D. (2006). Relationship between Working Capital
Management and Profitability of Listed Companies in the Athens Stock
Exchange. Journal of Financial Management and Analysis, 19(1), 26-35.
Lyroudi, K., &Lazaridis, Y. (2000). The Cash Conversion Cycle and Liquidity Analysis
of the Food Industry in Greece [Electronic Version]. EFMA 2000 Athens, from
http://ssm.com/paper=23 6175
Moyer, R. C., Mcguigan, J. R., & Kretlow, W. J. (2003). Contemporary Financial
Management (Ninth ed.). United States of America: Thomson.
Maclnnis, D. J. (2011).A Framework for Conceptual Contributions in Marketing. Journal
of Marketing, 75(4),136-154.
Mitnick, B. (1986). The Theory of Agency and Organizational Analysis. Unpublished
working paper, Universityof Pittsburgh, U.K.
Moles, P., Parriso, R. & Kidwell, D. (2011).Corporate finance (European ed.), John
Wiley and Sons.
Prasana, C. (2000). Financial management. Mc Graw Publishing Company. European
Journal of Business and Management www.iiste.orgISSN 2222-1905 (Paper) SSN
222-2839 (Online)Vol.7, No.2, 201518
Raheman, A. & Nasr, M. (2007). Working capital management and profitability -case of
Pakistani firms. International Review of Business Research Papers, 3 (1),279-
300.
38
Richards, V.D. &Laughhin, E.J. (1980).A cash conversion cycle approach to liquidity
analysis. Financial management, 9 (1), 32-38.
Richards, A. B., Stewart, C. M.,& Franklin, A.(2008). Principles of Corporate
Finance.(9th ed.), New York, Wiley and sons.
Ross, S.A. (1973). The Economic Theory of Agency: The principal`s Problem. American
Economic Review, 63,134-139.
Sathyamoorthi, C.R. & Wally-Dima, L.B. (2008). Working capital management: The
case of listed Domestic companies in Botswana. Journal of management
research, 7(5), 7-24.
Schwartz, R.A. (1974). An Economic model of trade credit. Journal of financial and
quantitative analysis, 9(4), 643-654.
Sekaran, U. & Bougie, R. (2009). Research methods for Business: A skill building
approach, (5th, ed.), London, John Wiley and sons, UK.
Shin, H. H. & Soenen, L. (1998). Efficiency of working capital management and
corporate profitability. Financial practice and education, 8(2), 37-45.
Simon, H. (1976). Administrative Behaviour (3rd ed.). New York. The freeman press.
Smith (1980).Profitability Versus Liquidity Trade-offs in Working Capital Management,
In readings on The Management of Working Capital. West Publishing Company,
St.Paul, New York.
Solow, R.M. (1985). Economic History and Economics. The American Economic
Review, 75,328-331.
Spence, A.M. &Zeckhauser, R. (1971).Insurance, information and individual
action. American Economic review, 61, 380-387.
39
Tiegen, H.K. &Brun, W. (1997).Anticipating the future: Appraising risk and
uncertainty. Routledge Dress, New York. U.S.A.
Williams, A. &Heins, R. (1964).Risk management and Insurance, (2nd ed.). New York,
Mc GrawHill, U.S.A.
Williamson, O.E. (1984). Corporate governance. Yale Law Review, 93, 1197
40
APPENDIX 1: Data collection Form
YEAR
Current
Assets
Current
Liabilities
Profit
After
Tax
Total
Liabilities
Total
Assets
Average
Accounts
Receivable
Net
Credit
Sales
Average
Accounts
Payable
Net Credit
Purchases
Average
Inventory
Cost
of
sales
Sharehold
ers Funds
2011
2012
2013
2014
2015
41
APPENDIX 2: Manufacturing Firms in Kenya
1 42 Geomatic Services Ltd 30 Bobmil Industries Ltd
2 A.Baumann co. Ltd 31 Bogani Industries Ltd
3 Abu Engineering Ltd 32 Bosky Industries Ltd
4 Acme Container Ltd 33 British American Tobacco Ltd
5 Adhesive Solutions Africa Ltd 34 B.O.C Kenya Ltd
6 African Kaluworks (Aluware)Division 35 Carbacid Investiments Ltd
7 Africa Cotton Industries 36 C. Dormans Ltd
8 Africa Oil Kenya B.V 37 Chandaria Industries Ltd
9 Agni Enterprises Ltd 38 Chemplus Holdings Ltd
10 Ali Glaziers Ltd 39 Chevron Kenya Ltd
11 Alpha Dairy Products Ltd 40 Chloride Exide Kenya Ltd
12 Alpha Fine Foods 41 Climacento Green Tech Ltd
13 Apex Steel Ltd 42 Colgate Palmolive (East Africa) Ltd
14 AquaSan Tec 43 Collis F B
15 Aquva Agencies Ltd 44 Commercial Motor Spares Ltd
16 Arrow Rubber Stamp Company Ltd 45 Cosmos Ltd
17 Artech Agencies (KSM)Ltd 46 Creative Fabric World Co Ltd
18 Ashut Quality Products 47 Creative Innovations Ltd
19 ASL ltd 48 Crown Berger (K) Ltd
20 Athiriver Mining Ltd 49 Cuma Refrigeration EA Ltd
21 Atlas Copco Eastern Africa Ltd 50 Doshi Group of Companies
22 Bamburi Special Products Ltd 51 East Africa Glassware Mart Ltd
23 Beta Health Care 52 East Africa Breweries Ltd
24 BIDCO Oil Refineries Limited 53 East Africa Cables Ltd
25 Bilco Engineering 54 East African Portland Cement
26 Biodeal laboratories Ltd 55 Eastern Chemical Industries Ltd
27 Blowplast Limited 56 Eco Consult Ltd
28 Blue Ring Products Ltd 57 Ecolab East Africa (K) Ltd
29 Blue Triangle Cement 58 Ecotech Ltd
42
59 Energy Pak (K) Ltd 88 Kenya Power and Lighting Company Ltd
60 Energy Regulatory Commission 89 Kenya Solar
61 Equatorial Tea LTD 90 Kiesta Industries Technical Services Ltd
62 Eveready East Africa Ltd 91 Kim Fay E.A Limited
63 Excel Chemical Ltd 92 King Source Plastic Machinery Co. Ltd
64 Fairdeal UPvc, Aluminium and Glass Industries 93 Lake Turkana Wind Power Ltd
65 Famiar Generating Systems Ltd 94 Magadi Soda
66 Farmers Choice Ltd 95 Makiga Engineering Services Ltd
67 Flame Tree Group Holding Ltd 96 Manzil Glass & Hardware Ltd
68 Flexoworld Ltd 97 Mather & Platt Kenya Ltd
69 Foam Mattress Ltd 98 Maweni Limestone Ltd
70 Forbes Media Electronic Advertising Solutions 99 Mellech Engineering Construction Ltd
71 Furmat Furnishers 100 Metal Crown Ltd
72 Gahir Engineering Works 101 Metsec Ltd
73 Goldrock International Enterprises 102 MGS International (K) LTD
74 Goods Chemistry Practise &Allied Cert. Corp
Ltd 103 Microsoft East Africa
75 Guan Candle Making Machine Co. Ltd 104 Mjengo LTD
76 Heluk International Ltd 105 Mohajan Trade International
77 Hills Converters (K) Ltd 106 Mombasa Canvas Ltd
78 Hydraulic Hose & Pipe Manufacturers Ltd 107 Mumias Sugar Co. Ltd
79 Imani Workshops 108 Ndugu Transport Company Ltd
80 JET Chemicals (K) Ltd 109 New Ruaraka Hardwares
81 Kapa Oil Refeneries Ltd 110 New World Stainless Steel Ltd
82 Kenbro Industries 111 Njoro Canning Factory
83 Kenya Electricity Generating Company Ltd 112 Octagon Express(Kenya) Ltd
84 Kenya Fluorspar Company Ltd 113 Orbit Chemical Industries Ltd
85 Kenya Grand Vehicle Industries 114 Orpower 4 , Inc
86 Kenya Orchards Ltd 115 Packaging Industries Ltd
87 Kenya Petroleum Refineries Ltd 116 Patco Industries Ltd
43
117 Pelican Signs Ltd 148 Simco Auto Parts Ltd
118 Petmix Feed 149 Slumberland Kenya Ltd
119 Platinum Packaging Ltd 150 Solarworks East Africa
120 Polythene Industries Ltd 151 Stainless Steel Products Ltd
121 Print Fast Kenya Ltd 152 Stamet Products (K) Ltd
122 Protec 153 Statpack Industries Ltd
123 Protocols Microcomputer Applications 154 Steel Structures Ltd
124 Pudlo Cement Company 155 Sudi Chemical Industries
125 Pwani Oil Products 156 Sunrays Solar Ltd
126 PZ Cussions EAST Africa Ltd 157 Superfit Steelcon Ltd
127 Quad Cypher sytems 158 Tamoil Africa Holdings Ltd
128 Raghad Enterprises 159 TARPO Industries Ltd
129 Ramco printing works 160 Tenacity Locks Ltd
130 Redsea chemist 161 The Kensta Group
131 Reesi Hospitality Ventures
162
Tianjin Haopu Chemical
Company 132 Reliable Concrete Works Ltd
133 Renscope Scientific Kenya 163 Top Tank
134 Rhino Special Products Ltd 164 Tripac Chemical Industriers
135 Rock Plant Kenya Ltd 165 Unga Farm Care (E.A)Ltd
136 ROM East Africa Ltd 166 Unga Group Ltd
137 Rosewood Office Systems Ltd 167 Unighir Ltd
138 Rotam Sub-Saharan Africa 168 Unilever Kenya Ltd
139 Rupa Cotton Mills Epz Ltd 169 Universal Ponds Kenya Ltd
140 Rural Elecrification Authority 170 Warren Concrete Ltd
141 Sameer Group 171 Wartisila eastern Africa Ltd
142 Sanpac Africa Ltd 172 Welfast Kenya Ltd
143 Shade Systems(E.A) Ltd 173 Welrods Ltd
144 Shadetents And Exquisite Designs 174 Wigglesworth Exporters Ltd
145 Shamas Motor Spares 175 Williamson Power Ltd
146 Shankan Engterprises Ltd 176 Wines of the World Ltd
147 Sigma Engineering Company Ltd 177 Zena net Services
44
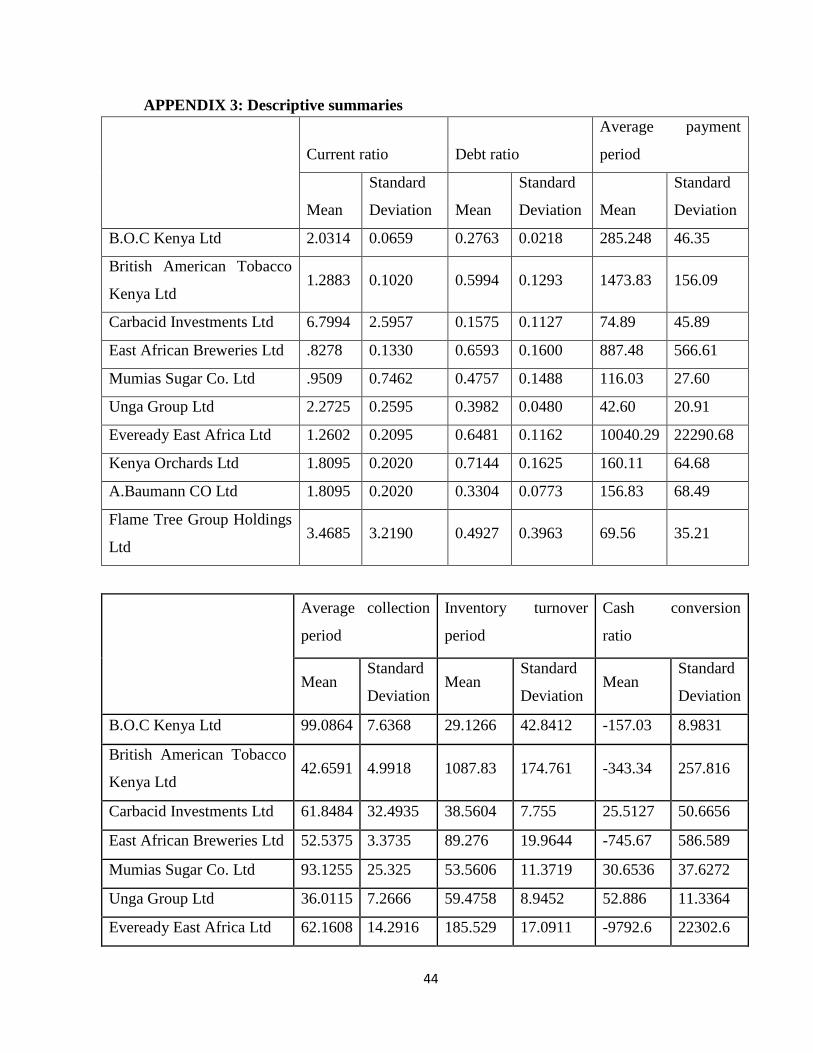
APPENDIX 3: Descriptive summaries
Current ratio Debt ratio
Average payment
period
Mean
Standard
Deviation Mean
Standard
Deviation Mean
Standard
Deviation
B.O.C Kenya Ltd 2.0314 0.0659 0.2763 0.0218 285.248 46.35
British American Tobacco
Kenya Ltd 1.2883 0.1020 0.5994 0.1293 1473.83 156.09
Carbacid Investments Ltd 6.7994 2.5957 0.1575 0.1127 74.89 45.89
East African Breweries Ltd .8278 0.1330 0.6593 0.1600 887.48 566.61
Mumias Sugar Co. Ltd .9509 0.7462 0.4757 0.1488 116.03 27.60
Unga Group Ltd 2.2725 0.2595 0.3982 0.0480 42.60 20.91
Eveready East Africa Ltd 1.2602 0.2095 0.6481 0.1162 10040.29 22290.68
Kenya Orchards Ltd 1.8095 0.2020 0.7144 0.1625 160.11 64.68
A.Baumann CO Ltd 1.8095 0.2020 0.3304 0.0773 156.83 68.49
Flame Tree Group Holdings
Ltd 3.4685 3.2190 0.4927 0.3963 69.56 35.21
Average collection
period
Inventory turnover
period
Cash conversion
ratio
Mean Standard
Deviation Mean
Standard
Deviation Mean
Standard
Deviation
B.O.C Kenya Ltd 99.0864 7.6368 29.1266 42.8412 -157.03 8.9831
British American Tobacco
Kenya Ltd 42.6591 4.9918 1087.83 174.761 -343.34 257.816
Carbacid Investments Ltd 61.8484 32.4935 38.5604 7.755 25.5127 50.6656
East African Breweries Ltd 52.5375 3.3735 89.276 19.9644 -745.67 586.589
Mumias Sugar Co. Ltd 93.1255 25.325 53.5606 11.3719 30.6536 37.6272
Unga Group Ltd 36.0115 7.2666 59.4758 8.9452 52.886 11.3364
Eveready East Africa Ltd 62.1608 14.2916 185.529 17.0911 -9792.6 22302.6
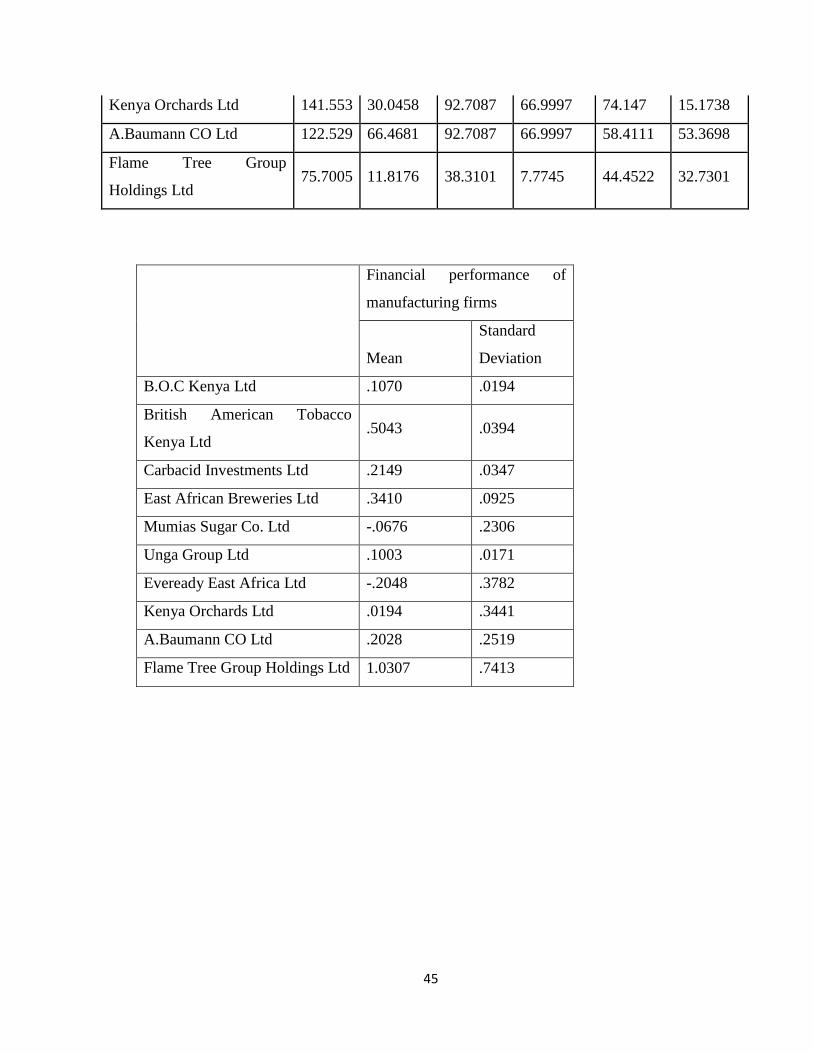
45
Kenya Orchards Ltd 141.553 30.0458 92.7087 66.9997 74.147 15.1738
A.Baumann CO Ltd 122.529 66.4681 92.7087 66.9997 58.4111 53.3698
Flame Tree Group
Holdings Ltd 75.7005 11.8176 38.3101 7.7745 44.4522 32.7301
Financial performance of
manufacturing firms
Mean
Standard
Deviation
B.O.C Kenya Ltd .1070 .0194
British American Tobacco
Kenya Ltd .5043 .0394
Carbacid Investments Ltd .2149 .0347
East African Breweries Ltd .3410 .0925
Mumias Sugar Co. Ltd -.0676 .2306
Unga Group Ltd .1003 .0171
Eveready East Africa Ltd -.2048 .3782
Kenya Orchards Ltd .0194 .3441
A.Baumann CO Ltd .2028 .2519
Flame Tree Group Holdings Ltd 1.0307 .7413