RELATIONSHIP BETWEEN WORKING CAPITAL MANAGEMENT …
66
RELATIONSHIP BETWEEN WORKING CAPITAL MANAGEMENT AND FINANCIAL RETURNS OF SEVENTH-DAY ADVENTIST ORGANIZATIONS IN EAST AFRICAN UNION. BY ONDURU REHEMA AKINYI A RESEARCH PROJECT SUBMITTED IN PARTIAL FULFILLMENT FOR THE REQUIREMENTS FOR THE DEGREE OF MASTER OF BUSINESS ADMINISTRATION SCHOOL OF BUSINESS AND ECONOMICS MASENO UNIVERSITY © 2017
Transcript of RELATIONSHIP BETWEEN WORKING CAPITAL MANAGEMENT …
RELATIONSHIP BETWEEN WORKING CAPITAL MANAGEMENT AND
FINANCIAL RETURNS OF SEVENTH-DAY ADVENTIST ORGANIZATIONS IN
EAST AFRICAN UNION.
BY
ONDURU REHEMA AKINYI
A RESEARCH PROJECT SUBMITTED IN PARTIAL FULFILLMENT FOR THE
REQUIREMENTS FOR THE DEGREE OF MASTER OF BUSINESS
ADMINISTRATION
SCHOOL OF BUSINESS AND ECONOMICS
MASENO UNIVERSITY
© 2017
ii
DECLARATION
I hereby declare that this project is my original work and has not been presented in any
institution for a ward of degree. The work form part of fulfillment of the requirement for the
award of a Master of Business Administration Degree of Maseno University.
Signature……………………………..
ONDURU REHEMA AKINYI
MBA/BE/00184/2014
This Project has been submitted for examination with my approval as the University
Supervisor.
Signature………………………….. Date………………………………..
DR. BENJAMIN OMBOK
Department of Accounting and Finance
Maseno University.

iii
ACKNOWLEDGEMENT
I thank my heavenly Father for the gift of life.
Special thanks to my supervisor Dr. Benjamin Ombok for his sacrifices and tireless efforts in
guiding and giving me valuable suggestions that enriched my Project. I am also grateful to
Dr. David Oima and Dr. Ondoro for their continuous support and input in this project.
I express my gratitude to the East African Union of Seventh-Day Adventist Church
that financially supported my studies.
My special thanks also go to all Business Managers/Treasurers of the ten (18) institutions for
their help in obtaining data.
I also give my profound gratitude to my colleagues at East African Union treasury
department for their support and to all those who contributed in so many ways to the success
of this work.
MAY GOD RICHLY BLESS YOU ALL

iv
DEDICATION
This thesis is lovingly dedicated to my beloved parents, my sisters Sabina, Darline and
brother Hanningtone, without whose prayers, support, and encouragement this work could
not have been completed.
v
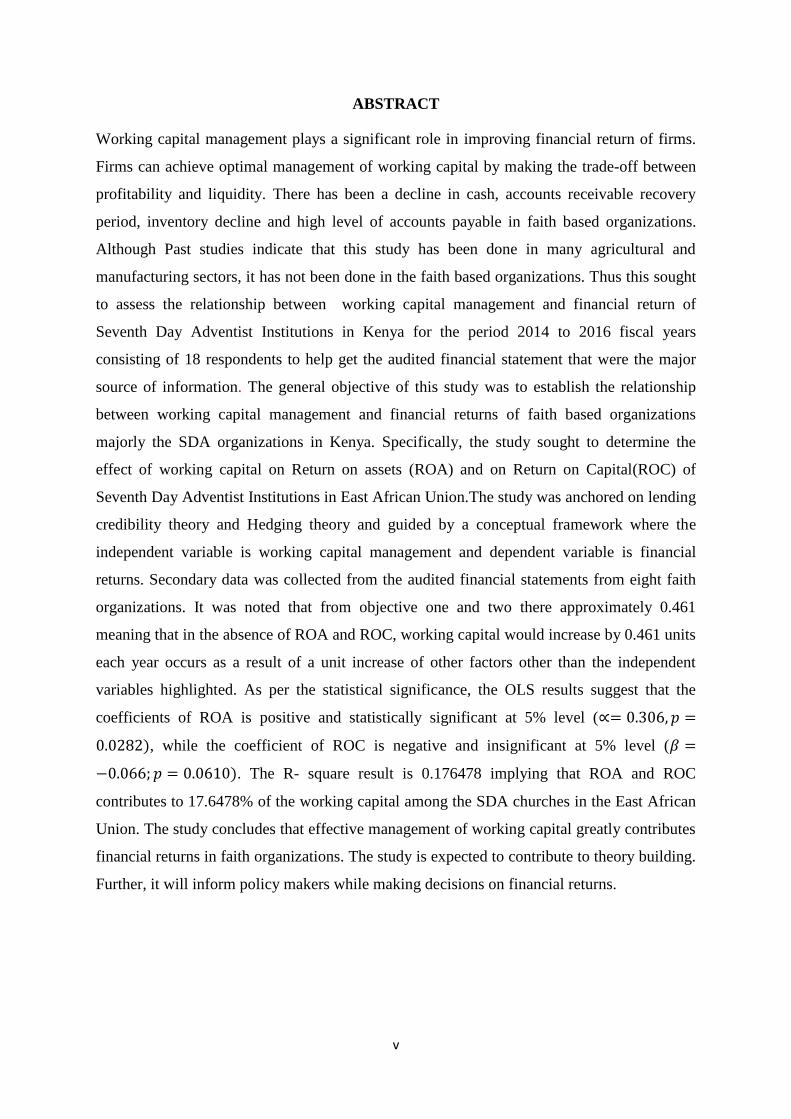
ABSTRACT
Working capital management plays a significant role in improving financial return of firms.
Firms can achieve optimal management of working capital by making the trade-off between
profitability and liquidity. There has been a decline in cash, accounts receivable recovery
period, inventory decline and high level of accounts payable in faith based organizations.
Although Past studies indicate that this study has been done in many agricultural and
manufacturing sectors, it has not been done in the faith based organizations. Thus this sought
to assess the relationship between working capital management and financial return of
Seventh Day Adventist Institutions in Kenya for the period 2014 to 2016 fiscal years
consisting of 18 respondents to help get the audited financial statement that were the major
source of information. The general objective of this study was to establish the relationship
between working capital management and financial returns of faith based organizations
majorly the SDA organizations in Kenya. Specifically, the study sought to determine the
effect of working capital on Return on assets (ROA) and on Return on Capital(ROC) of
Seventh Day Adventist Institutions in East African Union.The study was anchored on lending
credibility theory and Hedging theory and guided by a conceptual framework where the
independent variable is working capital management and dependent variable is financial
returns. Secondary data was collected from the audited financial statements from eight faith
organizations. It was noted that from objective one and two there approximately 0.461
meaning that in the absence of ROA and ROC, working capital would increase by 0.461 units
each year occurs as a result of a unit increase of other factors other than the independent
variables highlighted. As per the statistical significance, the OLS results suggest that the
coefficients of ROA is positive and statistically significant at 5% level (∝= 0.306, 𝑝 =
0.0282), while the coefficient of ROC is negative and insignificant at 5% level (𝛽 =
−0.066; 𝑝 = 0.0610). The R- square result is 0.176478 implying that ROA and ROC
contributes to 17.6478% of the working capital among the SDA churches in the East African
Union. The study concludes that effective management of working capital greatly contributes
financial returns in faith organizations. The study is expected to contribute to theory building.
Further, it will inform policy makers while making decisions on financial returns.
vi
Table of Contents
DECLARATION ................................................................................................................ ii
ACKNOWLEDGEMENT ................................................................................................. iii
DEDICATION ................................................................................................................... iv
ABSTRACT ........................................................................................................................ v
LIST OF TABLES ........................................................................................................... viii
LIST OF ACRONYMS AND ABBREVIATIONS .......................................................... ix
OPERATIONAL DEFINITION OF TERMS .................................................................... x
LIST OF FIGURES ........................................................................................................... xi
CHAPTER ONE ............................................................................................................. 12
INTRODUCTION........................................................................................................... 12
1.1 Background Information ......................................................................................... 12
1.2 Statement of the Problem ........................................................................................ 19
1.3 Objectives of the Study ........................................................................................... 20
1.4 Hypothesis ............................................................................................................... 20
1.5 Significance of the Study ........................................................................................ 20
1.6 Justification of the Study ........................................................................................ 21
1.7 Conceptual Frame work .......................................................................................... 21
1.8 Scope of the Study................................................................................................... 22
CHAPTER TWO ............................................................................................................ 24
LITERATURE REVIEW .............................................................................................. 24
2.1 Theoretical Review ................................................................................................. 24
2.1.1 The Lending Credibility Theory ................................................................................... 24
2.1.2 Hedging Theory ............................................................................................................ 26
2.2 Empirical Review .................................................................................................... 26
CHAPTER THREE ........................................................................................................ 44
RESEARCH METHODOLOGY .................................................................................. 44
3.1 Research Design ...................................................................................................... 44
3.2 Study Area ............................................................................................................... 44
3.3 Population of the Study ........................................................................................... 44
vii
3.4 Sample and Sampling Technique ............................................................................ 46
3.5 Data Collection Techniques .................................................................................... 46
3.5.1 Sources of Data ............................................................................................................. 46
3.5.2 Data Collection Procedure ............................................................................................ 46
3.5.3 Research Instrument ...................................................................................................... 46
3.6 Data Analysis model ............................................................................................... 47
3.6.1 Diagnostics of Regression Model ................................................................................. 47
3.6.1.1 Multi collinearity test ................................................................................................. 47
3.6.1.2 Serial correlation test ................................................................................................. 48
3.6.1.3 Homoscedasticity Test ............................................................................................... 48
CHAPTER FOUR ........................................................................................................... 50
RESULTS AND DISCUSSION ..................................................................................... 50
Table 4.1 Descriptive statistics...................................................................................... 50
Table 4.2 Correlation..................................................................................................... 51
Table 4.3 Unrestricted Co-integration Rank Test (Trace) and Maximum eigenvalue .. 52
Table 4.4 Ordinary least square table ............................................................................ 53
CHAPTER FIVE ............................................................................................................ 56
SUMMARY, CONCLUSIONS AND RECOMMENDATIONS ................................ 56
5.1 Summary of Findings .............................................................................................. 56
5.2 Conclusions of the study ......................................................................................... 56
5.3 Recommendations of the Study .............................................................................. 56
5.4 Limitations of the Study .......................................................................................... 56
5.5 Suggestions for Further Research ........................................................................... 57
REFERENCES ................................................................................................................ 58
APPENDICES ................................................................................................................. 62
APPENDIX I: INTRODUCTORY LETTER ................................................................... 62
APPENDIX II: LIST OF THE SDA INSTITUTIONS .................................................... 64
APPENDIX III: RAW DATA .......................................................................................... 65

viii
LIST OF TABLES
Table 3.6.1.1 Multi collinearity test……………………………………………………………45
Table 3.6.1.2 Serial correlation test……………………………………………………………46
Table 3.6.1.3 Homoscedasticity Test…………………………………………………………..47

ix
LIST OF ACRONYMS AND ABBREVIATIONS
WKUC: West Kenya Union Conference
SDA : Seventh Day Adventist
WCM : Working Capital Management
EKUC : East Kenya Union.
EAU : East African Union
x
OPERATIONAL DEFINITION OF TERMS
Main concepts are defined according to how they are used in the study and they are as
follows;
Cash conversion cycle is the net number of days from the outlay of cash for raw materials to
receiving payment from the customer.
Cash management identify the cash balance which allows for the business to meet day to
day expenses, but reduces cash holding costs.
Inventory management identify the level of inventory which allows for uninterrupted
production but reduces the investment in raw materials and minimises reordering costs and
increases cash flow.
Receivables management identify the appropriate credit policy which will attract customers
such that any impact on cash flow and the cash conversion cycle will be offset by increased
revenue and hence return on capital
Financial Return– Is impliedly defined the amount of suplus or deficit in a firm
Working capital management involves managing the relationship between a firm’s short-
term assets and its short-term liabilities.

xi
LIST OF FIGURES
Figure 1.1 Conceptual Framework……………………………………………………17
Figure 1.2 Working Capital Cycle…………………………………………………….25

12
CHAPTER ONE
INTRODUCTION
1.1 Background Information
According to Modiglian and Pogue (1973), financial return is an outcome measurable in
financial terms as the product of an investment. Levisaukaite (2010), however define
financial return as a product of investment and risk management in a productive framework.
Kuhlemeyer (2004) explains Return as the total gain or loss experienced on an investment
over a given period of time; which is commonly measured by cash distributions during the
period plus the change in value expressed as percentage of the beginning of period
investment value. According to Banz (1981), Financial Return refers to collection of final
results generated from investment activity and process over a period of time. Therefore
financial return can be impliedly defined as the rate of return on investment. If it will not be
unjustifiable over investment in current assets then this would negatively affect the rate of
return on investment. Damadoran (2007), states that financial return is an outcome of
application of resources on a recurrent manner on long term investments; with such measures
as Return on Capital (ROC), Return on Invested capital (ROIC) and Return on Equity (ROI)
European Central Bank (2010), while recognizing return on Equity (ROE) as a measure of
returns or performance identifies other such measures as Return on Assets (ROA), Cost to-
Income Ratio, Economic Value Added (EVA), Net interest margin and ROCE among others.
Vananzi (2012), while examining Financial performance and value criteria identifies such
value based measures as Economic Value Added (EVA), Cash flow return on Investment
(CFROI), shareholders value added (SVA), Economic Margin (EM) and cash flow value
added (CVA).Romania (2007 and 2008), States that the most common measures or indicators
of financial returns or the ratios of return are considered among the most important indicators
used by the management of a business. Whatever the form of expression (return on assets,
return on equity, return on sales), they are found among the set of indicators published by
most companies. This reveals return are Return on Capital (ROC), Return on Invested capital
(ROIC) and Return on Equity (ROE) as the common and most usable measures of financial
returns.
The main components of working capital are inventories, accounts payables, and payments to
be received from customers after sales. Success of a business depends heavily on the ability
of the managers to effectively manage receivables, inventories and payables (Filbeck and
13
Krueger, 2005). Working capital needs for a firm dictates its liquidity and profitability, and
consequently affect its financing and investing decisions.
Working capital management refers to the administration of all aspects of current assets,
namely cash, inventories, marketable securities and debtors, and current liabilities. In general,
working capital management is a simple and straight forward concept of ensuring the ability
of a firm to fund the difference between short term assets and short term liabilities (Harris,
2005). Working capital is the most crucial factor for maintaining liquidity, survival, solvency and
profitability of a business (Mukhopadhyay, 2004). Every organization requires a necessary
amount of working capital regardless of its size or nature of business. Working capital
management plays a key role in making comparisons between liquidity and profitability among
firms (Eljely, 2004), providing a basis for financing decisions and composition of current assets.
Working capital management enables companies to achieve optimal balance between working
capital components (Gill, 2011). Efficient management of working capital is fundamental to
organizations as it plays a crucial role in creating shareholders’ value (Nazir and Afza, 2008).
Most organizations therefore aim to establish an optimal level of working capital that enhances
their value (Deloof, 2003).
According to Bialy and Elliott (2013), Financial Return plays significant sustainability roles
in firm operations, in such a way that it determines credit provision, liquidity provision and
risk management services so as to provide a framework for growth and investment capacity
development of an organisation. Deloof (2003), states that if the return on capital works as
advertised, it should give us a measure of the return earned on the capital invested on all of
the projects that the firm has on its books i.e. its assets in place. This can then be compared to
the firm’s cost of capital to conclude whether the firm has collectively invested in good
projects. In practice, it is instructive to consider when return on capital is most likely to
succeed at its mission: the operating income in the most recent year should be a good proxy
of the typical operating earnings on existing investments and the book value should, in fact,
capture the capital invested in these investments. Thus, operating income, as a pre-debt
measure of earnings, is used in the computation, and it is adjusted for taxes to arrive at an
aftertax return on capital. The profitability and liquidity tradeoff is an important role of
financial return of a firm in helping to enhance the working capital because if working capital
management is not given due considerations then the firms are likely to fail and face
bankruptcy (Kargar & Bluementhal, 1994).
14
The level of working capital and the efficiency in working capital management directly
affects the growth of a firm. High levels of current assets may result in low returns from a
firm’s investment; however, firms with very few current assets stand the risk of incurring
shortages and difficulties in maintaining smooth operations (Horne and wachowicz, 2000).
According to Damadoran (2007), various measures of financial return play specific functional
roles in a firm and this measures are ROC, ROA and ROE which are used to help answer
questions like, how good are the firm’s existing investments, what do we expect the excess
returns to look like on future investments sustainable growth rate and lastly how measuring
Investment Returns valuation and corporate finance comes from accounting statements.
Romania (2007and 2008) on the other side states this roles and importance as follows, the
return on capital or invested capital in a business attempts and helps to measure the return
earned on capital invested in an investment, the return on capital measures return generated
on all capital, debt as well as equity, invested in an asset or assets. Consequently, it has to
consider earnings and lastly return on equity which helps a firm to relate the earnings left
over for equity investors after the debt service cost is considered.
The ultimate objective of any firm is to have positive financial return, but, preserving
liquidity of the firm is an important objective too. The problem is that increasing in financial
return at the cost of liquidity can bring serious problems to the firm. Therefore, there must be
a tradeoff between these two objectives of the firms. One objective should not be at cost of
the other because both have their importance (Arnold, 2008). We cannot survive for a longer
period if returns are less. On the other hand, if we do not care about liquidity, we may face
the problem of insolvency or bankruptcy. For these reasons working capital management
should be given proper consideration and will ultimately affect the financial return of the
firm.
Working capital is a financial metric which represents operating liquidity available to a
business. According to Bacani, 2005, it is considered a part of operating capital and is
calculated as current assets minus current liabilities. If the current assets are less than the
current liabilities, an entity has a working capital deficiency, also called a working capital
deficit. Positive working capital is required to ensure that a firm is able to continue its
operations and that it has sufficient funds to satisfy both maturing short-term debt and
upcoming operational expenses. The management of working capital involves managing
inventories, accounts receivable and accounts payable and cash (Bacani, 2005).
15
Every business requires working capital for its survival. Working capital is a vital part of
business investment which is essential for continuous business operations. It is required by a
firm to maintain its liquidity, solvency and profitability (Arnold, 2008). The importance of
managing working capital of a business efficiently cannot be denied. Working Capital
management explicitly impacts both the profitability and level of desired liquidity of a
business (Dong, 2010). If a firm will invest heavily in working capital i.e. more than its
needs, then the profits which can be generated by investing these resources in fixed or long
term assets will be diminished. Moreover the firm will have to endure the cost of storing
inventory for longer periods as well as the cost of handling excessive inventory (Arnold,
2008).On the other hand, if a firm will invest heavily in fixed assets to generate profits by
neglecting its short-term capital needs then it is quite possible that it may have to face
bankruptcy because of insufficient funds. The return as well as adequate level of liquidity is
required to be maintained for the survival of a business, so if a firm will not pay sufficient
attention to its working capital management, then it is quite possible that the firm would have
to face bankruptcy (Kargar& Blumenthal, 1994).
Working Capital Management is a very sensitive area in the field of financial management
(Harris, 2005). It involves the decision of the amount and composition of current assets and
the financing of these assets. Current assets include all those assets that in the normal course
of business return to the form of cash within a short period of time, ordinarily within a year
and such temporary investment as may be readily converted into cash upon need. The
Working Capital Management of a firm in part affects its financial return. The basic purpose
of managing working capital is controlling of current financial resources of a firm in such a
way that a balance is created between financial return of the firm and risk associated with that
return (Harris, 2005).The goal of working capital management (WCM) is to manage the
firm’s assets and liabilities in such a way that a satisfactory level of working capital is
maintained. This is so because if the firm cannot maintain a satisfactory level of working
capital, it is likely to become insolvent and may even be forced to bankruptcy. The
interaction between current assets and current liabilities is therefore the main theme of the
theory of management of working capital (Dong& Su, 2010).
However, there are a few studies with reference to Kenya on working capital management
and firm profitability, especially in the manufacturing and construction sectors. For example,
Mathuva(2010) focused on the influence of working capital management on corporate
profitability of firms listed at the Nairobi Securities Exchange. Gakure, Cheluget, Onyango
16
and Keraro (2012) on the other hand, analyzed the relationship between working capital
management and performance of 15 manufacturing firms listed at the Nairobi Securities
Exchange for a period of five years from 2006 to 2010. Omesa,
Maniagi, Musiega and Makori (2013) examined the relationships between Working Capital
Management and Corporate Performance of 20 manufacturing firms listed on the Nairobi
securities exchange for 5 years from 2007-2011 was selected. Finally, Nyabwanga, Ojera,
Lumumba, Odondo, & Otieno (2012) assessed the effect of working capital management
practices on the financial performance of SSEs in Kisii South District. Evidence of role of
working capital management and financial return is seen, such organizations like religious
organizations established have in the present past engaged in profit related activities which
would require operational resource. It is therefore imperative that working capital
management be done to test the operation of not only profit oriented but also for nonprofit.
However, these studies provide no evidence on the relationship between working capital
management and financial return of faith based organization Kenya. In this context, the
objective of the current study is to provide empirical evidences about the assessment of
working capital management on financial return for a sample of 18 organizations in the
seventh day sector during the period 2014, 2015 & 2016.
Kargar& Blumenthal 1994) states that that extended accounts receivable results to a declining
return, firms miss out on having that cash available for paying off debts, developing new
products and making other investments. Decrease in working capital results to the difference
between a company's assets and liabilities frees up cash, thereby making it easier for
companies to respond to market changes as early as possible as possible because working
capital management and financial return will increasingly not be realizable.. Beneda, Zhang
(2008), on a study impact of working capital management on the operating performance and
growth of new public companies, established that even though it dealt with relationship of
working capital and financial returns using a sample of initial public offerings (IPO’s), it
singled out positive association between higher levels of accounts receivables and operating
performance. It study further states that maintaining control (i.e. lower accounts) over levels
of cash and securities, inventory, fixed assets and accounts payables has a positive
relationship with operating performance of a firm. Lazaridis & Tryfonidis (2004), conducted
a cross sectional study by using a sample of 131 firms listed on Athens Stock Exchange for a
period of four years ( 2001-2004) and found statistically significant relationship between
profitability, measured through gross operating profit and the cash conversion cycle and its
components (accounts receivables, accounts payable and inventory). Based on the results of
17
the analysis of annual data by using correlation and regression tests, they suggest that
managers can create profits for their companies by correctly handling the cash conversion
cycle and by keeping each component of the conversion cycle (accounts receivables,
accounts payable and inventory) at an optimal level (Chion and Chen, 2006)
It is important to note that the Seventh-day Adventist Church world-wide has a working
capital policy document which guides its financial operations (SDA Working Policy, 2010).
In Seventh-day Adventist institutions in East Central Africa, working capital management is
the responsibility of the business manager/treasurer. Proper management of working capital
components allows institutions to reduce holdings of current assets such as inventory and
accounts receivable which earns no interest income and require financing with short term-
debt. The resulting cash-inflow can be reinvested in interest- bearing financial instruments or
used to reduce short-term borrowing, thus improving the sustainability of the organization.
Investigating the determinants of WCM in an organisational setting provides valuable
information that can be used in formulating an effective WCM strategy.
This study will focus on Seventh - day Adventist institutions within the East African Union
(EAU) territory. EAU is the administrative arm of the Seventh-Day Adventist Church in
Kenya. It is comprised of 18 administrative units (fields & conferences) in various regions of
the country. WKU also has 8 business entities under its jurisdiction. The fields and
conferences are; Greater Rift Valley Conference, Central Nyanza Field, Kenya Lake
Conference, Ranen Conference, North West Kenya Conference. The business entities are
comprised of, Kendu Adventist Hospital, Kamagambo Adventist College, and Africa Herald
Publishing House. Although working capital management plays a vital role in maximizing
firm value, unfortunately, there is limited empirical information on the relationship between
working capital management and firm value.
Financial return is therefore a function of investment on resources in a production process in
effect to the working capital management of a manufacturing firms, thus Return on
investment (ROI) is a measure that investigates the amount of additional profits produced due
to a certain investment enabling the capacity of the working capital, Businesses use this
calculation to compare different scenarios for investments to see which would produce the
greatest profit and benefit for the company working capital management (Damadoran, 2007).
Vananzi (2012) confirms that there are many reasons for exploring ROI and its influence
towards the working capital. These reasons relate not only to how an organization is
18
perceived by others but what it knows about itself. This kind of self-examination encourages
improvements in processes that keep agricultural businesses profitable and government
organizations effective. Raheman (2010), states that justifying expenditures is an accepted
part of good business practice in the private sector and, increasingly, in the public sector
towards management of working capital, in an era marked by budget tightening, ROI analysis
can answer the question that plagues managers everywhere on working capital management.
ROI analysis provides a self-check on job performance. Working capital management is very
essential and valued in manufacturing sectors because of its role in increasing and
maximizing the firm’s value, however, there is no enough studies used to help to determine
the effect of working capital management on ROI which is a measure of financial return in
non-governmental organizations where faith based organizations fall and working capital is
practiced.
Return on assets (ROA), is one of the all-time favourites and perhaps most widely used
overall measure of corporate financial performance and working capital (Rappaport 1986).
This was confirmed by Monteiro (2006) who stated that ROA is perhaps the most important
ratio an investor should consider to help determine the working capital in a manufacturing
firm. The fact that ROE represents the end result of structured financial ratio analysis, also
called Du Pont analysis (Stowe, 2002). Jordan (2004) contributes towards its popularity
among analysts, financial managers and shareholders alike. ROA can be analyzed further and
broken down into other well-known financial accounting ratios to help show its relation to
working capital. These ratios cover the categories of profitability, asset management and
financial structure. Instead of regarding ROA as the point of departure, one could also view it
as the final result of structured financial ratio analysis Smith (1980). However, working
capital management is very important and avital role in improving the firms performance or
returns of manufacturing and agricultural as mentioned, awkwardly, there in not enough
empirical studies on the effects of ROA as a measure of financial return to the working
capital management of faith based organizations where working capital functions operates.
The importance of return on assets as a measure of the firm performance is recognized in the
specialized literature. Thus, David Lindo believes that "Return on Assets (ROA) is the
general purpose financial ratio used to measure the relationship of profit earned to the
investment in assets required to earn that profit and determine the level of working capital in
affirm today Samiloglu (2008). The ROA percent is a baseline that can be used to measure
the profit contribution required from new investments, As such it identifies the rate of return
19
needed to at least maintain current performance arid can be used to establish a hurdle rates all
new investments must meet for approval and determine its effects to capital. Gitman (2009)
states that the return on capital measures return generated on all capital, debt as well as
equity, invested in an asset or assets, he continues that Consequently, it has to consider
earnings not just to equity investors (which is net income) but also to lenders in the form of
interest invested Capital. Therefore we find that in most financial computations, when given a
choice between market value and book value, we choose to proceed with market value. Thus,
the cost of capital is computed using market value weights for debt and equity and levered
and unlevered using market values. The accounting return computation is perhaps the only
place in finance where we revert back to book value, and the reason we do it is simple. We
are trying to compute the return earned on the capital invested in existing assets and we are
assuming that the book values of debt and equity effectively measures this capital investment.
Therefore, even though ROA is so vital and considered one of the majorly used measures of
financial return but there is no enough information on the effects of working capital
management and ROA.
Findings of this study can be beneficial for managers. It gives them more insight when they
make their financial decisions, especially the decision on firm liquidity by using working
capital. It also gives them insights about how to create the firm value by efficient working
capital management. Investors can also gain benefits from this research. They can obtain
some knowledge about how to assess a company’s financial health by looking at the working
capital management. Based on that, investors can make their correct investment decisions.
This study is also useful for finance and accounting students. They can have a deeper look at
how working capital management works and the impact of working capital management on
firm value
1.2 Statement of the Problem
The inability of financial managers to properly plan and control the current assets and current
liabilities of their companies and the failure of a large number of businesses can be attributed
to the inefficient working capital management. Management strategy aimed at maintaining a
balance between working capital and financial returns has far reaching consequences on the
growth and the survival of the firm. Thus, the manager of a business entity is in a dilemma of
achieving desired balance between working capital and returns in order to maximize the
value of a firm. Studies reveal that working capital management has been a major issue
especially in manufacturing and agricultural sectors and in order to explain the relationship
20
between working capital management and financial returns, different researches have been
carried out in different parts of the world to find out the relationship between working capital
management and financial returns in many different organization especially in manufacturing
and agricultural sectors. However, no study has been done on faith based organizations in
Kenya. This calls for an empirical analysis of the working capital management and the
financial returns of faith based organizations in Kenya using selected Seventh-day Adventist
institutions in Kenya as a case study.
1.3 Objectives of the Study
The general objective of the study is to establish the relationship between working capital
management and financial returns of faith based organizations in East African Union.
1.3.1 Specific Objectives of the Study
1. To determine the effect of working capital management on ROA of seventh day
Adventist Institutions in East African Union.
2. To determine the effect of working capital management of ROC of seventh day
Adventist Institutions in East African Union.
1.4 Hypothesis
H01: There is no effect between working capital management and Return on Assets of seventh
day Adventist Institutions in East African Union.
Ho2: There is no effect of working capital management on ROC of seventh day Adventist
Institutions in East Africa Union.
1.5 Significance of the Study
East Kenya Union is one among many administrative arms of the Seventh-Day Adventist
Church world- wide. The Seventh-Day Adventist Church in its mission to evangelize to the
whole world through various channels has established fields and conferences, hospitals, guest
houses, publishing houses, printing presses, hospitals and schools and institutions of higher
learning. It is against this backdrop that it is anticipated that this study will contribute to the
body of knowledge by identifying the relationship between working capital management and
financial return of institutions of the East African Union. This will not only benefit the
management and administrators of institutions of East African Union but of other SDA
Church institutions in other parts of the world as well as stakeholders and other faith based
organizations. This study will also add knowledge on the general subject of working capital
21
management for researchers, accountants, policy makers, professionals and financial
managers in the dynamic business environment of Kenya.
1.6 Justification of the Study
In the world of business, the ability to seize every opportunity and to seek practical business
tools and techniques to improve the financial profitability are of paramount importance for
success. Although not all business activities are for profit, business needs resources to
support all its activities (Arnold, 2008). Good business acumen dictates that business
resources should be managed efficiently. Money tied up in working capital is one area worth
looking into. Working capital for most firms constitutes a big chunk of their investment. On
this note, business leaders cannot overlook working capital management and its relationship
with the sustainability of the firm.
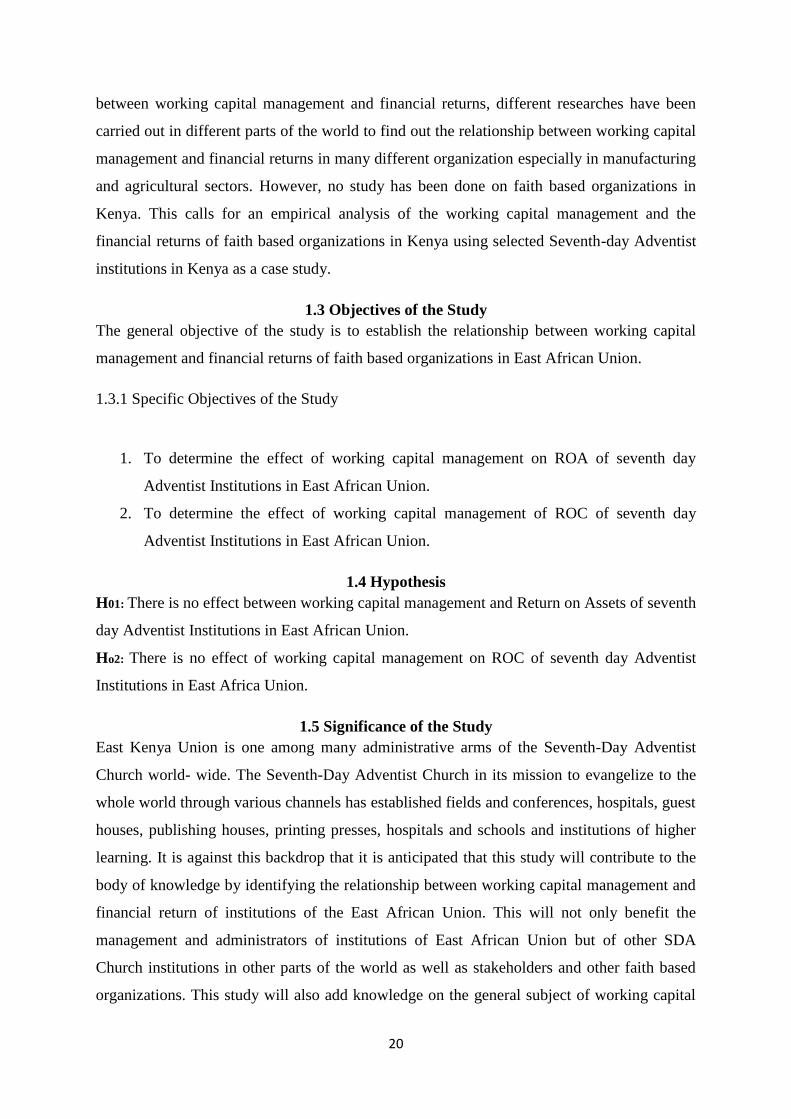
1.7 Conceptual Frame work
This study’s conceptual framework is concerned with the relationship between the working
capital variables as comprised of receivables, inventory, payables, cash and the policies and
practices employed in the management of working capital.
The relationships between the variables and the resultant outcomes are conceptualized in the
Figure below:
Independent Variable Dependent Variable
Intervening variable
Figure 1.1 Conceptual framework showing relationship between working capital management
and financial return variables.
Source: Self-Conceptualization (2017)
Efficient Working Capital
Policies and Practices
Elements of Working Capital
Management
Current Assets
Management of Accounts
Receivables
Current Liabilities
Management of Accounts
Payables
Financial
Return
Return on Asset
Return on capital
22
All businesses have either products or services to sell to the customers, they also want to
maximize their sales so, in order to increase the level of their sales they use different policies
to attract customers and one of them is offering a trade credit. It means a company sells its
products now to receive the payment at a specified date in the future. The level of account
receivables is largely influenced by the credit policy offered by the company to creditors.
Strict policy will reduce the collection period and account receivables and if company offers
relaxed credit policy it will raise the level of account receivables. This in the long run can
lower the profitability of the organisation.
The success of a business could be made or marred by its inventory policies. Before any
decision rules can be applied to the management of stock, a proper system of control and
recording of stocks must be instituted. If stocks are uncontrolled, costs of production will
vary indistinctly and this will mean that information required for other financial management
decisions will be inaccurate. The objective of inventory management is to turn over inventory
as quickly as possible without losing sales from stock-outs. It is an important aspect of
working capital management because inventories themselves do not earn any revenue.
Organisations not only need to manage their accounts payables in a good way but they should
also have the ability to generate enough cash to pay the mature account payables. If an
organisation fails to generate enough cash to fulfil the mature account payables then such a
situation will pass the negative signal to the market and it will directly affect the relationship
with creditors and suppliers. In this situation it will be difficult for the organisation to raise
more funds by borrowing money or get more supplies from the suppliers. Such a financial
distress will lead to the death of the entity. For most businesses to make profit, they have to
supply goods or services to their respective customers before being paid. But, no matter how
profitable the bargain, lack of enough money to pay staff and suppliers before receiving
payment, the business will be unable to deliver its own side of the bargain or make profit.
1.8 Scope of the Study
This study on working capital management is to be conducted among selected Seventh-day
Adventist institutions in East African Union. According to the Seventh-Day Adventist
Church Year Book (2016), there are eighteen institutions which fall directly under the East
African Union of SDA. The population of the study will consist of Business
Managers/Treasurers and accountants of ten (18) of the institutions. These institutions are a
representation of the administrative units and the service oriented institutions.

23
The respondents will be representatives from these institutions who actually take part in
engagements such as business managers/ treasurers and accountants. They are the individuals
who are responsible for the day to day management of working capital.
24
CHAPTER TWO
LITERATURE REVIEW
This chapter focuses on concepts and theories from the literature that are related to the major
variables of the study. It includes a brief understanding of working capital management, and
the main variables and related studies with their relationship to the present study. It is not
intended to answer any of the research questions directly, but to establish a rationale and lay
ground work on which other chapters will build on.
2.1 Theoretical Review
2.1.1 The Lending Credibility Theory
Another theory based on public perception, is the lending credibility theory. The key issue of
this theory is the addition of credibility to financial statements. Stakeholders need a guarantee
for fair representation of the economic value of the firm (Hayes et al, 2005). The information
hypothesis assigns an important role to the auditor in providing credibility to the financial
statements. Given a situation of uncertainty, the demand for auditing has one of the
controlling mechanisms has several possible explanations. The first one is the general belief
that an audit enhances the reliability of financial statement data and provides assurance to
users about their decisions.
Another theory is the dependence of the directors on the audit to produce information helpful
in estimating risk, even if the audit results do nothing more than confirm the directors’
expectations and beliefs about their decisions (Soltani, 2007).
The theory suggests that the primary function of audit is to add credibility to the financial
statements. This theory underpins this study’s objective as it is based on reliability of
credibility of financial statements of an entity that are confirmed.
Michael Fleuriet (1980) introduced a new model for analysing and managing working
capital. The model is based on the existence of three interrelated cycles: production cycle,
economic cycle and financial cycle. Therefore every industry observes a characteristic
financial cycle which indicates the normal rate at which transactions occur in that industry.
The financial cycle is also known as cash conversion cycle or working capital cycle and
represents the time it takes the company to recoup their investment (Arnold, 2008).
Working capital is sometimes substituted by capital circulate because it includes a portion of
the firm’s capital which is an essential element. Working capital is defined as the investment
of the firm in the current or short-term assets such as cash, short-term securities, accounts
25
receivable and inventories (Ghahderijani, 2006).Working capital management refers to the
whole aspects of managing the current assets of the firms. Working capital requires handling
different current assets and liabilities and is also composed of decisions related to the finance
of the current assets through current debts or equity. Significance of the capital in the
organizational processes made its management having essential importance. In general,
working capital holds a large proportion of the capital in all organizations. Financial affairs of
the firms might be classified into three main sections of capital budgeting, capital structure
and working capital management. Managing long-term capital is related to capital budgeting
and capital structure; while management of the current assets and liabilities deals with the
working capital management (Chion and Chen, 2006).
Working capital of a firm is defined as the amounts invested in the current assets of the
organization. Skilling (1996) believes that working capital represents the investments in the
cur-rent assets and liabilities, cash, short-term securities, accounts receivable and inventories.
Form his point of view; working capital is determining the volume and compound of the
resources so that the shareholders’ wealth is maximized. The policies of the working capital
include those principles and plans dealing with the tasks of current assets and liabilities.
Many authors and scholars referred to three types of working capital: aggressive, mediator
and conservative. The major difference between these policies is the level of networking
capital management which is equal to the difference between current assets and liabilities
(Fathi and Tavakkoli, 2009).
Many specific factors affect working capital management. Obviously, the elements at
different levels have changed the need to a proper working capital. Nature of the
manufacturing (firms’ operations) process, manufacturing period of the firm and its policy,
credit guideline of the suppliers, growth and development affairs, facility in attaining the
financial returns. Attitudes of the managers toward risk determine the level and compound of
the working capital. Conservative managers tend to select the volume and compounds by
which the risk is mitigated. However, some other managers intend to select the volume and
compound of the working capital management which increases the return.
Financial return can be termed as the rate of return on investment. If there will be an
unjustifiable over investment in current assets then this would negatively affect the rate of
return on investment (Dong & Su, 2010). According to (Banz 1981) Financial Return refers
to collection of final results generated from investment activity and process over a period of
26
time. The basic purpose of managing working capital is controlling of current financial
resources of a firm in such a way that a balance is created between financial return of the firm
and risk associated with that return (Harris, 2005).
Damadoran 2007, states that financial return is an outcome of application of resources on a
recurrent manner on long term investments which subsequently defines the measures of
financial return as Return on Capital (ROC), Return on Invested capital (ROIC) and Return
on Equity (ROI) Financial return is therefore a function of investment on resources in a
production process, thus Return on investment (ROI) is a measure that investigates the
amount of additional profits produced due to a certain investment. Businesses use this
calculation to compare different scenarios for investments to see which would produce the
greatest profit and benefit for the company.
2.1.2 Hedging Theory
Hedging theory mean no long term funds was used to finance short-term seasonal need i.e.
current assets are equal to current liabilities. The theory is a moderate policy that links assets and
liabilities to maturity. Finnerty (1993; Josh et al,1996) stated that current acid test and cash ratios
are balance sheet measures that cannot give a detailed and accurate working capital that is
effective and efficient. Hedging theory is a risk based theory as its full utilization on the firm’s
capacity to use short-term funds in an emergency situation not satisfies short-term needs. Most
companies use long-term sources in financing fixed assets and permanent current assets plus
short-term funds in financing temporary current assets, Richards and Laughlin(1989) Gentry et al
(1990), Schillng (1996) Boer (1999) and Waithaka (2012) have insisted on utilization of ongoing
liquidity management. Ongoing liquidity management means that inflows management means
that inflows and outflows of cash arising from the company’s as the payment and collection takes
place over a period of time. In hedging approach, a firm needs to have additional inventories for
about two months and short term funds also for two months in order to match the inventory
purchase. However limited access to short term WC sources which include bank financing and
suppliers financing does not augur well with hedging approach. Ross et al., (2003) gave an
opinion that most of them it is reasonable to study the WC management approach in reference to
utilization of funds.
2.2 Empirical Review
Working capital management as Kouma (2001) points out is that working capital is required
to finance the day to day operations of an organization. Working capital may be required to
bridge the gap between buying of stock items to eventual payments for goods sold on
27
account. Working capital has to fund the gap when products are on hand but being held in
stock. Products in stocks are at full cost, effectively they are company cash resources which
are out of circulation therefore additional working capital is required to meet this gap which
can only be reclaimed when the stocks are sold (and only if these stocks are not replaced) and
payment for them is received. Working capital requirements have to do with profitability and
much more to do with cash flow.
Jel (2014) investigated whether working capital management affect firm’s performance of
non-financial films listed in Pakistani, Kerachi stock exchange during 2007 to 2010. The
impact of WC variables was conducted using three performance measures namely gross
profit margin, return on assets and return on assert and return on equity. The findings were
average age of inventory was positively related to gross profit margin and return on assets but
negatively related to return on equity with a significant relationship. The relationship was
insignificant but positive thus may be due to increased sales which reduce inventory levels,
hence profitability. Average collection period was significantly and positively related to gross
profit margin and return in average collections period improves accounts receivables which in
turn positively affect the firm’s performance.
Truel and Solano (2007) conducted a study which a negative relationship between profitability of
a company and cash conversion cycle. The finding was that there is a possibility of increasing
company profitability by means of a more efficient working capital management. For this to be
realized ,it is important that main components of cash conversion cycle for example short-term
trade liabilities, short-term accounts receivable and inventories must be managed in such a way it
maximizes a firm’s profitability. An efficient working capital management increases free cash
flows to the company’s growth opportunities and return of stockholders. This study indicates that
there is an element of negativity to some extent on the credit management hence a negative effect
on the company’s financial performance
For instance, the study conducted in three Japanese companies by Gill (2015), it was
established that working capital management is concerned with the problems that arise in
attempting to manage current assets, current liabilities and the interlocking relationship that
exist between them. The term current assets refers to those assets which in an ordinary course
of business can be or will be converted into cash within one year without undergoing a
diminution in value and without disrupting the operations of the firm. The major current
28
assets are cash, marketable securities, accounts receivables and inventory (Gill, Biger,
Mathur, 2010).
In the same domain, Current liabilities are those liabilities which are intended at their
inception to be paid in the ordinary course of business, within one year out of the current
assets or earning of the concern. The basic current liabilities are accounts payable, bills
payable, bank overdraft and outstanding expense. The goal of working capital management is
to manage the firm’s assets and liabilities in such a way that a satisfactory level of working
capital is maintained. This is so because if the firm cannot maintain a satisfactory level of
working capital, it is likely to become insolvent and may even be forced to bankruptcy
(Vataliya, 2008).
In regard to fridge benefit, Vataliya (2008) postulates that the current assets should be large
enough to cover its current liabilities in order to ensure a reasonable margin of safety for the
return on assets. Each of the current assets must be managed efficiently in order to maintain
the liquidity of the firm while not keeping too high a level of any of them. Each of the short
term sources of financing must be continuously managed to ensure that they are obtained and
used in the best possible way. There is no explanation for the disparity in the study, but
fundamentally, the study fails to indicate the measure of the working capital management.
The interaction between current assets and current liabilities is therefore the main theme of
the theory of management of working capital (Chandra, 2010) thus this directs us to the gap
of knowledge that ensues will be mitigated by the current study by looking at our our
objective to establish the relationship between working capital management and return on
assets of SDA in East African Union.
Management of working capital enables the organization to achieve the following; Meet
day-to-day cash flow needs, Pay wages and salaries when they fall due, Pay creditors to
ensure continued supplies of goods and services, pay government taxation and providers of
capital, and Ensure long term survival of the business entity. Although the study attributes
fringe benefit to influence Working capital management, it was done in the public sectors and
not in the private organizations like the faith based organizations and they have documented
differences in their mode of operations thus this.
Mutungi (2010) worked on the relationship between working capital management and
financial performance of oil marketing firms registered in Kenya with the petroleum institute
of east Africa within Nairobi and its environs. The sample consists of 59 registered oil
29
marketers in Kenya .The research noted that working capital management decisions have
effects on the company’s risk return as well as share price. The study revealed that in order
for a company to operate effectively, receivables and inventory must be monitored and
controlled properly. The effect of having adequate level of working capital for the growth and
sustainability of a firm is therefore fundamental.
Lazaridis T. (2006) carried out a study on the relationship between the cash conversion cycle
and level of profitability on 13 listed companies of the Athens Stock Exchange for a period
between 2001 and 2004 .The study aimed at determining statistically the significant
relationship between CCC and profitability which is measured by operating profit. Accounts
receivable turnover, accounts payable turnover and inventory management as forming part of
(cash conversion cycle (CCC) used in the study. The study revealed that firms interested in
the increase in their accounts receivables to an optimal level have their profitability increased
hence increase in sales and market share. The Pearson correlation and regression results were
used in the analysis of the findings which revealed the existence of a negative relationship
between accounts receivables turnover ,accounts payable turnover and inventory management
as well as profitability which is in line with the study carried out by Deloof (2003) Belgium
firms. The findings emphasized their
Study on working capital management and return on capital is an all important function of the
financial manager if the business is to survive in the midst of intense competition and make
profit. The effective and efficient management of working capital will therefore have
favourable impact on both short-run and long-run organizational goals and objectives of the
firm one of which is profit maximization. However, both excessive as well as inadequate
working capital positions are dangerous from the firm’s point of view (Pandey, 2000). This is
because excessive working capital means idle funds which earn no profits for the firm
(Brealey, 1996). Also true is that paucity of working capital not only impairs the firms
profitability but also results in production interruptions and inefficiencies. No wonder,
Pandey (2000) rightly suggest the dangers of excessive working capital on a firm’s
performance as follows: It results in unnecessary accumulation of inventories, thereby
leading to chances of inventory mishandling, waste, theft and losses increase, it is an
indication of defective credit policy and slack collection period. This result into higher
incidence of bad debts, which adversely affects profits, excessive working capital makes
management complacent which degenerates into managerial inefficiency, and finally,
tendencies of accumulating inventories tend to make speculative profits grow. This may tend
30
to make dividend policy liberal and difficult to cope with in future when the firm is unable to
make speculative profits (Pandey, 2000).
On the other hand, inadequate working capital is also bad and has the following six dangers,
according to the same authors, as, It stagnates growth in that it becomes difficult for the firm
to undertake profitable projects due to non- availability of working capital funds, it becomes
difficult to implement operating plans and achieve the firm’s profit target, operating
inefficiencies creep in when it becomes difficult even to meet day-to-day commitments.
Fixed assets are not efficiently utilized for the lack of working capital funds hence leading to
deterioration of the firm’s profitability; paucity of working capital funds renders the firm
unable to avail it of attractive credit opportunities and so forth. And finally, the firm loses its
reputation when it is not in a position to honour its short-term obligations and as a result, the
firm faces tight credit terms (Kouma, 2001).
The foregoing discussions have gone a long way to demonstrate the need to balance working
capital position of the business enterprise in order to maintain adequate liquidity, minimize
risks and raise the returns, at all times. An enlightened top management should therefore
maintain the right proportion of working capital on a continuous basis. Only then will a
proper functioning of business operations be ensured. Sound financial and statistical
techniques, supported by judgment, should be used to predict the quantum of working capital
needed at different time periods (Pandey, 2000).
But a different study, Kouma (2013) established that a proper management of working capital
is required because if a company has too little invested capital in the working capital then it
means that company does not have sufficient quantity of materials and account receivables
which might lead to loss in production and consequently sales will decrease, furthermore in
case of a high demand in the market it will be difficult for the company to react immediately
and fulfill the demand. On the other hand if the investment in working capital is too big then
a company has to bear the cost of storage of inventory, handling cost and opportunity cost
(Arnold, 2008).
Furthermore, the studies states that in order to control risk and cost of capital of the company,
the decision about the financing and level of working capital is really important. The level of
working capital fluctuates with any fluctuation in its component e.g. if the production of firm
is higher but the sale is relatively lower than the level of inventory will increase, on the other
hand if the sale exceeds the level of production then inventory will decrease. Similarly, the
31
level of cash will increase when companies collect the receivables and its level reduces when
it pays its account payables. Moreover companies have three options to choose between to
finance working capital i.e. short term debt, long term debt and equity finance. Equity
financing is the most expensive way of financing followed by long term debt and short term
debt (Boone & Kutz, 2010).
Although short term debt is the cheapest way to finance but it carries risk with it because any
discarded fluctuation in cash might push the company towards default. Long term debts have
more risk than short term debts and it carries high interest rate (because of a higher risk
premium) which will reduce profitability. So in order to maintain cash inflow, cash outflow
and to create the breakeven between risk, return and liquidity it is really important to manage
working capital (Andrew & Gallagher, 1999). Furthermore the studies focused on working
capital management and return on capital on manufacturing and agricultural sectors thereby
leaving out the faith based organizations. Therefore the resultant gap in the knowledge cannot
be clearer. The current study will thus mitigate the gap by utilizing case study design and
focusing on working capital management and return on capital as a factor of financial return
in the faith based organizations.
Anold (2008) conducted a study about the model of the working capital cycle given in Figure
2.1, articulates the basic components of WCM interrelationship and their dynamics with the
liquidity phase of a given enterprise. The working capital cycle starts at the purchasing of raw
materials from potential suppliers for the production process, through work in progress and
ending with finished products. The finished goods are kept as inventories, ready to be sold to
customers for cash or credit transactions if the accrual accounting system is implemented. If
the finished goods (i.e. inventory) are sold on credit to customers then the cash would be
tightening in the form of account receivables. These amounts would be collected in
accordance with the trade credit policy being given to customers.
Chatraji (2010) carried out a study on the impact of working capital management on
profitability in companies listed in London stock exchange between 2006 and 2008. The
Pearson correlation coefficient was used by the researcher to evaluate the effect of cash
transformation cycle, the period of collection of receivables, inventory retention period,
liability settlement period, the current to quick ratio to net operational profit. Results
indicated a negative relationship between working capital management and profitability. It
therefore means that an increase in cash transformational cycle would result in a reduction in
32
profitability. The study has also revealed a negative relationship between liquidity and
profitability. This clearly indicates a negative effect on the company’s financial performance.
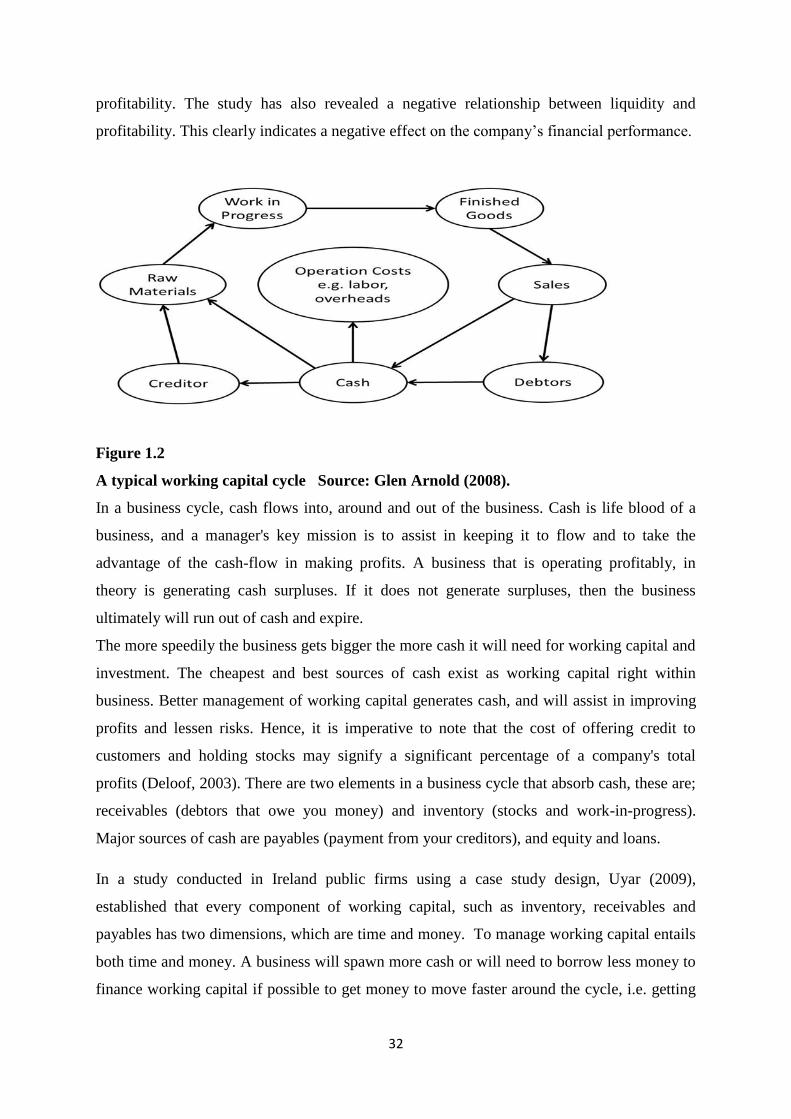
Figure 1.2
A typical working capital cycle Source: Glen Arnold (2008).
In a business cycle, cash flows into, around and out of the business. Cash is life blood of a
business, and a manager's key mission is to assist in keeping it to flow and to take the
advantage of the cash-flow in making profits. A business that is operating profitably, in
theory is generating cash surpluses. If it does not generate surpluses, then the business
ultimately will run out of cash and expire.
The more speedily the business gets bigger the more cash it will need for working capital and
investment. The cheapest and best sources of cash exist as working capital right within
business. Better management of working capital generates cash, and will assist in improving
profits and lessen risks. Hence, it is imperative to note that the cost of offering credit to
customers and holding stocks may signify a significant percentage of a company's total
profits (Deloof, 2003). There are two elements in a business cycle that absorb cash, these are;
receivables (debtors that owe you money) and inventory (stocks and work-in-progress).
Major sources of cash are payables (payment from your creditors), and equity and loans.
In a study conducted in Ireland public firms using a case study design, Uyar (2009),
established that every component of working capital, such as inventory, receivables and
payables has two dimensions, which are time and money. To manage working capital entails
both time and money. A business will spawn more cash or will need to borrow less money to
finance working capital if possible to get money to move faster around the cycle, i.e. getting
33
monies due from debtors as fast as possible or lowering the sum of monies tied-up by
lowering inventory levels relative to sales. As a consequence, one can lower bank interest
cost or one will have extra free money that will be available to enhance more sales growth or
investment. In the same way, negotiating improved terms with suppliers such as getting
longer credit or an increased credit limit will effectively create free finance to assist funding
future sales
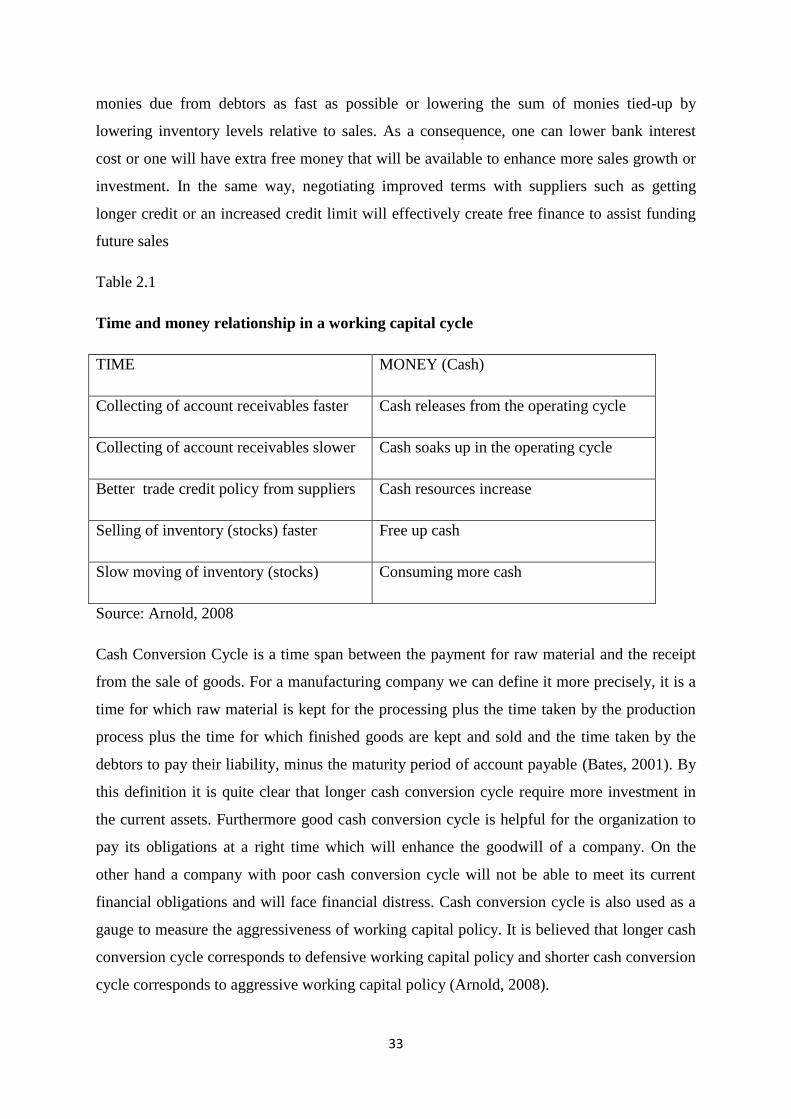
Table 2.1
Time and money relationship in a working capital cycle
TIME MONEY (Cash)
Collecting of account receivables faster Cash releases from the operating cycle
Collecting of account receivables slower Cash soaks up in the operating cycle
Better trade credit policy from suppliers Cash resources increase
Selling of inventory (stocks) faster Free up cash
Slow moving of inventory (stocks) Consuming more cash
Source: Arnold, 2008
Cash Conversion Cycle is a time span between the payment for raw material and the receipt
from the sale of goods. For a manufacturing company we can define it more precisely, it is a
time for which raw material is kept for the processing plus the time taken by the production
process plus the time for which finished goods are kept and sold and the time taken by the
debtors to pay their liability, minus the maturity period of account payable (Bates, 2001). By
this definition it is quite clear that longer cash conversion cycle require more investment in
the current assets. Furthermore good cash conversion cycle is helpful for the organization to
pay its obligations at a right time which will enhance the goodwill of a company. On the
other hand a company with poor cash conversion cycle will not be able to meet its current
financial obligations and will face financial distress. Cash conversion cycle is also used as a
gauge to measure the aggressiveness of working capital policy. It is believed that longer cash
conversion cycle corresponds to defensive working capital policy and shorter cash conversion
cycle corresponds to aggressive working capital policy (Arnold, 2008).
34
McClure (2007) sought to establish why Capital is the oxygen which enhances a business
survival and prosperity, and is the basic indicator of business health. As a business can
survive for a short time without sales or profits, it cannot survive without cash i.e. it will die.
As a result the inflow and outflow of cash need careful monitoring and management. Cash
flow is a function of the time and money that flow into and out of the business on weekly and
monthly basis. A good cash-flow implies that the method of income and spending a business
employs, will enable it to have cash available to pay bills on time (Baker, 2005).
He further established that Cash balances should not be confused with profit. Profit is known
to be the difference between the total amount the business generates and all of its costs that is
normally assessed over a year or other trading period. There is a possibility of being able to
forecast a good profit for the year, but still face situations when the business is strapped for
cash (Boone & Kurtz, 2010).For most businesses to make profit, they have to supply goods or
services to their respective customers before being paid. But, no matter how profitable the
bargain, lack of enough money to pay staff and suppliers before receiving payment, the
business will be unable to deliver its own side of the bargain or make profit.
For instance in trading and growing the business effectively, one must build up cash balances
by ensuring that the timing of cash movements puts the organisation in an overall positive
cash flow position. Meanwhile, having a lot of cash in bank does not make any good business
sense. If the cash is not needed to be used immediately, it is advisable to lodge it in an
account where it will earn high interest, or maybe invest in short term investment (Baker,
2005).Companies of various sizes have fluctuating cash balances. These fluctuations can
occur at random or at expected intervals. It may occur on a monthly basis due to variations
between payables and receivables, or seasonal basis depending on the nature of the business
(Collis & Hussey, 2003). Regardless of the reason for fluctuations in the cash account, a
company incurs costs in holding cash balances in excess of their immediate transactional
needs.
Additionally, the costs involved in holding cash are stated in terms of opportunities lost to
invest these funds at a positive interest rate. The interest income lost becomes increasingly
large as the amount of idle funds and the rate of interest increases. The managing of the funds
of a company in order to maximise cash availability and interest income on any idle funds is
the concern of cash management. At one end, the role of cash management begins the
moment a customer writes a cheque to pay the company on its account receivable. The role
35
ends when a supplier realizes collected funds from the firm on an account payable or accrual.
The activities between these two points fall within the realm of cash management.
Furthermore a perfectly timed cash conversion cycle is completed when the firm collects cash
exactly when its accounts payable and accrued expenses fall due or mature. In reality, hardly
ever does a firm have its obligation maturing at the same time as it collects cash, thus the
need for financing (Arnold, 2008).
A separate study conducted by McClure (2007) describes cash as the lifeline of a company. If
this lifeline deteriorates, so does the company’s ability to fund operations, reinvest and meet
capital requirements and payments. Understanding a company’s cash flow health is essential
to making investment decisions. A good way to judge a company’s cash flow prospects is to
look at its working capital management. Cash is king, especially at a time when fund raising
is harder than ever. Letting it slip away is an oversight that investors should not forgive.
Analysing a company’s working capital can provide excellent insight into how well a
company handles its cash, and whether it is likely to have any on hand to fund growth and
contribute to shareholder value.
Additionally, inventory management is the supervision of non-capitalized assets (inventory)
and stock items. A component of supply chain management, inventory management
supervises the flow of goods from manufacturers to warehouses and from these facilities to
point of sale (Arnold, 2008). It is the goal of inventory management to determine the
optimum level of stock on hand under conditions of changing market demand, production
requirements, and financial resources (Glos et al., 2001). Effective inventory management
enables an organization to meet or exceed customer’s expectations of product availability
while maximizing net profits or minimizing costs. Inventory of materials, parts, goods and
supplies represent a high investment in all businesses. The success of a business could be
made or marred by its inventory policies. Before any decision rules can be applied to the
management of stock, a proper system of control and recording of stocks must be instituted.
If stocks are uncontrolled, costs of production will vary indistinctly and this will mean that
information required for other financial management decisions will be in accurate.
Furthermore the first component of cash conversion cycle is the average age of inventory.
The objective of inventory management is to turn over inventory as quickly as possible
without losing sales from stock-outs. It is an important aspect of working capital management
because inventories themselves do not earn any revenue. Holding either too little or too much
36
inventory incurs costs. Inventory is generally made up of three elements such as raw
materials, work-in-progress (WIP) and finished goods (Arnold, 2008; Cinnamon, Helweg-
Larsen, & Cinnamon, 2010; Gitman, 2009).Raw materials are concerned with the goods that
have been delivered by the supplier to purchaser’s warehouse but have not yet been taken
into the production area for conversion process (Cinnamon et al., 2010). The minimizing of
the raw materials is ideal in this particular part of working capital. It is not necessary for a
firm to hold high level of raw material inventory, in fact a firm can order raw material on
daily basis but the high ordering cost is associated with such a policy. Moreover, the delay in
supply might stop the production.
Additionally, work in progress concerns when the product has left the raw material storage
area, until it is declared for sale and delivery to customers. In this process the working capital
must be considered in terms of reducing the buffer stocks, eliminating the production process,
reducing the overall production cycle time. The raw materials and finished goods must be
minimized in the production area. WIP must be carefully examined to justify how long it
takes for products to be cleared for sale. This stage is normally done by the quality control
(QC) procedures (Birt et al., 2011; Cinnamon et al., 2010).
In regard to return on assets, the literature concentrates on the concept of return on assets
where the finished goods refer to the stock sitting in the warehouse waiting for sale and
delivery to customers. They could be sitting in the warehouse or on the shelf for quite
sometimes. The owner/manager of the business should find what options are available to
dispose of the slow moving items. Should the stock be repacked or reprocessed, and sold at
lower discount prices. Sales and operations planning can reduce or eliminate the need for
finished goods. The best example of stock management is car manufacturing. The
manufacturers normally use the JIT system to deliver finished products. In this way they
minimize or eliminate both raw material stock and work in progress, as the stock is now in
finished goods (Brealey, Myers, & Allen, 2006;Cinnamon et al., 2010; Van Horne
&Wachowicz, 2008).
Similarly, a firm can reduce its finished goods inventory by reducing the production and by
producing the goods only to meet the current demand but such a strategy can also create
trouble for the company if the demand for the product rises suddenly. Such a situation might
cause the customer dissatisfaction and even a loyal customer can switch to the competitors
brand. The stock-outs of inventory levels can cause a loss in sales leading to diminishing
37
profits. Therefore, the firm should have enough inventories to meet the unexpected rise in
demand but the cost of holding this inventory should not exceed its benefit (Brealey& Myers,
2006).
Inventory is transformed into debtors (accounts receivables) by selling on credit then cash is
collected at a later stage. Gitman (2009) echoes the significance of the average collection
period (ACP) that represents the length of time to collect cash from customers. Likewise,
cash tied up in inventory between purchase and sale represents the average age of inventory
(AAI) in the cash conversion cycle. When the cash conversion cycle (CCC) increases, it will
lead to the decline of profitability of a typical business. Thus the owners-managers can create
a positive value for the business owners by adequately handling the CCC and keeping each
different component to an optimal level (Uyar, 2009). The costs of carrying too much
inventory are opportunity cost of foregone interest, ware-housing costs, damage and
pilferage, obsolescence and insurance. The costs of carrying too little inventory are stock out
(i.e. lost sales, delayed service), and ordering costs (i.e. freight, order administration and loss
of quantity discounts).
The following ordinary techniques are available for effectively managing the firm’s inventory
(Birt, 2011; Gitman, 2009).Just-In-time approach (JIT) is concerned with the delivering of
raw materials. When using the JIT system, goods can be delivered directly to the production
area, eliminating raw material storage costs. The purpose of using just-in-time approach is to
have the supplier carrying the goods rather than it being carried by the purchaser (Cinnamon
et al., 2010; Zietlow et al., 2007). This frees up cash will would have been tied up in large
quantities of stock and in storage to be used in other operations of the business.
Furthermore, Uyar (2009) conducted a study to establish the relationship on one working
capital components and states that accounts receivable management as the process of making
decisions relating to investment in trade debtors. Certain investment in receivables is
necessary to increase the sales and the profits of the firm. All businesses have either products
or services to sell to the customers, they also want to maximize their sales so, in order to
increase the level of their sales they use different policies to attract customers and one of
them is offering a trade credit. It means a company sells its product now to receive the
payment at a specified date in the future. Hill & Sartoris (2005) found that one sixth of total
assets for manufacturing corporations consist of account receivables and because of its huge
proportion in the total assets, it can become a problem for the organization in a way that it
38
requires more financing for the period for which payment is due from the customers. Account
receivables also have opportunity cost associated with them because a company can’t invest
this money elsewhere until and unless it collects its receivables. More account receivables
can raise the profit by increasing the sale but it is also possible that because of high
opportunity cost of invested money in account receivables and bad debts the effect of this
change might turn difficult to realize. On the other hand if a company adopts a policy to have
a low level of account receivables then it can reduce the profitability by reducing the sales but
it can contribute to the profit by reducing the risk of bad debts and by reducing investment in
the receivables (Andrew & Gallagher, 1999). Companies want to have a level of account
receivables which maximizes the profitability. The level of account receivables is largely
influenced by the credit policy offered by the company to creditors. Strict policy will reduce
the collection period and account receivables and if company offers relaxed credit policy it
will raise the level of account receivables. Thus, it is important for the financial manager to
establish a good policy that controls the advantages of offering credit with the associated
costs. Kelly & McGowen (2010) promote the notion of credit policy offered to the credit
customers should include the following;
In regard to working capital management, the literature concentrates on Setting credit terms-
in this portion of the credit policy is concerned with how long should the business extend
credit? That’s the accounts payable. It also considers what type of discounts should business
offer to convince credit customers for early payments, establish credit standards-these
standards deal with how should the business decide which customers qualify for credit? What
type of credit data should it require? How strict should standards be? Design appropriate
collection policy-this part of collection policy deals with how aggressive should the business
be at collecting overdue accounts? At what point of time does it make sense to take legal
action against credit customers who are having late paying accounts, or to turn over the
outstanding accounts to collection agencies? It also deals with when it makes sense to work
out compromises?
On a different study, Gitman (2009) established that it’s the cheapest and simplest way of
financing an organization. Account payables are generated when company purchases some
products for which payment has to be made no later than a specified date in the future.
Account payables are a part of all the businesses and have some advantages associated with it
e.g. it is available to all the companies regardless of the size of the company and earlier
payment can bring cash discount with it (Arnold, 2008). Companies not only need to manage
39
their account payables in a good way but they should also have the ability to generate enough
cash to pay the mature account payables because if a company fails to generate enough cash
to fulfil the mature account payables then such a situation will pass the negative signal to the
market and it will directly affect the share price, relationship with creditors and suppliers. In
this situation it will be difficult for the company to raise more funds by borrowing money or
get more supplies from the suppliers. Such a financial distress will lead to the death of the
entity (Lamberson, 1995).
Gitman (2009) and Birt et al., (2011) established that accounts payable management objective
is to pay creditors as slowly as possible without damaging its credit rating. Accounts payable
and accruals are the two major spontaneous liability sources of short-term financing for a
typical firm. Accounts Payables are the major unsecured short-term financing for businesses.
They result from transactions in which merchandise (inventory) is purchased. The suppliers
might give credit terms together with allowing discount to the purchasers. Bates states that
credit terms granted seem to depend to some extent on the traditions and customs of the trade
in which the business is operating, and some trade association have fairly strict rules about
trade credit terms, and discounts; but there is little doubt that on occasion, the extension of
trade credit on more favourable terms can be a way of extending sales (Bates, 2001).
Moreover, differences between industries also reflect the relationship between the company
and its customer. According to Bates, businesses which work basically on specification
orders for regular customer tend to give credit while businesses that make their own products
and place them in the market without advance orders tend to receive credit. This suggests that
firms working on contract for other firms are very much at their mercy when it comes to
receiving payment for work done. Government institutions are frequently mentioned as bad
payers of trade debt.
Furthermore the effective working capital management policy of enterprises is essential in
order to ensure the optimal levels of growth, profitability, and long-term sustainability.
Owners/managers of enterprises need to spend more time to manage the current assets and
current liabilities effectively in order to maximize the firm’s value in a way that balances
profitability (Baker & Powell, 2005; Preve & Sarria-Allende, 2010; Sharma, 2009). Finance
literature classifies working capital policy into three categories; Aggressive policy, defensive
policy, and Conservative policy.
40
Current assets are most important components of working capital as the policy which a
company adopts towards working capital also depends on the level of current assets.
Aggressive policy can be adopted to create value by maintaining low level of current assets
as compared to current liabilities. It will create value but at the same time it will increase the
risk of default. On the other hand it can follow the defensive policy by increasing the level of
current assets as compared to current liabilities, it will reduce the risk of default but there is
an opportunity cost associated with it, which might cause the reduction in profitability (Afza
& Nazir, 2008).
The central point or the focus of working capital policy is on the liquidity of current assets to
meet the short term or current liabilities. Liquidity gives the true idea of firm’s position to
meet its maturing liabilities. A firm should have sufficient level of liquidity because
excessive liquidity results into idle funds which do not create any value. On the other hand
low level of liquidity might result into the lack of resources to meet financial obligations
hence creates financial distress (Vishnani & Shah, 2007).
So one may define working capital policy as a policy which creates a breakeven of cash flow
i.e. same level of cash inflow and cash outflow. Such a cash flow will help to manage the
affairs of business in an efficient way (Brian, 2009), but it is not a simple concept to establish
such policy without proper understanding of the drivers of working capital. It emerges as a
major problem in the organizations where finance department is unable to identify the basic
drivers and appropriate level of working capital. Lamberson says that, a good understanding
of these drivers and their role helps the finance managers to reduce the risk of default and to
boost up the performance (Lamberson, 1995).
Similarly most firms have defined their optimal level of working capital which will create
value for them. For such firms working capital is a part of their financial management
strategy. For instance in order to increase their sales, different firms uses different credit
policies. Strict credit policy will result in the decrease in the sales therefore companies prefer
to have such a policy which facilitates the customers and the objectives of the firm.
Furthermore such credit is an expensive source of finance for the customers rather than
borrowing money from any financial institution thus it increases the sale (Deloof, 2003). This
credit sale system requires more investment in the account receivables. Some companies
offer some kind of discounts on early payments which helps to convert account receivables
into cash. On the other hand in order to fulfill high sales, company need to have sufficient
41
supply and an optimal level of inventory. Since company has invested some money in the
account receivables it prefers to buy raw material on the credit terms which match the credit
period of account receivables. Raheman and Nasr (2004), says that by following such credit
policies companies can create demand and have sufficient supply to meet the demand, it will
increase their profitability, but at the same time the level of current assets and current
liabilities will increase. The total investment in the working capital will increase which can
disturb the balance between cash inflow and cash outflow. So, companies need to have
strategy, that will help them to make the cash conversion cycle efficient. Many researchers
use cash conversion cycles as a tool to measure effectiveness and aggressiveness of working
capital policy. Cash conversion cycle is a time span from the disbursement of cash to supplier
until the receipt of payment from the customer. Large time span increase the profitability by
increasing the level of sale but at the same time needs larger investment in working capital.
The effect of this increased profitability can disappear if the cost of higher investment in
working capital surpasses its benefits (Deloof, 2003).
Furthermore the main objective of working capital policy is to maintain such a level of cash
inflow and cash outflow which creates a balance between each component of working capital.
Without such a balance it is impossible to move or bring a business operation on a right track.
Furthermore it requires consistent and continuous monitoring of components of working
capital in order to achieve such a balance but if finance executives fail to monitor and manage
it well then they use most of their time to fetch unfavorable level of short-term assets and
liabilities to the favorable optimal level (Filbeck& Krueger 2005, Lamberson, 1995).
According to the working policy of the Seventh-Day Adventist Church, working capital was
defined as the amount of current assets above the total current liabilities. Provisions are
outlined for each of the organizations for sound and effective operation. Where the working
capital of an organization is less than the 100 % required for two years in succession, that
organization shall transfer from its allocated funds to its unallocated funds sufficient monies
to meet the required 100 %working capital with committee approval. It is the responsibility
of the division committee to arrange for periodic surveys of the working capital status of each
subsidiary organization and to provide a plan for maintaining adequate working capital and
liquid assets (SDA Church Working Policy, 2010).
The literature reviewed on the relationship between working capital management and firm’s
financial return has left several knowledge gaps to be filled. For instance Deloof (2003)
42
investigated the relationship between working capital management and corporate profitability
for a sample of 1,009 large Belgian non-financial firms from 1992 – 1996. He found a
negative relationship between gross operating income and number of days receivable,
payable and inventories. His studies also established a negative relationship between cash
conversion cycle and profitability. In studying working capital management and profitability
of listed Pakistani firms on the Karachi Stock Exchange, Raheman and Nasr (2007)
determined the existence of a strong negative correlation between the variables of working
capital management and profitability. Using a sample of fifty (50) selected listed firms in
Nigeria, Falope and Ajilore (2009) conclude that a statistically significant negative
correlation exist between net operating profitability and inventory turnover, cash conversion
cycle, debtors collection period and account payable days. More recently, Bagchi and
Khamrui (2012) have shown that statistically significant inverse association exist between the
return on assets of selected FMCG companies in India and each of cash conversion cycle,
interest coverage ratio, age of debtors, age of creditors, age of inventory and debt ratio. These
findings are not significantly different from those of other researchers such as Ching et al
(2011), Lazaridis and Tryfonidis (2006), Garcia-Teruel and Martinez-Solano (2007). Despite
the findings of these authors, Agyei and Yeboah (2011) show that a positive relationship
exists between cash conversion cycle and bank profitability. Gill et al (2010) also educe a
statistically positive significant relationship between cash conversion cycle and gross
operating profit ratio. This implies that longer cash conversion cycle might increase
profitability because it leads to higher sales. But Deloof (2003) argues that corporate
profitability might also decrease with the cash conversion cycle if the cost of higher
investment in working capital is higher and rises faster than the benefits of holding more
inventories and granting more trade credit to customers.
Raheman and Nasr (2004), studied the effect of different variables of working capital
management including average collection period, inventory turnover in days, average
payment period, cash conversion cycle and current ratio on the net operating profitability of
Pakistani firms. They selected a sample of 94 Pakistani firms listed on Karachi Stock
Exchange for a period of six years from 1999-2004 and found a strong negative relationship
between variables of working capital management and profitability of the firm. They found
that as the cash conversion cycle increases, it leads to decreasing profitability of the firm and
managers can create positive value for the shareholders by reducing the cash conversion
cycle to a possible minimum level.
43
Working capital management is a very important component of corporate finance because it
directly affects the liquidity and profitability of the company. Working capital refers to a
company‘s current asset and liabilities. An optimal working capital management is expected to
contribute positively to the creation of a firm‘s value. To arrive at an optimal working capital
management, firm managers should control the tradeoff between liquidity (ability to meet its dues
by making adequate sales and paying off its bills as they fall due) and profitability (size of
earning after tax).
A review of prior literature reveals that there exists a significant relationship between financial
performance and working capital management by using different variable selection for analysis.
preference characteristics of firm‘s managers will affect the level of performance and profitability
of the organization.
However, it is evident from the literature that none of the studies has been able enough to develop
a model that will assist managers to establish an optimum working capital under different
operating environments or even industries. Instead the literature and studies suggest the existence
of an optimum level without necessarily suggesting the same level or how to be establishing it. A
few studies have been conducted in context touching on working capital management; from
these empirical studies it‘s clear that much has not been done to determine the relationship
between working capital and financial return of faith based organizations. Therefore there is need
to establish whether there exists any relationship between working capital management and
financial return of faith based organizations.
44
CHAPTER THREE
RESEARCH METHODOLOGY
3.1 Research Design
The study employed a descriptive & correlational research design. A descriptive study is a
process of collecting data in order to test hypothesis or answer questions concerning the
current status of the study. It is used when the purpose is to describe the characteristics,
estimate proportions of variables that behave in certain ways and make specific predictions
(Mugenda, 2003). It was therefore necessary to use descriptive correlational method because
of the nature of the data the researcher collected to test the hypothesis and establish a
relationship. This study tried to paint the larger picture of what occurs in the management of
working capital and the relationship it has with financial returns of institutions of the selected
Seventh - day Adventist institutions in East African Union. Descriptive statistics like
frequencies, percentages, mean, and standard deviation was used to analyse the findings of
the study.
3.2 Study Area
This research was conducted in Seventh Day Adventist churches in Kenya. According to the
statistic from 18 Business Managers of the SDA organizations in Kenya through their audited
financial statements for 2014-2016 fiscal years.
3.3 Population of the Study
The population of the study was 18 organizations consisting of 18 respondents in total.
According to the Seventh-Day Adventist Church Year Book (2011), there are eighteen
institutions which fall directly under the East African Union. The population of the study
consisted of 18 Business Managers of 18 (18) of the institutions. These institutions were a
representation of the administrative units and the service oriented institutions. These
institutions included Ranen Conference, Kenya Lake Conference, Greater Rift Valley
Conference, Kendu Adventist Hospital, Africa Herald Publishing House, Kamagambo
Adventist School &College, Central Nyanza Conference, North West Kenya Conference as
shown in table 3 .1 below.
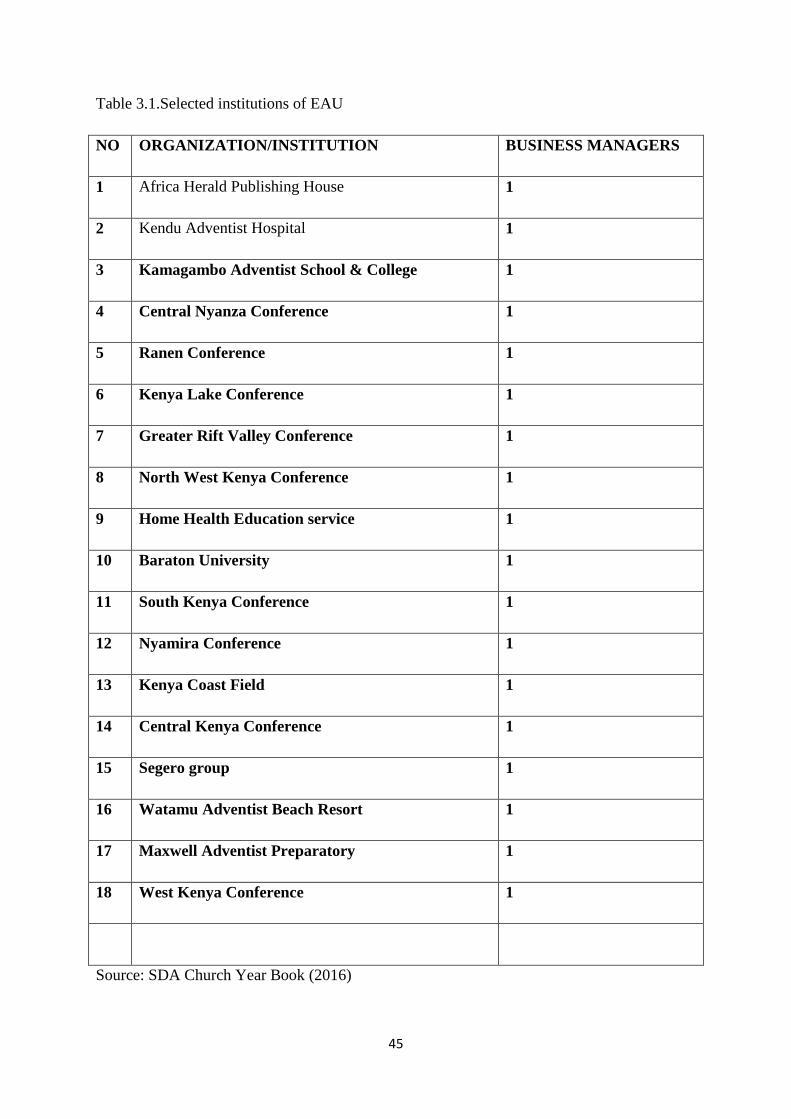
45
Table 3.1.Selected institutions of EAU
NO ORGANIZATION/INSTITUTION BUSINESS MANAGERS
1 Africa Herald Publishing House 1
2 Kendu Adventist Hospital 1
3 Kamagambo Adventist School & College 1
4 Central Nyanza Conference 1
5 Ranen Conference 1
6 Kenya Lake Conference 1
7 Greater Rift Valley Conference 1
8 North West Kenya Conference 1
9 Home Health Education service 1
10 Baraton University 1
11 South Kenya Conference 1
12 Nyamira Conference 1
13 Kenya Coast Field 1
14 Central Kenya Conference 1
15 Segero group 1
16 Watamu Adventist Beach Resort 1
17 Maxwell Adventist Preparatory 1
18 West Kenya Conference 1
Source: SDA Church Year Book (2016)
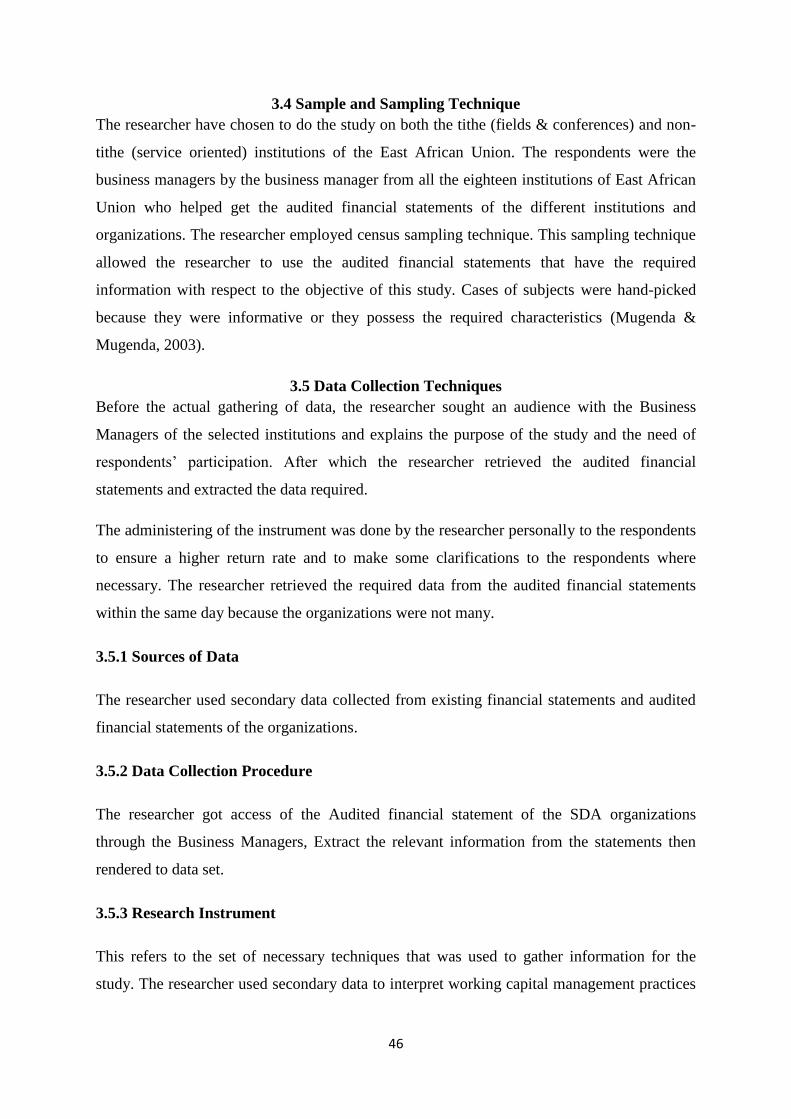
46
3.4 Sample and Sampling Technique
The researcher have chosen to do the study on both the tithe (fields & conferences) and non-
tithe (service oriented) institutions of the East African Union. The respondents were the
business managers by the business manager from all the eighteen institutions of East African
Union who helped get the audited financial statements of the different institutions and
organizations. The researcher employed census sampling technique. This sampling technique
allowed the researcher to use the audited financial statements that have the required
information with respect to the objective of this study. Cases of subjects were hand-picked
because they were informative or they possess the required characteristics (Mugenda &
Mugenda, 2003).
3.5 Data Collection Techniques
Before the actual gathering of data, the researcher sought an audience with the Business
Managers of the selected institutions and explains the purpose of the study and the need of
respondents’ participation. After which the researcher retrieved the audited financial
statements and extracted the data required.
The administering of the instrument was done by the researcher personally to the respondents
to ensure a higher return rate and to make some clarifications to the respondents where
necessary. The researcher retrieved the required data from the audited financial statements
within the same day because the organizations were not many.
3.5.1 Sources of Data
The researcher used secondary data collected from existing financial statements and audited
financial statements of the organizations.
3.5.2 Data Collection Procedure
The researcher got access of the Audited financial statement of the SDA organizations
through the Business Managers, Extract the relevant information from the statements then
rendered to data set.
3.5.3 Research Instrument
This refers to the set of necessary techniques that was used to gather information for the
study. The researcher used secondary data to interpret working capital management practices
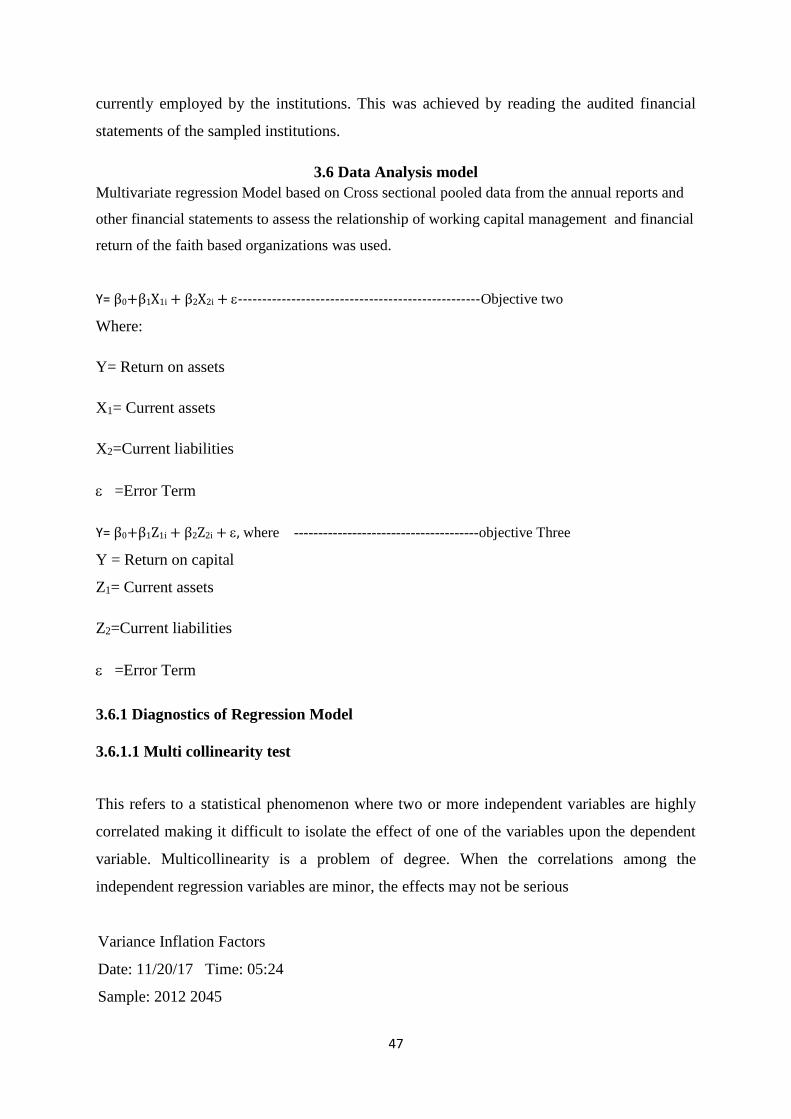
47
currently employed by the institutions. This was achieved by reading the audited financial
statements of the sampled institutions.
3.6 Data Analysis model
Multivariate regression Model based on Cross sectional pooled data from the annual reports and
other financial statements to assess the relationship of working capital management and financial
return of the faith based organizations was used.
Y= β0+β1X1i + β2X2i + --------------------------------------------------Objective two
Where:
Y= Return on assets
X1= Current assets
X2=Current liabilities
=Error Term
Y= β0+β1Z1i + β2Z2i + , where --------------------------------------objective Three
Y = Return on capital
Z1= Current assets
Z2=Current liabilities
=Error Term
3.6.1 Diagnostics of Regression Model
3.6.1.1 Multi collinearity test
This refers to a statistical phenomenon where two or more independent variables are highly
correlated making it difficult to isolate the effect of one of the variables upon the dependent
variable. Multicollinearity is a problem of degree. When the correlations among the
independent regression variables are minor, the effects may not be serious
Variance Inflation Factors
Date: 11/20/17 Time: 05:24
Sample: 2012 2045
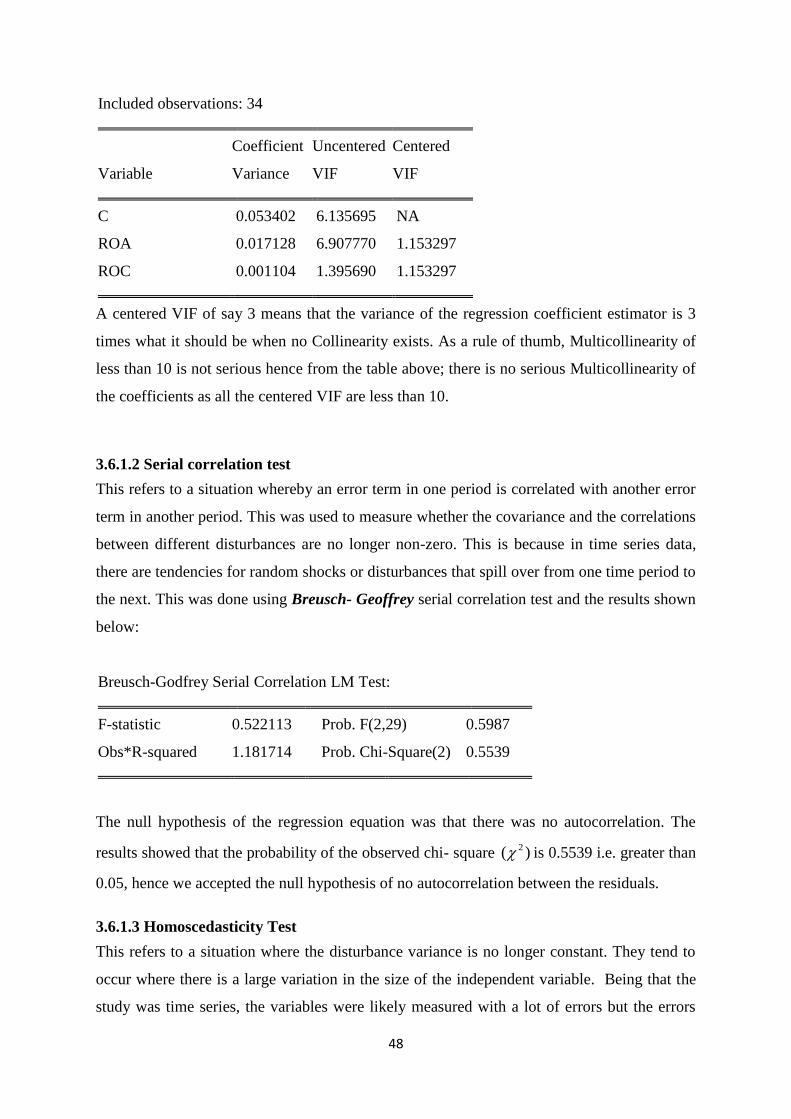
48
Included observations: 34
Coefficient Uncentered Centered
Variable Variance VIF VIF
C 0.053402 6.135695 NA
ROA 0.017128 6.907770 1.153297
ROC 0.001104 1.395690 1.153297
A centered VIF of say 3 means that the variance of the regression coefficient estimator is 3
times what it should be when no Collinearity exists. As a rule of thumb, Multicollinearity of
less than 10 is not serious hence from the table above; there is no serious Multicollinearity of
the coefficients as all the centered VIF are less than 10.
3.6.1.2 Serial correlation test
This refers to a situation whereby an error term in one period is correlated with another error
term in another period. This was used to measure whether the covariance and the correlations
between different disturbances are no longer non-zero. This is because in time series data,
there are tendencies for random shocks or disturbances that spill over from one time period to
the next. This was done using Breusch- Geoffrey serial correlation test and the results shown
below:
Breusch-Godfrey Serial Correlation LM Test:
F-statistic 0.522113 Prob. F(2,29) 0.5987
Obs*R-squared 1.181714 Prob. Chi-Square(2) 0.5539
The null hypothesis of the regression equation was that there was no autocorrelation. The
results showed that the probability of the observed chi- square )( 2 is 0.5539 i.e. greater than
0.05, hence we accepted the null hypothesis of no autocorrelation between the residuals.
3.6.1.3 Homoscedasticity Test
This refers to a situation where the disturbance variance is no longer constant. They tend to
occur where there is a large variation in the size of the independent variable. Being that the
study was time series, the variables were likely measured with a lot of errors but the errors
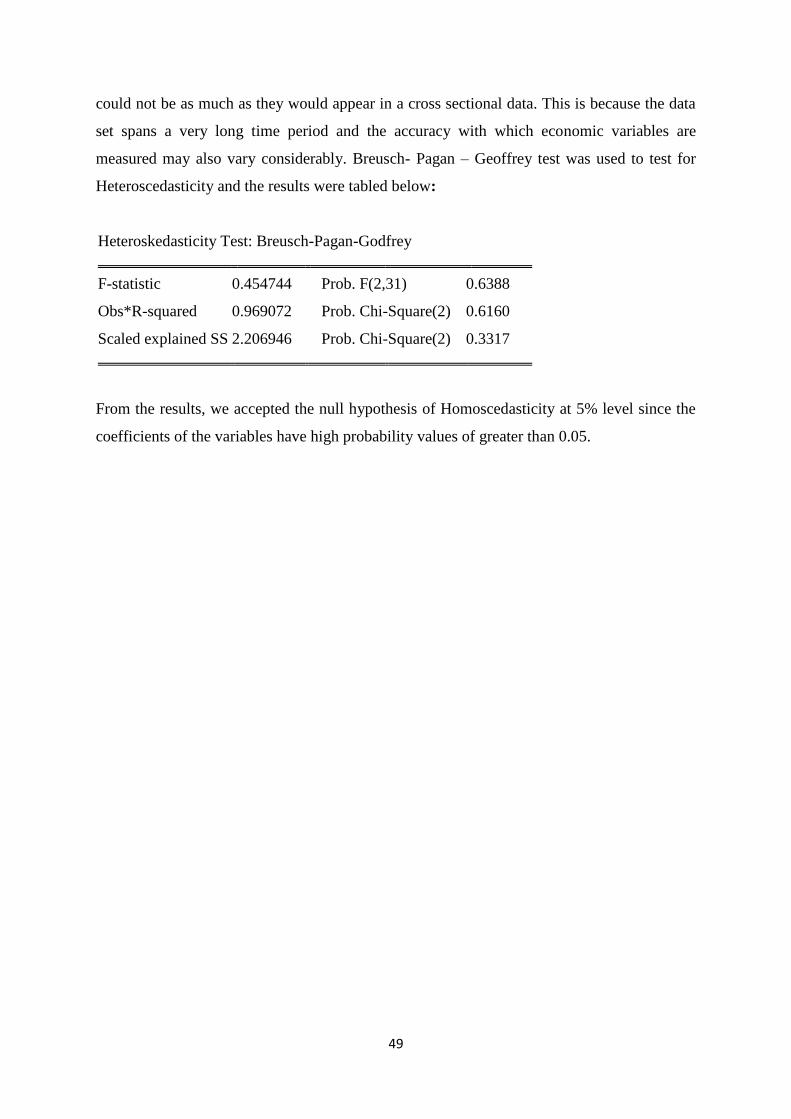
49
could not be as much as they would appear in a cross sectional data. This is because the data
set spans a very long time period and the accuracy with which economic variables are
measured may also vary considerably. Breusch- Pagan – Geoffrey test was used to test for
Heteroscedasticity and the results were tabled below:
Heteroskedasticity Test: Breusch-Pagan-Godfrey
F-statistic 0.454744 Prob. F(2,31) 0.6388
Obs*R-squared 0.969072 Prob. Chi-Square(2) 0.6160
Scaled explained SS 2.206946 Prob. Chi-Square(2) 0.3317
From the results, we accepted the null hypothesis of Homoscedasticity at 5% level since the
coefficients of the variables have high probability values of greater than 0.05.
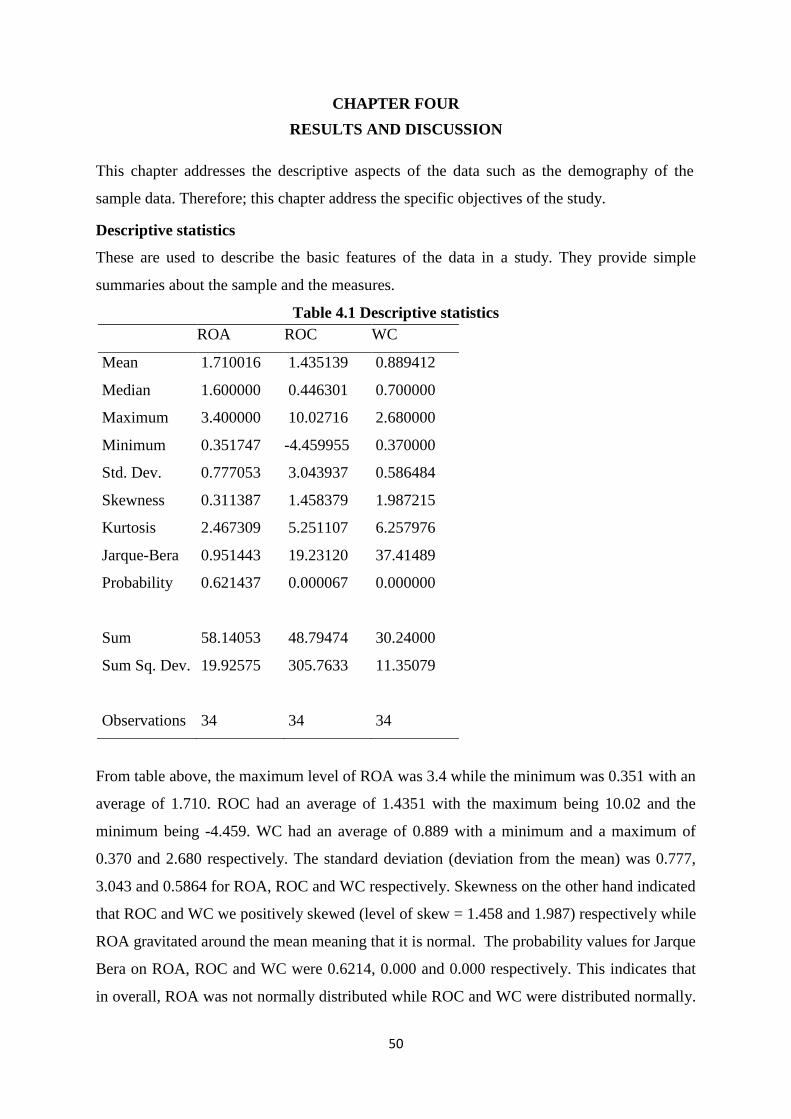
50
CHAPTER FOUR
RESULTS AND DISCUSSION
This chapter addresses the descriptive aspects of the data such as the demography of the
sample data. Therefore; this chapter address the specific objectives of the study.
Descriptive statistics
These are used to describe the basic features of the data in a study. They provide simple
summaries about the sample and the measures.
Table 4.1 Descriptive statistics
ROA ROC WC
Mean 1.710016 1.435139 0.889412
Median 1.600000 0.446301 0.700000
Maximum 3.400000 10.02716 2.680000
Minimum 0.351747 -4.459955 0.370000
Std. Dev. 0.777053 3.043937 0.586484
Skewness 0.311387 1.458379 1.987215
Kurtosis 2.467309 5.251107 6.257976
Jarque-Bera 0.951443 19.23120 37.41489
Probability 0.621437 0.000067 0.000000
Sum 58.14053 48.79474 30.24000
Sum Sq. Dev. 19.92575 305.7633 11.35079
Observations 34 34 34
From table above, the maximum level of ROA was 3.4 while the minimum was 0.351 with an
average of 1.710. ROC had an average of 1.4351 with the maximum being 10.02 and the
minimum being -4.459. WC had an average of 0.889 with a minimum and a maximum of
0.370 and 2.680 respectively. The standard deviation (deviation from the mean) was 0.777,
3.043 and 0.5864 for ROA, ROC and WC respectively. Skewness on the other hand indicated
that ROC and WC we positively skewed (level of skew = 1.458 and 1.987) respectively while
ROA gravitated around the mean meaning that it is normal. The probability values for Jarque
Bera on ROA, ROC and WC were 0.6214, 0.000 and 0.000 respectively. This indicates that
in overall, ROA was not normally distributed while ROC and WC were distributed normally.
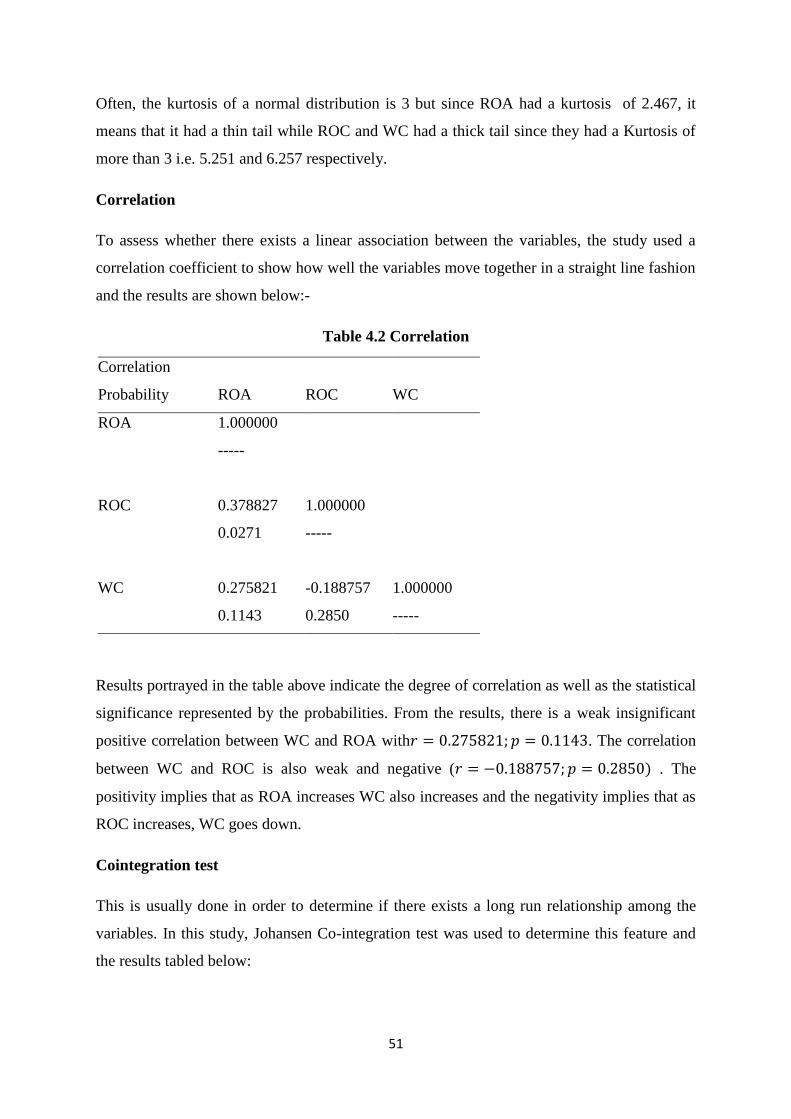
51
Often, the kurtosis of a normal distribution is 3 but since ROA had a kurtosis of 2.467, it
means that it had a thin tail while ROC and WC had a thick tail since they had a Kurtosis of
more than 3 i.e. 5.251 and 6.257 respectively.
Correlation
To assess whether there exists a linear association between the variables, the study used a
correlation coefficient to show how well the variables move together in a straight line fashion
and the results are shown below:-
Table 4.2 Correlation
Correlation
Probability ROA ROC WC
ROA 1.000000
-----
ROC 0.378827 1.000000
0.0271 -----
WC 0.275821 -0.188757 1.000000
0.1143 0.2850 -----
Results portrayed in the table above indicate the degree of correlation as well as the statistical
significance represented by the probabilities. From the results, there is a weak insignificant
positive correlation between WC and ROA with𝑟 = 0.275821; 𝑝 = 0.1143. The correlation
between WC and ROC is also weak and negative (𝑟 = −0.188757; 𝑝 = 0.2850) . The
positivity implies that as ROA increases WC also increases and the negativity implies that as
ROC increases, WC goes down.
Cointegration test
This is usually done in order to determine if there exists a long run relationship among the
variables. In this study, Johansen Co-integration test was used to determine this feature and
the results tabled below:
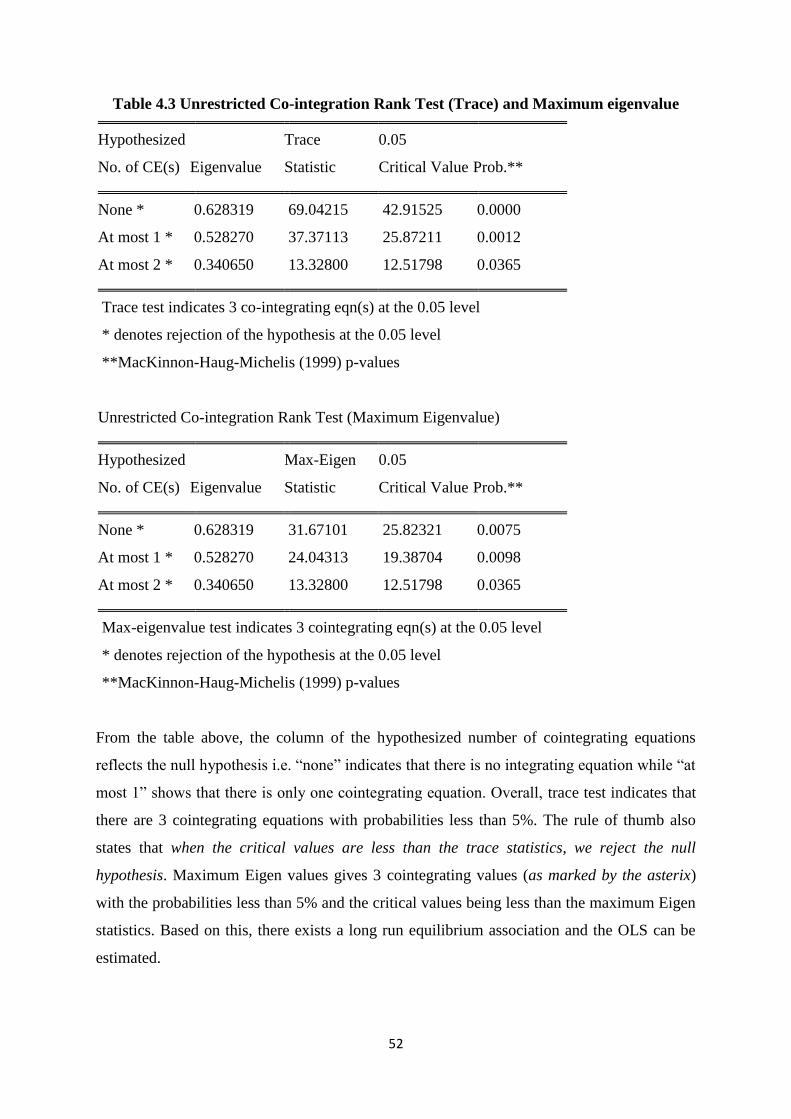
52
Table 4.3 Unrestricted Co-integration Rank Test (Trace) and Maximum eigenvalue
Hypothesized Trace 0.05
No. of CE(s) Eigenvalue Statistic Critical Value Prob.**
None * 0.628319 69.04215 42.91525 0.0000
At most 1 * 0.528270 37.37113 25.87211 0.0012
At most 2 * 0.340650 13.32800 12.51798 0.0365
Trace test indicates 3 co-integrating eqn(s) at the 0.05 level
* denotes rejection of the hypothesis at the 0.05 level
**MacKinnon-Haug-Michelis (1999) p-values
Unrestricted Co-integration Rank Test (Maximum Eigenvalue)
Hypothesized Max-Eigen 0.05
No. of CE(s) Eigenvalue Statistic Critical Value Prob.**
None * 0.628319 31.67101 25.82321 0.0075
At most 1 * 0.528270 24.04313 19.38704 0.0098
At most 2 * 0.340650 13.32800 12.51798 0.0365
Max-eigenvalue test indicates 3 cointegrating eqn(s) at the 0.05 level
* denotes rejection of the hypothesis at the 0.05 level
**MacKinnon-Haug-Michelis (1999) p-values
From the table above, the column of the hypothesized number of cointegrating equations
reflects the null hypothesis i.e. “none” indicates that there is no integrating equation while “at
most 1” shows that there is only one cointegrating equation. Overall, trace test indicates that
there are 3 cointegrating equations with probabilities less than 5%. The rule of thumb also
states that when the critical values are less than the trace statistics, we reject the null
hypothesis. Maximum Eigen values gives 3 cointegrating values (as marked by the asterix)
with the probabilities less than 5% and the critical values being less than the maximum Eigen
statistics. Based on this, there exists a long run equilibrium association and the OLS can be
estimated.
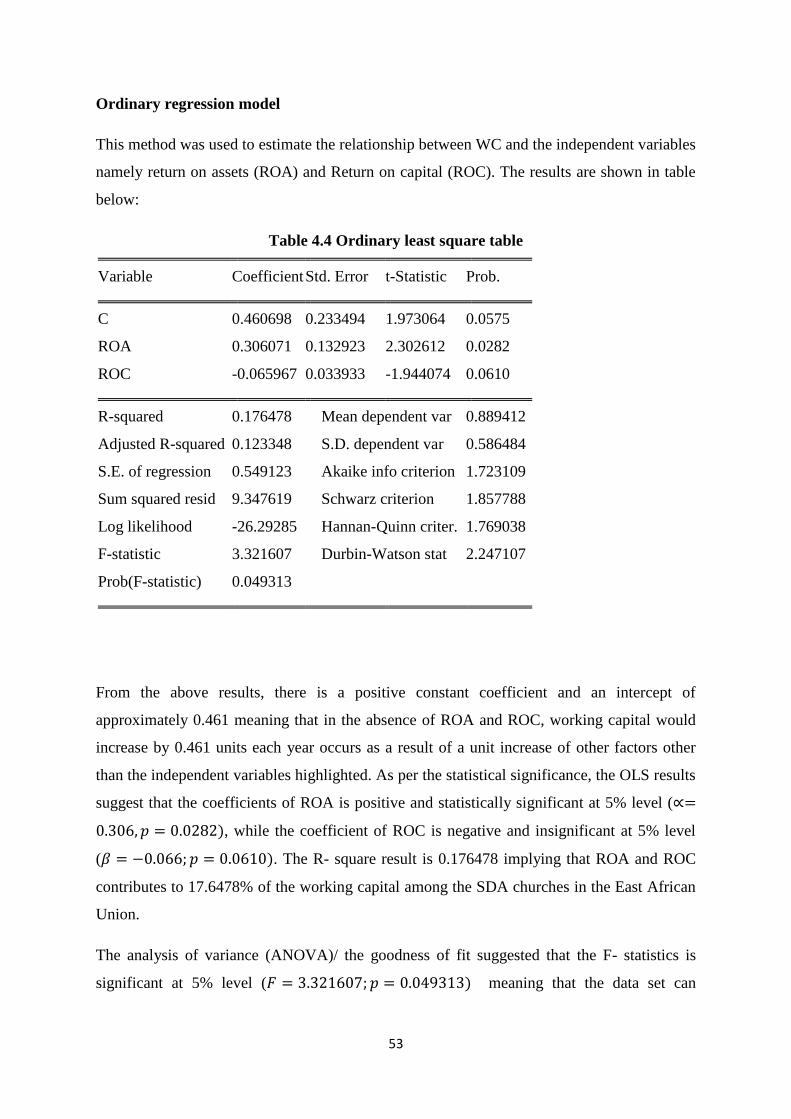
53
Ordinary regression model
This method was used to estimate the relationship between WC and the independent variables
namely return on assets (ROA) and Return on capital (ROC). The results are shown in table
below:
Table 4.4 Ordinary least square table
Variable Coefficient Std. Error t-Statistic Prob.
C 0.460698 0.233494 1.973064 0.0575
ROA 0.306071 0.132923 2.302612 0.0282
ROC -0.065967 0.033933 -1.944074 0.0610
R-squared 0.176478 Mean dependent var 0.889412
Adjusted R-squared 0.123348 S.D. dependent var 0.586484
S.E. of regression 0.549123 Akaike info criterion 1.723109
Sum squared resid 9.347619 Schwarz criterion 1.857788
Log likelihood -26.29285 Hannan-Quinn criter. 1.769038
F-statistic 3.321607 Durbin-Watson stat 2.247107
Prob(F-statistic) 0.049313
From the above results, there is a positive constant coefficient and an intercept of
approximately 0.461 meaning that in the absence of ROA and ROC, working capital would
increase by 0.461 units each year occurs as a result of a unit increase of other factors other
than the independent variables highlighted. As per the statistical significance, the OLS results
suggest that the coefficients of ROA is positive and statistically significant at 5% level (∝=
0.306, 𝑝 = 0.0282), while the coefficient of ROC is negative and insignificant at 5% level
(𝛽 = −0.066; 𝑝 = 0.0610). The R- square result is 0.176478 implying that ROA and ROC
contributes to 17.6478% of the working capital among the SDA churches in the East African
Union.
The analysis of variance (ANOVA)/ the goodness of fit suggested that the F- statistics is
significant at 5% level (𝐹 = 3.321607; 𝑝 = 0.049313) meaning that the data set can
54
explain the entire population. The Durbin Watson statistics rotates around 2 (coefficient =
2.247107) meaning that there is no problem of auto correlation.
The OLS equation can thus be written as follows:-
𝑊𝐶 = 0.461 + 0.306 𝑅𝑂𝐴 − 0.066 𝑅𝑂𝐶 + 𝜀
Objective one: Effect of working capital on ROA
The study seek to find the effect of working capital of ROA. According to the results in the
regression table above, there is a positive effect of Working capital on ROA. A unit change in
working capital leads to 0.306 increase in ROA. The effect is significant meaning that it
strongly affects ROA (p= 0.0282). The above findings concurs with the works of Jel (2014)
who investigated whether working capital management affect firm’s performance of non-
financial films listed in Pakistani, Kerachi stock exchange during 2007 to 2010. The findings
were that average age of inventory was positively related to gross profit margin and return on
assets but negatively related to return on equity with a significant relationship. The
relationship was insignificant but positive thus may be due to increased sales which reduce
inventory levels, hence profitability. It also concurs with the findings of the study by Onono
(2006) who sought to find out how credit management practices in the service industry with
specific reference to telecom Kenya limited. Their findings revealed that that efficient
management of accounts receivables improves cash flow which in return improves Return on
Capital. The works of Mutungi (2010) who investigated the relationship between working
capital management and financial performance of oil marketing firms registered in Kenya
with the petroleum institute of east Africa within Nairobi and its environs was in line with the
findings of the current study The research noted that working capital management decisions
have effects on the company’s risk return as well as share price. The study revealed that in
order for a company to operate effectively, receivables and inventory must be monitored and
controlled properly. The effect of having adequate level of working capital for the growth and
sustainability of a firm is therefore concluded to be fundamental.
The work of Chatraji (2010) contradicted the findings of this study. They carried out a study
on the impact of working capital management on profitability in companies listed in London
stock exchange between 2006 and 2008. Their results indicated a negative relationship
between working capital management and profitability. It therefore means that an increase in
55
cash transformational cycle would result in a reduction in profitability. The study also
revealed a negative relationship between liquidity and profitability.
Objective two: effect of working capital on ROC
The study seeks to find the effect of working capital of ROC. According to the results in the
regression table above, there is a negative effect of Working capital on ROC. A unit change
in working capital leads to -0.66 increase in ROC. The effect is insignificant meaning that it
does not strongly affects ROC (p= 0.0610).The results above are in negates the assertions of
Pandey, (2000) who said that a study on working capital management and return on capital is
an all important function of the financial manager if the business is to survive in the midst of
intense competition and make profit. He further clarified that the effective and efficient
management of working capital will therefore have favourable impact on both short-run and
long-run organizational goals and objectives of the firm one of which is profit maximization.
However, both excessive as well as inadequate working capital positions are dangerous from
the firm’s point of view.
Although the study observed an insignificant probability, the aspect of negativity conforms to
Truel and Solano (2007) conducted a study and observed also a negative relationship between
profitability of a company and cash conversion cycle. Their finding was that there is a
possibility of increasing company profitability by means of a more efficient working capital
management. They went further to assert that for this to be realized, it is important that main
components of cash conversion cycle for example short-term trade liabilities, short-term
accounts receivable and inventories must be managed in such a way that it maximizes a
firm’s profitability. They concluded that an efficient working capital management increases
free cash flows to the company’s growth opportunities and return of stockholders
.
56
CHAPTER FIVE
SUMMARY, CONCLUSIONS AND RECOMMENDATIONS
This chapter summarizes the results of the study and reports the conclusion drawn. In
addition, practical contributions of the study are discussed together with observed limitations.
The chapter concludes by providing potential avenues for further research.
5.1 Summary of Findings
Objective one sought to determine the effect of working capital management on return on
assets of Seventh Day Adventist Institutions in East African Union. The results showed that
the effect of working capital on ROA was positive and significant. This implied that as the
working capital increases, ROA also increases.
The second objective sought to determine the effect of working capital management on return
on capital of Seventh Day Adventist Institutions in East African Union. However, the results
indicated that there was an insignificant negative effect of Working capital on ROC.
5.2 Conclusions of the study
From the findings it can be concluded that within the Seventh Day Adventist Institutions in
east African union, working capital significantly affects ROA but not ROC.
5.3 Recommendations of the Study
Based on the conclusions of the objective one and two, it is recommended that for better
enhancement of financial return among Seventh Day Adventist Institutions in East African
Region, emphasis should be pegged upon ROA as this is seen to be favourable to their
existing structure of the working capital.
5.4 Limitations of the Study
The term limitation as used in the context of this study implies limiting conditions or
restrictive weaknesses encountered in the conduct of the research (Mutua, 2006). A number
of limitations were identified in the conduct of this research. The study limited its
investigation to nonprofit making organization (SDA institutions) which compromises its
global generalizability. Therefore the study advises the readers to restrict generalization of
the results within this industry otherwise outside the industry may give totally different
results.

57
5.5 Suggestions for Further Research
The results indicated that the R-square was 0.1764% meaning that working capital explained
only 17.64% of ROA and ROC combined. This means that there are other determinants of
ROA and ROC that this study did not look into. It is therefore the suggestion of this study
that other factors that may have an effect on ROA and ROC be included to make the
regression more robust.
58
REFERENCES
Abel, M. (2008). The impact of working capital management on cash holdings: A
Quantitative study of swedish manufacturing smes.
Afza, T., & Nazir, M. S. (2008). Working capital approaches and firm’s returns. Pakistan
Journal of Commerce and Social Sciences, 1(1), 25-36.
Arnold, G. (2008). Corporate financial management (4th ed.): FinancialTimes/Prentice Hall.
Auerbach, C., & Silverstein, L. (2003). Qualitative data: An introduction to coding and
analysis (1 ed.): NYU press.
Bacani, C. (2007).The big squeeze. Retrieved November, 12 2012 from
http://www.cfoasia.com/archives/200709-09.htm
Baily, M. N., & Elliot, D. (2013). The role of finance in the economy: implications for
structural reform of the financial sector. The Brookings Institution.
Baker, H.K, & Powell. G (2005). Understanding financial management: A practical guide (1
ed.). Malden, Malden, MA: Wiley Blackwell.
Bazeley, P., & Jackson, K. (Eds.). (2013). Qualitative data analysis with NVivo. Sage
Publications Limited.
Beneda, N. Zhang, Y. (2008). Working Capital Management, Growth and Performance
of New Public Companies, Credit & Financial Management Review.
Birt, J., Chalmers, K., Brooks, A., Byrne, S., & Oliver, J. (2011). Accounting: Business
reporting for decision making (3rd ed.). Milton, Australia: John Wiley & Sons.
Birt, J., Chalmers, K., Beal, D., Brooks, A., Byrne, S., & Oliver, J. (2008). Accounting:
Business reporting for decision making. John Wiley & Sons Australia, Ltd..
Brigham, E. F., &Ehrhardt, M. C (2005). Financial Management: Theory and practice (11th
ed.): Thomson: South Western.
Brigham, E. F., &Ehrhardt, M. C. (2010). Financial management: Theory and practice (13th
ed.): South-Western Pub.
Chandra, P. (2008). Financial Management (7th ed.). West Padel Nagar, New Delhi: Tata
McGraw-Hill.
Cinnamon, R., Helweg-Larsen, B., & Cinnamon, P. (2010). How to Understand Business
Finance: Understand the Business Cycle; Manage Your Assets;
Collis, J., & Hussey, R. (2003). Business research: A practical guide for Postgraduate and
undergraduate students (2nd ed.). New York: Palgrave Macmillan.
59
Collis, J., & Hussey, R.(2009). Business research: A practical guide for Undergraduate and
postgraduate students (3rd ed.). New York: Palgrave Macmillan.
Deloof, M. (2003). Does working capital management affect profitability of Belgian firms?.
Journal of business finance & accounting, 30(3‐4), 573-588.
Dong, H.,&Su,J. (2010). The relationship between working capital m profitability: AVietnam
case. International Research Journal of Finance and management and Economics
(49), 59-67.
Eljelly, A. (2004). Liquidity-profitability tradeoff: An empirical investigation in an Emerging
market. International Journal of Commerce and Management, 14(2), 48-61.
Filbeck, G., & Krueger, T. (2005). Industry related differences in working capital
management. Mid-American Journal of Business, 20(2), 11-18.
Gill, A. (2011). Factors that influence working capital requirements in Canada. Economics
and Finance Review, 1(3), 30-40.
Gill, A., Biger, N., & Mathur, N. (2010). The relationship between working capital
management and profitability: Evidence from the United States. Business and
Economics Journal, 10(1), 1-9.
Gitman, L. J. (2009). Principles of Managerial finance (12th ed.). Bostos, MA: Pearson
Prentice Hall.
Harris, A. (2005). Working capital management: difficult, but rewarding. Financial
Executive, 21(4), 52-54.
Karger, J., & Blumenthal, R. A. (1994). Leverage impact of working capital in small
business. TMA Journal, 14(6), 46-53.
Kouma, G. (2001). Working Capital Management in Health Care. [email protected]. (5)
76-89.
Makridakis, S., & Wheelwright, S. C. (1978). Interactive forecasting univariate and
multivariate methods. California: Holden-Day Inc.
Maradi, M., Salehi, M., & Arianpoor, A. (2012). A comparison of working capital
management of chemical and medicine listed companies in Tehran Stock
Exchange. International Journal of Business and Behavioral Science, 2 (5), 62-78.
Mathuva, D.M. (2010). Influence of working capital management components on corporate
profitability: A survey on Kenyan listed firms. Research Journal of Business
Management 3 (1),
Mugenda O.M &Mugenda A.G. (2003). Research Methods. Nairobi: ACTS Press.
60
Mukhopadhyay, D. (2004). Working Capital Management in Heavy Engineering Firms—A
Case Study.Accessed from myicwai.com/knowledgebank/fm48.
Nazir, M. S., & Afza, T. (2009). Impact of aggressive working capital management policy on
firms' profitability. IUP Journal of Applied Finance, 15(8), 19.
Pandey,I.M.,(2011).Financial Management. (10th ed.): New Delhi:Vikas PublishingHouse
PVT Ltd.
Preve, L., &Sarria-Allende,V. (2010). Working Capital Management: Oxford University
Press.
Raheman, A., & Nasr, M. (2007). Working capital management and profitability–case of
Pakistani firms. International review of business research papers, 3(1), 279-300.
Raheman, A., & Nasr, M. (2007). Working capital management and profitability–case of
Pakistani firms. International review of business research papers, 3(1), 279-300.
Raheman, A., Afza, T., Qayyum, A., & Bodla, M.A. (2010). Working Capital Management
and corporate perfomance of Manufacturing Sector in Pakistan. International
Research Journal of Finance and Economics, Issue 47, 151-163.
Samiloglu, F., & Demirgunes, K. (2008). The effect of working capital management on firm
profitability: Evidence from Turkey. The International Journal of Applied
Economics and Finance, 2(1), 44–50.
SDA Working Policy (2010)
Sharma, A. K., & Kumar, S. (2011). Effect of working capital management on firm
profitability: Empirical evidence from India. Global Business Review, 12(1), 159-
173.
Shin, H. H., & Soenen, L. (1998). Efficiency of working capital management and corporate
profitability. Financial practice and education, 8(2), 37-45.
Shiundu, J. A. (2008). Research methods in education: A course for postgraduate studies.
Unpublished handbook for research methods. Nairobi.
Smith, K. (1980). Profitability versus liquidity tradeoffs in working capital management.
Readings on the management of working capital, 549-562.
Van Horne, J.,&Wachowicz, J. (2008). Fundamentals of financial management (13th ed.):
Pearson Education.
Vataliya, K. S. (2008). Management of Working Capital: Analysis, Planning and Control.
Paradise Publishers.

61
Zariyawati, M. A., Annuar, M. N., Taufiq, H., & Rahim, A. A. (2009). Working capital
management and corporate performance: Case of Malaysia. Journal of Modern
Accounting and Auditing, 5(11), 47.
Zietlow, J., Hankin, J., &Seidner, A. (2007). Financial management for nonprofit
Organization : Policies and practices (1st ed.). Hoboken, NJ: Wiley.
62
APPENDICES
APPENDIX I: INTRODUCTORY LETTER
Department of Accounting and finance
School of Business and Economics
Maseno University
P.O BOX 333-10100,
Maseno/Kenya
Dear Sir/Madam
RE: REQUEST FOR RESEARCH DATA
I am a masters student at Maseno University –Kisumu Town Campus pursuing a course
leading to award of master’s in Business Administration in Partial fulfillment of the
requirement of this course; I am conducting a study on the relationship of working capital
management and financial return of SDA churches in East African Union, Kenya. I Therefore
kindly request you to assist by completing the attached questionairs to the best of your
knowledge.
The information required is purely of academic purposes and will be treated with a lot of
confidentiality. A copy of the findings of this study will be made to you upon your request.
Thanks for your cooperation.
Yours faithfully
Onduru Rehema Akinyi
Signature……………………………
Date…………………………………

63
DATA SET
organization Inventory Acc
payable
Acc
receivable
Cash suplu
s
capit
al
Asset
Baraton
university
2014
2015
2016
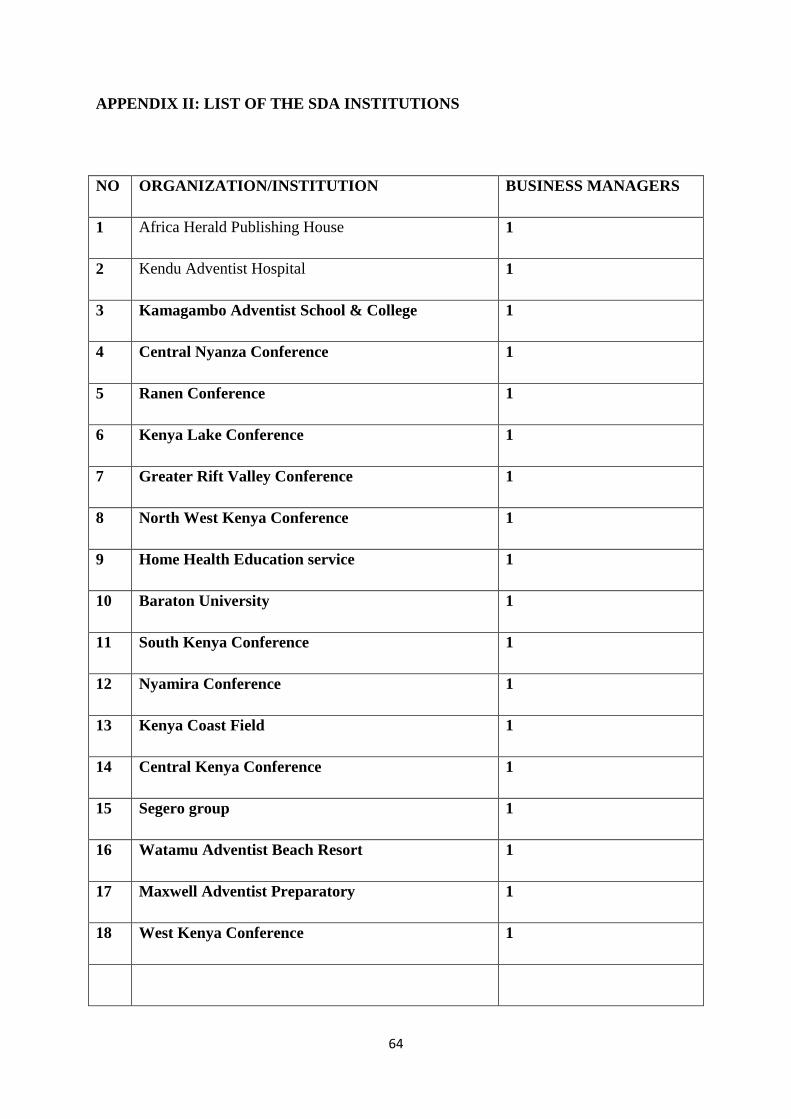
64
APPENDIX II: LIST OF THE SDA INSTITUTIONS
NO ORGANIZATION/INSTITUTION BUSINESS MANAGERS
1 Africa Herald Publishing House 1
2 Kendu Adventist Hospital 1
3 Kamagambo Adventist School & College 1
4 Central Nyanza Conference 1
5 Ranen Conference 1
6 Kenya Lake Conference 1
7 Greater Rift Valley Conference 1
8 North West Kenya Conference 1
9 Home Health Education service 1
10 Baraton University 1
11 South Kenya Conference 1
12 Nyamira Conference 1
13 Kenya Coast Field 1
14 Central Kenya Conference 1
15 Segero group 1
16 Watamu Adventist Beach Resort 1
17 Maxwell Adventist Preparatory 1
18 West Kenya Conference 1
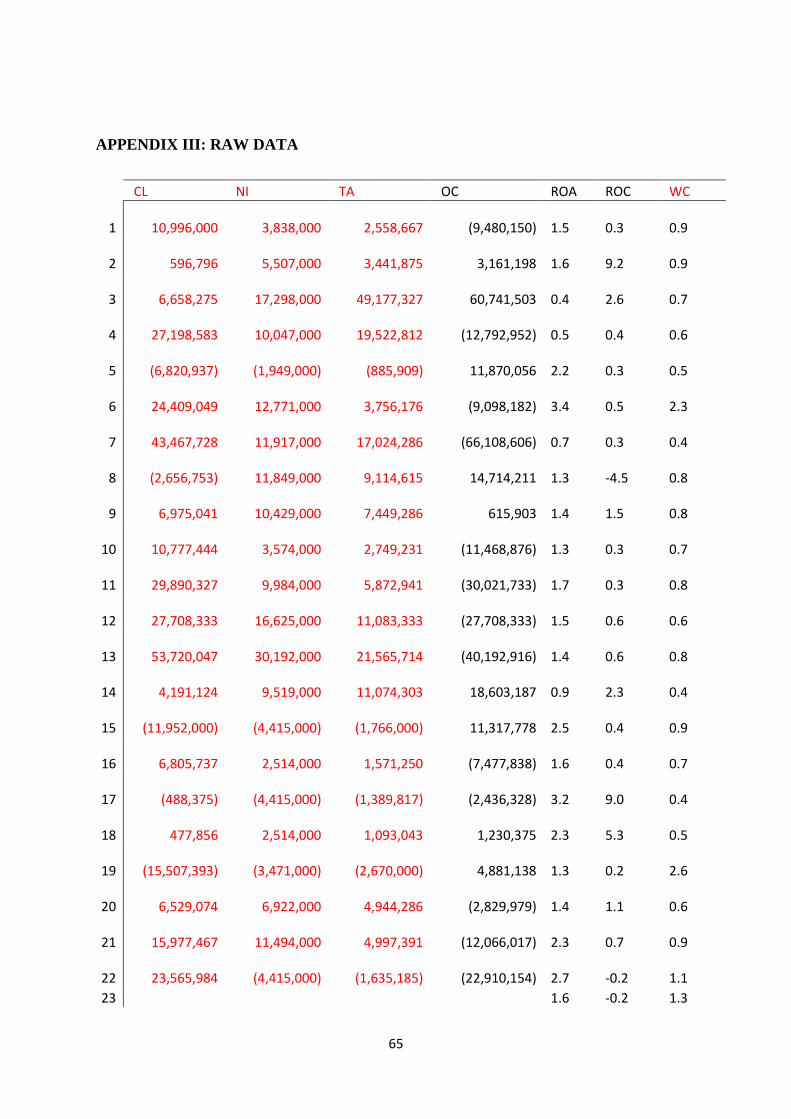
65
APPENDIX III: RAW DATA
CL NI TA OC ROA ROC WC
1
10,996,000
3,838,000
2,558,667
(9,480,150) 1.5 0.3 0.9
2
596,796
5,507,000
3,441,875
3,161,198 1.6 9.2 0.9
3
6,658,275
17,298,000
49,177,327
60,741,503 0.4 2.6 0.7
4
27,198,583
10,047,000
19,522,812
(12,792,952) 0.5 0.4 0.6
5
(6,820,937)
(1,949,000)
(885,909)
11,870,056 2.2 0.3 0.5
6
24,409,049
12,771,000
3,756,176
(9,098,182) 3.4 0.5 2.3
7
43,467,728
11,917,000
17,024,286
(66,108,606) 0.7 0.3 0.4
8
(2,656,753)
11,849,000
9,114,615
14,714,211 1.3 -4.5 0.8
9
6,975,041
10,429,000
7,449,286
615,903 1.4 1.5 0.8
10
10,777,444
3,574,000
2,749,231
(11,468,876) 1.3 0.3 0.7
11
29,890,327
9,984,000
5,872,941
(30,021,733) 1.7 0.3 0.8
12
27,708,333
16,625,000
11,083,333
(27,708,333) 1.5 0.6 0.6
13
53,720,047
30,192,000
21,565,714
(40,192,916) 1.4 0.6 0.8
14
4,191,124
9,519,000
11,074,303
18,603,187 0.9 2.3 0.4
15
(11,952,000)
(4,415,000)
(1,766,000)
11,317,778 2.5 0.4 0.9
16
6,805,737
2,514,000
1,571,250
(7,477,838) 1.6 0.4 0.7
17
(488,375)
(4,415,000)
(1,389,817)
(2,436,328) 3.2 9.0 0.4
18
477,856
2,514,000
1,093,043
1,230,375 2.3 5.3 0.5
19
(15,507,393)
(3,471,000)
(2,670,000)
4,881,138 1.3 0.2 2.6
20
6,529,074
6,922,000
4,944,286
(2,829,979) 1.4 1.1 0.6
21
15,977,467
11,494,000
4,997,391
(12,066,017) 2.3 0.7 0.9
22
23,565,984
(4,415,000)
(1,635,185)
(22,910,154) 2.7 -0.2 1.1
23 1.6 -0.2 1.3
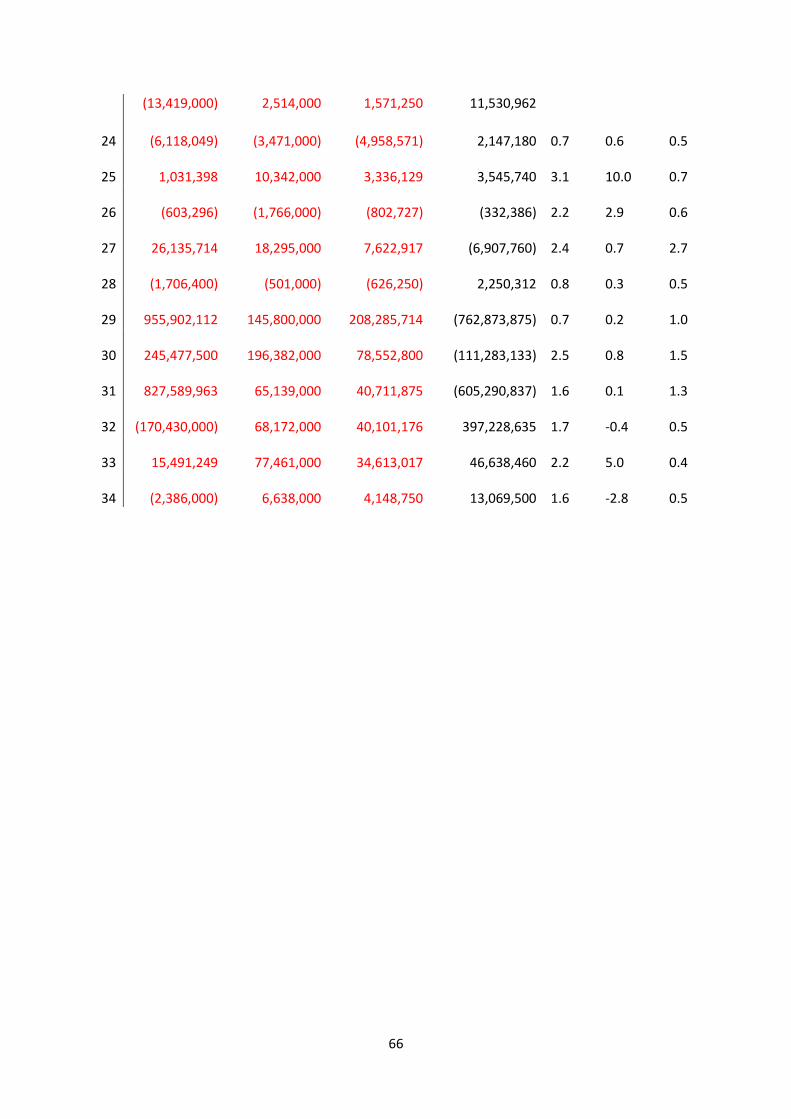
66
(13,419,000) 2,514,000 1,571,250 11,530,962
24
(6,118,049)
(3,471,000)
(4,958,571)
2,147,180 0.7 0.6 0.5
25
1,031,398
10,342,000
3,336,129
3,545,740 3.1 10.0 0.7
26
(603,296)
(1,766,000)
(802,727)
(332,386) 2.2 2.9 0.6
27
26,135,714
18,295,000
7,622,917
(6,907,760) 2.4 0.7 2.7
28
(1,706,400)
(501,000)
(626,250)
2,250,312 0.8 0.3 0.5
29
955,902,112
145,800,000
208,285,714
(762,873,875) 0.7 0.2 1.0
30
245,477,500
196,382,000
78,552,800
(111,283,133) 2.5 0.8 1.5
31
827,589,963
65,139,000
40,711,875
(605,290,837) 1.6 0.1 1.3
32
(170,430,000)
68,172,000
40,101,176
397,228,635 1.7 -0.4 0.5
33
15,491,249
77,461,000
34,613,017
46,638,460 2.2 5.0 0.4
34
(2,386,000)
6,638,000
4,148,750
13,069,500 1.6 -2.8 0.5