Relationship Between Organizational Justice and ...
13
International Journal of Occupational Safety and Ergonomics (JOSE) 2014, Vol. 20, No. 2, 199–211 Correspondence should be sent to Seth Ayim Gyekye, Department of Psychology, Sheffield Hallam University, Collegiate Campus, Sheffield, S10 2BP, UK. E-mail: [email protected]. 199 Relationship Between Organizational Justice and Organizational Safety Climate: Do Fairness Perceptions Influence Employee Safety Behaviour? Seth Ayim Gyekye Department of Psychology, Buckinghamshire New University, High Wycombe, UK Mohammad Haybatollahi Department of Real Estate, Planning and Geoinformatics, Aalto University Espoo, Aalto, Finland This study investigated the relationships between organizational justice, organizational safety climate, job satisfaction, safety compliance and accident frequency. Ghanaian industrial workers participated in the study (N = 320). Safety climate and justice perceptions were assessed with Hayes, Parender, Smecko, et al.’s (1998) and Blader and Tyler’s (2003) scales respectively. A median split was performed to dichotomize participants into 2 categories: workers with positive and workers with negative justice perceptions. Confirmatory factors analysis confirmed the 5-factor structure of the safety scale. Regression analyses and t tests indicated that workers with positive fairness perceptions had constructive perspectives regarding workplace safety, expressed greater job satisfaction, were more compliant with safety policies and registered lower accident rates. These findings provide evidence that the perceived level of fairness in an organization is closely associ- ated with workplace safety perception and other organizational factors which are important for safety. The implications for safety research are discussed. organizational justice organizational safety climate perceived organizational support industrial accidents safety management 1. INTRODUCTION The impact of psychosocial work factors on organizational behaviour is well recognized in the organizational literature. Research has shown that employees develop a set of coherent perceptions and expectations based on the appraisals drawn from the social and organizational conditions in which they perform their assignments. These evaluations are technically referred to as organi- zational climate. According to Schneider, Bowen, Ehrhart, et al., “the sense people make of the pat- terns of experiences and behaviours they have, or other parties to the situation have, constitutes the climate of the situation” (p. 22) [1]. Organiza- tional safety climate is a subset of organizational climate. It denotes the shared perceptions of safety values, norms, beliefs, practices and princi- ples that workers have of their work environment [2]. For Neal and Griffin, it describes the “indi- vidual perceptions of policies, procedures and practices relating to safety in the workplace” (p. 946–7) [3]. Essentially, these perceptions reflect employees’ beliefs about the priority of organizational safety and consequently inform behaviour-outcome expectancies. Research reports along this line have shown positive corre- lations between safety climate and compliance
Transcript of Relationship Between Organizational Justice and ...
International Journal of Occupational Safety and Ergonomics (JOSE) 2014, Vol. 20, No. 2, 199–211
Correspondence should be sent to Seth Ayim Gyekye, Department of Psychology, Sheffield Hallam University, Collegiate Campus, Sheffield, S10 2BP, UK. E-mail: [email protected].
199
Relationship Between Organizational Justice and Organizational Safety Climate:
Do Fairness Perceptions Influence Employee Safety Behaviour?
Seth Ayim Gyekye
Department of Psychology, Buckinghamshire New University, High Wycombe, UK
Mohammad Haybatollahi
Department of Real Estate, Planning and Geoinformatics, Aalto University Espoo, Aalto, Finland
This study investigated the relationships between organizational justice, organizational safety climate, job satisfaction, safety compliance and accident frequency. Ghanaian industrial workers participated in the study (N = 320). Safety climate and justice perceptions were assessed with Hayes, Parender, Smecko, et al.’s (1998) and Blader and Tyler’s (2003) scales respectively. A median split was performed to dichotomize participants into 2 categories: workers with positive and workers with negative justice perceptions. Confirmatory factors analysis confirmed the 5-factor structure of the safety scale. Regression analyses and t tests indicated that workers with positive fairness perceptions had constructive perspectives regarding workplace safety, expressed greater job satisfaction, were more compliant with safety policies and registered lower accident rates. These findings provide evidence that the perceived level of fairness in an organization is closely associ-ated with workplace safety perception and other organizational factors which are important for safety. The implications for safety research are discussed.
organizational justice organizational safety climate perceived organizational support industrial accidents safety management
1. INTRODUCTION
The impact of psychosocial work factors on organizational behaviour is well recognized in the organizational literature. Research has shown that employees develop a set of coherent perceptions and expectations based on the appraisals drawn from the social and organizational conditions in which they perform their assignments. These evaluations are technically referred to as organi-zational climate. According to Schneider, Bowen, Ehrhart, et al., “the sense people make of the pat-terns of experiences and behaviours they have, or other parties to the situation have, constitutes the
climate of the situation” (p. 22) [1]. Organiza-tional safety climate is a subset of organizational climate. It denotes the shared perceptions of safety values, norms, beliefs, practices and princi-ples that workers have of their work environment [2]. For Neal and Griffin, it describes the “indi-vidual perceptions of policies, procedures and practices relating to safety in the workplace” (p. 946–7) [3]. Essentially, these perceptions reflect employees’ beliefs about the priority of organizational safety and consequently inform behaviour-outcome expectancies. Research reports along this line have shown positive corre-lations between safety climate and compliance

200 S.A. GYEKYE & M. HAYBATOLLAHI
JOSE 2014, Vol. 20, No. 2
with safety management polices [4, 5]; participa-tion in citizenship behaviours [5, 6]; supportive perceptions [4, 7] and a negative correlation with accident frequency [4, 8]. Recent meta-analytic evidence [9] and theoretical models [10, 11] found support for these linkages and provide more credibility to the observations. Thus, organ-izational safety scientists [7, 8, 9] have consensu-ally agreed that organizational climate predicts safety climate, which in turn is related to safety performances. One set of organizational con-structs that is linked to climate perceptions, which could potentially impact on safety climate is jus-tice climate or the extent to which workers per-ceive fairness in their organizations.
1.1. Organizational Justice
Organizational justice describes employees’ per-ceptions of fair or unjust treatment received from their management and their behavioural reactions to such perceptions [12]. Meta-analytic studies and reviews have confirmed three dimensions: distributive, procedural and interactional justice (e.g., Colquitt, Conlon, Wesson, et al. [13]. Dis-tributive justice denotes employees’ perceptions of the fairness of the outcomes they receive rela-tive to their contributions, and the outcome and contributions of their colleagues [12]. Procedural justice denotes employees’ perceptions of the fairness of decision-making processes, proce-dures that determine those contributions and reg-ulate the distribution of resources [12]. Proce-dures are judged based on their consistency of application, prevailing ethical standards, imparti-ality and rationality [13]. Interactional/relational justice, on the other hand, has been defined as the perceived fairness of the interpersonal treatment displayed by supervisors and management [14]. These reflect perceptions of being treated with honesty, propriety and respect in the workplace.
These shared perceptions on justice create a cli-mate that promotes or inhibits positive organiza-tional behaviours, and have consistently been found to be related to employee work-related atti-tudes and behaviours [13]. When employees have perceived justice and fair treatment in the work-place, they have expressed higher levels of job satisfaction [13, 15]; displayed more commitment
and lower turnover rate (e.g., Simons and Rober-son 16]) and actively participated in organiza-tional citizenship behaviours [17]. Conversely, when employees have perceived and experienced injustice and unfair treatment, they have reported lower levels of job satisfaction [18], mistrust in both supervisors and management [19], with-drawn participation in organizational citizenship behaviours [17] and displayed less organizational commitment [20]. Furthermore, they have been motivated to redress perceived injustice by engaging in counterproductive organizational behaviours (COBs) such as theft, sabotage [12, 21]; vandalism, absenteeism and resistance [22]. Meta-analytic reviews by Niehoff and Moorman [13] and Cohen-Charash and Spector [15] con-firm and support these observations.
1.2. Organizational Safety Climate and Organizational Justice
A key commonality across these two organiza-tional constructs is the fact that they both are con-structed through social interactions, and are drawn from the social and organizational circum-stances in which workers perform their assign-ments (organizational climate). Previous studies have suggested that shared perceptions of organi-zational climate exist with regards to the fairness of policies and procedures [23]. Accordingly, jus-tice researchers (e.g., Liao and Rupp [24]) have noted that perceptions of inequity (injustice) motivate people to make adaptive responses in a variety of ways, both cognitively and behaviour-ally. That is to say, employees make distinct judgements about fairness treatment received from their supervisors and organizations, which ultimately predict important attitudes and behav-iour relevant to job outcomes. Based on this rea-soning, it seems logical to expect justice climate to have incremental validity in predicting employees’ safety behaviour, by which safety performance could increase or decrease in rela-tion to employees’ perceptions of how fairly they are being treated in the workplace.
Although no research to date has investigated the impact of fairness perception on safety per-formance, more general evidence for this rela-tionship exists. In a closely related study that

201FAIRNESS PERCEPTIONS & SAFETY BEHAVIOUR
JOSE 2014, Vol. 20, No. 2
examined the impact of climate perceptions (spe-cifically, perceived organizational support [POS]) on employee safety behaviour, Gyekye and Salminen found that workers with positive per-spectives regarding organizational support, simi-larly had positive views concerning workplace safety [4]. Correspondingly, they expressed higher levels of job satisfaction, were more inclined to work in a safe manner and, conse-quently, experienced lower accident involvement rate. The explanation for this observation was drawn from the social exchange theory (SET), a theory that has been the central principle used in explaining the motivational basis for climate per-ceptions and organizational behaviours [16, 25].
1.3. SET
The theoretical underpinning of this research and its hypotheses is SET [25, 26]. Central to SET is the norm of reciprocity, which obligates employ-ees to respond positively to favourable treatment received from organizational management. In contrast to an economic exchange, where behav-iour is dictated by a specific contract between employee and the organization, social exchange consists of diffused, nonspecific, informal agree-ments that are based on trust between two parties. According to SET, individuals who are treated favourably by others feel a sense of indebtedness and obligation to respond positively and return the favourable treatment in some manner. A review of literature on SET provides considerable evidence that the level of perceived justice is directly related to the quality of resulting social exchange relationships between employees and their organizations [28]. The resulting social exchange repeatedly has been a significant pre-dictor of important employee attitudes and behav-iours, including enhanced job satisfaction, organ-izational citizenship behaviours and safety per-formances (e.g., Gyekye and Salminen [4, 5]; Simons and Roberson [16]; Organ [29]).
Recently, Hofmann, Morgerson and Gerras have extended the social exchange relationships to the realm of safety management [30]; they have suggested that employees are likely to use safety performance as an avenue to reciprocate favourable perceptions regarding organizational
safety climate. DeJoy, Della, Vandenberg, et al.’s recently tested model that focused on social exchange in the context of safety management confirmed the validity of this proposal [27]. From a justice perspective, perceptions of fair treatment are likely to generate positive and high-quality social exchange relationships, which in turn will create obligations for the worker to repay man-agement or the organization with safe work per-formances. Thus, in the current study, employee perceptions of justice are hypothesized to influ-ence employee safety behaviours and their consequences.
1.4. Current Study and Hypotheses
No prior research, to the best of our knowledge, has empirically examined and demonstrated a link between organizational justice and organiza-tional safety climate. This study addressed the paucity. It compared (a) the safety perceptions of workers with positive justice perceptions with their counterparts with negative justice percep-tions, (b) their levels of job satisfaction, (c) their compliance with safety management policies and (d) their accident involvement rate. An attempt was also made to investigate the extent to which the three facets of organizational justice (proce-dural, distributive and interactional justice) pre-dicted safety behaviour. The dearth of research in organizational behaviour in developing nations, particularly Africa, was another reason for these analyses.
Consistent with the social exchange logic and the aforementioned literature review, the follow-ing hypotheses were proposed:
Hypothesis 1: Link between organizational justice and organizational safety climate: despite the absence of ample evidence that bears directly on this link, we anticipate a positive association between organizational justice and organizational safety climate.
Research Question 2: The extent to which the three facets of organizational justice predict safety behaviour: because of the absence of evidence that bears directly on this link, this relationship is tested and no hypothesis is offered on its direction.
202 S.A. GYEKYE & M. HAYBATOLLAHI
JOSE 2014, Vol. 20, No. 2
Hypothesis 3: Link between organizational justice and job satisfaction: consistent with existing empirical and theoretic work, it is anticipated that workers with higher (positive) justice perceptions would express higher levels of job satisfaction than their counterparts with lower (negative) justice perceptions.
Hypothesis 4: Link between organizational justice and safety behaviour: drawing from SET, it is anticipated that workers with positive justice perceptions would be more compliant with safety management policies than their counterparts with negative perceptions.
Hypothesis 5: Link between organizational justice and accident frequency: despite the absence of ample evidence, it is anticipated that workers with higher (positive) perceptions of organizational justice would register fewer accidents than their counterparts with lower (negative) perceptions.
2. METHODOLOGY
2.1. Participants
Ghanaian industrial workers from underground mines (n = 102) and factories (n = 218) participated in the study (N = 320). The factory workers were mainly from textiles, breweries, food processing plants, and timber and saw-mill plants. Sixty-five percent (n = 208) were male, 35% (n = 112) were female. Subordinate workers made up 75% (n = 240), supervisors 25% (n = 80) of the total number. Forty-two percent (n = 134) of the par-ticipants was married, 58% (n = 186) were unmarried. Their educational background was as follows: 50% (n = 159) had basic education, 30% (n = 98) had secondary education, 17% (n = 56) had vocational education and 3% (n = 7) had uni-versity education.
2.2. Procedure
During lunch break, participants responded to a questionnaire in English, which took 15–20 min to complete. Supervisors completed the question-naire unaided. For illiterate or semiliterature
respondents who had difficulty understanding written English, the local language was used via the interpretation of a research assistant. All were assured that their responses would remain anony-mous and confidential and would not be disclosed even to their line managers.
2.3. Instruments
2.3.1. Organizational safety climate
Workers’ perceptions of safety were measured with the 50-item workplace safety scale (WSS) developed by Hayes, Parender, Smecko, et al. [31]. This instrument assesses employees’ per-ceptions of work safety and measures five distinct constructs, each with 10 items: (a) work safety (sample item: “Safety programmes are effective”, α = .96); (b) co-worker safety (sample item: “Pay attention to safety rules”, α = .80); (c) supervisor safety (sample item: “Enforces safety rules”, α = .97); (d) management’s commitment to safety (sample item: “Responds to safety concern”, α = .94); (e) satisfaction with safety programme (sample item: “Effective in reducing injuries”, α = .86). Total coefficient α score was .89.
2.3.2. Organizational justice
Organizational justice was measured with Blader and Tyler’s scale [32]. This instrument consists of 15 items and assesses participants’ perceptions of fairness on (a) distributive justice (sample item: “My work load and responsibilities are fair”, α = .84) and (b) procedural justice (sample item: “All job decisions are applied consistently to all workers”, α = .93). Niehoff and Moorman’s scale [14] was used to measure (c) interactional justice (sample item: “When decisions are made about my job, my supervisor shows concern for my rights as an employee”, α = .93). Total coeffi-cient α score was .97. The attention to all three dimensions made this a more parsimonious study [20, 33].
2.3.3. POS
POS refers to workers’ general perceptions regard-ing their managements’ contributions and concern for their well-being [34]. It was measured with the

203FAIRNESS PERCEPTIONS & SAFETY BEHAVIOUR
JOSE 2014, Vol. 20, No. 2
short version of Eisenberger, Fasolo and Davis-LaMastro’s survey [34]. The scale consisted of eight items and assessed workers’ evaluations of organizational issues that affected their well-being. Sample items were “The organization val-ues my contribution to its well-being”, “The organization takes pride in my accomplishments” and “Help is available from the organization when I have a problem”. Total coefficient α score was .97.
2.3.4. Job satisfaction
Job satisfaction is defined as the degree to which a worker experiences positive affection towards his or her job [35]. It was measured with Porter and Lawler’s one-item global measure of job sat-isfaction [36]. This measure was chosen because single-item measures of overall job satisfaction have been considered to be as robust as scale measures [37], and has been used extensively in the organizational behaviour literature [38]. The measure has five response categories ranging from extremely dissatisfied to extremely satisfied.
2.3.5. Safety compliance
Safety compliance denotes the fundamental and essential activities that employees need to carry out to maintain workplace safety. Items for safety compliance were pooled from the extant literature (e.g., Neal and Griffin [3]) (sample item: “Follow safety procedures regardless of the situation”, α = .78). Total coefficient α score was .80. Partic-ipants responded to all the aforementioned meas-uring instruments on a 5-point scale ranging from 1 = not at all to 5 = very much.
2.2.6. Accident frequency
Accident frequency was measured with responses to a question on the number of times the partici-pants had been involved in accidents in the past 12 months. All cases were accidents that had resulted in three or more consecutive days of absence and, therefore, the safety inspection authorities classified them as serious.
2.4. Data Analyses
Four statistical approaches were applied for the data analyses. First, a correlational analysis examined the interrelationships between organi-zational justice, organizational safety and the other variables under study. Second, the responses of all 15 organizational justice items were calculated, and a median split was per-formed to segregate the sample into two groups: participants with positive justice perceptions (n = 154) and participants with negative justice per-ceptions (n = 166). Using this as an independent variable, differences between the two groups were identified with a one-tailed t-test analysis. This provided comparative scores for the five subscales of the WSS, total WSS scores, job sat-isfaction, compliance with safety procedures, and accident frequency. Third, a linear regression analysis was performed to assess the degree at which the WSS predicted organizational justice. Fourth, because POS has been shown to mediate the relationships between organizational justice and organizational outcomes such as organiza-tional commitment, organizational citizenship behaviours, job satisfaction and organizational safety climate [39], the degree at which it predicts justice perceptions was also assessed. A confirm-atory factor analysis verified the factor structure of the WSS and provided support for the con-struct validity. Finally, regression analysis was applied to investigate the degree at which the three facets of organizational justice predicted safety behaviour. SAS statistical package version 9.1 was used for assessing the psychometric properties of the measures, the descriptive statis-tics and correlations. Table 1 shows descriptive statistics and bivariate correlations between the study variables.
3. RESULTS
The results provided general support for our pre-dictions, as they indicated significant correlations in the expected directions. As Table 1 shows, organizational justice indicated strong positive correlations with organizational safety climate and its five subscales: work safety, co-worker
204 S.A. GYEKYE & M. HAYBATOLLAHI
JOSE 2014, Vol. 20, No. 2
safety, supervisor safety, management safety practices and safety programmes. There were also significant positive associations with job sat-isfaction and compliance with safety policies, and a negative correlation with accident frequency. All three justice dimensions intercorrelated strongly and positively. The correlational evi-dence is thus consistent with our hypotheses 1, 3, 4 and 5.
Significant differences between the two catego-ries of workers on the WSS and the other organi-zational variables were revealed by t tests (Table 2). A dissection of the five subsets on the
WSS indicated the following: workers with high (positive) fairness perceptions significantly per-ceived their jobs to be less hazardous than their counterparts with low (negative) perceptions of work safety. They significantly noticed and appreciated their co-workers’ contributions towards safety, and perceived their supervisors to be supportive of workplace safety. Additionally, they expressed more satisfaction with manage-ment’s safety practices and were significantly contented with their organizations’ safety pro-grammes. They significantly complied with the organizational safety management policies and
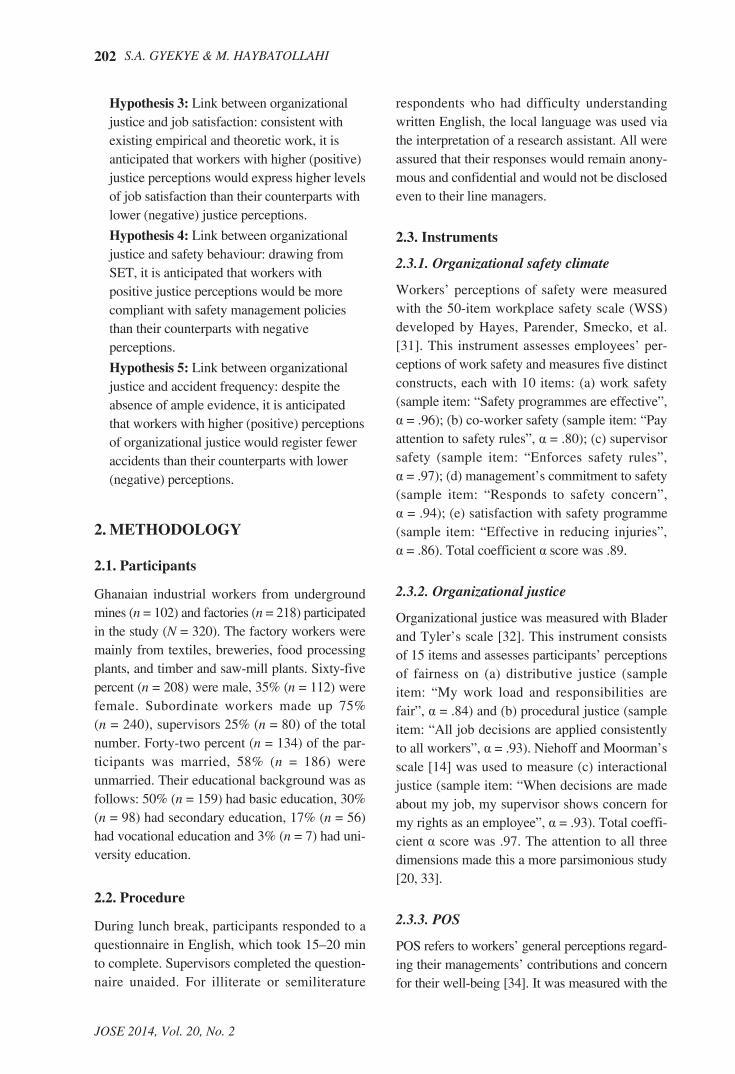
TABLE 1. Correlations Among Variables Under Study
Variable OJ 1 2 3 4 5 6 7 8 9 10 11 121. Work safety .54 ** 1.00
2. Co-worker safety .88 ** .52 ** 1.00
3. Supervisor safety .88 ** .50 ** .85 ** 1.00
4. Management safety practices
.90 ** .55 ** .85 ** .91 ** 1.00
5. Safety programmes .73 ** .43 ** .71 ** .73 ** .77 ** 1.00
6. Organizational safety climate
.92 ** .66 ** .91 ** .95 ** .97 ** .82 ** 1.00
7. Compliance with safety procedures
.94 ** .52 ** .84** .87 ** .89 ** .72 ** .90 ** 1.00
8. POS .92 ** .52 ** .84 ** .85 ** .87 ** .73 ** .90 ** .90 ** 1.00
9. Job satisfaction .91 ** .56 ** .86 ** .84 ** .87 ** .71 ** .90 ** .89 ** .91 ** 1.00
10. Accident frequency –.93 **–.71 **–.85 **–.87 **–.89 **–.73 **–.91 **–.93 **–.92 **–.91 ** 1.00
11. Distributive justice .96 ** .54 ** .82 ** .83 ** .85 ** .69 ** .87 ** .88 ** .86 ** .86 **–.88 ** 1.00
12. Procedural justice .97 ** .92 ** .85 ** .85 ** .88 ** .70 ** .89 ** .92 ** .91 ** .89 **–.91 ** .90 ** 1.00
13. Relational justice .97 ** .54 ** .86 ** .88 ** .89 ** .73 ** .92 ** .93 ** .90 ** .89 **–.91 ** .89 ** .92 **
Notes. ** p < .001; OJ = organizational justice, POS = perceived organizational support.
TABLE 2. Descriptive Statistics and t Test Between Positive and Negative Justice Perceptions
VariablePositive OJ
M (SD)Negative OJ
M (SD) t dfWSS 35.22 (3.73) 29.55 (5.61) 10.67 ** 314
Co-worker safety 35.81 (3.32) 25.74 (3.96) 24.62 ** 316
Supervisor safety 36.61 (4.97) 20.19 (6.24) 26.34 ** 317
Management safety practices 40.12 (5.42) 20.06 (7.47) 27.40 ** 313
Safety programmes 32.71 (2.96) 26.99 (3.31) 15.80 ** 298
Total WSS 180.40 (12.97) 121.68 (20.34) 29.44 ** 288
Compliance with safety procedures 16.89 (1.29) 7.52 (2.97) 37.06 ** 318
Job satisfaction 4.30 (0.53) 1.79 (0.87) 31.59** 318
Accident frequency 1.05 (0.23) 3.25 (0.76) –35.47** 318
Notes. ** p < .001; OJ = organizational justice, WSS = work safety scale.
205FAIRNESS PERCEPTIONS & SAFETY BEHAVIOUR
JOSE 2014, Vol. 20, No. 2
recorded relatively lower accident involvement rate. These results give further support for hypotheses 1, 3, 4 and 5.
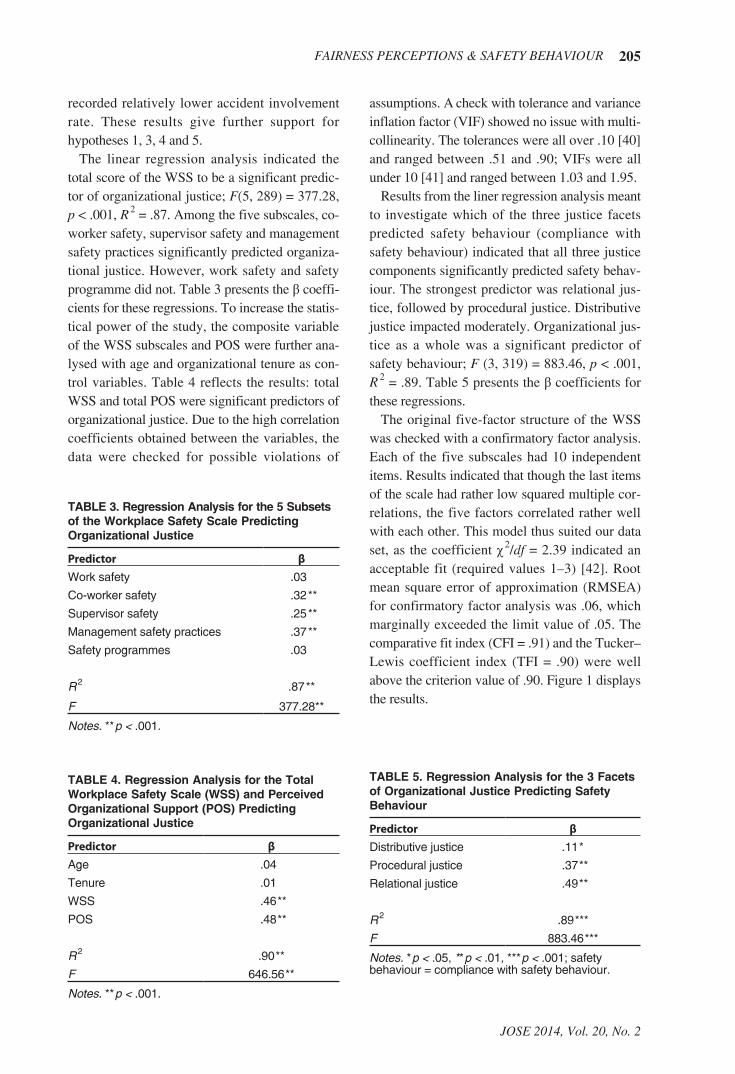
The linear regression analysis indicated the total score of the WSS to be a significant predic-tor of organizational justice; F(5, 289) = 377.28, p < .001, R 2 = .87. Among the five subscales, co-worker safety, supervisor safety and management safety practices significantly predicted organiza-tional justice. However, work safety and safety programme did not. Table 3 presents the β coeffi-cients for these regressions. To increase the statis-tical power of the study, the composite variable of the WSS subscales and POS were further ana-lysed with age and organizational tenure as con-trol variables. Table 4 reflects the results: total WSS and total POS were significant predictors of organizational justice. Due to the high correlation coefficients obtained between the variables, the data were checked for possible violations of
assumptions. A check with tolerance and variance inflation factor (VIF) showed no issue with multi-collinearity. The tolerances were all over .10 [40] and ranged between .51 and .90; VIFs were all under 10 [41] and ranged between 1.03 and 1.95.
Results from the liner regression analysis meant to investigate which of the three justice facets predicted safety behaviour (compliance with safety behaviour) indicated that all three justice components significantly predicted safety behav-iour. The strongest predictor was relational jus-tice, followed by procedural justice. Distributive justice impacted moderately. Organizational jus-tice as a whole was a significant predictor of safety behaviour; F (3, 319) = 883.46, p < .001, R 2 = .89. Table 5 presents the β coefficients for these regressions.
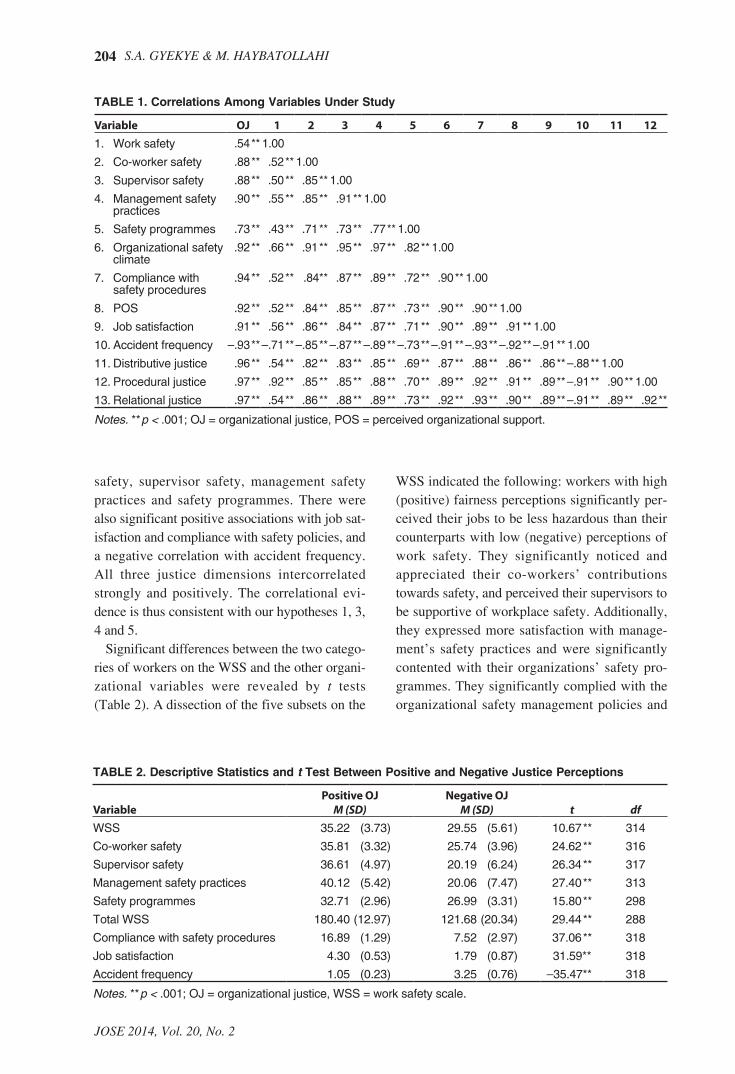
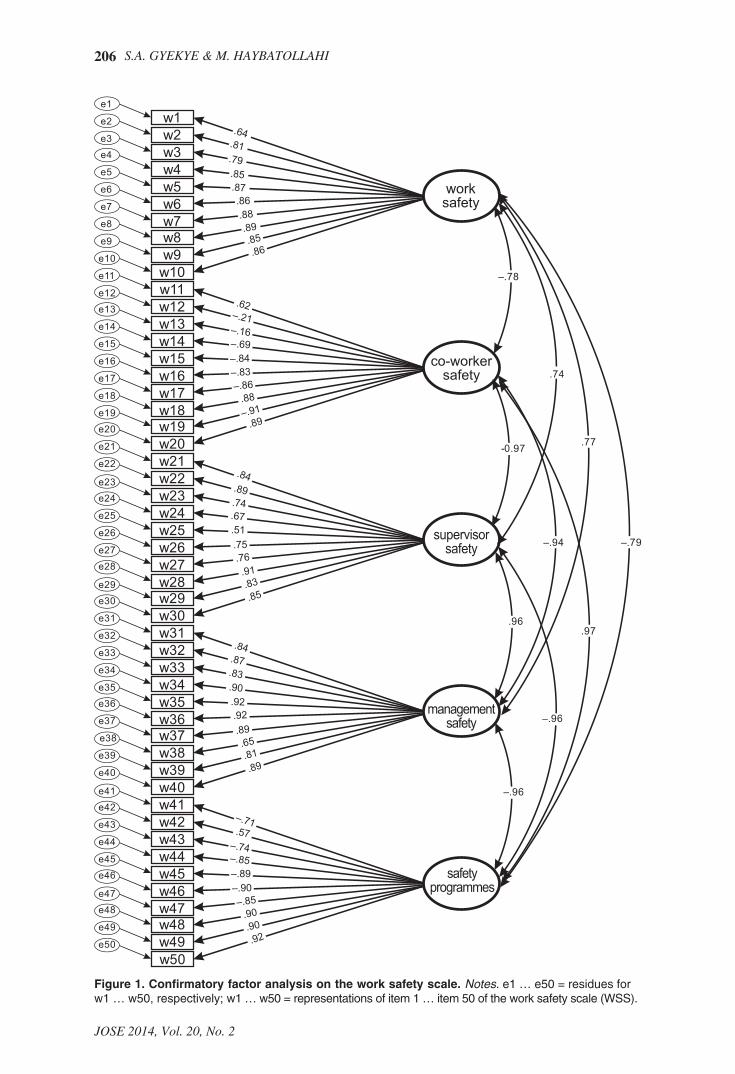
The original five-factor structure of the WSS was checked with a confirmatory factor analysis. Each of the five subscales had 10 independent items. Results indicated that though the last items of the scale had rather low squared multiple cor-relations, the five factors correlated rather well with each other. This model thus suited our data set, as the coefficient χ 2/df = 2.39 indicated an acceptable fit (required values 1–3) [42]. Root mean square error of approximation (RMSEA) for confirmatory factor analysis was .06, which marginally exceeded the limit value of .05. The comparative fit index (CFI = .91) and the Tucker–Lewis coefficient index (TFI = .90) were well above the criterion value of .90. Figure 1 displays the results.
TABLE 3. Regression Analysis for the 5 Subsets of the Workplace Safety Scale Predicting Organizational Justice
Predictor βWork safety .03
Co-worker safety .32 **
Supervisor safety .25 **
Management safety practices .37 **
Safety programmes .03
R 2 .87 **
F 377.28**
Notes. ** p < .001.
TABLE 4. Regression Analysis for the Total Workplace Safety Scale (WSS) and Perceived Organizational Support (POS) Predicting Organizational Justice
Predictor βAge .04
Tenure .01
WSS .46 **
POS .48 **
R 2 .90 **
F 646.56 **
Notes. ** p < .001.
TABLE 5. Regression Analysis for the 3 Facets of Organizational Justice Predicting Safety Behaviour
Predictor βDistributive justice .11 *
Procedural justice .37 **
Relational justice .49 **
R 2 .89 ***
F 883.46 ***
Notes. * p < .05, ** p < .01, *** p < .001; safety behaviour = compliance with safety behaviour.
206 S.A. GYEKYE & M. HAYBATOLLAHI
JOSE 2014, Vol. 20, No. 2
w1e1
w2e2
w3e3
w4e4
w5e5
w6e6
w7e7
w8e8
w9e9
w10e10
.64.81.79.85.87.86.88.89.85.86
w11e11
w12e12
w13e13
w14e14
w15e15
w16e16
w17e17
w18e18
w19e19
w20e20
w21e21
w22e22
w23e23
w24e24
w25e25
w26e26
w27e27
w28e28
w29e29
w30e30
w31e31
w32e32
w33e33
w34e34
w35e35
w36e36
w37e37
w38e38
w39e39
w40e40
w41e41
w42e42
w43e43
w44e44
w45e45
w46e46
w47e47
w48e48
w49e49
w50e50
–.78
-0.97
.96
.74
–.94 –.79
.77
.97
–.96
–.96
worksafety
co-workersafety
supervisorsafety
managementsafety
safetyprogrammes
.62
.88
.89
.84.89.74
.90.90.92
.57
.89.81.65.89
.92.92
.90
.83.87.84
.85.83.91.76.75.51.67
–.21–.16–.69–.84–.83–.86
–.91
–.90–.89–.85
–.85
–.74
–.71
Figure 1. Confirmatory factor analysis on the work safety scale. Notes. e1 … e50 = residues for w1 … w50, respectively; w1 … w50 = representations of item 1 … item 50 of the work safety scale (WSS).

207FAIRNESS PERCEPTIONS & SAFETY BEHAVIOUR
JOSE 2014, Vol. 20, No. 2
4. DISCUSSION
The study investigated the link between organiza-tional justice and organizational safety climate. It also examined links with job satisfaction, compli-ance with safety management policies and acci-dent frequency. The results provided general sup-port for our hypotheses. As predicted, and in accordance with the social exchange theory, workers with positive fairness perceptions responded favourably to their organizations in the form of safe work behaviour. Additionally, they also indicated constructive views regarding organizational safety climate, expressed higher levels of job satisfaction, were more compliant with safety management policies and experienced relatively lower accident involvement rate. Con-versely, workers with experiences of injustice treatment indicated negative assessments regard-ing safety climate, were less satisfied at their posts, less committed to safe work and experi-enced higher accident frequencies.
Ostensibly, employees’ perceptions of fair treatment at the workplace appear to translate into safety behaviour practices. Compliance with safety management policies seems to be the ave-nue through which workers who perceive fair treatment reciprocate the implied obligation to their organizational management. Meanwhile, workers with negative justice perceptions had considered themselves to have received lower inducements from organizational management, and had not reciprocated with the same level of safety performance. The current observation is thus consistent with Hofmann et al.’s assertion that lower safety performance is one mechanism used by workers to restore personal feelings of equity regarding the social exchange relationship [30].
The results also demonstrated a positive link between fairness perception and job satisfaction. Job satisfaction involves an appraisal of organiza-tional structures and salient job attributes and is, hence, closely linked with organizational climate and organizational safety climate. In line with our predictions for hypothesis 3, workers who per-ceived higher levels of fair treatment expressed higher levels of job satisfaction. This observation is consistent with the notion that workers’ posi-
tive perceptions regarding organizational climate impact positively on their satisfaction levels, with subsequent implications for their safety perform-ances [43]. It corroborates previous research examining the job satisfaction–fairness relation-ships that has consistently found a significant, moderate-to-large positive association between the two variables [44].
A key observation was the finding that all three facets of organizational justice were significantly and strongly related to safety behaviour: scores revealing safety behaviour indicated approxi-mately equal correlations with distributive (r = .88, p < .05), procedural (r = .92, p < .001) and rela-tional justice (r = .93, p < .001). Relational justice indicated the strongest impact. This finding is important, as the three facets have differentially been related to different organizational constructs and outcomes (e.g., organizational citizenship behaviour [45], job satisfaction [44]). More importantly, it represents an element of the col-lectivistic experience that Ghanaians share. As a group and relationship-oriented community, it seems logical that relational and interactional concerns indicated a slight edge over the other two justice facets. In addressing workplace injus-tice, Ghanaian organizational management should pay attention to all three dimensions, but with relatively more focus on the interactional aspect.
4.1. Implications of Findings
According to the research data, interventions aimed at addressing injustice will significantly improve employee dissatisfaction, safety behav-iour and safety performances. Organizational management could ensure that fairness treatment is consistent, unbiased and ethical. At the proce-dural level, organizational management could endeavour to maintain consistency, accuracy and transparency in their evaluation processes. Injus-tice at the relational level could be addressed by authorities treating subordinates with respect and dignity, and refraining from inappropriate com-ments on their work attitudes. Although the implementation and administration of fair proce-dures may be determined at the top management level, it is supervisors (front-line managers) who

208 S.A. GYEKYE & M. HAYBATOLLAHI
JOSE 2014, Vol. 20, No. 2
normally manage these practices; as they struc-ture, co-ordinate and facilitate work activities. For employees, supervisors’ behaviour is the main indicator of how the organization treats and appreciates them [46]. It is imperative, therefore, that supervisors and front-line managers be edu-cated on the importance of applying human resource practices, and react to subordinate work-ers’ concern with some level of sensitivity, in a fair and respectful manner. According to the safety literature, front-line mangers and the cli-mates they help create within their work groups have significant impact on the safety performance of their subordinates [46, 47].
Implementing these measures will contribute to building a supportive climate that will promote a sense of trust and belongingness in the organiza-tion. Additionally, they will signal to workers that their organizational management respects and appreciates their contributions. This will eventu-ally lead to a deeper sense of obligation within the social exchange relationship [25]. Fundamen-tally, they will address employee violations of safety policies, with a resultant decrease in acci-dent frequency and its concomitant social and human cost. Spillover effects would include an increase in employees’ level of job satisfaction [13, 15], participation in citizenship behaviours (e.g., Colquitt, Conlon, Wesson, et al. [13], Chen, Lin, Tung, et al. [17]) and an increase in effi-ciency and productivity (e.g., Moorman [45]). It is worth noting that efforts to influence the beliefs and attitudes of workers and motivate them to engage in safe work behaviours may fail if the environment is not supportive (β = .48, p < .001). Thus, recent theoretical models have demon-strated that supportive safety policies and pro-grammes do impact on safety climate and organi-zational commitment, and these relationships are mediated by POS [11, 27]. It follows from this additional vantage point on climate strength that when organizational climate is both positive and strong, one would expect the most consistently positive organizational behaviour from employees.
4.2. Study Limitations
While these results are encouraging, it is also important to consider that the study relies on self-
reported instruments. There is, therefore, the pos-sibility for common method variance among some of the scales. However, meta-analytic stud-ies by Crampton and Wagner [48] and more recently Podsakoff, MacKenzie, Lee, et al. [49] inform that while this problem continues to be cited regularly, the magnitude of distortions may be overestimated. Self-reported measures have been effectively used in fairness (e.g., Ang, Van Dyne and Bergley [44]) and safety (e.g., Gyekye and Salminen [4], Blader and Tyler [32]) analy-ses. The cross-sectional and correlational design of the study precludes a causal inference. Future studies should consider longitudinal designs in which serial measurements will be made among the same participants over time. Organizational researchers could consider attempting to replicate this study using other forms of climates such as innovation or service climates. It is noteworthy that reverse causal is also conceivable, i.e., posi-tive views regarding workplace safety might affect employee perceptions of fairness. Notwith-standing the aforementioned limitations, the cur-rent findings reinforce occupational and organi-zational psychologists’ assertions on the impact of climate perceptions on workplace safety per-formance. Particularly, they reveal the influential bearing that fairness treatment in the workplace has on employees’ safety performance, job satis-faction and accident frequency.
REFERENCES
1. Schneider B, Bowen DE, Ehrhart MG, Holcombe KM. The climate for service: evolution of a construct. In: Ashkanasy NM, Wilderom CP, Peterson MF, editors. Handbook of organizational culture and climate. Thousand Oaks, CA, USA: Sage; 2000. p. 21–36.
2. Zohar D. Safety climate in industrial organizations: theoretical and applied implications. J Appl Psychol. 1980;65(1): 96–102.
3. Neal A, Griffin M. A study of the lagged relationships among safety climate, safety motivation, safety behavior, and accidents at the individual and group levels. J Appl Psychol. 2006;91(4):946–53.

209FAIRNESS PERCEPTIONS & SAFETY BEHAVIOUR
JOSE 2014, Vol. 20, No. 2
4. Gyekye SA, Salminen S. Workplace safety perceptions and perceived organizational support: do supportive perceptions influence safety perceptions? International Journal of Occupational Safety and Ergonomics (JOSE). 2007;13(2):189–200. Retrieved January 9, 2014, from: http://www.ciop.pl/21990.
5. Gyekye SA, Salminen S. Are “good soldiers” safety conscious? An examination of the relationship between organizational citizenship behaviours and perception of workplace safety. Social Behaviour and Personality: An International Journal. 2005;33(8):805–20.
6. Lee TZ, Wu CH, Hong CW. An empirical investigation of the influence of safety climate on organizational citizenship behaviour in Taiwan’s facilities. International Journal of Occupational Safety and Ergonomics (JOSE). 2007;13(3):255–69. Retrieved January 9, 2014, from: http://www.ciop.pl/23206.
7. Hofmann DA, Morgerson FP. Safety-related behaviour as a social exchange: the role of perceived organizational support and leader–member exchange. J Appl Psychol. 1999;84(2):286–96.
8. Clarke S. An integrative model of safety climate: linking psychological climate and work attitudes to individual safety outcomes using meta-analysis. J Occup Organ Psychol. 2010;83(3):553–78.
9. Nahrgang JD, Morgeson F, Hofmann DA. Safety at work: a meta-analytic investigation of the link between job demands, job resources, burnout, engagement, and safety outcomes. J Appl Psychol. 2011;96(1): 71–94.
10. Christian MS, Bradley JC, Wallace JC, Burke MJ. Workplace safety: a meta-analysis of the roles of person and situation factors. J Appl Psychol. 2009;94(5):1103–27.
11. Gyekye SA, Salminen S, Ojajarvi A. A theoretical model to ascertain determinates of occupational accidents among Ghanaian industrial workers. Int J Ind Ergon. 2012;42(2):233–40.
12. Greenberg J. Employee theft as a reaction to underpayment inequity: the hidden cost of pay cuts. J Appl Psychol. 1990;75(5): 561–8.
13. Colquitt JA, Conlon DE, Wesson MJ, Porter CO, Ng KY. Justice at the millennium: a meta-analytic review of 25 years of organizational justice research. J Appl Psychol. 2001;86(3):425-445.
14. Niehoff BP, Moorman RH. Justice as a mediator of the relationship between methods of monitoring and organizational citizenship behaviour. Acad Manage J. 1993;36(6):527–56.
15. Cohen-Charash Y, Spector PE. The role of justice in organizations: a meta-analysis. Organ Behav Hum Decis Process. 2001; 86(2):278–321.
16. Simons T, Roberson Q. Why managers should care about fairness: the effects of aggregate justice perceptions on organizational outcomes. J Appl Psychol. 2003;88(3):432–43.
17. Chen YJ, Lin CC, Tung YC, Ko YT. Associations of organizational justice and ingratiation with organizational citizenship behaviour: the beneficiary perspective. Social Behaviour and Personality: An International Journal. 2008;36(3):289–302.
18. Beugre CD, Baron RA. Perceptions of systematic justice: the effects of distributive, procedural, and interactional justice. J Appl Soc Psychol. 2001;31(2):324–39.
19. Brockner J. Making sense of procedural fairness: how high procedural fairness can reduce or heighten the influence of outcome favourability. Academy of Management Review. 2002;27(1):58–76.
20. Ambrose ML, Hess RL, Ganesan S. The relationship between justice and attitude: an examination of the justice effects on event and system-related attitudes. Organ Behav Hum Decis Process. 2007;103(1):21–36.
21. Fox S, Spector PE, Miles D. Counterproductive work behaviour (CWB) in response to job stressors and organizational justice: some mediators and moderator tests for autonomy and emotions. J Vocat Behav. 2001;59(3):291–309.
22. Jermier JM, Knights D, Nord WR, editors. Resistance and power in organizations. London, UK: Routledge; 1994.
23. Naumann SE, Bennett N. A case for procedural justice climate: development and test of a multilevel model. Academy of Management Journal. 2000;43(5):881–9.

210 S.A. GYEKYE & M. HAYBATOLLAHI
JOSE 2014, Vol. 20, No. 2
24. Liao H, Rupp DE. The impact of justice climate and justice orientation on work outcomes: a cross-level multifoci framework. J Appl Soc Psychol. 2005;90(2):242–56.
25. Blau PM. Exchange and power in social life. New York, NY, USA: Wiley; 1964.
26. Gouldner AW. The norm of reciprocity: a preliminary statement. Am Sociol Rev. 1960;25(2):161–78.
27. DeJoy DM, Della LJ, Vandenberg RJ, Wilson MG. Making work safer: testing a model of social exchange and safety management. J Safety Res. 2010;41(2): 163–71.
28. Cropanzano R, Mitchell MS. Social exchange theory: an interdisciplinary review. J Manage. 2005;31(6):874 –900.
29. Organ DW. Organizational citizenship behaviour: the good soldier syndrome. Lexington, MA, USA: Lexington Books; 1988.
30. Hofmann DA, Morgerson FP, Gerras SJ. Climate as a moderator of the relationship between leader-member exchange and content specific citizenship: safety climate as an exemplar. J Appl Psychol. 2003;88(1): 170–8.
31. Hayes BE, Parender J, Smecko T, Trask J. Measuring perceptions of workplace safety: development and validation of the Work Safety Scale. J Safety Res. 1998;29(3): 145–61
32. Blader SL, Tyler TR. A four-component model of procedural justice: Defining the meaning of a “fair” process. Pers Soc Psychol Bull. 2003;29(6):747–58.
33. Ambrose ML, Schminke M. The role of overall justice judgments in organizational justice research: a test of mediation. J Appl Psychol. 2009;94(2):491–500.
34. Eisenberger R, Fasolo P, Davis-LaMastro V. Perceived organizational support and employee diligence, commitment, and innovation. J Appl Psychol. 1990;75(1):51–9.
35. Locke EA. What is job satisfaction? Organ Behav Hum Perform.1969;4(4):309–36.
36. Porter LW, Lawler EE III. Managerial attitudes and performance. Homewood, IL, USA: Irwin-Dorsey; 1968.
37. Dolbier CL, Webster JA, McCalister KT, Mallon MW, Steinhardt MA. Reliability and validity of a single-item measure of job satisfaction. Am J Health Promot. 2005; 19(3):194–8.
38. Nagy MS. Using a single-item approach to measure facet of job satisfaction. J Occup Organ Psychol. 2002;75(1):77–86.
39. Masterson SS, Lewis K, Goldman BM, Taylor MS. Integrating justice and social exchange: the differing effects of fair procedures and treatment on work relationships. Acad Manage J. 2000;43(4): 738–48.
40. Tabachnick BG, Fidell LS. Using multivariate statistics. 5th ed. Boston, MA, USA: Pearson/ Allyn & Bacon; 2007.
41. Hair JF Jr, Anderson RE, Tatham RL, Black WC. Multivariate data analysis: with readings. 4th ed. Upper Saddle River, NJ, USA: Prentice Hall; 1995.
42. Carmines EG, McIver JP Analyzing models with unobserved variables: analysis of covariance structures. In: Bohrnstedt GW, Borgatta EF, editors. Social measurement: current issues. Beverly Hills, CA, USA: Sage; 1981. p. 65–115.
43. Gyekye SA. Workers’ perceptions of workplace safety and job satisfaction. International Journal of Occupational Safety and Ergonomics (JOSE). 2005;11(3): 291–302. Retrieved January 9, 2014, from: http://www.ciop.pl/14182.
44. Ang S, Van Dyne L, Bergley MT. The employment relationships of foreign workers versus local employees: a field study of organizational justice, job satisfaction, performance, and OCB. J Organ Behav. 2003;24(5):561–83.
45. Moorman RH. Relationship between organizational justice and organizational citizenship behaviours: do fairness perceptions influence employee citizenship behaviours? J Appl Psychol. 1991;76(6): 845–55.
46. Heinrich H. Industrial accident prevention. 4th ed. London, UK: McGraw-Hill; 1959.
47. Lui HK, Wong YT. How to improve employees’ commitment to their line manager: A practical study in a Chinese

211FAIRNESS PERCEPTIONS & SAFETY BEHAVIOUR
JOSE 2014, Vol. 20, No. 2
joint venture. Journal of General Manage-ment. 2007;32(3):61–77.
48. Crampton SM, Wagner JA. Percept-precept inflation in microorganizational research: an investigation of prevalence and effect. J Appl Psychol 1994;79(1):67–76.
49. Podsakoff PM, MacKenzie SB, Lee JY, Podsakoff NP. Common method biases in behavioral research: a critical review of the literature and recommended remedies. J Appl Psychol. 2003;88(5):879–903.