RELATIONSHIP BETWEEN MICROCREDIT AND …chss.uonbi.ac.ke/sites/default/files/chss/RAEL...
58
RELATIONSHIP BETWEEN MICROCREDIT AND THE GROWTH OF SMALL AND MEDIUM ENTERPRISES IN KENYA BY: RAEL NASIMIYU WALIAULA D61/75885/2012 A RESEARCH PROJECT SUBMITTED IN PARTIAL FULFILMENT FOR THE REQUIREMENTS OF MASTER DEGREE IN BUSINESS ADMINISTRATION, UNIVERSITY OF NAIROBI AUGUST 2013
Transcript of RELATIONSHIP BETWEEN MICROCREDIT AND …chss.uonbi.ac.ke/sites/default/files/chss/RAEL...
RELATIONSHIP BETWEEN MICROCREDIT AND THE
GROWTH OF SMALL AND MEDIUM ENTERPRISES IN KENYA
BY:
RAEL NASIMIYU WALIAULA
D61/75885/2012
A RESEARCH PROJECT SUBMITTED IN PARTIAL FULFILMENT FOR
THE REQUIREMENTS OF MASTER DEGREE IN BUSINESS
ADMINISTRATION, UNIVERSITY OF NAIROBI
AUGUST 2013
ii
DECLARATION
I declare that this is my original work and has never been presented in any other
university or college for any academic purpose.
Signature………………………….. Date……………………….
Rael Nasimiyu Waliaula
D61/75885/2012
This research project has been submitted for examination with my approval as the
student supervisor.
Signature………………………….. Date……………………….
Dr. Josiah Aduda
Chairman
Finance and Accounting Department

iii
DEDICATION
This project is dedicated to my mum Ann Wayongo and my sister Lydia. Their
inspiration and support throughout the project, will always be cherished. Also
dedicated to friends who stood by me.

iv
ACKNOWLEDGEMENT
The Almighty God has been so faithful in granting me the strength, wisdom, knowledge and the courage needed throughout the period of study.
I would like to express my gratitude to Dr Aduda, my research supervisor for his assistance in keeping my progress on schedule, advice and useful critiques of this research work.
I am highly indebted to employees of SMEs that took their time to cooperate and respond to the questionnaires during the study. God bless you
Finally my deep heart- heartfelt gratitude goes to my parents and siblings for their support and encouragement throughout this research.

v
ABSTRACT The accessibility of credit by SMEs is usually considered as an important factor in the growth of SMEs. Credit helps SMEs improve their income levels, alleviate poverty and create job opportunities. This study sought to evaluate the relationship between microcredit and the growth of SMEs in Kenya. To achieve this objective, the study employed a correlation research design. Data was collected using a semi-structured questionnaire from SMEs in Nairobi County. A total of 50 questionnaires were administered to various SMEs but the researcher managed to obtain 48 completed questionnaires representing a response rate of 96% .The researcher adopted a drop-and –pick-later approach where questionnaires were issued in the morning and picked in the evening to allow the respondents to complete the questionnaires. The collected data was edited, coded and entered for analysis using the Statistical Package for Social Sciences (Version 17.0) computer package. Both descriptive and inferential statistics were used. The research findings revealed that there was a very strong positive relationship (R= 0.852) between the variables. The study also revealed that 72.7% of demand for growth in SMEs could be explained by use of microcredit. From this study it was evident that at 95% confidence level, the variables produced statistically significant values and could be relied on to explain growth in SMEs as a result of microcredit. Growth in SMEs was evident in terms of increased employees and entity’s total equity. The research findings were presented in pie charts, bar graphs, and tables for clarity. The findings of this study will be of great use to the government, lending institutions in formulating microcredit policies so as to promote the microcredit in Kenya.
vi
TABLE OF CONTENTS
DECLARATION ..................................................................................................... ii
DEDICATION ........................................................................................................ iii
ACKNOWLEDGEMENT ...................................................................................... iv
ABSTRACT ............................................................................................................. v
LIST OF ABBREVIATIONS ................................................................................. ix
LIST OF TABLES ................................................................................................... x
LIST OF FIGURES ................................................................................................ xi
CHAPTER ONE ...................................................................................................... 1
INTRODUCTION ................................................................................................... 1
1.1 Background of the study ................................................................................... 1
1.1.1Microcredit ................................................................................................. 1
1.1.2 Growth of SMEs ........................................................................................ 2
1.1.3 Relationship between Microcredit and Growth of SMEs ............................ 3
1.1.4 SMEs in Kenya .......................................................................................... 4
1.2 Research Problem............................................................................................. 4
1.3 Objective of the Study ...................................................................................... 5
1.4 Value of the Study ............................................................................................ 5
CHAPTER TWO ..................................................................................................... 7
LITERATURE REVIEW........................................................................................ 7
2.1Introduction....................................................................................................... 7
2.2Theoretical literature ......................................................................................... 7
2.2.1 Credit Theory of Money ............................................................................ 7
2.2.2 Liquidity Theory ........................................................................................ 8
2.2.3 Credit Risk Theory..................................................................................... 8
2.3Factors that Affect SMEs Access to Credit .................................................... 8
2.4 Impact of Microcredit on Growth of Small and Medium Enterprises ................ 9
2.4.1 Constraints of SMEs Growth in Kenya .................................................... 10
2.4.2 Sources of Finance for SMEs ................................................................... 11
2.4.3 Microfinance Institution-SMEs relationship ............................................. 11
2.5 Indicators of Growth ...................................................................................... 12
2.7: Conclusion .................................................................................................... 14
vii
CHAPTER THREE ............................................................................................... 16
RESEARCH METHODOLOGY .......................................................................... 16
3.1 Introduction .................................................................................................... 16
3.2 Research Design ............................................................................................. 16
3.3 Population ...................................................................................................... 16
3.4 Sample ........................................................................................................... 16
3.5 Data collection ............................................................................................... 17
3.6 Data analysis .................................................................................................. 17
3.7 Data Validity and reliability ........................................................................... 18
CHAPTER FOUR ................................................................................................. 19
PRESENTATION OF FINDINGS........................................................................ 19
4.1 Introduction ............................................................................................... 19
4.2 Data Analysis and Presentation ...................................................................... 19
4.2.1 Business Type .......................................................................................... 19
4.2.2 Number of Employees ............................................................................. 20
4.2.3 Period SME had been in Operation .......................................................... 21
4.2.4 Sales Level before Getting Credit............................................................. 22
4.2.5 Sales after Using Credit ........................................................................... 23
4.2.6 Benefits of Microcredit ....................................................................... 24
4.2.7 Percentage of Annual Profits Contributed from Microcredit ............... 25
4.2.8 Increase in Total Assets by use of Credit ............................................ 26
4.2.9 Role of Microcredit on Sales Growth .................................................. 27
4.2.10 Microcredit and Employment ............................................................ 28
4.2.11 Microcredit and Creation of More SMEs ............................................ 29
4.2.12 Microcredit and Growth in Business ................................................... 30
4.2.13 Use of Loans for Business .................................................................. 31
4.2.14 Activities Clients use Loans for .......................................................... 32
4.2.11 Regression Analysis ............................................................................... 33
4.3 Summary and Interpretation of Findings .................................................... 35
CHAPTER FIVE ................................................................................................... 37
SUMMARY, CONCLUSIONS & RECOMMENDATIONS ............................... 37
5.1 Summary ................................................................................................... 37
5.2 Conclusion ................................................................................................ 38
viii
5.3 Recommendations for Policy and Practice ................................................. 38
5.4 Limitations of the Study ............................................................................ 39
5.5 Suggestions for Further Studies ................................................................. 40
REFERENCES ...................................................................................................... 41
APPENDIX: Questionnaire................................................................................... 45
ix
LIST OF ABBREVIATIONS CDF: Constituency Development Fund
GDP: Gross Domestic Product
IFC: International Finance Corporation
MFI: Micro Financial Institution
NSE: Nairobi Security Exchange
SMES: Small and Medium Enterprises
x
LIST OF TABLES
Table 3.1 Operationalization of the Variables ..................................................... 17
Table 4.1 Business Type .................................................................................... 20
Table 4.2 Number of Employees ........................................................................ 20
Table 4.3 Period SME has been in Operation ..................................................... 21
Table 4.4 Sales Level before Getting Credit ....................................................... 22
Table 4.5 Sales after Using Credit ...................................................................... 23
Table 4.6 Benefits of Microcredit ....................................................................... 24
Table 4.7 Percentage of Annual Profits Contributed from Microcredit ............... 25
Table 4.8 Increase in Total Assets by use of Credit ............................................ 26
Table 4.9 Role of Microcredit on Sales Growth .................................................. 27
Table 4.10 Microcredit and Employment............................................................ 28
Table 4.11 Microcredit and Creation of More SMEs .......................................... 29
Table 4.12 Microcredit and Growth in Business ................................................. 30
Table 4.13 Use of Loans for Business ................................................................. 31
Table 4.14 Model Summary ................................................................................. 33
Table 4.15 ANOVA ............................................................................................. 33
Table 4.16 Coefficients ........................................................................................ 34
xi
LIST OF FIGURES
Figure 4.1Business Type ..................................................................................... 20
Figure 4.2 Number of Employees ........................................................................ 21
Figure 4.3Period SME has been in Operation ...................................................... 22
Figure 4.4 Sales Level before Getting Credit ....................................................... 23
Figure 4.5 Sales Level before Getting Credit ....................................................... 24
Figure 4.6 Benefits of Microcredit ....................................................................... 25
Figure 4.7 Percentage of Annual Profits Contributed from Microcredit ............... 26
Figure 4.8 Increase in Total Assets by Use of Credit ........................................... 27
Figure 4.9 Role of Microcredit on Sales Growth .................................................. 28
Figure 4.10 Microcredit and Employment ........................................................... 29
Figure 4.11 Microcredit and Creation of More SMEs .......................................... 30
Figure 4.12 Microcredit and Growth in Business ................................................. 31
Figure 4.13 Use of Loans for Business ................................................................ 32
1
CHAPTER ONE
INTRODUCTION 1.1 Background of the study
Microcredit is a powerful tool for poverty reduction among people who are
economically active but constrained by financial resources and vulnerable to
economic stress. Microcredit enables small and medium enterprises find means of
getting funds to start up their own businesses. According to (Littlefield and
Rosenberg, 2004) their studies indicate that microfinance benefits the poor
households. Microcredit is part of microfinance and in addition to providing financial
intermediation; it extends by providing non financial services. The non financial
services include, encouraging formation of groups, business training on financial
literacy and management (Ledgewood, 1999).
Small and medium enterprises play a crucial role in the growth of Kenyan economy.
Economic survey, (2006) reveals that SMEs contributes 50 percent new jobs that were
created in 2005.Past researches show that the nation’s GDP gets 18 percent being a
contribution from SMEs .SMEs have limited access from formal financial
institutions to meet their working and investment needs (Kessy, 2009).Most financial
institutions do not offer SMEs credits due to their failure rates, which makes it
difficult for lenders to assess viability of their enterprises. Kenya National bureau of
statistics, (2007) indicate that three out five businesses fail within the first few months
of operation. Failures of SMEs are attributed to lack of knowledge in dealing with the
business and investing in the wrong kind of business.
The most serious constraint of SMEs is lack of credit as it hinders the growth of
SMEs in Kenya (Oketch, 2000).Microcredit provides credit to SMEs. Availability of
credit to SMESs greatly enhances economic growth, which breaks the circle of low
investment and low income (Yunus, 1984).
1.1.1 Microcredit Several discussions have been in place as to what defines microcredit.(Srinivas,
1997) defines microcredit as programmes that extend small loans to very poor people
for self-employment projects that generate income allowing them to care for their
2
needs. The existence of microcredit gives an alternative to people that is not included
in the traditional banking sector and hence relies on the informal sector to attend to
their financial necessities. The differences between formal and informal, range from
money lenders, community savings clubs, deposit collectors and agricultural input
providers, traders and processors (Helms, 2006).
1.1.2 Growth of SMEs Growth can be defined as the process of improvements that a firm undergoes.
(Penrose, 1995) implies that the size of a firm is growth over period of time. Despite
of the challenges encountered by SMEs, it contributes to the Kenyan economy.
(Bowen et al, 2009) results from his investigation pointed out that SMEs in Kenya are
faced with challenges of insecurity, competition that arise among themselves and
from large firms, lack of access to credit and debt collection. The MSEs 2011 bill
recognizes MSEs formally and creates clear definitions as to what a small enterprise
is. It creates a platform that if well executed creates a means of continuous
development of the SMEs sector. The massive ideas associated with SMEs, have a
greater impact on the economy.
In Kenya micro enterprises are those with annual turnover of below kshs 500000 and
less than ten employees. On the other hand, small businesses are those with annual
turnover of between kshs 500000 and 5 million, employing employees between 10
and 15.It is impossible to ignore the impact of the SMEs sector in the Kenyan
economy. The impact of SMEs has necessitated creation of the special market
segment at the Nairobi stock exchange targeting SMEs. The growth enterprise market
segment aims at providing alternative platform of ways SMEs can seek capital
injection for their growth.(www.fsdkenya.org).
Ministry of finance continues to play a greater role to SMEs by allocating funds from
their budget towards women and youth programmes. Revolving funds are provided to
the smes inform of loans at low interest rates. The move by the government to support
growth of SMEs is due to realization of potential benefits achieved towards the
country’s economy. Appropriate policies should aim to encourage the development of
local technologies. To enhance full development of SMEs specific policy measures
3
are required to ensure technology services and infrastructure are provided.(Wanjohi,
2009) policy initiates in revitalizing the SMEs sub-sector, should not only be
government engineered but involve all stakeholders in development. The
establishment of CDF kitty through the CDF Act 2003 in the Kenya Gazette
supplement No.107 was aimed to supporting constituency level projects.
Improvement of infrastructure and investment into various projects has contributed to
the growth of SMEs (www.growth partners.co.ke).
1.1.3 Relationship between Microcredit and Growth of SMEs The accessibility of credit by SMEs is usually considered as an important factor in the
growth of SMEs. Credit helps SMEs improve their income levels, alleviate poverty
and create job opportunities.(Hiedhues,1995) points out that ,when the poor people
are helped access credit, the poor gain an advantage of overcoming their liquidity
constraints and involve in investments such as the improvement of farm technology
inputs thereby leading to an increase in agricultural production.(Navajas et al,2000)
sees microcredit as tool to improve the welfare of the poor as a result of better access
to small loans that are not offered by the formal institutions.
According to (Coleman, 1999) village bank credit did not help in physical asset
accumulation. Women ended up in a vicious cycle of debt as they used the money
from the village banks for consumption purposes and had to borrow from money
lenders at high interest rate to repay. The observation from this study was that credit
was not an effective tool in helping the poor enhance their economic growth.
Theoretically, credit increases income for households and as income of SMEs
increases more resources are available for expenditure, savings and investment in
assets. (Hoque, 2008) found out that micro-credit improves capacity to cope economic
difficulties as there is positive influence of microcredit on the well being of
borrowers. Growth of SMEs depends on the capital injection into the business and
non financial services like training to develop the SMEs sector.
4
1.1.4 SMEs in Kenya In Kenya, the micro, small and medium enterprises are variously referred. They fall
under the informal sector Juakali as mostly they start in open. The sector creates
employment opportunities for the young generation that is jobless and cannot find
jobs in the formal sector. Currently the government gives much attention to the sector
because it is the solution to the crippling unemployment levels among the youth.
Kenya in the past has recognized informal enterprises as more than a residual
employer for the survival of poor households in its development policies.
SMEs operation in Kenya cuts across almost all sectors of the economy and sustain
majority of households. SMEs form a breeding ground for businesses and employees
creating employment. Despite of flourishing of SMEs, they still face challenges
related to accessing credit. Commercial banks need collateral for them to issue loans
and the entrepreneurs are unable to provide the necessary collateral needed for loan
requests (Wanjohi, 2009).
1.2 Research Problem Microcredit provides loans to SMEs, who basically are unable to secure credit due to
poverty levels, unemployment, and underemployment, lack of collateral and credit
history. SMEs rely on credit for their growth. The SMEs need both financial services
and non financial services to enable them sustain their businesses. SMEs need
business management skills on how to wisely invest by using the loans granted so as
to make their businesses profitable.(Helmes ,2007) states that, lack of access to credit
is a general reason why many people in developing countries remain poor. Demand
for credit by SMEs in Kenya, has continued to rise as many youths graduating from
colleges diverting their interests in starting small businesses to apply the skills they
have acquired from their institutions.
Previous studies imply that microcredit is an important tool in poverty alleviation. On
the other hand there is criticism about the studies. (Karnani, 2007) disagrees implying
that microcredit leads borrowers to a debt trap. The problem of microcredit lies with
SMEs who possess little capital, lack economies of scale, their businesses encounter
low productivity that result to minimal earnings which cannot lift the poor out of their
5
poverty situation. Credit cannot overcome control on its own .In spite of SMEs having
access to credit, they lack control over the loans to be granted.
A number of studies have been done in Kenya on microcredit. (Gitonga, 2012) carried
a study on micro-crediting for low income earners. The study found that from the year
2006 there has been an upward trend in borrowing, more people are taking up
loans to start small enterprises which are helping to create informal jobs amidst the
crowding in the formal sector.Gitonga also found that people need to be educated on
the micro-crediting program and show different business opportunities to venture
into. On the other hand, an investigation on determinants of microcredit provision to
women entrepreneurs by Mfis in Kenya ,showed that poor product design by Mfis,
lack of freedom and bargaining power by women and the relegating status for women
to position subordinates in resource management had the greatest influence on micro-
credit provision to women by Mfis (Onchiri,2012).In Kenya, entrepreneurs have
suffered lack of access to credit as a result of not having collateral and entrepreneurs
do not get much loan as per the application by the entrepreneurs to the Mfis(Pius
,2010).This raises the question whether microcredit leads to the growth of SMEs .This
study therefore seeks to fill in the research gap by determining the relationship
between microcredit and the growth of small and medium enterprises.
1.3 Objective of the Study
To determine the relationship between microcredit and the growth of SMEs in Kenya.
1.4 Value of the Study The government wants to grow the economy in double digits. The findings of this
study will enable the government design effective economic policy strategies which
will ease accessibility of credits. Measures to be put in place, if properly implemented
will enhance growth of SMEs. Effective implementation will see the SMEs contribute
directly to the economic growth and promote equitable development.
The public will be able to get enlightened on the necessity of credit in the SMEs
sector. They will appreciate the job opportunities offered by the sector and participate
by starting their businesses to earn income to support their needs instead of fully
6
depending on government aid. The public involvement will see the country alleviate
poverty and hence achieve vision 2030 of poverty eradication goal.
The other researchers interested in this area of study will want findings of previous
research. The findings of this research will serve as additional literature to be used as
reference materials in developing further studies. Researchers, who are entrepreneurs
in the SMEs and have experienced failure of businesses without identifying reasons
leading to failure, would require reasons and this study will address failures and give
success measures.
The Mfis will be able to train their credit officers on what kind of investment
opportunities are viable for SMEs. The credit officers will not only give out credit, but
also advise borrowers on profitable projects to consider investing in. Borrowers
should repay the loans that have become fruitful in their business and not having
burdens repaying with little improvements experienced from the funds granted to
them as loans.
7
CHAPTER TWO
LITERATURE REVIEW
2.1Introduction
This chapter presents various theories on the effects of microcredit on the SMEs. It
points out the theoretical literature, empirical studies and general literature which is of
importance to this study. The general literature covers the constraints on SMEs
sources of finance and factors that affect accessibility to credit.
2.2Theoretical literature The aim of this section is to review theoretical literature related to microcredit. These
theories seek to emphasize on the need of external funds as source of finance when
internal funds do not sufficiently meet the needs of the firm. The theories are credit
risk theory, liquidity and credit theory for money.
2.2.1 Credit Theory of Money This theory seeks to illustrate the relationship between credit and money. Proponents
of this theory argue that money is best understood as debt even in systems often
understood as using commodity money. The first formal credit theory of money arose
in the 19th century. (Graeber, 2011) argued that for most of human history, money has
been widely understood to represent debt, though he concludes that even prior to
modern era. According to Innes, the credit theory is the sale and purchase in the
exchange of a commodity for credit. From the main theory springs the sub theory that
the value of credit or money does not depend on the value of any metal, but on the
right which the creditor acquires payment meaning satisfaction for credit. On the
obligation of the debtor to pay his debt and conversely on the right of the debtor to
release himself from his debt by the tender of an equivalent debt owed by the creditor.
The obligation of the creditor to accept the tender in satisfaction for the credit. Innes
goes on to note that a major problem in getting the public to understand the extend to
Which monetary systems are debt based is the challenge of persuading them that
things are not the way they seem. (Banking law journal, vol 31)
8
2.2.2 Liquidity Theory (Emery, 1984) proposes that credit rationed firms use more trade credit than those
with normal access to financial institutions. When a firm is financially constrained the
offer of trade credit makes up for the reduction of credit offer from financial
institutions. In line to Emery’s view, firms with better access to capital markets can
finance those that are credit rationed(.Nielson ,2002) obtained empirical evidence by
use of small firms as a proxy for credit rationed firms, found out that when there is
monetary contraction; small firms react by increasing the amount of trade credit
accepted. Financially unconstrained firms are less likely to demand trade credit and
prone to offer it.
2.2.3 Credit Risk Theory Credit risk is the risk of default or reductions in market value caused by changes in
the credit quality of issuers or counterparties. Adverse selection and credit exposure is
a case in business lending, the borrower knows more than its lender. Being at an
informational disadvantage, the bank, in light of the distribution of default risks across
the population of borrowers, may find it profitable to limit borrowers’ access to the
bank’s credit, rather than allowing borrowers to select the sizes of their own loans
without restriction. An attempt to compensate for credit risk by increasing a
borrower’s interest rate increases with the size of loan.
Moral hazard. One of the reasons that large loans are more risky than small ones,
other things being equal, is that they provide incentives for borrowers to undertake
riskier behavior. The obvious defense against the moral hazard induced by offering
large loans to risky borrowers is to limit access to credit. Large borrowers in default
are often in a better bargaining position and can thereby extract more favorable terms
for bankruptcy or restructuring that can small borrowers.
Conclusion, it was pointed out by the author to be due to poor infrastructure and low
income as constraints to MFI.
2.3Factors that Affect SMEs Access to Credit Start-up business: Most entrepreneurs are faced with challenges of how to be funded.
Some Mfi weigh options on whether to consider existing entrepreneurs or the starters
9
in the business. Businesses financed from scratch by Mfi are considered to create an
impact to the society by alleviating poverty in increasing their level of income. The
startup business also needs other services like skills training to equip them in their
operations. Level of employment SMEs development: Mfi provide services and
products to SMEs depending on the stage of the business is at.The levels in this case
include; unstable survivors, stable and growth enterprises (Steel, 2003).
Unstable survivors: These are the kind of businesses considered not to be credit
worthy due to lack of stability. The chances for its survival are limited and it therefore
consideration of mfis to revert the situation remains wastage of time and costs
increase with time. Growth enterprise: The business shows high possibility to grow
and microfinance institutions are interested in the objective of the SMEs to create jobs
and move from the informal sector to formal. Mfis help provide services that lead to
SMEs gaining economic independence to meet their needs. Stable survivors: This
kind of business rarely grows due to low profit margins which inhibit them to reinvest
and unstable environment. Basically SMEs at this level need funds from Mfi to meet
their production and consumption needs (Yaron, 1997).
2.4 Impact of Microcredit on Growth of Small and Medium
Enterprises SMEs need capital injection to facilitate their operations and growth, but the existence
of the financing gap requires microcredit to fill the gap.(Derbile,2003) implies that
success of microcredit has been achieved in alleviating poverty in developing
countries.SMEs gain selfemployment,create job opportunities and women gain
economic empowerment to meet their family needs.
(Mayoux, 1997) asserts that microcredit programmes have been promoted as among
key strategies for poverty alleviation and women empowerment.Economic
independence is gained by SMEs enabling them meet their basic needs.Microcredit
programmes provides SMEs with access to networks and equipping markets to
necessitate wider experience by individuals.
10
Microcredit programmes results in social benefits.Establishments of adult literacy
programmes have been put in place to encourage business training.Providers of
education gain earn income as they are employed to do so.SMEs that participate in
literacy programs,places them in better position in decision making hence reducing
chances of failure.
(Hoque,2008) shows that, many studies have been done in the past and reveal that
micro credit improves capacity to cope with economic difficulties because there is a
positive influence on the well being of borrowers.
Despite the positive impacts of micro credit, there are arguments against microcredit.
Micro credit does not create assets for the poor and the very poor borrowers, but
increases income to meet daily expenditure. To some it reduces assets due to the
demand of repayment of loan as it is severe that borrowers are compelled to sell assets
to repay loan.
2.4.1 Constraints of SMEs Growth in Kenya SMEs face issues that affect the growth and profitability of their businesses, which
diminishes the ability to contribute effectively to sustainable development.The below
constraints are associated with the sector.
Regulatory constraint: The process involved in application of certificates and
registration is burdensome to SMEs. The process requires time and money for the
SMEs to be allowed to carry out their business activities as per the legal law
requirements. Failure to comply with the regulatory standards risks closure and
penalties by the law.
Lack of credit: Access to finance remains a challenge for SMEs. Insufficient funds
affect technology choice by limiting the number of alternatives to be considered. In
Kenya credit constraints forces underdeveloped capital markets to rely on self
financing or borrowing from friends. Lack of access to long term credit for SMEs
forces them rely on high cost short term finances (Wanjohi and Mugure,2008).
11
Inadequate business skills: The scarcity of entrepreneurial and business management
skills remains a constraint on SMEs development. For instance juakali sector which is
informal boosts Kenya’s economy. The individuals who run the juakali sector lack
adequate business skills which are usually attributed to low levels of education.
HIV/AIDS pandemic: The disease threatens the survival of SMEs. It is as much
business issue as well as a humanitarian concern, the IFC aims at promoting the
involvement of the private sector in the fight against the disease. SMEs being the
leading sector in private sector, IFC provides training programs to build businesses
mitigate the impact o HIV/AIDS in their operations (Conner, 2000).
2.4.2 Sources of Finance for SMEs
Survival and growth of SMEs relies on a dependable source of funding the business.
There are informal and formal ways of credit accessibility as a source of funds.
(Schein, 2004) argues that choice of financing a business entity is a crucial part of
whether the existing business can survive. He states that the choice of financing is a
requirement for an entrepreneur to raise cash when you possess a limited
history.Schein makes it clear that there exist various sources of financing a business
entity but sustainability of the alternatives depends on the stage of the business.
Sources of finance include; getting funds from friends, relatives, personal savings,
venture capital, factoring and assist based lending.
(Brody, 2004) identifies microcredit as a key strategy in attaining the millennium
development goals. The goal of poverty eradication and financial systems that meet
the needs of the very poor people. Microcredit remains a way of intervention to
development which can offer social benefits.
2.4.3 Microfinance Institution-SMEs relationship (Omeke,2010) emphasized that microfinance institutions provides both financial and
non financial services to SMEs, loans, savings mobilization, micro insurance and
money transfer. The microfinance industry has been identified as a tool of poverty
eradication and improvement of household welfare. For accessibility of funds to
become a reality a relationship of cooperation between lenders and clients need to
coexist.
12
(Ozkan, 2004) argues that maintaining and building relationships with financial
institutions improve firm’s ability to access external financing. He suggests that firm’s
with higher proportion of bank debt enables accessibility of external financing more
easily. Establishing Mfi relationships with SMEs reduces information asymmetry and
agency problems. The valuable information required to be provided by SMEs to Mfi
are disclosed. Establishing stable links with financial institutions improves availability
of funds by lowering their costs.
(Kumar, 2007) concurs with previous studies that good relationship town SMEs and
mfis helps them easily access finances and information. He adds that capacity
building of staff preparedness is a task Mfi enhances as a way of operation rapport
between staff and remote clients. In case of emergency, Kumar established that Mfi
personals were often the first to reach affected communities.
2.5 Indicators of Growth This study will focus on increase in volume of sales, employment levels, and
profitability and total assets as a measure of growth of SMEs.
2.6 Review of Empirical Studies Muthengi,(2012) conducted a study on the impact of microcredit on the growth small
and microenterprises in Kitui District. His findings were that 80% of the sampled
population used credit before. The result also showed that microcredit had impacted
positively on the growth of SMEs in the District. The study recommended that the
government should improve the existing facilities and establish those which are
lacking in order to better the working atmosphere and hence performance of SMEs
operating in the district.
Pius,(2010) investigated on the influence of microcredit finance on the growth of
small scale women entrepreneurs in Kenya. She used survey research designs to
conduct the study. The target population as the small scale women entrepreneurs in
Mosocho division, Kisii central district. The sample study constituted 36 respondents
out of 120 entrepreneurs spread over three markets. Simple random sampling
technique was used to determine the study sample. The research findings revealed that
13
the small scale entrepreneurs faced problems in operating their businesses. Lack of
collateral to access loans came up as a major challenge in the study. The study
established that the entrepreneurs did not receive as much loan as they needed and the
process involved in accessing loans was lengthy. The further revealed the repayment
period affected the cashflow into the business. The other major finding was that most
of the entrepreneurs had not been trained on the basic business management skills and
therefore most of them had no focused strategies but operated on trial and error
methods. Inspite of many challenges, the study found out that most of the
entrepreneurs depended wholly on their businesses. They said that they could still
take loans even with the high interest rates long as the loans are available. The
entrepreneurs seemed positive about the loans they get from the lenders.
Microfinance contributes to the reduction of property through its impact on income
and asset level as per findings carried out by( Mosley,1999).The mechanism through
which poverty levels are reduced; keep on varying from one institution to the other.
On average institutions that offer small loans reduce poverty much more by lifting
borrowers above the poverty line. On the other hand institutions that give larger loans
reduce it more by expanding the demand amongst the poor.
Amin et al, (2003) carried out panel data set on monthly consumption and income
before they received loans. The findings were that microcredit is successful in
reaching the poor and failure to the vulnerable. Coleman (1999) explains that debt is
not necessarily an effective tool towards helping the poor enhance their economic
condition. The poor are poor as a result of other reasons rather than lack of access to
credit.
Kessy,(2006)conducted a study on contributions of microfinance institutions on
poverty reduction. His findings were that Mfis operations impacted positive changes
in the living standards of people who accessed their services. Clients of Mfi had
complaints on the higher interest rates charged and the weekly meeting was
considered time wastage. The clients preferred rather than weekly meetings the time
be used in doing productive activities. The study recommended Mfi to lower its
interest rate, increase grace period and provide proper planning to SMEs.
14
Hulmes, (1998) found evidence of a trade-off between the very poor and substantial
impact on household income. His findings were that programmes with higher income
households had a greater impact on household income. The individuals below the
poverty line did not gain much and the very poorest were negatively affected. The
poorest were more risk averse and used their loans to maintain consumption levels
rather than improved technology.
Nicholas, (2004) carried out a case study to establish the impact of Mfi upon the lives
of the poor in the rural setting. His findings were that participation of poor in Mfi
program led to positive impacts in their personal life. Their income increased,
spending on educational and health also increased therefore improving the standards
of living. There were visible sign of higher wealth level within the village.
Coleman et al, (2005) argued that management of mfis should assess and recommend
projects to be funded. Findings overtime assists businesses realize which kind of
business experience leads to the least kind of business failures. The managers of Mfi
are in position to offer advice to their clients due to knowledge and skills they
possess. For management to be able to know if funds are properly and efficiently put
to use, monitoring of operations carried out by SMEs reduce default rate.
Chijoriga, (2000) evaluated the performance and financial sustainability of Mfi in
Tanzania. He randomly selected 28 Mfi and 194 SMEs, which resulted to findings
that the overall performance of Mfi in Tanzania is so poor and only few have clear
objectives. Further observation was that most Mfi lack participatory ownership and
are donor driven. The operational performance shows low loan repayment rates. In co
conclusion, it was pointed out by the author to be due to poor infrastructure and low
income as constraints to MFI.
2.7: Conclusion This chapter reviewed literature by other scholars on the impact of microcredit on the
growth of SMEs. Despite SMEs facing financial constraint, its impact on economy
cannot be overlooked. Availability of credit remains a necessity to the growth of
SMEs. Financing decisions for small and new ventures becomes complex when linked

15
to personal wealth.The agency problem faced by SMEs and information asymmetry
need to be addressed. The existences of microcredit gives an alternative to people that
are not included in the traditional banking sector and hence rely on the informal sector
to attend to their financial necessities.
16
CHAPTER THREE
RESEARCH METHODOLOGY
3.1 Introduction In this chapter, the study outlines the methods used by the researcher. It highlights the
research design, population, sample, data collection methods, data analysis
techniques, data validity and reliability.
3.2 Research Design According to (Orodho, 2003) research design is a programme that guides the
researcher in collecting, analyzing and interpreting observed facts. This study will use
descriptive and correlation methods. The researcher aimed at establishing the
relationship between variables of microcredit and growth of SMEs in terms of
employment and asset base. Both qualitative and quantitative approaches to data
analysis were used by the researcher in analyzing data. The researcher used a likert
scale of five in the questionnaire.
3.3 Population (Ngechu, 2004), population is a set of people, services, elements, events, group of
household that are being investigated. The target population of this study was
registered SMEs found within Nairobi. According to NSE during the listing of SMEs
there are about 50000 formally registered SMEs. This population was given
importance due to getting empirical evidence.
3.4 Sample A simple random technique was adopted to select a total of fifty ( 50). SMEs were
divided into small and medium enterprises. (Cooper and Schindler, 2003) random
sampling frequently minimizes the sampling error in the population, which in turn
increases the precision of any estimation methods used.
17
3.5 Data collection This involves the techniques to be used by the researcher in data gathering. Data was
collected from primary sources through self administered questionnaire. The
questionnaires were structured in a way to capture information from SMEs sector, on
the nature of business and its size. The study variables and comments from the
respondents before and after utilization of microcredit. The use of questionnaire
enabled the researcher to collect larger amount of data touching on the study. Drop
and pick later method was used as it was appropriate and convenient for the
researcher. It gave the respondents time to fill the questionnaires and also allowed the
researchers the opportunity to review the questionnaires for completeness before
picking.
3.6 Data analysis Data collected was checked for completeness of recording from the respondents and
its accuracy. The researcher used both descriptive and statistical approaches in
analyzing and processing the data. Both qualitative and quantitative methods were
used as they both complemented each other. Qualitative data was analyzed on a
comparison basis and merging those which were similar in narrative form. On the
other hand quantitative data was analyzed by use of statistical package for social
sciences (SPSS- Version 17.0) and Microsoft excel. The findings were presented in
the form of tables, figures and charts.
The hypothesis was structured to ascertain the extent to which microcredit has
enhanced the expansion capacity of SMEs in the study.
A multiple regression model was used to analyze the relationship between the
variables of growth of SMEs as depicted below
Yt =α +β1 X 1 +β2X2 + β3X3 +e ……………………………………………………. (1)
Table 3.1 Operationalization of the Variables symbol Variable
Y Growth of the Enterprise
Α Constant term
X 1 Microcredit (loan size)
X 2 Number of employees
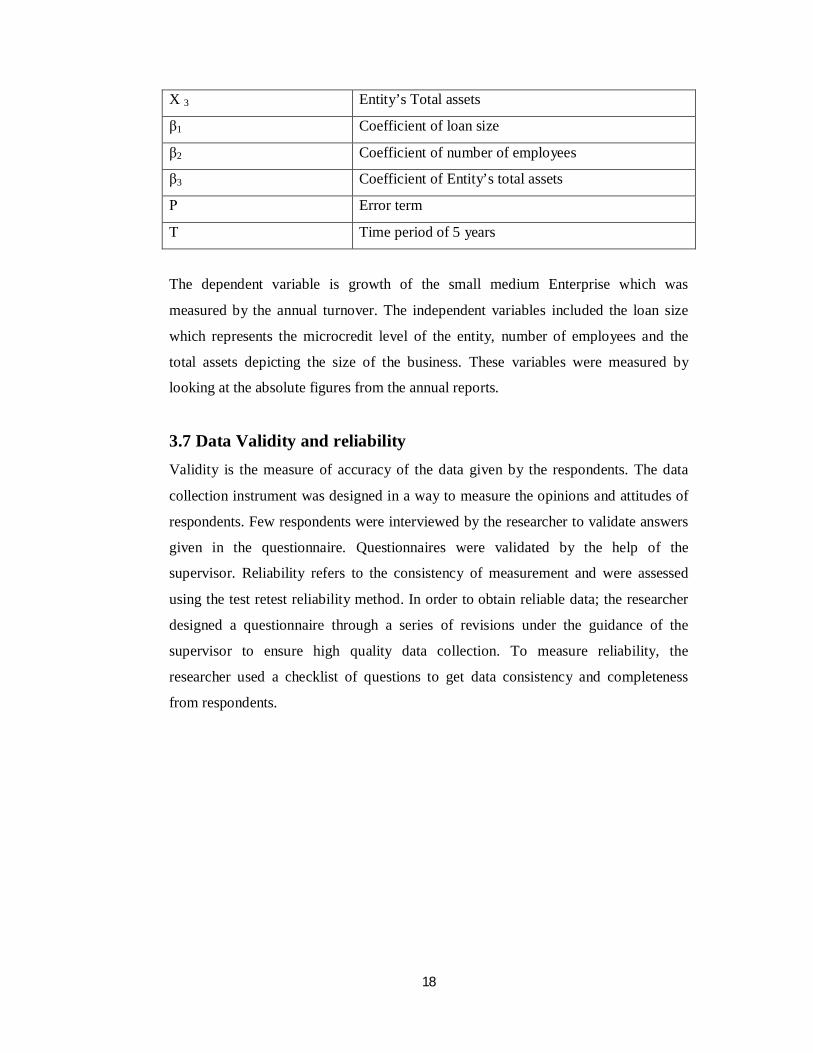
18
X 3 Entity’s Total assets
β1 Coefficient of loan size
β2 Coefficient of number of employees
β3 Coefficient of Entity’s total assets
Ρ Error term
T Time period of 5 years
The dependent variable is growth of the small medium Enterprise which was
measured by the annual turnover. The independent variables included the loan size
which represents the microcredit level of the entity, number of employees and the
total assets depicting the size of the business. These variables were measured by
looking at the absolute figures from the annual reports.
3.7 Data Validity and reliability
Validity is the measure of accuracy of the data given by the respondents. The data
collection instrument was designed in a way to measure the opinions and attitudes of
respondents. Few respondents were interviewed by the researcher to validate answers
given in the questionnaire. Questionnaires were validated by the help of the
supervisor. Reliability refers to the consistency of measurement and were assessed
using the test retest reliability method. In order to obtain reliable data; the researcher
designed a questionnaire through a series of revisions under the guidance of the
supervisor to ensure high quality data collection. To measure reliability, the
researcher used a checklist of questions to get data consistency and completeness
from respondents.
19
CHAPTER FOUR
PRESENTATION OF FINDINGS
4.1 Introduction This chapter presents the analysis of data collected from the administered
questionnaires. 50 questionnaires in total were administered but the researcher
managed to obtain 48 completed questionnaires representing a 96% response rate. The
questionnaire contained questions that addressed the objectives of the study.
4.2 Data Analysis and Presentation The collected questionnaires were edited and cleaned for completeness in preparation
for coding. Once the questionnaires were coded, they were entered into the Statistical
Package for Social Sciences (SPSS) version 17 computer package for analysis.
Descriptive statistics such as mean, standard deviation and frequency distribution
were used to analyze data. Quantitative technique was used to analyze the closed-
ended questions and qualitative technique was used to analyze the open ended
questions, content analysis was used to categorize common answers according to their
commonality. Inferential statistics (regression analysis) was also used to establish the
relationship between microcredit and growth of SMEs in Kenya.
4.2.1 Business Type Respondents were required to indicate the nature of their businesses.62.5% of them
indicated that their businesses were small and the remaining 37.5% of them were
medium. The findings therefore reveal that there was proportional representation of
the two categories of businesses. The findings are as shown in Table 4.1 and Figure
4.1 below.
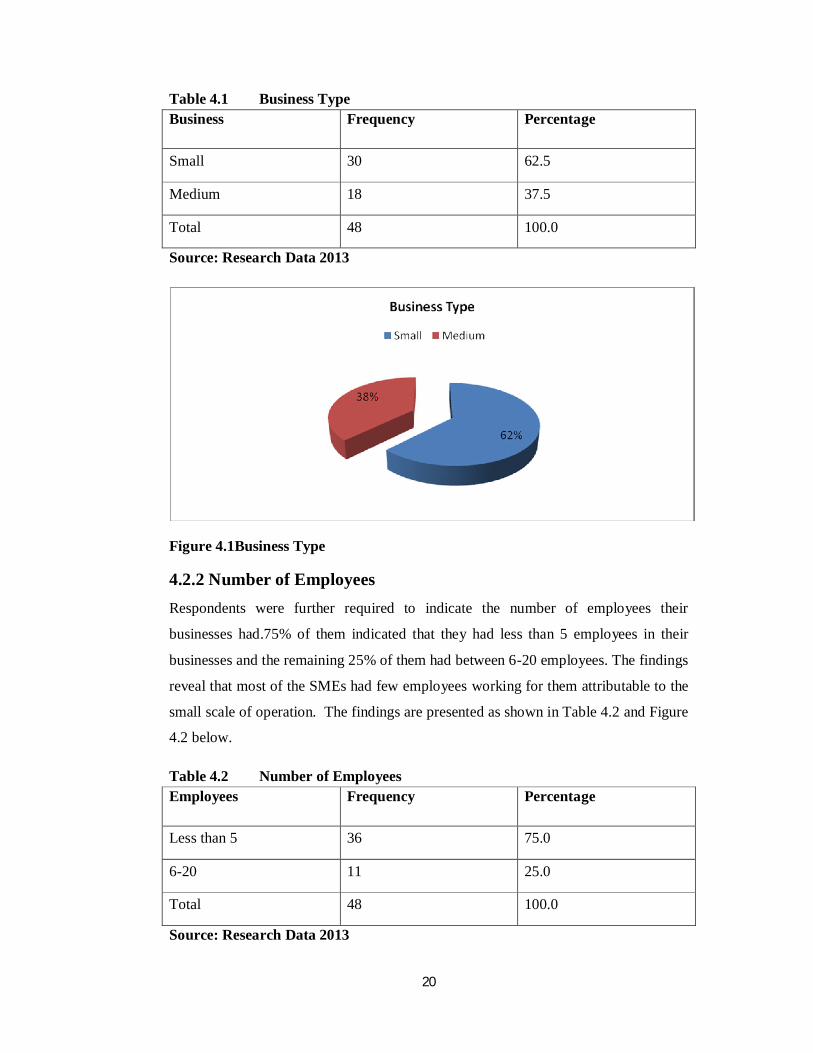
20
Table 4.1 Business Type Business Frequency Percentage
Small 30 62.5
Medium 18 37.5
Total 48 100.0
Source: Research Data 2013
Figure 4.1Business Type
4.2.2 Number of Employees Respondents were further required to indicate the number of employees their
businesses had.75% of them indicated that they had less than 5 employees in their
businesses and the remaining 25% of them had between 6-20 employees. The findings
reveal that most of the SMEs had few employees working for them attributable to the
small scale of operation. The findings are presented as shown in Table 4.2 and Figure
4.2 below.
Table 4.2 Number of Employees Employees Frequency Percentage
Less than 5 36 75.0
6-20 11 25.0
Total 48 100.0
Source: Research Data 2013
21
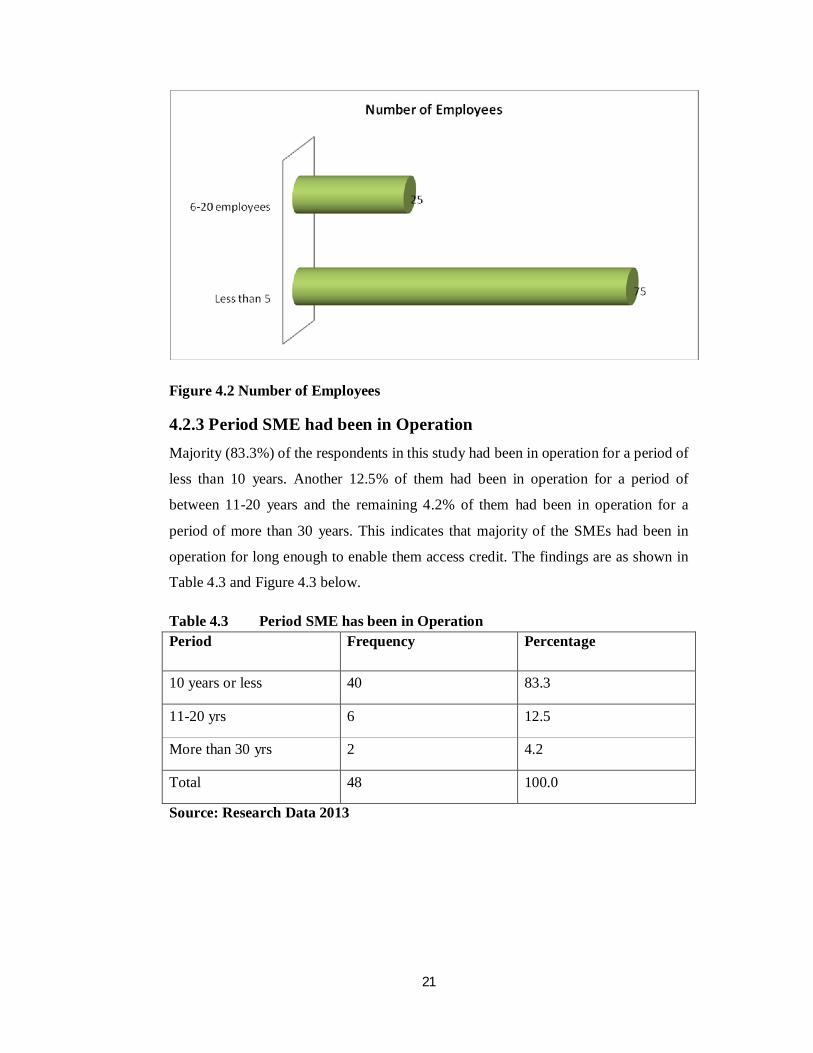
Figure 4.2 Number of Employees
4.2.3 Period SME had been in Operation Majority (83.3%) of the respondents in this study had been in operation for a period of
less than 10 years. Another 12.5% of them had been in operation for a period of
between 11-20 years and the remaining 4.2% of them had been in operation for a
period of more than 30 years. This indicates that majority of the SMEs had been in
operation for long enough to enable them access credit. The findings are as shown in
Table 4.3 and Figure 4.3 below.
Table 4.3 Period SME has been in Operation Period Frequency Percentage
10 years or less 40 83.3
11-20 yrs 6 12.5
More than 30 yrs 2 4.2
Total 48 100.0
Source: Research Data 2013
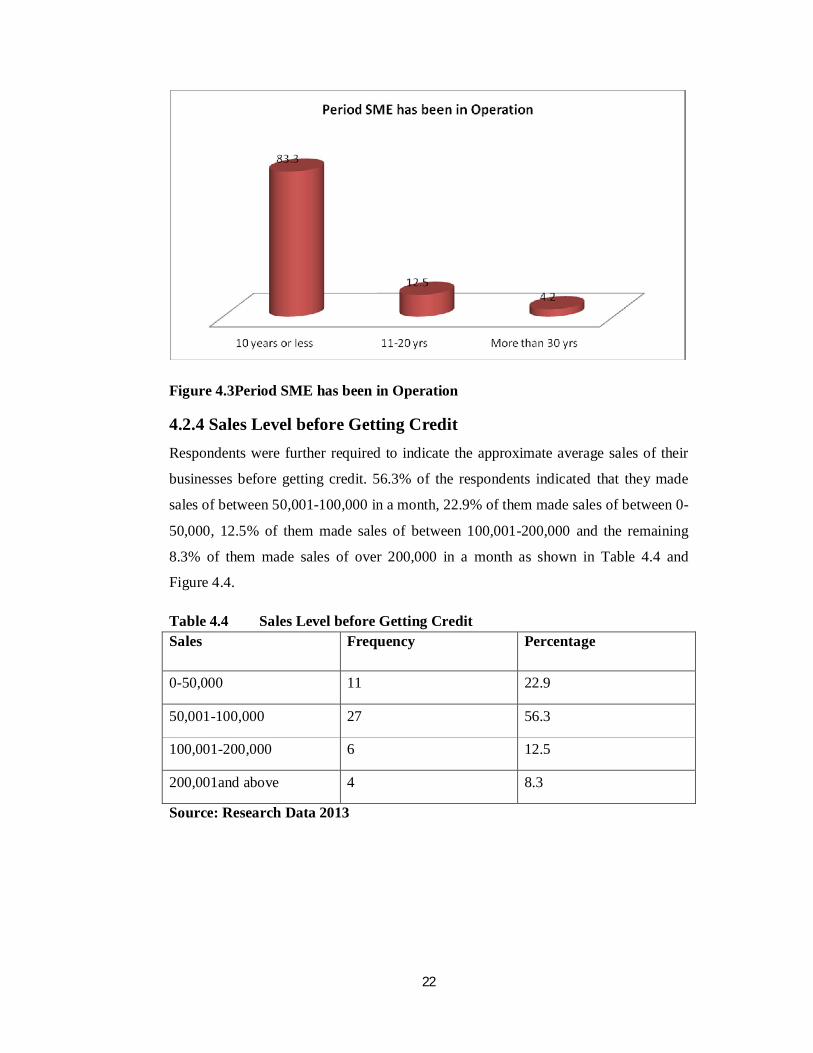
22
Figure 4.3Period SME has been in Operation
4.2.4 Sales Level before Getting Credit Respondents were further required to indicate the approximate average sales of their
businesses before getting credit. 56.3% of the respondents indicated that they made
sales of between 50,001-100,000 in a month, 22.9% of them made sales of between 0-
50,000, 12.5% of them made sales of between 100,001-200,000 and the remaining
8.3% of them made sales of over 200,000 in a month as shown in Table 4.4 and
Figure 4.4.
Table 4.4 Sales Level before Getting Credit Sales Frequency Percentage
0-50,000 11 22.9
50,001-100,000 27 56.3
100,001-200,000 6 12.5
200,001and above 4 8.3
Source: Research Data 2013
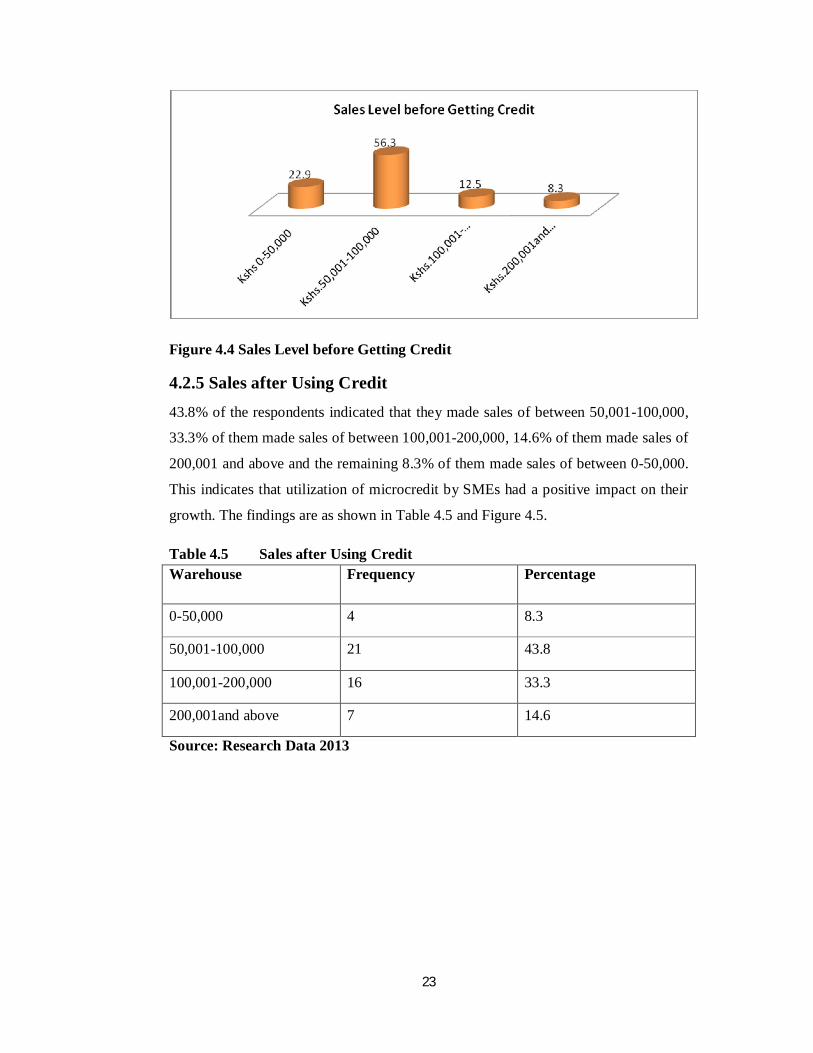
23
Figure 4.4 Sales Level before Getting Credit
4.2.5 Sales after Using Credit 43.8% of the respondents indicated that they made sales of between 50,001-100,000,
33.3% of them made sales of between 100,001-200,000, 14.6% of them made sales of
200,001 and above and the remaining 8.3% of them made sales of between 0-50,000.
This indicates that utilization of microcredit by SMEs had a positive impact on their
growth. The findings are as shown in Table 4.5 and Figure 4.5.
Table 4.5 Sales after Using Credit Warehouse Frequency Percentage
0-50,000 4 8.3
50,001-100,000 21 43.8
100,001-200,000 16 33.3
200,001and above 7 14.6
Source: Research Data 2013
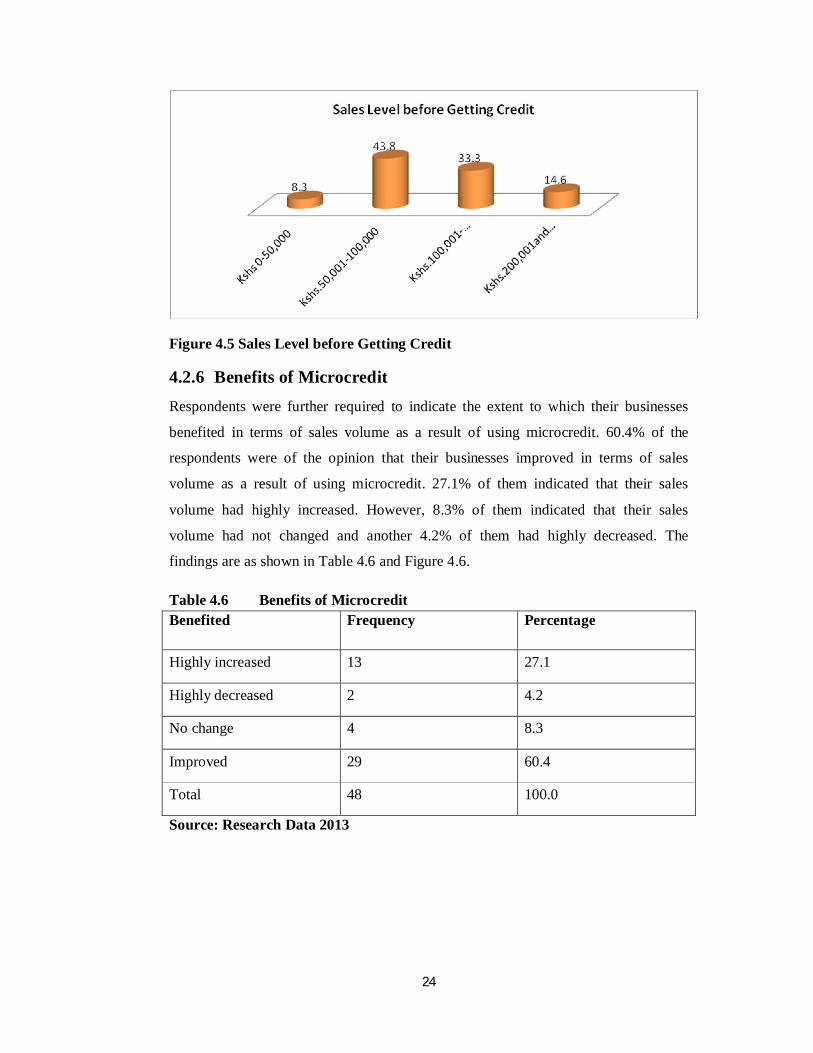
24
Figure 4.5 Sales Level before Getting Credit
4.2.6 Benefits of Microcredit Respondents were further required to indicate the extent to which their businesses
benefited in terms of sales volume as a result of using microcredit. 60.4% of the
respondents were of the opinion that their businesses improved in terms of sales
volume as a result of using microcredit. 27.1% of them indicated that their sales
volume had highly increased. However, 8.3% of them indicated that their sales
volume had not changed and another 4.2% of them had highly decreased. The
findings are as shown in Table 4.6 and Figure 4.6.
Table 4.6 Benefits of Microcredit Benefited Frequency Percentage
Highly increased 13 27.1
Highly decreased 2 4.2
No change 4 8.3
Improved 29 60.4
Total 48 100.0
Source: Research Data 2013
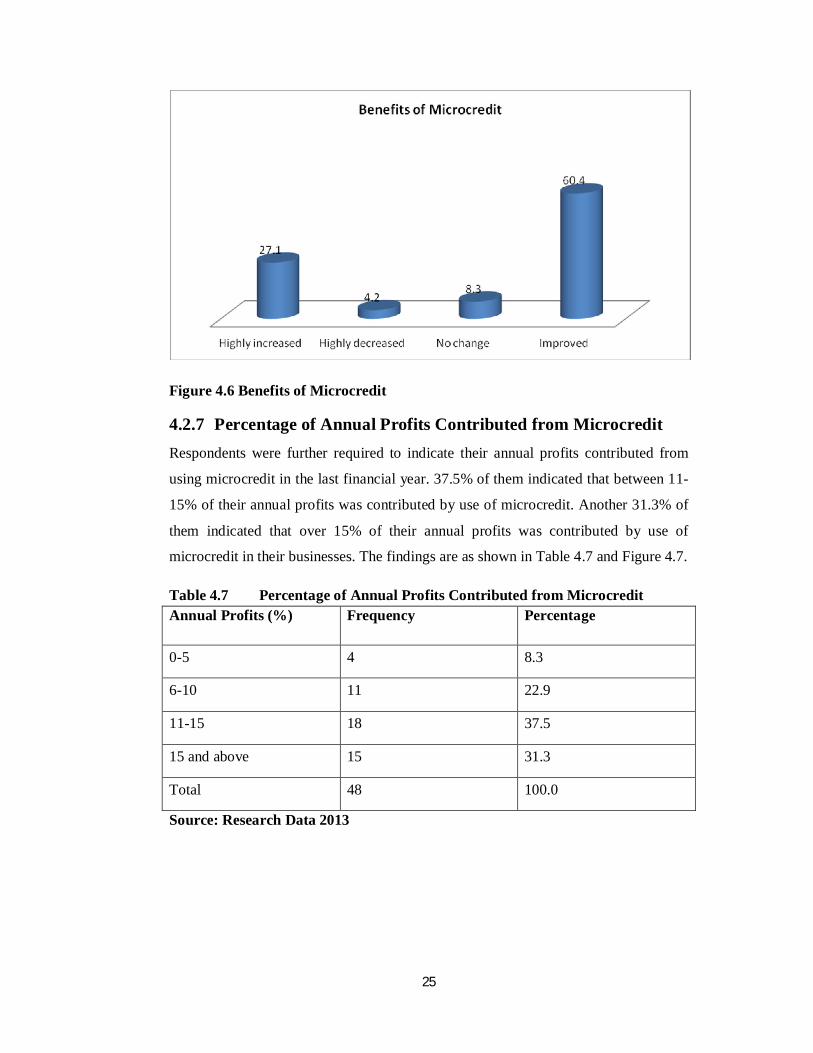
25
Figure 4.6 Benefits of Microcredit
4.2.7 Percentage of Annual Profits Contributed from Microcredit Respondents were further required to indicate their annual profits contributed from
using microcredit in the last financial year. 37.5% of them indicated that between 11-
15% of their annual profits was contributed by use of microcredit. Another 31.3% of
them indicated that over 15% of their annual profits was contributed by use of
microcredit in their businesses. The findings are as shown in Table 4.7 and Figure 4.7.
Table 4.7 Percentage of Annual Profits Contributed from Microcredit Annual Profits (%) Frequency Percentage
0-5 4 8.3
6-10 11 22.9
11-15 18 37.5
15 and above 15 31.3
Total 48 100.0
Source: Research Data 2013
26
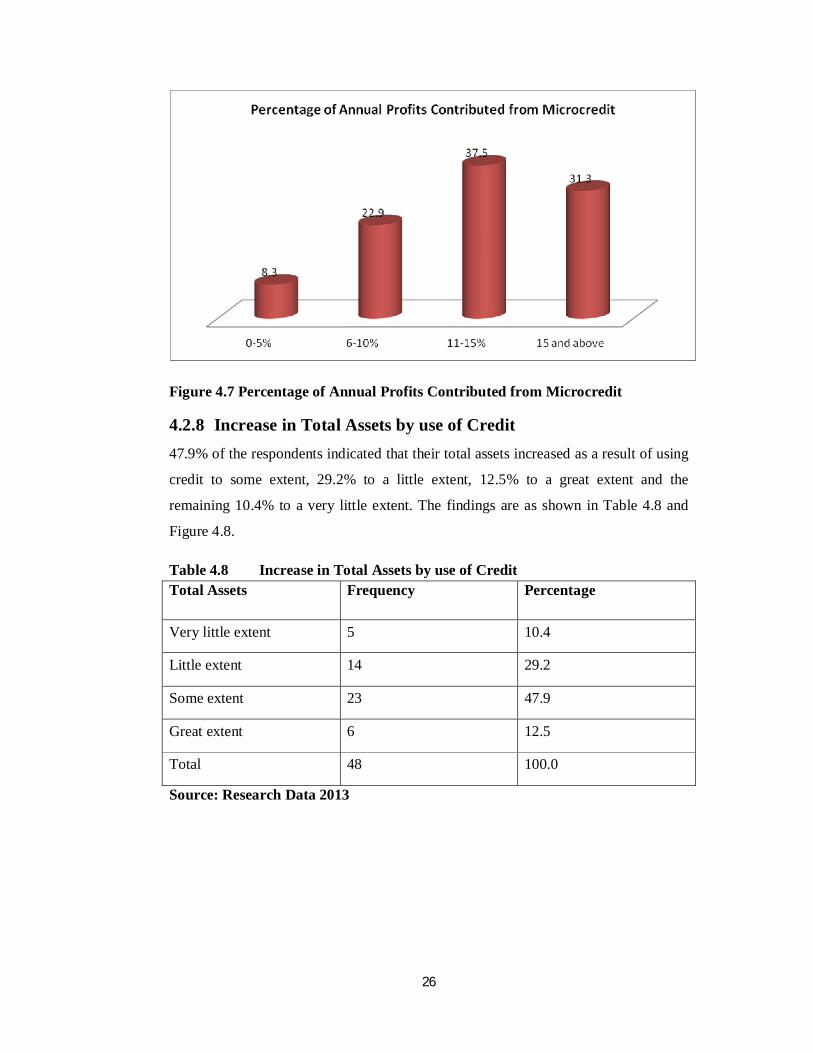
Figure 4.7 Percentage of Annual Profits Contributed from Microcredit
4.2.8 Increase in Total Assets by use of Credit 47.9% of the respondents indicated that their total assets increased as a result of using
credit to some extent, 29.2% to a little extent, 12.5% to a great extent and the
remaining 10.4% to a very little extent. The findings are as shown in Table 4.8 and
Figure 4.8.
Table 4.8 Increase in Total Assets by use of Credit Total Assets Frequency Percentage
Very little extent 5 10.4
Little extent 14 29.2
Some extent 23 47.9
Great extent 6 12.5
Total 48 100.0
Source: Research Data 2013
27
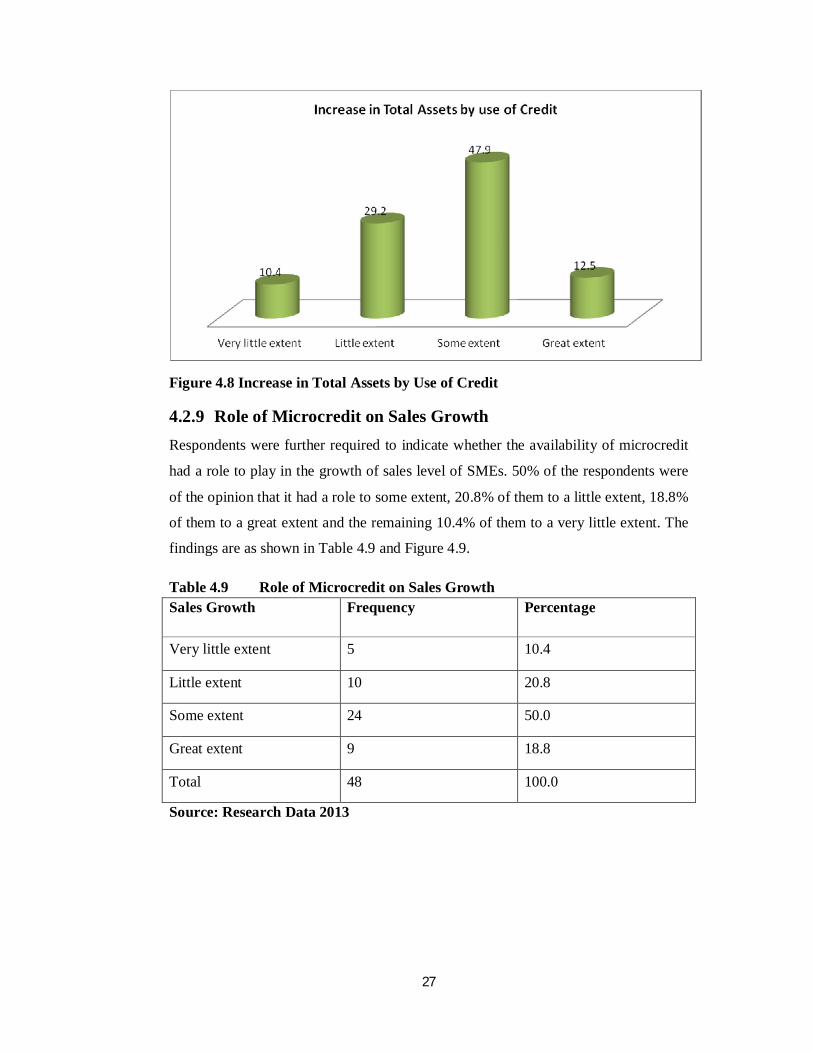
Figure 4.8 Increase in Total Assets by Use of Credit
4.2.9 Role of Microcredit on Sales Growth Respondents were further required to indicate whether the availability of microcredit
had a role to play in the growth of sales level of SMEs. 50% of the respondents were
of the opinion that it had a role to some extent, 20.8% of them to a little extent, 18.8%
of them to a great extent and the remaining 10.4% of them to a very little extent. The
findings are as shown in Table 4.9 and Figure 4.9.
Table 4.9 Role of Microcredit on Sales Growth Sales Growth Frequency Percentage
Very little extent 5 10.4
Little extent 10 20.8
Some extent 24 50.0
Great extent 9 18.8
Total 48 100.0
Source: Research Data 2013
28
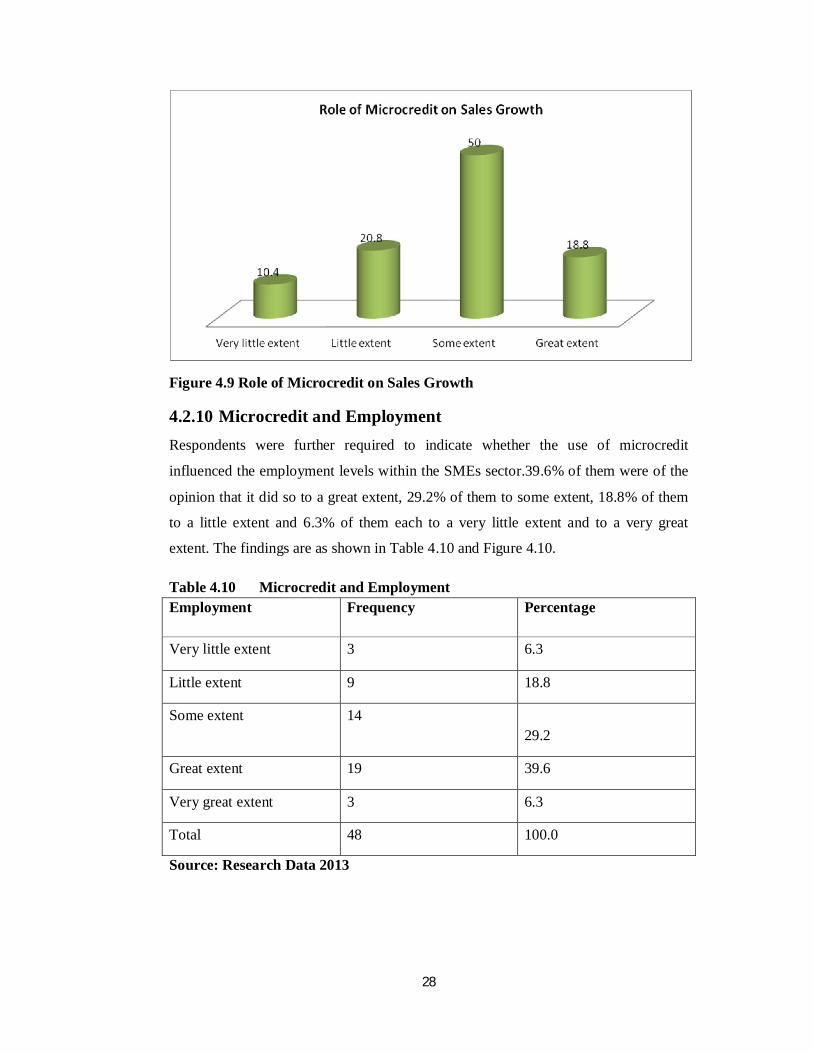
Figure 4.9 Role of Microcredit on Sales Growth
4.2.10 Microcredit and Employment Respondents were further required to indicate whether the use of microcredit
influenced the employment levels within the SMEs sector.39.6% of them were of the
opinion that it did so to a great extent, 29.2% of them to some extent, 18.8% of them
to a little extent and 6.3% of them each to a very little extent and to a very great
extent. The findings are as shown in Table 4.10 and Figure 4.10.
Table 4.10 Microcredit and Employment Employment Frequency Percentage
Very little extent 3 6.3
Little extent 9 18.8
Some extent 14 29.2
Great extent 19 39.6
Very great extent 3 6.3
Total 48 100.0
Source: Research Data 2013
29
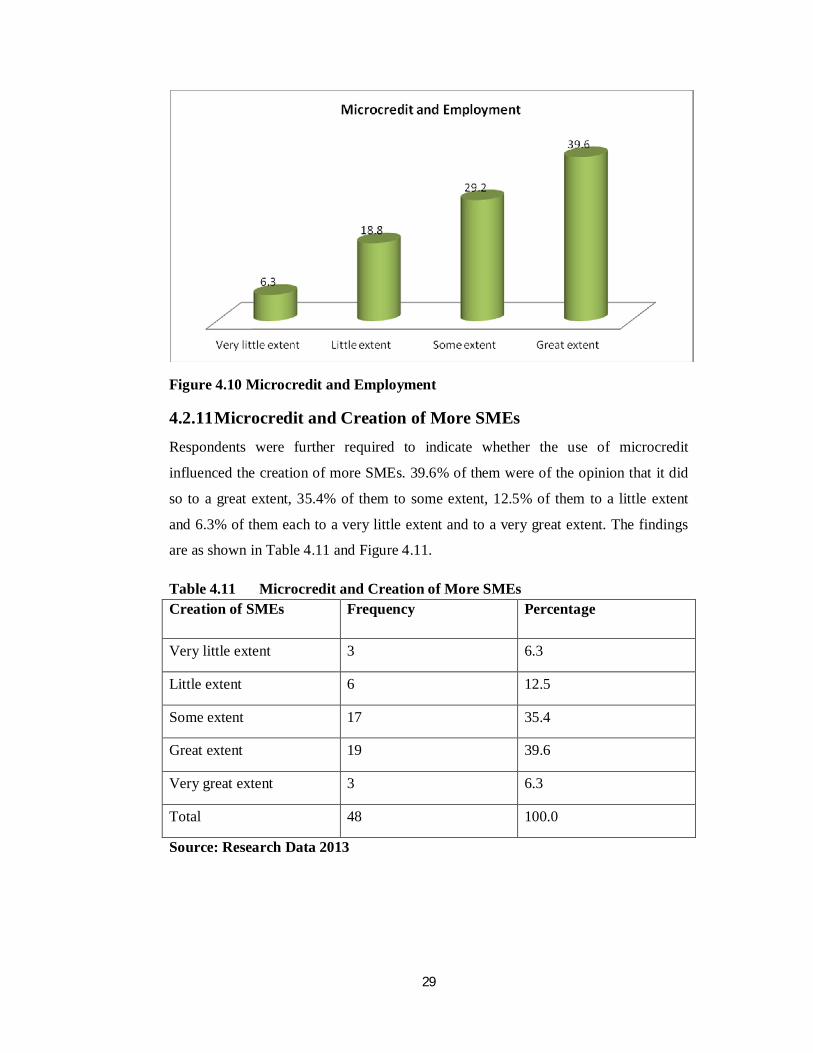
Figure 4.10 Microcredit and Employment
4.2.11 Microcredit and Creation of More SMEs Respondents were further required to indicate whether the use of microcredit
influenced the creation of more SMEs. 39.6% of them were of the opinion that it did
so to a great extent, 35.4% of them to some extent, 12.5% of them to a little extent
and 6.3% of them each to a very little extent and to a very great extent. The findings
are as shown in Table 4.11 and Figure 4.11.
Table 4.11 Microcredit and Creation of More SMEs Creation of SMEs Frequency Percentage
Very little extent 3 6.3
Little extent 6 12.5
Some extent 17 35.4
Great extent 19 39.6
Very great extent 3 6.3
Total 48 100.0
Source: Research Data 2013
30
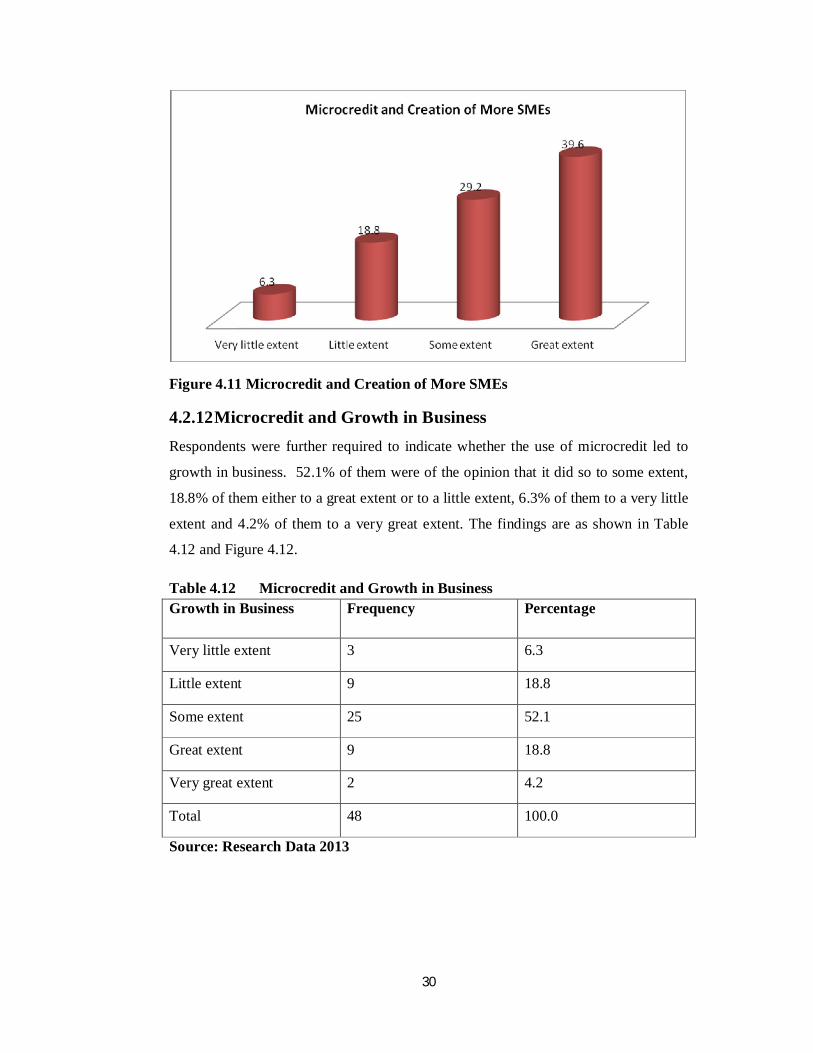
Figure 4.11 Microcredit and Creation of More SMEs
4.2.12 Microcredit and Growth in Business Respondents were further required to indicate whether the use of microcredit led to
growth in business. 52.1% of them were of the opinion that it did so to some extent,
18.8% of them either to a great extent or to a little extent, 6.3% of them to a very little
extent and 4.2% of them to a very great extent. The findings are as shown in Table
4.12 and Figure 4.12.
Table 4.12 Microcredit and Growth in Business Growth in Business Frequency Percentage
Very little extent 3 6.3
Little extent 9 18.8
Some extent 25 52.1
Great extent 9 18.8
Very great extent 2 4.2
Total 48 100.0
Source: Research Data 2013
31
Figure 4.12 Microcredit and Growth in Business
4.2.13 Use of Loans for Business Respondents were further required to indicate whether clients used all loans granted
for business use. 47.9% of them were of the opinion that they used the loans granted
to them for business activities to some extent, 33.3% of them to a great extent,10.4%
of them to a little extent, 6.3% of them to a very little extent and 2.1% of them to a
very great extent. The findings are as shown in Table 4.13 and Figure 4.13.
Table 4.13 Use of Loans for Business Use of loans Frequency Percentage
Very little extent 3 6.3
Little extent 5 10.4
Some extent 23 47.9
Great extent 16 33.3
Very great extent 1 2.1
Total 48 100.0
Source: Research Data 2013
32
Figure 4.13 Use of Loans for Business
4.2.14 Activities Clients use Loans for Respondents were further required to indicate other uses of loans granted other than
the intended purpose. They mentioned the following: Building houses; buying cars;
buying clothes, buying land; addressing emergencies like hospital fees; entertainment
and luxury; expanding and increasing stock; paying school fees; paying house rent
and lending to their friends. Respondents further indicated the following as ways of
avoiding credit misappropriation: Account for every use of loans; account for the
amount of cash lost through other activities such as emergencies; appraisal of the loan
purpose so that it can deliver, avoid using loans for other purposes; borrowing loans
with a viable project; commit the credit to business; diversifying fund to other uses
than business plan; educating business men on how to use it; ensuring that the credit
yield a return; give loan to credit worthy clients; lenders to advice SMEs while issuing
loans on how to account for loan spending; limit loan usage on unworthy projects;
monitoring credit usage; prior planning for the budget and stick to that budget; replace
the amount used for other purposes on time; sticking to purpose of the loan; the
microcredit should have a follow up programme to make sure clients have put the
loan in the stated purpose, thorough training through public awareness and
withdrawing enough or little cash needed from the bank to avoid excessive use or
misuse or purchasing things that were not planned for.
33
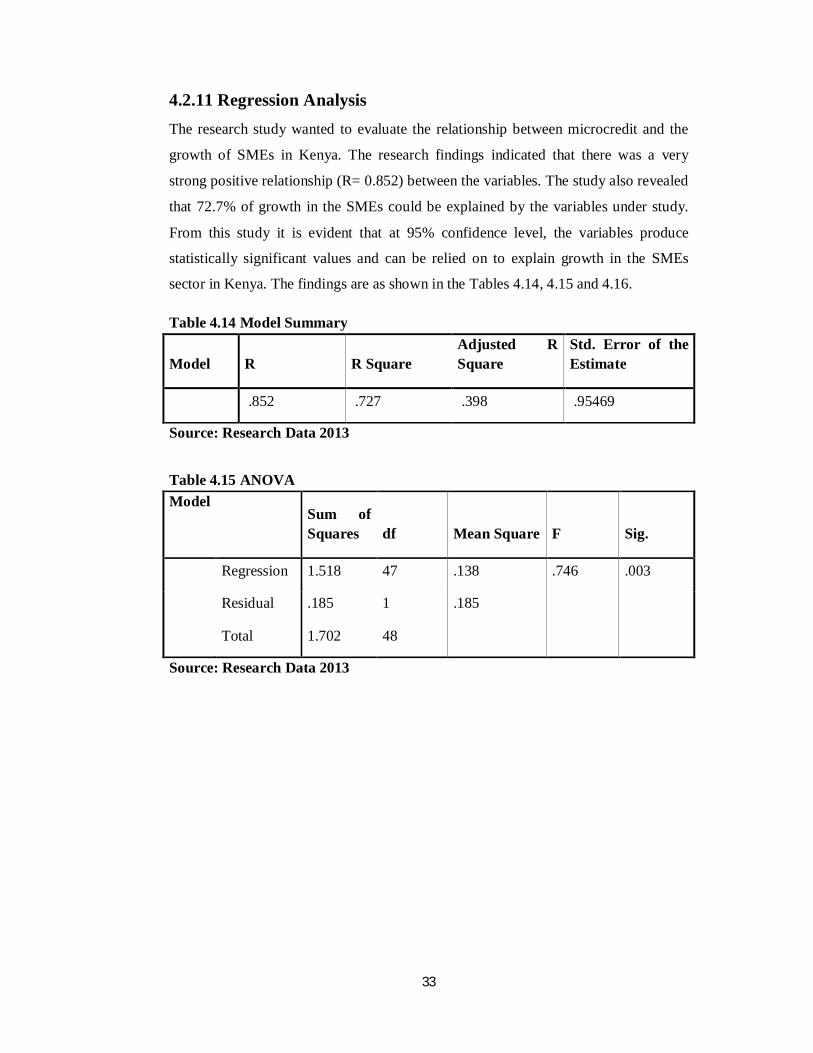
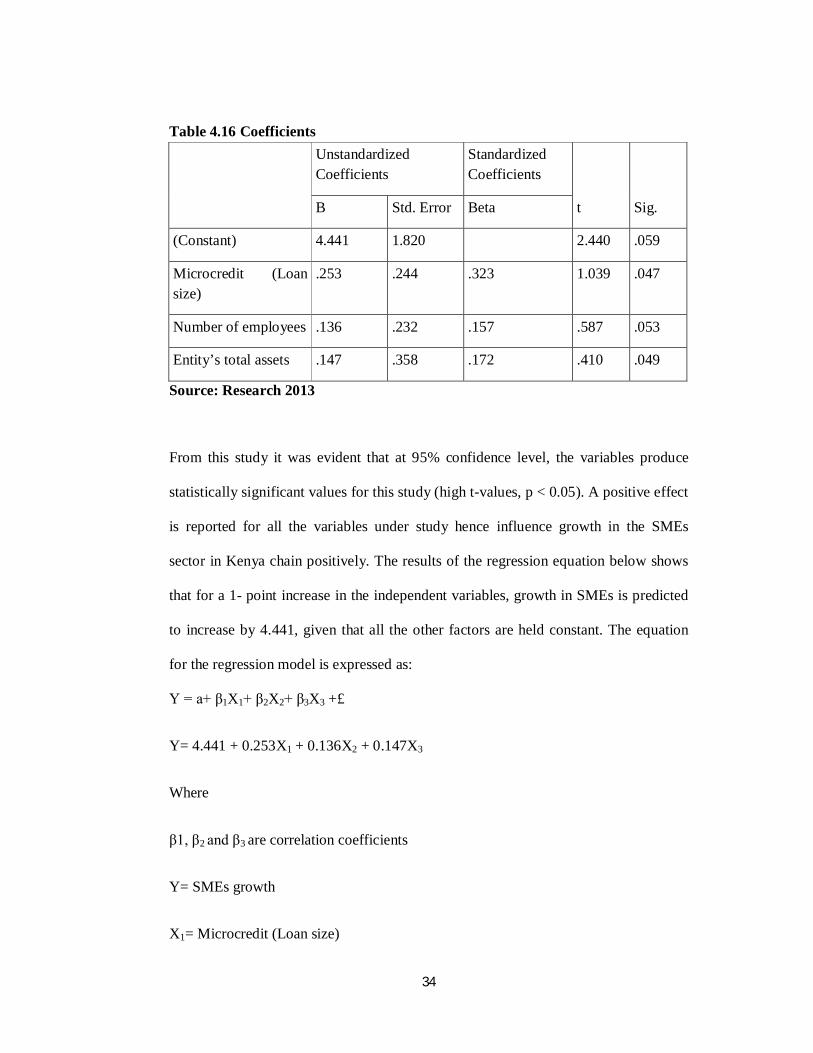
4.2.11 Regression Analysis The research study wanted to evaluate the relationship between microcredit and the
growth of SMEs in Kenya. The research findings indicated that there was a very
strong positive relationship (R= 0.852) between the variables. The study also revealed
that 72.7% of growth in the SMEs could be explained by the variables under study.
From this study it is evident that at 95% confidence level, the variables produce
statistically significant values and can be relied on to explain growth in the SMEs
sector in Kenya. The findings are as shown in the Tables 4.14, 4.15 and 4.16.
Table 4.14 Model Summary
Model R R Square Adjusted R Square
Std. Error of the Estimate
.852 .727 .398 .95469
Source: Research Data 2013
Table 4.15 ANOVA Model
Sum of Squares df Mean Square F Sig.
Regression 1.518 47 .138 .746 .003
Residual .185 1 .185
Total 1.702 48
Source: Research Data 2013
34
Table 4.16 Coefficients Unstandardized
Coefficients Standardized Coefficients
t Sig. B Std. Error Beta
(Constant) 4.441 1.820 2.440 .059
Microcredit (Loan size)
.253 .244 .323 1.039 .047
Number of employees .136 .232 .157 .587 .053
Entity’s total assets .147 .358 .172 .410 .049
Source: Research 2013
From this study it was evident that at 95% confidence level, the variables produce
statistically significant values for this study (high t-values, p < 0.05). A positive effect
is reported for all the variables under study hence influence growth in the SMEs
sector in Kenya chain positively. The results of the regression equation below shows
that for a 1- point increase in the independent variables, growth in SMEs is predicted
to increase by 4.441, given that all the other factors are held constant. The equation
for the regression model is expressed as:
Y = a+ β1X1+ β2X2+ β3X3 +£
Y= 4.441 + 0.253X1 + 0.136X2 + 0.147X3
Where
β1, β2 and β3 are correlation coefficients
Y= SMEs growth
X1= Microcredit (Loan size)
35
X2= Number of employees
X3= Entity’s total assets
4.3 Summary and Interpretation of Findings This research sought to evaluate the relationship between microcredit and the growth
of SMEs in Kenya. 62.5% of the businesses considered were small while the
remaining 37.5% of them medium hence relative representation of the two categories
of businesses. Majority of them had less than 5 employees attributable to their small
scope of operations. Majority of these businesses had been in business for a period of
less than 10 years (83.3%). However a significant 12.5% of them had been in business
for a period of between 10-20 years which was long enough for them to build a credit
history.
The following major findings were established: Access of credit significantly led to
increase in sales level. 60.4% of the respondents were of the opinion that their
businesses improved in terms of sales volume as a result of using microcredit. 27.1%
of them indicated that their sales volume had highly increased.37.5% of them
indicated that between 11-15% of their annual profits was contributed by use of
microcredit. Another 31.3% of them indicated that over 15% of their annual profits
was contributed by use of microcredit in their businesses. This reveals that access and
utilization of microcredit by SMEs leads to increased profitability due to increased
working capital. Further, 47.9% of the respondents indicated that their total assets
increased as a result of using credit to some extent. 50% of the respondents indicated
that microcredit influenced growth of SMEs to some extent. However, another 18.8%
of them indicated microcredit influenced the growth of SMEs to a great extent. On the
other hand 39.6% of them categorically indicated that microcredit increased
employment levels attributable to increased employment power. Businesses which
had more working capital can recruit more employees to execute assignments.
Another 39.6% of them were of the opinion that use of microcredit influenced the
creation of more SMEs. This is attributable to the fact that microcredit can be used as
initial capital.
36
The inferential statistics indicated that there was a very strong positive relationship
(R= 0.852) between the variables. The study also revealed that 72.7% of growth in the
SMEs could be explained by the variables under study. From this study it is evident
that at 95% confidence level, the variables produce statistically significant values and
can be relied on to explain growth in the SMEs sector in Kenya.
Muthengi,(2012) conducted a study on the impact of microcredit on the growth small
and microenterprises in Kitui District. His findings were that 80% of the sampled
population used credit before. The result also showed that microcredit had impacted
positively on the growth of SMEs in the District. Pius,(2010) investigated on the
influence of microcredit finance on the growth of small scale women entrepreneurs in
Kenya. The research findings revealed that the small scale entrepreneurs faced
problems in operating their businesses. Lack of collateral to access loans came up as a
major challenge in the study. Amin et al, (2003) carried out panel data set on monthly
consumption and income before they received loans. The findings were that
microcredit is successful in reaching the poor and failure to the vulnerable. Coleman
(1999) explains that debt is not necessarily an effective tool towards helping the poor
enhance their economic condition. The poor are poor as a result of other reasons
rather than lack of access to credit.
All the empirical studies are in line with the study findings. It can be concluded that
access and utilization of microcredit has a positive effect on the growth of SMEs in
Kenya.
37
CHAPTER FIVE
SUMMARY, CONCLUSIONS & RECOMMENDATIONS
5.1 Summary This research sought to evaluate the relationship between microcredit and the growth
of small and medium enterprises in Kenya. A descriptive and correlation research
design was used. This research targeted all registered SMEs found within Nairobi
County estimated at 50,000. This population was given importance due to getting
empirical evidence. A sample of 50 SMEs was selected using random sampling.
A semi-structured questionnaire which contained both open-ended and close-ended
questions was used to obtain information from the respondents. The questionnaire
was structured in such a way to capture information from SMEs sector, on the nature
of business and its size. The study variables and comments from the respondents
before and after utilization of microcredit. Drop and pick later method was used as it
is appropriate and convenient for the researcher. This gave the respondents time to fill
the questionnaires and also allowed the researcher the opportunity to review the
questionnaires for completeness before picking. The questionnaires contained
questions that addressed the objective of the study.
50 questionnaires in total were administered but the researcher managed to obtain 48
completed questionnaires. Access of credit significantly led to increase in sales level.
60.4% of the respondents were of the opinion that their businesses improved in terms
of sales volume as a result of using microcredit. 37.5% of them indicated that between
11-15% of their annual profits was contributed by use of microcredit. This reveals that
access and utilization of microcredit by SMEs leads to increased profitability due to
increased working capital. Further, 47.9% of the respondents indicated that their total
assets increased as a result of using credit to some extent. 50% of the respondents
indicated that microcredit influenced growth of SMEs to some extent. However,
another 18.8% of them indicated microcredit influenced the growth of SMEs to a
great extent. On the other hand 39.6% of them categorically indicated that microcredit
increased employment levels attributable to increased employment power. Businesses
which had more working capital can recruit more employees to execute assignments.
Another 39.6% of them were of the opinion that use of microcredit influenced the
creation of more SMEs. This is attributable to the fact that microcredit can be used as
38
initial capital. The inferential statistics indicated that there was a very strong positive
relationship between the variables. All the empirical studies are in line with the study
findings. It can be concluded that access and utilization of microcredit has a positive
effect on the growth of SMEs in Kenya.
5.2 Conclusion From the study findings, it would be safe to conclude that access and utilization of
microcredit leads to growth of SMEs. The conclusion is supported by the study
findings which showed that there was a very strong positive relationship (R= 0.852)
between the variables. The study also revealed that 72.7% of growth in the SMEs
could be explained by the variables under study. From this study it is evident that at
95% confidence level, the variables produce statistically significant values and can be
relied on to explain growth in the SMEs sector in Kenya.
Access of credit significantly led to increase in sales level. Businesses improved in
terms of sales volume as a result of using microcredit. There is increased profitability
of SMEs by using microcredit which is attributable to increased working capital.
There is a notable increase in the total asset base attributable to increased purchasing
power. Microcredit increases employment levels attributable to increased recruitment
power. Businesses which have more working capital can recruit more employees to
execute assignments. Use of microcredit influences the creation of more SMEs
because the credit facilities can be used as initial capital. These conclusions are
supported by both descriptive and inferential statistics as indicated.
5.3 Recommendations for Policy and Practice With due regard to the ever increasing desire to have growth in the SMEs sector in
Kenya , there is need to invest in proper microcredit strategies so as to meet these
expectations. This should be done in a manner in which all the stakeholders are
happy. This therefore calls for embracing proper microcredit strategies which are
39
acceptable, accessible, ethically sound, have a positive perceived impact, relevant,
appropriate, innovative, efficient, sustainable and replicable.
The management of lending institutions should ensure that they sensitize the owners
of SMEs and their management on best financial management practices. This will go
a long way in helping them to account for every use of loan, account for the amount
of cash lost through other activities such as emergencies. Lending institutions should
also advise borrowers on how to appraise their projects for viability so that they can
deliver and avoid misappropriations to execute projects they were not meant for. This
will go a long way helping the business owners realize the objectives of the business
and the credit to yield high returns. Banks should engage professional marketers of
credit facilities to the SMEs which will increase uptake of loans by SMEs. They
should also ensure that the lending procedure is clear and precise and timely to
encourage SMEs to take up the loans. Flexible repayment periods should be
facilitated by management of lending institutions.
The owners and management of SMEs should always monitor their credit usage to
avoid misappropriation. This should start even before accessing the credit by prior
planning for the budget and sticking to that budget. In the event of misappropriation
they should replace the amount used for other purposes on time so as to stick to
purpose of the loan. Banks should also have a follow up programme to make sure
clients have put the loan in the stated purpose.
The government should enact legislation which regulates the microfinance industry.
This legislation should ensure that banks and other lending institutions charge
affordable interest rates on SMEs. The legislations should also ensure that the lending
institutions accept a wide range of documentation to access a loan as a security.
Stringent requirements should be removed.
5.4 Limitations of the Study The researchers encountered quite a number of challenges related to the research and
most particularly during the process of data collection. Some respondents were biased
while giving information due to reasons such as privacy and busy schedules at their
places of work.
40
Due to inadequate resources, the researcher conducted this research under constraints
of finances and therefore collected data from SMEs located in Nairobi
County.Travelling to other places could be more costly to the researcher.
The research was also constrained by time factor and therefore longitudinal methods
study cannot be used. Time allocated for this project to meet the university’s deadline
caused the researcher spend sleepless nights analyzing data and researching about the
contents to be included within the topic of study.
The study will only sample 10% of the population making sampling restrictions a
limitation. Some respondents may be suspicious and hence give inaccurate
information. Aside from receiving inaccurate information, some considered
information on credit as confidential leading to rejection of responding to the
questionnaires.
5.5 Suggestions for Further Studies Arising from this study, the following directions for future research in finance are as
follows: First, this study focused on SMEs located in Nairobi and therefore,
generalizations cannot adequately extend to other SMEs outside Nairobi. Future
research should therefore focus on all SME in Kenya. A broad based study on
microcredit issues and performance in both private and public should also be carried
out.
41
REFERENCES
Amin, et al (2003).Does microcredit reach the poor and vulnerable? Evidence from
Northern Bangladesh, Journal of Development Economics, Vol. 70 (1).
Bowen, M., Morara, M., & Mureithi, M. (2009). Management of business challenges
among small and micro enterprises in Nairobi-Kenya. KCA journal of
business management, 2(1).
Chijoriga, M. M. (2000) .The Performance and Sustainability of Micro Finance
Institution in Tanzania. Working Paper in Tanzania.
Coleman, Isobel. (2005). Defending Microfinance. (Winter), Fletcher Forum of
World Affairs.
Coleman, B.E. (1999).The impact of group lending in Northeast Thailand. Journal of
Development Economics, Vol. 60(1) pp5.
Conner, G. (2000). Building the capacities of businesses to mitigate the impact of
HIV/AIDS in Africa..Journal of HIV/AIDS impact to the economy.
Derbile,E.K(2003).Women in nonfarm enterprise development and poverty reduction
in kasena-Nankane District.Kumasi unpublished master’s thesis
Kwame Nkrumah university of science and Technology.
David Graeber (2011.) The Myth of Barter debt.The theory on microcredit on credit
risk.
Emery, G.W(1984). A pure financial explanation for trade credit. Journal of financial
and quantitative Analysis
Gitonga,Barbara Daisy( 2012) .Micro-crediting for low income earners.Unpublished
master’s Thesis University of Nairobi.
42
Heidhues, F. (1995). Rural Finance Markets-An Important Tool to Fight Poverty.
Quarterly Journal of International Agriculture Vol.34 No.2, pp 105-
108.
Hulmes, D. 1997. Impact assessment methodologies for micro-finance: a review.
Paper prepared for the virtual meeting (April 17-19) of the CGAP
working group on impact assessment methodologies
Hoque, Seerajul (2008). Does Micro credit Programs in Bangladesh Increase
Household ability to Deal with Economic Hardships. (www.mpra.ub,unimuenchen.
de/6678/ (accessed on 14 April 2008).
Kessy, S.A and Urio, F (2006). The Contribution of Microfinance Institutions to
Poverty Reduction in Tanzania, Research Report No. 06.3 – REPOA, Mkuki na Nyota
Publishers, Dar es Salaam
Ledgerwood J. (1999). Microfinance handbook: An institutional and financial
perspective, World Bank, Washington, D.C. 2, 5-7
Littlefield, E. & Rosenberg, R. (2004). Microfinance and the poor.Journal of
Development Economics, 78(2).
Montogometry R.,(1996). "Disciplining or Protecting the Poor? Avoiding the social
costs of Peer Pressure in Micro-Credit Schemes". Journal of
international Development 8, 289-305
Mosley, P. (1997). The use of control groups in impact assessment for microfinance
23 mimeo, Washington DC, Consultative Group to Assist the Poorest
(CGAP).
Mayoux,L.(1997)microfinance programs and women’s empowerment: towards a
framework for participatory Planning United Kingdom Action Aid.
43
Muthengi Dalmas,(2012).The impact of microcredit on the growth of small and micro
enterprises in Kitui district. Unpublished thesis Kenyatta university.
Navajas S., Conning J., Gonzalez-Vega C., (2003). Lending Technologies,
competition and Consolidation in the Markets for Microfinance in
Bolivia. Journal of Institutional Development. pp 15,747-770 68
Nichols( 2004). A Case Study Analysis of the Impacts of Microfinance Upon the
Lives of the Poor in Rural China, RMIT University, Melbourne, 2000
Ngechu, M.(2004).Understanding the research process and methods. An introduction
to research methods. Acts Press, Nairobi
Nielsen(2002) .Trade credit and the bank Lending channel. Journal of money, credit
and banking vol.2 pp 4.
Oketch, H. O. (2000). Gender Equity. In A. Mullei and A. Bokea (Eds). Micro and
small Enterprises in Kenya: Agenda for improving the Policy
Environment. Nairobi: ICEG.
Onchiri Albert Orero (2012). Determinants of microcredit provision to women
entrepreneurs by MFI in Kenya.Unpublished master’s thesis at the
Univerity of Nairobi.
Orodho,A.J (2003). Essentials of Educational and social Science Research methods.
Nairobi: Mazola Publishers
Pius,Mary Monday (2010). Influence of microcredit finance on the growth of small
scale women entrepreneurs in Kenya. Unpublished master thesis
university of Nairobi
Srinivas, H. (1997).So, what is ‘microcredit? in Virtual Library on Microcredit web
site
Steel(2003).Africa working paper series No.49 Washington, D.C: World bank
44
.Schein, E.H(2004).Organizational culture and leadership. San Francisco Jossey-Bass
Wanjohi, A. (2009). Challenges Facing SMEs in Kenya. Retrieved July 10, 2010
Wanjohi, A. and Mugure, A. (2008). Factors affecting the growth of MSEs in rural
areas of Kenya: A case of ICT firms in Kiserian Township, Kajiado
District of Kenya. Unpublished
Yaron,J.(1997).How to assess performance of development finance institutions. In
Hartmunt Schneider (1st ed).Microfinance for the poor.Paris:OECD
Yunus, M. (1984) .Group based Savings and credit of the Rural Poor: The Grameen
Bank in Bangladesh”, In ILO (ed) Group based Savings and credit of
the Rural Poor, Geneva.
45
APPENDIX: Questionnaire PART 1: Introduction This is a questionnaire on the effect of microcredit on the growth of SMEs in Kenya
being conducted for the purpose of research at the University of Nairobi.
Kindly complete this questionnaire, considering each question thoughtfully and
honestly. Your responses will be treated as confidential and the information will be
used only for the purposes of this study.
PART 2: BACKGROUND INFORMATION
1.Name of the SMES(optional)……………………………………………………..
2.Business type: Small[ ] Medium [ ]
3.How many employees are there?
6-20 [ ]
21-50 [ ]
4.For how long has the SMES been in operation?
10 years or less [ ]
11 to 20 years [ ]
21 to 30 years [ ]
More than 30 years[ ]
PART 3:ACCESSIBILITY AND UTILIZATION OF MICROCREDIT BY
SMES
5.What was the approximate average sales levels before getting credit?...................
……………………………………………………………………………………….
6 What was the approximate average sales after using credit?.......................................
……………………………………………………………………………………….
7.How has the business benefited from in terms of sales volume from the
microcredit?
Highly increased [ ]
Highly decreased [ ]
No change [ ]
Decreased [ ]
46
Improved [ ]
8.What percentage of your annual profits was contributed from using microcredit in
the last financial year?......................................................................................................
……………………………………………………………………………………..
9.Did the firms total assets increase as a result of use of credit?
Very little extent [ ]
Little extent [ ]
Some extent [ ]
Great extent [ ]
Very great extent [ ]
10.Did the availability of microcredit have a role in the growth of sales level of
SMEs?
Very little extent [ ]
Little extent [ ]
Some extent [ ]
Great extent [ ]
Very great extent [ ]
11.Has the use of microcredit influenced employment levels within the SMEs sector?
Very little extent [ ]
Little extent [ ]
Some extent [ ]
Great extent [ ]
Very great extent [ ]
12.Does the use of microcredit influence the creation of more SMEs?
Very little extent [ ]
Little extent [ ]
Some extent [ ]
Great extent [ ]
Very great extent [ ]
13. As per your evaluation, do loans granted lead to growth in their businesses?
Very little extent [ ]
Little extent [ ]

47
Some extent [ ]
Great extent [ ]
Very great extent [ ]
14. Do clients use all loans granted for business activities?
Very little extent [ ]
Little extent [ ]
Some extent [ ]
Great extent [ ]
Very great extent [ ]
15. If no, what activities do you know clients use the loans for?
..........................................................................................................................................
..........................................................................................................................................
..........................................................................................................................................
..................
16. Kindly suggest how credit misappropriation can be avoided.
..........................................................................................................................................
......................................................................................................................................
17.What would you recommend that needs to be done to improve accessibility of
microcredit by SMEs?.....................................................................................................
………………………………………………………………………………………..
………………………………………………………………………………………
……………………………………………………………………………………….
Any other comment?....................................................................................................
…………………………………………………………………………………………
……………………………………………………………………………………….
THANK YOU FOR YOUR TIME.