Relationship between Deflection and Contact Area of Drive Tire · Tire width, contact surface and...
4
Abstract—Tires are important parts of every vehicle including tractors and other off-road vehicles. Thus, structural and operational characteristics determination of the tires is too important. Tire deflection and tire contact area are functions of tractive performance. In this study an electronic system was designed in order to determine deflection of the tire. Deflection and contact area experiments were conducted by means of single wheel tester. As a result; the effects on deflection of dynamic axle load and inflation pressure were found significant (P<0.01) by utilizing variance analysis. There was a linear relationship between deflection and contact area of tire. The deflection of the tire increased with dynamic axle load for all inflation pressures tested. The deflection decreased with increasing inflation pressure. Additionally, increase in the tire load and decrease in the tire inflation pressure lead to bigger the tire contact area. Index Terms—Contact area, deflection, dynamic load, inflation pressure, tire. I. INTRODUCTION One of the most important tire properties is the modulus of elasticity, the relation between the applied force and tire deformation. Deflection is a term that it describes the bulge that forms at the bottom of a loaded tire. That bulge is instead the result of the deflection. The tire deflection depends on tire carcass stiffness, structure (cross ply or radial), ply rating (number of structure layers), tire inflation pressure, of which, the tire inflation pressure is the dominant determining factor for tires [1]. Deflection is a key parameter and many equations have been developed based on it to evaluate the tractive performance of tires operating in cohesive-frictional soils. Gross traction, rolling resistance, net traction and tractive efficiency are predicted as a function of the tire deflection [2]. Too high a deflection increases rolling resistance [3]. Several methods are used to determine tire deflection. The most widely used conventional method is the one based on static deflection only that can be determined by measuring the tire cross section height and by applying the equation [δ=(OD/2)-(SLR)] developed by Brixius [4] to calculate the deflection (ASAE S296.4) [5]. Lyasko [6] measured Manuscript received March 19, 2015; revised July 28, 2015. This work was supported by the Scientific and Technological Research Council of Turkey by the project number: 113 O 794. Ş. Ekinci is with the Department of Mechanical Engineering, Selçuk University, Konya, 42003, Turkey (e-mail: [email protected]). K. Ç arman is with the Department of Agricultural Machinery, Selçuk University, Konya, 42003, Turkey (e-mail: [email protected]). M. Taşyürek is with the Department of Metallurgical and Materials Engineering, Selçuk University, Konya, 42003, Turkey (e-mail: [email protected]). M. Mirik is with the Rail Systems Machine Technology Programme, Cumhuriyet University, Sivas, Turkey (e-mail: [email protected]). deflection for 20 tires by this way, on a rigid surface under various vertical loads and inflation pressures. Taylor et al. [7] measured load-deflection data at three inflation pressures by increasing the static load and measuring static loaded radius (SLR) as the tire rested on a smooth metal plate. Tiwari et al. [8] conducted on the hard surface deflection and zero condition tests by this way. Rashidi et al. [2] designed and constructed a tire deflection test apparatus to measure deflection of tires with different sizes at diverse levels of inflation pressure and vertical load. The static loaded radius was obtained by measuring the deflection as deflection on a hard surface is equal to d/2 minus the measured static loaded radius. The other method that is based on dynamic deflection is the one that employs electronic measurement systems when the test tire is running at certain speeds. In a study conducted by Koca [9] on a vehicle, investigations of effects of varying tire inflation pressures at certain speeds on the dynamic radius and deflection of the tire under laboratory conditions were made. The researcher determined the deflection amount of an automobile tire placed on a chassis dynamometer by using a Linear Variable Differential Transformer at certain speeds. Traction force that can be developed by the driving tire is a function of the contact between the ground and the tire. There exists a linear relationship between the contact and the tire’s projection area. Contact area is a function of slip angle and deflection [10]. Tire width, contact surface and profile play an important role in selection of tires. Carrying capacity of tires depends on structure of tires, air volume and inflation pressure. Because of changing operation loads on tires, it is important for tire manufacturers to specify optimum inflation pressures to prevent tire damages. To improve draw force of tires during field operation, contact area of tires should be increased by lowering inflation pressure. Inflation pressure has also a remarkable influence on tire performance When there is an increase of load on tire about two times, tire contact area increases at a rate of 30-40% while tire connection area decreases at a rate of 70-80% when inflation pressure becomes two times bigger [11]. The contact area also depends on the rolling resistance. The internal resistance relates here to the dissipated energy within the tire that is mainly dependent on the hysteresis of the material used and therefore the tire deformation [12]. Kumar and Dewangan [13] used 6.00 × 12-4PR tires for determining contact characteristics of the tire. They performed the experiments under five levels of inflation pressure and six levels of normal load. A white paper was placed at the center of a steel plate and a blue carbon paper was placed on the paper. The carbon paper was covered with a drawing sheet. The tire was raised and rotated by few degrees to obtain a good imprint of the tire on the white paper by overlaying a number of prints on the same area. The outline of the contact Relationship between Deflection and Contact Area of Drive Tire Ş. Ekinci, K. Çarman, M. Taşyürek, and M. Mirik International Journal of Materials, Mechanics and Manufacturing, Vol. 4, No. 3, August 2016 DOI: 10.7763/IJMMM.2016.V4.251 179
Transcript of Relationship between Deflection and Contact Area of Drive Tire · Tire width, contact surface and...

Abstract—Tires are important parts of every vehicle
including tractors and other off-road vehicles. Thus, structural
and operational characteristics determination of the tires is too
important. Tire deflection and tire contact area are functions of
tractive performance. In this study an electronic system was
designed in order to determine deflection of the tire. Deflection
and contact area experiments were conducted by means of single
wheel tester. As a result; the effects on deflection of dynamic
axle load and inflation pressure were found significant (P<0.01)
by utilizing variance analysis. There was a linear relationship
between deflection and contact area of tire. The deflection of the
tire increased with dynamic axle load for all inflation pressures
tested. The deflection decreased with increasing inflation
pressure. Additionally, increase in the tire load and decrease in
the tire inflation pressure lead to bigger the tire contact area.
Index Terms—Contact area, deflection, dynamic load,
inflation pressure, tire.
I. INTRODUCTION
One of the most important tire properties is the modulus of
elasticity, the relation between the applied force and tire
deformation. Deflection is a term that it describes the bulge
that forms at the bottom of a loaded tire. That bulge is instead
the result of the deflection. The tire deflection depends on tire
carcass stiffness, structure (cross ply or radial), ply rating
(number of structure layers), tire inflation pressure, of which,
the tire inflation pressure is the dominant determining factor
for tires [1]. Deflection is a key parameter and many equations
have been developed based on it to evaluate the tractive
performance of tires operating in cohesive-frictional soils.
Gross traction, rolling resistance, net traction and tractive
efficiency are predicted as a function of the tire deflection [2].
Too high a deflection increases rolling resistance [3].
Several methods are used to determine tire deflection. The
most widely used conventional method is the one based on
static deflection only that can be determined by measuring the
tire cross section height and by applying the equation
[δ=(OD/2)-(SLR)] developed by Brixius [4] to calculate the
deflection (ASAE S296.4) [5]. Lyasko [6] measured
Manuscript received March 19, 2015; revised July 28, 2015. This work
was supported by the Scientific and Technological Research Council of
Turkey by the project number: 113 O 794.
Ş. Ekinci is with the Department of Mechanical Engineering, Selçuk
University, Konya, 42003, Turkey (e-mail: [email protected]).
K. Ç arman is with the Department of Agricultural Machinery, Selçuk
University, Konya, 42003, Turkey (e-mail: [email protected]).
M. Taşyürek is with the Department of Metallurgical and Materials
Engineering, Selçuk University, Konya, 42003, Turkey (e-mail:
M. Mirik is with the Rail Systems Machine Technology Programme,
Cumhuriyet University, Sivas, Turkey (e-mail: [email protected]).
deflection for 20 tires by this way, on a rigid surface under
various vertical loads and inflation pressures. Taylor et al. [7]
measured load-deflection data at three inflation pressures by
increasing the static load and measuring static loaded radius
(SLR) as the tire rested on a smooth metal plate. Tiwari et al.
[8] conducted on the hard surface deflection and zero
condition tests by this way. Rashidi et al. [2] designed and
constructed a tire deflection test apparatus to measure
deflection of tires with different sizes at diverse levels of
inflation pressure and vertical load. The static loaded radius
was obtained by measuring the deflection as deflection on a
hard surface is equal to d/2 minus the measured static loaded
radius. The other method that is based on dynamic deflection
is the one that employs electronic measurement systems when
the test tire is running at certain speeds. In a study conducted
by Koca [9] on a vehicle, investigations of effects of varying
tire inflation pressures at certain speeds on the dynamic radius
and deflection of the tire under laboratory conditions were
made. The researcher determined the deflection amount of an
automobile tire placed on a chassis dynamometer by using a
Linear Variable Differential Transformer at certain speeds.
Traction force that can be developed by the driving tire is a
function of the contact between the ground and the tire. There
exists a linear relationship between the contact and the tire’s
projection area. Contact area is a function of slip angle and
deflection [10]. Tire width, contact surface and profile play an
important role in selection of tires. Carrying capacity of tires
depends on structure of tires, air volume and inflation
pressure. Because of changing operation loads on tires, it is
important for tire manufacturers to specify optimum inflation
pressures to prevent tire damages. To improve draw force of
tires during field operation, contact area of tires should be
increased by lowering inflation pressure. Inflation pressure
has also a remarkable influence on tire performance When
there is an increase of load on tire about two times, tire contact
area increases at a rate of 30-40% while tire connection area
decreases at a rate of 70-80% when inflation pressure
becomes two times bigger [11].
The contact area also depends on the rolling resistance. The
internal resistance relates here to the dissipated energy within
the tire that is mainly dependent on the hysteresis of the
material used and therefore the tire deformation [12]. Kumar
and Dewangan [13] used 6.00 × 12-4PR tires for determining
contact characteristics of the tire. They performed the
experiments under five levels of inflation pressure and six
levels of normal load. A white paper was placed at the center
of a steel plate and a blue carbon paper was placed on the
paper. The carbon paper was covered with a drawing sheet.
The tire was raised and rotated by few degrees to obtain a
good imprint of the tire on the white paper by overlaying a
number of prints on the same area. The outline of the contact
Relationship between Deflection and Contact Area of
Drive Tire
Ş. Ekinci, K. Çarman, M. Taşyürek, and M. Mirik
International Journal of Materials, Mechanics and Manufacturing, Vol. 4, No. 3, August 2016
DOI: 10.7763/IJMMM.2016.V4.251 179

area imprint was traced and the contact area was determined
using a digital planimeter. Raheman and Singh [10] for a fixed
normal load, and inflation pressure, run a test trolley in the
soil bin and marked area coming in contact with the tire on the
soil surface. They traced out the contact area with a marker
pen by pressing a transparent paper on the marked area and
later measured with the help of a planimeter. In this way, they
measured contact area for various combinations of external
load, inflation pressure.
II. MATERIALS AND METHODS
280/70R20 radial type of tire was used at experiments.
Table I shows the values of the parameters for the tire
manufacturer In order to determine tire deflection, a newly
developed deflection measuring device and a single wheel
tester to be used in traction performance tests were used (Fig.
1 and Fig. 2). The measuring set consists of an electric motor
located in a canal, a transmission with a 4-speed range and 2
drums. With the transmission, it is possible to drive the drums
at four different speeds. The power transfer from the electric
motor to the transmission is achieved by using a belt-pulley
mechanism.
TABLE I: TIRE DIMENSIONAL CHARACTERISTICS
Tire size
Overall
diameter
(mm)
Section
width
(mm)
Tire carrying
capacity (kg)
Load Index
and Speed
Symbol
280/70R20 912 282 710-1640 116 A8 /
116 B8
Fig. 1. Single wheel tester design concept.
Fig. 2. Deflection measuring device.
In the tests involving deflection measurements, a 220
VAC-24 VDC convertor, a data logger, a linear displacement
transducer and a deflection testing system were used.
Electronic device of deflection testing system is shown in Fig.
3.
The inflation pressures of the 280/70R20 size driving tire
specimen used in the tests were selected based on the
manufacturer’s catalogue instructions by assigning the values
of 62, 103, 137, 179, 220, 241 and 275 kPa. As for the tire
deflection, the specimen was subjected to four rotational
speeds of 60, 100, 150 and 200 rpm while loaded with 3.0, 4.5,
6.0 and 7.5 kN of axial loads respectively.
Fig. 3. Data detection and storage unit of deflection measuring device.
Through the loading unit, the axial loads were applied by
taking the single wheel tester developed for different grounds
onto the drums of the deflection measuring device. The
amounts of deflection were recorded to the data logger by
using the linear displacement transducer mounted onto the tire
center with a shaft. The distance between the tire center and
the drum before loading, the distance after application of the
axial load with the static deflection and the distance after
running the drums with the dynamic deflection were
determined.
To determine contact areas of the tire on concrete surface,
experiment tire was lifted with lever jack and partly painted
and then lowered on an A3 sized paper which was placed
under lifted tire at every axle load and inflation pressure. This
procedure was repeated 4-5 times while tire was rotated 5-10º
at every experiment to fill contact area. Contact areas on
papers were transferred to electronic data with SigmaPro
Scan™ software. The paper containing the trace area first
scanned to computer and then the digital form was prepared
for the SigmaPro Scan™ software via Photoshop™ software
after pixels of the residual paint were cleared via MS paint™
software.
Variance analyses of manipulated variables such as
dynamic load, inflation pressure and wheel speed were done
in order to determine effects on deflection values.
MINITAB™ program was used to obtain the results of
variance analysis which was done via ANOVA module.
III. RESULTS AND DISCUSSION
When looking at the tire’s deflection values based on the
tire inflation pressure, it is found that as the inflation pressure
increases the amount of deflection decreases. In the Fig. 4, the
variations of static deflection with the applied axial load and
the dynamic deflection with the inflation pressure after
running the tire are observed. As the axial load increases, the
deflection increases because of the load distribution within
the tire as far as the tire’s shape is concerned (Fig. 5). In study
conducted by Raheman and Sing [10], it was found that the
International Journal of Materials, Mechanics and Manufacturing, Vol. 4, No. 3, August 2016
180
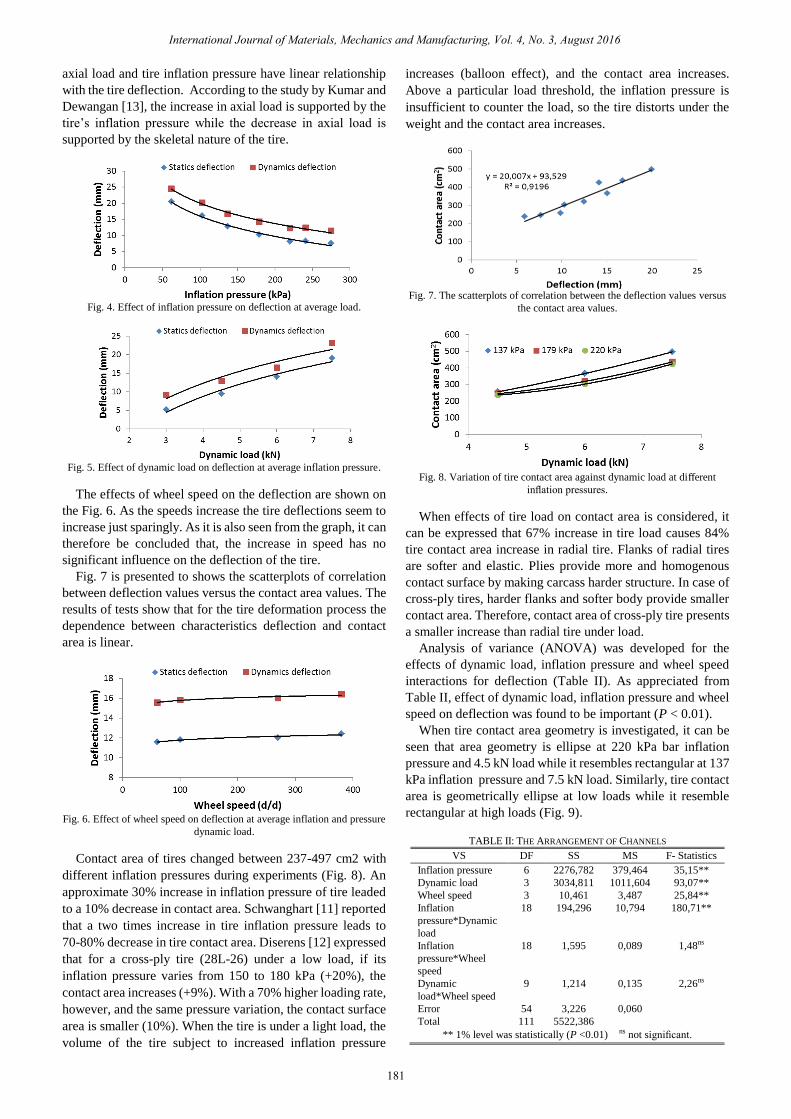
axial load and tire inflation pressure have linear relationship
with the tire deflection. According to the study by Kumar and
Dewangan [13], the increase in axial load is supported by the
tire’s inflation pressure while the decrease in axial load is
supported by the skeletal nature of the tire.
Fig. 4. Effect of inflation pressure on deflection at average load.
Fig. 5. Effect of dynamic load on deflection at average inflation pressure.
The effects of wheel speed on the deflection are shown on
the Fig. 6. As the speeds increase the tire deflections seem to
increase just sparingly. As it is also seen from the graph, it can
therefore be concluded that, the increase in speed has no
significant influence on the deflection of the tire.
Fig. 7 is presented to shows the scatterplots of correlation
between deflection values versus the contact area values. The
results of tests show that for the tire deformation process the
dependence between characteristics deflection and contact
area is linear.
Fig. 6. Effect of wheel speed on deflection at average inflation and pressure
dynamic load.
Contact area of tires changed between 237-497 cm2 with
different inflation pressures during experiments (Fig. 8). An
approximate 30% increase in inflation pressure of tire leaded
to a 10% decrease in contact area. Schwanghart [11] reported
that a two times increase in tire inflation pressure leads to
70-80% decrease in tire contact area. Diserens [12] expressed
that for a cross-ply tire (28L-26) under a low load, if its
inflation pressure varies from 150 to 180 kPa (+20%), the
contact area increases (+9%). With a 70% higher loading rate,
however, and the same pressure variation, the contact surface
area is smaller (10%). When the tire is under a light load, the
volume of the tire subject to increased inflation pressure
increases (balloon effect), and the contact area increases.
Above a particular load threshold, the inflation pressure is
insufficient to counter the load, so the tire distorts under the
weight and the contact area increases.
Fig. 7. The scatterplots of correlation between the deflection values versus
the contact area values.
Fig. 8. Variation of tire contact area against dynamic load at different
inflation pressures.
When effects of tire load on contact area is considered, it
can be expressed that 67% increase in tire load causes 84%
tire contact area increase in radial tire. Flanks of radial tires
are softer and elastic. Plies provide more and homogenous
contact surface by making carcass harder structure. In case of
cross-ply tires, harder flanks and softer body provide smaller
contact area. Therefore, contact area of cross-ply tire presents
a smaller increase than radial tire under load.
Analysis of variance (ANOVA) was developed for the
effects of dynamic load, inflation pressure and wheel speed
interactions for deflection (Table II). As appreciated from
Table II, effect of dynamic load, inflation pressure and wheel
speed on deflection was found to be important (P < 0.01).
When tire contact area geometry is investigated, it can be
seen that area geometry is ellipse at 220 kPa bar inflation
pressure and 4.5 kN load while it resembles rectangular at 137
kPa inflation pressure and 7.5 kN load. Similarly, tire contact
area is geometrically ellipse at low loads while it resemble
rectangular at high loads (Fig. 9).
TABLE II: THE ARRANGEMENT OF CHANNELS
VS DF SS MS F- Statistics
Inflation pressure 6 2276,782 379,464 35,15**
Dynamic load 3 3034,811 1011,604 93,07**
Wheel speed 3 10,461 3,487 25,84**
Inflation
pressure*Dynamic
load
18 194,296 10,794 180,71**
Inflation
pressure*Wheel
speed
18 1,595 0,089 1,48ns
Dynamic
load*Wheel speed
9 1,214 0,135 2,26ns
Error 54 3,226 0,060
Total 111 5522,386
** 1% level was statistically (P <0.01) ns not significant.
International Journal of Materials, Mechanics and Manufacturing, Vol. 4, No. 3, August 2016
181

a) b)
Fig. 9. Tire contact area geometries at different inflation pressures a) 220 kPa,
4.5 kN, b) 137 kPa, 7.5 kN.
IV. CONCLUSION
Based on the experiment conducted with the range of tire
inflation pressure (62-275 kPa) and dynamic load (3-7.5 kN),
findings can be summarized as following;
The tire deflection linearly decreased with an increase in
inflation pressure at constant normal load while it linearly
increased with an increase in normal load at constant inflation
pressure. Excessive deflection of a tire causes high rolling
resistance, overheats the tire and accelerates wear of its
surface. Therefore, an optimum inflation pressure should be
determined in order to maximize tire performance. The
influence of the inflation pressure is more significant than
dynamic loads.
The tire contact area decreases as inflation pressure
increases. Decreasing contact area leads to a decrease in draw
force, and increases in soil deformation and slippage. Tire
contact area increases while load is increased due to tire
structure.
Between the contact area and the deflection was
determined linear relationship. For a pneumatic tire the
contact area depends on tire deflection, influenced by tire
inflation pressure and wheel load; but it also depends on the
elasticity of the soil.
The deflection measurement method, which needs only one
tractive performance parameter, will make it simpler and ideal
candidate for use in deflection studies.
ACKNOWLEDGMENT
The authors acknowledge the support of this study by the
Scientific and Technological Research Council of Turkey by
the project number: 113 O 794.
REFERENCES
Paragra Şerafettin Ekinci is with the Department of
Mechanical Engineering, Technology Faulty, Selçuk
University, Konya, Turkey. He was born in Sivas,
Turkey, in 1971, who received his PhD degree in
agricultural machineries from Konya, Turkey in Sept.
2011, with major field of traction mechanics. His
research interests are traction performance, tire and
tribology. He is a member of IACSIT.
Kazım Çarman was born in 1961, Kayseri, Turkey.
He received his PhD degree from Selçuk University of
Turkey. He is currently a professor at the Department of
Agricultural Machinery, Selçuk University. He is
interested in traction performance and tillage.
Mustafa Taşyürek was born in 1982, and received his
PhD degree in mechanical education from Selçuk
University, Turkey in 2014. From 2005 to present, he
is a research assistant with Selçuk University.
Currently, he is a research assistant at the Department
of Metallurgical and Materials Engineering, Selçuk
University, Turkey. His research interests are in
nanomaterials, nanocomposites and mechanical
properties. He is a member of IACSIT.
Murat Mirik was born in 1982. He received his master
degree in machine training from Selçuk University,
Turkey in 2010. Currently, he is a lecturer at the Rail
Systems Machine Technology Programme,
Cumhuriyet University, Turkey. His main research
interest includes nanocomposite materials.
International Journal of Materials, Mechanics and Manufacturing, Vol. 4, No. 3, August 2016
182
[1] M. Saarilahti, “Soil interaction model project deliverable D2 (Work
Package No. 1),” in Proc. Development of a Protocol for Ecoefficient
Wood Harvesting on Sensitive Sites, 1999-2002, pp. 33-39.
[2] M. Rashidi et al., “Prediction of radial-ply tire deflection based on
contact area index, inflation pressure and vertical load,” J. Agric. &
Environ. Sci., vol. 13, no. 3, pp. 307-314, April 2013.
[3] D. R. Lee and K. U. Kim, “Effect of inflation pressure on tractive
performance of bias-ply tires,” Journal of Terramechanics, vol. 34, no.
3, pp. 187-208, May 1997.
[4] General Terminology for Traction of Agricultural Tractors,
Self-propelled Implements, and Traction and Transport Devices,
ASAE Standards ASAE S296.4-1995.
[5] W. W. Brixius, “Traction prediction equations for bias ply tires,”
ASAE Paper No. 87-1622, p. 8, 1987.
[6] M. I. Lyasko, “The determination of deflection and contact
characteristics of a pneumatic tire on a rigid surface,” Journal of
Terramechanics, vol. 31, no. 4, pp. 239-246, July 1994.
[7] R. K. Taylor, L. L. Bashford, and M. D. Schrock, “Methods for
measuring vertical tire stiffness,” Transactions of the ASAE, vol. 43,
no. 6, pp. 1415-1419, Nov./Dec. 2000.
[8] V. K. Tiwari et al., “A review on traction prediction equations,”
Journal of Terramechanics, vol. 47, pp. 191–199, June 2010.
[9] A. Koca, “Lastik hava basıncı ve taşıt hızının dinamik yarıçap
değişimine etkilerinin deneysel olarak incelenmesi,” Gazi Ü niv. Müh.
Mim. Fak. Dergisi, vol. 22, no. 3, pp. 305-311, 2007.
[10] H. Raheman and R. Singh, “Steering forces on undriven tractor
wheel,” Journal of Terramechanics, vol. 40, pp. 161-178, July 2003.
[11] H. Schwanghart, “Measurement of contact area, contact pressure and
compaction under tires in soft soil,” Journla of Terramechanics, vol.
28, no. 4, pp. 309-318, 1991.
[12] E. Diserens, “Calculating the contact area of trailer tyres in the field,”
Soil Till. Res., vol. 103, no. 2, pp. 302-309, May 2009.
[13] G. V. P. Kumar and K. N. Dewangan, “Deflection and contact
characteristics of a power tiller tyre,” Agricultural Engineering
International: The CIGR EJournal, vol. 6, pp. 1-8, Jan. 2004.