Relationship between Crude Oil Prices and the U.S. Dollar ...
13
Journal of Applied Finance & Banking, vol. 7, no. 5, 2017, 103-115 ISSN: 1792-6580 (print version), 1792-6599 (online) Scienpress Ltd, 2017 Relationship between Crude Oil Prices and the U.S. Dollar Exchange Rates: Constant or Time-varying? Duong Le 1 Abstract This paper aims to analyze the intertemporal interaction between crude oil prices and the U.S. dollar trade-weighted exchange rates from January 1997 through December 2012. To this end, the study assumes that the conditional covariance matrix between crude oil and the dollar exchange rate returns follows a bivariate GARCH process. Using daily data, I find strong evidence of a time-varying conditional covariance and correlation between crude oil prices and the U.S. dollar exchange rates. If on one day the change in the dollar price of oil is largely due to a change in the dollar’s value, there is a tendency for the next day’s change in oil prices to be primarily caused by changes in the dollar’s value as well. On the other hand, if one day the change in the dollar price of oil is caused primarily by factors other than the dollar’s value, there is a tendency for those to be primarily causes of changes in the dollar price of oil on subsequent days. JEL classification numbers: E31, F31 Keywords: Garch process, crude oil prices, exchange rate 1 Introduction This paper examines the intertemporal interaction between crude oil prices and the U.S. dollar exchange rates from January 1997 through December 2012. Crude oil is one of the most essential energy sources in the U.S., accounting for about 40% of the nation’s energy consumption. Since OPEC’s 1973 decision to regulate its oil price independently of large oil companies, crude oil prices have been subject to dramatic volatility. Oil prices increased from less than $11 per barrel in the beginning of 1999 to $38 per barrel in September 2000, decreased to $18 per barrel in January 2002 and went up to $77 per barrel in July 2006. The crude oil market experienced an unprecedented dramatic volatility in 2008 as crude oil prices reached an all-time high level of $145 per barrel in July and then fell sharply to $30 per barrel in December. This large oil price fluctuation tendency has continued in recent 1 Department of Business and Economics, Marietta College, 215 Fifth Street, Marietta, OH 45750. Phone: (740) 376-4769. Fax: (740) 376-7501. Article Info: Received : June 1, 2017. Revised : July 2, 2017. Published online : September 1, 2017
Transcript of Relationship between Crude Oil Prices and the U.S. Dollar ...

Journal of Applied Finance & Banking, vol. 7, no. 5, 2017, 103-115
ISSN: 1792-6580 (print version), 1792-6599 (online)
Scienpress Ltd, 2017
Relationship between Crude Oil Prices and the U.S.
Dollar Exchange Rates: Constant or Time-varying?
Duong Le1
Abstract
This paper aims to analyze the intertemporal interaction between crude oil prices and the
U.S. dollar trade-weighted exchange rates from January 1997 through December 2012. To
this end, the study assumes that the conditional covariance matrix between crude oil and
the dollar exchange rate returns follows a bivariate GARCH process. Using daily data, I
find strong evidence of a time-varying conditional covariance and correlation between
crude oil prices and the U.S. dollar exchange rates. If on one day the change in the dollar
price of oil is largely due to a change in the dollar’s value, there is a tendency for the next
day’s change in oil prices to be primarily caused by changes in the dollar’s value as well.
On the other hand, if one day the change in the dollar price of oil is caused primarily by
factors other than the dollar’s value, there is a tendency for those to be primarily causes of
changes in the dollar price of oil on subsequent days.
JEL classification numbers: E31, F31 Keywords: Garch process, crude oil prices, exchange rate
1 Introduction
This paper examines the intertemporal interaction between crude oil prices and the U.S.
dollar exchange rates from January 1997 through December 2012. Crude oil is one of the
most essential energy sources in the U.S., accounting for about 40% of the nation’s energy
consumption. Since OPEC’s 1973 decision to regulate its oil price independently of large
oil companies, crude oil prices have been subject to dramatic volatility. Oil prices increased
from less than $11 per barrel in the beginning of 1999 to $38 per barrel in September 2000,
decreased to $18 per barrel in January 2002 and went up to $77 per barrel in July 2006. The
crude oil market experienced an unprecedented dramatic volatility in 2008 as crude oil
prices reached an all-time high level of $145 per barrel in July and then fell sharply to $30
per barrel in December. This large oil price fluctuation tendency has continued in recent
1Department of Business and Economics, Marietta College, 215 Fifth Street, Marietta, OH 45750.
Phone: (740) 376-4769. Fax: (740) 376-7501.
Article Info: Received : June 1, 2017. Revised : July 2, 2017.
Published online : September 1, 2017
104 Duong Le
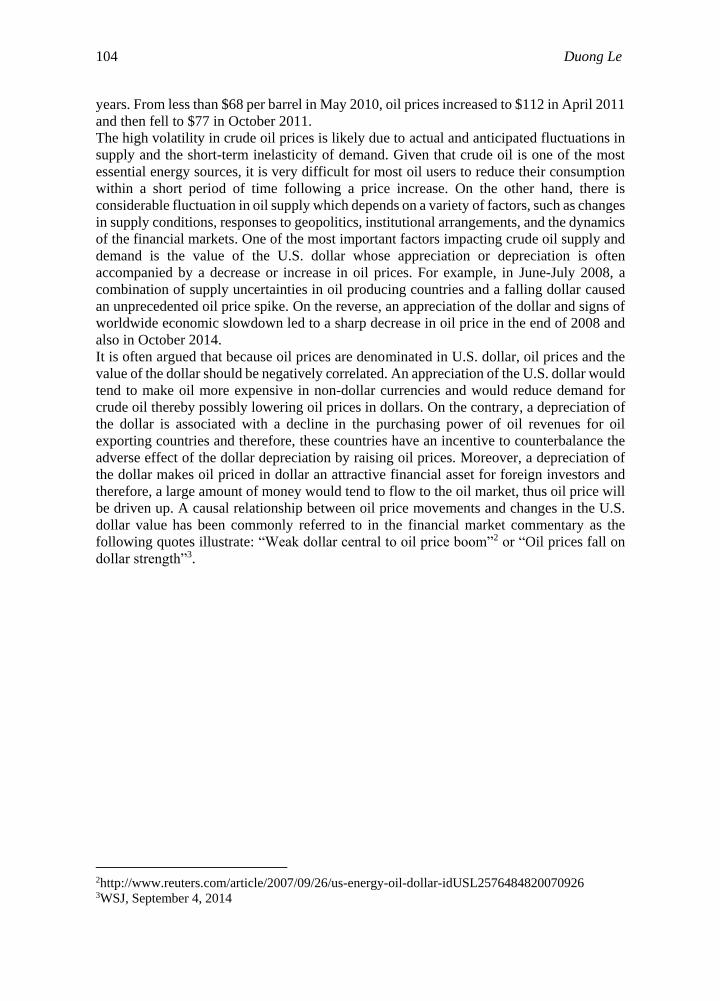
years. From less than $68 per barrel in May 2010, oil prices increased to $112 in April 2011
and then fell to $77 in October 2011.
The high volatility in crude oil prices is likely due to actual and anticipated fluctuations in
supply and the short-term inelasticity of demand. Given that crude oil is one of the most
essential energy sources, it is very difficult for most oil users to reduce their consumption
within a short period of time following a price increase. On the other hand, there is
considerable fluctuation in oil supply which depends on a variety of factors, such as changes
in supply conditions, responses to geopolitics, institutional arrangements, and the dynamics
of the financial markets. One of the most important factors impacting crude oil supply and
demand is the value of the U.S. dollar whose appreciation or depreciation is often
accompanied by a decrease or increase in oil prices. For example, in June-July 2008, a
combination of supply uncertainties in oil producing countries and a falling dollar caused
an unprecedented oil price spike. On the reverse, an appreciation of the dollar and signs of
worldwide economic slowdown led to a sharp decrease in oil price in the end of 2008 and
also in October 2014.
It is often argued that because oil prices are denominated in U.S. dollar, oil prices and the
value of the dollar should be negatively correlated. An appreciation of the U.S. dollar would
tend to make oil more expensive in non-dollar currencies and would reduce demand for
crude oil thereby possibly lowering oil prices in dollars. On the contrary, a depreciation of
the dollar is associated with a decline in the purchasing power of oil revenues for oil
exporting countries and therefore, these countries have an incentive to counterbalance the
adverse effect of the dollar depreciation by raising oil prices. Moreover, a depreciation of
the dollar makes oil priced in dollar an attractive financial asset for foreign investors and
therefore, a large amount of money would tend to flow to the oil market, thus oil price will
be driven up. A causal relationship between oil price movements and changes in the U.S.
dollar value has been commonly referred to in the financial market commentary as the
following quotes illustrate: “Weak dollar central to oil price boom”2 or “Oil prices fall on
dollar strength”3.
2http://www.reuters.com/article/2007/09/26/us-energy-oil-dollar-idUSL2576484820070926 3WSJ, September 4, 2014

Relationship between Crude Oil Prices and the U.S. Dollar Exchange Rates 105
60
70
80
90
100
110
120
0
20
40
60
80
100
120
140
160
U.S. dollar
value$/b
arr
el
Crude oil futures price (left axis) U.S. dollar index value (right axis)
Figure 1: Crude oil prices and the U.S. dollar exchange rates
Figure 1 plots crude oil prices against the U.S. dollar exchange rates from January 1997
through December 2012. While apparently there is no clear relationship from 1997 to 2001,
crude oil prices and the U.S. dollar value appear to be negatively correlated in recent years.
As the dollar lost 35.40% of its value against the Trade Weighted Major Currencies
Exchange Index between January 2002 and July 20084, oil prices soared from $18 to $145
per barrel during the same time period. On the contrary, during the financial crisis, oil prices
collapsed from $145 to $50 per barrel from July 2008 to March 2009 while the dollar
appreciated 23% in that 9-month period.
4Constructed by the author using data from the Federal Reserve Statistical releases, downloaded
from http://www.federalreserve.gov/releases/h10/summary/indexn96_b.htm.

106 Duong Le
Figure 2: Oil prices and U.S. dollar exchange rates correlation
Figure 2 depicts the correlation between oil prices and the U.S. dollar exchange rates,
computed over 30-day moving windows. While the correlation fluctuates between negative
and positive values during most of the sample period, it tends to be more persistently
negative after 2002.
While the negative relationship between oil prices and the U.S. dollar value is widely
discussed in the popular economic press and among market practitioners, the academic
literature documents mixed evidence regarding whether a change in the dollar exchange
rate drives changes in oil prices or vice versa. Prior academic studies generally find that oil
prices Granger-cause exchange rates, but not vice versa. For example, Zhou (1995) [1],
Chaudhuri and Daniel (1998) [2], Amano and Norden (1998a,b)[3] [4], and Chen and Chen
(2007) [5] find that oil price is the dominant source of real exchange rate movements. They
argue that if an oil importing country is dependent on imported oil, an oil price rise may
increase the prices of tradable goods in that country by a greater proportion than in other
countries, and thereby cause a real depreciation of that currency and an appreciation of the
U.S. dollar. On the contrary, Lizardo and Mollick (2010) [6] argue that as oil price goes up,
the supply of U.S. dollars relative to the oil exporter’s currency goes up which would lead
to a depreciation of the U.S. dollar. However, Zhang, Fan, Tsai and Wei (2008) [7]
documents that a change in the U.S. dollar exchange rate does Granger cause oil price
changes, but a change in oil price does not significantly Granger cause U.S. dollar exchange
rate changes. They further prove that the U.S. dollar depreciation is a crucial reason for the
recent soaring oil price. On the contrary, Coudert, Mignon, and Penot (2008) [8] document
that an oil price increase is linked to a dollar appreciation in the long run and therefore, the
situation of a weakening dollar and an increasing oil price is atypical.
-1
-0.8
-0.6
-0.4
-0.2
0
0.2
0.4
0.6
1997 1998 1999 2000 2001 2002 2003 2004 2005 2006 2007 2008 2009 2010 2011 2012

Relationship between Crude Oil Prices and the U.S. Dollar Exchange Rates 107
However, while there is a considerable amount of literature on the correlation between oil
prices and the U.S. dollar values, none of the previous research have attempted to examine
whether that correlation is constant or varying over time.
An understanding of the conditional correlation between crude oil prices and the U.S. dollar
exchange rates is essential for risk management and asset allocation since oil is one of the
dollar-denominated assets often included in the commodity portfolios of most serious
individual and institutional investors. Furthermore, oil prices and exchange rates are among
asset prices which are likely to respond instantly to economic news and developments in
financial markets. The purpose of this study is to analyze the intertemporal interactions of
crude oil prices and the U.S. dollar trade-weighted exchange rates. To this end I allow the
conditional covariance matrix of oil and the dollar exchange rate returns to vary over time,
according to a bivariate GARCH model since the evidence of heteroskedastic covariances
among other financial assets5 has been well documented in numerous previous studies.
This study hypothesizes that the conditional correlation between crude oil prices and the
U.S. dollar exchange rates is time-varying rather than constant over time. Generally, oil
price and the value of the dollar tend to have a negative relationship. An increase in the
value of the dollar causes more expensive oil prices in non-dollar currencies which should
result in a downward pressure on oil demand and hence lower oil prices in dollar and a
decrease in the dollar value implies cheaper oil prices which would result in more money
flowing to the oil market and hence drive up oil prices. However, oil prices are also
impacted by international supply-demand shifts, such as changes in the global oil demand
and supply conditions, responses to geopolitics, institutional arrangements (such as the
OPEC), and the dynamics of the financial markets, which are not caused by changes in the
value of the U.S. dollar. In those cases, there should be no correlation between oil prices
and the U.S. dollar exchange rates. Occasionally, there may be forces, such as interest rate
movements or the global growth outlook, that simultaneously increase or decrease oil prices
and the value of the dollar, resulting in a positive correlation between the two. Hence, I test
the hypothesis of a time-varying correlation between crude oil prices and the U.S. dollar
exchange rates.
To the best of my knowledge, this is the first study to examine whether the conditional
covariance and correlation between crude oil prices and the U.S. dollar exchange rates vary
over time. Although the relationship between oil prices and the dollar value has been
investigated previously, no study has yet focused on the time-varying correlation between
the two and this paper is a first step toward filling this gap.
The paper is organized as follows. The data is presented in Section 2. Section 3 analyzes
the bivariate GARCH model for the conditional covariance between crude oil prices and
the U.S. dollar exchange rates. Section 4 presents the results and Section 5 concludes the
paper.
5See, for example, Bollerslev et al. (1988) [9], Harvey (1989) [10], Bodurtha and Mark (1991) [11],
Fleming, Kirby, and Ostdiek (1998) [12] and Goeij and Marquering (2004) [13].

108 Duong Le
2 Data
The crude oil data used in this study consist of daily closing prices of futures contracts
traded on the New York Mercantile Exchange (NYMEX). Crude oil futures contracts,
which began trading on the NYMEX on March 30, 1983, trade in units of 1,000 U.S.
barrels. The sample period is January 1, 1997 to December 31, 2012 totaling 4,010 daily
observations. This sample period includes both the fall and rise of oil prices and U.S. dollar
value where the years 2002 and 2008 are supposedly the principal turning points. Crude oil
prices are from the Energy Information Administration, downloaded from
http://www.eia.gov/dnav/pet/pet_pri_fut_s1_d.htm.
Futures prices are used in place of spot prices for the following reasons. First, futures prices
are the major prices in the crude oil market. The NYMEX crude oil futures contract is the
world's most liquid forum for crude oil trading and is used as a principal international
pricing benchmark. Crude oil futures prices are also the prices reported in newspapers.
Second, the futures market for crude oil is liquid and centralized while spot markets are
localized and illiquid. Third, futures prices are the prices normally used in most oil risk
management contracts such as swaps and options.
To examine volatility in a GARCH type framework, I utilize daily log returns6 defined as
r1,t=ln(Pt/Pt-1) wherein Pt is the price of the futures contract on day t and Pt-1 is the price of
the same contract the previous day. As traders often cover their positions on the last trading
day of a contract’s life, trading volume and open interest decline and price volatility
increases substantially. To avoid this “thin market” problem, in constructing the rt series I
replace the return of the nearest contract on its last trading day of each month with that of
the second nearest contract.
As a measure of the exchange value of the dollar, I use the trade-weighted average of the
foreign exchange value of the U.S. dollar against a subset of the broad index currencies that
circulate widely outside the country of issue, including the Euro Area, Canada, Japan,
United Kingdom, Switzerland, Australia, and Sweden. The exchange index data is from the
Federal Reserve Statistical releases, downloaded from the following website (daily h10
reports): http://www.federalreserve.gov/releases/h10/summary/indexn96_b.htm. The
index value is set 100 in March 1973 and calculated using the formula:
,
( )
1 , , 1
1
( / ) ,j t
N tw
t t j t j t
j
EI EI e e
where EIt is the value of the index at time t, ej,t and ej,t-1 are
the prices of the U.S. dollar in terms of foreign currency j at times t and t-1, wj,t is the weight
of currency j in the index at time t (based on annual data on international trade), N(t) is the
number of foreign currencies in the index at time t, and , 1 .j t
j
w I also utilize daily log
returns for the U.S. dollar exchange rate which is defined as r2,t=ln(EIt/EIt-1) wherein EIt is
the index value on day t and EIt-1 is the index value the previous day.
6The daily crude oil “returns” are used to measure price changes only. These “returns” are not
investment returns since no money is actually invested.

Relationship between Crude Oil Prices and the U.S. Dollar Exchange Rates 109
Table 1: Descriptive statistics for daily log changes of crude oil prices and U.S. dollar
exchange rates
Crude oil U.S. dollar’s value
Mean (x102) 0.0318 -0.0047
Minimum -0.1654 -0.0411
Maximum 0.1641 0.0216
Standard deviation 0.0247 0.0046
Annualized Standard
deviation
0.4710 0.0883
Skewness -0.1134 -0.3151
Kurtosis 4.0796 10.4830
This table gives descriptive statistics for the daily log changes of crude oil prices and
U.S. dollar’s exchange index value for the period from January 01, 1997 to December
31, 2012.
Table 1 provides a summary of the descriptive statistics at the daily frequency. Both log
changes in crude oil prices and U.S. dollar exchange rates are characterized by excess
kurtosis, indicating that their empirical distributions have fatter tails than a normal
distribution. Moreover, as illustrated in Figure 1, crude oil prices and the dollar exchange
rates exhibit volatility clustering in that large price changes tend to be followed by large
price changes of either sign. GARCH models are attractive and empirically successful in
that they are, to a large extent, able to explain both the volatility clustering behavior and
the excess kurtosis of the empirical distribution of returns.
3 Model Specification
I utilize a multivariate generalized autoregressive conditional heteroskedasticity (GARCH)
model to test for a time-varying covariance between crude oil prices and the U.S. dollar
exchange rates. While the GARCH specification does not follow any economic theory, it
provides a good approximation to the heteroskedasticity typically found in financial time-
series data. The development of multivariate GARCH models represents a major step
forward in the modeling of volatility since these models allow for time-varying conditional
variances as well as covariances. Among various multivariate GARCH models in the
literature7, the Diagonal VECH model introduced by Bollerslev, Engle and Wooldridge
(1988) [9] is one of the most popular since it is a natural extension of the univariate GARCH
model and is easy to understand. Moreover, recent studies by Ferreira and Lopez (2005)
[23] and Bauwens, Laurent and Rombouts (2006) [24] show that among the most popular
multivariate models, the diagonal VECH seems to provide the best out-of-sample
(co)variance forecasts. In the general Diagonal VECH model, the conditional covariance
follows a multivariate GARCH (1,1) process:
7Some examples include Harvey (1989) [10], Bollerslev (1990) [14], Bodurtha and Mark (1991)
[11], Ng (1991) [15], Ng, Engle, and Rothschild (1992) [16], Braun, Nelson, and Sunier (1995) [17],
Engle and Kroner (1995) [18], Nijman and Sentana (1996) [19], Ng and Kroner (1998) [20], Ding
and Engle (2001) [21], and Engle (2002) [22].
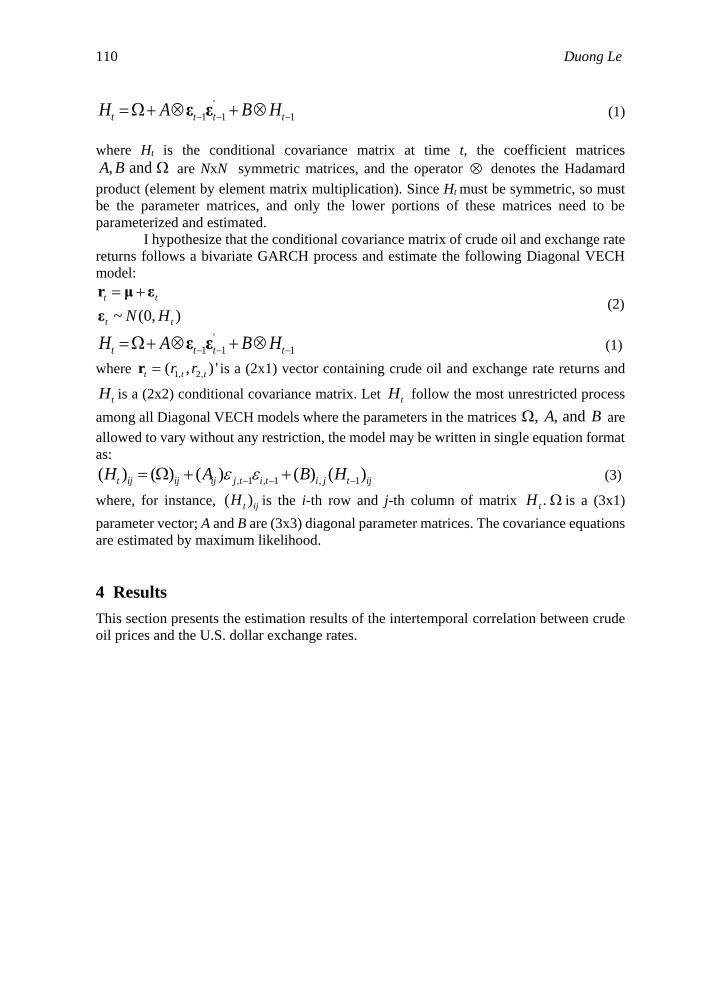
110 Duong Le
'
1 1 1 (7)t t t tH A B H ε ε (1)
where Ht is the conditional covariance matrix at time t, the coefficient matrices
, andA B are NxN symmetric matrices, and the operator denotes the Hadamard
product (element by element matrix multiplication). Since Ht must be symmetric, so must
be the parameter matrices, and only the lower portions of these matrices need to be
parameterized and estimated.
I hypothesize that the conditional covariance matrix of crude oil and exchange rate
returns follows a bivariate GARCH process and estimate the following Diagonal VECH
model:
(8)
~ (0, )
t t
t tN H
r μ ε
ε (2)
'
1 1 1 (7)t t t tH A B H ε ε (1)
where 1, 2,( , ) 't t tr rr is a (2x1) vector containing crude oil and exchange rate returns and
tH is a (2x2) conditional covariance matrix. Let tH follow the most unrestricted process
among all Diagonal VECH models where the parameters in the matrices , , andA B are
allowed to vary without any restriction, the model may be written in single equation format
as:
, 1 , 1 , 1( ) ( ) ( ) ( ) ( ) (9)t ij ij ij j t i t i j t ijH A B H (3)
where, for instance, ( )t ijH is the i-th row and j-th column of matrix .tH is a (3x1)
parameter vector; A and B are (3x3) diagonal parameter matrices. The covariance equations
are estimated by maximum likelihood.
4 Results
This section presents the estimation results of the intertemporal correlation between crude
oil prices and the U.S. dollar exchange rates.

Relationship between Crude Oil Prices and the U.S. Dollar Exchange Rates 111
Table 2: The Diagonal VECH model of the crude oil and U.S. dollar exchange rate
covariance matrix
Univariate GARCH (1,1) Diagonal VECH
U.S. dollar’s
value
Crude oil price
Ω(1,1) 0.0015** 0.0015**
(0.0005) (0.0005)
Ω(1,2) -0.0035*
(0.0020)
Ω(2,2) 0.2051*** 0.1935***
(0.0437) (0.0421)
A(1,1) 0.0376*** 0.0362***
(0.0053) (0.0050)
A(1,2) 0.0268***
(0.0074)
A(2,2) 0.0693*** 0.0651***
(0.0067) (0.0064)
B(1,1) 0.9549*** 0.9563***
(0.0074) (0.0071)
B(1,2) 0.9290***
(0.0275)
B(2,2) 0.8968*** 0.9026***
(0.0123) (0.0118)
This table reports the maximum-likelihood estimation results of Equations (1-2) using
data from January 1, 1997 to December 31, 2012 (T=4,010). Standard errors are shown
in parentheses. (***), (**) and (*) designate estimates significantly different from zero at
the 0.001, 0.01 and 0.05 levels, respectively.
Estimation results from specification (1-2) are presented in the fourth column of Table 2.
In order to provide some intuition on the bivariate model parameters, I present the estimates
of the univariate GARCH(1,1) specification for exchange rate and crude oil volatilities in
the second and third columns of Table 2. Results from Table 2 indicate that the bivariate
GARCH estimates of volatility persistence for exchange rate and crude oil returns are close
to, and not significantly different from, the univariate GARCH (1,1) estimates.
The estimate of (1,2), the unconditional mean of the covariance between crude oil and
exchange rate returns, is negative and significant at the 0.05 level, which is consistent with
the observation of a negative correlation between crude oil prices and the value of the dollar.

112 Duong Le
The estimates of A(1,2) and B(1,2) (the ARCH and GARCH terms in the covariance
equation) are both positive and significant at the 0.01 level, implying that the covariance
between crude oil prices and the value of the dollar tends to cluster over time.
The positive estimate for A(1,2), the ARCH term, means that shocks to oil prices and the
U.S. dollar exchange rates of the same sign affect the conditional covariance positively,
while shocks of opposite signs affect the forecasted covariance negatively. Apparently two
negative (or positive) shocks lead to a significant increase in next period’s covariance.
Given that the unconditional mean of the covariance, Ω(1,2), is significantly negative, two
shocks of the same sign would decrease and two shocks of opposite signs would increase
the predicted covariance in absolute value terms. A significantly positive estimate of A(1,2)
also indicates that causes of the correlation between oil prices and the dollar’s value tend
to persist. If on one day the change in the dollar price of oil is largely due to a change in the
dollar’s value, there is a tendency for the next day’s change in oil prices to be primarily
caused by changes in the dollar’s value as well. On the other hand, if on one day the change
in the dollar price of oil is caused primarily by factors other than the dollar’s value, there is
a tendency for those to be the primary causes of changes in the dollar price of oil on
subsequent days.
To examine whether the time variability in the covariance of crude oil and exchange rate
returns is solely due to variation in the two variances, I calculate the conditional correlation
coefficient at time t+1, 12, 1 :t
1, 1 2, 1
12, 1
1, 1 2, 1
{ , )
( ) ( )
t t t
t
t t t t
Cov r r
Var r Var r
(4)
If ρ12,t+1 is constant over time, the variability in covariance is solely due to variation in
variances. In that case, modeling of time-varying covariances is not very interesting, as all
the dynamics are captured in variances. To test the null hypothesis of a constant correlation
coefficient, I estimate the Constant Conditional Correlation (CCC) model and test the
Diagonal VECH model against the CCC model. The likelihood ratio test statistics is 9.8
with 2 degrees of freedom and significant at the 0.01 level. Therefore, the Constant
Conditional Correlation hypothesis is rejected, clearly showing that the correlation between
oil prices and the value of the dollar is not constant over time. Consequently the variability
in covariances is not solely due to time-varying variances, and modeling time-varying
covariances is important.
Figures 3 and 4 present the plots of the conditional covariance forecasts and the estimated
correlation coefficient over time, based on the estimation results of the diagonal VECH
model as presented in Table 2. The figures show that the conditional covariance and the
correlation coefficient vary considerably over time.

Relationship between Crude Oil Prices and the U.S. Dollar Exchange Rates 113
Figure 3: Conditional covariance between crude oil prices and the value of the dollar
Figure 4: Conditional correlation between crude oil prices and the value of the dollar
5 Summary and Conclusions
Crude oil prices and the U.S. dollar value tend to move together, and appear to have been
negatively correlated in recent years. A dollar appreciation (depreciation) is typically
associated with lower (higher) oil prices. This paper aims to analyze the intertemporal
interaction between crude oil prices and the U.S. dollar exchange rates from January 1997
through December 2012. To this end, the study assumes that the conditional covariance
matrix follows a bivariate GARCH process. The contribution this paper makes is to provide
strong evidence of a time-varying conditional covariance and correlation between oil prices
and the U.S. dollar exchange value.
114 Duong Le
ACKNOWLEDGEMENTS: I am grateful to Louis Ederington for helpful comments and
suggestions. I benefited from the comments of Duane Stock, Chitru Fernando, Scott Linn,
Xin Huang and participants in the Finance workshop at the University of Oklahoma. All
mistakes remain my responsibility.
References
[1] S. Zhou, “The response of real exchange rates to various economic shocks”, Southern
Economic Journal, vol. 61, 1995, pp. 936-954.
[2] K. Chaudhuri and B. Daniel, “Long-run equilibrium real exchange rates and oil
prices”, Economic Letters, vol. 58, 1998, pp. 231-238.
[3] R.A. Amano and S. Van Norden, “Exchange rates and oil prices”, Review of
International Economics, vol. 6, 1998, pp. 683-694.
[4] R.A. Amano and S. Van Norden, “Oil prices and the rise and fall of the US real
exchange rate”, Journal of International Money and Finance, vol. 17, 1998, pp. 299-
316.
[5] SS. Chen and HC. Chen, “Oil prices and real exchange rates”, Energy Economics,
vol. 29, 2007, pp. 390-404.
[6] R.A. Lizardo and A.V. Mollick, “Oil price fluctuations and U.S. dollar exchange
rates”, Energy Economics, vol. 32, 2010, pp. 399-408.
[7] YJ. Zhang, Y. Fan, HT. Tsai and YM. Wei, “Spillover effect of US dollar exchange
rate on oil prices”, Journal of Policy Modeling, vol. 30, 2008, pp. 973–991.
[8] V. Coudert, V. Mignon and A. Penot, “Oil price and the dollar”, Energy Studies
Review, vol. 15, 2008, pp. 45-58.
[9] T. Bollerslev, R. Engle and J.M. Wooldridge, “A Capital Asset Pricing Model with
time varying covariances”, Journal of Political Economy, vol. 96, 1988, pp. 116-131.
[10] C.R. Harvey, “Time-Varying Conditional Covariances in tests of asset pricing
models”, Journal of Financial Economics, vol. 24, 1989, pp. 289–318.
[11] J.N. Bodurtha and N.C. Mark, “Testing the CAPM with time-varying risks and
returns”, Journal of Finance, vol. 46, 1991, pp. 1485-1505.
[12] J. Fleming, C. Kirby and B. Ostdiek, “Information and volatility linkages in the stock,
bond, and money markets”, Journal of Financial Economics, vol. 49, 1998, pp. 111-
137.
[13] P. Goeij and W. Marquering, “Modeling the conditional covariance between stock
and bond returns: A Multivariate GARCH approach”, Journal of Financial
Econometrics, vol. 2, 2004, pp. 531-564.
[14] T. Bollerslev, “Modelling the coherence in short-run nominal exchange rates: a
Multivariate Generalized Arch Model”, Review of Economics and Statistics, vol. 72,
1990, pp. 498-505.
[15] L. Ng, “Tests of the CAPM with time-varying covariances: A Multivariate GARCH
approach”, Journal of Finance, vol. 46, 1991, pp. 1507–1521.
[16] V. Ng, R.F. Engle and M. Rothschild, “A multi-dynamic-factor model for stock
returns”, Journal of Econometrics, vol. 52, 1992, pp. 245-266.
[17] P.A. Braun, D.B. Nelson and A.M. Sunier, “Good news, bad news, volatility, and
betas”, Journal of Finance, vol. 50, 1995, pp. 1575-1603.
[18] R.F. Engle and K.F. Kroner, “Multivariate Simultaneous Generalized ARCH”,
Econometric Theory, vol. 11, 1995, pp. 122-150.
Relationship between Crude Oil Prices and the U.S. Dollar Exchange Rates 115
[19] T. Nijman and E. Sentanab, “Marginalization and contemporaneous aggregation in
multivariate GARCH processes”, Journal of Econometrics, vol. 71, 1996, pp. 71-87.
[20] V. Ng and K.E. Kroner, “Modeling asymmetric comovements of asset returns”,
Review of Financial Studies, vol. 11, 1998, pp. 817-844.
[21] Z. Ding and R.F. Engle, “Large scale conditional covariance matrix modeling,
estimation and testing”, Working Paper, NYU Stern School of Business (2001).
[22] R. Engle, “Dynamic conditional correlation: A simple class of Multivariate
Generalized Autoregressive Conditional Heteroskedasticity models”, Journal of
Business and Economics Statistics, vol. 20, 2002, pp. 339-350.
[23] M.A. Ferreira and J.A. Lopez, “Evaluating interest rate covariance models within a
Value-at-Risk framework”, Journal of Financial Econometrics, vol. 3, 2005, pp. 126-
168.
[24] L. Bauwens, S. Laurent and J.V.K. Rombouts, “Multivariate GARCH models: A
survey”, Journal of Applied Econometrics, vol. 21, 2006, pp. 79-109.