Relation between Mass-Transfer and Biodegradation of ...
210
Relation between Mass-Transfer and Biodegradation of Hydrophobic Pollutants in Soil
Transcript of Relation between Mass-Transfer and Biodegradation of ...

Relation between Mass-Transfer
and Biodegradation of Hydrophobic
Pollutants in Soil

promotor: Dr. ir. W.H. Rulkens hoogleraar in de milieutechnologie
co-promotor: Dr. A.M. Breure wetenschappelijk onderzoeker aan het Rijksinstituut voor Volksgezondheid en Milieu, Bilthoven

'-V~N ' I "1
Relation between Mass-Transfer
and Biodegradation of Hydrophobic
Pollutants in Soil
H. Mulder
Proefschrift
ter verkrijging van de graad van doctor
op gezag van de rector magnificus
van de Landbouwuniversiteit Wageningen,
dr. CM. Karssen,
in het openbaar te verdedigen
op woensdag 1 September 1999
des namiddags te 13:30 uur in de Aula.
ISBN 90-5808-087-0
Printing : Ponsen & Looijen B.V., Wageningen, The Netherlands
Cover R. Kliffen (design) and B. Mulder, b.v. Kunstdrukkerij Mercurius-
Wormerveer, Wormerveer, The Netherlands;
Jacob van Campen B.V. (printing), Amsterdam, The Netherlands
This research was performed at and financially supported by the National Institute of Public Health and the Environment in Bilthoven, The Netherlands (RIVM 715901).
BI8LIOTHEEK LAND3OUWUNIVEKSIT0TT
WAGENTNCEN

o ' . ~' - e |
STELLINGEN
1. Naarmate de moleculaire massa van polycyclische aromatische koolwaterstoffen toeneemt, zal het moeilijker worden om een biodegradatie-experiment zodanig in te richten dat massatransportlimitaties afwezig zijn. Hiermee dient men bij de bestudering van de intrinsieke microbiologische kinetiek terdege rekening te houden.
dit proefschrift
2. Zonder kwantificering van de massatransportsnelheden van verontreinigingen in bodemmateriaal in relatie tot de potentiele afbraakcapaciteit van de aanwezige microbiele populate, kan geen uitspraak gedaan worden over een beperkte biologische beschikbaarheid.
Madsen T, Kristensen P (1997) Environ. Tox. Chem. 16: 631-637
3. Aangezien Zhang et al. hun conclusie betreffende de beperkte biologische beschikbaarheid van in micellen opgeloste polycyclische aromatische koolwaterstoffen niet onderbouwen met experimenten en er door hen geen rekening gehouden wordt met eventuele toxische effecten van de bestudeerde biosurfactants, lopen zij het risico een zeperd te halen.
Zhang Y, Maier WJ, Miller RM (1997) Environ. Sci. Technol. 31:2211-2217
4. Vanwege het ontbreken van een gedegen mechanistische basis moet de reden voor de populariteit van het empirische 'twee-compartimenten model' vooral gezocht worden in de mathematische eenvoud en het feit dat er mooie lijnen door experimentele meetwaarden mee gefit kunnen worden.
Carroll KM, Harness MR, Bracco AA, Balcarcel RR (1994) Environ. Sci. Technol. 28:253-258
5. Teneinde een beter inzicht te verkrijgen in de fysische verschijningsvormen van bodemverontreinigingen in grond, zou er meer onderzoek verricht moeten worden naar verontreinigingsprocessen.
dit proefschrift
6. De grote verschillen in fysische eigenschappen en toxiciteit tussen de verschillende polycyclische aromatische koolwaterstoffen, zouden aanleiding moeten zijn voor differentiatie binnen de normstelling voor deze groep verontreinigingen.

7. Aangezien het woord 'biobeschikbaarheid' in verschillende onderzoeksgebieden een verschillende betekenis heeft, moet er bij het gebruik altijd een nadere definitie worden gegeven.
Zie definities in: Peijnenburg WJGM, Posthuma L, Eijsackers HJP, Allen HE (1997) Ecotox. Environ. Safety 37:163-172
8. Vertegenwoordigers van laboratorium-apparatuur zijn rasechte optimisten ten aanzien van de mogelijkheden en bedrijfszekerheid van hun producten.
9. Voor een manager geldt hetzelfde als voor de doe-het-zelver: 'Goed gereedschap is het halve werk1.
10. De Randstad is feitelijk een stad met een hopeloze infrastructuur en overdreven grote parken.
ll.Geavanceerde navigatie-apparatuur in de watersport, zoals bijvoorbeeld de GPS, heeft op de Nederlandse binnenwateren voornamelijk nut als onderwerp voor borrelpraat na het afmeren in de haven.
12. In de laagdrempelige literatuur betreffende grafische technieken wordt het veiligheidsaspect onderbehcht.
Klatser R, Kruijff] (red) (1983) De kunst van het doen: etstechnieken. Van Dobbenburgh, Amsterdam, The Netherlands
Stellingen behorende bij het proefschrift: "Relation between Mass-Transfer and Biodegradation of Hydrophobic Pollutants in Soil" H. Mulder, Wageningen, 1 September 1999.

Voor mijn ouders

Contents
Chapter 1 General introduction 1
Chapter 2 Influence of hydrodynamic conditions on naphthalene 25 dissolution and subsequent biodegradation
Chapter 3 Effect of biofilm formation by Pseudomonas 8909N 49 on the bioavailability of solid naphthalene
Chapter 4 Effect of nonionic surfactants on naphthalene 67 dissolution and biodegradation
Chapter 5 Effect of mass-transfer limitations on the bioavailability 95 of sorbed naphthalene in synthetic model soil matrices
Chapter 6 Application of a mechanistic desorption-biodegradation 135 model to describe the behavior of polycyclic aromatic hydrocarbons in peat soil aggregates
Chapter 7 Prediction of bioremediation periods for PAH soil 161 pollutants in different physical states by mechanistic models
Chapter 8 General conclusions 183
Summary 193
Samenvatting 197
Dankwoord 201
Curriculum vitae 205
Bibliography 207
CHAPTER 1
General introduction
1.1 Soil pollution
In reaction to the first serious cases of soil contamination in the late 70s, environmental standards have been formulated by the Dutch government in terms of admissible concentrations of chemical compounds in the soil. Three concentrations were defined: target, mediate and intervention values. When the pollutant concentration exceeds the target value, multifunctional soil quality cannot be guaranteed. The mediate value is the average of the target and the intervention value and exceeding of this value necessitates further investigation of the site. At concentrations above the intervention value, the soil is characterized as seriously contaminated. These concentrations were derived for numerous compounds from human toxicological data and ecotoxicological data.
In the Netherlands, serious soil pollution exists at an estimated 175,000 (RTVM, 1997, Ministry of VROM et al„ 1998) to 279,000 (CUR/ NOBIS, 1998) sites, of which one-third is located in residential areas (RIVM, 1997). At 60,000 sites, short-term measures are necessary to reduce human health risks or ecosystem risks (RIVM, 1997).
After the problem of soil pollution became evident, the Dutch policy was to clean up or control all urgent cases of serious pollution and to secure the less urgent situations in the year 2010. It was estimated that an amount of $50 billion US dollars would be needed to achieve this goal. Because the annual expenditure for soil clean-up by the government and social parties is now $500 million US dollars, it is calculated that 10% to 30% of the seriously contaminated sites can be remediated in 2010 according to this policy (RIVM, 1997).
One of the goals of the Dutch policy has been to clean-up the soil to such levels that multifunctional use of the remediated land was always assured. Given the present number of contaminated sites and the substantial economic pressure that is related to such a target, this policy has recently been reconsidered. Main product from this re-evaluation is the functional remediation. According to this new policy, the treatment of a polluted site is to be selected on the basis of a risk-assessment study aimed at the future use of such a site. This policy reduces the total estimated costs of soil remediation in the Netherlands to about $20 billion US dollars

Chapter 1
(CUR/NOBIS, 1998). Besides local contamination of the soil by, for instance, incidental spills, also
diffuse emissions of compounds burden the environment with hazardous chemical compounds. Human activities (combustion processes, deposition of heavy metals from flue gases) and natural processes (wood fires, volcanic activities) result in emissions to the mobile environmental compartments (water, air). By transport over long distances and subsequent deposition into the soil compartment, large areas are contaminated by these diffuse processes. Concentrations of pollutants resulting from these mechanisms are, however, relatively low in comparison to local contamination.
Besides the two types of soil pollution also two types of soil contaminants are generally distinguished: heavy metals and toxic organic compounds. The major difference between the two is the degradability. Although heavy metals can be taken up by organisms (e.g. plants, microorganisms) and complexation reactions often influence the chemical state of metal ions, metals persist as elementary particles and form a potential threat to the environment whenever present. However, organic pollutants can be converted to form other compounds that can be less harmful than the original compound. In this thesis, only organic compounds are considered.
The differences in pollutant concentration, soil type and route of contamination result in different physical states of the organic compounds in the soil matrix (Rulkens and Bruning, 1995) (Fig 1). When, for instance, a local spill of gasoline has occurred at a sandy soil, the contaminants may be present as a separate liquid
H $
particulate pollutant
absorbed
II
liquid film
dissolved in pore water
adsorbed
VI
solid or liquid in pores
figure 1 Proposed physical states of organic pollutants in the soil matrix: I: solid pollutant particles; II: liquid phase pollutant; III: adsorbed pollutant onto soil particles; IV: absorbed into soil particles; V: contaminant dissolved in the pore water phase; VI: solid phase or liquid phase pollutant in soil pores.

General introduction
phase (Fig 1; state II). In the case of diffuse contamination, it is more likely that organic contaminants will be homogeneously distributed over the organic soil matter (Fig 1., state IV). 1.2 PAH polluted soil
1.2.1 Sources of PAH pollution in soil
A group of organic soil pollutants that has received enormous attention in the last decades are the polycyclic aromatic hydrocarbons (PAHs). Although PAHs are formed by natural processes like, for instance, forest fires, volcanic activity, the presence in natural oil, and synthesis by plants (Blumer, 1976), the major source of emissions results from human activities. These anthropogenic sources can be subdivided into three groups: • atmospheric deposition: mainly caused by incomplete combustion processes
like: traffic, waste incineration, or combustion of fossil fuels for the generation of electricity (Baek et al., 1991), pollution due to the application of PAH-containing products, such as creosote and anthracene oil for the preservation of wood, asphalt in road construction and tar for ship coating, local spills of PAH-containing wastes, such as coal-tar dumping on gasworks or the spillage of oil products.
The emissions of PAHs through atmospheric deposition in the Netherlands are estimated to be 6.0 kg km 2 y 1 (Slooff et al., 1989) on an average basis. At local spills, concentrations of PAHs can be several grams per kilogram dry matter of soil. Such high concentrations can be found at, for instance, creosote production plants, gas works or wood impregnating plants (Tab 1) (Wilson and Jones, 1993).
1.2.2 Physicochemical properties of PAHs
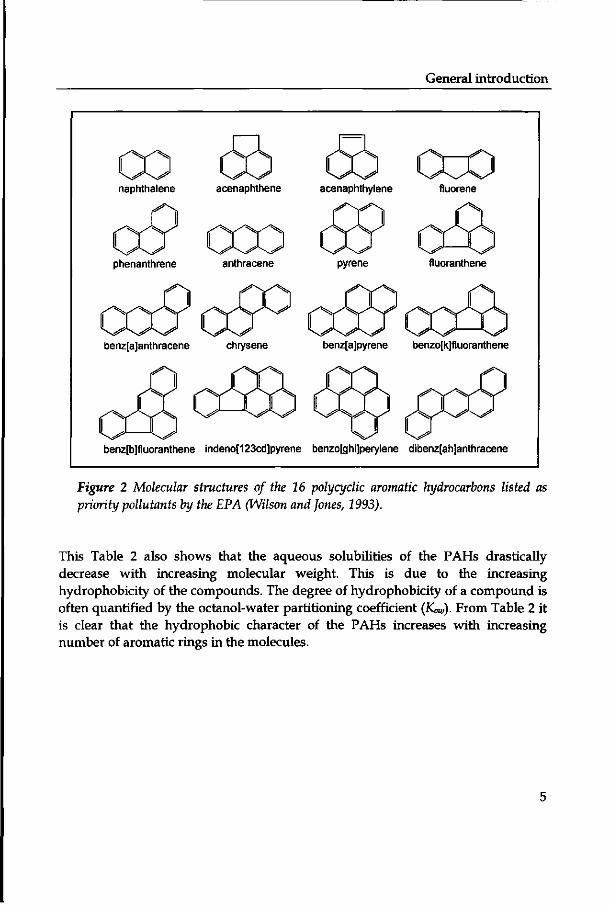
PAHs are molecules which consist of two or more fused aromatic rings, at which additional structural elements such as aliphatic ring structures can be present (Fig 2). Due to the absence of polar groups of these structures, PAHs are very hydrophobic compounds which is indicated by the high values of the octanol-water partitioning coefficients (Tab 2). As a result of the strong hydrophobicity, the water solubilities of PAHs are extremely low. With increasing molecular weight, the hydrophobicity increases and this results in decreasing water-solubilities for the higher PAHs.
Empirical relationships (Wilke-Chang equation) show that the diffusion coefficient of a component (A) in a solvent (B) is related to the molar volume (Bird et al., 1960):

Chapter 1
DAB =1.86-10' {iyBMB)°5T
(1)
where iys is an dimensionless association parameter for solvent B with the value 2.6 for water, DAB the diffusion coefficient (m2 s1), MB the molecular weight of the solvent B (g mol1), T the absolute temperature (K), // the viscosity of the solution (kg nv1 s1) and <PA the molar volume of the component (m3 mol1). From Equation (1) it can be seen that the diffusion coefficient is only dependent on the molar volume by the power -0.6, which is reflected in a slight decrease of the diffusion coefficients with increasing molecular weight in Table 2.
Table 1 Mean soil PAH concentrations [mg (kg-1 dry weight)] at different contaminated sites (Wilson and Jones, 1993)
PAH
naphthalene*
1-methylnaphthalene
2-methylnaphthalene
2,6-dimethylnaphthalene
2,3-dimethylnaphthalene
acenaphthylene
acenaphthene
fluorene
phenanthrene*
anthracene*
2-methylanthracene
pyrene
fluoranthene*
benz [a] anthracene*
chrysene*
benz[a]pyrene*
benzo[k]fluoranthene*
benzo[b]fluoranthene
indeno[l 23cd] pyrene*
dibenz[ah]anthracene
total
total PAHs on Dutch list
of priority pollutants
wood
preserving
3925
1452
623
296
168
49
1368
1792
4434
3037
516
1303
1629
171
481
82
140
23
21466
13782
creosote
production
1313
901
482
33
650
1595
334
642
682
614
7246
4538
wood
treatment
92
620
1440
766
983
1350
356
321
94
10
6022
4419
coking
plant
59
87
112
187
29
245
277
130
285
200
135
2
1746
801
gas works
2
225
379
156
491
2174
317
345
92
260
238
207
2451
4679
3908
h PAHs on tlie Dutch list of priority pollutants
General introduction
naphthalene acenaphthene
^v^X-^S
acenaphthylene fluorene
phenanthrene anthracene pyrene fluoranthene
benz[a]anthracene chrysene benz[a]pyrene benzo[k]fluoranthene
benz[b]fluoranthene indeno[123cd]pyrene benzo[ghi]perylene dibenz[ah]anthracene
Figure 2 Molecular structures of the 16 polycyclic aromatic hydrocarbons listed as priority pollutants by the EPA (Wilson and Jones, 1993).
This Table 2 also shows that the aqueous solubilities of the PAHs drastically decrease with increasing molecular weight. This is due to the increasing hydrophobicity of the compounds. The degree of hydrophobicity of a compound is often quantified by the octanol-water partitioning coefficient (Kow). From Table 2 it is clear that the hydrophobic character of the PAHs increases with increasing number of aromatic rings in the molecules.

Chapter 1
Table 2 Physicochemical properties of polycyclic aromatic hydrocarbons (Sims and Overcash, 1983). The octanol-water partition coefficient (Kow) is a measure for the hydrophobicity of the PAHs.
PAH
naphthalene*
acenaphthylene
acenaphthene
fluorene
phenanthrene*
anthracene*
pyrene
fluoranthene*
benz [a] anthracene*
chrysene*
benz[a]pyrene*
benzo [k] fluoranthene*
benzo[b]fluoranthene
indeno[123cd]pyrene*
benzo [ghi] pery lene*
dibenz[ah]anthracene
molecular
weight
[g moF]
128
152
154
166
178
178
202
202
228
228
252
252
252
276
276
278
water solubility
(30°C)
[kg m-3]
31.7
3.93
3.47
1.98
1.29
7.310-2
1.3510-1
2.6010-1
4.010-2
2.010-3
4.010-3
1.210-3
5.5-1CH
6.210-2
2.6-10-4
5.0-1CH
vapor pressure
(20°C)
[N m-2]
6.56
3.87
2.67
1.73
9.0710-2
2.6110"2
8.0010^
9.1110-5
6.6710-7
8.4010-5
6.6710-5
6.6710-5
6.6710-5
1.33-10-s
1.3310-8
1.3310-8
Log
&OIV
[-] 3.37
4.07
4.33
4.18
4.46
4.45
5.32
5.33
5.61
5.61
6.04
6.57
6.84
7.66
7.23
5.97
diffusion
coefficient"
[10-10 m2 s-1]
9.31
8.35
7.88
7.70
7.70
7.05
6.90
6.44
-' Calculated with tlie Wilke-Chang relation (Bird et al, I960), * The 10 PAHs on the Dutch list of priority
pollutants
1.2.3 Soil quality criteria for PAHs
When it became evident that the presence of PAHs in the soil could impose risks to both ecosystems and humans, legislation was formulated to control this problem. In the United States of America, 16 of the most encountered PAHs were identified as target compounds and admissible concentrations were determined. In the Netherlands, 10 PAHs were placed on the list of priority pollutants and therefore, removal of these compounds from the environment was necessary. Target levels in soil and sediments for these 10 PAHs were deduced from ecotoxicity data and translated into the following values (paragraph 1.1):
R = 10FK 0 < F„c < 1 (2)
I = 400 F 0 < Foe < 1 (3)
General introduction
where Foc is the fraction of organic matter of the material (kg kg-1) and R and I are the reference and intervention values respectively [(mg PAHs)(kg"1 dry weight)]. This implies that soils with a relatively high organic matter content (high Foe), like peat soils, are allowed to have relatively high PAH concentrations (high /-value). However, when these admissible concentrations are compared to the total PAH concentrations in soil at different types of contaminated sites (Tab 1), it is evident that an extremely high performance of the sanitation technique is necessary to lower the PAH concentrations below the intervention value. When, for example, a soil with 10% organic matter is contaminated with 5000 mg PAHs kg"1 dry weight, the remediation efficiency should be at least 99.2%.
1.3 Soil remediation techniques
1.3.1 Physicochemical remediation techniques
Several remediation techniques have been developed to reduce PAH concentration levels in soil material or to prevent emissions from PAH polluted soil to the environment. They can be divided into physicochemical and biological treatment methods. The most important physicochemical remediation techniques are: extraction/classification, incineration, solvent extraction, containment and disposal at landfills. The first three techniques are relatively intensive and PAH levels can be reduced to the target values, but the biological systems in the soil are destroyed and treatment is expensive and energy consuming. Containment or landfill disposal only solves the problem provisionally since the pollution is not removed from the soil. Furthermore, intensive monitoring of contained polluted material is necessary to prevent leaching of the pollutants through the boundaries of the containment (metal, plastic or concrete walls, local extraction of groundwater). Other physical and chemical techniques like, for instance, oxidation with ozone or extraction with supercritical carbondioxide are still in the development stage. These methods also destroy the biological structure of the soil and, furthermore, they are limited to highly polluted material which cannot be treated with other cheaper methods due to the relatively high operational costs.
1.3.2 Bioremediation
As an alternative to the destructive and cost-intensive physicochemical treatment techniques, biological methods exist for the clean-up of PAH polluted soil. The main advantages of bioremediation are that the biological value of the soil is preserved during the remediation and that it can be operated at relatively low costs and low energy requirements. Bioremediation is based on the ability of specific

Chapter 1
microorganisms (or even higher organisms, like plants in the case of phytoremediation) to convert pollutants to less hazardous compounds.
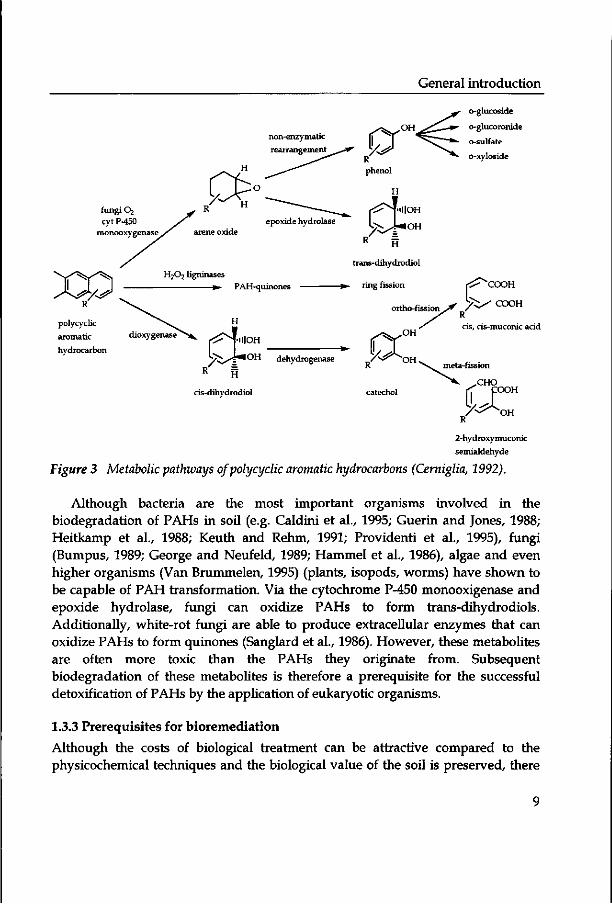
The metabolism of PAHs can be roughly divided into two routes: the eukaryotic and the prokaryotic route (Cerniglia, 1984). The aerobic metabolism of bacterial PAH degradation allows for complete mineralisation of PAHs to water, carbondioxide and biomass (Bouchez et al., 1996). Initially, molecular oxygen is incorporated into the aromatic ring by dioxygenase enzymes to form cis-dihydrodiols, which are then converted to dihydroxylated intermediates by dehydrogenases (Fig 3) (Cerniglia, 1992). The intermediates can react according to the ortho-fission pathway, in which the fission occurs at the covalent bond between the hydroxylated carbon atoms in the aromatic ring, or the meta-fission pathway, where a bond adjacent to these carbon atoms is cleaved (Evans et al., 1965). Several consecutive reactions can take place after this fission and for the low molecular weight PAHs, this can ultimately lead to complete mineralisation to water and carbondioxide (Cerniglia, 1992; Komatsu et al., 1993). The high molecular weight PAHs can be used as sole carbon and energy source but the biochemical degradation routes are not well documented (Boldrin et al., 1993; Kelley et al., 1993; Mueller et a l , 1990; Walter et al., 1991; Weissenfels et al., 1991). Cometabolic degradation is shown for numerous PAHs, yielding hydroxylated polycyclic aromatic acids as the end-products (Gibson et al., 1975; Heitkamp and Cerniglia, 1988). Because oxygen limitations are a significant problem in bioremediation applications, degradation under anoxic conditions would be very interesting from an engineering perspective. However, few reports on anaerobic degradation are available (Al-bashir et a l , 1990; Langenhoff, 1997; McNally et al., 1998; Mihelcic and Luthy, 1987, 1988, 1991). In the case of aerobic biotransformation, oxygen is used to destabilize the aromatic structure. In the anaerobic metabolism alternative terminal electron acceptors are used, which cannot perform this destabilizing function (Langenhoff, 1997). Furthermore, rates of metabolism are generally much lower under anaerobic conditions, because the energy yield from the alternative electron acceptors is relatively low compared to oxygen. Given these considerations, anaerobic degradation of PAHs can be neglected as a significant contribution to the biological transformation of PAHs.
General introduction
non-enzymatic
rearrangement
o-glucoside
o-glucoronide
o-sulfate
o-xyloside
fungi O2 cyt P-450
monooxygenase
H2O2 ligninases
polycyclic
aromatic
hydrocarbon
PAH-quinones
trans-dihydrodiol
ring fission r ^ ^ C O O H
ortho-fission X / ^ C O O H
OH d i o x y g e n a s e ^ ^ J | | | O H
V ^ ^ l ^ O H dehydrogenase /~^^OH
cis, cis-muconic acid
H
cis-dihydrodiol catechol
2-hydroxymuconic
semialdehyde
Figure 3 Metabolic pathways of polycyclic aromatic hydrocarbons (Cerniglia, 1992).
Although bacteria are the most important organisms involved in the biodegradation of PAHs in soil (e.g. Caldini et al., 1995; Guerin and Jones, 1988; Heitkamp et al., 1988; Keuth and Rehm, 1991; Providenti et al., 1995), fungi (Bumpus, 1989; George and Neufeld, 1989; Hammel et al., 1986), algae and even higher organisms (Van Brummelen, 1995) (plants, isopods, worms) have shown to be capable of PAH transformation. Via the cytochrome P-450 monooxigenase and epoxide hydrolase, fungi can oxidize PAHs to form trans-dihydrodiols. Additionally, white-rot fungi are able to produce extracellular enzymes that can oxidize PAHs to form quinones (Sanglard et al., 1986). However, these metabolites are often more toxic than the PAHs they originate from. Subsequent biodegradation of these metabolites is therefore a prerequisite for the successful detoxification of PAHs by the application of eukaryotic organisms.
1.3.3 Prerequisites for bioremediation Although the costs of biological treatment can be attractive compared to the physicochemical techniques and the biological value of the soil is preserved, there

Chapter 1
are some preconditions involved (Thomas and Lester, 1993). First, the pollutant must be biodegradable to less toxic compounds by an organism. In practice it has been shown that many compounds that were considered to be non-biodegradable, can be converted by specialized organisms. Of course, these organisms must be present in the soil or artificially introduced at the start of the clean-up. Additionally, the PAH-degrading organisms must be supplied sufficiently with nutrients like, for instance, oxygen, nitrogen and phosphorus. Another important factor is the pH of the soil (slurry) since the pH optimum for bacteria and fungi are 6-8 and 4-5 respectively. Although soil organic matter has a buffering effect, the pH should be monitored since the conversion of PAHs or other substrates may cause a significant decrease in pH.
Furthermore, biodegradation of the PAH pollutants may be inhibited by other contaminants present in the soil (e.g. heavy metals). The biodegradation of a relatively large amount of mineral oil, which is often found as co-pollutant at PAH-contaminated sites, can impose oxygen limitations on the biodegradation of PAHs.
As in all microbiological processes, the temperature and water content are crucial factors. The temperature determines the rate of the biochemical reactions. Sufficient water must be available in the soil matrix, because microorganisms need an aqueous phase.
In general, microorganisms can only metabolize PAH compounds which are dissolved in an aqueous phase (Wodzinski and Bertolini, 1972; Wodzinski and Coyle, 1974). This implies that PAHs that are sorbed to soil material or present as a separate phase cannot be transformed by microorganisms. First, transfer from these solid states to an aqueous phase is necessary.
1.3.4 Properties of soil in relation to mass-transfer processes
The dimensions and the structure of soil material are important factors influencing mass-transfer rates of PAHs in soil. Soil can be subdivided into organic matter and inorganic material. The organic matter in soil originates mainly from decomposed vegetation and the most important part is humus, which is often subdivided into humin (insoluble), humic acids (soluble at high pH only), and fulvic acids (soluble in acid solution). Because of the origin, the chemical structure of humus is undefined and can only be characterized generally as high molecular-weight polymer chains with a great diversity in functional groups (e.g. phenols, carboxyl groups, alcohols, sugars, peptides, aromatic rings) (Fig 4). Dependent on the environmental conditions like, for instance, pH, ionic strength, and temperature, humus molecules can have different three-dimensional properties. Due to the polymeric structure, soil organic matter has a large specific surface area.
10

General introduction
/ sugar
HOOC I
R-CH I
o / peptide
° NH
I Figure 4 Hypothetical chemical structure ofhumic acid (Stevenson, 1982)
The inorganic soil material is often characterized on the basis of the dimensions of the primary mineral particles: sand (50-2000 urn), silt (2-50 \xm), and clay (< 2 \im). Sand and silt particles originate mainly from the erosion of rocks (silicon oxides), whereas clay minerals are formed from the products of erosion (oxides and hydroxides of aluminum and silicon).
The structure of a soil is the way elementary constituents are oriented in space. The structure of soil is studied on different scales, from the effect of mammal migration on soil structure (meters) to the mutual orientation of clay particles (nanometers). In this thesis, the most important characteristics of soil structure are the degree of aggregation and the pore-size distribution in fine textured soil material. Elementary soil particles can aggregate to form primary aggregates which can subsequently aggregate to form aggregates of a higher level (Kay, 1990; Waters and Oades, 1991). From this perspective, soil can be considered as a system of different aggregation levels (Fig 5). The stability of the aggregates decreases with increasing level of aggregation. When, for instance, clods of soil are mixed in a stirred reactor, the aggregation level will decrease to the point when the shear stress of the fluid phase is insufficient to break-up aggregates further. The smallest aggregates are formed by the agglomeration of primary clay particles to form so-called domains (Emerson et al., 1986). These primary aggregates (0.1-10 urn) can be interconnected by organic compounds (e.g. polysaccharides, humus) and form (often in combination with sand and silt particles) stable aggregates of higher order (100-1000 urn) (Fig 6).
The pore-size distribution inside soil aggregates is determined by the level of aggregation. The smallest pores will be located in the primary aggregates and as
11

Chapter 1
Z primary particle
primary aggregate
secondary aggregate
Figure 5 Schematic description of aggregation levels in soil aggregates (Kay, 1990)
VI
III
VIII
Figure 6 Schematic description of different orientations of primary clay aggregates (domains): I: random orientation of clay particles; II: domains oriented randomly; III: parallel orientation of domains; IV: parallel orientation of domains with little differentiation between the domains: V: granular organic matter disturbs the orientation of domains; VI: random orientation of domains between silt particles; VII: sand, coated with domain; VIII: domains interconnected by organic matter (Fitzpatrick, 1993; Hattori and Hattori, 1976).
12

General introduction
the level of aggregation increases the size of the voids between the aggregates increases. The pores in domains can, dependent on the type of clay mineral, be as small as 2.8-3.5 x 10¹⁰ m (Van der Heij and Peerlkamp, 1975). Pores between domains are generally in the range of 1-5 um (Van der Heij and Peerlkamp, 1975; Lawrence, 1977). This implies that significant parts of the soil material are inaccessible for microorganisms (Alexander, 1994), because the typical dimensions are 1-2 um for bacteria and about 10 um for fungal hyphen (Schlegel, 1981). Mass transfer of the pollutants from these pores is therefore a prerequisite for biodegradation.
The internal structure, the chemical composition and the dimensions of soil aggregates are important features with respect to the mobility of soil pollutants. The internal structure of soil aggregates determines the degree of tortuosity (deviation of the axial pore direction from the direction of the concentration gradient) and constrictivity (dead-end pore effects). The overall mass-transfer distances are dictated by the dimensions of the aggregates. In the case of PAHs, which are very hydrophobic compounds, the degree in which PAHs interact with soil organic matter is strongly dependent on the chemical composition of the humic material. As can be seen from Figure 4, humic substances are highly aromatic and this results in a three-dimensional matrix with hydrophobic regions. PAHs interact with these regions and this can result in a drastic decrease of mass-transfer rates of PAHs through the soil matrix, as will be illustrated in the next paragraph (1.3.5).
1.3.5 Relation between mass transfer and biodegradation of PAHs in soil
When it became clear that specific microorganisms were able to transform PAHs, laboratory tests showed acceptable PAH degradation rates. However, in most cases these degradation rates could not be achieved by the same organisms in field-scale bioremediation practice. Often it was shown that after optimization of the conditions for microbiological degradation (pH, oxygen, etc.), actual removal rates of PAH from contaminated soil still remain low. These low transformation rates are now generally attributed to low mass-transfer rates of PAHs in soil, because the transfer of PAHs to an aqueous phase is a prerequisite for biotransformation by bacteria.
Mass-transfer rates of PAHs in aqueous systems are strongly affected by the low solubilities of PAHs and to a lesser degree by the diffusion coefficient as can be seen from the following mass-transfer equation (Bird et al., 1960):
N = - D , B ^ (4) ox
13

Chapter 1
where N is the mass flux of a component A (kg nv2 s1), C is the dissolved concentration (kg nv3) and x is a space coordinate in the direction of transport. The maximum value of the gradient of the dissolved concentration over a certain distance in space is limited by the value of the maximum solubility of the compound. As a result, potential mass-transfer rates are higher for the light PAHs in comparison to the high molecular weight PAHs.
A similar line of reasoning can, for instance, be applied to the mass-transfer rates of PAHs through a water-saturated porous matrix in which sorption occurs. Sorption is generally described by a sorption isotherm. For simplicity sake a linear sorption model is used here:
Q = KC (5)
where Q is the concentration of the sorbed PAH (kg kg-1) and K is a sorption coefficient (m3 kg-1). When we consider a water-saturated flat sheet of a porous sorbent the following mass balance can be postulated over a thin section of the sheet:
{sNAfx -{sNAf"'^ = eAAx^ + (l-£)ps AAx^ (6)
where Ax is the thickness of the thin section in the sheet (m), s the volumetric porosity of the matrix (m3 nr3), A the area of the sheet (m2), ps the skeletal density of the solid matrix (kg nr3) and t the time (s). By taking the limit of Ax to zero and division by the area (A) the mass balance can be transferred to Equation (7) by using Equation (5):
^ A B ^ = (s + (l-e)p5K)— (7)
When a constant mass flux of PAH through the sheet is assumed, the following expression for this mass flux can be derived from Equation (7):
(e + (l-e)psK) dx v '
Tortuosity and constrictivity effects of the matrix on the binary diffusion coefficient (DAB) are neglected here for sake of simplicity.
14

General introduction
It is shown in various studies that the sorption coefficients of hydrophobic soil pollutants is correlated to the octanol-water partitioning coefficient (Tab 2) (Karickhoffetal.,1979):
logK~-logKow (9)
Equation (8) indicates that the mass transfer of PAHs through a porous sheet of soil particles is retarded when the molecular weight of the PAHs increases due to increased sorption at the solid matrix [Eq (9)].
From the previous it is clear that the physicochemical properties of PAHs and interactions of these hydrophobic compounds with soil material, cause extremely low mass-transfer rates from solid phases to aqueous phases. Therefore it is often shown that the removal rate of PAHs from soil is limited by mass-transfer processes, instead of microbial kinetics (Erickson, 1993; Luthy et al., 1994; Stucki and Alexander, 1987, Wu and Gschwend, 1986). This situation is generally referred to as a reduced or a low bioavailability. This is, however, sometimes a confusing nomenclature because the word bioavailability is used in several different definitions (Peijnenburg et al., 1997). When the term limited bioavailability is used in this thesis, we refer to the situation where the potential biodegradation capacity of the microorganisms exceeds the mass-transfer rate to the aqueous phase where biodegradation can occur.
1.3.6 Bioremediation techniques
In biological remediation, three different strategies can be distinguished (Lapinskas, 1989; Thomas and Lester, 1993): • In-Situ bioremediation:
This method can be subdivided into two methods that are distinguished by the degree in which action is undertaken to optimize conditions for biodegradation. Such actions usually have impact on the preconditions for biodegradation mentioned above. Examples are the introduction of oxygen (air sparging or bioventing) or microorganisms, temperature elevation (input of heat by electric conduction), control of pH, introduction of co-substrates or specialized organisms. When interventions are absent, we speak of natural attenuation (Hart, 1996). This remediation strategy is developed after it was discovered that the organisms, originally present in the soil, can lower the pollutant concentration. In practice, this technique boils down to the monitoring of the contamination, sometimes in combination with risk assessment studies. The first intensive method generally proceeds faster then
15
Chapter 1
the 'do-nothing' extensive variant because conditions for biodegradation are not optimized in any way in the latter case. On the other hand, the operational costs are higher. A combination of the two techniques may be attractive, when a short intensive phase with a relatively high removal efficiency is followed by a cheap, long-term remediation phase in which the risks are already reduced. The major disadvantage of in-situ treatment is the uncertainty in determination and control of the conditions in the soil which is caused by soil heterogeneity. This results in poor estimates on treatment periods and efficiencies.
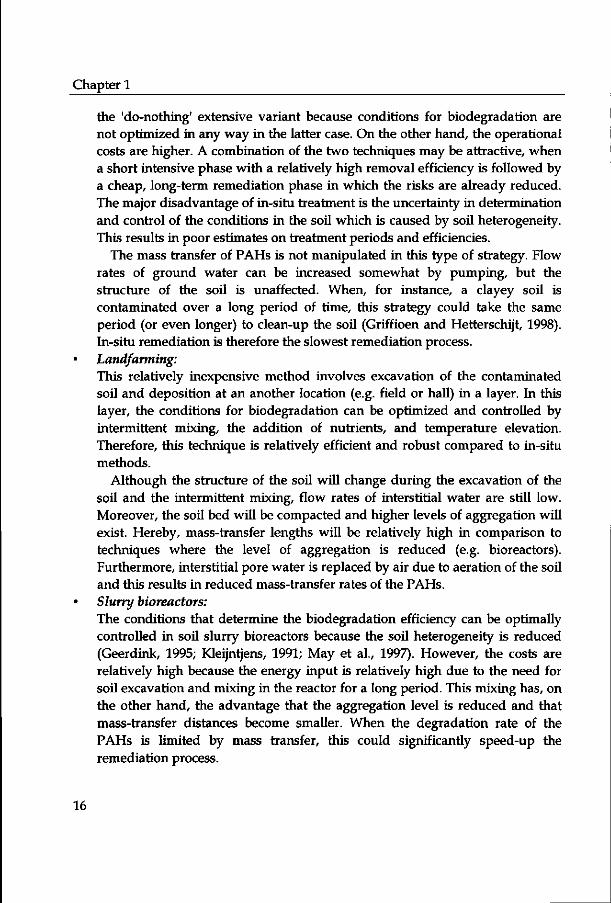
The mass transfer of PAHs is not manipulated in this type of strategy. Flow rates of ground water can be increased somewhat by pumping, but the structure of the soil is unaffected. When, for instance, a clayey soil is contaminated over a long period of time, this strategy could take the same period (or even longer) to clean-up the soil (Griffioen and Hetterschijt, 1998). In-situ remediation is therefore the slowest remediation process. Landfarming: This relatively inexpensive method involves excavation of the contaminated soil and deposition at an another location (e.g. field or hall) in a layer. In this layer, the conditions for biodegradation can be optimized and controlled by intermittent mixing, the addition of nutrients, and temperature elevation. Therefore, this technique is relatively efficient and robust compared to in-situ methods.
Although the structure of the soil will change during the excavation of the soil and the intermittent mixing, flow rates of interstitial water are still low. Moreover, the soil bed will be compacted and higher levels of aggregation will exist. Hereby, mass-transfer lengths will be relatively high in comparison to techniques where the level of aggregation is reduced (e.g. bioreactors). Furthermore, interstitial pore water is replaced by air due to aeration of the soil and this results in reduced mass-transfer rates of the PAHs. Slurry bioreactors: The conditions that determine the biodegradation efficiency can be optimally controlled in soil slurry bioreactors because the soil heterogeneity is reduced (Geerdink, 1995; Kleijntjens, 1991; May et al., 1997). However, the costs are relatively high because the energy input is relatively high due to the need for soil excavation and mixing in the reactor for a long period. This mixing has, on the other hand, the advantage that the aggregation level is reduced and that mass-transfer distances become smaller. When the degradation rate of the PAHs is limited by mass transfer, this could significantly speed-up the remediation process.
16
General introduction
In general, the necessary remediation efficiency is very high for PAH soil remediation (paragraph 1.2.3). In the optimal situation the clean-up rate is limited by the mass-transfer rates of the pollutants. Because concentration differences are the driving force for mass-transfer processes, clean-up will progress faster at the beginning of remediation and will become slower when the PAHs concentration decreases during the process. The residence time of the soil in the clean-up process will thus progressively increase with decreasing target residual PAHs concentrations. An additional problem in this repect is the irreversible binding of PAHs to soil organic matter. PAHs can thus be immobilized in the soil matrix and become unavailable for biodegradation (Eschenbach et al., 1994).
The limited bioavailability of hydrophobic soil pollutants is the most important disadvantage of this technique. In bioremedion practice, residual concentrations are, therefore, above the intervention values in most cases. Furthermore, long periods are necessary to achieve a significant descrease in the soil PAH concentration. Research on the subject of the limited bioavailability of PAHs is aimed at the elucidation of rate-limiting processes and the remediation of these limitations to increase the applicability of bioremediation techniques. An example of such research is the use of surfactants to increase the dissolution rate of PAHs and, thereby, increase the biodegradation rate of these pollutants.
1.4 Outline of the PhD-thesis
In order to evaluate the possibilities of bioremediation as a competitive method next to the physicochemical techniques, it is necessary to determine the limitations that are involved with respect to efficiency, costs and degradation rates. It is the purpose of this study to investigate the relation between mass-transfer rates and microbial degradation rates of hydrophobic organic compounds in soil. Many studies have been performed on this subject (Alexander, 1994; Bosma et al., 1997; Mihelcic and Luthy, 1991; Scow and Alexander, 1992; Weissenfels et al., 1992), but in most only qualitative insights were obtained into the relevant processes due to the use of phenomenological models. In this work, mechanistic models were developed to indicate more quantitatively the most important parameters that limit the bioavailability of PAHs in soil.
In earlier work, the limited bioavailability of PAHs was studied in model systems for contaminated soil material (Volkering, 1996), which had the advantage that results could be interpreted unambiguously and experiments yielded reproducible results. This approach is also adapted in this work and PAHs have been used in two different solid states: crystalline naphthalene to model separate
17
Chapter 1
phase PAHs (Chapter 2, 3, and 4) and naphthalene sorbed to porous particles which imitates contaminated soil at relatively low pollutant concentrations (Chapter 5).
The quantification of the influence of reactor hydrodynamic conditions on the dissolution rate of solid naphthalene and the effect of these conditions on the biodegradation rate of naphthalene are described in Chapter 2. During these experiments it was observed that biofilms were formed on the surface of the crystalline naphthalene. Because it is known that a substantial fraction of the soil biomass consists of immobilized bacteria at soil material, this system was investigated in detail. The influence of the layer of microorganisms at the solid-liquid interface on the bioavailability of the separate phase naphthalene was described in Chapter 3.
The addition of surface active compounds to counteract the effects of a limited bioavailability has received enormous research attention in the last decade. The low aqueous solubilities of PAHs are apparently increased by adding surfactants to aqueous media and mass-transfer rates therefore increase. Many investigations aimed at the screening of different surfactants for the optimal properties with respect to reducing the bioavailability limitations. Few studies, however, were involved in the description of the fundamental processes that determine the efficiency of applying a certain surfactant. In the present work (Chapter 4), such a fundamental study is performed to elucidate the surfactant properties that are crucial in the acceleration of mass-transfer rates.
The models developed in the first chapters of this thesis cannot be applied to systems where the pollutant is present in a sorbed state. Therefore, a mass-transfer model is used which incorporates the partition of the PAHs over the liquid and solid phase in the pores of soil aggregates. Microbial kinetics are also modeled and the mutual influence of mass-transfer and biodegradation processes is illustrated with experimental results on soil model systems and with model simulations (Chapter 5). Similar experimental work is performed with real soil aggregates to validate the results obtained with the model systems (Chapter 6).
A theoretical study was performed to investigate the influence of the physical state of PAHs in soil material on the biodegradation rate (Chapter 7). Results of the foregoing chapters are extrapolated to the bioavailability of higher PAHs to indicate the most important process variables. Finally, the major conclusions from this work are summarized in Chapter 8 and the implications of the study for cleanup possibilities are discussed in relation to legislation.
18
General introduction
Nomenclature
A C DAB
K
&0W
MB
N
Q t T X
area dissolved PAH concentration diffusion coefficient of PAH in water sorption coefficient octanol-water partition coefficient molecular weight mass flux concentration of sorbed PAH time absolute temperature space coordinate
Greek symbols
e
W
M A $A
volumetric porosity dimensionless association parameter in Equation (1) dynamic viscosity skeletal density of the solid matrix molar volume
(m*) (kg m-3) (m2 s-1) (m'kg-i)
(-) (g mol1) (kg nv2 s-1)
(kg kg"1) (s) (K) (m)
(m3 m3)
(-) (kg nr1 s1) (kg m-3) (m3 mol1)
Literature
Al-bashir B, Cseh T, Leduc R, Samson R (1990) Effect of soil contaminant interactions on the biodegradation of naphthalene in flooded soil under denitrifying conditions. Appl. Microbiol. Biotechnol. 34: 414-419
Alexander M (1994) Biodegradation and bioremediation. AP, San Diego, 302 pp. Baek SO, Field RA, Goldstone ME, Kirk PW, Lester JN, Perry R (1991) A review of
atmospheric polycyclic aromatic hydrocarbons: sources, fate, and behavior. Water Air Soil PoUut. 60: 279-300
Bird RB, Stewart WE, Lightfoot EN (1960) Transport Phenomena. 1st ed. Wiley, New York
Blumer M (1976) Polycyclic aromatic compounds in nature. Sci. American 234: 884-890
19
Chapter 1
Boldrin B, Thiem A, Fritsche C (1993) Degradation of phenanthrene, fluorene, fluoranthene and pyrene by a Mycobacterium sp.. Appl. Environ. Microbiol. 59: 1927-1930
Bosma TNP, Middeldorp PJM, Schraa G, Zehnder AJB (1997) Mass transfer limitation of biotransformation: quantifying bioavailability. Environ. Sci. Technol. 31: 248-252
Bouchez M, Blanchet D, Vandecasteele JP (1996) The microbiological fate of polycyclic aromatic hydrocarbons: carbon and oxygen balances for bacterial degradation of model compounds. Appl. Microbiol. Biotechnol. 45: 556-561
Bumpus JA (1989) Biodegradation of polycyclic aromatic hydrocarbons by Phanerochaete chrysosporium. Appl. Environ. Microbiol. 55:154-158
Caldini G, Censi G, Manenti R, Morozzi G (1995) The ability of an environmental isolate of Pseudomonas fluorescens to utilize chrysene and other four-ring polynuclear aromatic hydrocarbons. Appl. Microbiol. Biotechnol. 44: 225-229
Cerniglia CE (1984) Microbial metabolism of polycyclic aromatic hydrocarbons. Adv. Appl. Microbiol. 30: 31-71
Cerniglia CE (1992) Biodegradation of polycyclic aromatic hydrocarbons. Biodegradation 3: 351-368
CUR, NOBIS (1998) Marktverkenning biologische in-situ bodemsanering Nederland met consequenties van de beleidsvernieuwing. NOBIS nr. 96003. Gouda, The Netherlands
Emerson WW, Foster RC, Oades JM (1986) Organo-mineral complexes in relation soil aggregation and structure. Soil Sci. Soc. Am. J. 17: 521-547
Erickson DC, Loehr RC, Neuhauser EF (1993) PAH loss during bioremediation of manufactured gas plant site soils. Water Res. 27: 911-919
Eschenbach A, Kastner M, Bierl R, Scheafer G, Mahro B (1994) Evaluation of a new, effective method to extract polycyclic aromatic hydrocarbons from soil samples. Chemosphere 28: 683-692
Evans WC, Fernley HN, Griffith E (1965) Oxidative metabolism of phenanthrene and anthracene by soil Pseudomonads: The ring-fission mechanism. Biochem J. 95: 819-831
Fitzpatrick EA (1993) Soil microscopy and micromorphology. Wiley, West Sussex, 304 pp
Geerdink MJ (1995) Kinetics of the microbial degradation of oil in soil slurry reactors. PhD-thesis, Technical University of Delft, Delft, The Netherlands
George EJ, Neufeld RD (1989) Degradation of fluorene in soil by fungus Phanerochaete chrysosporium. Biotechnol. Bioeng. 33:1306-1310
Gibson DT, Mahadevan V, Jerina DM, Yagi H, Yeh HJC (1975) Oxidation of the carcinogens benz[a]pyrene and benz[a]anthracene to dihydrodiols by a
20

General introduction
bacterium. Science 189: 295-297 Griffioen J, Hetterschijt, RAA (1998) On diffusive mass-transfer limitations in
relation to remediation of polluted groundwater systems, in: Contaminated Soil '98. Vol 1. Thomas Telford, London, pp 231-240
Guerin WF, Jones GE (1988) Mineralization of phenanthrene by a Mycobaterium sp.. Appl. Environ. Microbiol. 54: 937-944
Hammel KE, Kalyanaraman B, Kirk TK (1986) Oxidation of polycyclic aromatic hydrocarbons and dibenzo[p]dioxins by Phanerochaete chrysosporium ligninase. J. Biol. Chem. 261:16948-16952
Hart S (1996) In situ bioremediation: defining the limits. Environ. Sri. Technol. 30: 398-401
Hattori T, Hattori R (1976) The physical environment in soil microbiology: an attempt to extend principles of microbiology to soil microorganisms. CRC Critical Rev. Microbiol. 5: 423-461
Van der Heij D, Peerlkamp PK (1975) Kermis van grond en bodem. Wolters Noordhoff, Groningen, The Netherlands
Heitkamp MA, Cerniglia CE (1988) Mineralization of polycyclic aromatic hydrocarbons by a bacterium isolated from sediment below an oil field. Appl. Environ. Microbiol. 54:1612-1614
Heitkamp MA, Franklin W, Cerniglia CE (1988) Microbial metabolism of polycyclic aromatic hydrocarbons: isolation and characterization of a pyrene-degrading bacterium. Appl. Environ. Microbiol. 54: 2549-2555
Karickhoff SW, Brown DS, Scot TA (1979) Sorption of hydrophobic pollutants on natural sediments. Water Res. 13: 241-248
Kay BD (1990) Rates of change of soil structure under different cropping systems. Adv. Soil Sci. 12:1-51
Kelley I, Freeman JP, Evans FE Cerniglia CE (1993) Identification of metabolites from the degradation of fluoranthene by Mycobacterium sp. strain PYR-1. Appl. Environ. Microbiol. 59: 800-806
Keuth S, Rehm HJ (1991) Biodegradation of phenanthrene by Arthrobacter polychromogenes isolated from a contaminated soil. Appl. Microbiol. Biotechnol. 34: 804-808
Kleijntjens R (1991) Biotechnological slurry process for the decontamination of excavated polluted soils. PhD-thesis, Technical University of Delft, Delft, The Netherlands
Komatsu T, Oori T, Kodama T (1993) Microbial degradation of the polycyclic aromatic hydrocarbons acenaphthene and acenaphthylene by a pure bacterial culture. Biosci. Biotechol. Biochem. 57: 864-865
Langenhoff A (1997) Biotransformation of toluene, benzene and naphthalene under
21

Chapter 1
anaerobic conditions. PhD-thesis, Wageningen Agricultural University, Wageningen, The Netherlands
Lapinskas J (1989) Bacterial degradation of hydrocarbon contamination in soil and groundwater. Chem. Ind. 12: 784-789
Lawrence GP (1977) Measurements of pore sizes in fine-textured soils: a review of existing techniques. J. Soil Sci. 28: 527-540
Luthy RG, Dzombak DA, Peters CA, Roy SB, Ramaswami A, Nakles DV, Nott BR (1994) Remediating tar-contaminated soils at manufactured gas plant sites. Environ. Sci. Technol. 28: 266-277
May R, Schroder P, Sandermann H jr. (1997) Ex-situ process for treating PAH-contaminated soil with Phanerochaete chrysosporium. Environ. Sci. Technol. 31: 2626-2633
McNally DL, Mihelcic JR, Lueking DR (1998) Biodegradation of three - and four-ring polycyclic aromatic hydrocarbons under aerobic and denitrifying conditions. Environ. Sci. Technol. 32: 2633-2639
Mihelcic JR, Luthy RG (1987) Degradation of aromatic hydrocarbon compounds under various redox conditions in soil-water systems. Appl. Environ. Microbiol. 53:1182-1187
Mihelcic JR, Luthy RG (1988) Microbial degradation of acenaphthalene and naphthalene under denitrifying conditions in soil-water systems. Appl. Environ. Microbiol. 54:1188-1198
Mihelcic JR, Luthy RG (1991) Sorption and microbial degradation of naphthalene in soil-water suspensions under denitrification conditions. Environ. Sci. Technol. 25:169-177
Ministries of VROM, EC, LNV, VWS, FZ, OS, 1998, Nationaal Milieubeleidsplan 3. Den Haag, The Netherlands
Mueller JG, Chapman PJ, Blattman BO, Pritchard PH (1990) Isolation and characterization of a fluoranthene-utilizing strain of Pseudomonas paucimobilis. Appl. Environ. Microbiol. 56:1079-1086
Peijnenburg WJGM, Posthuma L, Eijsackers HJP, Allen HE (1997) A conceptual framework for implementation of bioavailability of metals for environmental management purposes. Ecotox. Environ. Safety 37:163-172
Providenti MA, Greer CW, Trevors JT (1995) Phenanthrene mineralization by Pseudomonas sp. UG14. World J. Microbiol. Biotechnol. 11: 271-279
RIVM (1997) Nationale milieuverkenning 4:1997-2010. Samson HD Tjeenk Willink, Alphen ad Rijn, The Netherlands, pp 262
Rulkens WH, Bruning H (1995) Clean-up possibilities of contaminated soil by extraction and wet classification: effect of particle size, pollutant properties and physical state of the pollutants. In: WJ van den Brink, R Bosman and F Arendt
22

General introduction
(eds), Contaminated Soil '95, Vol 5, Kluwer, The Netherlands, pp 761-773 Sanglard D, Leisola MSA, Fiechter A (1986) Role of extracellular ligninases in
biodegradation of benzo[a]pyrene by Phanerochaete chn/sosporium. Enzyme Microbiol. Technol. 8: 209-212
Schlegel HG (1981) Allgemeine Microbiologic Thieme Verlag, Stuttgart, Germany Scow KM, Alexander M (1992) Effect of diffusion on the kinetics of biodegradation:
Experimental results with synthetic aggregates. Soil Sci. Soc. Am. J. 51:128-134 Sims RC, Overcash MR (1983) Fate of polynuclear aromatic compounds (PNAs) in
soil-plant systems. Residue Rev. 88:1-68 Slooff W, Janus JA, Matthijsen AJCM, Montizaan GK, Ros JPM (1989)
Basisdocument PAK. RIVM Rapportnummer 758474007, RIVM, The Netherlands
Stevenson FJ (1982) Humus chemistry; genesis composition, reactions. John Wiley & Sons, New York
Stucki G, Alexander M (1987) Role of dissolution rate and solubility in biodegradation of aromatic compounds. Appl. Environ. Microbiol. 53: 292-297
Thomas AO, Lester JN (1993) The microbial remediation of former gasworks sites: a review. Environ. Technol. 14:1-24
Van Brummelen TC (1995) Distribution and ecotoxicity of PAHs in forest soil. PhD-thesis. Free University of Amsterdam, Amsterdam, The Netherlands
Volkering F (1996) Bioavailability and biodegradation of polycyclic aromatic hydrocarbons. PhD-Thesis, Wageningen Agricultural University, Wageningen, The Netherlands
Walter U, Beyer M, Klein J, Rehm HJ (1991) Degradation of pyrene by Rhodococcus sp. UW1. Appl. Microbiol. Biotechnol. 34: 671-676
Waters AG, Oades JM (1991) Organic matter in water-stable aggregates. In: Adv. Soil Organic Matter Res, WS Wilson (ed), R. Soc. Chem., Cambridge, pp 163-174
Weissenfels WD, Beyer M, Klein J, Rehm HJ (1991) Microbial metabolism of fluoranthene: isolation and identification of ring fission products. Appl. Microbiol. Biotechnol. 34: 528-535
Weissenfels WD, Klewer HJ, Langhoff J (1992) Adsorption of polycyclic aromatic hydrocarbons (PAHs) by soil particles: influence on biodegradability and biotoxicity. Appl. Microbiol. Biotechnol. 36: 689-696
Wilson SC, Jones KC (1993) Bioremediation of soil contaminated with polynuclear aromatic hydrocarbons (PAHs): a review. Environ. Pollut. 81: 229-249
Wodzinski RS, Bertolini D (1972) Physical state in which naphthalene and bibenzyl are utilized by bacteria. Appl. Microbiol. 23:1077-1081
Wodzinski RS, Coyle JE (1974) Physical state of phenanthrene for utilization by bacteria. Appl. Microbiol. 27:1081-1084
23
Chapter 1
Wu S, Gschwend PM (1986) Sorption kinetics of hydrophobic organic compounds to natural sediments and soils. Environ. Sci. Technol. 20: 717-725
24
CHAPTER 2
The influence of hydrodynamic conditions on naphthalene dissolution and subsequent biodegradation*
2.1 Abstract
The influence of hydrodynamic conditions on the dissolution rate of crystalline naphthalene as a model polycylic aromatic hydrocarbon (PAH) was studied in stirred batch reactors with varying impeller speeds. Mass transfer from naphthalene melts of different surface areas to the aqueous phase was measured and results were modeled according to the film theory. Results were generalized using dimensionless numbers (Reynolds, Schmidt and Sherwood). In combined mass transfer and biodegradation experiments, the effect of hydrodynamic conditions on the degradation rate of naphthalene by Pseudomonas 8909N was studied. Experimental results were mathematically described using mass-transfer and microbiological models. The experiments allowed determination of mass-transfer and microbiological parameters separately in a single run. The biomass formation rate under mass-transfer limited conditions, which is related to the naphthalene biodegradation rate, was correlated to the dimensionless Reynolds number, indicating increased bioavailability at increased mixing in the reactor liquid. The methodology presented in which mass-transfer processes are quantified under sterile conditions followed by a biodegradation experiment can also be adapted to more complex and realistic systems, such as particulate, suspended PAH solids or soils with intrapartically sorbed contaminants when the appropriate mass-transfer equations are incorporated.
* H Mulder, AM Breure, JG van Andel, JTC Grotenhuis, WH Rulkens (1998) Biotechnol. Bioeng. 57:145-154

Chapter 2
2.2 Introduction
Bioremediation is a promising technique for the decontamination of soil polluted with hazardous organic compounds such as polycyclic aromatic hydrocarbons (PAHs) (Mihelcic et al., 1993; Wilson and Jones, 1993). The complete conversion of several of these pollutants into less harmful compounds has been shown in laboratory studies (Cerniglia, 1984; Davies and Evans, 1964; Evans et al., 1965). However, in full-scale practice bioremediation techniques demand extensive periods of treatment after which residual concentrations are often too high to meet environmental standards. Due to their hydrophobicity, the PAHs in soil are mainly associated with the solid phase or may even be present as particles. A limited release rate of PAHs from the solid to the aqueous phase has been proven to cause reduced bioavailability (Volkering et al., 1992). There are some reports on the direct uptake of hydrophobic substances from surfaces by microorganisms (Guerin and Boyd, 1992; Guerin and Jones, 1988; Hermannson and Marshall, 1985), but generally the desorption or dissolution of PAH to the aqueous phase is considered a prerequisite for biodegradation. The latter view is expressed in most studies and supports the idea that microorganisms can only convert these compounds in the dissolved state (Mihelcic and Luthy, 1991; Scow and Alexander, 1992; Wodzinski and Bertolini, 1972; Wodzinski and Coyle, 1974). Because mass transfer from sorption sites or crystalline surfaces to an aqueous phase with microorganisms is necessary for biodegradation, the physical state of the pollutant in the soil plays an important role (Mihelcic et al., 1993; Rulkens and Bruning, 1995; Wu and Gschwend, 1986).
As in studies on the dissolution and biodegradation of hydrophobic compounds from nonaqueous phase liquids (NAPLs) (Birman and Alexander, 1996; Ramaswami et al., 1994), earlier experiments have shown that the dissolution rate from crystalline PAHs can limit the biodegradation rate (Volkering et al., 1992; Volkering et al., 1993). However, it was not measured in a way that the kinetics could be transferred quantitatively to full-scale bioreactor systems. In this study, mass-transfer resistances influencing the bioavailability of crystalline naphthalene were quantitatively investigated. Naphthalene melts in stainless steel supports with specified surface areas were used as a model for PAH particles in suspensions of heavily contaminated soil to study the effect of hydrodynamic conditions in the liquid phase on the diffusive transport across a stagnant liquid film at the solid-liquid interface. The transfer limitations in the experimental setup could be characterized by dimensionless numbers. Based on such characterizations, experimental results obtained from studies in different reactor systems can be compared and correlated. By means of batch experiments, the influence of the
26

Influence of hydrodynamic conditions on naphthalene bioavailability
mass-transfer resistances on the biodegradation rate was determined and modeled using Monod microbial kinetics and mass balances for biomass and dissolved naphthalene. Because the biodegradation rate as influenced by mass-transfer limitations is expressed as a function of mass-transfer coefficients via dimensionless numbers, the effect of hydrodynamic conditions on the bioavailability of crystalline substrate could be determined.
2.3 Materials and methods
2.3.1 Bacterial cultures
Isolation of a naphthalene degrading bacterial strain was described previously and the microorganisms were characterized as a Gram-negative Pseudomonas strain. 8909N (Volkering et a l , 1992).
2.3.2 Media and culture conditions
A mineral medium was used for the biodegradation as well as the physicochemical experiments at a temperature of 30°C to ensure similar conditions. This medium contained one-tenth of the concentrations described by Evans et al. (1970), resulting in the following composition: 10 mM NH4C1, 1 mM NaH 2P0 4 ,1 mM KC1, 0.2 mM Na2S04, 0.125 mM MgCl2, 2 ^M CaCl2, 0.01 ^M Na2Mo04 and 0.5 mL of a trace metal solution per liter. No chelating agent was added. The trace metal solution contained 0.12 mM HC1, 5 mM ZnO, 20 mM FeCla, 10 mM MnCl2 ,1 mM CuCl^ 2 mM CoCl2 and 0.8 mM H3 BO3. The medium was buffered at pH 7.0 with 50 mM sodium phosphate. Pure cultures were maintained in vials containing a mixture of mineral medium and 15% (v/v) glycerol and stored at -70°C. Microorganisms used for inoculation were grown in 200-mL serum flasks supplemented with naphthalene crystals in mineral medium at 30°C and stoppered with Teflon-lined septa.
2.3.3 Naphthalene melts
Conical-shaped notches with 0.5 cm depth and of 1.0 or 2.0 cm diameters at the outer surface were cut in stainless steel cylinders of 2.4 cm diameter and 1.0 cm height (Fig 1). Naphthalene crystals were amended in the notches and melted at a temperature of 150°C on a hot plate. Subsequently the melts were cooled at room temperature and smooth surfaces were obtained. The amount of naphthalene dissolved during the experiments was 2% maximum. The surface area of the melt was assumed constant throughout the experiments.
27

Chapter 2
0 screw cap
10 or 20
10 tIR Jl
impeller outlet
24
B
30 •« >
24
82 175
80
Figure 1 Schematic presentation of experimental equipment. (A) Cross-section of stainless steel cylinders (</> =70°). (B) Batch reactor used for the dissolution and biodegradation experiments. Inlet and outlet were used to circulate the reactor contents over a spectrophotometer. The numbers indicate dimensions in millimeters.
2.3.4 Dissolution and biodegradation experiments
Dynamic experiments were performed in 500-mL cylindrical reactors (internal diameter 8.0 cm) with a disk-mounted flat-blade turbine impeller (diameter 2.4 cm, 6 blades) at a distance of 3.0 cm from the bottom at a temperature of 30°C (Fig 1). Reactor solutions were pumped through quartz cuvets to measure absorption at 275 nm and optical density at 540 run (OD540) at discrete time intervals (Perkin-Elmer spectrophotometer Lambda 15) with demineralized water as the reference. The reactor, pump, and spectrophotometer were interconnected with stainless steel and Viton® tubing. Prior to the experiments the reactors were filled with 350 or 400 mL of mineral medium, resulting in 243 and 193 mL headspace volumes, respectively, and then autoclaved (20 min at 120 °C). After sterilization, pure oxygen gas was led through the reactor liquid and headspace for 15 min at a flow rate of 2.5 L min-1. Tubing was sterilized by successively circulating solutions of 1 M NaOH, 1 M HC1, and sterile mineral medium for 30 min each. This sterilization procedure was demonstrated to be effective because no growth occurred after 7 days of incubation (at 30°C) without inoculation. At the start of each experiment,
28
Influence of hydrodynamic conditions on naphthalene bioavailability
one naphthalene melt was added to the reactor; after naphthalene concentrations in the liquid phase reached equilibrium, bacteria from a batch culture in the linear growth phase (with naphthalene as the sole carbon and energy source) were inoculated by pipeting 10 mL of a culture suspension with an approximate optical density of 0.3 in the reactors. After inoculation, samples were drawn from the reactor to determine the dissolved naphthalene concentration. Samples were filtered over 0.22-um disposable filters (Schleicher & Schuell, Dassel, Germany) to remove bacteria and were prepared for HPLC analysis by mixing 0.75 mL of filtrate with 0.75 mL of acetonitrile in 2-mL crimp-top vials.
2.3.5 Analytical procedures.
Biomass concentrations were determined by measuring the OD540 in the flow-through cuvette. OD540 values were converted to biomass concentrations by determining the cell dry weight in a culture of known optical density [conversion factor: 0.433 kg nv3 (U ODSM)"1]- Dissolved naphthalene concentrations were determined by measuring light absorbance at 275 nm and by HPLC (Hewlett-Packard series HP 1050). Samples were injected onto a Chromspher Cig (PAH) column (Chrompack, Middelburg, The Netherlands) with an 88:12% (v/v) mixture of acetonitrile and water as eluent. Peaks were detected by a UV detector at 276 nm and a fluorescence detector at wavelengths of excitation and emission of 278 and 324 nm, respectively.
2.3.6 Chemicals
All chemicals used were analytical grade except for acetonitrile, which was HPLC grade.
2.4 Modeling
Mathematical models used to describe experimental data were analogous to earlier models used to investigate the effect of dissolution rates on biodegradation of crystalline substrates (Volkering et al., 1992). In these models, dissolution of naphthalene from the surface of the melt in a stirred vessel is described according to the film theory, which is based on the assumption that mass-transfer resistances are completely at the surface in a stagnant liquid film (Bird et al., 1960). The flow pattern in this film is presumed to be laminar, so mass transfer perpendicular to the plane surface is diffusion controlled and convective transfer is ignored. Furthermore, concentration gradients over the film are assumed to be established
29

Chapter 2
rapidly in relation to changes in naphthalene concentration in the bulk solution, so the flux throughout the film is considered constant at any given moment. At the crystalline surface, the solid and aqueous phases are in chemical equilibrium so naphthalene concentration is equal to the saturation concentration. A mass balance over a film of a certain thickness results in the following equation, which describes the flux of naphthalene to the bulk liquid phase:
N = - | (C* -Q) (1)
where N is the flux (kg nv2 s1), D the diffusion coefficient of naphthalene in water (m2 s1), £the film thickness (m), C* the saturation naphthalene concentration (kg nv 3), and Cb the actual bulk naphthalene concentration (kg rrr3). A mass-transfer coefficient can be defined to replace the ratio of diffusion coefficient to film thickness according to Equation (2):
where ki is the film mass-transfer coefficient (m s1). The change in naphthalene concentration in time that is observed in the bulk liquid volume results from the supply by the flux over a certain area and the conversion rate of dissolved naphthalene by microorganisms:
AC
V—b- = NA-RV (3) dt
where V is the liquid volume (m3), A the surface area of the solid phase (m2), and R the volumetric conversion rate (kg nv3 s1). The volumetric conversion rate of naphthalene is defined as a function of growth rate, biomass concentration and a yield coefficient that relates the converted amount of substrate to the amount of biomass formed as in the following (Tempest, 1970):
R = ^ (4)
where // is the growth rate (s1), X the biomass concentration (kg nv3), and Y the yield coefficient (kg kg-1), which relates the biodegradation rate to the biomass formation rate according to this equation:
30

Influence of hydrodynamic conditions on naphthalene bioavailability
dC _ 1 dX . .
~~dt~ ~Y~d7 ( '
The microbial kinetics are modeled by the Monod equation, Equation (6), in which the growth rate is related to the dissolved naphthalene concentration by a maximum growth rate and a saturation constant:
where /Umax is the maximum growth rate (s1), and Ks is the saturation concentration (kg nr3). In addition to the substrate depletion rate, the biomass formation rate can be described using this kinetic expression and biomass concentration as in:
— = //X (7)
Under sterile conditions or at low biomass concentrations, the conversion rate is negligible and dissolution of naphthalene in an aqueous phase can be calculated by integrating the time-based differential Equation (3) with appropriate boundary conditions, resulting in Equation (8):
Cb=C 1-e v with: Cb = 0 at t = 0 (8)
The mass-transfer coefficient, ki, can be determined from the initial part of the dissolution curve by rearranging Equation (8), which results in:
A
C*-Cb
C* = -kLt (9)
By plotting the left term in Equation (9) against time, a straight line is initially observed. The slope of this line, determined by linear regression analysis, is equal to the mass-transfer coefficient.
To describe the simultaneous biodegradation of dissolved naphthalene and dissolution of naphthalene from the crystalline surface, the set of interrelated differential Equations, (3) and (6), must be time integrated. Because an analytical solution to this mathematical problem is not possible, a numerical integration
31

Chapter 2
method (Euler) is used to calculate the development of both biomass and naphthalene concentrations in time (Press et al., 1992). In addition, growth and dissolution rates are calculated for each point in the discretizied time interval according to Equations (1) and (5).
Film thickness is dependent on suspension hydrodynamics and is therefore related to the energy dissipation rate imposed by shaking or stirring. Hydrodynamic conditions in the reactor liquid can be characterized for the experimental setup by using empirical relations and dimensionless numbers. Defining the dimensionless numbers of Reynolds, Sherwood, and Schmidt allows us to characterize the hydrodynamics; Equation (10) represents a general relationship that interrelates these quantities (Bird et al., 1960; Perry et al., 1963):
Sh = aScflRex (10)
Sh=k-f (10a)
Sc = (10b)
Re = (10c)
where Sh, Sc, and Re are the dimensionless Sherwood, Schmidt, and Reynolds numbers, respectively; d is the diameter of the naphthalene melt (m); u is the kinematic viscosity of the liquid (m2 s1); d; is the diameter of the impeller (m); M is the rotational speed of the impeller (s1); TJ is the dynamic viscosity of the (kg m 1 s-
!); and p is the liquid density (kg nr3). The value of the coefficients a, /?, and x depend on the geometry of the experimental setup and can be determined by plotting the logarithm of the ratio of Sh and Sc0-33 against the logarithm of Re, because /? is assumed to have a value of 0.33 (Bird et al., 1960; Perry et al., 1963). The slope and the point of intersection with the vertical axis of this curve gives the values of x and a, respectively.
In chemical reaction engineering, the dimensionless Damkohler number (Da), which is defined as the ratio of the reaction rate in the absence of mass-transfer limitations and the maximum mass-transfer rate, is often used to identify mass transfer or reaction rate controlled conditions (Perry et al, 1963):
32
Influence of hydrodynamic conditions on naphthalene bioavailability
Da = ™ (11)
When the Damkohler number exceeds unity significantly (>10), mass transfer is rate limiting to the overall process. When the number does not exceed unity (<0.1), the reaction rate is limiting. Although this number is mostly used in steady-state situations, it can be used in the present system to indicate the rate-limiting process for biodegradation of the crystalline PAH. According to Equation (11) the Damkohler number can be calculated throughout the batch biodegradation experiments, where Equation (1) is used to calculate the flux from the naphthalene surface. According to Equation (4), the volumetric conversion rate is calculated by substituting the growth rate with the maximum growth rate, assuming zero-order microbial kinetics in the absence of dissolution limitations.
2.5 Results
2.5.1 Dissolution experiments
Because the bioavailability of pure PAH particles in suspension is related to the dissolved concentration and the dissolution rate, batch dissolution experiments were performed to quantify the influence of hydrodynamic conditions on the overall mass-transfer rate to the aqueous phase. Naphthalene melts in stainless steel supports with a specified surface area were immersed in mineral medium to simulate PAH particles in a suspension of polluted soil. Subsequently, concentrations of dissolved naphthalene were measured spectrophotometrically. The influence of hydrodynamics on the mass-transfer coefficient was determined by varying the impeller rotational speed from 0 to 11.7 s1. Results of four dissolution experiments at different impeller rotational speeds and surface areas are depicted in Figure 2 in combination with calculated dissolution curves according to Equation (8). Mass-transfer coefficients determined in similar experiments with two different surface areas were calculated according to Equation (9). The relation between impeller speed and mass-transfer coefficient is presented in Figure 3. These results show an increase in the mass-transfer coefficient as impeller speed is increased. The diffusion coefficient of naphthalene in water (8.28 x 10¹⁰ m^1) is known (Gustafson and Dickhut, 1994). Based on this value, film thickness were calculated from mass-transfer coefficient data by rearranging Equation (2). Figure 3 shows the dependency of film thickness on the impeller rotation speed, from which can be seen that film thickness decreases at increasing impeller speed. The relationship between mass-transfer coefficient and
33

Chapter 2
(kgnO
0.030 -
0.020 -
3)
0.010 -
0.000 I
Ar t rf* ^ f r ^
• \TY <f
J — 1 — ' — ' — ' — 1 —
o o a A
M = 1.67 s"1
M = 3.33 s"1
M = 6.67 s"1
M = 6.67 s"1 (two melts) model
50000 t (s) 100000 150000
Figure 2 Dissolution of naphthalene from melts (2-cm diameter) at different impeller speeds (M): experimental results (symbols) and model calculations (lines).
impeller speed is only valid and applicable to the present experimental system. Reactor geometry, such as the presence of obstacles (e.g., baffles, tubing), determines the efficiency of energy dissipation to the fluid phase by the impeller, so for each reactor system this relation will differ. Relevant process parameters were expressed in dimensionless numbers to facilitate correlation and comparison between experimental conditions in different reactor systems.
The present study determined the effect of hydrodynamics on mass-transfer characteristics, so the Reynolds, Schmidt, and Sherwood numbers were calculated according to Equation (lOa-c). The following values were used in the calculation of the dimensionless numbers (at atmospheric pressure and a temperature of 30CC): water dynamic viscosity, TJ = 8.09 x 10⁻⁴ kg nv1 s :; water kinematic viscosity, u = 8.09 x 10⁷ m2 s1; diameter of impeller, d\ = 2.4 x 10² m; water density, p = 1 x 10³
kg nv3 (Perry et al., 1963). The dimensionless numbers are interrelated according to Equation (10) in which the coefficients a, /?, and x a r e characteristic for the experimental setup used. A value of 0.33 was presumed for ft (Bird et al., 1960; Perry et al., 1963) and therefore coefficients a and x were evaluated by plotting the
34

Influence of hydrodynamic conditions on naphthalene bioavailability
0.8 • -.
(10-4 m s'1) ( lO^m)
10 12
M (s"1)
Figure 3 Effect of impeller speed (M) on mass-transfer coefficient (kO (squares) and film thickness (5) (diamonds) for naphthalene in the melts.
logarithm of the ratio of the Sherwood and Schmidt (to the power 0.33) numbers versus the logarithm of the Reynolds number (Fig 4). A straight line was fitted through the experimental data by linear regression. From the calculated point of interception with the vertical axis and the slope of this line, values of 0.28 and 0.75 were determined for a and Xf respectively. The value of the Schmidt number in these calculations was 976.6.
2.5.2 Biodegradation experiments
To study the effect of mass-transfer dynamics on the biodegradation rate of dissolved naphthalene by the naphthalene degrading organism Pseudomonas sp. 8909N, batch experiments were performed at different mixing intensities. Initially naphthalene melts and bacteria were added as supplements to the reactors at the start of an experiment, after which dissolved naphthalene and biomass concentrations were measured spectrophotometrically in time. Experimental results and model predictions [Eqs (3), (6)] of two biodegradation experiments with naphthalene melts with different surface areas but the same hydrodynamic conditions are presented in Figure 5.
35

Chapter 2
3.0
2.0--
1 S h
1.0--
0.0
• Sherwood over Sc
A biodegradation rate (1cm)
O biodegradation rate (2cm)
linear regression
y = 0.75x-0.55 ' R2 = 0.99
y = 0.75x-11.96 " R2 = 0.98
y = 0.71x -12.31
• - 9
logV df
(kgs1) R = 0.90
1 ' ' '
•--10
-11 2.0 2.5 3.0 3.5
log Re
4.0 4.5
Figure 4 The ratio of the dimensionless Sherwood and Schmidt numbers (squares) and the biomass formation rate in the presence of large (circles) and small (triangles) surface areas, as affected by the dimensionless Reynolds number.
Due to the absorption of UV radiation by biomass at the wavelength at which naphthalene was detected (275 nm), dissolved substrate concentrations could not be measured properly at high biomass concentrations; these data are omitted from that moment onward. In this type of experiment, mass-transfer dynamics were quantified according to Equation (9), assuming the initial biodegradation capacity of the bacteria to be negligible. To eliminate the influence of biodegradation on the determination of mass-transfer parameters, experiments were performed in two phases. In the first phase, concentrations of dissolved naphthalene were measured under sterile conditions until equilibrium was established, and the mass-transfer coefficient was determined on the basis of these data according to Equation (8). In the second phase, bacteria were inoculated into the medium and the dissolved naphthalene concentration and biomass concentrations were measured in time. In these experiments as well, the absorption of UV radiation by biomass interferred with the on-line measurement of dissolved naphthalene, so the spectrophoto-metrical data were omitted after inoculation and samples were drawn from the
36
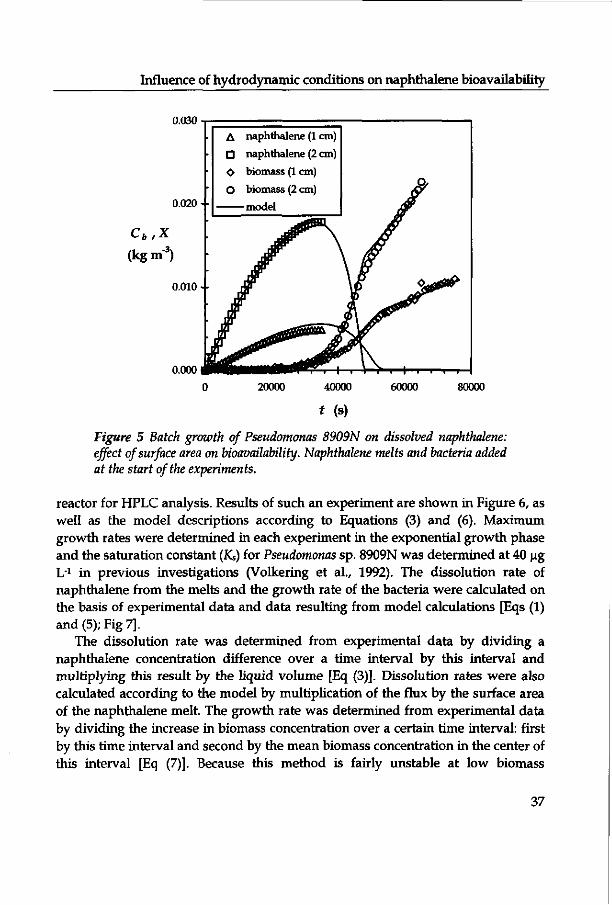
Influence of hydrodynamic conditions on naphthalene bioavailability
0.030
0.020 - -
cb,x (kgnV3)
0.010 - -
0.000
A naphthalene (1 cm)
O naphthalene (2 cm)
O biomass (1 cm)
O biomass (2 cm)
model
mf&mm&tt&^r—t-• \ \ • 1 i i i i
20000 40000
t (s)
Figure 5 Batch growth of Pseudomonas 8909N on dissolved naphthalene: effect of surface area on bioavailability. Naphthalene melts and bacteria added at the start of the experiments.
reactor for HPLC analysis. Results of such an experiment are shown in Figure 6, as well as the model descriptions according to Equations (3) and (6). Maximum growth rates were determined in each experiment in the exponential growth phase and the saturation constant (Ks) for Pseudomonas sp. 8909N was determined at 40 ug L1 in previous investigations (Volkering et al., 1992). The dissolution rate of naphthalene from the melts and the growth rate of the bacteria were calculated on the basis of experimental data and data resulting from model calculations [Eqs (1) and (5); Fig 7].
The dissolution rate was determined from experimental data by dividing a naphthalene concentration difference over a time interval by this interval and multiplying this result by the liquid volume [Eq (3)]. Dissolution rates were also calculated according to the model by multiplication of the flux by the surface area of the naphthalene melt. The growth rate was determined from experimental data by dividing the increase in biomass concentration over a certain time interval: first by this time interval and second by the mean biomass concentration in the center of this interval [Eq (7)]. Because this method is fairly unstable at low biomass
37
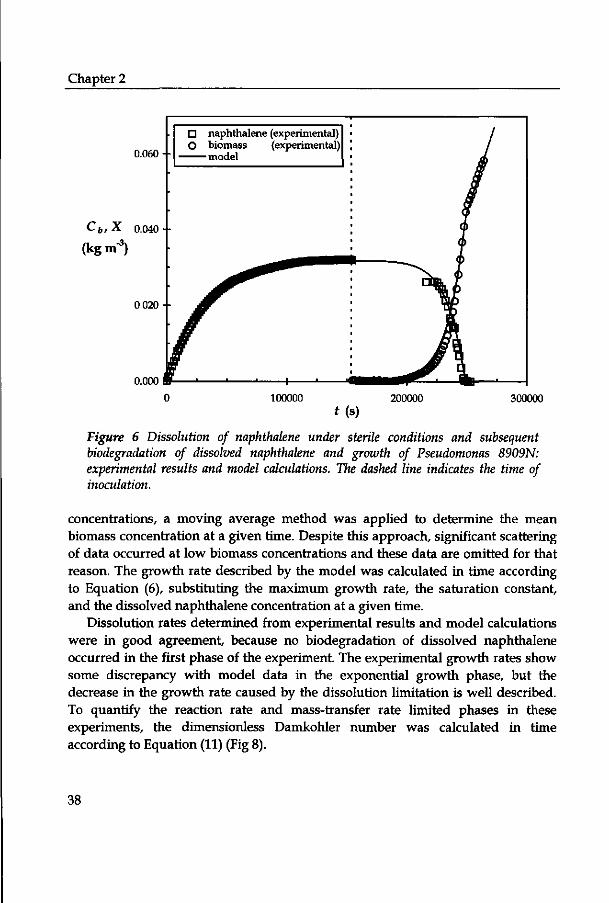
Chapter 2
0.060 - -
Cb,X 0.040 •-
(kgm-3)
0.020 - -
0.000
• naphthalene (experimental) O biomass (experimental)
model
S - . . . 1 . M
100000
Ms) 200000 300000
Figure 6 Dissolution of naphthalene under sterile conditions and subsequent biodegradation of dissolved naphthalene and growth of Pseudomonas 8909N: experimental results and model calculations. The dashed line indicates the time of inoculation.
concentrations, a moving average method was applied to determine the mean biomass concentration at a given time. Despite this approach, significant scattering of data occurred at low biomass concentrations and these data are omitted for that reason. The growth rate described by the model was calculated in time according to Equation (6), substituting the maximum growth rate, the saturation constant, and the dissolved naphthalene concentration at a given time.
Dissolution rates determined from experimental results and model calculations were in good agreement, because no biodegradation of dissolved naphthalene occurred in the first phase of the experiment. The experimental growth rates show some discrepancy with model data in the exponential growth phase, but the decrease in the growth rate caused by the dissolution limitation is well described. To quantify the reaction rate and mass-transfer rate limited phases in these experiments, the dimensionless Damkohler number was calculated in time according to Equation (11) (Fig 8).
38

Influence of hydrodynamic conditions on naphthalene bioavailability
5.0--+ dissolution rate (experimental)
dissolution rate (model) O growth rate (experimental)
™ ^g rowth rate (model)
•-1.0
--0.8
(10-V1) --0.6
--0.4
-•0.2
0.0
300000 0 100000 200000
t (s)
Figure 7 Dissolution and growth rates: experimental results and model calculations.
The influence of hydrodynamic conditions on the biomass formation rate during the conversion of crystalline naphthalene can be quantified by defining this rate as the rate of biomass formation in the linear growth phase multiplied by the liquid volume. Figure 4 plots the logarithm of this biomass formation rate against the logarithm of the dimensionless Reynolds number for the two different surface areas. As expected, the biomass formation rate increased approximately 4 times (a factor of 4.07 was determined on the basis of the slopes of the regression lines in Fig 9) as the diameter of the melts was doubled. Because the dissolution rate limits biomass formation in the linear growth phase, both rates are influenced similarly by the Reynolds number. Using linear regression analysis, slopes of 0.75 and 0.71 were determined for the curves of the logarithm of biomass formation rate plotted against the logarithm of Reynolds number for the large and small surface areas, respectively. At the end of the batch biodegradation experiments, biofilm formation was observed visually at the surface of the solid phase naphthalene and on the stainless steel supports. No quantification of biofilm properties or the influence of biofilm formation on mass-transfer dynamics was performed.
39

Chapter 2
Da
5- -
4 - -
3 - -
2 - -
1 -•
•+-
100000
I I I —
200000 300000
Ms)
Figure 8 Dimensionless Damkohler number (Da) in the biodegradation phase of the experiment.
1.0--
df (lO-'kgs1)
0.8 --
0.6 •-
0.4--
0.2--
0.0
D 1 cm diameter A 2 cm diameter
linear regression
10 12
M (s1)
Figure 9 Effect of impeller speed on the biomass formation rate in the mass-transfer limited growth phase with two different melt diameters: lcm (squares) and 2 cm (triangles). The lines represent optimal fits according to linear regression.
40

Influence of hydrodynamic conditions on naphthalene bioavailability
2.6 Discussion
2.6.1 Dissolution experiments
Results obtained from the dissolution experiments using well-defined reactor systems indicate the effect of both mixing speed and the surface area to liquid volume ratio on the dissolution rate. In accordance with previous studies, the dissolution rate proved to be proportional to the ratio of the surface area to liquid volume (Volkering et al., 1993). The dissolution model [Eq (8); Fig 2] adequately describes the dissolution of naphthalene from the melts to the medium and mass-transfer coefficient, and film thickness could be quantified as a function of mixing speed in the experimental setup. As expected, mass-transfer rates were increased as film thickness was decreased by increased mixing in the liquid. The specific results from these mass-transfer experiments have been generalized by using dimensionless numbers (Fig 4). Correlation of these numbers to the proposed relation as in Equation (9) was good (R2 = 0.99).
It must be noted that real contaminated soils consist of relatively small particles instead of the fixed surfaces used in this study. Therefore, the dependency of mass-transfer coefficients on hydrodynamic conditions will be different. The particles in soil suspensions will move along with the fluid phase and the relative velocity of both phases will be decreased. Mass-transfer coefficients at a certain value of the Reynolds number will therefore be lower for suspended crystalline particles compared to the present system.
However, in the field of chemical technology several mathematical relations have been proposed to quantify the hydrodynamic conditions in suspensions as a function of reactor geometry and energy dissipation rate (Bird et al., 1960; Levins and Glastonbury, 1972). The first-order dissolution model used in this study to describe the mass transfer of PAH from a crystalline solid to the water phase is not applicable to systems where pollutants are sorbed in porous soil particles. In this case, transport equations describing the retarded intraparticle diffusion should be used to quantify the mass flux of the contaminant from the particle to the surrounding liquid (Weber and Miller, 1988; Wu and Gschwend, 1986).
2.6.2 Biodegradation experiments
The quantification of both mass transfer and biodegradation parameters in one experiment is useful to unambiguously study the mutual effects of the two processes. The influence of mass-transfer rate on the biodegradation rate was determined in batch experiments with different surface areas (Fig 5). Results showed the biomass formation to be exponential when the substrate concentration was relatively high
41

Chapter 2
compared to the saturation constant (Ks). This naphthalene concentration initially increased, because the degradation capacity of the present bacteria was low. In contrast to the dissolution curves in Figure 2, however, equilibrium with respect to maximum aqueous phase naphthalene concentration was not established. This was caused by an increased biodegradation capacity of the bacteria, because naphthalene was used for biomass formation. When the biodegradation rate of dissolved naphthalene exceeded the dissolution rate of naphthalene, the dissolved naphthalene concentration decreased to a low value. At this very moment, dissolution of naphthalene limited the formation of biomass and the transition from exponential to linear bacterial growth was observed. From this point in time, the dissolution rate was nearly maximum and constant because the driving force for mass transfer was almost maximized. The concentration of naphthalene in the bulk liquid was far below saturation (below the detection limit of HPLC analysis); therefore the concentration gradient over the film approached its maximum value. Figure 5 shows that the difference in surface area by a factor of 4 of the melts proportionally affects the dissolution dynamics and thereby the biomass formation rate in the mass-transfer limited growth phase. Model calculations according to the combined dissolution-biodegradation model show that experimental results using a mechanistic approach can be adequately described. Quantification of the mass-transfer dynamics in these combined dissolution-biodegradation experiments where bacteria were inoculated immediately was only possible when the initial biodegradation capacity was low. In this case, the increase in dissolved naphthalene concentration can be totally attributed to dissolution. However, to exclude potential discrepancies resulting from this assumption, mass-transfer processes should be studied first under aseptic conditions. After equilibrium is established with respect to the dissolved naphthalene concentration, mass-transfer parameters can be determined according to Equation (8). Subsequently, bacteria can be inoculated to study the effect of the previously determined mass-transfer processes on the biodegradation rate. The results presented in Figures 6-8 indicate that this procedure is useful in studying the effect of mass-transfer limitations on bioavailability, because mass transfer and biodegradation processes can both be quantified separately in one experiment. From Figure 7 it is evident that biodegradation rate is indeed limited by dissolution dynamics, because the growth rate in the linear growth phase is below the maximum value. Moreover, because biomass concentration increases as a result of dissolving naphthalene, which is metabolized and partially converted to new bacteria, and the biomass formation rate is constant, the growth rate is ever decreasing. The dimensionless Damkohler number can be useful in indicating the rate controlling process as illustrated in Figure 8. Because the number is defined as the ratio of maximum reaction to mass-transfer rates, the biodegradation process is microbially limited at low values and dissolution
42

Influence of hydrodynamic conditions on naphthalene bioavailabihty
0.12
0.10 - •
cb,x 008 +
(kg m 3) 0.06 - -
0.04--
0.02 - -
0.00
D A O O
naphthalene (1.67 s"1) naphthalene (6.67 s"1) biomass (1.67 s"1) biomass (6.67 s"1) model
•+•
50000 100000 150000
t (s)
1 I ' 200000 250000
Figure 10 Dissolution of naphthalene under sterile conditions and subsequent biodegradation of dissolved naphthalene and growth of bacteria: effect of impeller rotation speed (1.67 and 6.67 s-1). The dashed line indicates the time of inoculation.
at high values. The maximum dissolution rate is assumed to be constant so the value of Da increases when biomass concentration increases [Eq (11)]. Directly after inoculation, the Damkohler number is far below unity, which means that the overall degradation process is limited by the capacity of the bacteria. However, biomass exponentially increases which leads to a proportional increase in the Damkohler number. At the transition of exponential to linear growth, values of Da are significantly higher than unity, indicating that mass transfer limits the overall biodegradation rate.
The effect of hydrodynamic conditions on the biodegradation rate is illustrated in Figure 10, where dissolution rate and biomass formation rate in the linear growth phase both increase with increased mixing. Biomass formation rates in the dissolution limited growth phase were determined in several similar experiments and plotted against the impeller rotation speed (Fig 9). As observed in earlier studies, this rate is proportional to the surface exchange area of the crystalline naphthalene in contact with the aqueous phase (Volkering et al., 1992), which can be deduced from the slopes of the linear regression lines. In addition to this observation, the biomass
43

Chapter 2
formation rate depends on the film thickness of the laminar fluid layer at the naphthalene surface, which is decreased at increased mixing rate. These data were also incorporated in Figure 4, showing that biomass formation rates were affected by the dimensionless Reynolds number in the same way as mass-transfer coefficients.
During the aerobic degradation of naphthalene, oxygen limitations were prevented by the flushing of pure oxygen prior to the experiments. A calculation based on a headspace and reactor liquid volume of 193 and 400 mL, respectively, a maximum biomass concentration of 0.12 kg nr3 (Figs 6-8), and a yield of 0.93 kg kg-1
shows that a maximum amount of 5.2 x 10⁻⁵ kg naphthalene was converted. When this amount is oxidized to water and carbon dioxide, 4.9 mmol of molecular oxygen is necessary, which is equal to a volume of 122 mL of pure oxygen gas under the experimental conditions (atmospheric pressure, 30°C). The actual amount of oxygen consumed will be even less, because only a certain fraction of the naphthalene is completely oxidized because biomass is also formed.
The volatilization of naphthalene to the reactor headspace was negligible, because calculation showed that the amount of naphthalene in the gas phase was 1% of the amount of naphthalene dissolved in the aqueous phase. This equilibrium distribution was calculated according to Henry's law and a value of 2.0 x 10"2 was used for the dimensionless Henry coefficient, which is defined as the ratio of the gas phase to liquid phase volumetric concentration (Fendinger and Glotfelty, 1990).
The implications of biofilm formation at the naphthalene crystalline surface on the results of these experiments have not been determined yet. However, it can be expected that even at low biofilm thickness, mass transfer from the crystalline surface to the bulk liquid is decreased by an extra barrier in the diffusive transfer of naphthalene. This influence will be relatively more important when the thickness of the stagnant liquid film decreases and becomes comparable to the biofilm thickness, e.g., at high mixing speeds.
2.7 Conclusions
In this work an experimental and theoretical approach was presented by which mass transfer and biodegradation processes can be studied and quantified on the basis of simple batch experiments. Experimental data showed the influence of hydrodynamic conditions on the dissolution and biodegradation rate of the poorly soluble naphthalene from crystalline surfaces. Film thickness and mass-transfer coefficient as a function of mixing rate were quantified and results were generalized by using dimensionless numbers. The knowledge of mass-transfer characteristics as a function of reactor hydrodynamics is of importance in actual intensive bioremediation
44

Influence of hydrodynamic conditions on naphthalene bioavailability
situations, because the economy of a process may be improved by optimizing the energy requirements for mixing. Thus, reactor geometry and energy input, characterized by the dimensionless Schmidt, Sherwood, and Reynolds numbers, are important factors in bioreactor design and scale-up, determining bioavailability and biodegradation rate of the pollutant. The simple experimental setup used in this study resulted in a theoretical and experimental methodology that can be extended to more complex systems consisting of PAH particles or soil particles with sorbed pollutant in full-scale reactor systems. However, the mass-transfer model should in this case be adapted to the system under consideration, because the first-order dissolution model used only applies to pure solid-phase substances. The processes that limit the biodegradation of organic soil pollutants in full-scale bioreactors can be identified by calculating the Damkohler number, which indicates mass-transfer or reaction limited conditions. The above conclusions indicate the dynamic nature of the bioavailability concept to be used in problems concerning the fate of organic pollutants in soil.
45

Chapter 2
Nomenclature
A surface area of naphthalene melt C dissolved naphthalene concentration C* max imum dissolved naphthalene concentration Cb bulk phase dissolved naphthalene concentration d n aphthalene melt diameter d\ impeller d iameter D naphthalene diffusion coefficient ki n aphthalene mass-transfer coefficient Ks saturation constant M impeller rotation speed N mass flux at the naphthalene surface R volumetric conversion rate Re dimensionless Reynolds number Sc dimensionless Schmidt number Sh dimensionless Sherwood number t time V liquid phase volume X biomass concentration Y yield factor
Greek symbols
a dimensionless parameter defined in Equation (10) P dimensionless parameter defined in Equation (10) X dimensionless parameter defined in Equation (10) 8 film thickness TJ liquid phase dynamic viscosity /j. growth rate /Jmax maximum growth rate p liquid density v liquid phase kinematic viscosity
[m2) [kg m-3) kg nr3) [kg nr3) (m) [m) [m2s-!) [m s-1) [kg nr3) [s-i) kg nr2 s1) kg nr3 s1)
(-) (-) (-) (s) [m3) kg nr3)
(kg kg-1)
:-) :-) :-) [m) [kg mV 1 )
kg m3) m2 s-i)
46
Influence of hydrodynamic conditions on naphthalene bioavailability
Literature
Bird RB, Stewart WE, Lightfoot EN (1960) Transport Phenomena. 1st edition. Wiley, New York
Birman I, Alexander M (1996) Optimizing biodegradation of phenanthrene dissolved in nonaqueous-phase liquids. Appl. Microbiol. Biotechnol. 45: 267-272
Cerniglia CE (1984) Microbial metabolism of polycyclic aromatic hydrocarbons. Adv. Appl. Microbiol. 30: 31-71
Davies JI, Evans WC (1964) Oxidative metabolism of naphthalene by soil Pseudomonads: The ring fission mechanism. Biochem. J. 91: 251-261
Evans CGT, Herbert D, Tempest DW (1970) The continuous cultivation of microorganisms. 2. Construction of a chemostat, pp. 277-327. In: JR Norris, and Ribbons DW (eds.), Methods of microbiology, vol. 2, Academic Press, London
Evans WC, Fernley HN, Griffith E (1965) Oxidative metabolism of phenanthrene and anthracene by soil Pseudomonads: The ring-fission mechanism. Biochem. J. 95: 819-831
Fendinger NJ, Glotfelty DE (1990) Henry's law constants for selected pesticides, PAHs and PCBs. Environ. Toxicol. Chem. 9: 731-735
Guerin WF, Boyd SA (1992) Differential bioavailability of soil-sorbed naphthalene for two bacterial species. Appl. Environ. Microbiol. 58:1142-1152
Guerin WF, Jones GE (1988) Mineralization of phenanthrene by a Mycobacterium sp. Appl. Environ. Microbiol. 54: 937-944
Gustafson KE, Dickhut RM (1994) Molecular diffusivity of polycyclic aromatic hydrocarbons in aqueous solution. J. Chem. Eng. Data. 39: 281-285
Hermannson M, Marshall KC (1985) Utilisation of surface localised substrate by non-adhesive marine bacteria. Microb. Ecol. 11: 91-105
Levins DM, Glastonbury JR (1972) Application of Kolmogoroff's theory to particle-liquid mass transfer in agitated vessels. Chem. Eng. Sci. 27: 537-543
Mihelcic JR, Luecking DR, Mitzell RJ, Stapleton JM (1993) Bioavailability of sorbed-and separate-phase chemicals. Biodegradation. 4:141-153
Mihelcic JR, Luthy RG (1991) Sorption and microbial degradation of naphthalene in soil-water suspensions under denitrifying conditions. Environ. Sci. Technol. 25: 169-177
Perry RH, Chilton CH, Kirkpatrick SD (1963) Chemical engineers' handbook. McGraw-Hill, New York
Press WH, Teukolsky SA, Vetterling WT, Flannery BP (1992) Numerical recipes in Fortran: The art of scientific computing, 2nd edition. Cambridge University Press, Cambridge, UK
Ramaswami A, Ghoshal S, Luthy RG (1994) Mass transfer and biodegradation of
47

Chapter 2
PAH compounds from coal tar. Water Sci. Technol. 30: 61-70 Rulkens WH, Bruning H (1995) Clean-up possibilities of contaminated soil by
extraction and wet classification: effect of particle size, pollutant properties and physical state of the pollutants, pp. 761-773. In: WJ van den Brink, R Bosman and F Arendt (eds.), Contaminated soil '95, Soil & Environment, vol. 5 , Kluwer, The Netherlands
Scow KM, Alexander M (1992) Effect of diffusion on the kinetics of biodegradation: Experimental results with synthetic aggregates. Soil Sci. Soc. Am. J. 51:128-134
Tempest DW (1970) The continuous cultivation of microorganisms. 1. Theory of a chemostat, pp. 259-276. In: JR Norris, and DW Ribbons (eds.), Methods in microbiology, vol. 2, Academic Press, London
Volkering F, Breure AM, Sterkenburg A, Van Andel JG (1992) Microbial degradation of polycyclic aromatic hydrocarbons: Effect of substrate availability on bacterial growth kinetics. Appl. Microbiol. Biotechnol. 36: 548-552
Volkering F, Breure AM, Van Andel JG (1993) Effect of microorganisms on the bioavailability and biodegradation of crystalline naphthalene. Appl. Microbiol. Biotechnol. 40: 535-540
Weber WJ, Miller CT (1988) Modeling the sorption of hydrophobic contaminants by aquifer materials-I. Water Res. 22: 457-464
Wilson SC, Jones KC (1993) Bioremediation of soil contaminated with polynuclear aromatic hydrocarbons (PAHs): A review. Environ. Pollut. 81: 229-249
Wodzinski RS, Bertolini D (1972) Physical state in which naphthalene and bibenzyl are utilized by bacteria. Appl. Microbiol. 23:1077-1081
Wodzinski RS, Coyle JE (1974) Physical state of phenanthrene for utilization by bacteria. Appl. Microbiol. 27:1081-1084
Wu S, Gschwend PM (1986) Sorption kinetics of hydrophobic organic compounds to natural sediments and soils. Environ. Sci. Technol. 20: 717-725
48

CHAPTER 3
Effect of biofilm formation by Pseudomonas 8909N on the bioavailability of solid naphthalene*
3.1 Abstract
The effect of biofilm formation by Pseudomonas 8909N (DSM-No. 11634) on the dissolution and biodegradation rates of solid naphthalene was quantified. Biofilms were cultivated on solid naphthalene as a model polycyclic aromatic hydrocarbon in continuous cultures. After different periods of incubation, the dissolution rate of naphthalene was determined by batch dissolution tests with active or inactivated biofilms and without biofilms. Results show that the naphthalene dissolution rate to the bulk liquid phase was reduced by over 90% after 7 days of biofilm formation. The degradation of naphthalene in the biofilm proved to be insignificant compared to the decrease in the bulk liquid conversion of naphthalene, and the overall biodegradation rate of the solid naphthalene decreased.
* H Mulder, AM Breure, D van Honschooten, JTC Grotenhuis, JG van Andel, WH Rulkens (1998) Appl. Microbiol. Biotechnol. 12:23-34
Chapter 3
3.2 Introduction
Polycyclic aromatic hydrocarbons (PAHs) are persistent soil pollutants because of their chemical and physical properties. The low water solubility and strong hydrophobic character of these compounds result in very low mass-transfer rates in soil. The nature of the mass-transfer processes depends partially on the physical state of the contaminant in the soil matrix (Mihelcic et al., 1993). Sorption to the organic matter of the soil and intraparticle diffusion through small pores in which bacteria are unable to penetrate are important retarding processes in porous soils (Volkering, 1996). In soils with high loadings of solid-phase PAH or PAHs dissolved in non-aqueous-phase liquids, dissolution to the aqueous phase will be the most important mechanism for mass transfer (Ghoshal and Luthy, 1998; Mulder et al., 1998).
In earlier studies in our laboratory, the influence of hydrodynamic conditions on the dissolution rate of naphthalene as a model PAH has been studied in model systems (Mulder et al., 1998). These model systems consisted of solid naphthalene surfaces that were developed to overcome heterogeneities that are present in soil material. After several days of incubation with axenic cultures of Pseudomonas 8909N, biofilm formation was observed visually on the solid naphthalene surface. Although growth of microorganisms at the hydrocarbon-water interface is a common phenomenon for liquid hydrocarbons (Ascon-Cabera and Lebeault, 1995; Chakravarty et al, 1972,1975; Efroymson and Alexander, 1991; Ortega-Calvo and Alexander, 1994), growth on solid hydrocarbons is not often reported (Cameotra et al., 1983; Goswami et al., 1983; Hermansson and Marshall, 1985; Kirschner Zilber et al., 1979, 1980; Tongpim and Pickard, 1996). To our knowledge, the formation of biofilms on solid naphthalene surfaces has not been reported before. It was the purpose of this study to investigate whether and to what extent the bioavailability of solid naphthalene is affected by the biofilm formation.
3.3 Modeling
The batch dissolution of solid naphthalene to the aqueous phase can be described according to the film theory. This model implies that mass-transfer resistances are mainly located in the diffusive transfer of dissolved naphthalene over a laminar fluid layer at the solid naphthalene surface to a well-mixed bulk liquid phase (Fig 1) (Mulder et al., 1998). In a batch reactor, the dissolution of solid naphthalene without a biofilm can be described by:
50

Biofilm formation decreases naphthalene bioavailability
naphthalene
fluid film bulk
B nutrients
naphthalene
biofilm fluid film bulk
Figure 1 Schematic presentation of naphthalene dissolution and degradation without (A) and with (B) a biofilm at the solid surface. C* solubility of naphthalene in water, C, concentration of naphthalene at distance SB from the solid-liquid interface, Q. dissolved naphthalene concentration in bulk liquid phase
V*£L = k A(C*-CL) dt L v L'
(1)
where V is the liquid volume (m3), G, the dissolved naphthalene concentration in the bulk liquid (kg nr3), t the time (s), ki the mass-transfer coefficient (m s1), A the surface area of the solid naphthalene (m2) and C* the water solubility of naphthalene (kg nv3). The mass-transfer coefficient is defined as:
h = D
(2)
where D is the diffusion coefficient of naphthalene in water (m2 s1) and 8 the thickness of the laminar fluid layer (m). When Equation (1) is integrated with the initial condition of zero dissolved naphthalene concentration, this gives:
51

Chapter 3
/ CL=C*
.b£t) 1-e v (3)
When a biofilm is present on the naphthalene surface, an extra mass-transfer resistance will exist (Fig 1) and naphthalene can be degraded in the biofilm. These two additional processes can be modeled by formulating a mass balance over the biofilm, assuming pseudo-steady-state conditions:
d2C r dx2 DB
x = 0 -» C = C* B.C(I)
dC
(4)
x = SB ->• -DB— dx
= kL(Ci-CL) B.C(II) x=S„
where x is the distance from the solid surface (m), C the dissolved naphthalene concentration (kg nr3), DB is the effective diffusion coefficient of naphthalene through the biofilm (m2 s_1), C, is the naphthalene concentration at a distance of <% from the solid-liquid interface (kg nr3) (Fig 1) and r the volumetric conversion rate of naphthalene in the biofilm (kg nr3 s-1), which is defined as:
r = i^S- (5) Y
where XB is the biomass concentration in the biofilm (kg nr3), Y the yield of the organisms on naphthalene (kg kg-1) and n the growth rate of the bacteria (s_1), which can be modeled according to Monod kinetics:
M = Mmax~ v (6)
where fhax is the maximum growth rate of the immobilized bacteria (s1) and Ks the Monod constant (kg nr3). When the dissolved naphthalene concentration in the biofilm is relatively high compared to the value of K$ (Fig 1), zero-order growth kinetics can be assumed and the growth rate of the bacteria equals the maximum growth rate. Because of the value of the Monod constant (Ks) of the organism used,
52
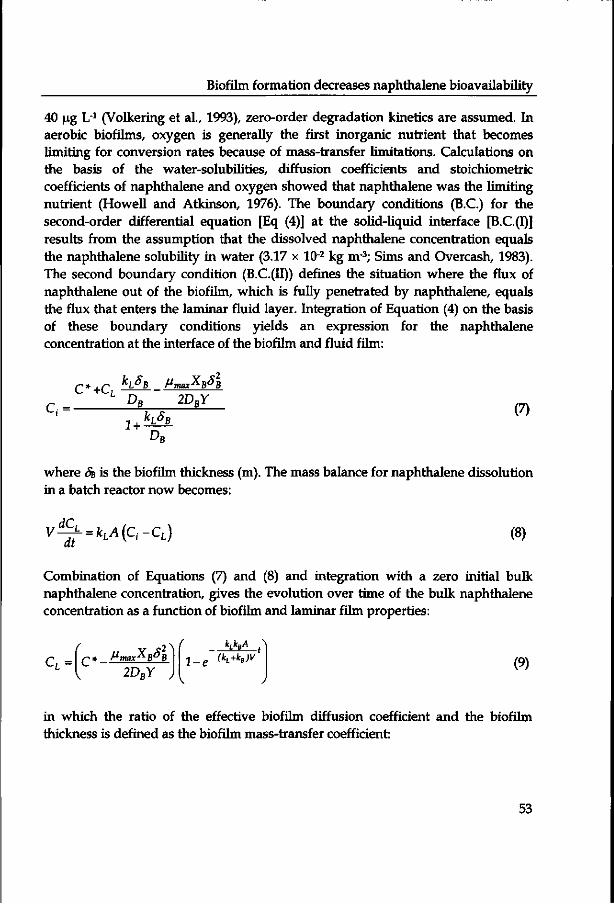
Biofilm formation decreases naphthalene bioavailability
40 ug L1 (Volkering et al., 1993), zero-order degradation kinetics are assumed. In aerobic biofilms, oxygen is generally the first inorganic nutrient that becomes limiting for conversion rates because of mass-transfer limitations. Calculations on the basis of the water-solubilities, diffusion coefficients and stoichiometric coefficients of naphthalene and oxygen showed that naphthalene was the limiting nutrient (Howell and Atkinson, 1976). The boundary conditions (B.C.) for the second-order differential equation [Eq (4)] at the solid-liquid interface [B.C. (I)] results from the assumption that the dissolved naphthalene concentration equals the naphthalene solubility in water (3.17 x 10"2 kg nv3; Sims and Overcash, 1983). The second boundary condition (B.C. (II)) defines the situation where the flux of naphthalene out of the biofilm, which is fully penetrated by naphthalene, equals the flux that enters the laminar fluid layer. Integration of Equation (4) on the basis of these boundary conditions yields an expression for the naphthalene concentration at the interface of the biofilm and fluid film:
C*+C ^L^B Mmax^B^B L D B 2DBY
Q= V * ~— (7) 1+ M B
DB
where 5B is the biofilm thickness (m). The mass balance for naphthalene dissolution in a batch reactor now becomes:
v ^ = M(Q-cL ) (8)
Combination of Equations (7) and (8) and integration with a zero initial bulk naphthalene concentration, gives the evolution over time of the bulk naphthalene concentration as a function of biofilm and laminar film properties:
CL
( ., v x2^ p» MnuaAB°B
2DBY .
f kLkBA \ 2 _ e (kL+kB)V (9)
in which the ratio of the effective biofilm diffusion coefficient and the biofilm thickness is defined as the biofilm mass-transfer coefficient:
53

Chapter 3
kB=^ (10)
where fa* is the biofilm mass-transfer coefficient (m s1). The mass-transfer coefficients through the laminar layer and biofilm can be determined by rearranging Equations (3) and (8):
a = kL no biofilm (11a)
a = —L B inactive biofilm (lib) kL +kB
where a is a lumped mass-transfer coefficient introduced for the sake of simplicity (m s"1) and the growth rate is put to zero, as is the case for an inactivated biofilm. By plotting the left-hand terms of Equation (11) against time, the value of a can be determined by linear regression. The value of fa can be determined from a dissolution test in which the biofilm is removed, and fa can be calculated from the results of a dissolution experiment with an inactivated biofilm according to Equations (11) and ( l ib), assuming that fa. is unaffected by the presence of a biofilm. In similar dissolution tests with active biofilms, the effect of microbial activity on the dissolution rate can be studied. Because data on the biodegradation capacity in the biofilm are unavailable, these data cannot be plotted in a form similar to Equation (11). Therefore, both the dissolution rates with the active and with the inactivated biofilms were plotted as a fraction of the dissolution rate of the solid naphthalene without a biofilm:
dC
dt
(=0
biofilm
«=-^F- <*> dt no biofilm
where <j> is the fraction (-) of the maximum (e.g. no biofilm) dissolution rate. To gain insight into the effect of a biofilm on the overall biodegradation capacity in the continuous reactor system, the flux of naphthalene from the solid surface should be calculated as a function of both biofilm and reactor system properties.
54
Biofilm formation decreases naphthalene bioavailability
First, the bulk concentration in the continuous reactor is calculated from the basic chemostat expression:
CL = f fKs ^ (13)
V V\ Mmax
where/is the flow rate of the medium in and out of the reactor (m3 s1). Then, using Equations (1), (7), and (8) the pseudo-steady-state naphthalene fluxes from the solid-liquid interface with and without a biofilm can be calculated and subsequently compared by defining a dimensionless number:
rSB+-^j-(C*-CL-" k^B /r* r Mmax^B^B
N kL(C*-CL) K '
where N and NB are the naphthalene mass fluxes from the solid surface in the absence and presence of a biofilm respectively (kg nr2 s1) and 7 is a dimensionless parameter indicating whether the biodegradation capacity of the system is decreased (77 < 1) or increased (77 > 1) by biofilm formation. Equation (13) can be used to calculate the value of Q. for different organism and reactor systems.
3.4 Materials and methods
3.4.1 Bacterial cultures
Isolation and characterization of the Pseudomonas sp. 8909N strain (DSM-No. 11634) were described earlier by Volkering et al. (1992).
3.4.2 Mineral medium
A mineral salts solution was used in all experiments to certify similar conditions in both biodegradation and dissolution experiments (Mulder et al., 1998).
3.4.3 Naphthalene melts
The production of solid-phase naphthalene melts with specified surface areas was described before (Mulder et al. 1998).
55
Chapter 3
3.4.4 Cultivation of the biof ilms Biofilms were cultivated in 500-mL stirred fermentors with naphthalene as sole carbon and energy source. The reactor geometry was identical to that of batch reactors used in earlier work (Mulder et al., 1998), but in this study the reactors were operated continuously by pumping mineral medium into them and simultaneously removing reactor liquid from the mixed bulk at the same flow rate of 40 mL h1. Prior to an experiment, the reactors were sterilized by steam autoclaving at 120°C for 20 min. The 20-L mineral medium and waste vessels were sterilized at 120°C for 50 min. Biomass concentrations were determined by taking protein samples manually at certain times. At the start of an experiment, naphthalene melts were placed at the bottom of the reactor with a sterile pincet. When biofilms were observed on the naphthalene surface the melts were subsequently replaced by new melts at 1-day intervals. The melts that were removed from the reactors were used for batch dissolution tests. To prevent oxygen limitation in the fermentors, pure oxygen gas was led through the reactor liquid by a stainless-steel filter with 2-p.m porosity (HPLC inlet filter; Alltech, The Netherlands) at a flow rate of 1.5 L h1.
3.4.5 Batch dissolution
After a naphthalene melt had been removed from the continuous reactor, it was placed in an identical reactor with 400-mL mineral medium at 30°C. Naphthalene dissolution was measured by taking samples for HPLC analysis in time. After approximately 2 h the melt was than placed in a batch reactor filled with 400 mL of a mineral medium solution with 1.3 g L"1 NaN3 to stop microbial activity. Again the dissolution of naphthalene was measured for 2 h. Finally, the melt was than placed in a 1 M NaOH solution to remove the biofilm from the naphthalene surface. The melt was placed in another 400-mL batch reactor with a solution of 1.3 g L1 NaN3 in mineral medium and the dissolved naphthalene concentration was measured as a function of time.
3.4.6 Measurement of O2 consumption rate by an active biofilm
The activity of biofilms at the naphthalene surface was measured by determination of the oxygen consumption rate of an active biofilm at 30°C in a biological oxygen monitor (Volkering et al., 1995). The biofilm was scraped from the solid naphthalene surface and placed in a 6-mL biological O2 monitor vessel, which was filled with an air-saturated mineral-salts solution with a dissolved naphthalene concentration of 20 mg L1. Because of intense mixing in the vessel (800 rpm) the biofilm was dispersed immediately as small particles in the liquid phase. The
56

Biofilm formation decreases naphthalene bioavailability
oxygen concentration was recorded over time (Kipp & Zn., The Netherlands), and afterwards the biomass concentration of the solution in the vessel was determined.
3.4.7 Determination of biofilm thickness
The biofilm was removed from the melt with a known amount of 1 M NaOH solution in which the protein concentration was determined. The total mass of bacteria in the NaOH-solution was than calculated by multiplication by the volume of the NaOH-solution. The volume occupied by the bacteria was obtained by dividing this mass by the density of the bacteria, which was assumed to be equal to the density of water. Assuming that 2.5% of the biofilm volume is occupied by bacteria (Characklis, 1990), the volume of the biofilm can be calculated. By dividing this volume by the naphthalene surface area, the biofilm thickness is obtained. Biofilm thicknesses were also determined by dividing the effective diffusion coefficient (DB), which was assumed to be 80% (Characklis, 1990) of the diffusion coefficient of naphthalene in water (D = 8.28 x 10⁻¹⁰ m2 s4; Gustafson and Dickhut, 1994), by the naphthalene biofilm mass-transfer coefficient (fa).
3.4.8 Analytical procedures
Dissolved naphthalene concentrations were determined by HPLC on a Hewlett-Packard series HP 1050 chromatograph. Samples were drawn form the reactors and 50% (v/v) diluted with acetonitrile. A 10-uL volume of these samples was injected on a 20-cm Qs Chromsphere PAH column (Chrompack, Middelburg, The Netherlands) at a temperature of 45°C. The eluate, a 12:88 % (v/v) mixture of MilliQ-water (Millipore, USA) and acetonitrile, was pumped over the column at a flow rate of 0.40 mL min1, resulting in an average pressure of 40 bar. Peaks were detected by a UV detector at 276 ran. The protein content in samples was determined according to a modified Lowry method (Peterson 1977). Biomass concentrations were calculated by assuming that the protein content of bacterial biomass is 70% (Herbert et al. 1971).
3.5 Results
3.5.1 Dissolution experiments
Biofilms were cultivated on solid naphthalene surfaces (3.14 x 10⁻⁴ m2) in continuous cultures of Pseudomonas 8909N with naphthalene as sole carbon and energy source at an impeller rotation speed of 200 rpm. Biomass concentrations in the bulk fluid of the continuous reactors were between 1 x 10² and 2 x 10"2 kg nv3.
57
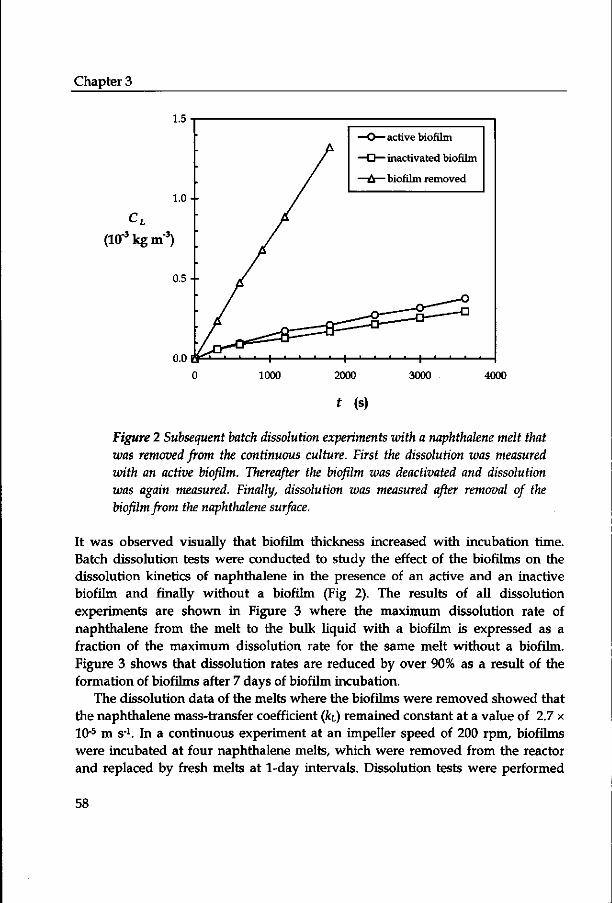
Chapter 3
1.5
(10-3kgm-3)
- active biofilm
- inactivated biofilm
- biofilm removed
1000 2000 3000 4000
t (S)
Figure 2 Subsequent batch dissolution experiments with a naphthalene melt that was removed from the continuous culture. First the dissolution was measured with an active biofilm. Thereafter the biofilm was deactivated and dissolution was again measured. Finally, dissolution was measured after removal of the biofilm from the naphthalene surface.
It was observed visually that biofilm thickness increased with incubation time. Batch dissolution tests were conducted to study the effect of the biofilms on the dissolution kinetics of naphthalene in the presence of an active and an inactive biofilm and finally without a biofilm (Fig 2). The results of all dissolution experiments are shown in Figure 3 where the maximum dissolution rate of naphthalene from the melt to the bulk liquid with a biofilm is expressed as a fraction of the maximum dissolution rate for the same melt without a biofilm. Figure 3 shows that dissolution rates are reduced by over 90% as a result of the formation of biofilms after 7 days of biofilm incubation.
The dissolution data of the melts where the biofilms were removed showed that the naphthalene mass-transfer coefficient (fa.) remained constant at a value of 2.7 x 10⁻⁵ m s1. In a continuous experiment at an impeller speed of 200 rpm, biofilms were incubated at four naphthalene melts, which were removed from the reactor and replaced by fresh melts at 1-day intervals. Dissolution tests were performed
58

Biofilm formation decreases naphthalene bioavailability
1.0-
08 -
00.6-
0.4-
0.2-
0.0-
—O— inactivated biofilm
—•— active biofilm
— i — . — . — . — | — J ^ g = = = = ^ • c - j — • — i — • — • — • — • — i — •
]
10 15
t (d)
Figure 3 Naphthalene dissolution rate in the presence of active and inactivated biofilms, expressed as a fraction of the maximum dissolution rate as a function of biofilm incubation time. Error bars indicate standard deviations of triplicates; where error bars are absent, single values are given.
and values for the mass-transfer coefficients ki and ke were determined, as well as biofilm thicknesses, according to the two different methods (Fig 4). From Figure 4 it can be seen that the water-film mass-transfer coefficient ki is constant for the four different melts, but the value of the mass-transfer coefficient of naphthalene through the biofilm decreases over time.
3.5.2 Microbial activity in the biofilm
To determine the activity of the biomass in the biofilm, the oxygen consumption rate of a 4-day-old biofilm cultivated at 400 rpm was measured in a biological oxygen monitor. A value of 1.3 x 10"4 (kg O2) (kg biomass)1 s-1 was determined. Assuming complete oxidation of naphthalene to CO2 and H2O (without growth) and no endogenic respiration, a value of 4.3 x 10⁵ (kg naphthalene) (kg biomass)1
S"1 was calculated for the maximum naphthalene conversion rate in the biofilm. The volumetric conversion rate of naphthalene in the biofilm (r) can be calculated from this value by multiplication by the biomass concentration of the biofilm (XB). For a
59

Chapter 3
4.0
3.0--
(10-4 m s"1)
2.0--
1.0--
0.0
-- 160
• 8B (protein)
• §B (mass transfer)
120
- -80 (Urn)
- -40
t (d)
Figure 4 Effect of different biofilm incubation periods (t) on the mass-transfer coefficients through the laminar film (kO and the biofilm (ks) and biofilm thicknesses (SB) as determined from the protein content and from the mass-transfer coefficient through the biofilm.
biofilm with a biomass concentration of 25 kg nv3 (Characklis, 1990), the volumetric conversion rate has a value of 1.1 x 10⁻³ kg nr3 s-1.
3.5.3 Mathematical simulation
A mathematical exercise was performed in order to investigate the effect of the presence of a biofilm at the naphthalene surface on the bioavailability of the solid substrate at the two impeller speeds applied. Therefore, the value of rj was calculated [Eq (14)] as a function of the biofilm thickness (SB) and the volumetric conversion rate (r), while other parameters were held constant (Tab 1; Fig 5). The results show that the bioavailability of the solid naphthalene was always reduced, since the value of rj never exceeded unity for all parameter combinations.
60

Biofilm formation decreases naphthalene bioavailability
5B (10-4 m) r (lO^kgm-V1)
Figure 5 Dimensionless parameter (TJ), indicating an decreased (TJ<1) or increased (TJ>1) bioavailability of solid naphthalene, as a function of biofilm thickness (SB) and the volumetric naphthalene conversion rate (r) at 200 and 400 rpm impeller speeds.
Table 1 Parameters used in the mathematical exercise. C* solubility of naphthalene in water, h mass-transfer coefficient, A surface area of solid naphthalene, V liquid volume, f flow rate of medium through reactor, D diffusion coefficient of naphthalene in water, DB effective diffusion coefficient of naphthalene through the biofilm
impeller speed
(rpm)
200
400
C*
(kgm-3)
0.0317
0.0317
h (ms-i)
2.7x10⁻⁵
5.1x10⁻⁵
A
3.14x10-*
3.14x10⁴
V
K) 4x10⁴
4x10⁴
/ (m3 S-l)
1.11x10*
1.11x10*
D
(m2s-')
8.28xlOio
8.28xlOio
(m2 s-i)
6.62xl010
6.62x101°
61
Chapter 3
3.6 Discussion
Figures 2 and 3 show that the dissolution rate of naphthalene into the bulk liquid is strongly reduced by the formation of the biofilms on the surface of the melts. Figure 3 shows that inactivation of the biofilm has no effect on the naphthalene dissolution rate compared to the active biofilm. Of course, whether the biofilm is as active in the dissolution reactor as it was before in the continuous culture can be disputed, since differences in the environmental conditions might cause a shock to the organisms. The data in Figure 4 show that the mass-transfer coefficient fa. remains constant over the incubation period of the biofilms. As this was also the case for all other experiments, the assumption made that there is a constant value for the surface area of the melts is supported. In agreement with visual observations, an increased biofilm thickness was determined as a function of the incubation period by the two different methods (Fig 4). The increase in biofilm thickness over time is similar in shape for the two methods, but the numerical values differ significantly. This can be explained because several theoretical assumptions underlie both methods. For instance, the biomass concentration in the biofilm (25 kg nr3) is derived from the literature (Characklis, 1990) and was not determined experimentally. Furthermore, because extracellular proteins (Flemming, 1995) are incorporated in the determination of the total protein content of the biofilm, the biofilm thicknesses given in Figure 4 represent maximum values. The biofilm thickness determined by this method will decrease when the relative amount of extracellular proteins compared to intracellular proteins increases. Although the value of the naphthalene diffusion coefficient (80% of the diffusion coefficient in water) is a typical value for diffusion coefficients of solutes in biofilms (Characklis, 1990), significant variations in these values have been reported (Libicki et al., 1988). Because naphthalene is a strongly hydrophobic compound, retarded diffusion caused by partitioning of compounds into the biofilm materials (Flemming, 1995) (mainly bacteria and extracellular polysaccharides) might lower the value of the effective diffusion coefficient through the biofilm (Libicki et al., 1988).
The volumetric napthalene conversion rate predicted by the oxygen consumption data can explain the data in Figures 2 and 3, in which no significant difference in the naphthalene dissolution rate is observed between active and inactivated biofilms. It can be seen from Equation (9) that the difference in the naphthalene dissolution rate between active and inactivated biofilms is caused by the microbial conversion of naphthalene in the biofilm. However, this conversion was low compared to the solubility of naphthalene [Eq (9)] and it was therefore not possible to discriminate between the naphthalene dissolution rates with an active
62

Biofilm formation decreases naphthalene bioavailability
or an inactive biofilm. The experimental value for the volumetric naphthalene conversion rate (1.1 x 10⁻³ kg nr3 s1) is comparable to the value calculated (3.4 x 10 3
kg nr3 s1) using a biomass concentration in the biofilm of 25 kg nr3 and microbial kinetics of a suspended culture of Pseudomonas 8909N (jJmaX = 0.46 h 1 , Y = 0.93 kg kg-1; Mulder et al., 1998). However, because of the complex nature of biofilm microbial kinetics (Capdeville and Nguyen, 1990), such a comparison of kinetics between suspended and immobilized bacterial cultures is disputable and can only serve as a tool to check whether data are physically realistic.
The mathematical exercise showed that the overall bioavailability of solid-phase naphthalene is drastically decreased by the presence of a biofilm with the properties specified in Table 1 and in the ranges of the biofilm thickness and volumetric conversion rates specified in Figure 5. As the volumetric conversion rate of naphthalene increases at constant biofilm thickness, the bioavailability decreases less, but values of 77 were never above unity. These experimental and theoretical results show that the bioavailability of pure naphthalene is strongly decreased by the immobilization of bacteria on the naphthalene solid surface.
When these findings are translated to bioremediation practice, this effect might significantly reduce the efficiency of biological treatment, since longer treatment periods will be necessary to achieve the same degree of conversion (Zhang et al. 1995). From an ecotoxicological perspective, the biofilms at the soil pollutant surface could reduce the flux of this toxic compounds to organisms, thereby reducing the chance of negative effects. However, it must be noted that the results in this study have been generated in well-defined experimental systems with an axenic culture. In order to discuss the effect of biofilm formation on pure soil contaminants, more work should be done on this subject in more realistic experimental systems.
63

Chapter 3
Nomenclature
A surface area of naphthalene melt C dissolved naphthalene concentration C* maximum dissolved naphthalene concentration C, dissolved naphthalene concentration at distance 8B
from the solid-liquid interface d bulk phase dissolved naphthalene concentration D diffusion coefficient of naphthalene in water DB effective diffusion coefficient of naphthalene through
the biofilm / flow rate of the medium in and out the reactor ki mass-transfer coefficient of naphthalene in the fluid layer ks mass-transfer coefficient of naphthalene in the biofilm Ks Monod constant N naphthalene mass flux from the solid surface in the
absence of a biofilm NB naphthalene mass flux from the solid surface in the
presence of a biofilm r volumetric conversion rate of naphthalene in the biofilm t time V liquid volume x distance from the solid naphthalene surface XB biomass concentration in the biofilm Y yield of the organisms on naphthalene
Greek symbols
a dimensionless parameter defined in Equation (11) S thickness of the laminar fluid layer 5B biofilm thickness <(> dimensionless number defined in Equation (12) H growth rate of the bacteria Umax maximum growth rate of the bacteria r\ dimensionless number defined in Equation (14)
m2) kg nv3) [kg nr3) [kg nr3)
kg nr3) m2 s-1) m2 s-1)
,m3 s-1) [m s-1) [m s1) [kg nr3) [kg nr2 s1)
kg nr2 s_1)
kg nr3 s1)
s) m3)
m) kg nr3) kgkg-i)
• )
m) m) )
s-1) s"1) )
64

Biofilm formation decreases naphthalene bioavailability
Literature
Ascon-Cabera MA, Lebeault JM (1995) Interfacial area effects of a biphasic aqueous/organic system on growth kinetics of xenobiotic-degrading microorganisms. Appl. Microbiol. Biotechnol. 43:1136-1141
Cameotra SS, Singh HD, Hazarika AK, Baruah JN (1983) Mode of uptake of insoluble solid substrates by microorganisms. II: uptake of solid n-alkanes by yeast and bacterial species. Biotechnol. Bioeng. 25: 2945-2956
Capdeville B, Nguyen KM (1990) Kinetics and modelling of aerobic and anaerobic film growth. Water Sri. Technol. 22:149-170
Chakravarty M, Amin PM, Singh HD, Baruah JN, Iyengar MS (1972) A kinetic model for microbial growth on solid hydrocarbons. Biotechnol. Bioeng. 14: 61-73
Chakravarty M, Singh HD, Baruah JN (1975) A kinetic model for growth on liquid hydrocarbons. Biotechnol. Bioeng. 17: 399-412
Characklis WG (1990) Biofilm processes. In: Charaklis WG, Marshall KC (eds) Biofilms. Wiley, New York
Efroymson R, Alexander M (1991) Biodegradation by an Arthrobacter species of hydrocarbons partitioned into an organic solvent. Appl. Environ. Microbiol. 57: 1441-1447
Flemming HK (1995) Sorption sites in biofilms. Water Sci. Technol. 32: 27-33 Ghoshal S, Luthy RG (1998) Biodegradation kinetics of naphthalene in nonaqueous
phase liquid-water mixed batch systems: comparison of model predictions and experimental results. Biotechnol. Bioeng. 57: 356-366
Goswami PC, Singh HD, Bhagat SD, Baruah JN (1983) Mode of uptake of insoluble solid substrates by microorganisms, I: sterol uptake by an Arthrobacter species. Biotechnol. Bioeng. 25: 2929-2943
Gustafson KE, Dickhut RM (1994) Molecular diffusivity of polycyclic aromatic hydrocarbons in aqueous solutions. J Chem Eng Data 39: 281-285
Herbert D, Phipps, Strange RE (1971) Chemical analysis of microbial cells. Methods Microbiol. 5: 209-343
Hermansson M, Marshall KC (1985) Utilization of surface localized substrate by non-adhesive marine-bacteria. Microb. Ecol. 11: 91-105
Howell JA, Atkinson B (1976) Influence of oxygen and substrate concentrations on the ideal film thickness and the maximum overall substrate uptake rate in microbial film fermenters. Biotechnol. Bioeng. 18:15-35
Kirschner Zilber I, Gutnick D, Rosenberg E (1979) 32P incorporation and growth of the hydrocarbon-degrading Pseudomonad UP-2. Curr. Microbiol. 2:163-167
Kirschner Zilber I, Rosenberg E, Gutnick D (1980) Incorporation of 32P and growth of Pseudomonad UP-2 on n-tetracosane. Appl. Environ. Microbiol. 40:1068-1093
65

Chapter 3
Libicki SB, Salmon PM, Robertson CR (1988) The effective diffusive permeability of a nonreacting solute in microbial cell aggregates. Biotechnol. Bioeng. 32: 68-85
Mihelcic JR, Lueking DR, Mitzell RJ, Stapleton JM (1993) Bioavailability of sorbed-and separate-phase chemicals. Biodegradation 4:141-153
Mulder H, Breure AM, Andel JG van, Grotenhuis JTC, Rulkens WH (1998) Influence of hydrodynamic conditions on naphthalene dissolution and subsequent biodegradation. Biotechnol. Bioeng. 57:145-154
Ortega-Calvo J, Alexander M (1994) Roles of bacterial attachment and spontaneous partitioning in the biodegradation of naphthalene initially present in nonaqueous-phase liquids. Appl. Environ. Microbiol. 60: 2643-2646
Peterson GW (1977) A simplification of the protein assay method of Lowry et al. which is more generally applicable. Anal. Biochem. 83: 346-356
Sims RC, MR Overcash (1983) Fate of polynuclear aromatic compounds (PNAs) in soil-plant systems. Residue Rev. 88:1-68
Tongpim S, Pickard MA (1996) Growth of Rhodococcus SI on anthracene. Can. J. Microbiol. 42: 289-294
Volkering F (1996) Bioavailability and biodegradation of polycyclic aromatic hydrocarbons. PhD thesis, Wageningen Agricultural University, Wageningen, The Netherlands
Volkering F, Breure AM, Sterkenburg A, Andel JG van (1992) Microbial degradation of polycyclic aromatic hydrocarbons: Effect of substrate availability on bacterial growth kinetics. Appl. Microbiol. Biotechnol. 36: 548-552
Volkering F, Breure AM, Andel JG van (1993) Effect of micro-organisms on the bioavailability of crystalline naphthalene. Appl. Microbiol. Biotechnol. 40: 535-540
Volkering F, Breure AM, Andel JG van, Rulkens WH (1995) Influence of nonionic surfactants on bioavailability and biodegradation of polycyclic aromatic hydrocarbons. Appl. Environ. Microbiol. 61:1699-1705
Zhang W, Bouwer E, Wilson L, Durant N (1995) Biotransformation of aromatic hydrocarbonds in subsurface biofilms. Water Sci. Technol. 31:1-14
66
CHAPTER 4
Effect of nonionic surfactants on naphthalene dissolution and biodegradation*
4.1 Abstract
The effect of six nonionic surfactants, Igepal CA-720, Tergitol NPX, Triton X-100, PLE4, PLE10 and PLE23, on the dissolution rate of solid naphthalene was studied in stirred batch reactors. Results showed increased mass-transfer rates with increased surfactant concentrations up to 10 kg nv3. Dissolution experiments were adequatly described by a mechanistic mass-transfer model. Partitioning of naphthalene into the micelles and the diffusion coefficients of the micelles affected the dissolution rate most significantly. Combined dissolution and biodegradation experiments with Triton X-100 or PLE10 with naphthalene showed that the biomass formation rate of Pseudomonas 8909N (DSM-No. 11634) increased concomitantly with the mass-transfer rate under naphthalene-dissolution limited conditions up to surfactant concentrations of 6 kg nr3.
* H Mulder, GR Wassink, AM Breure, JG van Andel, WH Rulkens (1998) Biotechnol. Bioeng. 60: 397-407
Chapter 4
4.2 Introduction
The microbiological conversion of polycyclic aromatic hydrocarbons (PAHs) into less harmful compounds has been shown in various laboratory studies (Cerniglia, 1984, 1992; Evans et al., 1965). However, in soil bioremediation practice the residual concentrations of such pollutants are often still above admissible levels, even after extensive treatment periods. Limitations in the mass-transfer rate of sorbed or separate phase PAHs to the aqueous phase, in which biodegradation can occur, is widely accepted as the cause of this persistence (Mihelcic et al., 1993; Volkering et al., 1992, 1993; Wu and Gschwend, 1986). The addition of (bio)surfactants to increase the diffusive mass-transfer rate of soil pollutants has received much attention in the last years (Aronstein and Alexander, 1992, 1993; Aronstein et al , 1991; Edwards et al, 1992, 1994; Grimberg et al., 1995, 1996a,b ; Hunt et al., 1993; Laha and Luthy, 1991, 1992; Tiehm, 1994; Thibault et al., 1996; Volkering et al., 1995; Yeom et al., 1996).
Surfactant molecules consist of a hydrophobic and a hydrophilic part and can interact with polar as well as apolar surfaces (Rosen, 1989). Above the critical micelle concentration (CMC) surfactant molecules aggregate and form micelles with a hydrophobic center in which partitioning of chemicals is possible. This partitioning results in increased pseudo-water-solubilities of hydrophobic compounds such as PAHs, hereby increasing the concentration gradient and mass-transfer rates. The availability of PAHs for biodegradation can be increased when the contaminants become available in the same phase as the microorganisms at a higher rate. It is shown that PAHs present in micelles are not available to biodegradation but have to be dissolved in the aqueous phase (Volkering et al., 1995).
The various interrelationships between surfactants, soil constituents, microorganisms and PAH are complex and experimental results are often difficult to interpret due to heterogeneities in soil material (Liu et al., 1995; Volkering, 1996). The use of well defined experimental systems is a possibility to eliminate these uncertainties (Grimberg et al., 1995; Mulder et al., 1998; Scow and Alexander, 1992; Volkering et al , 1992). The effect of surfactant addition on transport processes has been studied in such well-defined experimental systems to understand the mechanistic processes that cause the acceleration of mass-transfer in the presence of surfactants (Grimberg et al., 1995; Volkering et al., 1995). It was shown in these studies that the dissolution rate of PAHs increases in the presence of nonionic surfactants, resulting in an increased bioavailability of the solid phase PAHs. Models on a mechanistic basis were developed to describe the observed results. Mass transfer of micellar-phase PAH from the solid PAH surface had to be taken
68

Nonionic surfactants increase naphthalene bioavailability
into account (Grimberg et al., 1995) because dissolution rates were underestimated when only dissolution via the aqueous phase was considered (Volkering et al., 1995). However, because the exchange of PAH dissolved in the aqueous and micellar phase is considered to be instantaneous, in this work a model is used in which the micelles are assumed to be in local equilibrium throughout the entire liquid phase. This includes the stagnant laminar fluid layer at the surface of the solid-phase PAH in which the mass-transfer resistance is located. It was the purpose of this study to verify this model on the basis of simple batch experiments in well-defined reactor systems (Mulder et al., 1998). Six different nonionic surfactants were used in equilibrium and dynamic dissolution experiments to study the influence of surfactant and micellar properties on the dissolution process of solid-phase naphthalene. Biological tests with axenic cultures of Pseudomonas 8909N (DSM-No. 11634) with Triton X-100 or PLE10 and naphthalene were performed to study the effect of the accelerated mass transfer on the biodegradation kinetics.
4.3 Materials and methods
4.3.1 Bacterial cultures
Isolation of a naphthalene degrading bacterium was described previously and the microorganisms were characterized as a Gram-negative Pseudomonas strain 8909N (DSM-No. 11634) (Volkering et al., 1992). Cells, used for inoculation of the biodegradation experiments, were obtained from an active batch culture with crystalline naphthalene as the only carbon and energy source.
4.3.2 Mineral Medium A mineral medium, described in previous work (Mulder et al., 1998), was used in the biodegradation as well as in the physicochemical experiments at a temperature of 30°C to ensure similar conditions.
4.3.3 Maximum apparent solubilities
Maximum apparent solubilities of naphthalene in the presence of the nonionic surfactants were determined by adding approximately 2 g of crystalline naphthalene particles to 250-mL aseptic serum flasks amended with 100 mL sterile mineral medium with a known surfactant concentration. These flasks were
69

Chapter 4
incubated on a rotary shaker at 30°C and 2.5 s_1. At equilibrium, samples were drawn and prepared for HPLC by 50% (v/v) dillution with methanol in crimp top vails to determine the surfactant and dissolved naphthalene concentrations.
4.3.4 Naphthalene melts
Solid-phase naphthalene surfaces were produced by cutting conical notches, with a diameter of 1 or 2 cm and a depth of 0.5 cm, in stainless steel cylinders of 2.4 cm diameter (Mulder et al., 1998). In these notches, naphthalene crystals were melted at 150°C and after cooling at room temperature, this resulted in smooth surfaces. At maximum, 5 % of the naphthalene was dissolved during the experiments, and it was assumed that the surface area was constant.
4.3.5 Dynamic dissolution experiments
Dissolution experiments were performed at 30°C in 500-mL stirred reactors with disc-mounted flat-blade turbine impellers (Mulder et al., 1998). Prior to an experiment, the reactor was filled with 400 mL of a sterile surfactant solution in mineral medium and was allowed to reach operating temperature. Hereafter, a naphthalene melt was placed in the reactor, and samples were drawn at certain times from the liquid for subsequent HPLC analysis to determine surfactant and naphthalene concentrations.
4.3.6 Biodegradation experiments
The reactors used in this experiments were identical to the reactors used in the dissolution experiments. Prior to the experiments, the reactors were filled with 400 mL of Triton X-100 or PLE10 solution in mineral medium and sterilized at 120°C for 20 min in a steam autoclave. The stainless steel and Viton tubing used to interconnect the reactor with a pump and a flow-through quartz cuvet was sterilized by subsequently pumping through 1 M NaOH, 1 M HC1 and sterile mineral medium for a period of 30 min per solution. After sterilization and interconnection of the reactors and tubing, the reactors were kept at a temperature of 30°C and were saturated with oxygen. During the experiments reactor solutions were pumped through quartz cuvets in which optical density at 540 nm (OD540) was measured (Varian Cary 1) in time. The experiments were initiated by immersing a naphthalene melt in the reactor. The dissolution kinetics in the presence of Triton X-100 were quantified by drawing samples at certain times for determination of dissolved naphthalene concentrations. Naphthalene dissolution kinetics in the presence of PLE10 was quantified by measuring the absorption at 276 nm in the flow-through cuvet as a function of time. Two hours after the start of
70

Nonionic surfactants increase naphthalene bioavailability
naphthalene dissolution, bacterial cells were added and two sets of samples were drawn from the reactors from that moment on. The first set of samples was directly filtered off over 0.45 urn disposable filters (Spartan 13/20, Schleicher & Schuell, Dassel, Germany) to remove bacteria and was stored at 4°C for surfactant and naphthalene quantification by HPLC. The second set of samples were directly stored at -20°C for protein concentration analysis. The existence of oxygen limitations was tested by bubbling through pure oxygen in the linear growth phase of the bacteria and measurements of the dissolved naphthalene concentration. When a sudden change in the slope of the linear growth curve was observed, after the oxygen addition, and high dissolved naphthalene concentrations were measured in the linear growth phase, an oxygen limitation was present.
4.3.7 Analytical procedures
Biomass formation was determined by measuring optical density at 540 run (OD540) in the flowthrough cuvette. OD540 values were converted to biomass concentrations by determining the protein concentration at a certain optical density. Protein concentrations were determined by the method described by Peterson (1977). A conversion factor of 4.33X101 [(kg nr3) OD5401] was determined. Igepal CA-720, Tergitol NPX and Triton X-100 dissolved naphthalene concentrations were determined by high performance liquid chromatography (Hewlett-Packard series HP 1050). Concentrations of the PLE-type surfactants could not be determined by this method. Samples, 50 % diluted with methanol, were injected on a 20 cm Chromspher Os-PAH column (Chrompack, Middelburg, The Netherlands) with a 85:15 (v/v) mixture of methanol and water as eluent. Peaks were detected by a UV detector at 276 nm for naphthalene and the 3 aromatic surfactants mentioned above. Naphthalene concentrations in the biodegradation experiments with PLE10 were determined by measuring light absorption at 276 nm in a flow-through cuvet (Varian Cary 1). A molar absorption coefficient of 5.45xl03 M^cnv1 was used in the calculations. Kinematic viscosities were measured with an Ubbelohde viscometer (Poulten Selfe & Lee Ltd., Wickford, England). The dynamic viscosity was calculated from this value by multiplication with the liquid density. A rotaviscometer (VOR, Bohlin, Sweden) equipped with a cone and plate geometry (1° angle) was used to investigate the influence of shear rate on the viscosity. A range of shear rates of 80 to 201 s 1 was applied in these measurements.
71

Chapter 4
Igepal CA-720
CH3
I I H3C C C C \ / /
CH3 CH3
C CH2 H 2
OH
12
Tergitol NPX CH3 CH2 O C CH2
H2
OH J 10.5
CH3 CH3
Triton X-100 H3C—c—c—c—k\ / /
I H2 I \ / CH3 CH3
O C CH2
H2
OH
9.5
PLE (n) CH3 CH2 -C CH2
H2
OH
Figure 1 Chemical structures of the six nonionic surfactants used in the experiments. The character n denotes the number of ethoxylate groups in the polyoxyethylene ethers (n = 4, 10, 23).
4.3.8 Chemicals
The surfactants listed in Table 1 and shown in Figure 1 were used without purification. In this table physical and chemical properties are given. All other chemicals were analytical grade, besides the methanol for analytic purposes, which was HPLC grade.
Table 1 Physical and chemical properties of the nonionic surfactants
surfactant
Igepal CA-720
Tergitol-NPX
Triton X-100
PLE4
PLE10
PLE23
Molecular
weight
(g mol-i)
735
683
625
363
627
1200
HLB
14.9
14.0
13.9
10.7
14.6
17.2
P
(kgm-3)
1104
1060
1065
950
992"
988"
purchased at
Aldrich
Fluka
Fluka
Sigma
Sigma
Sigma
Catalog No.
23,858-9
86450
93420
P-4391
P-9769
P-1254
" (Van Os et al., 1993)
72

Nonionic surfactants increase naphthalene bioavailability
4.4 Modeling
The mechanistic mass-transfer model used is similar to earlier models describing the PAH fluxes in both the aqueous and micellar phase (Grimberg et al., 1995). The following assumptions underlie the mathematical equations: (i) micelles are only formed above the critical micelle concentration; (ii) only micellar surfactant affects the maximum solubility of naphthalene; (iii) concentrations of micellar-phase naphthalene and water-phase naphthalene are in local equilibrium; (iv) above the critical micelle concentration, the micellar-phase naphthalene concentration is a proportional function of the water-phase naphthalene concentration; (v) mass transfer is limited by the diffusive flux of naphthalene over a stagnant water film at the surface of the melts; (vi) surfactant micelles act as a separate phase, and the apparent solubility of naphthalene is increased by partitioning into this phase and the water-phase solubility is unaffected. The above assumptions are generally accepted (Edwards et al., 1992) but assumptions (iii) and (v) result in some alterations in relation to the earlier model, on the basis of which the solubilization kinetics could not be described satisfactory (Volkering et al., 1995). A graphical presentation of the processes modeled is given in Figure 2.
mixed bulk
liquid
Figure 2 Graphical representation of the dissolution process.
73

Chapter 4
The relation between water-phase and micellar-phase naphthalene concentrations can be modeled by a equilibrium relation:
Cu,=KCm (1)
where Cw and Cm are water-phase and micellar-phase naphthalene concentrations respectively (kg nr3), and K is the partition coefficient (dimensionless). A mass balance over the liquid phase can be formulated:
CTVT=CaVw+CmVm (2)
where CT is the apparent concentration of naphthalene (kg nr3) in a total volume Vr (m3), which is equal to the sum of water volume Vw (m3) and micellar volume Vm
(m3). The volume Vm can be defined by:
K=VT(S-SCMC) whenS>ScMc (3)
where S is the surfactant concentration (kg nr3), SCMC the critical micellar concentration of the surfactant (kg nr3) and p the surfactant density (kg nr3) assuming that the volume of the micelles in the liquid phase is equal to the volume of the surfactant that is present as micelles. The SCMC can be determined by calculating the surfactant concentration at which the value of the maximum apparent naphthalene concentration is equal to the naphthalene solubility in water. Under saturation conditions the concentrations in Equation (2) are equal to saturation concentrations. Assuming that the solubility of naphthalene in water (C*w) is unaffected in the presence of surfactants, the partition coefficient (K) can be calculated from the apparent solubility (C*r) at a certain surfactant concentration. By substitution of Equations (1) and (3) in (2), the water-phase naphthalene concentration can be described explicitly as:
C = Wl (4) W L Vr(SSCMC)) { '
[a pK )
Two naphthalene fluxes over the stagnant fluid film can be distinguished: a flux of aqueous-phase naphthalene and a flux of solubilized naphthalene. The first flux is defined as:
74

Nonionic surfactants increase naphthalene bioavailability
Nu, = -Dw^- (5)
where Nw is the flux of naphthalene in the aqueous phase (kg nv2 s1), Dw the aqueous-phase diffusion coefficient of naphthalene (m2 s1) and x the distance from the solid naphthalene into the liquid phase. The flux of solubilized naphthalene is given by:
N = _Dmk(S-SCMC)dCm w i t h . ^ = Q w h e n s < s^c
p dx
where Nm is the flux of solubilized naphthalene (kg nv2 s1) and Dmic the diffusion coefficient of the micelles (m2 s1). When local equilibrium [Eq (1)] is assumed between the naphthalene concentrations in the aqueous phase and in the micellar phase, the total flux of naphthalene over the laminar film can be found by addition of both fluxes [Eqs (5) and (6)]:
L'micid ^CMC/
PK dC
NT=-\ Dw+ ""c' CMC/ ^p- (7) dx
where NT is the total flux of naphthalene from the solid-phase PAH surface (kg nv2
s1). According to the film theory (Bird et al., I960), the flux of naphthalene is constant at any given moment and Equation (7) can be integrated:
NT = rK + km(S~JCMc))(c:-ca) (8)
where kw is the aqueous-phase mass-transfer coefficient (m s1) and km the micellar-phase mass-transfer coefficient (m s1). These mass-transfer coefficients are defined as the ratios of the respective diffusion coefficients and the thickness of the laminar fluid layer at the solid-phase PAH surface:
K=^f (9)
k » = % (10)
75

Chapter 4
where S is the film thickness (m). Experimental data on diffusion coefficients of micelles are scarce but can be calculated from the theoretical Stokes-Einstein equation which applies for large spherical particles or molecules (Bird et al., 1960):
D*ic=T^- (11) 6nRhri
where Kis the Boltzmann's constant (1.380 x 10²³ J K1), T the temperature (K), Rh the hydrodynamic radius of the diffusing particle (m) and t] the dynamic viscosity of the medium (kg m 1 s1).
Because only apparent concentrations (Cr) could be measured, a mass balance is postulated which describes the change in apparent naphthalene concentration in time:
VT^- = NTA (12)
where A is the surface area of the solid-phase naphthalene (m2). The naphthalene concentration at the interface between solid naphthalene and water is assumed to be equal to the water solubility C\ which is in equilibrium with the saturated micellar-phase naphthalene concentration (C*m). Combination of Equations (4), (8) and (12) gives:
k | K{s-scMc)
d C x = r pK / A / C . _ c ) ( 1 3 )
dt (r _ VT(S-SCMCj) v J> v,+ pK
Integration of the above differential equation results in a relation that describes the evolution of the apparent dissolved naphthalene concentration in time:
In \CT~CT }=-at (14)
76

Nonionic surfactants increase naphthalene bioavailability
k ( *m(S SCMC)
« = 7 v A <15)
pK
where a is a lumped mass-transfer parameter which is introduced for the sake of simplicity (s_1). By plotting the left logarithmic term in Equation (14) against time, the value of a can be determined by linear regression. The maximum dissolution rate was calculated by multiplication of a by the surface area of the solid naphthalene (A) and by the saturated apparent concentration at the applied surfactant concentration [i.e. the bulk apparent naphthalene concentration is set to zero in Eq (13)]. The micellar mass-transfer coefficient (km) can be calculated from the values of the lumped mass-transfer parameter as a function of surfactant concentration. Nonlinear regression (Graphpad Prism 2.00) is used to optimize the value of km. It is assumed that the aqueous-phase diffusion coefficient of naphthalene is unchanged in these dilute solutions, and therefore a constant value of kw is used. Because the description of the Igepal CA-720 data was inadequate by this procedure, here a calculation was made with a variable value of kw. The value of the diffusion coefficient of the micelles is calculated according to Equation (10) by multiplication of the micellar mass-transfer coefficient by the laminar layer thickness (S).
Hydrodynamic conditions can significantly affect the dissolution of solid-phase naphthalene to the aqueous phase because the thickness of the stagnant fluid film at the solid surface is determined by the rheology of the solution (Mulder et al., 1998). Surfactant addition changes this rheology by, for instance, changes in the liquid-phase viscosities. The effect of the viscosity on mass-transfer coefficients like kw and k„, can be described as:
( Y
where ki and ki are mass-transfer coefficients (m s1) at dynamic liquid viscosities of T]\ and t]i (kg m 1 s1) respectively. The parameter ft depends on the geometry of the experimental system and is dimensionless. This relation is derived assuming that the diffusion coefficient of the solute remains constant within the viscosity range of 773 t o 72-
It was shown earlier (Mulder et al., 1998) that mass-transfer and biomass-
77
Chapter 4
formation rates could be quantified in single run experiments and this methodology was also adapted in this study. First, mass-transfer coefficients were determined by a sterile dissolution experiment and by application of Equation (14) to the data. After this dissolution experiment, bacteria are inoculated in the reactor. The growth kinetics of the bacteria can be modeled with Monod kinetics:
f=M- fKx (17)
where X is the biomass concentration (kg nr3), Ks is the saturation constant (kg nr3) and Umax is the maximal growth rate of the bacteria (s1) which can be determined from the exponential growth phase (Mulder et al., 1998). It was shown before (Mulder et al., 1998; Volkering et al., 1992) that the biomass-formation rate was limited by the dissolution rate of the naphthalene when linear growth curves were observed. Bacterial growth can than be related to substrate depletion by a yield factor:
dX = dC dt ~ dt
(18)
where Y is the yield coefficient of the organism growing on naphthalene (kg kg-1). Under mass-transfer limited growth conditions the yield coefficient can therefore be calculated from the ratio of the maximum dissolution rate and the biomass-formation rate in the linear growth phase. The first is obtained by setting the apparent naphthalene concentration (Cr) to zero in Equation (13), the latter by linear regression on the linear section of the growth curve.
4.5 Results
4.5.1 Maximum apparent solubilities
The maximum apparent solubility of naphthalene was determined for the nonionic surfactants Igepal CA-720, Tergitol NPX, Triton X-100, PLE4, PLE10 and PLE23 (Fig 3). Dynamic experiments showed that equilibrium was established within the period of 24 h of incubation. The lines in Figure 3 represent linear regression lines on the solubility data at surfactant concentrations above the SCMC From the slope and the intercept with the y-axis, SCMC and K values were calculated and the results are shown in Table 2.
78

Nonionic surfactants increase naphthalene bioavailability
(kgm-3)
1.6-
1.2-
0.8 -
0.4 -
0.0'
+ IgepalCA-720
OTergitolNPX
DTriton X-100
APLE4
OPLEIO
XPLE23
/t
A
/k
\ j b . ^ ^
10 15
S (kgm3)
Figure 3 Maximum apparent solubilities of naphthalene (C'T) as a function of surfactant concentrations (S)for six nonionic surfactants at 30°C.
4.5.2 Dynamic dissolution experiments
The effect of the surfactant concentration on the dissolution rate of naphthalene was studied in dynamic experiments with naphthalene melts (surface area of 3.14 x 10⁻⁴ m2) in stirred reactors (rotational speed 6.67 s1). Apparent naphthalene concentrations in the liquid phase were measured for a period of 2 hours at different concentrations of the nonionic surfactants. Typical results of the dissolution experiments are presented in Figure 4 (Triton X-100) and in Figure 5 (PLE). The k,„ values of the six surfactants used are given in Table 3. The lines in these figures represent model calculations which describe the maximum dissolution rate and the lumped mass-transfer parameter (a) as a function of surfactant concentration. On the basis of dissolution experiments without surfactants, a value of 1.1 x 10⁵ m was determined for S at a rotational speed of 6.67 s"1 (Mulder et al., 1998). Theoretical values for the diffusion coefficients of the micelles are calculated according to the Stokes-Einstein equation assuming that the hydrodynamic radius of the micelles was twice the length of the surfactant molecules (Dennis, 1979). The results of these calculations are shown in Table 3. On the basis of the experimentally determined values for the diffusion coefficients and
79

Chapter 4
Table 2 The Critical Micelle Concentration, partition coefficient and dynamic liquid viscosity at a surfactant concentration of 10 kg ms for the six nonionic surfactants used.
surfactant
Igepal CA-720
Tergitol NPX
Triton X-100
PLE4
PLE10
PLE23
ScMC
(kgm-3)
0.0547
0.0285
0.1416
0.2609
0.1246
0.0555
K
(Iff4)
5.57
3.87
4.23
2.48
4.76
8.42
(10" kg m"1 s"1)
8.72
10.02
8.77
11.40
8.76
9.08
the Stokes-Einstein equation, experimental radii of the micelles are calculated (Tab 3). Viscosity measurements were performed at 30°C with an Ubbelohde viscometer at different surfactant concentrations of the six nonionic surfactants. A linear increase in solution dynamic viscosity with surfactant concentration was observed for all six surfactants. In Table 2 the dynamic viscosity at a surfactant concentration of 10 g L1 is shown. The viscosity of the mineral medium was determined to be 8.36 x 1(H kg m 1 s1. The rheological behavior of the PLE4 solution was determined with a rotaviscometer equipped with a cone and plate geometry. The measurements of the dynamic viscosity at different shear rates showed that this solution was Newtonian up to PLE4 concentrations of 10 g L1.
Table 3 Diffusion coefficients of surfactant micelles (DmiC) calculated on the basis of the Stokes-Einstein equation and the lumped mass-transfer parameter (a). Hydrodynamic radii of the micelles (Rh) were calculated on the basis of the chemical structure of the surfactants and the experimentally determined diffusion coefficients.
surfactant
Igepal CA-720
Tergitol NPX
Triton X-100
PLE4
PLE10
PLE23
experimental
Km
(lO^ms"1)
10.55
6.65
10.86
3.18
13.64
16.71
Dmic
(10-"m2s' ')
11.61
7.32
11.95
3.50
15.00
18.38
Rh
(10' l0m)
22.9
36.3
22.2
75.8
17.7
14.4
predicted
L)mic
(10-"m2s"')
5.30
5.41
6.56
9.03
5.26
2.80
Rh
(10-'°m)
50.1
49.1
40.5
29.4
50.5
94.8
80

Nonionic surfactants increase naphthalene bioavailability
d£. df max
(lO-6 kg m3 s1)
8 1
6 -
4 -
2 -
0 -
" ^
.
D dC/dt
O a
model
• 1 • • • 1
P ^ ^
—__o_
' ' ' 1 • • '
^^n.
•
' 0 w
1 • • •
r i
- 4
- A
•2
- 0
a (10'5 s1)
10
S (kgm-3)
Figure 4 Maximum dissolution rate (dC/dt) and lumped mass-transfer parameter (a) of naphthalene as a function of Triton X-100 concentration (S).
(lO^kgmV1) a
3 (IffV)
S (kgm"3)
Figure 5 Maximum dissolution rates (dC/dt) and lumped mass-transfer parameters (a) of naphthalene as a function of surfactant concentration (S) for PLE4, PLE10 and PLE23.
81

Chapter 4
0.000
-0.050 - •
In L, j - - L ] •
-0.100 - -
-0.150
0.20
• - 0.15
X ••0.10 ( kg in 3 )
0.05
0.00
20000 40000 60000
t (S)
80000 100000
Figure 6 Sterile dissolution experiment followed by a growth experiment with the strain Pseudomonas 8909N growing on naphthalene at three different PLE10 concentrations: 0, 2, and 6 kgm3.
4.5.3 Biodegradation experiments
To study whether the accelerated mass-transfer kinetics in the presence of surfactants were reflected in biodegradation rates, combined dissolution and biodegradation experiments were performed with Triton X-100 (naphthalene surface of 3.14 x 10-* m2) and PLE10 (naphthalene surface area of 7.85 x 10⁵ m2). Results of three experiments with PLE10 are shown in Figure 6. From such results, the maximum dissolution rate was calculated according to Equation (13). The maximum growth rate of the bacteria was determined from the exponential growth phase in each experiment (Fig 7). From the increase of biomass concentration in time during the linear growth phase, the biomass-formation rate was calculated by linear regression (Fig 8). The ratio of the maximum biomass-formation rate and the dissolution rate (yield) was calculated for each batch experiment and these data are also shown in this figure. The drawn line in Figure 8 represents the maximum dissolution rates of naphthalene in the presence of Triton X-100 as determined in the dynamic dissolution experiments (Fig 4). Similar results were obtained in experiments when PLE10 was added (data not shown).
82

Nonionic surfactants increase naphthalene bioavailability
2.0
1.5-• O
Mma O
4 ° (s-1) 1 0 +
0.5--
0.0
a
a o
O Triton X-100
• PLE10
A no surfactant
I ' ' • I • • ' I • ' • I • ' ' I * '
0 2 10 12
S (kgm'3)
Figure 7 Maximum growth rates (fima) of Pseudomonas 8909N growing on naphthalene as carbon and energy source as function of Triton X-100 and PLE10 concentration (S).
rates
(kgm-V) 4 | (kg kg1)
S (kgm"3)
Figure 8 Maximum dissolution rate of naphthalene and biomass-formation rate (dX/dt) under mass-transfer limited conditions as a function of Triton X-100 concentration (S). The yield coefficient (Y) calculated from these rates is plotted on the right y-axis.
83

Chapter 4
In previous work it was shown in batch tests that Pseudomonas 8909N could not use Triton X-100 as carbon or energy source (Volkering et al., 1995). In similar experiments with PLE10 as only possible carbon and energy source, a slight increase in biomass concentration was observed after 3 days of inoculation. The initial biomass concentration was similar to the biodegradarion experiments with naphthalene and PLE10. On the basis of this result and the length of the experiments it was assumed that the biomass formation in the dynamic dissolution and biodegradarion experiments could be attributed only to growth of the axenic culture on naphthalene as sole carbon and energy source.
In the experiments with Triton X-100, bacterial aggregation was observed at surfactant concentrations above 1 kg nr3. Small aggregates were fluidized in the flow-through cuvet and this interfered with the OD540 measurements. By increasing the flow rate through the cuvet, this could be prevented. Several samples were taken in the linear growth phase at different times for protein analysis to assure that biomass-formation rates were determined correctly because aggregation of the bacteria might alter the relation between the OD540 values and the biomass concentrations.
4.6 Discussion
4.6.1 Maximum apparent solubilities
The apparent concentration of naphthalene depends linearly on the surfactant concentration for all six nonionic surfactants used. Therefore, partitioning coefficients [Eq (1)] and CMC-values could be determined on the basis of these solubilization data. Equilibrium was established in the serumflasks within 24 h of incubation. This was due to the fine particles of naphthalene that were used to saturate the surfactant solutions (Volkering et al., 1995). A simple calculation using Equation (14) shows that a period of 130 h would be necessary to achieve 99% of the saturation naphthalene concentration at a Triton X-100 concentration of 10 kg nr3 in the stirred reactors using naphthalene melts (6.67 s1 rotational speed; 3.14 x 10⁻⁴ m2 naphthalene surface area).
4.6.2 Dynamic dissolution experiments
The results of the dynamic dissolution experiments show that the mass-transfer process of solid-phase naphthalene in the presence of different nonionic surfactants can be described by the mechanistic model (Figs 4 and 5). An important aspect of
84
Nonionic surfactants increase naphthalene bioavailability
this model is the assumption that the micellar-phase naphthalene concentration is in equilibrium with the aqueous-phase naphthalene concentration throughout the entire liquid phase. As this includes the laminar film at the solid naphthalene surface the extra flux of micellar solubilized naphthalene can be related to the diffusion coefficient of the micelles. In earlier studies with phenanthrene it was assumed that only micelles in the bulk liquid are in equilibrium with the aqueous phase concentration of this bulk (Grimberg et al., 1995). However, as the exchange of PAHs between the micelles and the aqueous phase is generally considered to be instantaneous (Grimberg et al., 1995; Volkering et al., 1995; Liu et al., 1995; Zana, 1987), it is more correct to assume that the concentration of naphthalene in the micelles will decrease going from the solid-liquid interface to the bulk liquid at subsaturated conditions in the bulk. The mathematical equations resulting from both approaches are similar due to identical boundary conditions at the solid-liquid interface and at the interface between the well-mixed bulk liquid and the stagnant hydrodynamic layer (Grimberg et al., 1995). However, when the micellar naphthalene concentrations are in local equilibrium with the aqueous-phase concentrations in the laminar film, the diffusion coefficient of the micelles will increase going from the solid-liquid interface towards the bulk liquid due to the decreasing naphthalene concentrations in that direction. The diffusion coefficients determined on the basis of this mathematical model and the experiments are therefore intermediate values between the values of the diffusion coefficients of saturated and empty micelles. Calculations according to the Stokes-Einstein equation indicate that the diffusion coefficient of naphthalene saturated micelles is 4 % to 1.4 % lower compared to empty micelles for PLE4 (highest pardoning) and PLE23 (lowest pardoning) respectively (Fig 3). Under mass-transfer limited growth conditions, the decrease in micellar radius will be maximal because the bulk concentrations of naphthalene are very low and the micelles will release the maximum amount of naphthalene during the transfer across the laminar film. A deviation of a few percent is therefore expected between predicted (Stokes-Einstein equation, empty micelles) and experimental values for the naphthalene mass fluxes and dissolution rates. This effect becomes more significant with increasing degree of pardoning due to the increasing difference between the micelle volume at saturation (e.g. at the solid-liquid interface) and the volume of empty micelles.
The results of the dissolution experiments with the six nonionic surfactants enables the analysis of the relation between surfactant chemical and physical properties and the efficiency in mass-transfer acceleration. From Equation (13) it is possible to determine the characteristics of an optimal surfactant or micellar system. In the situation of mass-transfer limited growth the bulk liquid concentration becomes negligible and the value of Or can be set to zero in Equation
85

Chapter 4
(13). The maximum apparent concentration is a linear function of the surfactant concentration above the SCMC, and so is the micellar volume. By combining Equations (2), (3) and (13) it can be deduced that the effect of surfactant addition on the increase of the apparent concentration and the micellar volume completely compensate each other. The extra mass transfer of naphthalene can therefore be attributed to the transport of micellar solubilized naphthalene over the laminar film. From Equation (13) it can be seen that this extra mass transfer will increase when: (i) the micellar mass-transfer coefficient (km) increases or (ii) the partitioning into the micelles increases (decrease of K). In the present study these two parameters were separately determined in dynamic and equilibrium experiments and the effect of these parameters on the performance of the six surfactants can therefore be discussed.
The value of the mass-transfer coefficient will increase when the hydrodynamic radius of the micelles decreases. When the length of the stretched surfactant molecule is taken as a measure for this radius (Dennis et al., 1979), the diffusion coefficients and thereby the mass-transfer coefficients of the micelles are underestimated (Tab 3). The surfactant molecules are, however, not fully extended in the micelles. In absence of organic compounds solubilized by the micelles, the radius of the hydrophobic core of the micelle can be considered equal to the length of the fully extended hydrophobic chain (Rosen, 1989). The hydrophilic chains, however, form hydrated coils and this phenomenon will result in a decrease of the micelle radius (Rosen, 1989; Van den Boomgaard, 1985). The smaller size of the micelles can explain the discrepancies in Table 3 between the theoretical and experimental values for the diffusion coefficients of the micelles. When micellar radii are calculated on the basis of these experimental diffusion coefficients and the Stokes-Einstein equation, they are (except for PLE4) indeed smaller than the surfactant molecular lengths (Tab 3).
A comparison of the diffusion coefficients for the phenyl-type surfactants shows that similar values are found for Igepal CA-720 and Triton X-100 which is expected due to the great similarity of the chemical structures (Fig 1). The value for Tergitol NPX is somewhat lower which can be explained by the length of the linear hydrophobic chain. The other two phenyl-type surfactants possess more branched hydrophobic chains and this might result in a smaller size of the hydrophobic core of the Igepal CA-720 and Triton X-100 micelles.
The PLE type surfactants were studied to examine whether the variation in the chain length of the polar group in the molecules was reflected in the values of the micellar diffusion coefficients as calculated from the dissolution experiments. It was expected that the diffusion coefficients would decrease as the chain length increased. This was not observed. Low diffusion coefficients for PLE4 micelles
86

Nonionic surfactants increase naphthalene bioavailability
were determined compared to the other two polyoxyethylene surfactants which had similar values. Furthermore, the PLE4 diffusion coefficient was the only case in which the experimental value was lower than the theoretical value calculated with the Stokes-Einstein equation (Tab 3). Although the viscosity of the solution increased significantly as function of PLE4 concentration, this effect could only account for a small fraction of the discrepancy observed. By applying Equation (16) on the dissolution data it was found that the mass-transfer coefficient was decreased 15% at a PLE4 concentration of 10 kg nr3 due to the viscosity increase. The value of (3 (0.47) was derived from earlier experiments in the same reactor system (Mulder et al., 1998). It is known that aggregation numbers of micelles increase in aqueous solutions when the surfactants become more hydrophobic. When the three PLE-type surfactants are compared, the PLE4 is the most hydrophobic due to the low HLB value (Tab 1). Furthermore, the PLE4 solutions were turbid because the cloud-point was exceeded (Van Os et al., 1993). At higher temperatures, the hydrophilic chain of ethoxylated surfactants is dehydrated and the reduced repulsive forces between micelles can cause secondary aggregation (Van den Boomgaard, 1985). The hydrodynamic radius of such secondary aggregation systems will increase compared to separate-micelle systems and this will result in lower diffusion coefficients. Operational temperatures should, therefore, kept below the cloud-point of the surfactant because mass-transfer rates can be significantly decreased by secondary aggregation.
The partitioning of the naphthalene molecules into the core of the micelles is fairly similar for the three phenyl-type surfactants but significant differences between the PLE-type surfactants are observed. As stated before, an increase in the partitioning will result in higher micellar mass-transfer coefficients (at a constant micelle diffusion coefficient). When the number of ethoxylate groups increases in the PLE-surfactants the partitioning is reduced, indicating that short hydrophilic chains are favorable. However, on the basis of the discussion above concerning the diffusion coefficients of the micelles, this is not always true. The small diffusion coefficient of the micelles and the high partitioning of naphthalene into the PLE4 micelles results in the lowest dissolution rate of all six surfactants tested. On the other hand, the smaller value of the diffusion coefficient of the PLE10 micelles compared to PLE23 is compensated for by the higher partitioning of naphthalene. From these results it is obvious that the combination of partitioning and diffusion processes determines the efficiency of the surfactants in accelerating mass-transfer rates of naphthalene. These processes can be quantified separately and this allows for the selection or design of surfactants on the basis of the physical and chemical properties of the surfactants and pollutants.
87

Chapter 4
a
a s=o
0 . 8 -
0 . 6 -
0 . 4 -
0 . 2 -
0 . 0 -
•In
• ' • • i • • • • i ' •
• this study
O Volkering et al., 1995
model
1 ' 1 • • • • 1 • ' ' ' 1 ' ' • •
S (kgm-3)
Figure 9 The lumped mass-transfer parameter (a) expressed as a fraction of this parameter at a zero surfactant concentration (S = 0), plotted against the Tergitol NPX concentration. These data are derived from the dissolution data of Volkering et al. (1995) (circles) and from this study (squares). The drawn line is calculated on the basis of the model presented in this paper.
To study whether the present model can now describe earlier experimental results from batch dissolution tests with naphthalene crystals in shaken reactors, the data of Volkering et al. (1995) were used. Dynamic dissolution experiments were performed under well-defined experimental conditions with particulate naphthalene of which the surface area was controlled by the mass and the size of the crystals. The description by the model than used, was poor because the dissolution rates predicted were too low to give an adequate description of the dissolution curves. The same experimental results are now described according to the model used in this work and results are shown in Figure 9. Earlier results (Volkering et al., 1995) showed the dissolution of naphthalene crystals in the presence of different concentrations Tergitol NPX (identical to the chemical used in this study; Tab 1). Because the surface area is not well-defined in these kind of experiments, the lumped mass-transfer parameter (a) is determined and made dimensionless by dividing by the value of this parameter at zero surfactant
88

Nonionic surfactants increase naphthalene bioavailability
concentration (as=o)- Hereby, the influence of the reactor volume, naphthalene surface area and hydrodynamic conditions are no longer relevant. The same method was applied for the dissolution data in Figure 4 and the results are plotted in Figure 9 with the data derived from Volkering et al. (1995). It is obvious from the latter figure that the two data sets agree well with each other and the model.
4.6.3 Biodegradation experiments
The surfactants Triton X-100 and PLE10 showed to be nontoxic to the Pseudomonas strain used and the maximum growth rate was not significantly reduced in the presence of these additives (Fig 7). The yield of the organisms remained constant at a value of approximately 1 kg kg"1 (Fig 8). At high PLE10 concentrations the yield seemed to increase which might be caused by the slow degradation of PLE10 which was observed in cultures without naphthalene present.
At the transition point of exponential to linear biomass formation, the mass flux of naphthalene limits the biodegradation rate of naphthalene (Fig 6) (Mulder et al, 1998; Volkering et al., 1992). It was expected that the acceleration of mass-transfer rates by the surfactants would be reflected in increasing biomass-formation rates under dissolution limited growth. In earlier experiments this was not observed. The addition of Triton X-100 seemed to reach a maximum effect on biomass-formation rates at Triton X-100 concentrations of 1 kg nr3 (Volkering et al., 1995). The rate at which oxygen was supplied to the liquid from the headspace might have been to low, because it was observed in the current study that oxygen limitations can also cause linear growth at high naphthalene dissolution rates. To prevent oxygen limitations it is therefore advised to use PAH with lower solubilities (e.g. phenanthrene) or a small surface area of the PAH to reduce the dissolution rate (Fig 8).
Because the Pseudomonas 8909N strain only grows on dissolved naphthalene in these experiments, the biomass-formation rate under mass-transfer limited conditions is a measure for the biodegradation rate of naphthalene. On the basis of these results it is shown that the accelerated mass-transfer of solid-phase naphthalene resulting from surfactant addition causes a proportional increase in the biodegradation rate of naphthalene by this bacterial strain up to surfactant concentrations of 6 kg nr3.
In contrast to earlier work (Volkering et al., 1995), the results of the biodegradation studies of naphthalene in the presence of Triton X-100 and PLE10 indicate that the dissolution rate of naphthalene at different surfactant concentrations is directly correlated to the biomass-formation rate. The methodology by which mass transfer and biological processes are quantified in simple batch experiments subsequently (Mulder et al., 1998), is shown to be
89

Chapter 4
applicable to these type of studies. The presented methodology which includes equilibrium and dynamic solubilization experiments, biodegradation experiments of PAHs and surfactants, and the description of these experiments by mechanistic models, will attribute to the insight in the applicability of surfactants in biological remediation of PAHs in soil. However, it must be noted that these experiments have been performed in well-defined model systems instead of real soil systems. Other processes are also important in these latter systems: (competitive) adsorption of the surfactant to the soil matrix (Liu et al, 1992), inhibition of contaminant biodegradation by surfactants (Laha and Luthy, 1991, 1992), degradation of the surfactants by soil organisms (Tiehm, 1994), structural changes of the soil matrix by surfactant material (Yeom et al., 1996) or the solubilization of other components than PAHs (for instance non-aqueous-phase-liquids). Although these processes are of great significance in soil remediation practice, it is the combination of fundamental and applied research that will hopefully result in a selection protocol for optimal (bio)surfactant systems.
Acknowledgments
Katja Grolle of the Department of Food Science, division of Integrated Food Science & Food Physics of the Wageningen Agricultural University, The Netherlands is gratefully acknowledged for performing the rotaviscometric measurements.
90

Nonionic surfactants increase naphtha lene bioavailability
Nomenclature
A surface area of naph tha lene mel t (m2)
Cm micellar phase naph tha lene concentrat ion (kg nv3) C*„, m a x i m u m micellar phase naph tha lene concentrat ion (kg n r 3 ) CT apparent naphthalene concentration (kg nv3) C*T max imum apparent naphthalene concentration (kg nv3) Cm aqueous phase naphthalene concentration (kg nr3) C*w max imum aqueous phase naphthalene concentration (kg nr3) Dw diffusion coefficient of naphtha lene in wa te r (m2 s 1 ) Dmic d iffusion coefficient of micelles in wa te r (m2 s 1 ) km mass-transfer coefficient of micellar phase naph tha lene (m s1) kw mass-transfer coefficient of aqueous phase naph tha lene (m s 1 ) K par t i t ion coefficient (-) Ks s a tura t ion constant (Monod constant) (kg n r 3 ) Nm micellar solubilized naph tha lene mass flux (kg n r 2 s*1) NT apparent naphthalene mass flux (kg n r 2 s1) Nw aqueous phase naphthalene mass flux (kg n r 2 s1) Ri, hydrodynamic radius (m) t t ime (s) T t emperature (K) V,„ vo lume of micellar surfactant (m3) VT l iquid phase volume (m3) Vw aqueous vo lume (m3) x distance from solid naphthalene into the liquid phase (m) X biomass concentration (kg nr3) Y yield factor (kg kg-1)
Greek symbols
a lumped mass-transfer parameter (s1) P dimensionless parameter defined in Equation (16) (-) 8 film thickness (m) 77 l iquid phase dynamic viscosity (kg m^s-1) fimax max imum growth rate (s1) K Boltzmann's constant (J K 1 ) p surfactant density (kg nv3)
91

Chapter 4
Literature
Aronstein BN, Alexander M (1992) Surfactants at low concentrations stimulate the
biodegradation of sorbed hydrocarbons in samples of aquifer sands and soil slurries. Environ. Toxicol. Chem. 11:1227-1233
Aronstein BN, Alexander M (1993) Effect of a nonionic surfactant added to the soil surface on the biodegradation of aromatic hydrocarbons within the soil. Appl. Microbiol. Biotechnol. 39: 386-390
Aronstein BN, Calvillo YM, Alexander M (1991) Effect of surfactants at low concentrations on the desorption and biodegradation of sorbed aromatic compounds in soil. Environ. Sci. Technol. 25:1728-1731
Bird RB, Stewart WE, Lightfoot EN (1960) Transport Phenomena. 1st edition. John Wiley & Sons, New York
Cerniglia CE (1984) Microbial metabolism of polycyclic aromatic hydrocarbons. Adv. Appl. Microbiol. 30: 31-71
Cerniglia CE (1992) Biodegradation of polycyclic aromatic hydrocarbons. Biodegradation. 3: 251-368
Dennis EA, Ribeiro AA, Roberts MF, Robson RJ (1979) Nonionic surfactant micelles and mixed micelles with phospholipids, pp. 175-194. In: K.L. Mittal (ed.), Solution chemistry of surfactants, Vol. 1, Plenum Press, New York
Edwards DA, Liu Z, Luthy RG (1992) Interactions between nonionic surfactant monomers, hydrophobic organic compounds, and soil. Water Sci. Technol. 26: 147-158
Edwards DA, Liu Z, Luthy RG (1994) Surfactant solubilization of organic compounds in soil/aqueous systems. J. Environ. Eng. 120: 5-21
Evans WC, Fernley HN, Griffith E (1965) Oxidative metabolism of phenanthrene and anthracene by soil Pseudomonads: the ring-fission mechanism. J. Biochem. 95: 819-831
Grimberg SJ, Miller CT, Aitken MD (1996a) Surfactant-enhanced dissolution of phenanthrene into water for laminar flow conditions. Environ. Sci. Technol. 30: 2967-2974
Grimberg SJ, Nagel JN, Aitken MD (1995) Kinetics of phenanthrene dissolution into water in the presence of nonionic surfactants. Environ. Sci. Technol. 29: 1480-1487
Grimberg SJ, Stringfellow WT, Aitken MD (1996b) Quantifying the biodegradation of phenanthrene by Pseudomonas stutzeri P16 in the presence of a nonionic surfactant. Appl. Environ. Microbiol. 62: 2387-2392
Hunt WP, Robinson HG, Ghosh MM (1993) The role of biosurfactants in biotic degradation of hydrophobic organic compounds. In: RE Hincee, BC Alleman,
92

Nonionic surfactants increase naphthalene bioavailability
RE Hoepel and RN Miller (eds), Hydrocarbon bioremediation, pp. 319-322, Lewis publishers, Boca Raton, USA
Laha S, Luthy RG (1991) Inhibition of phenanthrene mineralization by nonionic surfactants in soil-water systems. Environ. Sci. Technol. 25:1920-1930
Laha S, Luthy RG (1992) Effects of nonionic surfactants on the solubilization and mineralization of phenanthrene in soil-water systems. Biotechn. Bioeng. 40: 1367-1380
Liu Z, Edwards DA, Luthy RG (1992) Sorption of nonionic surfactants onto soil. Wat. Res. 26:1337-1345
Liu Z, Jacobson AM, Luthy RG (1995) Biodegradation of naphthalene in aqueous nonionic surfactant systems. Appl. Environ. Microbiol. 61:145-151
Mihelcic JR, Luecking DR, Mitzell RJ, Stapleton JM (1993) Bioavailability of sorbed-and separate-phase chemicals. Biodegradation. 4:141-153
Mulder H, Breure AM, Grotenhuis JTC, Van Andel JG, Rulkens WH (1998) Influence of hydrodynamic conditions on naphthalene dissolution and subsequent biodegradation. Biotechnol. Bioeng. 57:145-154
Peterson GW (1977) A simplification of the protein assay of Lowry et al. which is more generally applicable. Anal. Biochem. 83: 346-356
Rosen MJ (1989) Surfactants and interfacial phenomena. 2nd ed. Wiley Interscience, New York, USA
Scow KM, Alexander M (1992) Effect of diffusion and sorption on the kinetics of biodegradation: experimental results with synthetic aggregates. Soil Sci. Soc. Amer. J. 56:128-134
Tiehm A (1994) Degradation of polycyclic aromatic hydrocarbons in the presence of synthetic surfactants. Appl. Environ. Microbiol. 60: 258-263
Thibault SL, Anderson M, Frankenberger WT (1996) Influence of surfactants on pyrene desorption and degradation in soils. Appl. Environ. Microbiol. 62: 283-287
Van den Boomgaard A (1985) The effect of electrolytes on emulsions stabilized by nonionic surfactants. PhD thesis, Wageningen Agricultural University, Wageningen, The Netherlands
Van Os NM, Haak JR, Rupert LAM (1993) Physico-chemical properties of selected anionic, cationic and nonionic surfactants. Elsevier, Amsterdam, The Netherlands
Volkering F (1996) Bioavailability and biodegradation of polycyclic aromatic hydrocarbons. PhD thesis, Wageningen Agricultural University, Wageningen, The Netherlands
Volkering F, Breure AM, Van Andel JG (1993) Effect of microorganisms on the bioavailability and biodegradation of crystalline naphthalene. Appl. Microbiol.
93

Chapter 4
Biotechnol. 40: 535-540 Volkering F, Breure AM, Van Andel JG, Rulkens WH (1995) Influence of nonionic
surfactants on the bioavailability and biodegradation of polycyclic aromatic hydrocarbons. Appl. Environ. Microbiol. 61:1699-1705
Voikering F, Breure AM, Sterkenburg A, Van Andel JG (1992) Microbial degradation of polycyclic aromatic hydrocarbons. Effect of substrate availability on bacterial growth kinetics. Appl. Microbiol. Biotechnol. 36: 548-552
Wu S, Gschwend PM (1986) Sorption kinetics of hydrophobic organic compounds to natural sediments and soils. Environ. Sci. Technol. 20: 717-725
Yeom IT, Ghosh MM, Cox CD (1996) Kinetic aspects of surfactant solubilization of soil-bound polycyclic aromatic hydrocarbons. Environ. Sci. Technol. 30: 1589-1595
Zana R (1987) Surfactant solutions. Surfactant science series, Vol. 22, Marcel Dekker Inc., New York, USA
94
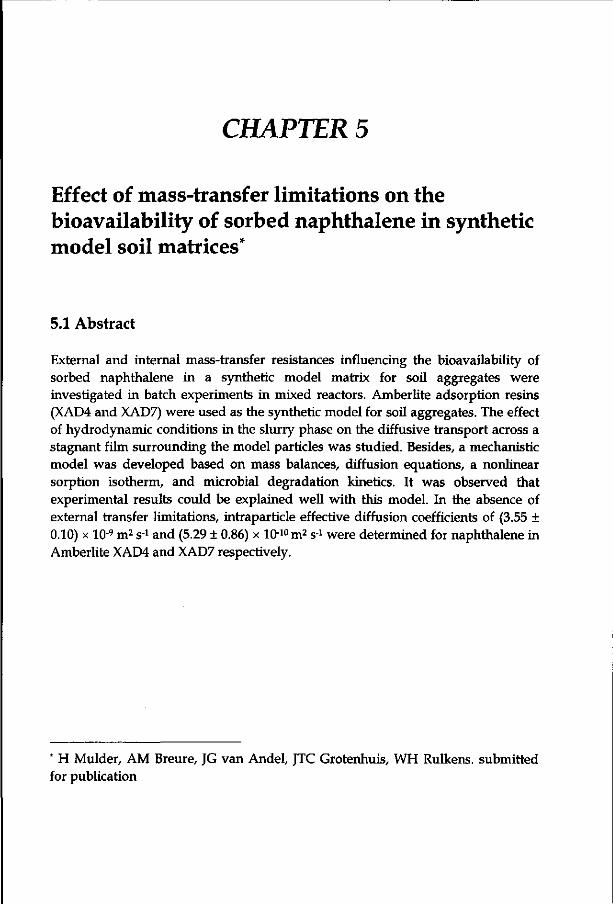
CHAPTER 5
Effect of mass-transfer limitations on the bioavailability of sorbed naphthalene in synthetic model soil matrices*
5.1 Abstract
External and internal mass-transfer resistances influencing the bioavailability of sorbed naphthalene in a synthetic model matrix for soil aggregates were investigated in batch experiments in mixed reactors. Amberlite adsorption resins (XAD4 and XAD7) were used as the synthetic model for soil aggregates. The effect of hydrodynamic conditions in the slurry phase on the diffusive transport across a stagnant film surrounding the model particles was studied. Besides, a mechanistic model was developed based on mass balances, diffusion equations, a nonlinear sorption isotherm, and microbial degradation kinetics. It was observed that experimental results could be explained well with this model. In the absence of external transfer limitations, intraparticle effective diffusion coefficients of (3.55 ± 0.10) x 10-9 m2 s 1 and (5.29 ± 0.86) x 1010 m2 s1 were determined for naphthalene in Amberlite XAD4 and XAD7 respectively.
* H Mulder, AM Breure, JG van Andel, JTC Grotenhuis, WH Rulkens. submitted for publication

Chapter 5
5.2 Introduction
The biological remediation of soils polluted with polycyclic aromatic hydrocarbons (PAHs) is considered an attractive alternative to the more destructive physical and chemical sanitation techniques. The biological value of the soil is preserved and therefore, it can be brought back into the environment, where soil treated otherwise is often dumped at waste disposal sites or only has a limited application as construction material.
There are, however, major drawbacks in bioremediation that limit its application. Since biological processes are used to lower pollutant concentrations, biodegradation of the contaminants must be possible by the microbial population present and environmental conditions have to allow for a sufficient biodegradation capacity of this population. In addition, biodegradation of non-contaminant compounds (soil organic matter) or the presence of other contaminants should not inhibit the conversion process. In the case of PAHs which are located in the soil under former gaswork plants, cyanide pollution, for instance, may limit the potential of bioremediation.
But even if the pollutants can be metabolized by the bacteria or fungi and co-pollution does not affect this conversion, low degradation rates can occur. The slow release of PAHs from the soil constituents to the aqueous phase is proven to be limiting for the overall biodegradation rate in many cases (Erickson et al., 1993; Harkey et al, 1995; Luthy et al., 1994; Thomas and Lester, 1993; Weissenfels et al, 1992; Wilson and Jones, 1993). Low mass-transfer rates caused by strong sorptive interactions with soil organic matter and intraparticle diffusion limitations are responsible for the low bioavailability of PAHs in soil (Brusseau et al., 1991; Chung et al., 1993; Connaugthon et al., 1993; De Jonge, 1996; Guerin and Boyd, 1992; Volkering, 1996; Wu and Gschwend, 1986).
When studying the limited bioavailability of PAHs in soil, a complex heterogeneous system is under investigation in which various physicochemical parameters are undefined. This heterogeneity occurs in both textural as well as in structural features of soil material (Fig 1). Therefore, soil matrices should be well characterized in order to obtain a qualitatively as well as a quantitatively sound description of the processes involved. An alternative approach is the use of synthetic matrices as model constituents of soil which possess defined homogeneous properties (Crocker et al., 1995; Darbyshire et al, 1993; Harms, 1996, Mulder et al., 1998ab; Scow and Alexander, 1992; Volkering, 1996). Using these model systems, the processes determining the reduced bioavailability of sorbed PAH can be simulated and modeled. Obviously, the physicochemical properties of the model system must be similar to the soil type under investigation so that results
96

Mutual influence of biodegradation and intraparticle mass transfer
primary particles
aggregation
pores
biota
clay silt sand | gravel | rocks
domains | clusters | micro- | aggregates | clods aggregates
micropores
bacteria
| meso-pores macro-pores
fungal hyphae
roots ! worms I moles, gohers
H 1 1 h H h IO-7 10-* io-1 10° l tr5 10"4 IO-3 IO"2
dimens ions (m)
Figure 1 Approximate dimensions of soil textural and structural features. The dimensions of pores between clay particles and some primary particles may be two orders of magnitude smaller than shown (Dexter, 1988).
can be translated to realistic systems (Darbyshire et al., 1993). A reduced bioavailability of PAH mainly occurs in fine textured soils like silt
and clay and in organic matter fractions. This is due to relatively high specific surface areas and the relatively slow rate of diffusion through the soil particle matrix as a result of contrictivity and tortuosity effects. Model systems must therefore consist of porous matrices in which sorption of the contaminants to an organic hydrophobic phase is possible and in which mass-transfer resistances can be rate-limiting to the overall release rate from the particles.
The particle diameter is an important factor when studying mass-transfer processes in aggregates. However, due to the heterogeneity of soil material, it is impossible to employ defined size limits for soil aggregates. Although there is literature on particle texture and structure, this literature stems from agricultural sources and often focuses on macroaggregate properties (Dexter, 1988; Emerson et al., 1986; Kay, 1990; Waters and Oades, 1991). However, in bioremediation practice it is mainly the effluent of a classification treatment installation that is considered for further clean-up. This effluent consists of micro-aggregates (Kleijntjes, 1991) that contain high amounts of clay particles and organic matter (Chapter 1).
The purpose of this study was to investigate the mutual influence of intra-aggregate mass-transfer processes and microbial degradation of naphthalene in synthetic model soil matrices. These model soil systems were used to validate a mathematical model, developed to describe the biological processes and the mass-
97

Chapter 5
Table 1 Physical properties of the sorbent
XAD4 XAD7
average pore diameter
(nm) 4.0 9.0
sorbent used as synthetic model soil specific surface
area
725 450
skeletal density (kg m-3)
1080 1240
porosity3
(m3 nv3) 0.71 0.78
" (Komiyama and Smith, 1974)
transfer phenomena. Because of the mechanistic nature of the mathematical model, reasonable predictions with respect to the fate and behavior of other compounds in soil matrices can be made.
5.3 Materials and methods
5.3.1 Bacterial cultures
In previous investigations, the isolation of the gram-negative Pseudomonas strain 8909N (DSM-No. 11634) (Volkering, 1996) was described and this organism can use naphthalene as sole carbon and energy source.
5.3.2 Media and culture conditions
A buffered mineral medium with pH 7.0 was used in the experiments (Mulder et al., 1998a). Both the physicochemical and the biodegradation experiments were conducted at 30°C to ensure similar conditions.
5.3.3 Synthetic soil matrix
Commercially available Amberlite XAD4 and XAD7 resins (Supelco, The Netherlands) were used as porous matrices (Fig 2). The physical properties of these materials are shown in Table 1. The XAD was sieved (Endecotts, England) and the resulting size fractions (425-500 urn; 500-600 urn; 710-850 um; 850-1000 nm; 1000-2360 um) were stored at 4°C in rubber stoppered serum flasks. Contamination of the matrices with naphthalene was performed in 250 mL-serum flasks supplemented with 200 mL medium and approximately 50 g Amberlite resin. Naphthalene was melted in stainless steel cups with conical shaped notches (Mulder et al., 1998a) at a temperature of 100°C after which the melts were cooled at room temperature. This procedure resulted in smooth melts with specified surface areas of 3.14 x 10^ m2, which were amended to the serum flasks. After a
98

Mutual influence of biodegradation and intraparticle mass transfer
microsphere
H H
XAD4
H H I I 1 H-hC—C--H
H c=o I
O I
R
XAD7
macrosphere
Figure 2 Schematic presentation of the physical and chemical structure of Amberlite XAD4 (polystyrene) and XAD7 (acrylic ester) resins.
certain period, the stainless steel cups with the solid PAH was removed and the XAD particles were separated from the aqueous solution by filtration.
5.3.4 Sorption isotherms
Adsorption and desorption isotherms were determined under sterile conditions at 30 °C in 100 mL-serum flasks with Teflon lined stoppers. Gravimetricalry determined amounts of loaded and unloaded XAD respectively were suspen-dended in 90 mL medium without naphthalene or in naphthalene solutions. After a period of 7 days, naphthalene liquid phase concentrations were determined by HPLC analysis. This period was long enough to assure equilibrium conditions.
5.3.5 Dynamic sorption and biodegradation experiments
Dynamic experiments were performed in slurry reactors of 500 mL (d, = 0.024 m) (Mulder et al., 1998a) and of 1500 mL (dt = 0.045 m; Applikon, the Netherlands) with disc-mounted flat-blade turbine impellers at 30°C, where dt is the impeller diameter (m). Particle-free solutions (stainless steel Alltech inlet filter, 10 um porosity) were pumped through quartz cuvets in which absorption at 276 nm (A276) and at 540 nm was measured at discrete time intervals [Varian Cary 1 (500 mL reactor); Perkin Elmer Lambda 15 (1500 mL reactor)] with mineral medium as reference. Stainless steel and Viton tubing was used to interconnect the reactor, pump and spectrophotometer. Prior to the experiments, the reactors were
99
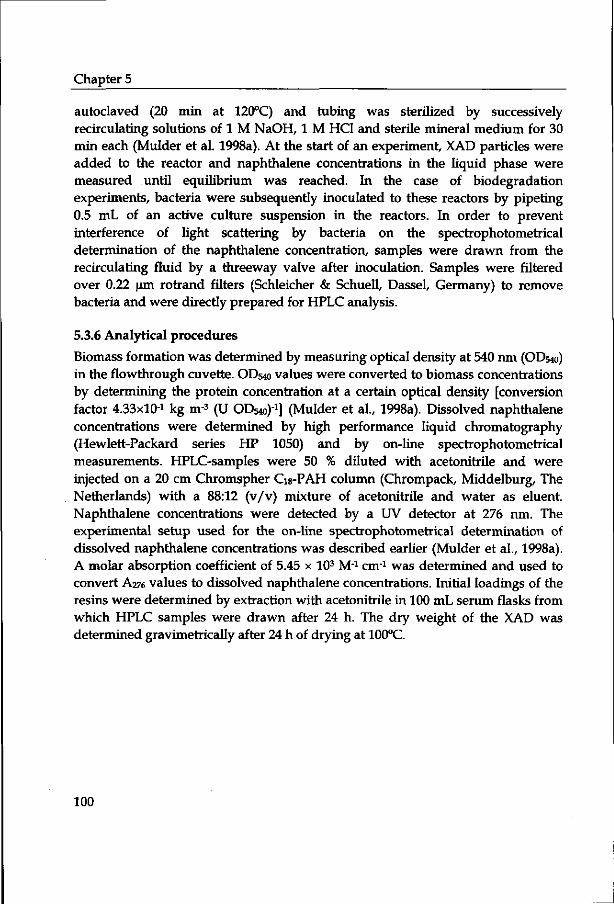
Chapter 5
autoclaved (20 min at 120°C) and tubing was sterilized by successively recirculating solutions of 1 M NaOH, 1 M HC1 and sterile mineral medium for 30 min each (Mulder et al. 1998a). At the start of an experiment, XAD particles were added to the reactor and naphthalene concentrations in the liquid phase were measured until equilibrium was reached. In the case of biodegradation experiments, bacteria were subsequently inoculated to these reactors by pipeting 0.5 mL of an active culture suspension in the reactors. In order to prevent interference of light scattering by bacteria on the spectrophotometrical determination of the naphthalene concentration, samples were drawn from the recirculating fluid by a threeway valve after inoculation. Samples were filtered over 0.22 urn rotrand filters (Schleicher & Schuell, Dassel, Germany) to remove bacteria and were directly prepared for HPLC analysis.
5.3.6 Analytical procedures
Biomass formation was determined by measuring optical density at 540 nm (OD540) in the flowthrough cuvette. OD540 values were converted to biomass concentrations by determining the protein concentration at a certain optical density [conversion factor 4.33xlOa kg nr3 (U OD540)1] (Mulder et al., 1998a). Dissolved naphthalene concentrations were determined by high performance liquid chromatography (Hewlett-Packard series HP 1050) and by on-line spectrophotometrical measurements. HPLC-samples were 50 % diluted with acetonitrile and were injected on a 20 cm Chromspher Cis-PAH column (Chrompack, Middelburg, The Netherlands) with a 88:12 (v/v) mixture of acetonitrile and water as eluent. Naphthalene concentrations were detected by a UV detector at 276 nm. The experimental setup used for the on-line spectrophotometrical determination of dissolved naphthalene concentrations was described earlier (Mulder et al., 1998a). A molar absorption coefficient of 5.45 x 10³ M_1 cm1 was determined and used to convert A276 values to dissolved naphthalene concentrations. Initial loadings of the resins were determined by extraction with acetonitrile in 100 mL serum flasks from which HPLC samples were drawn after 24 h. The dry weight of the XAD was determined gravimetrically after 24 h of drying at 100°C.
100

Mutual influence of biodegradation and intraparticle mass transfer
mixed bulk liquid (V)
t C,Q
L Q(r)
soil aggregate
laminar film
^
m$™»m> * • • • ' • • • • • • • • • • • • • ••••• : • • . • : • : < Jt • .•;•"•"•"•.•:•:•:•:•:• i
! • • • • • • : • : • ' • : • : • : • : L C(r=R)
^
biomass (X) 0 r-
Figure 3 Schematic representation of the mathematical model. The presence of bacterial biomass is optional.
5.4 Modeling
The sorption equilibrium of naphthalene to Amberlite resins is described by the Freundlich isotherm, which gives the nonlinear relationship between the naphthalene concentration in the sorbed phase and the dissolved naphthalene concentration in the pore liquid:
Q = KFC (1)
where Q is the sorbed naphthalene concentration (kg kg-1), KF the Freundlich sorption coefficient (m3n kg"n), C the dissolved naphthalene concentration (kg nr3), and n a dimensionless constant. When the natural logarithm of Q is plotted versus the natural logarithm value of C, a straight line is obtained with a slope equal to n and an intercept of the vertical axis equal to the natural logarithm of KF.
The release of contaminant from a porous particle is a dynamic process, which can be modeled by setting up a mass balance for a specific geometry and the substitution of a diffusion equation (Bird et al., 1960; Fig 3). Assuming a spherical shape of the Amberlite resins, a concentration independent diffusion coefficient in the pore liquid, and instantaneous local equilibrium at a certain location in the porous particle, Equation (2) describes the variation of concentration in time as a
101

Chapter 5
function of the concentration gradient in the particle at a given location:
dC dQ — e + —(l-s)ps =Deff dt dt ff
1' d2C 2 dC\ T- +
dr r dr (2)
where e is the particle volumetric porosity (m3 nv3), t the time (s), ps the skeletal density of the solid phase (kg nr3), Deff the effective diffusion coefficient through the porous matrix (m2 s1) and r the distance from the center of the particle (m). The effective diffusion coefficient is defined as the binary diffusion coefficient of the PAH in dilute water solutions corrected for tortuosity and constrictivity effects imposed on this coefficient by the matrix geometry by means of a lumped matrix factor (x) (Van Brakel and Heertjes, 1974; Wu and Gschwend, 1986):
DM=-eD,
(3)
where DAB is the binary diffusion coefficient of the PAH in dilute aqueous solutions and K-the dimensionless matrix factor. By substitution of Equation (1) into Equation (2) the following equation is obtained:
dC D. 'ff dt £ + (l-e)psKFnC (n-l)
d2C 2 dC — 7 + dr r dr
(4)
In most studies that use radial diffusion models to describe the behavior of hydrophobic compounds in soil particles an overall effective diffusion coefficient is defined (Ball and Roberts, 1991b; Connaughton et a l , 1993; Wu and Gschwend, 1986). Although these overall diffusion coefficients were defined for the case of a linear isotherm [e.g. n = 1 in Eq (1) ], we follow a similar definition:
D 'ff eff £ + (l-e)p$KFnC<n'1> (5)
where D°eff is the overall effective diffusion coefficient (m2 s1). Equation (4) can be simplified by introducing the following normalized parameters:
R (6)
102

Mutual influence of biodegradation and intraparticle mass transfer
tD, <?ff
R2
Where £ is the dimensionless normalized location in the particle, R the radius of the particle (m) and T the dimensionless normalized time. Substitution of the normalized parameters [Eqs (6) and (7)] in Equation (4) yields:
dC 1
dx s + (l- e)psKFnC (n-l) + —
d? SK. (8)
The boundary conditions for Equation (8) follow from the definition of a zero concentration gradient in the center of the particle {boundary condition (I) [B.C.(I)]} and the condition that the mass flux from the surface of the particle equals the mass flux through the laminar layer [B.C.(II)]. Besides intraparticle mass-transfer resistances, diffusion across a stagnant liquid film surrounding the particle influences the overall transfer rate of to a well-mixed aqueous phase (Bird et ah, 1960). This additional mass-transfer resistance can be modeled by assuming a linear concentration gradient across the laminar liquid film and thus defining the mass flux through the film as:
N = ekt(C^-Cb) (9)
where N is the mass flux through the laminar layer (kg nr2 s1), k/ the mass-transfer coefficient of the naphthalene (m2 s1), and Q, and C^j are the concentrations in the mixed bulk liquid and at the interface of the particle with the laminar layer respectively (kg nr3). The boundary conditions (B.C.) and initial condition (I.C.) for Equation (8) are therefore:
3$ = 0 B.C. (I) (10)
4-0
= eklR(C{,t-CJ B.C. (II) (11)
103

Chapter 5
with:
C = d for: 0>%>1 ; Cb = 0 at:r=0 I.C. (desorption) (12)
C = 0 for: 0>4>1 ;Cb = Ci at: r =0 I.C. (adsorption) (13)
where C, is the initial dissolved naphthalene concentration (kg nr3). In the case of desorption, this concentration is in equilibrium [Eq (1)] with the initial sorbed naphthalene concentration Q, (kg kg-1). The magnitude of the mass-transfer coefficient over the laminar film (k^) depends on the flow conditions imposed by shaking or stirring. The external mass transfer can be characterized by the dimensionless Sherwood number (Sh):
Sl,-2-^ (.4) UAB
The relation between reactor flow conditions and the external mass transfer is often described as a function of the dimensionless Reynolds and Schmidt numbers:
Sh = 2 + aRefiScr (15)
Re = ^ l ' (16)
Sc = -^— (17) PPAB
where Re and Sc are the dimensionless Reynolds and Schmidt numbers respectively. The parameter pf is the liquid density (kg nr3), v the relative velocity of the particle to the liquid (m s1), and J] the dynamic viscosity of the liquid phase (kg m 1 s1). The constants a, J3, and /are dimensionless and have values of 0.60, 0.5, and 0.33 respectively for mixed slurries of spherical particles (Levins and Glastonbury, 1972; Perry et al., 1963). However, determination of the dimensionless Reynolds number requires information on the relative velocity of the particles to the fluid (v), which is difficult to obtain. Although there are alternative formulations for the Reynolds number as a function of the energy dissipation rate to the liquid phase by means of mixing, these relations have a limited applicability (Levins and Glastonbury, 1972). Therefore in this study, only the impeller Reynolds
104

Mutual influence of biodegradation and intraparticle mass transfer
number is used to evaluate whether turbulent conditions exist in the stirred vessel (Perry et al., 1963):
Re,=£&£ (18)
where Re, is the impeller dimensionless Reynolds number, S, the rotational speed of the impeller (s1), and d, the diameter of the impeller (m). At high Re, values (Re, > 10000) the flow in the vessel is considered turbulent throughout the entire liquid phase. Between Reynolds numbers of 10 to 10000, the flow is turbulent at the impeller and might be laminar at distant locations in the vessel. Below Reynolds numbers of 10 the flow is considered laminar in the complete liquid phase.
To analyse whether external or internal mass transfer is limiting the overall release or uptake rate of naphthalene, the dimensionless Biot number can be used (Bi) (Chung et al., 1993; Perry et al, 1963):
Bi = ^ - (19)
At high Biot numbers (Bi » 1) external diffusion limitations can be neglected and intraparticle mass transfer is rate-determining. At low Biot numbers (Bi « 1) the external mass-transfer resistances dominate the overall transfer process.
Bacteria have dimensions in the order of micrometers (Schlegel, 1981) and are, therefore, unable to penetrate the pores of the porous particles which have an average pore size of nanometers as is the case for the XAD particles (Tab 1). Therefore, biodegradation can only occur in the liquid phase. When the biodegradation in the stagnant layer is neglected, the following mass balance can be postulated to describe the change in the dissolved PAH concentration in time in the bulk liquid phase:
dt V ^ b Y (C^-CJ-^- (20)
where V is the volume of the liquid phase per particle (m3), A the particle external surface area (m2), ju the growth rate of the bacteria (s1), X the biomass concentration (kg nr3), and Y the yield of the organisms on the PAH (kg kg"1). When adsorption or desorption experiments under sterile conditions were modeled, the biomass concentration was set to zero for the duration of these sterile
105

Chapter 5
conditions. The initial conditions for Equation (20) are given in Equations (12) or (13). The volume per particle is calculated on the basis of the following equation:
VR\nR3a-e)p, V = * (21)
™.
where VR is the total liquid volume in the reactor (m3), and ms the total dry weight of the particles in the reactor (kg). The volume of the water inside the pores was neglected. The change in biomass concentration in time can be modeled by:
f " * <22> With:
X = 0 for: t<ti (23)
X = X, for: t= ti (24)
where X; is the biomass concentration (kg nv3) at the moment of inoculation U (s). The growth rate of the bacteria is modeled by assuming Monod kinetics for the growth on dissolved naphthalene (Mulder et al., 1998a):
C M = Mmaxc7K~ ( 25)
where / w is the maximum growth rate of the bacteria (s1) and Ks the Monod constant (kg nv3). From Equations (22) and (25) it can be deduced that zero order growth will occur at relatively high PAH concentrations compared to the Monod constant, and that first order growth occurs at relatively low concentrations. To assess whether the biodegradation in the laminar layer may be neglected the dimensionless Hatta number (Ha) is defined at first order growth conditions (Perry et al., 1963):
DAB /fronxA
V YKs Ha = -! (26)
106

Mutual influence of biodegradation and intraparticle mass transfer
At low Hatta numbers (Ha < 0.3) and for a relatively low volume of the boundary layer compared to the liquid volume (V), the biodegradation in the laminar boundary layer can be neglected. At high Hatta numbers (Ha > 3) there is a significant reaction rate in the boundary layer and Equation (9) is no longer valid. This becomes important at high biomass concentrations and low mass-transfer coefficients.
In order to calculate the development of biomass (X) and bulk liquid PAH concentrations (G) in time, the set of coupled differential equations formed by Equations (8), (20), and (22) has to be solved. Because of the nonlinearity of the bacterial transformation kinetics and of the Freundlich isotherm, the set of differential equations cannot be integrated analytically and numerical integration methods are necessary to approximate the solution. A Crank-Nicholson scheme is the recommended discretisation scheme to transform the set of differential equations into a set of; linear equations withy unknowns (Appendix I) (Press et al., 1993). The value of ; is determined by the number of locations at which the dissolved concentration (C) is evaluated. An Euler integration method is applied to calculate the evolution of biomass concentration in time.
The description of the experimental data by the model was optimized in a two-step procedure. First, the mass transfer was quantified by determination of the effective diffusion coefficient (Dejj) and the mass-transfer coefficient (fc,) from sterile desorption and adsorption experiments. In the second step, the microbial parameters were quantified by determining the maximum growth rate (fJmax) and the yield (Y) from the biodegradation experiments. The value of the effective diffusion coefficient was optimized by minimizing a Chi-squared function (Press et al., 1993) at negligible external mass-transfer resistances:
7
2 = 2
where %2 is a dimensionless parameter, z the identifier of the experimental individual data points, Z the total number of experimental data points, C21 r the experimental PAH concentration at time r, and C(T) the concentration at time r predicted by the model. At low energy dissipation rates, the value of the effective diffusion coefficient (Dejf) as determined from the above-mentioned calculations was introduced as a fixed parameter. The value of the mass-transfer coefficient (fc,) was subsequently optimized by minimizing f- in Equation (27). Thereafter, the value of the maximal growth rate of the bacteria was determined from the exponential growth phase by a procedure which was also adapted in earlier work (Mulder et al., 1998a). In this procedure the natural logarithm of the ratio of the
107

Chapter 5
biomass concentration over the initial biomass concentration is calculated. Then, this logarithmic value is plotted against time. In the growth phase where zero order kinetics are valid, a straight line is obtained and the slope of this line equals the maximum growth rate of the bacteria. Finally, the value of the yield coefficient was optimized in the biodegradation phase (t ^ ti) by minimizing another Chi-squared function:
Z'-I^I-XM] (28)
where Xz\ T is the experimental biomass concentration at time r, and X(r) the concentration at time r predicted by the model. The values of %2 was minimized by applying a bracketing method (Press et al., 1993).
5.5 Results
5.5.1 Sorption isotherms
Sorption isotherms of naphthalene on Amberlite XAD4 and XAD7 were determined under sterile conditions at a temperature of 30°C in mineral medium (Fig 4) and Freundlich isotherms were fitted through the experimental data. Results of these fits are given in Table 2. Adsorption and desorption isotherms were identical so the sorption of naphthalene to both sorbents was reversible.
Table 2 Freundlich sorption parameters (KF, n) and intraparticle effective diffusion coefficients (Dejf) and matrix factors (K) for the two Amberlite resins. For the calculation of the matrix factor from the value ofDejf, a value of 8.28 x lCr10 m2 s-1 was used for the binary diffusion coefficient of naphthalene in water (DAB) (Gustafson and Dickhut, 1994).
sorbent
XAD4 XAD7
KF
(m3n kg"n) 2.89 1.93
n
(-) 0.53 0.69
Deff
(m* s-1) (3.55 ± 0.10) x 10-9
(5.29 ± 0.86) x 10-10
K
(-) 0.17 1.22
108

Mutual influence of biodegradation and intraparticle mass transfer
I n Q
0.005 0.010 0.015 0.020
Cb (kgm-3)
A XAD4
A XAD4
a XAD7
• XAD7
- Freundlich model
• linear regression
Figure 4 Sorption isotherms of naphthalene to XAD4 and XAD7 Amberlite resins. The closed symbols are the natural logarithmic values of the sorbed naphthalene concentration (Q) and the dissolved naphthalene bulk liquid concentration (Cb).
5.5.2 Mass-transfer parameters
One of the most important parameters in the current model is the effective diffusion coefficient of naphthalene in the porous Amberlite matrices. This parameter can be determined by measuring the amount of naphthalene that is taken up by an Amberlite particle or the amount that is released from a homogeneously contaminated particle in course of time. To be sure that external mass-transfer limitations are negligible during these measurements, information must be generated on the influence of reactor hydrodynamics on these external resistances (Foo and Rice, 1979). Therefore, dynamic sorption experiments were conducted with the resins at different liquid mixing rates. Adsorption experiments with uncontaminated resins and desorption experiments with naphthalene-
109

Chapter 5
contaminated XAD4 and XAD7 were performed in two different types of impeller-mixed reactors under aseptic conditions.
The adsorption tests were initiated by immersing a certain mass of a sieve fraction of the sorbent in an aqueous naphthalene solution. Subsequently, the decrease in the dissolved naphthalene concentration was followed by means of online spectrophotometrical measurements at discrete time intervals. In the desorption tests, artificially polluted resin was brought into the water-phase of the reactor and the increase in the dissolved naphthalene concentration was followed in time by the same analytical procedure. Pilot experiments showed that the loss of naphthalene due to adsorption to the apparatus was negligible, which was achieved by the use of glass vessels and Viton and stainless steel materials to interconnect the measuring equipment.
Results of sterile adsorption and desorption experiments with XAD7 are shown in Figure 5. From this figure it is clear that the desorption rate increases with the rotational speed up to a rate of 1.67 s 1 and then remains constant, indicating intraparticle diffusion being rate limiting under those circumstances. From these and additional experiments it was found that the external mass-transfer resistances were negligible at rotational speeds above 1.2 s 1 (Fig 6). In the range of rotational speeds applied, calculated impeller Reynolds numbers (Rei) ranged from 4.2 xlO2 to 3.3 x 10⁴ [/>,= 1 x iQ3 kg m -3 ; n = 8.09 x 10"4 kg m 1 s 1 (Perry et al., 1963)]. From the desorption and adsorption experiments at sufficiently high mixing rates, effective diffusion coefficients were determined for naphthalene in XAD4 and XAD7 pores (Tab 2). Matrix factors (xr) for both types of sorbents were calculated on the basis of the effective diffusion coefficients according to Equation (3) and these are given in Table 2.
110

Mutual influence of biodegradation and intraparticle mass transfer
10000 t (s) 20000 30000
0.030
0.025
0.020 - -
(kgm- 3 )
0.015 - -
0.010 -
» n ,r r—•—r
D R = 275 nm; Sj = 0.42 s"1 A R = 275 nm; Sj = 0.
O R = 275 urn; ^ = 1.67 s"1 + - — - -
0 R = 181 urn; ^ = 6.67 s'1
.83 s"1
R = 181 urn; S( = 6.67 s"1
model
0.005 © •——• <-
0.012
0.000
0 20000 t (s)
40000 60000
Figure 5 Dynamic batch adsorption and desorption experiments with two different
size fractions ofAmberlite XAD7. Experimental data are indicated by symbols and
the drawn lines are model calculations. The adsorption experiments were
conducted at different rotational speeds to investigate the presence of external
mass-transfer resistances. The experiments shown in this figure were carried out
in the 1500 mh reactors with a 1000 mL working volume (VR).
Sh
00 -
10 -
1 -
: O
• 4
A
A
O
O
' 1 ' '
A
ft 8
A 500 mL reactor
01500 mL reactor
A
A
1 ' ' • '
1 A
i ' • ' •
0 1 2 , 3 4 St (s1)
Figure 6 The dimensionless Sherwood (Sh) number as a function of the impeller
speed (St) for the two reactor types used.
I l l
Chapter 5
5.5.3 Desorption and subsequent biodegradation
The purpose of this work was to study the mutual influence between the mass-transfer processes of naphthalene, initially sorbed in porous particles, and the biodegradation of desorbed naphthalene outside these particles by bacteria. In earlier work, a procedure was developed to quantify both the physicochemical process and the biodegradation of the released PAH in single-run experiments (Mulder et al., 1998a). Although those experiments were conducted with solid phase naphthalene, a similar approach was adapted in the experiments described in this section.
In the experiments first the mass-transfer parameters were determined in an aseptic phase (e.g. X = 0). Then the reactor was inoculated (at: t = ti) with bacteria
0.030
Cb,X
(kgrn3) 0 0 2 0
0.010
0 dissolved naphthalene
O biomass
^^^^— model
• ln(X/Xo)
- - - "linear regression In (X/Xo)
0.000
2 In (X/X0)
o
150000
Figure 7 Desorption of naphthalene from XAD7 (1000-2360 /urn) under aseptic conditions and the subsequent biodegradation of desorbed naphthalene by Pseudomonas 8909N. The natural logarithm plot is provided to illustrate the procedure to determine the maximum growth rate in the exponential growth phase. Symbols indicate experimental data and drawn lines are model calculations. The vertical dashed line indicates the moment of inoculation (ti). The values of the parameters applied in the model calculations are provided in Table 3.
112

Mutual influence of biodegradation and intraparticle mass transfer
(with: X = X;) to study the effect of the mass transfer on the biodegradation process. The aseptic part of the experiments was identical to the experiments described in the foregoing section (5.5.2). In the ideal situation, equilibrium with respect to the desorption process was established prior to inoculation. Thereafter, bacteria were added and the biomass concentration was measured online at discrete time intervals by a spectrophotometer. Because the biomass interferes with the spectrophotometrical determination of dissolved naphthalene in the bulk of the liquid, samples were drawn from the reactor liquid for HPLC analysis after the moment of inoculation. Results of such an experiment are given in Figure 7, showing the desorption of naphthalene from XAD7 particles and the subsequent biodegradation by Pseudomonas 8909N. These data have been described by the mathematical model and the values for the model parameters are given in Table 3. The value of the Monod constant (Ks = 4.0 x 10⁵ kg nr3) for naphthalene was determined in ear her reports on Pseudomonas 8909N (Volkering et al., 1992).
The data in Figure 7 show the two-stage setup of the experiments. After the preloaded XAD7 was added to the reactor, dissolved naphthalene concentrations were measured by UV adsorption at 276 ran. At the moment where equilibrium was achieved, bacteria were added to the reactor medium and light scattering at 540 nm was now measured as a measure for the biomass concentration. Additional HPLC samples were drawn to determine the decrease in dissolved naphthalene concentrations. The maximum growth rate was determined from the slope of the ln(X/Xo) values at the exponential growth phase (Tab 3). At the end of the experiment some colorization of the, originally white, XAD7 was observed. The yellow-brown color was attributed to sorbed bacteria or metabolites in the medium. No quantification was performed on the amount of biomass that was sorbed to the surface of the XAD7.
From the results presented in Figure 7, experimental desorption rates in the aseptic phase were calculated by dividing the increase in dissolved naphthalene concentration by the time interval in which this increase had occurred and multiplication by the volume of liquid per particle (V). Furthermore, growth rates were calculated in the biodegradation phase of the experiment by dividing the increase in biomass concentration in a certain time interval by this interval and by the current biomass concentration [Eq. (22)].
As in earlier work (Mulder et al., 1998a), significant scattering in the values of the maximum growth rate occurred at low biomass concentrations and a moving average method was applied to calculate the results in Figure 8. Besides these calculations, model calculations are given in Figure 8.
Similar experiments as those with XAD7 were performed with preloaded XAD4 resins and results are shown in Figure 9. At the end of the experiments with the XAD4 resins colorization was also observed, but in a larger extent compared to the
113
Chapter 5
tests with XAD7. Here the resins were colored dark brown. The dissolved naphthalene concentration and biomass concentration were calculated according to the mathematical model and, in addition, the residual mass fraction of the naphthalene still present in the particle at a certain moment is given. For this purpose, the residual mass in the particle was calculated by multiplication of the dissolved naphthalene concentration in the pores of the particle and the concentration of sorbed naphthalene by the volume of the shells that were defined for the numerical evaluation (Appendix I). The mass fraction was simply computed by dividing the actual mass in the particle by the initial mass.
(lO"4 s1)
50000 100000 150000
t (s)
Figure 8 Experimental and calculated desorption rates of naphthalene from XAD7 particles (1000-2360 jum) and experimental and calculated growth rates in the biodegradation phase. The conditions of this experiment and the model parameters used to calculate the model lines are given in Table 3. The vertical dashed line indicates the moment of inoculation (ti).
To illustrate the effect of external mass-transfer limitations, combined desorption and biodegradation tests were performed at low mixing rates (Sh = 1.7) and the results are shown in Figure 10. In this experiment, bacteria were added to the reactor liquid at the start of the test and it was assumed that the biodegradation capacity was negligible in the first 8 h due to the low biomass concentration that was present initially. Two types of model calculations were performed: the parameters were adjusted to optimize the description of the experimental data by
114
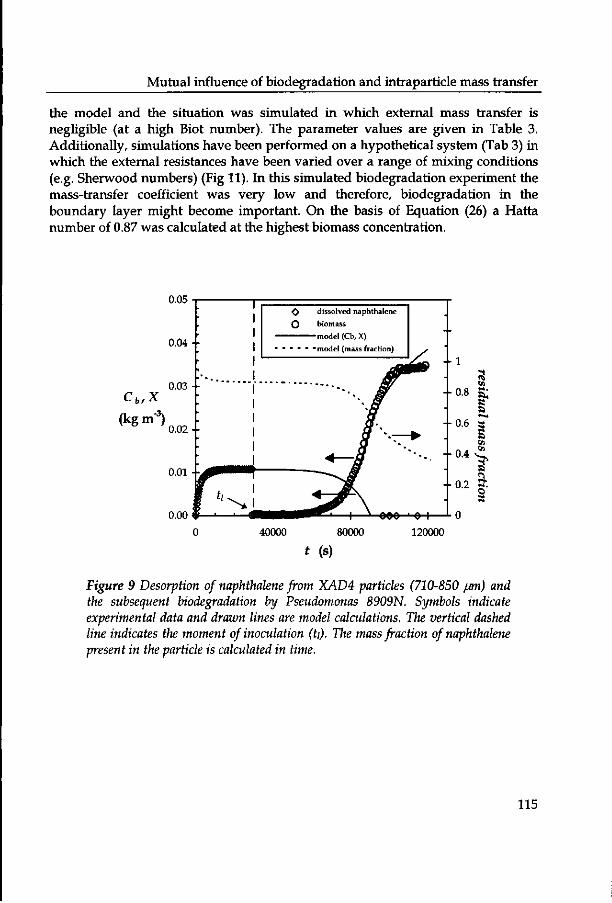
Mutual influence of biodegradation and intraparticle mass transfer
the model and the situation was simulated in which external mass transfer is negligible (at a high Biot number). The parameter values are given in Table 3. Additionally, simulations have been performed on a hypothetical system (Tab 3) in which the external resistances have been varied over a range of mixing conditions (e.g. Sherwood numbers) (Fig 11). In this simulated biodegradation experiment the mass-transfer coefficient was very low and therefore, biodegradation in the boundary layer might become important. On the basis of Equation (26) a Hatta number of 0.87 was calculated at the highest biomass concentration.
0.05
0.04 - -
Cb, X
(kg m"3)
0.03 - •
0.02 - •
0.01 - -,
0.00
0 dissolved naphthalene O biomass
model (Cb, X) • " " "model (mass fraction)
40000 80000 120000
t (s)
Figure 9 Desorption of naphthalene from XAD4 particles (710-850 jjm) and the subsequent biodegradation by Pseudomonas 8909N. Symbols indicate experimental data and drawn lines are model calculations. The vertical dashed line indicates the moment of inoculation (ti). The mass fraction of naphthalene present in the particle is calculated in time.
115

Chapter 5
0.0100
0.0000
100000 200000 300000
t (8)
Figure 10 Desorption from XAD7 (425-500 /mt) and simultaneous biodegradation (t\ = 0) of desorbed naphthalene at low mixing conditions (Sh = 1.7) by Pseudomonas 8909N. Symbols represent experimental data and the drawn lines are model calculations for the bulk liquid naphthalene concentration (Cb) and the biomass concentration (X). The dotted lines (for Cb and X; Bi = 44) are calculated for the case when external mass-transfer resistances would have been negligible. The conditions and model parameters are given in Table 3.
116

Mutual influence of biodegradation and intraparticle mass transfer
200000
0.35
0.02
(kg m")
o.oi
(kg m")
0.03 • •
80000
Figure 11 Model simulations to illustrate the effect of external mass-transfer limitations on the desorption of naphthalene (Cb) from porous particles and the subsequent biodegradation by the bacteria (X).
An important feature of the current modeling is the combination of the application of Monod kinetics for the description of the bacterial growth and substrate conversion (e.g. naphthalene) and the use of the nonlinear Freundlich isotherm to describe the sorption of naphthalene to the porous solids. To investigate the effect of the constant n in the Freundlich isotherm and the initial biomass concentration (Xo) on the biodegradation of naphthalene, several calculations were performed (Fig 12). In this figure, the mass fraction of naphthalene present in the particle and the biomass concentration are given.
117

Chapter 5
Table 3 Experimental conditions and values of parameters used in the model calculations. A dash in the cells of the table indicates that these data are provided in the figure itself. To differentiate between fixed parameter values and parameters that were optimized on the basis of experimental data, an 'a' or 'V is added above the parameter values respectively.
parameter
fraction
St
ms
VR
Deff
K R
KF
n
V
Q
X,
Mmax
Y
K5
e
A
Figure number
(urn)
(s-i)
(ICHkg)
(10-4 m 3 )
(lO-'O m 2 s-l)
(1CH m s-1)
(10-> m)
(m3n kg-")
(-) (10"8 m3)
(10-3kgkg-i)
(10"6 kg m-3)
(10-4 s-i)
(kgkg-i)
(10-5 kg m-3)
(m3 nr3)
(103 kg m-3)
7
1000-2360
1.67'
2.96"
4.00"
5.29*
6.9b
6.10b
1.93"
0.69"
33.3*
76.5*
2i2b
1.02b
0.93*
4.0*
0.78*
1.24*
9
710-850
13.3*
1.05*
4.50"
35.5*
5.4b
3.90"
2.90*
0.53"
33.2»
313a
38.6b
1.04b
0.83b
4.0»
0.71"
1.08*
10
425-500
0.58"
1.53*
3.50»
5.29"
0.04b
2.31a
1.93a
0.69"
3.23*
23.5*
24.4b
0.47b
1.06b
4.0*
0.78*
1.24*
11
--
5.0
5.0
5.0
-
2.50
5.55
0.75
1.79
400
50
1.11
0.80
4.00
0.78
1.24
12
--
5.0
5.0
5.0
13
2.50
1.15
0.30
1.79
400
5.0
1.11
0.80
4.00
0.78
1.24
12
--
5.0
5.0
5.0
13
2.50
2.31
0.50
1.79
400
5.0
1.11
0.80
4.00
0.78
1.24
12
--
5.0
5.0
5.0
13
2.50
5.55
0.75
1.79
400
5.0
1.11
0.80
4.00
0.78
1.24
12
--
5.0
5.0
5.0
13
2.50
13.3
1.0
1.79
400
-
1.11
0.80
4.00
0.78
1.24
The data in Figure 12 show that a decrease in the value of the Freundlich constant n results in an increased period necessary for removal of a certain mass fraction from the solid. It was expected that the value of the overall effective diffusion coefficient (D0ejf) might be responsible for this effect. Therefore, the value of this parameter was evaluated as a function of the elapsed time in the simulations of Figure 12 (at: r = 0.5R) and as a function of the dissolved naphthalene concentration (Fig 13).
118

Mutual influence of biodegradation and intraparticle mass transfer
(kgm-3)
1.00
- - 0.75
• - 0.50
• - 0.25
0.00
a. S a 3* a tn
a-. a
50000 100000 150000 200000 250000
t (s)
Figure 12 Model simulations showing the effect of the sorption constant n in the Freundlich isotherm on the removal rate of naphthalene from a porous particle and the related biomass formation. Furthermore, the effect of the initial biomass concentration is illustrated for the linear isotherm (n=l). The initial mass of naphthalene was identical for all simulations (Tab 3).
119
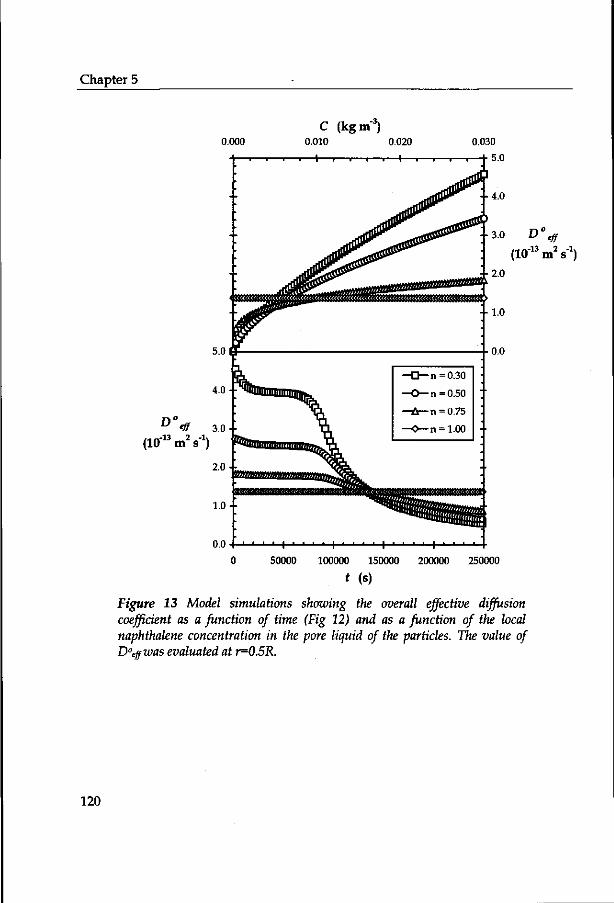
Chapter 5
0.000
C (kgnO 0.010 0.020
1 1 1 1
D° *ff 3.0 - •
(10 m s )
- 3 . 0 D*
(10 m s )
0 50000 100000 150000 200000 250000
t (s)
Figure 13 Model simulations showing the overall effective diffusion coefficient as a function of time (Fig 12) and as a function of the local naphthalene concentration in the pore liquid of the particles. The value of D°effwas evaluated at r=0.5R.
120

Mutual influence of biodegradation and intraparticle mass transfer
5.6 Discussion
5.6.1 Sorption isotherms
In agreement with earlier experiments in which sorption isotherms of naphthalene on XAD4 and XAD7 resins were determined, nonlinear sorption behavior was observed [XAD4: n = 0.40; XAD7: n = 0.68; (Volkering, 1996)]. It is clear that XAD4 shows a more strongly nonlinear behavior than the XAD7 resin. The Freundlich model fits excellent through the experimental data (Fig 4) and therefore other nonlinear models like, for instance, the Langmuir-isotherm were not tested.
Although in most work on the partitioning of hydrophobic compounds to soil materials, linear isotherms are applied to describe the data (Chiou et al., 1998; Chung et a l , 1993; Connaughton et al., 1993; Karickhoff, 1981; Wu and Gschwend, 1986) there are several reports in which the nonlinear Freundlich isotherm is used (Ball and Roberts, 1991a; Hinz et a l , 1994; Huang and Weber, 1997; Liu et al., 1991; Schlebaum, 1998; Volkering, 1996; Weber and Huang, 1996; Weber and Miller, 1988). It is suggested that the linear isotherm is applicable to low-polluted soil material and that the isotherm becomes nonlinear at relatively high contaminant loadings (Karickhoff, 1981). The mobility of pollutants in the soil matrix is strongly affected by the type of isotherm used to describe the equilibrium partitioning (Hinz et al., 1994; Schlebaum, 1998). Due to the nonlinearity of the bacterial kinetics, numerical techniques are necessary anyway and the introduction of another nonlinear process is therefore a marginal effort.
5.6.2 Mass-transfer parameters
The dynamic adsorption and desorption experiments at different mixing conditions clearly show that quantification of the external transfer resistances as a function of reactor hydrodynamics is important when the intraparticle diffusion is studied (Fig 5). The values of the impeller Reynolds number indicate that the flow is always turbulent in the vicinity of the impeller (Press et al., 1963), but laminar regions may exist at certain locations in the reactor at the low mixing speeds. This is supported by the low Sherwood numbers shown in Figure 6. From Equation (15) it can be seen that the value of the Sherwood number becomes 2 at very low relative velocities of the particle to the fluid. This is in accordance with the datapoints at impeller rotational speeds below 0.8 s_1 shown in Figure 6. The significant scattering of the data at high mixing rates can be explained by the fact that external mass-transfer limitations are negligible at these energy dissipation rates and, therefore, true values for the mass-transfer coefficient cannot be determined.
The values of the effective diffusion coefficients show that the diffusion of naphthalene in the XAD7 matrix is hindered by the tortuosity and constrictivity effects (Tab 2). The matrix factor of 1.22 is within the range of 1.08 to 1.28 of matrix
121

Chapter 5
factors that are reported on the basis of theoretical and empirical relations which relate the matrix factor to the matrix porosity (s = 0.78) (Van Brakel and Heertjes, 1974). However, the effective diffusion coefficient of naphthalene through the XAD4 matrix is found to exceed the water diffusivity. This suggests that surface diffusion occurs which is probably caused by the strong hydrophobicity of the XAD4 material (Komiyama and Smith, 1974). Since reports on the significance of surface diffusivity in soil material are lacking, this material (XAD4) seems to be less attractive as a soil model system. Therefore, no attempts were made to alter the model and incorporate surface diffusion processes.
5.6.3 Desorption and subsequent biodegradation
The single-run tests that were developed in earlier work with solid naphthalene to study the mutual influence mass-transfer and biodegradation processes (Mulder et al., 1998a), are also applicable to the current system with porous sorbents (Figs. 7-9). In the first stage of the experiment it is possible to unambiguously quantify the mass-transfer processes, because biodegradation of the substrate is prevented. After inoculation the bacteria are consuming the desorbed naphthalene and biomass is generated as a results of this conversion. As long as the dissolved naphthalene concentration is far above the Monod constant (Ks), zero order growth occurs and an exponential growth phase is observed. The maximum growth rate can be determined from this exponential increase in the biomass concentration and the logarithmic plots in Figures 7 and 10 show the good correlation between the experimental data and the linear relation. When the potential biodegradation capacity exceeds the maximum desorption rate, the dissolved naphthalene concentration drops to a very low value. From that moment onwards, the biodegradation of naphthalene is no longer microbiologically limited but becomes mass-transfer limited.
This can also be deduced from Figure 8 where the experimental desorption and growth rates are compared with model calculations. In the aseptic desorption phase, the desorption rate decreases from the maximum value at the start of the test to zero when equilibrium is established. When bacteria have been added and start to convert the substrate the concentration of dissolved naphthalene decreases. Hereby, the driving force for transfer of naphthalene from the particles is increased and the desorption rate increases.
At the transition point of exponential growth and mass-transfer limited growth, the dissolved concentration becomes virtually zero and the desorption rate is maximum. Meanwhile, the average naphthalene concentration in the particle has decreased compared to the initial concentration and the maximum desorption rate is significantly lower than the rate at the start of the test. This is different from the systems with solid naphthalene (Mulder et al., 1998a) where the maximum dissolution rate remains constant. As the biodegradation is mass-transfer limited
122

Mutual influence of biodegradation and intraparticle mass transfer
from the transition point onwards, the desorption rate remains maximal. However, the concentration of naphthalene in the particle decreases and therefore the maximum desorption rate also decreases. The growth rate of the bacteria decreases drastically from the maximum value in the exponential growth phase to a very low value when the naphthalene concentration decreases to a level far lower than the Monod constant under mass-transfer limited conditions. As the biomass concentration still increases due to the conversion of desorbing naphthalene and the desorption rate decreases in time, the growth rate decreases continuously.
The data in the Figures 7, 9, and 10 illustrate the good agreement between the calculated concentrations of dissolved naphthalene and biomass. However, in Figure 7, and more pronounced in Figure 9, deviations occur between the experimental biomass concentration and the model prediction for this concentration. These experiments were terminated because the decline in the slope of the biomass curve was explained as the depletion of naphthalene from the XAD particles. However, the model calculations show that there is still a considerable amount of naphthalene present in the particles at the termination of the tests. In both the experiments with XAD7 and XAD4 it was observed that biomass or metabolites (or both) were sorbed to the surface of the Amberlite resins. Given the above mentioned differences between experimental biomass concentrations and model predictions, there might be significant sorption of biomass to the hydrophobic resins. This was reported earlier (Volkering, 1996) and it is known that Pseudomonas 8909N attaches to hydrophobic surfaces (Mulder et al, 1998b). It might be interesting in future work to analyze whether this attachment affects the analysis of the biomass concentration and whether the mass transfer of naphthalene is influenced.
It was observed that the model prediction for the desorption of naphthalene from the XAD7 particles in the fraction 2360 <dp< 1000 um was initially poor when an average particle radius (R) of 840 um was used. Furthermore, a yield of 1.2 kg kg-1 was determined which is not a realistic value. Given the wide range of particle diameters in this fraction and the fact that the product specifications of the XAD7 indicate a diameter range of 850-250 um (20-60 mesh) it was assumed that a smaller average radius was reasonable. Therefore, a yield of 0.93 kg kg-1 was assumed, which was determined earlier (Mulder et al., 1998a), and the particle radius (R) was optimized and determined at 610 um. This clearly stresses the importance of narrow sieve fractions during the preparation of the material.
Although the effective intraparticle diffusion coefficient was determined in several separate adsorption and desorption experiments and was a fixed parameter in the description of the biodegradation experiments, it is possible to optimize this parameter in the aseptic phase of the experiment. It must than be assured that external mass-transfer resistances are negligible by sufficient mixing. Although the value of the mass-transfer coefficient was optimized in the first part of the
123

Chapter 5
experiments, this was only important in the test described in Figure 10, where external resistances were limiting the rate of naphthalene release. In Figures 7 and 8, intraparticle diffusion was rate-limiting for the transfer of naphthalene from the particles to the mixed bulk as indicated by Biot numbers of 1.6 x 10³ and 46 respectively.
The effect of the external resistances is illustrated in Figures 10 and 11. Figure 10 shows the biodegradation of naphthalene, desorbing from XAD7 particles, at low mixing intensities. Although the model calculations show excellent agreement with the experimental data, this situation is not optimal. The porous sorbents were intended to function as a matrix from which slow diffusion of the pollutant occurs. However, model calculations at higher mixing conditions (Bi = 44) show that intraparticle mass transfer limits the biodegradation only for a short period (from t = 1.27 x 10⁵ s onwards). However, by choosing larger particles (Fig 7) this problem can be circumvented.
The simulations which are shown in Figure 11 are calculated with the same value for the effective diffusion coefficient. In fact, the properties of the hypothetical sorbents are almost identical to those of XAD7 to increase the relevance to the current experimental systems. In real soil systems, however, porosities (e) will be much lower and this will cause a strong decrease in the effective diffusion coefficient [Eq (3)]. Furthermore, relative velocities of soil aggregates compared to the fluid will most likely be higher due to larger differences between the particle density and liquid density (Van 't Riet and Tramper, 1991). The importance of external diffusion limitations will therefore be less pronounced.
The simulations that have been performed to illustrate the effect of the Freundlich sorption constant n (Fig 12), clearly demonstrate that deviation from the linear isotherm causes longer biodegradation periods necessary to reduce the contaminant concentration in the particle to certain levels [at equal initially sorbed concentrations (Qi)]- From Equation (5) and Figure 13 it can be deduced that the value of the overall effective diffusion coefficient decreases with a decreasing dissolved naphthalene concentration. This results in lower desorption rates from the particles and consequently in lower biomass formation rates in the mass-transfer limited part of the simulation. Even in the case of a linear isotherm (n = 1.0) the overall effective diffusion coefficient is orders of magnitude lower than the effective diffusion coefficient. This is the reason for the relatively slow release of more hydrophobic soil contaminants in comparison to pollutants that show less sorption to the soil material. In most studies on the sorption of pollutants to soil material, the sorption constant is related to the octanol-water partitioning coefficient of the compound. This quantity is a measure for the hydrophobicity and the interactions with the soil organic matter have shown to be proportional to this
124

Mutual influence of biodegradation and intraparticle mass transfer
parameter (Karickhoff, 1981). The calculation at different initial biomass concentration indicate that the
microbiological limited phase can be shortened by altering the biological parameters. In fact, the kinetically limited phase can be prevented if the potential biodegradation capacity exceeds the maximum desorption rate. In that situation, bioremediation periods can simply be calculated on the basis of a zero bulk liquid concentration when sorption is described by a linear isotherm (n = 1.0) (Mulder et al., 1999). However, as the biomass formation rate becomes zero order at microbiological limited conditions and the desorption rate is limited to a certain maximum value, it can be expected that mass-transfer limited conditions will eventually be inevitable. The sufficient supply of other nutrients (e.g. oxygen, nitrogen) is of course a prerequisite to achieve zero order biodegradation.
5.7 Conclusions
The purpose of this work was to validate a mechanistic model that incorporates mass-transfer processes and biological degradation kinetics. The foregoing has showed that the model can adequately describe the sorption, mass transfer and biodegradation processes of naphthalene, initially sorbed in a porous particle. As the model parameters can all be determined seperately, a mechanistic framework is available with which predictions can be made about the behavior of hydrophobic soil pollutants in systems with nonlinear sorption and Monod bacterial kinetics.
The use of sythetic model soil matrices eliminate the soil heterogeneity that complicates the research for the rate limiting processes in the biodegradation of PAHs and other hydrophobic soil pollutants. Because the Amberlite resins posses well-defined and constant properties, validation of the model was possible and experimental results were reproducible. The size of the model soil particles was, for instance, within defined limits which is often a problem in real soil slurries. Furthermore, the particles have homogenous properties which is not the case for real soil particles wherein heterogeneities occur at all scales. The use of naphthalene as a model PAH is very convenient because the timescales of the experiments is short and analytical difficulties are prevented.
However, there are drawbacks to the application of these types of soil model systems. In general, there are two types of disadvantages. It is undesired that processes which are absent in real soil systems occur in the model matrices. The surface diffusion of naphthalene in the XAD4 resins and the possible sorption of biomass to the Amberlite resins are examples of such processes. However, with respect to the latter it must be stressed that the major part of the soil biomass is attached to particulate matter. On the other hand, it is also possible that relevant processes for natural systems are impossible to mimic in artificial systems. The
125

Chapter 5
formation of bound residues or the aging of pollutants in the soil organic matter are important processes that cannot be simulated in the current model system (Eschenbach et al., 1994; Hatzinger and Alexander, 1995). However, there are some interesting reports on the use of humus-coated silica gels to predict the environmental fate of hydrophobic contaminants (Szabo and Guczi, 1995). Provided that the properties are reasonably reproducible, these might be soil model systems that will overcome some of the disadvantages of the present system. In addition, the partitioning characteristics will be similar to real soil organic matter.
Nomenclature
A area of a particle Bi dimensionless Biot number C dissolved naphthalene concentration C(T) concentration at time r predicted by the model Cf=j concentrations at the interface of the particle
with the laminar layer Cb concentrat ions in the mixed bulk l iquid d initial d issolved naphtha lene concentrat ion Cz\ T experimental PAH concentration at time r dt diameter of the impeller DAB binary diffusion coefficient of the PAH in water Deff effective diffusion coefficient D°eff overall effective diffusion coefficient Ha d imensionless Hat ta n umbe r ke mass-transfer coefficient K total n umbe r of s teps in the 4 d oma in KF F reundl ich sorpt ion coefficient Ks Monod constant L total number of steps in the r domain ms dry weight of the particles n dimensionless constant N mass flux through the laminar layer Q sorbed phase concentration Qi initial sorbed naphthalene concentration r distance from the center of the particle R radius of the particle
(m2)
(-) (kg nr3) (kg nr3) (kg nr3)
(kg nr3) (kg nr3) (kg nr3) (m) (m2 s1) (m2 s1) (m2 s1)
(-) (m2 s-1)
(-) (m3n kg-") (kg nr3)
(-) (kg) (-) (kg nr2 s-1) (kgkg-i) (kgkg-i) (m) (m)
126

Mutual influence of biodegradation and intraparticle mass transfer
Re d imensionless Reynolds number Ret d imensionless impeller Reynolds number Sc d imensionless Schmidt number Sh d imensionless Sherwood number Si rotational speed of the impeller t t ime ti momen t of inoculation v relative velocity of the particle to the liquid velocity V vo lume of the l iquid phase per particle VR vo lume of l iquid in the reactor X biomass concentration X; initial biomass concentration X(T) concentration a t t ime r p redicted by the model X21 r experimental b iomass concentration at t ime r Y yield of the bacteria z identifier of the experimental individual data point Z number of experimental data points
Greek symbols
a constant in Equation (15) a, dimensionless coefficient in Equation (A.4) P constant in Equation (15) Pi dimensionless coefficient in Equation (A.4) y constant in Equation (15) yi dimensionless coefficient in Equation (A.4) e particle volumetric porosity K dimensionless matrix factor £ dimensionless normalized location in the particle 77 dynamic viscosity of the liquid phase H g rowth rate of the bacteria fjmax max imum growth rate of the bacteria pe l iquid density Ps density of the solid phase X d imensionless parameter r d imensionless normalized t ime tm d imensionless coefficient in Equation (A.4) Oi d imensionless coefficient in Equation (A.4) d d imensionless coefficient in Equation (A.4)
) :-) •)
» s-i)
s) s) m s 1 ) m 3 )
m3) kg nr3) kg nr3) kg nr3) kg nr3) kgkg-i) :-) :-)
) m 3 n r3) -) -) kg m 1 s-1) ;-i)
ri)
kg nr3) kg nr3)
127

Chapter 5
Literature
Ball WP, Roberts PV (1991a) Long-term sorption of halogenated organic chemicals
by aquifer material. 1. Equilibrium. Environ. Sci. Technol. 25:1223-1235 Ball WP, Roberts PV (1991b) Long-term sorption of halogenated organic chemicals
by aquifer material. 2. Intraparticle diffusion. Environ. Sci. Technol. 25: 1237-1249
Bird RB, Stewart WE, Lightfoot EN (1960) Transport Phenomena. 1st edition. Wiley, New York
Brusseau ML, Jessup RE, Rao PSC (1991) Nonequilibrium sorption of organic chemicals: elucidation of rate-limiting processes. Environ. Sci. Technol. 25: 134-142
Chiou CT, McGroddy SE, Kile DE (1998) Partition characteristics of polycyclic aromatic hydrocarbons on soils and sediments. Environ. Sci. Technol. 32: 265-269
Chung GY, McCoy BJ, Scow KM (1993) Criteria to assess when biodegradation is kinetically limited by intraparticle diffusion and sorption. Biotechnol. Bioeng. 41: 625-632
Connaughton FC, Stedinger JR, Lion LW, Shuler ML (1993) Description of time-varying desorption kinetics: release of naphthalene from contaminated soils. Environ. Sci. Technol. 27: 2397-2403
Crank J (1975) The mathematics of diffusion. 2nd ed. Clarendon Press, Oxford, UK Crocker FH, Guerin WF, Boyd SA (1995) Bioavailability of naphthalene sorbed to
canonic surfactant-modified smectite clay. Environ. Sci. Technol. 29: 2953-2958 Darbyshire JF, Chapman SJ, Cheshire MV, Gauld JH, McHardy WJ, Paterson E,
Vaughan D (1993) Methods for the study of interrelationships between microorganisms and soil structure. Geoderma 56: 3-23
De Jonge H (1996) Sorption, bioavailability and mineralization of hydrocarbons in contaminated soils. PhD-thesis, University of Amsterdam, Amsterdam, The Netherlands
Dexter AR (1988) Advances in characterization of soil structure. Soil Tillage Res. 11: 199-238
Emerson WW, Foster RC, Oades JM (1986) Organo-mineral complexes in relation soil aggregation and structure. Soil Sci. Soc. Am. J. 17: 521-547
Erickson DC, Loehr RC, Neuhauser EF (1993) PAH loss during bioremediation of manufactured gas plant site soils. Water Res. 27: 911-919
Eschenbach A, Kastner M, Bierl R, Scheafer G, Mahro B (1994) Evaluation of a new, effective method to extract polycyclic aromatic hydrocarbons from soil samples. Chemosphere 28: 683-692
Foo SC, Rice RG (1979) Sorption equilibria and rate studies on resinous retardation
128
Mutual influence of biodegradation and intraparticle mass transfer
beads. 2. rate studies. Ind. Eng. Chem. Fundam. 18: 68-75 Guerin WF, Boyd SA (1992) Differential bioavailability of soil-sorbed naphthalene
to two bacterial species. Appl. Environ. Microbiol. 58:1142-1152 Gustafson KE, Dickhut RM (1994) Molecular diffusivity of polycyclic aromatic
hydrocarbons in aqueous solution. J. Chem. Eng. Data 39: 281-285 Harkey GA, Hoof van PL, Landrum PF (1995) Bioavailability of polycyclic aromatic
hydrocarbons from a historically contaminated sediment core. Environ. Tox. Chem. 14:1551-1560
Harms H (1996) Bacterial growth on distant naphthalene diffusing through water, air, and water-saturated and non-saturated porous media. Appl. Environ. Microbiol. 62: 2286-2293
Hatzinger PB, Alexander M (1995) Effect of aging of chemicals in soil on their biodegradability and extractability. Environ. Sci. Technol. 29: 537-545
Hinz C, Gaston LA, Selim HM (1994) Effect of sorption isotherm type on predictions of solute mobility in soil. Water Resour. Res. 30: 3013-3021
Huang W, Weber WJ (1997) A distributed reactivity model for sorption by soils and sediments. 10. Relationships between desorption, hysteris, and the chemical characteristics of organic domains. Environ. Sci. Technol. 31: 2562-2569
Karickhoff SW (1981) Semi-empirical estimation of sorption of hydrophobic pollutants on natural sediments and soils. Chemosphere. 10: 833-846
Kay BD (1990) Rates of change of soil structure under different cropping systems. Adv. Soil Sci. 12:1-51
Kleijntjens R (1991) Biotechnological slurry process for the decontamination of excavated polluted soils. PhD-thesis, Technical University of Delft, Delft, The Netherlands
Komiyama H, Smith JM (1974) Intraparticle mass transport in liquid-filled pores. AIChE J. 20: 728-734
Levins DM, Glastonbury JR (1972) Application of Kolmogoroff's theory to particle-liquid mass transfer in agitated vessels. Chem. Eng. Sci. 27: 537-543
Liu KH, Enfield CG, Mravik SC (1991) Evaluation of sorption models in the simulation of naphthalene transport through saturated soils. Ground Water 29: 685-692
Luthy RG, Dzombak DA, Peters CA, Roy SB, Ramaswami A, Nakles DV, Nott BR (1994) Remediating tar-contaminated soils at manufactured gas plant sites. Environ. Sci. Technol. 28: 266-276
Mulder H, Breure AM, Van Andel JG, Grotenhuis JTC, Rulkens WH (1998a) Influence of hydrodynamic conditions on naphthalene dissolution and subsequent biodegradation. Biotechnol. Bioeng. 57:145-154
Mulder H, Breure AM, Van Honschooten D, Grotenhuis JTC, Van Andel JG, Rulkens WH (1998b) Effect of biofilm formation by Pseudomonas 8909N on the bioavailability of solid naphthalene. Appl. Microbiol. Biotechnol. 50: 277-283
129

Chapter 5
Mulder H, Breure AM, Rulkens WH (1999) Prediction of bioremediation periods for PAH soil pollutants in different physical states by mechenistic models. submitted for publication.
Perry RH, Chilton CH, Kirkpatrick SD (1963) Chemical engineers' handbook. McGraw-Hill, New York
Press WH, Teukolsky SA, Vetterling WT, Flannery BP (1992) Numerical recipes in Fortran: The art of scientific computing, 2nd edition. Cambridge University Press, Cambridge, UK
Schlegel HG (1981) Allgemeine Mikrobiologie. Thieme Verlag, Stuttgart, Germany Scow KM, Alexander M (1992) Effect of diffusion on the kinetics of biodegradation:
experimental results with synthetic aggregates. Soil Sci. Soc. Am. J. 56:128-134 Schlebaum W (1998) Organic contaminants in soil: desorption kinetics and
microbial degradation. PhD-thesis, Wageningen Agricultural University, Wageningen, The Netherlands
Szabo G, Guczi J (1995) Examination of silica-salicyclic acid and silica-8-hydroxyquinoline HPLC stationary phases for estimation of the adsorption coefficient of soil for some aromatic hydrocarbons. Chemosphere 30:1717-1727
Thomas AO, Lester JN (1993) The microbial remediation of former gaswork sites: a review. Environ. Technol. 14:1-24
Van Brakel J, Heertjes PM (1974) Analysis of diffusion in macroporous media in terms of a porosity, a tortuosity and a constrictivity factor. Int. J. Heat. Mass Transfer 17:1093-1103
Van 't Riet K, Tramper J (1991) Basic bioreactor design. Marcel Dekker Inc., New York, USA
Volkering F (1996) Bioavailability and biodegradation of polycyclic aromatic hydrocarbons. PhD-Thesis, Agricultural University of Wageningen, Wageningen, The Netherlands
Volkering F, Breure AM, Sterkenburg A, Van Andel JG (1992) Microbial degradation of polycyclic aromatic hydrocarbons: effect of substrate availability on bacterial growth kinetics. Appl. Microbiol. Biotechnol. 36: 548-552
Waters AG, Oades JM (1991) Organic matter in water-stable aggregates, in: Adv. Soil Organic Matter Res, ed.: WS Wilson, R. Soc. Chem., Cambridge, pp. 163-174
Weber WJ, Huang W (1996) A distributed reactivity model for sorption by soils and sediments. 4. Intraparticle heterogeneity and phase-distribution relationships under nonequilibrium conditions. Environ. Sci. Technol. 30: 881-888
Weber WJ, Miller CT (1988) Modeling the sorption of hydrophobic contaminants by aquifer materials-I. Water Res. 22: 457-464
Weissenfels WD, Klewer HJ, Langhoff J (1992) Adsorption of polycyclic aromatic hydrocarbons (PAHs) by soil particles: influence on biodegradability and biotoxicity. Appl. Microbiol. Biotechnol. 36: 689-696
130

Mutual influence of biodegradation and intraparticle mass transfer
Wilson SC, Jones KC (1993) Bioremediation of soil contaminated with polynuclear aromatic hydrocarbons (PAHs): a review. Environ. Pollution 81: 229-249
Wu S, Gschwend PM (1986) Sorption kinetics of hydrophobic organic compounds to natural sediments and soils. Environ. Sci. Technol. 20: 717-725
131

Chapter 5
Appendix
The partial differential Equation (8) is discretized according to the Crank-Nicholson scheme (Press et a l , 1993). The following equations apply for the first and second derivative, given a function C(£T):
C(t,r) = C: (A.1)
cc _cj+7-c> dr ~ AT
2dC = l
(i-VAZ.
1 = 0,1,2 K ; 7 = 0 , 2 , 2 L
ri+1 A.ri _ri+1 _ri ^
2*4
(A.2)
(A.3)
Cl+J + C> •2(Cp+C{) + Ctt+CJ,
A? (A.4)
where i is the location in the £ domain,;' the location in the r domain, K the total number of steps in the £ domain, and L the total number of steps in the r domain (Fig A.l). The intervals Agand AT are the differences between the gridpoints in the discretization scheme. When the Equations (A.2), (A.3), and (A.4) are substituted into Equation (8), a set of linear equations of the following form is obtained:
a.-c/r/ + PP? + rC% = » 4 , + 0tc{ + a.-C/l, (A.4)
where on, /?>, yt, m,, 9i, and <r, are dimensionless coefficients. After the boundary conditions [Eqs (12) and (13)] are discretized, these dimensionless coefficients can be calculated. The calculation of the concentrations from an initial condition at r = 0 over a time interval AT, is than reduced to solving K+2 linear equations with K+2 unknowns. This can be done by solving the following tridiagonal matrix system for the unknown concentrations at time T+AT (C 0
M r , Ci+A\... r- -I+Ar
decomposition (Press et al., 1993): CK+iT+"r) by LU-
132

Mutual influence of biodegradation and intraparticle mass transfer
i-1 i i+1
0
I t — I I — i t
I M M I —>•
O—A—0 "• J
Figure A.1 Molecule of the Crank-Nicholson discretization scheme. % is the space domain and T the time domain.
a.
0
0
0
Yo Pi a,
0
Yi
Pi
0
0
Yi
0
0
0
0
a K - l
0 fi, K-l
ak
YK-I
PK a*
T+AT
0 T+AT
1 T+AT
2
(^T+AT
S-'T+AT
S^T+AT
0
YK
K+l PK+1
90C\ + a0C\
ETJCQ + 0jCj + CTjCl
m2c\ + e2c2 + <J2C;
^ J c Q - l + 9KCTK + <JKCT
K+1
"K+V~K + crK+1LK+j
(A.5)
133

Chapter 5
The change in biomass concentration in time, as defined by Equation (22), is calculated with an Euler integration scheme over the same time interval AT. Than, the dimensionless coefficients cm, /?,, y\, mi, #,, and cr, are again calculated and the matrix system can be solved for the next concentrations (OT+AT) using the concentrations that have been calculated as future concentrations (QT+Az) in the preceding time-interval as the present concentrations (Qz). By this procedure, the concentration of bacterial biomass and dissolved PAH is calculated in time.
Numerical approximations by this procedure have been compared by analytical solutions of the partial differential Equation (8) for the situation of desorption of a solute into a liquid phase of limited volume without external mass-transfer resistances (Crank, 1975). Complete agreement between the analytical solution and the numerical approximation was observed. A linear isotherm [n = 1.0; Eq (1)] was used in this verification. Mass balances were set up and recoveries were always within 100% ±0.1%.
134

CHAPTER 6
Application of a mechanistic desorption-biodegradation model to describe the behavior of polycyclic aromatic hydrocarbons in peat soil aggregates
6.1 Abstract
A procedure was developed to obtain three size fractions (2360 < dp < 1000 |xm, 1000 < dp < 710 urn, and 710 < dp < 425 urn) of stable aggregates from Koopveen peat soil by application of an intense mixing regime prior to sieving of the soil material. The organic matter content, aggregation structure and the microstructure of these aggregates were determined and the particles were artificially contaminated with naphthalene and phenanthrene via a solvent phase. A nonlinear Freundlich sorption isotherm was determined for the naphthalene contaminated soil aggregates (n = 0.39; KF = 1.13 x 10² m117 kg"039). The applicability of a mathematical model, that describes sorption equilibrium, intraparticle mass transfer, and nonlinear bacterial degradation kinetics, was tested by fitting results of dynamic desorption and biodegradation experiments, generated in this study and earlier work on the peat soil aggregates. The experimental data were described adequately although strong variations in the values of the fit parameter, the intraparticle porosity (0.30 < s < 0.88), were found. This indicates the necessity of further investigations.

Chapter 6
6.2 Introduction
The influence of dissolution and desorption processes of polycyclic aromatic hydrocarbons (PAHs) in soil on the subsequent biodegradation of these hazardous pollutants has been studied extensively in the last decades (Cornelissen, 1998; De Jonge, 1996; Erickson et al., 1993; Guerin and Boyd, 1992; Harkey et al., 1995; Kotterman, 1998; Luthy et al , 1994; Volkering, 1996; Weissenfels et al., 1992). The result of these studies is the insight that slow transport processes often limit the degradation of PAHs because microorganisms are unable to attack the pollutants that are sorbed to soil material. This lack of mobility and the resulting low degradation rates of these pollutants is often referred to as a reduced bioavailability. Several authors have attempted to describe the phenomena and mechanisms of the transport of these extremely hydrophobic molecules through porous media and through the organic matter of the soil in particular (Brusseau et al., 1991; Connaugthon et al., 1993; De Jonge, 1996; Huang and Weber, 1997; Volkering, 1996).
In earlier work that was aimed at the elucidation of the rate-determining steps in the biodegradation of PAHs in porous matrices, it was demonstrated that mechanistic models can adequately describe the release and degradation of naphthalene from artificial soil aggregates (Mulder et al., 1999a). These experiments were performed with well-defined synthetic porous solids. Consequently, the model parameters (intraparticle diffusion coefficient, sorption coefficient, particle radius) were reproducible quantities and experimental uncertainties were minimized. The mathematical model that was used in that work was based on intraparticle diffusion as the rate-determining step for the release of PAH from the solid phase (Mulder et al., 1999a; Scow and Alexander, 1992; Wu and Gschwend, 1986). It was the purpose of the present study to test the applicability of this model to describe sorption, mass-transfer and biodegradation processes of PAHs in real soil material.
When real soil material is used, the materials are less accurately characterized and soil heterogeneity often causes problems with respect to reproducibility of data (Darbyshire, 1993; Scow and Alexander, 1992). To explore the applicability of the earlier developed model, we have attempted to produce reasonable characterized porous aggregates from soil material. Diffusion distances or, more specific, the particle radius are critical model parameters. It is known from agricultural literature that the level of aggregation depends on the forces that are exerted on soil aggregates (Kay, 1990; Waters and Oades, 1991). Therefore, hydrodynamically stabilized soil aggregates were used assuring that the value of the particle radius was constant throughout the experiments.
136
Model validation with porous soil aggregates
6.3 Material en Methods
6.3.1 Microorganisms and medium The isolation and maintenance of the bacterial cultures used in the biodegradation experiments, Pseudomonas 8909N and 8803F is described by Volkering (1996). The composition of the buffered (pH 7.0) mineral medium has been described earlier (Mulder et al„ 1998).
6.3.2 Soil aggregates
The 'Koopveen' peat soil was kindly provided by the Soil and Groundwater Research Laboratory of the National Institute for Public Health and the Environment, the Netherlands. To stabilize the aggregation structure of the soil aggregates, 500 g of the original soil was dispersed in 500 mL demineralized water and stirred at 1500 rpm for 24 h. The soil was then wet sieved (sieves: 2360 urn, 1000 |am, 850 (un, 710 urn, 600 m, 500 |am, 425 (xm, 355 urn, 300 urn, 250 urn, and 63 l m; Endecotts Ltd., England) and dried at 105°C for 24 h in the presence of silica gel resulting in 11 sieve fractions. Three fractions were composed and used in the desorption and biodegradation experiments: 2360 < dp < 1000 urn (Fi), 1000 < dp< 710 um (F2), and 710 < dr< 425 um (F3), where dp is the aggregate diameter. These aggregate fractions were contaminated with naphthalene and phenanthrene by the procedure of Volkering (1996). Serum flasks of 100 mL were filled with 30 mL acetone and 0.3 g of the PAH or no PAH for the controls. Then, 15 g of the aggregates was added and the slurries were incubated for 5 d at 30CC. Thereafter, the excess acetone was decanted and the remaining solvent was evaporated by repeated nitrogen flushing. The soils were stored at 4°C under a nitrogen atmosphere. To investigate the mineral composition of the stabilized soil aggregates, a standard soil analysis (Lagas et al., 1986) was performed to determine mineralogical composition of the largest sieve fraction (Fi). Air-dried soil (20 g) was added to a 800 mL glass beaker at 90°C containing 35 mL water and 15 mL 30% H2O2 solution. After 2 h, fresh peroxide solution was added and this was repeated until the solution became transparent. Ethanol was added to prevent excessive foaming. Finally, 5 mL of 1 M HC1 was added to remove calcareous components. The solution was decanted and the soil particles were dried at 105°C. After drying, the material was sieved and the mass at the sieves was determined. Measurements of the solid phase density and the specific surface area, as determined by nitrogen and carbondioxide gas adsorption, were performed analogous to earlier tests with soil material (De Jonge and Mittelmeijer-Hazeleger, 1996).
137

Chapter 6
Figure 1 Batch reactor used for desorption experiments: 1. 250 mL serum flask; 2. mineral medium; 3. filter; 4.Teflon lined septum with cap; 5. Viton tubing with clamp; 6. syringe; 7. thermostat. In the biodegradation experiments the sampling device was absent.
6.3.3 Batch desorption experiments
Batch desorption experiments were performed in 250 mL serum flasks with Teflon lined septa and 100 mL of sterile mineral medium at 30°C. Agitation of the slurry was accomplished by shaking at 250 rpm on a rotary shaker. Viton tubing was led through the septa and connected to 2 \xm stainless steel filters (HPLC inlet filter, Alltech, The Netherlands) inside the flasks (Fig 1). The filters were always above the liquid level of the medium to prevent differences in the hydrodynamic regime compared to the biodegradation experiments without the filter equipment.
The experiments were started by addition of 1 g of contaminated dry soil. At certain time intervals, the reactors were turned up-side-down and 0.75 mL samples were drawn from the reactors by a syringe and brought into 1.5 mL crimp top vials. The samples were 50% diluted with acetonitril. The PAH concentration in the samples was determined by HPLC. Control experiments showed that wetting of the soil prior to the experiments had no effect on the desorption kinetics.
6.3.4 Biodegradation experiments
Biodegradation experiments were performed in 250 mL serum flasks with 100 mL mineral medium at a temperature of 30°C. Agitation of the slurry was achieved by shaking at 250 rpm on a rotary shaker. The headspace volume of 215 mL and the medium was flushed with pure oxygen gas to remove CO2. At the start of an
138

Model validation with porous soil aggregates
experiment 1.0 g of soil was amended to the flask and 1 mL of an active bacterial culture, growing on crystalline naphthalene or phenanthrene, was added. Thereafter, the flasks were closed and the CO2 concentration in the headspace was measured in time by GC analysis. At the end of an experiment, 1 mL of a 12 M HC1 solution was added by a syringe through the septum to release the CO2 from the liquid phase. After 1 h of shaking, the CO2 concentration in the headspace was again measured by GC. The fractions were brought into 100 mL serum flasks and extracted with 50 mL acetonitril to determine the residual PAH concentration.
6.3.5 Analytical methods
Naphthalene and phenanthrene concentrations were determined by HPLC analysis (HP 1050 series). Samples were injected onto a 20 cm Chromspher PAH columns (Chrompack, The Netherlands) and eluted with a 88:12 (% v/v) mixture of acetonitrile and MilliQ water (Millipore) at a flow rate of 0.4 mL min1 and a column temperature of 45 °C. Peaks were detected at 276 nm for naphthalene and at 254 nm for phenanthrene with an UV detector.
Soil loadings were determined by extracting 0.5 g of soil with 50 mL acetonitril at 30°C in 100 mL serum flasks which were fitted with Teflon lined septa. After 5 days samples were drawn from the liquid. Thereafter 45 mL of the solvent was decanted and the extraction was repeated with 45 mL fresh solvent.
The carbondioxide concentration in the headspace of the reactors was measured by GC (Hewlett Packard type 5890 gas chromatograph). Helium was applied as the carrier gas at a flow rate of 30 mL min1 over a Hayesep Q packed stainless steel column (diameter 1/8", 2 m length, Chrompack, The Netherlands). Samples of 100 |iL were injected at a temperature of 150°C with splitless injection. The oven temperature was 80°C and the temperature of the thermal conductivity detector 200°C.
The organic matter content of the soils was determined by loss on ignition at 550°C for 24 h. Prior to the oxidation of the organic matter, the soils were dried for 24 h at 105°C.
6.4 Modeling
The mathematical model is described in earlier work and will, therefore, only be discussed generally (Mulder et al., 1999a). The assumptions that underlay the model are: (i) the soil aggregates consist of homogeneous spheres of equal diameter, (ii) biodegradation of the contaminant is only possible in the bulk liquid
139

Chapter 6
because bacteria are unable to penetrate the pores of the particles, (iii) there is local equilibrium inside the particles, (iv) diffusion occurs via the liquid phase of the pores, (v) the bacterial growth follows Monod kinetics, and (vi) external mass-transfer limitations are negligible. Except for (vi), these assumptions are equal to the earlier model. Dissolution tests with naphthalene crystals in the shaken flasks indicated that mass-transfer coefficients in the laminar layer around the soil aggregates were high enough to neglect external mass-transfer limitations and make assumption (vi) valid.
The intraparticle partitioning of PAHs between the water and the soil material is described with the nonlinear Freundlich isotherm:
Q = KFC (1)
where Q is the sorbed PAH concentration in the pores of the aggregate (kg kg-1), KF the Freundlich sorption coefficient (m3n kg-"), C the dissolved PAH concentration in the particle (kg nr3), and n a dimensionless constant. The values of KF and n can be found from a plot of the natural logarithm of Q versus the natural logarithm of C where the slope of the resulting straight line equals n and the intercept at the vertical axis equals the natural logarithm of KF. The concentration profiles inside the particles can be described by the the following mass balance:
dC Deff (tfc 2dC eS • • + -
m e + (l-£)p5nKFC(n-1)\dr2 rdr)
with the following boundary conditions (B.C.) and initial condition (I.C.):
(2)
~dr 0 r = 0 t>0 B.C. (I) (3)
r=0
C = Cb r = R t>0 B.C. (II) (4)
C = d 0>r>R t = 0 I.C. (5)
where s is the particle volumetric porosity (m3 nr3), t the time (s), ps the skeletal density of the solid phase (kg nr3), Dejf the effective diffusion coefficient through the porous matrix (m2 s1), r the distance from the center of the particle (m), R the particle radius, G, the bulk liquid PAH concentration (kg nr3), and C, the initial PAH concentration in the water phase in the particle (kg nr3) which is in
140

Model validation with porous soil aggregates
equilibrium [Eq (1)] with the initial sorbed concentration in the solid phase of the particle Q, (kg kg-1). The value of the effective diffusion coefficient is generally expressed as a function of diffusion coefficient of the compound in water, the volumetric porosity and a matrix factor (Mulder et al., 1999a; Van Brakel and Heertjes, 1974). A value of 1.52 was reported for the matrix factor for soil particles (Van Brakel and Heertjes, 1974) and this value was used in the calculations. Then the effective diffusion coefficient can be defined as:
D sD AB
<# (6)
where DAB is the binary diffusion coefficient of the PAH in water (m2 s1) and K the matrix factor. The change in bulk liquid PAH concentration is described by the following differential equation:
dC, NA fjX dt ~ V Y
(7)
with:
dC (8)
Cb = 0 f = 0 I.C. (9)
where V is the volume of the liquid phase per particle (m3), N the mass flux from the particle surface to the bulk liquid (kg nv2 s1), A the particle external surface area (m2), // the growth rate of the bacteria (s1), X the biomass concentration (kg nv 3), and Y the yield of the organisms on the PAH (kg kg-1). The liquid volume per particle is defined by:
V = VR^R3(l-e)Ps
(10)
where VR is the total bulk liquid volume in the reactor (m3), and ms the total dry weight of the soil particles in the reactor (kg). The volume of the water in the pores of the aggregates is negligible. The change in biomass concentration in time is given by:
141

Chapter 6
j y
— = fiX X = Xt t = 0 I .C (11) dt '
where X, is the initial biomass concentration (kg nr3). The growth rate of the bacteria is modeled by nonlinear Monod kinetics:
H = Mmax T T % - (12)
where fjma is the maximum growth rate of the bacteria (s1) and K5 the Monod constant (kg nv3).
The numerical integration of the coupled differential equations (2), (7), and (11) is described in detail in earlier reports (Mulder et al., 1999a). The optimization of the model to experimental dynamic desorption data was performed similar to the method of Wu and Gschwend (1986) in which the particle porosity is used as the single fit parameter. The value of the unknown porosity was optimized by minimizing a Chi-squared function using a bracketing method (Press et al., 1992).
The biodegradation of PAHs is followed experimentally by measuring CO2 concentrations in the headspace of the reactors. The volume percentage of CO2 in the headspace was calculated on the basis of the amount of biomass formed by PAH degradation assuming ideal gas conditions in the headspace:
105 ncVRYco yRT = c R co2r g
- YMwPVh v ;
where/COi is the volume fraction of carbondioxide in the headspace (%), nc the
number of carbon atoms in the PAH molecule that is biodegraded, Yco the yield of
CO2 on the degraded PAH (C-mol C-mol-1), y the fraction of the total amount of CO2 which is present in the headspace (a value of 0.490 was determined by acidification of the medium), Rg the gas constant (8.3144 J mol1 K1; Smith and Van Ness, 1987), T the temperature (K), Mw the molecular weight of the PAH (g mol1), P the pressure (Pa), and Vi, the headspace volume (m3). The initial amount of CO2 in the reactors was negligible due to the flushing of the medium and headspace with pure oxygen gas before the start of the experiment.
142

Model validation with porous soil aggregates
6.5 Results
6.5.1 Koopveen aggregates
Hydrodynamically stabilized aggregates of the peat soil were obtained by the application of an intense hydrodynamic regime and the subsequent separation of the size fractions by wet sieving. Pilot tests proved that this procedure yielded stable aggregates under the relatively mild hydrodynamic conditions applied in further experiments. After a 5 d period of mixing at 250 rpm in 250 mL flasks with 100 mL of medium, approximately 80 % of the particles was retained at the lower size limit of the fraction. The distribution of the fractions in the original material and the organic matter content of each fraction is shown in figure 2. The mineralogical composition of the aggregates of the largest fraction (2360<dp<1000 urn) was investigated by oxidation of the organic matter and removal of calcareous components by hydrogen peroxide and hydrochloric acid.
The distribution of the primary soil particles over different size fractions was determined by sieving (Fig 2). In earlier work, identical Koopveen peat soil was used in similar desorption and biodegradation experiments and, conveniently, this material was preserved and the size distribution and organic matter content could be determined (Fig 2). The results in Figure 2 are in agreement with the visual observation that the particles in the fractions above 425 um were similar in appearance. The hypothesis is that the smaller particles originate from larger particles by mechanical attrition mechanisms (Kay, 1990). Below 425 um the organic matter content rapidly decreases which can be explained by the large amount of mineral particles (mainly sand) that is present in the smaller fractions. These fractions deviated in visual appearance from the larger fractions although particles, visually similar to the aggregates in the larger fractions, were observed. Separation of these aggregates from the mineral particles was not performed. Since the organic matter fraction in the larger size fractions was very similar, it was assumed that the fractions only differed in particle size and that the chemical composition was identical.
Three size fractions were composed of the six largest fractions with similar organic matter content: 2360 < dp < 1000 um (Fi), 1000 <dp< 710 um (F2), and 710 < dp < 425 um (F3). A value of 2.02 x 10³ kg nr3 was determined pycnometrically for the skeletal density (pfe) of the peat soil. To eliminate the influence of the significant quantity of mineral particles (sand) in the size fraction between 250 and 106 um, a density of 2.65 x 10³ kg nr3 was assumed for the mineral phase (Lagas et al., 1986) and an aggregate skeletal density (ps) of 1.77 x 10³ kg nr3 was calculated.
The three size fractions were contaminated with either naphthalene or
143

Chapter 6
0.4
0.3
« < 0.2
I 0.1
• soil aggregates (this work)
• soil aggregates (Volkering, 1996)
• primairy particles (Fl; this work)
, 1 n
I J] B
A
i
o o o o o o o in t-H o o oo f-. vo in
?Q ^
in in o CM in o T °? *?
6 o Q in in <-H o o tN in u I N o in • * en co
o p m p
9 ? 5 1
sieve fraction (fxm)
0.4 §
•i 0.3 S.
o =
0.2 » I 0.1 ^
& o §••
Figure 2 A: The organic matter content in the different sieve fractions of the Koopveen peat soil was determined by loss on ignition. Results are shown for the material used in the present study and for the soil that was used in earlier work (sieved at: dv < 1000 jan; Volkering, 1996). B: The original Koopveen soil was divided in different sieve fractions and the mass fractions of these size classes are shown for the material used in this work and for the soil used in earlier work (sieved at: dv < 1000 /xm; Volkering, 1996). Aggregates of the largest fraction (Fi: 2360<dp<1000 fim) were subjected to a mineralogical analysis to determine the distribution of the primary particles. The distribution of the size fractions and the organic matter content is expressed as a fraction of the total weight.
phenanthrene. The results of the extraction of the contaminated soils are given in Table 1. A sorption isotherm was determined for the naphthalene contaminated particles (Fig 3) and the sorption parameters were calculated from the natural logarithmic data by linear regression (n = 0.39; KF = 1.13 x 10² m117kg-°39).
144

Model validation with porous soil aggregates
InC, -2
0.005
0.004 - -
Q 0.003 - -
(kg k g 1 )
0.002 - -
0.001 - -
I I I I
In Q = 0.39 In C - 4.48 R2 = 0.87
. *
q> o
---6
- - -8
D A O
O
Fl F2 F3
— Freundlich model logarithmic data
• linear regression
• • ' • ' • • I • •
InQ
•--10
---12
-14
0.01 0.02 0.03 0.04
Cb (kgm-3)
Figure 3 Sorption isotherm of naphthalene on Koopveen peat soil aggregates of three different size fractions (Ft, Fi, F3) and model calculation with the nonlinear Freundlich isotherm. The parameters n and KF are determined by linear regression on the logarithmic transformed data.
Table 1 Organic matter content and PAHs loadings of the six different fractions. The mean radius is taken to be the median value of the upper and lower size limit.
fraction
Fi
F2
F3
size fraction
(Mm)
1000 - 2360 710 -1000 425 - 710
median radius
(Hin)
840 428 284
naphthalene loading
(10-3kgkg-l)
3.17 5.15 5.97
phenanthrene loading
(10-3kgkg-l)
4.43 4.09 5.95
organic matter content
(%)
0.34 0.33 0.34
145

Chapter 6
The microstructure of the peat soil aggregates was characterized by measuring nitrogen and carbondioxide gas adsorption on the soil material. The specific surface areas were 1.3 x 10³ m2 kg-1 and 59.3 x 10³ m2 kg-1 and the microporosities were 0.25 x 10⁵ m3 kg-1 and 2.24 x 10⁵ m3 kg-1 for nitrogen and carbondioxide adsorption respectively.
6.5.2 Desorption experiments
Batch desorption experiments were performed with the six contaminated fractions in 250 mL serum flasks with 100 mL mineral medium at 250 rpm. The experiments with the phenanthrene contaminated fractions yielded physically unrealistic values because the maximum solubility was fourfold exceeded. Control experiments in which the maximum solubility of the PAHs was determined in the supernatant of the control aggregate fractions, showed that the solubility remained unchanged over a six day period. The partition of phenanthrene onto dissolved organic matter could, therefore, be eliminated as the cause of these high dissolved concentrations.
0.03 - -
0.02 - -
(kgm-3)
o.oi - -j
0.00
o o •
Fl F2 F3
-model
5000 10000
t (S)
15000 20000
Figure 4 Batch desorption of naphthalene as a function of time from three Koopveen peat soil size fractions (Fi, F2, and F3). The symbols represent experimental data and the solid lines are model calculations.
146
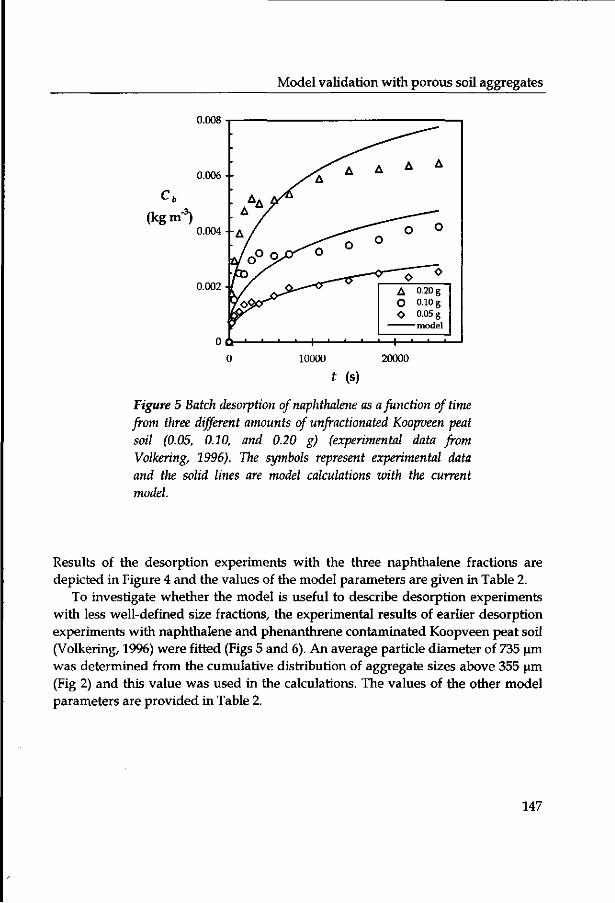
Model validation with porous soil aggregates
0.008
0.006 - -
(kgm-3) 0.004 - - £
0.002 A O O
0.20 g 0.10 g 0.05 g
- model
•+- •+•
0 10000 20000
t (s)
Figure 5 Batch desorption of naphthalene as a function of time from three different amounts of unfractionated Koopveen peat soil (0.05, 0.10, and 0.20 g) (experimental data from Volkering, 1996). The symbols represent experimental data and the solid lines are model calculations with the current model.
Results of the desorption experiments with the three naphthalene fractions are depicted in Figure 4 and the values of the model parameters are given in Table 2.
To investigate whether the model is useful to describe desorption experiments with less well-defined size fractions, the experimental results of earlier desorption experiments with naphthalene and phenanthrene contaminated Koopveen peat soil (Volkering, 1996) were fitted (Figs 5 and 6). An average particle diameter of 735 urn was determined from the cumulative distribution of aggregate sizes above 355 ^m (Fig 2) and this value was used in the calculations. The values of the other model parameters are provided in Table 2.
147

Chapter 6
Table 2 Model parameters used in the calculations of the desorption curves. A matrix factor (K) of 1.52 was assumed (Van Brakel and Heertjes, 1974).
parameter U
Soil
PAHb
ms
VR
Qi
DAB
R
KF
n
V
E e
A
figure number =>
(10-3 kg)
(1(H m3)
(10-skgkg-i)
(10-W m 2 s-l)
(l(Hm)
(10-2m3nkg-n)
(-) (10-» m3)
(m3 nr3)
(103 kg m-3)
4
Fi
N
1.00
1.00
3.17
8.28'
8.40
1.13
0.39
14.1
0.68
1.77
4
F2
N
1.00
1.00
5.15
8.28
4.27
1.13
0.39
4.12
0.29
1.77
4
F3
N
1.00
1.00
5.97
8.28
2.84
1.13
0.39
1.48
0.12
1.77
5
Volk.»
N
0.05
1.00
16.1
8.28
3.67
6.18
0.36
48.8
0.33
1.77
5
Volk.
N
0.10
1.00
16.1
8.28
3.67
6.18
0.36
25.5
0.31
1.77
5
Volk.
N
0.20
1.00
16.1
8.28
3.67
6.18
0.36
12.8.
0.30
1.77
6
Volk.
P
0.025
1.00
20.4
7.70d
3.67
6.81
0.19
17.2
0.88
1.77
6
Volk.
P
0.05
1.00
20.4
7.70
3.67
6.81
0.19
8.86
0.88
1.77
* The abbreviation 'Volk.' indicates the experiments with the unfractionated Koopveen peat soil
(Volkering, 1996); b Naphthalene (N) and phenanthrene (P) are indicated by a single character; c
Adapted from Gustafson and Dickhut (1994);d Calculated value (Mulder et al., 1999b);e fit parameter.
0.0010
0.0008
0.0006
(kgm-3) 0.0004
0.0002
0.0000
•
; DCr
/p
n ' ' • '
D
O
1 • '
D S_ —' D •
O o o o
O 0.025 g
• 0.050 g
10000 20000 t (s)
30000
Figure 6 Batch desorption of phenanthrene as a function of time from two different amounts of unfractionated Koopveen peat soil (0.025 and 0.050 g) (experimental data from Volkering, 1996). The symbols represent experimental data and the solid lines are model calculations with the current model.
148

Model validation with porous soil aggregates
6.5.3 Biodegradation experiments
Biodegradation experiments were performed with the three size fractions of Koopveen aggregates which were either contaminated with naphthalene or phenanthrene (Fig 7). The bacterial strains Pseudomonas 8909N and Pseudomonas 8803F were used as naphthalene and phenanthrene degraders respectively. The experiments were performed in serum flasks, identical to those used in the desorption experiments to assure similar conditions. The degradation of the PAHs was followed in time by measuring the CO2 concentration in the headspace of the flasks. The CO2 concentrations were corrected for the carbondioxide production by conversion of organic components other than the PAHs, by performing control experiments with aggregates that had only been treated with acetone. After seven days, the total amount of CO2 was determined by acidification of the medium and the residual amount of PAH in the soil was determined by solvent extraction. After this period, no PAHs were detected in the soil samples. The CO2 yield for naphthalene was determined to be 0.53 C-mol C-mol1. The value of this parameter
f CO
(%)
-Fl (naphthalene)
- F2 (naphthalene)
- F3 (naphthalene)
-Fl (phenanthrene)
-F2 (phenanthrene)
-F3 (phenanthrene)
100000 200000 300000
t (s)
Figure 7 Batch biodegradation of naphthalene and phenanthrene, by Pseudomonas 8909N and Pseudomonas 8803F respectively, for three different size fractions of Koopveen peat soil (Pi, F2, and F3). The biodegradation was determined by measuring the volume fraction of CO2 in the headspace.
149

Chapter 6
could not be determined for phenanthrene, because a strong increase in the CO2 production was observed after three days of incubation. This was attributed to the conversion of soil organic matter by the phenanthrene degrading organisms. Control experiments without the inoculation of bacteria showed that the soil loading procedure had yielded sterile soil aggregates.
The biodegradation of naphthalene which was initially sorbed onto the largest size fraction (Fi) was modeled by the current model (Fig 8; Tab 2). From the amount of CO2 produced at the end of the 7 day period and the amount produced after 2 days, a residual naphthalene amount of 9% of Qi was calculated. The residual mass fraction of naphthalene and the normalized desorption rate were also calculated and are given in Figure 8. The desorption rate was normalized on the basis of the maximum desorption rate at the beginning of the experiment. The values of the mass-transfer parameters calculated from the desorption experiments
1.2
feci
(%)
0.8
0.6--
0.4
0.2
" - r
I - \
\
.1
1
1
' 1
- L
1
1
• 1
• -j>
0
0 Fl (volume fraction of carbortdioxide) O Fl (volume fraction of carbondioxide)
residual mass fraction " •" •" normalised desorption rate
A 0 0 %
/\ d \ 1 \ / V 1 X 1 *.
f s
50000 100000 150000
t (s)
'
.
•
- l.U
-0.8
•0.6
•0.4
•0.2
200000
s 0 3 3 sidua
talize m
ass fraction
d desroption rate
Figure 8 Modeling of the batch biodegradation of naphthalene desorbing from peat soil aggregates (Ff, duplo experiments). The residual mass fraction of naphthalene in the aggregates and the normalized desorption rate are projected on the right vertical axis. The biodegradation was determined by measuring the volume fraction of CO2 in the headspace. The desorption rate was normalized on the basis of the initial desorption rate.
150

Model validation with porous soil aggregates
were used in the model calculations and bacterial kinetic data for the Pseudomonas 8909N were known from earlier work (jum* = 1.33 x 10^ s1; Ks = 40 x 10'6 kg nr3; Y = 0.93 kg kg-1) (Mulder et al, 1998; Volkering, 1996). The only unknown model parameter during the fitting procedure was, therefore, the initial biomass concentration. This value was adjusted in such a way that the description of the exponential growth phase in the experimental curves was optimized.
In addition to the experiments with the fractionated Koopveen soil aggregates, the experimental data of earlier biodegradation experiments with either naphthalene (Fig 9) or phenanthrene (Fig 10) contaminated unfractionated Koopveen peat soil (Volkering, 1996) were fitted with the current mechanistic model. The experiments were conducted in identical serum flasks with identical microorganisms. The above-mentioned kinetic parameters were used for naphthalene degradation by Pseudomonas 8909N and literature data on the kinetic parameters of phenanthrene degradation by Pseudomonas 8803F were used in the calculations (Tab 3; Volkering, 1996). In contrast to the fitting procedure described above, the initial biomass concentration was adapted from earlier calculations (Volkering, 1996).
f CO
(%)
4--
3--
2--
1 -•
o o A
2.0 g 1.0 g 0.5 g
-model (CQ2) residual mass fraction (0.5 g) residual mass fraction (1.0 g)
- residual mass fraction (2.0 g)
--0.8
AA
200000
1
400000
1.0
3 <n El
0.6 a 3 a u> (A
0.4 > & rs **. O
s -•0.2
0.0
600000
t (s)
Figure 9 Modeling of the batch biodegradation by Pseudomonas 8909N of naphthalene desorbing from different amounts (0.5, 1.0, and 2.0 g) of unfractionated peat soil aggregates (experimental data from Volkering, 1996). The residual mass fractions of naphthalene in the aggregates are projected on the right vertical axis.
151

Chapter 6
6 - -
/ CO
(%) 4 --
2 - -
gporca-r i • • •
A 0.5 g O i o g
O 2.0 g
— - - — residual mass fraction (0.5 g) —~ ~~ ^ residual mass fraction (1.0 g)
^ . ^ _ _
1 • • • 1 • ' • 1 ' ' '
•
• -
•
- -1 .0
0.8 3
& - - 0 . 6
•-0.4
s --0.2
0.0
200000 400000 600000
t (S)
800000 1000000
Figure 10 Modeling of the batch biodegradation by Pseudomonas 8803F of phenanthrene desorbing from different amounts (0.5, 1.0, and 2.0 g) of peat soil aggregates (experimental data from Volkering, 1996). The residual mass fractions of phenanthrene in the aggregates are projected on the right vertical axis.
152
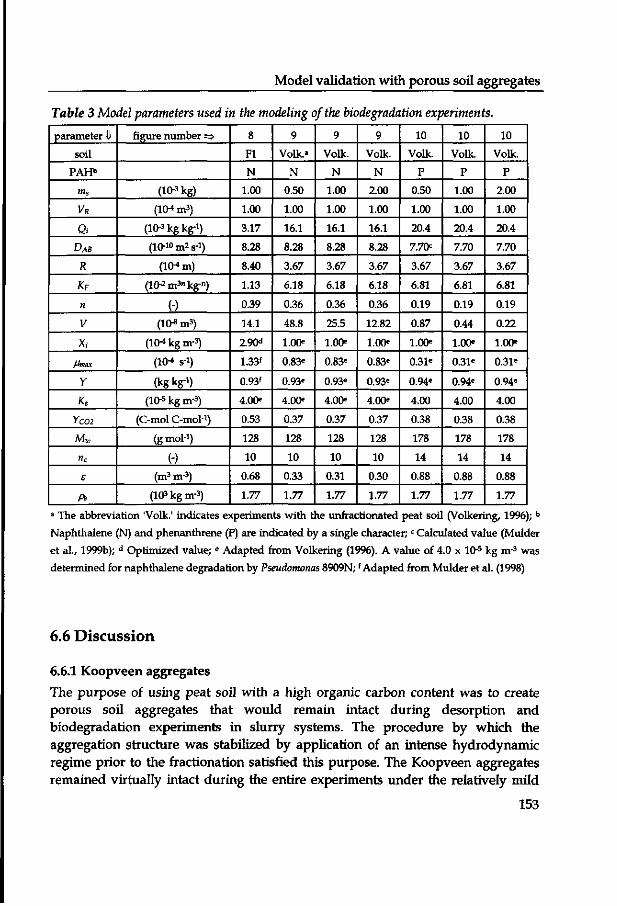
Model validation with porous soil aggregates
Table 3 Model parameters used in the modeling of the biodegradation experiments.
parameter U
soil
PAHb
ms
VR
Qi
DAB
R
Kr
n
V
X,
//max
Y
Ks
YC02
Mw
nc
s
Ps
figure number =>
(10-3 kg)
(10-4 m3)
(KHkgkg-i)
(10-w m2 s-1)
( l (Hm)
(10-2m3"kg-n)
(-) (lO8 m3)
(1(H kg m-3)
(10-4 s-1)
(kgkg-i)
(lO-5 kg m-3)
(C-mol C-moH)
(g moH)
(-) (m3 nr3)
(103 kg m-3)
8
Fl
N
1.00
1.00
3.17
8.28
8.40
1.13
0.39
14.1
2.90"
1.33'
0.93'
4.00*
0.53
128
10
0.68
1.77
9
Volk.»
N
0.50
1.00
16.1
8.28
3.67
6.18
0.36
48.8
1.00=
0.83*
0.93"
4.00*
0.37
128
10
0.33
1.77
9
Volk.
N
1.00
1.00
16.1
8.28
3.67
6.18
0.36
25.5
1.00*
0.83*
0.93*
4.00*
0.37
128
10
0.31
1.77
9
Volk.
N
2.00
1.00
16.1
8.28
3.67
6.18
0.36
12.82
1.00*
0.83*
0.93*
4.00*
0.37
128
10
0.30
1.77
10
Volk.
P
0.50
1.00
20.4
7.70=
3.67
6.81
0.19
0.87
1.00*
0.31*
0.94*
4.00
0.38
178
14
0.88
1.77
10
Volk.
P
1.00
1.00
20.4
7.70
3.67
6.81
0.19
0.44
1.00*
0.31*
0.94*
4.00
0.38
178
14
0.88
1.77
10
Volk.
P
2.00
1.00
20.4
7.70
3.67
6.81
0.19
0.22
1.00*
0.31*
0.94*
4.00
0.38
178
14
0.88
1.77 a The abbreviation 'Volk.' indicates experiments with the unfractionated peat soil (Volkering, 1996); b
Naphthalene (N) and phenanthrene (P) are indicated by a single character;c Calculated value (Mulder
et al„ 1999b); d Optimized value; * Adapted from Volkering (19%). A value of 4.0 x 10⁻⁵ kg nr3 was
determined for naphthalene degradation by Pseudomonas 8909N; 'Adapted from Mulder et al. (1998)
6.6 Discussion
6.6.1 Koopveen aggregates
The purpose of using peat soil with a high organic carbon content was to create porous soil aggregates that would remain intact during desorption and biodegradation experiments in slurry systems. The procedure by which the aggregation structure was stabilized by application of an intense hydrodynamic regime prior to the fractionation satisfied this purpose. The Koopveen aggregates remained virtually intact during the entire experiments under the relatively mild
153
Chapter 6
mixing conditions in the desorption and degradation reactors, compared to the conditions in the stabilizing procedure. However, some attrition occurred and when, for instance, long term experiments with high-molecular weight PAHs will be performed, the decrease in particle diameter might become more important. This was also observed in an alternative contamination procedure, in which the peat soil aggregates were contaminated via the water phase in the presence of either solid naphthalene or solid phenanthrene. In these experiments that lasted for several weeks, significant attrition occurred and the aggregation level decreased.
The contamination procedure that was applied in this work yielded stable aggregates with sufficiently high PAH concentrations (Tab 1), although PAH loadings were higher in earlier experiments with Koopveen peat soil (Volkering, 1996). By determination of sorption isotherms with the contaminated soil material, only an isotherm for naphthalene was obtained. It was observed that phenanthrene concentrations exceeded the maximum water solubility during desorption tests, whereas controls indicated that this effect could not be attributed to partition to dissolved soil organic matter. The phenomenon might be explained by the presence of PAH crystals that were initially bound to the external surface of the particles. The contamination procedure might have resulted in such a situation because of the evaporation of the acetone after decanting of the excess acetone. The sorption isotherm of naphthalene shows strongly nonlinear behavior, and although the sorption coefficient n has a value similar to earlier reports (n = 0.36; Volkering, 1996), the sorption capacity is significantly less. Because of this strong nonlinearity and because of the fact that the organic matter content of the used size fractions is very similar to the organic matter content of the soil used in the earlier tests (organic matter content = 29%; Volkering, 1996), this necessitates a critical interpretation of the results with the soil aggregates. Although it is assumed that the contaminants are present in a sorbed state, there might be a certain fraction that is present as pure solid phase compounds. This was certainly expected for the smaller size fractions of the aggregates produced in this work. The initial loadings result in calculated [Eq (1)] equilibrium dissolved concentrations in the pores of the particles that significantly exceed the maximum solubility (3.17 x 10² kg nr3 for naphthalene). In future work, determination of adsorption isotherms might provide some insight in the validity of the sorption isotherm as determined in this work.
The mineralogical analysis of the largest aggregate fraction (Fi; Fig 2) shows that the soil particles indeed consist of an agglomeration of small primary soil particles (fine sand, silt, and clay). The characterization of the microstructural properties of the Koopveen aggregates indicates the presence of very small pores (<0.5 nm) in the aggregate matrix. This observation is based on the large difference
154

Model validation with porous soil aggregates
between the specific surface areas determined by either nitrogen or carbondioxide gas adsorption (De Jonge and Mittelmeijer-Hazeleger, 1996). The measurement of the nitrogen gas adsorption isotherm is performed at a low temperature (77 K) and the nitrogen molecules are therefore unable to penetrate in pores with diameters smaller than approximately 0.5 nm. However, because the carbondioxide isotherm is measured at relatively much higher temperature (273 K), activated diffusion of the CO2 molecules in these small pores occurs which increases the value of the determined specific surface area (De Jonge and Mittelmeijer-Hazeleger, 1996). Although the microporosities have small values, the presence of such small pores is important because the total surface area is dominated by subnanometer scale pores (De Jonge and Mittelmeijer-Hazeleger, 1996) and the diffusion processes in such pores are very slow. Although the presence of these small pores is associated with the aging of organic hydrophobic soil pollutants or the formation of resistant fractions (Brusseau et a l , 1991; Connaugthon et al., 1993; De Jonge and Mittelmeijer, 1996; Hatzinger and Alexander, 1995), it is assumed that the period of contamination was too short to allow for migration of naphthalene and phenanthrene in these micropores.
6.6.2 Desorption experiments
The results in Figure 4 show that the desorption experiments with naphthalene contaminated peat soil can be described reasonably well with the current mass-transfer model. However, the initial loadings of the two smaller aggregate fractions (F2 and F3) are out of range with the sorption isotherm for this material (Fig 3). Therefore, it is disputable whether the model description of these data is meaningful. For this reason, only the biodegradation data with the largest fraction are modeled. The description of the experimental data with the naphthalene contaminated Koopveen peat soil that was not divided into different size fractions (Volkering, 1996) seems less accurate than the results with the fractionated material (Fig 5). However, the tests with phenanthrene polluted soil are described quite well (Fig 6). The particle internal porosity is used as the single fit parameter in the optimization procedure. This situation is, however, not ideal because this parameter affects the description of the concentration profiles [Eq (2)], the effective diffusion coefficient [Def, Eq (6)], and the volume per particle [V; Eq (10)]. It would be more elegant to determine the value of the porosity independently and use the matrix factor (K) as a fit parameter (Mulder et al., 1999a). Furthermore, the determined porosities differ significantly between the naphthalene and phenanthrene experiments and measurement of the particle porosity could lead to a better insight in the reason for this phenomenon.
155
Chapter 6
6.6.3. Biodegradation experiments The biodegradation of either naphthalene or phenanthrene that was initially sorbed to the fractionated peat soil aggregates (Fig 7) could be followed by CO2 formation for a period of 7 days in the case of naphthalene and for 3 days in the case of phenanthrene. In the latter experiments, a second exponential growth phase was observed which was probably caused by degradation of organic substances released from the soil matrix by Pseudomonas 8803F. In future work, this might necessitate the use of radioactively labeled PAHs. The experimental degradation data obtained with the largest fraction of naphthalene contaminated aggregates were modeled by the desorption-degradation model and the results show an excellent model description (Fig 8). Furthermore, the calculated endpoint of the residual mass of naphthalene of 10% concurs with the experimentally observed value (9%).
However, it is clear from the results in Figure 8 that the mass-transfer limited degradation phase (from t = 3 x 10⁵ s onwards) (Mulder et al, 1999a) is of limited magnitude because over 50% of the initial amount of naphthalene is transformed in the microbiologically limited degradation phase of the experiment ( t = 0 - 3 x 10⁵
s). This is also reflected in the desorption rate which is drastically decreased at the transition point from exponential growth to first order growth (Mulder et al., 1999a). The experiments with the unfractionated Koopveen peat soil showed a more extended mass-transfer limited growth phase (Figs 9 and 10), which is also described excellently by the mathematical model. The calculated residual masses are 16-19% for naphthalene and 38% for the phenanthrene tests. These results are, especially in the case of phenanthrene, in good agreement with the experimentally determined residual fractions of 8-9% and 41-43% respectively (Volkering, 1996).
It is remarkable how well the biodegradation data are described on the basis of the few desorption tests performed. Especially considering the rather poor fit of the naphthalene desorption tests in Figure 5. The power of the current model lies in the mechanistic description of sorption equilibrium, mass transfer to the bulk liquid and biodegradation processes. The description of the experimental desorption and biodegradation data obtained with the unfractionated soil according to a two-compartment model (Volkering, 1996) yielded comparable agreement between model calculations and experimental data. However, the applicability of such a model for predictions concerning the fate of other hydrophobic pollutants in other soil material is limited due to its empirical basis. The current model allows for the independent quantification of the model parameters and can, therefore, be used to gain more insight in the processes that determine the limited bioavailability of soil pollutants.
156

Model validation with porous soil aggregates
6.7 Conclusions
The purpose of this study was to validate the mechanistic desorption-biodegradation model developed in earlier work (Mulder et al., 1999a) with real soil material. The stabilization of the aggregation structure by applying different hydrodynamic regimes is an elegant method to obtain well-defined aggregates with a restricted size. Contamination of the aggregates with naphthalene and phenanthrene by adsorption via a water phase is preferred instead of the acetone procedure applied in this study and earlier work (Volkering, 1996). Although the contamination will then take a longer period, oversaturation of the liquid phase with solid PAH can be prevented.
The model that incorporates sorption, mass transfer and biological transformation of PAHs in porous soil material can adequately describe the fate of naphthalene and phenanthrene in the peat soil aggregates. It is the challenge of future work to explore the applicability of this model to other soil types. Incorporation of long-term diffusion processes might be necessary to describe the transport through the micropores that have been identified by the microstructural analysis. Macroscale and microscale characterization of the material and the independent quantification of the model parameters are important issues that have to be considered before applying this type of modeling. Although this implies that considerable research efforts are involved, more insight is gained into the mechanisms that determine the limited bioavailability of PAHs in soil compared to the use of empirical models.
Acknowledgments
Mrs. Marjo Mittelmeijer from the Department of Chemical technology of the University of Amsterdam is gratefully acknowledged for the characterization of the microporous structure of the soil.
157

Chapter 6
Nomenclature A C G, G dp
DAB
Deff
Jco,
KF
Ks
ms
Mw
n nc
N P
Q Qt r R Rg
t T V Vh
VR
X Xi Y Y 1co,
particle external surface area dissolved naphthalene concentration in particle concentrations in the bulk liquid initial dissolved naphthalene concentration particle diameter binary diffusion coefficient of the PAH in water effective diffusion coefficient volumetric percentage of CO2 in the headspace
Freundlich sorption coefficient Monod constant dry weight of the particles molecular weight dimensionless constant number of carbon atoms per PAH molecule mass flux to the bulk liquid pressure sorbed phase concentration initial sorbed phase concentration distance from the center of the particle radius of the particle gas constant time temperature volume of the liquid phase per particle headspace volume volume of liquid in the reactor biomass concentration initial biomass concentration biomass yield of the bacteria carbondioxide yield of the bacteria
Greek symbols
fraction of CO2 present in the headspace particle volumetric porosity dimensionless matrix factor growth rate of the bacteria maximum growth rate of the bacteria skeletal density of the solid phase
£
K
M fJmax
Ps
158
in*) kg nv3) kg nr3) kg nr3) m) m2 s-1) m2 s-1) %)
m3n kg-n)
kg nr3) kg) g mol1)
) -) kg nr2 s1) Pa) kgkg-i) kgkg-i) m) m) J mol1 K-i) !s) K) m3) in3) m3) kg nr3) kg nr3) kgkg-i) C-mol C-mol1)
:-) m3 m3)
) s-i)
s-i)
kgm3)
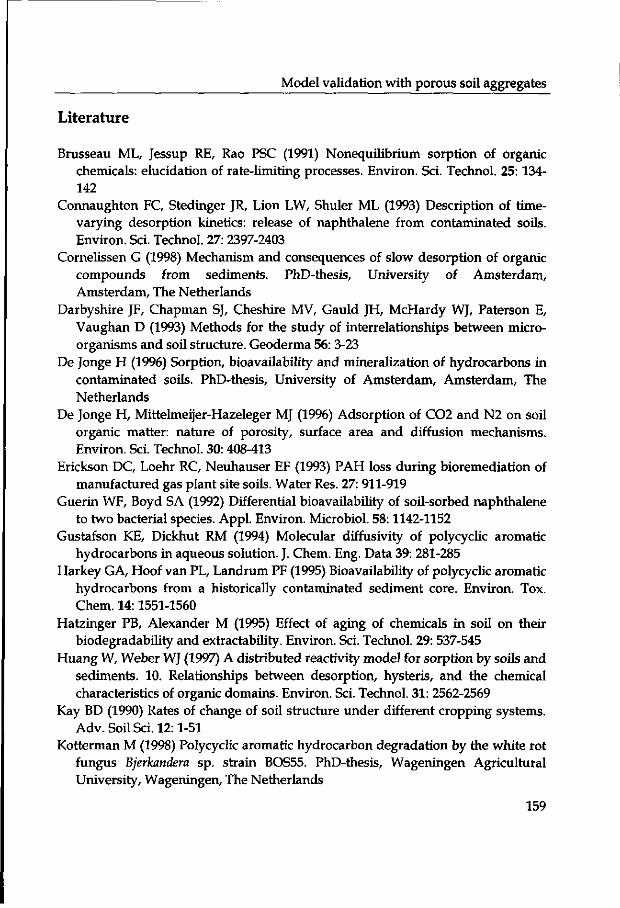
Model validation with porous soil aggregates
Literature
Brusseau ML, Jessup RE, Rao PSC (1991) Nonequilibrium sorption of organic chemicals: elucidation of rate-limiting processes. Environ. Sci. Technol. 25: 134-142
Connaughton FC, Stedinger JR, Lion LW, Shuler ML (1993) Description of time-varying desorption kinetics: release of naphthalene from contaminated soils. Environ. Sci. Technol. 27: 2397-2403
Cornelissen G (1998) Mechanism and consequences of slow desorption of organic compounds from sediments. PhD-thesis, University of Amsterdam, Amsterdam, The Netherlands
Darbyshire JF, Chapman SJ, Cheshire MV, Gauld JH, McHardy WJ, Paterson E, Vaughan D (1993) Methods for the study of interrelationships between microorganisms and soil structure. Geoderma 56: 3-23
De Jonge H (1996) Sorption, bioavailability and mineralization of hydrocarbons in contaminated soils. PhD-thesis, University of Amsterdam, Amsterdam, The Netherlands
De Jonge H, Mittelmeijer-Hazeleger MJ (1996) Adsorption of C02 and N2 on soil organic matter: nature of porosity, surface area and diffusion mechanisms. Environ. Sci. Technol. 30: 408-413
Erickson DC, Loehr RC, Neuhauser EF (1993) PAH loss during bioremediation of manufactured gas plant site soils. Water Res. 27: 911-919
Guerin WF, Boyd SA (1992) Differential bioavailability of soil-sorbed naphthalene to two bacterial species. Appl. Environ. Microbiol. 58:1142-1152
Gustafson KE, Dickhut RM (1994) Molecular diffusivity of polycyclic aromatic hydrocarbons in aqueous solution. J. Chem. Eng. Data 39: 281-285
Harkey GA, Hoof van PL, Landrum PF (1995) Bioavailability of polycyclic aromatic hydrocarbons from a historically contaminated sediment core. Environ. Tox. Chem. 14:1551-1560
Hatzinger PB, Alexander M (1995) Effect of aging of chemicals in soil on their biodegradability and extractability. Environ. Sci. Technol. 29: 537-545
Huang W, Weber WJ (1997) A distributed reactivity model for sorption by soils and sediments. 10. Relationships between desorption, hysteris, and the chemical characteristics of organic domains. Environ. Sci. Technol. 31: 2562-2569
Kay BD (1990) Rates of change of soil structure under different cropping systems. Adv. Soil Sci. 12:1-51
Kotterman M (1998) Polycyclic aromatic hydrocarbon degradation by the white rot fungus Bjerkandera sp. strain BOS55. PhD-thesis, Wageningen Agricultural University, Wageningen, The Netherlands
159

Chapter 6
Lagas P, Van der Berg S, Van Dordrecht P, Mesters-Bakhuys H (1986) Voorschriften voor bodemanalyse. RrVM rapport nr. 847221001. RIVM, Bilthoven, The Netherlands
Luthy RG, Dzombak DA, Peters CA, Roy SB, Ramaswami A, Nakles DV, Nott BR (1994) Remediating tar-contaminated soils at manufactured gas plant sites. Environ. Sri. Technol. 28: 266-276
Mulder H, Breure AM, Van Andel JG, Grotenhuis JTC, Rulkens WH (1998) Influence of hydrodynamic conditions on naphthalene dissolution and subsequent biodegradation. Biotechnol. Bioeng. 57:145-154
Mulder H, Breure AM, Rulkens WH (1999a) Effect of mass-transfer limitations on the bioavailability of sorbed naphthalene in artificial soil aggregates, submitted for publication.
Mulder H, Breure AM, Rulkens WH (1999b) Prediction of bioremediation periods for PAH soil pollutants in different physical states by mechanistic models. submitted for publication.
Press WH, Teukolsky SA, Vetterling WT, Flannery BP (1992) Numerical recipes in Fortran: The art of scientific computing, 2nd edition. Cambridge University Press, Cambridge, UK
Scow KM, Alexander M (1992) Effect of diffusion on the kinetics of biodegradation: experimental results with synthetic aggregates. Soil Sri. Soc. Am. J. 56:128-134
Smith JM, Van Ness HC (1987) Introduction to chemical engineering thermodynamics. 4th ed. McGraw-Hill, New York
Van Brakel J, Heertjes PM (1974) Analysis of diffusion in macroporous media in terms of a porosity, a tortuosity and a constrictivity factor. Int. J. Heat. Mass Transfer 17:1093-1103
Volkering F (1996) Bioavailability and biodegradation of polycyclic aromatic hydrocarbons. PhD-Thesis, Agricultural University of Wageningen, Wageningen, The Netherlands
Waters AG, Oades JM (1991) Organic matter in water-stable aggregates, in: Adv. Soil Organic Matter Res, ed.: WS Wilson, R. Soc. Chem., Cambridge, pp. 163-174
Weissenfels WD, Klewer HJ, Langhoff J (1992) Adsorption of polycyclic aromatic hydrocarbons (PAHs) by soil particles: influence on biodegradability and biotoxicity. Appl. Microbiol. Biotechnol. 36: 689-696
Wu S, Gschwend PM (1986) Sorption kinetics of hydrophobic organic compounds to natural sediments and soils. Environ. Sri. Technol. 20: 717-725
160

CHAPTER 7
Prediction of bioremediation periods for PAH soil pollutants in different physical states by mechanistic models"
7.1 Abstract
Mass-transfer models and biodegradation models were developed for three theoretical physical states of PAHs in soil. These mechanistic models were used to calculate the treatment periods necessary for complete removal of the PAH pollutants from the soil under batch conditions. Results indicate that the bioremediation of PAHs in such systems is mainly mass-transfer limited. The potential for bioremediation as a treatment technique for PAH contaminated soils is therefore mainly determined by the mass-transfer dynamics of PAHs. Under mass-transfer limited conditions simplified mathematical models, based on the assumption of a zero dissolved PAH concentrations, can be used to predict the period of time needed for complete bioremediation.
* H Mulder, AM Breure, WH Rulkens. submitted for publication.

Chapter 7
7.2 Introduction
The physical states in which polycyclic aromatic hydrocarbons (PAHs) are present in soil mainly determine the potential of remediation techniques. It must be analyzed whether the mobility requirements of possible remediation techniques can be met in and by the physical status of the contaminant in the soil matrix (Rulkens and Bruning, 1995).
Bioremediation is a clean-up technology that was initially presumed to have great potential, but it became evident that just like the physical and chemical treatment techniques for polluted soil, biological methods had their disadvantages. Long treatment periods and high residual concentrations were the main problems. This is especially true for PAH-polluted soil. Because of their hydrophobicity and low water solubilities, PAHs strongly interact with the soil matrix and can even form separate phases. Microorganisms can only degrade dissolved PAHs and so they have to be released from the solid phase to an aqueous phase in which they are available. As a result of low mass-transfer rates in the soil matrix, this release is often limiting the effectiveness of bioremediation and we speak of a reduced bioavailability of the pollutants causing the reduced effectiveness.
On a theoretical basis, several simplified states of PAHs in soil have been suggested (Fig 1) and mass-transfer models are formulated to describe the release of PAHs from these different states to obtain an estimated time in which the PAHs concentration can be reduced by leaching processes (Rulkens and Bruning, 1995). The same procedure can be applied to bioremediation processes when microbial kinetics are incorporated into these models. Mathematical simulations of the combined mass transfer and microbiological conversion indicate the time needed to reduce the concentrations of the different PAHs to certain levels. Hereby, the potential of bioremediation can be estimated and decisions can be made whether or
I
i \ ^
"' • •J . 1
b 1 1
Figure 1 Schematic presentation of three proposed physical states of PAHs in soil particles and mathematical parameters. Solid phase PAH as: pure particle (I), pure solid in a pore (II) and sorbed into a soil aggregate (III).
162

Effect of physical states on PAH bioavailability
Table 1 Physicochemical properties (at 30°C)
naphthalene
acenaphtylene
fluorene
phenanthrene
anthracene
pyrene
fluoranthene
chrysene
(g mol)
128
152
166
178
178
202
202
228
density W
(103x kg nv3)
1.03
0.899
1.20
0.980
1.28
1.27
1.25
1.27
of some PAHs.
DAB<2>
(10-10x mV1)
9.31
8.35
7.88
7.70
7.70
7.05
6.90
6.44
C*<3>
(kg nv3)
0.0317
0.00393
0.00198
0.00129
0.000073
0.000135
0.00026
0.000002
logK^P)
(-) 3.37
4.07
4.18
4.46
4.45
5.32
5.33
5.61
(D adapted from Weast (1974); <2> calculated values (Bird et al., 1960); »> adapted from Sims and
Overcash (1983).
not bioremediation should be attempted. The aim of this paper is to translate the theoretical considerations concerning
the mass transfer of hydrophobic pollutants in different physical states in the soil to the situation where micro-organisms can degrade the contaminants. The effect of several model parameters on the availability of pollutants towards microbial populations is illustrated with the results of mathematical simulations with model PAHs.
7.3 Physicochemical properties of PAHs
Polycyclic aromatic hydrocarbons are extremely hydrophobic compounds due to the absence of polar groups on the molecules. This results in very low water-solubilities and high octanol-water partitioning coefficients (Tab 1). Besides the solubility (C*) and the octanol-water partitioning coefficient (Kow), there is little difference in the values of the other physicochemical properties of the PAH listed in Table 1. Because diffusion coefficients depend mainly on the molar volume of the diffusing solute (Bird et al., 1960), the decrease of the diffusion coefficient with an increased number of aromatic rings is relatively small. Due to their hydrophobic nature, PAH have high solubilities in hydrophobic organic solvents. Because emissions of PAHs are often accompanied by spills of non-aqueous-phase-liquids, this is of importance for the physical state in which PAHs are present in the soil (Ghoshal and Luthy, 1998).
163

Chapter 7
7.4 Physical states of pollutants
In an earlier study on the effect of physical states of soil pollutants on the remediation potential of physical separation processes (Rulkens and Bruning, 1995), 6 simplified physical states for soil contaminants were proposed on a theoretical basis. In this work, three of these states (Fig 1) are further analyzed as far as the influence on the bioavailability and bioremediation potential is concerned.
For simplicity sake, only one-component PAH contamination is considered. The presence of non-aqueous-phase-liquids, which were mentioned before is neglected. However, with the methodology followed in this study, such systems can also be described by incorporating for instance the partitioning of PAHs into an organic phase. The considered physical states are: solid PAH particles, PAHs which have formed pure solid phases in the pores of porous soil aggregates and PAHs that are intraparrically sorbed to soil organic matter. The first two states are likely to be found in heavily contaminated situations (hot-spots), whereas the latter state is probable when diffusive emissions occurred.
7.5 Mathematical models
In this section, three mass-transfer models are presented to describe the fluxes of the contaminant from polluted particles to the bulk aqueous phase in which biodegradation is possible. These models are based on a mathematical description of microbial degradation kinetics and of mechanistic processes, using data on the physicochemical properties of the contaminant and the porous soil matrix (e.g. situations II and III, Fig 1). The models describe the flux of contaminant from the spherical polluted particles to the bulk liquid and the loss of pollutant from these particles and the biodegradation. The decrease in degree of contamination can therefore be calculated as a function of time.
7.5.1 Microbial growth and degradation kinetics
The growth of biomass on the contaminant dissolved in the bulk liquid phase can be described according to Monod kinetics. The growth rate is than expressed as a function of the maximal growth rate, the Monod constant and the dissolved PAH concentration in the bulk liquid phase:
164

Effect of physical states on PAH bioavailability
M = Vn,ax r * CO
where // is the growth rate (s-1), fhmx the maximum growth rate (s-1), Ks the Monod constant (kg nr3), and C& the dissolved PAH concentration in the bulk liquid phase. The development of the specific organisms growing on the dissolved PAH in time can be described by:
~ l ^ (2)
at
with:
X = X, at: f = 0 I.C. (3) where t is time (s), X the biomass concentration in the bulk liquid (kg nr3), and X; the initial biomass concentration (kg nr3). When the dissolved PAH concentration is high compared to the affinity constant, the biomass concentration increases exponentially in time due to zero order kinetics. When the PAH concentration is low compared to Ks [Eq (1)], first order kinetics are observed. The degradation of dissolved PAHs is coupled to biomass growth by the yield coefficient. In the case that there is no supply of PAHs from the soil to the liquid this gives:
^ = _ 1 ^ L = _ ^ £ (4) At Y At Y K '
where Y is the yield coefficient (kg kg-1). When there is a supply of dissolved PAHs to the bulk liquid by dissolution or desorption, an additional term describing this mass transfer must be incorporated in Equation (4). In this model for biodegradation of contaminants by specific populations, the growth of the microorganisms on other carbon sources is neglected for sake of simplicity.
7.5.2 Dissolution of solid PAH particles and subsequent biodegradation
The dissolution of PAHs particles in a well-mixed bulk liquid phase can be described by simple mass-transfer equations (Rulkens and Bruning, 1995). The flux of a PAH to the bulk liquid phase is described by:
N = k{C*-Cb) (5)
165

Chapter 7
where N is the flux of the dissolved PAH over a stagnant fluid layer at the solid-liquid interface (kg nr2 s1), k the mass-transfer coefficient (m s1), and C* the solubility of the PAH (kg nr3). The mass-transfer coefficient k depends on hydrodynamic conditions and for small particles or large particles at low relative velocities, the value of this parameter can be approximated by (Rulkens and Bruning, 1995):
Jt = ^ L ( 6 )
R V ;
where DAB is the diffusion coefficient of the PAH in water (m2 s1), and R is the radius of the PAH particle (m). The decrease in the particle radius in time can be expressed by:
^L = _ ^ L ( C * - Q ) (7) dt pRy h' W
with:
R = Ri at: f = 0 I.C. (8)
where p is the density of the PAH particle (kg nr3) and Rt the initial radius of the particle (m). A mass balance for one dissolving PAH particle with subsequent biodegradation in a space element with a volume of V (m3) is used to describe the evolution of the dissolved bulk PAH concentration in time:
it V v "' Y v '
with:
G = 0 at: f = 0 I.C. (10)
When the dissolved PAH concentration (Q,) is zero, the following expression can be obtained from Equation (7) for the period (r) that is necessary to achieve a 99% reduction of the original PAH volume (Rulkens and Bruning, 1995):
095 pR] r = — - (11)
2DABC* V ;
166

Effect of physical states on PAH bioavailability
7.5.3 Dissolution of PAH from filled pores and subsequent biodegradation
In the case of pure solid-phase contaminant located in the pores of a soil particle (Fig 1; state II), the dissolution of PAHs from these pores to the bulk liquid phase can be described with the 'shrinking-core model'. In this model, the contaminant front located at Rcf moves inwards as a result of the compound flux to the bulk. Assuming pseudo-steady-state conditions, the total mass flux of pollutant through the pores between Rcf and R0 to the solid-liquid interface can be described by:
NT=-4xr2Deff^ Rc/<r<R„ (12) " dr
where r is the coordinate in the direction of transport (m), Nr the total mass flux (kg s1), Deff the effective diffusion coefficient through the water filled section of the pores (m2 s1), RCf the location of the contaminant front (m), R0 the radius of the particle (m), and C the dissolved PAH concentration in the pores (kg nr3). Several emperical, semi-empirical, and theoretical relations that describe the influence of pore geometry (pore tortuosity and constrictivity) on effective diffusion coefficients have been reported in literature (Van Brakel and Heertjes, 1974; Wu and Gschwend, 1986). In this work, the effective diffusion coefficient is expressed as a function of the aggregate porosity (e) and the diffusion coefficient of the PAH in water (DAB) (Van Brakel and Heertjes, 1974):
Deff=066sDAB (13)
Where E is the particle porosity (m3 nr3). Equation (12) can be integrated between RCf and R0 assuming that Nr is constant due to the pseudo-steady-state conditions. The total mass flux from the particle solid-liquid interface to the bulk liquid can also be described by:
NT=4xsR20k(cR -Cb) (14)
where k is defined in Equation (6) and CR is the dissolved PAH concentration at
the surface of the particle (kg nr3). Elimination of CR , by using the integrated
Equations (12) and (14), yields the following expression for the total mass flux to the bulk liquid:
167

Chapter 7
NT = InRie Dfirk
°—^—{c*-cb) D#+(lt-k)R°£k (15)
The change of the location of the contaminant front as a function of time can be formulated by:
dRcf
dt
with:
Rcf = Ro
PK
at:
Rl ^k
D^+(^-i)R'£k
t = 0
T ( C * - Q )
I.C.
(16)
(17)
The concentration in the bulk liquid phase is described by an equation that follows from a mass balance:
dt V
tosRlDJ . ( c . _ C t ) _ / * D€+(i7-^ek
with:
Cb = 0 at: t = 0 i.e.
(18)
(19)
The period (r) necessary to degrade 99% of the pollutant from relatively large particles (k » Deff/Ro) at a zero dissolved bulk-liquid PAH concentration can be deduced from Equation (16):
T = • 098psR2
o
6DeffC* (20)
7.5.4 Desorption from porous particles and subsequent biodegradation
Concentration profiles in porous particles, of radius R0, with intrapartically sorbed PAHs can be described with the following partial differential equation (Mulder et al , 1997; Mulder et al., 1999; Wu and Gschwend, 1986):
dC
dt
168
D e #
e + (l-e)p,K
d2C 2 dC
dr1 r dr 0<r<Ro (21)

Effect of physical states on PAH bioavailability
with:
— = 0 at: r = 0 B.C. (22) dr
C = Cb at: r = Rc B.C. (23)
C = Q for: 0<r<RB, and: G = 0 at:f = 0 I.C. (24)
where ps is the solid matrix density. The effective diffusion coefficient is defined by Equation (13). The sorption coefficient K describes the linear partitioning of the pollutant over the solid and liquid phase:
Q = KC (25)
where Q is the concentration of the sorbed pollutant in the solid phase which is in local equilibrium with the dissolved concentration. The sorption coefficient of hydrophobic compounds like PAHs can be related to the fraction organic carbon (foe) in the soil matrix and the organic carbon partition coefficient (Koc), by (Karickhoffetal.,1979):
K = &&&- (26) WOO v ;
where foc is the organic carbon fraction in the soil and Kx the organic carbon partition coefficient (L kg-1). The organic carbon partition coefficient can be correlated to the octanol-water partition coefficient by emperical relations similar to the following (Chiou et al., 1998; Karickhoff et al., 1979):
logKoc=logKm,-021 (27)
where Km, is the octanol-water partition coefficient. Often, an overall effective diffusion coefficient is defined (Ball and Roberts, 1991; Mulder et al., 1999; Wu and Gschwend, 1986), which includes the sorption term in Equation (21):
D° = ^ (28) e# e + (l-e)p,K K '
where D°eff is the overall effective diffusion coefficient (m2 s_1). The flux of the
169

Chapter 7
dissolved PAH at the surface of the porous particle to the liquid phase can be described by the following expression:
dC (29)
r=K
where Ns is the mass flux from the particle (kg nr2 s1). It is assumed that external mass-transfer resistances are negligible. Analogous to the two earlier models, the evolution of the dissolved bulk PAH concentration can be described by a mass balance incorporating the flux of the pollutant to the bulk liquid (of volume V per particle) and the degradation by microorganisms:
dCb _ 4xR20Ns yX
At V Y (M)
with:
G = 0 at: t = 0 I.C (31)
At high values for the Fourier number (Fo > 0.02) and a constant zero bulk-liquid PAH concentration, the ratio between the mean contaminant concentration (C) and the initial concentration (C) can be calculated by (Crank, 1975):
7 r = - r £ - T e * ; (32)
with:
F° = -£- (33)
The period that is necessary to remove 99% percent of the pollutant from a relatively large porous particle can than be evaluated from:
0.42R2
T = ~D7^ (34)
170

Effect of physical states on PAH bioavailability
7.5.5 Numerical approximation
The models described in the previous sections cannot be solved analytically due to the nonlinearity of the coupled (partial) differential equations [Eqs (2), (7), (9), (16), (18), (21), and (30)]. However, these equations can be numerically integrated to calculate the development of the variables (R, Rc/, Q>, X) in time on the basis of the initial conditions. For the first two models, a fourth-order Runge-Kutta routine was programmed in FORTRAN to calculate the values of the model variables as a function of time (Press et al., 1992). The third model was solved numerically with the appropriate boundary conditions, using a Crank-Nicholson scheme (Press et al., 1992) programmed in a FORTRAN routine.
7.6 Results and discussion
7.6.1 Biodegradation of PAH particles
When PAH pollutants have formed separate solid particles in the soil, the radius of the PAH particle and the solubility of the PAHs determine the time needed for the nearly complete dissolution (99%) of the particle at a maximum driving force for dissolution (Rulkens and Bruning, 1995). It was expected that these factors also determine the potential of bioremediation and several mathematical simulations were performed to study this effect (Fig 2). In these simulations, PAH concentrations of 1000 mg kg-1 dry weight of soil and slurry concentrations of 1:10 (m3 soil)(m3 aqueous phase)1 were assumed. The microbiological parameters were optimized so mass-transfer limited biodegradation was assured. Values of maximum growth rates varied between 1.3 x 10⁻⁴ s1 for naphtalene and 1.0 x 10⁻⁵ s1
for phenanthrene degradation respectively, which are feasible values (Boldrin et al , 1993; Keuth and Rehm, 1991; Mulder et al., 1998; Volkering, 1996). Due to the lack of literature data, the value for the Monod constant is assumed to be a factor hunderd less than the solubility of the PAH under consideration. The yield was assumed to be 0.5 kg kg-1 which is a common value for microorganisms that can use the PAH as sole source of energy and carbon (Volkering et al., 1996). The values in Table 1 are used for the physical properties of the PAHs (density, solubility, and diffusion coefficient).
171

Chapter 7
g 13 V 4-a> re 3 re
SI
re 3 B>
13 3" ^ re 3 re
a c o
s 3 re
Figure 2 Influence of initial particle radius (Ri) and compound properties on the period needed for complete biodegradation (r).
Results (Fig 2) show that, indeed, the particle radius of the PAHs is of great effect on the period (z) that is required for 99% biodegradation of the contaminant. Because the microbiological kinetics were optimized, dissolved aqueous-phase concentrations were very low during degradation of the particles. Therefore, the times calculated for complete degradation of the pollutants by bacteria are the same to the dissolution times calculated in earlier work (Rulkens and Bruning, 1995) [Eq (11)].
However, to assure mass-transfer limited growth conditions, certain microbiological conditions must be met. This is illustrated with Figure 3 where the effect of the maximal growth rate and the initial biomass concentration was determined in calculations on the biodegradation of a naphthalene particle. Here, a value for the Monod constant (4.0 x 10s kg nr3) was used from literature (Volkering et al., 1992) and the yield was assumed to be 0.5 kg kg-1. The upper value for the maximum growth rate (1.3 x 10"4 s-1) was experimentally determined (Mulder et al., 1998) and the upper value of the inoculum size (1.0 x 101 kg nv3) is a feasible bacterial density. The plateau in the value of x (Fig 3) shows that an increase of microbiological capacity (maximal growth rate, initial biomass concentration), does not necessarily results in a shorter treatment period. In fact, this plateau indicates that the removal of PAH was mainly mass-transfer limited instead of microbiologically limited. From the development of the biomass in time
172

Effect of physical states on PAH bioavailability
Figure 3 Effect of maximal growth rate (fJmax) and initial biomass concentration (Xi) on the period needed for complete biodegradation (T) of a 100 fjm naphthalene particle.
(data not shown), it could be seen that the period necessary to build up sufficient biodegradation capacity increased with a decreasing inoculum size and a decreasing maximum growth rate.
7.6.2 Biodegradation of PAH dissolving from filled pores
Simulations in which microbial conditions were optimized, similar to those described in the previous section, were performed with the snrinking-core model. Where justified, values for the model parameters (degree of contamination, maximum growth rate, yield, Monod constant) were identical to those used to contract Figure 2. In contrast to the first model, external mass-transfer limitations are negligible in the calculation with the shrinking-core model. The results indicate that treatment periods for both physical states are similarly affected by particle radius and compound properties. This agrees with calculations performed on the mass-transfer dynamics in these two different systems (Rulkens and Bruning, 1995) [Eqs (11) and (20)]. Only the effect of the pore geometry on the effective diffusion coefficient [Eq (13)] results in longer treatment periods for PAH located in the pores of porous particles compared to particulate PAHs.
173

Chapter 7
Cb,X
(10'3kgm-3)
250-
200-
150-
100-
50-
01
T ili^z-J*^
*V ^V
••^-AXttflftifti i i if l ibA^A^w^vwwww i3kwwww ly^|^<A-^---*--
r b
- 4
- 3
- 2
- 1
- 0
(10-4 m)
10 15 20 25 30
t (105s)
Figure 4 Effect of particle radius (250 [closed symbols] or 500 [open symbols] fm) on the batch biodegradation of naphthalene, dissolving from the pores of a soil particle: development of bulk biomass (X; circles) and dissolved naphthalene (Cb; diamonds) concentrations and the contaminant front (Rcf, triangles) in time.
Experimental work on the influence of mass transfer on the biodegradation and bioavailability of PAHs has been done earlier for solid state PAHs (Mulder et al., 1998; Volkering, 1996; Volkering et al., 1992) and sorbed PAHs in porous matrices (Mulder et al , 1997; Mulder et al., 1999; Volkering, 1996). In these studies, the effect of the physical states of PAHs on the development of dissolved PAH and biomass concentrations were measured and modeled. It was shown that the models could predict the biodegradation and mass-transfer processes in well-defined experimental systems that were designed to mimic the physical states of PAH pollutants in the two situations. However, such experiments have not been performed on the system in which pores of porous particles are filled with solid-phase PAH. Therefore, we have now calculated the evolution in time of the contaminant front, the biomass and dissolved PAH concentration for the batch degradation of solid-phase naphthalene located in the pores (e = 0.05) of a 250 nm or a 500 nm soil particle at a high external mass-transfer coefficient (k » Deff/R0) (Fig
174

Effect of physical states on PAH bioavailability
4). Here, a solid to liquid ratio of 1:100 (m3 soil) (m3 aqueous phase)1 was assumed and, initially, the pores of the soil aggregate were completely filled with the pollutant.
To illustrate the phenomena that occur when the biodegradation is subsequently microbiologically limited and mass-transfer limited, a maximum growth rate of 1.3 x 10 5 s_1 was used in combination with a low initial biomass concentration (1.0 x 10⁻⁴ kg nr3). The yield was again 0.5 kg kg-1 and the Monod constant was a factor hunderd less than the naphthalene solubility (3.17 x 10⁻⁴ kg nr3). The results in Figure 4 are very similar to experimental findings with respect to the biodegradation of pure solid-phase PAHs (Mulder et a l , 1998; Volkering, 1996). In such batch experiments an initial microbiologically limited degradation phase was observed with relatively high dissolved PAH concentrations. Thereafter, the biodegradation capacity exceeds the mass-transfer rate due to the increased biomass concentration. At the transition point between reaction and mass-transfer limited biodegradation, the dissolved PAH concentration becomes very low and the driving force for mass transfer from the particle to the bulk liquid is maximized. Although the dissolved PAH concentration is very low during the mass-transfer limited degradation phase, the biomass concentration still increases due to the partial conversion of contaminant to biomass. The maximization of the driving force for mass transfer by reducing the dissolved PAH concentration to a very low value from the transition point onwards results in great similarity between treatment periods calculated on the basis of mass-transfer models solely (Rulkens and Bruning, 1995).
7.6.3 Biodegradation of PAH desorbed from porous particles
When PAHs are sorbed into porous particles, the description of the flux of the desorbed contaminant to the bulk liquid becomes somewhat more complicated compared to the other two systems with solid-phase PAHs. To investigate whether the simple mass-transfer models in a earlier study (Rulkens and Bruning, 1995) [Eq (34)] are also valid to indicate the period needed for complete bioremediation of such contaminated soils, simulations were performed with the biodegradation-desorption model presented. Sorption coeffients (K) were calculated on the basis of an organic carbon content of 5% (foe = 0.05) and by application of Equations (26) and (27). A solid-phase density of 2.0 x 10³ kg nr3 was used. Overall effective diffusion coefficients were calculated on the basis of Equation (13) and external mass transfer was neglected (k » Dejf/Ro)- As a result of the sorption term in Equation (28), overall effective diffusion coefficients were significantly lower than the effective diffusion coefficients and varied from 1.6 x 10'13 m2 s 1 to 1.6 x 10¹⁴ m2
s1 . These values are in agreement with literature data on overall effective diffusion
175

Chapter 7
coefficients of hydrophobic compounds in soil aggregates (Chung et al., 1993; Rijnaarts et al., 1990; Wu and Gschwend, 1986). Again, the maximum growth rate of the naphthalene degrading organisms was assumed to be 1.33 x 10"4 s'1 and Monod constant was 4.0 x 10-* kg nr3 (Volkering et al., 1992). The initial biomass concentration was 1.0 x lfr4 kg nr3 and a yield of 0.5 kg kg-1 was assumed. A solid to liquid ratio of 1:100 (m3 soil) (m3 aqueous phase)-1 was assumed with a soil solid density of 2.0 x 10³ kg nr3. Results show (Fig 5) that simple mass-transfer models (Rulkens and Bruning, 1995) [Eq (34)] can adequately predict the period of time needed to lower the total PAH concentration in the particle to a level of 1 % of the initial amount.
20.0
r (s)
•- 15.0
•- 10.0
(1014 mV1)
K (m'kgT1)
Figure 5 Period (r) needed for 99% naphthalene removal from porous particles of different radii (Ro) [R0 = 50 /jm (circles); R0 = 100 /jm (squares); R0 - 250 pm (diamonds); R0 = 500 /jm (triangles)] and sorption coefficients (K). Drawn lines are calculations with simple mass-transfer relations [Eq (34)] and represent the shortest periods needed for 99% removal with a maximum driving force for mass transfer. Overall effective diffusion coefficients (crosses) are plotted on the right y-axis.
176

Effect of physical states on PAH bioavailability
s
u
s 8
as
•*••»
Si
100
80
60
40 -
20 -
101
> ' , . "<*
\
1
• acenaphtylene
• fluorene
—A—phenanthrene
11 III
ll J
\
\ 1
'11
t' HI
1 10" 10J 104
t (s)
10* 10" 10'
Figure 6 Model calculations predicting the batch biodegradation of four PAHs sorbed to porous soil particles (e = 0.05, R0 = 200jum) with optimized microbial conditions. Overall diffusion coeffients were calculated according to the data in Table 1 and Equations (13), (26), (27), and (28), assuming an organic carbon content of 5%.
Under mass-transfer limited biodegradation conditions, an increase of PAH sorption (K) or the particle radius (R„) significantly increases the period needed for complete removal of the PAHs. Because the sorption to hydrophobic material increases significantly with increasing PAH molecular weight (Tab 1), relatively longer bioremediation periods are needed for removal of the high-molecular weight PAHs (Fig 6). The overall effective diffusion coefficients (e = 0.05, foe - 0.05) were calculated with Equations (13), (26), (27), and (28) and were: 2.24 x 10 " n^s1 , 4.00 x 10¹⁴ m2 s1, 2.93 x 10¹⁴ m2 s1, and 1.50 x 10⁻¹⁴ m2 s-1 for naphthalene, acenaphtylene, fluorene, and phenanthrene respectively. Again, a solid to liquid ratio of 1:100 (m3 soil) (m3 aqueous phase)-1 was assumed with a soil solid density of 2.0 x 10³ kg nr3. Yield coefficients were 0.5 kg kg-1, maximum growth rates were 1.33 x 10⁵ s1, the initial biomass concentration was 1.0 x 10^ kgnv3 and the Monod constants were assumed to be a factor hunderd less than the solubility of the PAH under consideration.
177

Chapter 7
It is shown in this theoretical study that mass-transfer models can be used to predict the period needed to achieve a certain degree of PAH removal from soil by bioremediation. However, the biological degradation capacity must be sufficient to obtain mass-transfer limited degradation of the contaminant. When this is the case, removal rates of PAHs are dictated by mass-transfer processes. In model calculations on three different physical states of PAHs in soil matrices, the influence of key mass-transfer parameters on the period needed for 99% PAH removal by bioremediation was investigated. During the simulation of the degradation of the high-molecular weight PAHs, low values were required for the microbiological parameters (Y, fhnax, Ks). Since these calculations have been made on model systems with one component and one set of microbiological parameters, it might be an interesting exercise to study the effect of co-metabolism and multi-component PAH mixtures on system stability. In agreement with dissolution models (Rulkens and Bruning, 1995) it was found that mass-transfer parameters, such as particle radius, water-solubility and sorption coefficients, indeed determine the efficiency of bioremediation under mass-transfer limited conditions. However, these were model calculations on a theoretical basis. In order to give these considerations a practical use, more work is needed on the characterization of the physical states of PAHs in soil matrices and validation of the proposed transfer models in real soil systems. For the moment, however, these considerations can be very useful to roughly calculate, for instance, the (relative) effects of soil sanitation measures like temperature elevation or the introduction of bacterial biomass. Because of the mechanistic nature of the models, these measures can be implemented in the models by altering the model parameters. Another use of these models could be the prediction of 'best-case' bioremediation periods of high-molecular weight PAHs based on degradation kinetics of low-molecular weight PAHs under mass-transfer limited conditions. Because the mass-transfer processes are dominated by the physical and chemical properties of the compounds, extrapolation of this kinetic information on relatively mobile pollutants can provide information on the release rate of more persistent hydrophobic substances from soils.
178

Effect of physical states on PAH bioavailability
Nomenclature
C dissolved P A H concentrat ion in the pores C mean con taminant concentrat ion C* solubility of the P A H Cb d issolved P A H concentrat ion in the bulk l iquid phase C, initial d issolved P A H concentrat ion CR d i ssolved P A H concentrat ion a t the surface of t he particle
DAB diffusion coefficient of the P A H in wa te r Deff effective diffusion coefficient D°eff overall effective diffusion coefficient foe fraction organic carbon in the soil matrix Fo Fourier n umbe r k mass-transfer coefficient K sorpt ion coefficient Koc o rganic carbon part i t ion coefficient Km, oc tanol-water par t i t ion coefficient Ks Monod constant N flux of the dissolved PAH over a stagnant fluid layer
at the solid-liquid interface Ns mass flux from the particle NT total mass flux Q concentration in the solid phase r coordinate in the direction of transport R radius of PAH particle RCf radial location of the contaminant front R, initial particle radius R„ particle radius t time V volume per particle X biomass concentration in the bulk liquid X, initial biomass concentration Y yield coefficient
(kg nr3) (kg m3) (kg nr3) (kg nr3) (kg m 3) (kg nr3)
(m2 s-1) (m2 s-1) (m2 s-1)
(-) (-) (m s1) (m3 kg-1) (Lkg-i) (-) (kg nr3) (kg nr2 s1)
(kg nr2 s1) (kgs-i) (kgkg-i) (m) (m) (m) (m) (m) (s) (m3) (kg nr3) (kg nr3) (kg kg-1)
179
Chapter 7
Greek symbols
e particle porosity (m3 nr3) H growth rate (s1) /Jmax maximum growth rate (s1) p density of PAH particle (kg nr3) Ps solid matrix density (kg nv3) r period to achieve a 99% reduction of PAH pollution (s)
Literature
Ball WP, Roberts PV (1991) Long-term sorption of halogenated organic chemicals by aquifer material. 2. Intraparticle diffusion. Environ. Sci. Technol. 25: 1237-1249
Bird RB, Steward WE, Lightfoot EN (1960) Transport phenomena. 1st ed.; Wiley, New York, USA
Boldrin B, Thiem A, Fritsche C (1993) Degradation of phenanthrene, fluorene, fluoranthene, and pyrene by a Mycobacterium sp.. Appl. Environ. Microbiol. 59: 1927-1930
Chiou CT, McGroddy SE, Kile DE (1998) Partition characteristics of polycyclic aromatic hydrocarbons on soils and sediments. Environ. Sci. Technol. 32: 264-269
Chung GY, McCoy BJ, Scow KM (1993) Criteria to assess when biodegradation is kinetically limited by intraparticle diffusion and sorption. Biotechnol. Bioeng. 41: 625-632
Crank J (1975) The Mathematics of diffusion. 2nd ed. Clarendon Press, Oxford, UK Ghoshal S, Luthy RG (1998) Biodegradation kinetics of naphthalene in nonaqueous
phase liquid-water mixed batch systems: comparison of model predictions and experimental results. Biotechnol. Bioeng. 57: 356-366
Karickhoff SW, Brown DS, Scott TA (1979) Sorption of hydrophobic pollutants on natural sediments. Water Res. 13: 241-248
Keuth S, Rehm HJ (1991) Biodegradation of phenanthrene by Arthrobacter polychromogenes isolated from a contaminated soil. Appl. Microbiol. Biotechnol. 34: 804-808
Mulder H, Breure AM, Van Andel JG, Grotenhuis JTC, Rulkens WH (1997) Physico-chemical processes affecting the bioavailability of PAHs. In: In Situ and On-Site Bioremediation. vol 5. Ed: Alleman BC, Leeson A. Battelle Press,
180

Effect of physical states on PAH bioavailability
Columbus, USA, pp. 643-648 Mulder H, Breure AM, Van Andel JG, Grotenhuis JTC, Rulkens WH (1998)
Influence of hydrodynamic conditions on naphthalene dissolution and subsequent biodegradation. Biotechnol. Bioeng. 57:145-154
Mulder H, Breure AM, Rulkens WH (1999) Effect of mass-transfer limitations on the bioavailability of sorbed naphthalene in artificial soil aggregates, submitted for publication. (Chapter 5)
Press WH, Teukolsky SA, Verterling WT, Flannery BP (1992) Numerical recipes in Fortran: The art of scientific computing, 2nd edition. Cambridge University Press, Cambridge, UK
Rijnaarts HHM, Bachmann A, Jumelet JC, Zehnder AJB (1990) Effect of desorption and intraparticle mass transfer on the aerobic mineralization of a-hexachlorocyclohexane in a contaminated calcareous soil. Environ. Sri. Technol. 24:1349-1354
Rulkens WH, Bruning H (1995) Clean-up possibilities of contaminated soil by extraction and wet classification: effect of particle size, pollutant properties and physical state of the pollutants. In: Contaminated Soil '95, Soil & Environment. vol. 5, Ed: Van den Brink WJ, Bosman R, Arendt F. Kluwer, The Netherlands. pp. 761-773
Sims RC, Overcash MR (1983) Fate of polynuclear aromatic compounds (PNAs) in soil-plant systems. Residue Rev. 88:1-68
Van Brakel J, Heertjes PM (1974) Analysis of diffusion in macroporous media in terms of a porosity, a tortuosity and a constricrivity factor. Int. J. Heat. Mass Transfer 17:1093-1103
Volkering F (1996) Bioavailability and biodegradation of polycyclic aromatic hydrocarbons. PhD-Thesis, Agricultural University of Wageningen, Wageningen, The Netherlands
Volkering F, Breure AM, Sterkenburg A, Van Andel JG (1992) Microbial degradation of polycyclic aromatic hydrocarbons: effect of substrate availability on bacterial growth kinetics. Appl. Microbiol. Biotechnol. 36: 548-552
Weast RC (1974) Handbook of chemistry and physics. 55th ed. CRC, Cleveland, USA
Wu S, Gschwend PM (1986) Sorption kinetics of hydrophobic organic compounds to natural sediments and soils. Environ. Sci Technol. 20: 717-725
181

CHAPTER 8
General conclusions
8.1 Bioavailability of PAHs studied in model soil systems
The Dutch soil is polluted on numerous locations with hydrophobic organic compounds, which, due to their dangerous properties towards humans and ecosystems, have to be removed from the environment. Although microorganisms exist that are able to convert these soil pollutants to less harmful compounds, degradation rates in soil are very low. The extremely low mobility in the soil matrix is generally accepted to be one of the main reasons for this persistence. Due to very low water-solubilities and the strong interactions with the organic fraction of soil material, mass-transfer rates of hydrophobic contaminants are very low in comparison with polar pollutants.
Because microbial degradation is only possible in an aqueous environment, transfer of the contaminant from the solid soil phase to a water-phase is necessary for biodegradation of the pollutant. If the potential biodegradation rate of the present microbial population exceeds the mass-transfer rate of the compounds towards the phase in which these organisms are present, there is a reduced bioavailability.
A group of frequently occurring organic soil contaminants are the polycyclic aromatic hydrocarbons (PAHs). These compounds are released into the soil compartment by both diffuse and local sources, predominantly by human activities like combustion of fossil fuels and oil spills respectively. Because there are microorganisms able to degrade these harmful substances, PAHs have been chosen as a model contaminant group for this study.
The aim of this work was to investigate the extent to which physicochemical processes determine the bioavailability of PAHs in soil. From earlier research on this subject, it was found that the mass transfer to an aqueous phase and the interactions of PAHs with organic soil material (sorption), were the most important processes with respect to the bioavailability issue.
Mathematical models have been postulated to obtain a quantitative description of the mutual interactions of these processes on the one hand, and the microbial degradation on the other. A mechanistic description of the processes was pursued,

Chapter 8
so that model parameters are related to the properties of the system under investigation (soil matrix, contaminant, microorganism, reactor conditions) and the models would have predictive capabilities.
The validity of the models was checked with experimental work on artificial soil systems because soil heterogeneity imposes great difficulties in soil research. Characterization of soil material is virtually impossible, given the heterogeneity in, for instance, chemical composition, structure and texture at all scale levels. The use of artificial soil matrices can overcome this problem and reproducible results can be obtained which can unambiguously be interpreted. The systems used model contaminated soil from hot-spots (pure PAHs phase) or from diffuse pollutions (PAHs sorbed in porous particles). Although the model systems we used in this study are very simplified representations of real soil material, it has been shown here and in other work (Scow and Alexander, 1992; Volkering, 1996) that the relevant fundamental processes (e.g. sorption, mass transfer, biodegradation) can be studied under well-defined and controlled conditions. It is therefore recommended that model systems are used more frequently in model development studies or as a well-defined test-case for method validation. However, the results obtained with model systems should be compared with results on real soil systems at some point, because simplifications have been made. Given the complex composition, structure and texture of soil materials, over-simplification is inevitable. The formation of irreversibly bound residues (Eschenbach, 1995), for instance, cannot be simulated in the model systems that were used in the present work. Characterization of the soil and the contaminant under investigation is a prerequisite for the selection of the proper model system. Although some efforts have been undertaken on this subject (Cuypers et al , 1998), more research on the physical states of pollutants in the soil (Rulkens and Bruning, 1995) is desirable to understand the processes that determine the bioavailability of contaminants. Notwithstanding these drawbacks a lot of insight is obtained using the model systems in this study.
The results of the theoretical and experimental work indicate that indeed mass-transfer and sorption processes will become limiting for the biodegradation of PAHs in soil if an active and growing microbial population is present. Because the mass-transfer rates are limited to maximum values and the potential of microorganisms to increase their population by growth, a mass-transfer limited degradation phase is inevitable. The most interesting issue of this is the mutual influence of the mass-transfer and biodegradation processes. Under mass-transfer limited growth conditions, the microorganisms decrease the dissolved PAH concentration in the water phase around the soil particles to a very low value and they thereby increase the mass transfer to its maximum. This is of course very
184

General conclusions
important for both bioremediation purposes and ecotoxicological risk assessment as will be discussed hereafter.
The combined dissolution and biodegradation experiments that have been performed to study the effect of mixing conditions on the removal rate of solid naphthalene indicate the necessity of a well-defined experimental system (Chapter 2). In microbiological studies dealing with PAH degradation this is often omitted, but the results have shown the significant influence of reactor hydrodynamics on the degradation rates of naphthalene. When, for instance, it is investigated whether a specific organism is able to transform a certain PAH, insufficient mixing could lead to the observation that no degradation takes place. As the dissolution rate is related to the maximum solubility this effect becomes more significant for high-molecular weight PAHs. The same holds for the determination of bacterial growth parameters because sufficient mixing must be applied to increase the dissolution rate to a level at which mass-transfer limitations are, at least temporarily, prevented. It would be interesting to study whether this effect has influenced degradability studies of PAHs by different organisms.
Identical experimental systems with solid phase naphthalene in a water phase have been used to investigate the effect of surfactant addition on dissolution rates and biodegradation rates (Chapter 4). The results indicate that the diffusion coefficient of micelles is an important factor affecting the performance of such compounds as a bioremediation stimulating agent. This is interesting for the selection of optimal surfactants for soil remediation. More work, however, is necessary to study the significance of this observation in porous soil (slurry) systems with organic matter at which surfactant sorption will occur and diffusion of the large micelles through small aggregate pores might be absent.
Biofilm formation on solid naphthalene as observed with the Pseudomonas 8909N (Chapter 3) could also be studied quite well in the experimental system with solid naphthalene. Further work on this subject should be focused on the relevance to field conditions and the exclusivity of this strain with respect to this phenomenon.
The work with the porous model systems for soil (Amberlite resins) has shown that the combination of biodegradation and mass-transfer processes can be investigated both qualitatively and quantitatively (Chapter 5). Especially the effect of nonlinear sorption on biodegradation rates under mass-transfer limited conditions is interesting with respect to the prediction of bioremediation periods (Chapters 5, 6, and 7).
A very interesting field for future research is the extension of the current models to mass transfer and biological transformation of mulricomponent PAH mixtures. Given the complexity of such investigations compared to single-substrate studies,
185

Chapter 8
experimental model systems will probably be indispensable. In general, it is recommended that model systems are used whenever the application of real soil is not strictly necessary, or at least used as a well-defined test-case analogous to real soil systems.
8.2 Bioavailability and bioremediation
In the last decades, bioremediation has had its ups and downs. In the seventies and eighties, when it was shown that there was a natural capacity to degrade harmful pollutants, there was supposed to be great potential for the biological remediation of contaminated soils. However, at the end of the eighties and the beginning of the nineties, it became evident that the capacity of microorganisms was not the limiting factor in bioremediation. Limitations in the mass transfer of immobile pollutants seriously hindered the successful application of bioremediation as a competitive method towards physicochemical clean-up techniques.
At present, the bioavailability concept is widely accepted and fundamental research has revealed important factors that influence the bioavailability of organic soil pollutants (Thomas and Lester, 1993; Volkering, 1996; Weissenfels et al., 1992; Wilson and Jones, 1993). This type of research can determine operational limitations for bioremediation techniques and can provide possible treatment strategies which improve the efficiency and cost-effectiveness. From the present work, the following implications for bioremediation practice can be extracted: • In-Situ bioremediation:
Although the results in the present work are mainly applicable to slurry systems, some conclusion for the in-situ bioremediation practice can be drawn. In in-situ remediation applications, concentrations of the contaminants are intensively monitored in time. It would be interesting to study how the mobility of PAHs is affected by microbiological conversion or mass transfer limitations. It is expected that the spreading of the contaminants from the original location should stop when there is a transition from microbial limited degradation to mass-transfer limited degradation. The results of monitoring campaigns can than be used to tailor any action to improve the efficiency. For instance, conditions for the microbial population may be altered (oxygen injection) or surfactants could be applied to increase mass-transfer rates. The use of surfactants is, however, questionable for in-situ purposes as the degradation of the surfactants might impose limitations in the oxygen supply (Volkering et al., 1998).
• Landfarming: In landfarming, conditions can be more controlled compared to in-situ
186
General conclusions
bioremediation. In the optimal situation, conditions for microbial conversion should be maintained at a level where the potential biodegradation capacity equals the maximum mass-transfer rate. Because the concentration of pollutants decreases over the remediation period, the mass-transfer rate will also decrease and a potential biodegradation capacity at a lower level might be sufficient. The pore-liquid concentration in the soil particles might be an indicator for the assessment of mass-transfer limited conditions, because dissolved PAH concentrations will be very low under such conditions. Given the experimental difficulties in determining aqueous-phase concentrations in soil material, this could, however, be problematic. To increase mass-transfer rates of the PAHs, there are several possibilities. The application of surfactants to increase the apparent PAH solubility might be interesting because the supply of oxygen can be regulated in landfarming. Another option would be particle size reduction resulting in reduced mass-transfer distances. However, intensive mixing of the microbial population would then be necessary to bring the microorganisms to the location were the pollutants enters the aqueous-phase. Temperature elevation is probably one of the most effective measures because sorption to the soil matrix then decreases and diffusion coefficients are increased. As these measures might lower the microbial capacity [e.g. toxicity of surfactants (Volkering et al., 1998)], it can be concluded from this work that these negative effects can be allowed if the potential biodegradation capacity remains higher than the maximum mass-transfer rate of the pollutants.
• Slurry bioreactors:
Recent developments in soil remediation practice and soil remediation policy have reduced the opportunities for slurry reactors as a possible technique. The costs of alternative remediation technques are drastically decreased and this makes the capital-intensive slurry treatment processes less attractive. When slurry bioreactors are applied, hydrodynamic conditions should be chosen such that external mass-transfer rates and disaggregation (reduction of mass-transfer distances) are optimal (Chapter 7; Geerdink, 1995; Rijnaarts, 1990).
It is not yet clear what the implications of biofilm formation on a solid phase will be for the bioremediation practice (Chapter 3). More research on this subject will have to be performed to determine the possible effect that immobilized microorganisms on separate phase pollutants exert on the mass-transfer rates in real soil systems.
The results of this work endorse the viewpoint stressed by Volkering (1996) that physicochemical characterization tests are a promising technique for the prediction of bioremediation potential. Because the biodegradation of the contaminants is determined by the mobility through the soil matrix, abiotic leaching experiments
187
Chapter 8
quantifying the mass-transfer, will provide the proper basis for the estimation of bioremediation efficiency and necessary treatment periods (Cornelissen et al., 1998; Kelsey et al., 1997).
Before the models that have been described in this thesis can be applied to real soil remediation practice, information on the physical states of the PAHs in the soil matrix is necessary to apply the proper mass-transfer models. When such information is available, the model parameters can be determined independently from equilibrium and dynamic experiments under sterile conditions. For solid phase contaminants, the particle size and the solubilities of the different PAHs will be the most important factors in the estimation of bioremediation periods (Chapters 2 and 7). When PAHs are sorbed to soil material, sorption isotherms, effective diffusion coefficients, aggregate porosities, and the particle size of the porous aggregates are crucial features that determine the fate of PAHs in the soil material during bioremediation (Chapters 5-7).
The practicability of the above-mentioned characterization of mass-transfer parameters is, however, difficult in field situations, given the heterogeneity of soil material and the complexity of the mass-transfer and biodegradation processes when mixtures of PAHs are considered. Nevertheless, the presented mathematical models can be useful to develop remediation measures that are based on the insights in the fundamental processes that have been investigated in this work.
8.3 Possible implications of mass-transfer limited bioremediation for ecotoxicological risk assessment
In recent years, more attention has been paid to risk assessment in relation to soil remediation (Beck et al., 1995). This development has probably been initiated because of the enormous financial consequences of the soil remediation policies. The Dutch policy aimed at the removal of defined priority pollutants from sites that exceeded the soil quality standards irrespective of the (future) use of the site. Recently, the Dutch government entered into consultations with other social partners and a new policy was formulated which lead to an estimated 45% reduction of the costs. In the so-called 'site-specific' approach the multifunctional use of cleaned soil is no longer the main target, and the (future) function of the polluted site is considered prior to the remediation as well as the risks that the site imposes.
The soil quality standards are, however, still used to assess the degree of contamination at a specific site. For PAHs these quality limits are mainly derived
188
General conclusions
from data on doses-effect relationships from single-species tests with aquatic organisms. Extrapolation of these data is performed on the basis of the equilibrium-partitioning model (Slooff et al., 1989). With this model, solid-phase concentrations in the soil compartment are calculated with a partitioning coefficient on the basis of aqueous-phase concentrations. The main disadvantage of this approach in the light of the present and earlier work (Volkering, 1996), is the static nature of this model (Brummelen et al., 1998). Because dynamic processes like mass transfer and biodegradation are not accounted for, the predicted risks can easily be over-estimated (Volkering, 1996).
Under mass-transfer limited biodegradation conditions, fluxes via the water phase towards target organisms will be reduced when the dissolved PAH concentration is relatively low compared to the equilibrium concentration in absence of degradation (Chapters 2 and 5). Although some work is done on this subject, it is therefore recommended that more research is initiated on the field of dynamic risk-assessment and the role of a limited bioavailability towards ecotoxicological risks. These risks will probably differ among species, given the diversity in exposure routes (Peijnenburg et al, 1997). For organisms that are exposed to toxicants via the aqueous phase, risks probably will be strongly reduced under mass-transfer limited degradation conditions (Landrum et al., 1994). When such a reduction of toxicity during biological treatment of soils is shown and can be made operational, this would open new possibilities for the use of bioremediation techniques. In that case the success of a remediation strategy will be determined by the degree in which the toxicity of the polluted site is reduced, instead of the degree in which the total concentration of the pollutant is reduced.
189

Chapter 8
Literature
Beck AJ, Wilson SC, Alcock RE, Jones KC (1995) Kinetic constraints on the loss of
organic chemicals from contaminated soils,: implications for soil-quality limits. Crit. Rev. Environ. Sci. Technol. 25:1-43
Brummelen van TC, Hattum van B, Crommentuijn T, Kalf DF (1998) Bioavailability and ecotoxicity of PAHs. The Handbook of Environmental Chemistry, Vol. 3, Part I, PAHs and related compounds, ed. AH Neilson, Springer-Verlag, Berlin, Germany
Cornelissen G, Rigterink H, Ferdinandy MMA, Noort van PCM (1998) Rapidly desorbing fractions of PAHs in contaminated sediments as a predictor of the extent of bioremediation. Environ. Sci. Technol. 32: 966-970
Cuypers MP, De Leeuw R, Doka O, Bicanic D, Grotenhuis JTC, Rulkens WH (1998) Photoacoustic spectroscopy: an attempt to characterize soils and sediments contaminated by PAHs. In: Contaminated Soil '98, vol. 2, pp 999-1000, Thomas Telford, London
Eschenbach A (1995) EinfluG von Pleurotus ostreatus, Kompost, Sphingomonas paucimobilis und der Kontaminationsdauer auf den Verbleib und Abbau 14C-markierter polyzyklischer aromatischer Kohlenwasserstoffe (PAK) in Altlastboden. PhD-thesis, Technical University Hamburg-Harburg, Hamburg, Germany
Geerdink MJ (1995) Kinetics of the microbial degradation of oil in soil slurry reactors. PhD-thesis, Technical University of Delft, Delft, The Netherlands
Kelsey JW, Kottler BD, Alexander M (1997) Selective chemical extractants to predict bioavailability of soil-aged organic chemicals. Environ. Sci. Technol. 31: 214-217
Landrum PF, Dupuis WS, Kukkonen J (1994) Toxicokinetics and toxicity of sediment-associated pyrene and phenanthrene in Diporeia spp.: examination of equmbrium-partitioning theory and residue-based effects for assessing hazard. Environ. Toxicol. Chem. 13:1769-1780
Peijnenburg WJGM, Posthuma L, Eijsackers HJP, Allen HE (1997) A conceptual framework for implementation of bioavailability of metals for environmental management purposes. Ecotox. Environ. Safety 37:163-172
Rijnaarts HHM, Bachmann A, Jumelet JC, Zehnder AJB (1990) Effect of desorption and intraparticle mass transfer on the aerobic biomineralization of y-hexachlorocyclohexane in a contaminated calcareous soil. Environ. Sci. Technol. 24:1349-1354
Rulkens WH, Bruning H (1995) Clean-up possibilities of contaminated soil by extraction and wet classification: effect of particle size, pollutant properties and
190

General conclusions
physical state of the pollutants. In: W.J. van den Brink, R. Bosnian and F. Arendt (eds.), Contaminated Soil '95, Soil & Environment, (5), Kluwer, The Netherlands, pp. 761-773.
Scow KM, Alexander M (1992) Effect of diffusion on the kinetics of biodegradation: Experimental results with synthetic aggregates. Soil Sci. Soc. Am. J. 51:128-134
Slooff W, Janus JA, Matthijsen AJCM, Montizaan GK, Ros JPM (1989) Basisdocument PAK. RIVM Rapportnummer 758474007, RIVM, The Netherlands
Thomas AO, Lester JN (1993) The microbial remediation of former gasworks sites: a review. Environ. Technol. 14:1-24
Volkering F (1996) Bioavailability and biodegradation of polycyclic aromatic hydrocarbons. PhD-Thesis, Agricultural University of Wageningen, Wageningen, The Netherlands
Volkering F, Breure AM, Rulkens WH (1998) Microbiological aspects of surfactant use for biological soil remediation. Biodegradation 8:401-417
Weissenfels WD, Klewer HJ, Langhoff J (1992) Adsorption of polycyclic aromatic hydrocarbons (PAHs) by soil particles: influence on biodegradability and biotoxicity. Appl. Microbiol. Biotechnol. 36: 689-696
Wilson SC, Jones KC (1993) Bioremediation of soil contaminated with polynuclear aromatic hydrocarbons (PAHs): A review. Environ. Pollut. 81: 229-249
191

SUMMARY The Dutch soil is contaminated at numerous locations with toxic organic compounds, such as polycyclic aromatic hydrocarbons (PAHs). To reduce the risks at these sites bioremediation can be applied as an alternative for the more destructive and energy intensive physicochemical soil sanitation techniques. During bioremediation microorganisms convert pollutants to less harmful compounds. Implementation of bioremediation is, however, limited because the strongly hydrophobic PAHs possess low water-solubilities and interact with soil organic matter. This results in a low mobility of PAHs in the soil as well as a low rate at which they become available for microbiological transformation. This thesis describes a study on the mutual influence of mass transfer and biodegradation processes which has been performed to gain a better insight in the mechanisms causing the persistence of PAHs in soil.
To achieve this goal, well-defined experimental systems have been applied to obtain reproducible results. In these systems, PAHs were used in defined solid states, either solid phase PAHs immobilized in stainless steel cups with a specified surface area, or PAHs adsorbed on chromatographic porous spheres (Amberlite resins) of hydrophobic material.
The influence of mixing on the dissolution rate and biodegradation rate of solid phase naphthalene has been investigated with the PAH immobilized in stainless steel cups in stirred fermentors (Chapter 2). Results of combined dissolution and degradation experiments have shown the necessity of quantification of the hydrodynamic flow conditions when studying the conversion of poorly water-soluble compounds. When the potential biodegradation rate of the bacterial population present exceeds the maximum dissolution rate, mass-transfer becomes limiting for naphthalene conversion. The maximum dissolution rate is strongly related to the extent of mixing and an increase of the latter results in an increase of the PAH biodegradation rate under such circumstances.
During the above-mentioned experiments biofilm formation by the applied bacterial strain (Pseudotnonas 8909N) has been observed at the naphthalene-water interface. On the basis of relatively long-term experiments, in which biofilms have been grown in chemostats, it was shown that the presence of a biofilm on the solid-liquid interface resulted in a 90% reduction of the biological availability of the solid naphthalene (Chapter 3).
The low solubilities of PAHs in water result in relatively low dissolution rates. The apparent solubility of hydrophobic compounds can be increased by the addition of surface active chemicals (surfactants) resulting in higher mass-transfer
193

rates. This implies that the bioavailability can be increased by the use of surfactants. It was shown in Chapter 4 that the model system used in the foregoing chapters is very suitable for the investigation and modeling of the influence of surfactant addition on the dissolution and biodegradation of (initially) solid naphthalene. Results indicate that besides the increase in the apparent solubility due to the partition of naphthalene in micelles (aggregates of surfactant molecules), also the diffusion coefficient of micelles is a determining factor for the efficiency of surfactant addition. The flux of PAH to the bulk liquid phase is positively correlated with an the partitioning of the PAH in the micelles and the micellar diffusion coefficients.
When PAHs are present as diffuse soil contaminants, they will exist in a sorbed physical state. To gain insight in the influence of sorption processes and mass transfer in porous soil aggregates on the biodegradation of PAHs, chromatographic material (Amberlite XAD4 and XAD7) is used as a model soil system (Chapter 5). A mathematical model was developed that simultaneously accounted for nonlinear sorption, for internal and external mass transfer, and for nonlinear bacterial transformation kinetics. This model was checked for its applicability on the basis of experiments with naphthalene as a model pollutant. By variation of the mixing conditions in the reactors it was shown that characterization of the external diffusion limitations is necessary in the system used. The fate of naphthalene in the porous particles could be predicted adequately by the mechanistic model. The crucial model parameters that determine the mass transfer of PAHs in soil aggregates are: the particle size, the sorption coefficient, and the effective diffusion coefficient. Nonlinear sorption results in relatively low desorption rates compared to linear sorption and, therefore, a longer clean-up period is necessary.
To check whether the model developed in Chapter 5 could be used to describe the fate of PAHs in real soil aggregates, experiments were performed with Koopveen soil (Chapter 6). Aggregates with three different size fractions but with equal organic matter content (±30%) were produced from this peat soil and proved to be stable during dynamic desorption and biodegradation experiments. These aggregates were artificially contaminated with either naphthalene or phenanthrene. The experimental results indicated that solid PAHs were probably present in the two lower size fractions due to the contamination method. However, mass transfer and biodegradation processes could be adequately modeled in the case of the largest naphthalene contaminated fraction. Results with similar soil material, that were fitted in earlier research with an empirical compartment model, could equally well be described with the current mechanistic model. The predictive capabilities of the current model are, however, superior because model parameters are related to measurable quantities.
194

Finally, three different physical states of PAH pollutants in soil have been postulated and mass transfer models have been developed to predict the release of PAHs to an aqueous phase (Chapter 7). The effect of the different physical states of PAHs in soil on the period necessary for a certain degree of bioremediation are calculated by coupling of the mass transfer models to a biodegradation module. It was calculated that, under mass transfer limited growth conditions, microorganisms can effectively lower the dissolved PAH concentration and maximize the driving force for mass transfer. Therefore, simple mass transfer models can be applied to calculate bioremediation periods under these conditions.
The main conclusions that are formulated on the basis of the findings in this thesis and some recommendations for future research are presented in Chapter 8. The most important conclusion is that the use of model soil systems is a very powerful tool to investigate the interactions between mass transfer and biological transformation of hydrophobic compounds. These interactions could be studied in both model systems and models could be developed that make it now possible to estimate the behavior of PAHs in soil. These models can be useful to estimate ecotoxicological risks on the basis of released quantities instead of total concentrations and to estimate the feasibility of soil bioremediation or the development of new sanitition treatments.
195

SAMENVATTTNG
De bodem is in Nederland op talloze plaatsen vervuild met giftige organische stoffen zoals polycyclische aromatische koolwaterstoffen (PAKs). Als alternatief voor energie-intensieve en destructieve fysisch-chemische saneringstechnieken kan biologische reiniging toegepast worden om de risico's te reduceren. Hierbij worden micro-organismen aangewend om de verontreinigingen om te zetten in minder schadelijke verbindingen. Voordeel van deze methode is dat de biologische waarde van de grond behouden blijft. De implementatie van biologische reiniging wordt echter beperkt doordat PAKs, vanwege hun hydrofobiciteit, zeer slecht oplossen in water en sterk hechten aan bodemmateriaal. Hierdoor is de mobiliteit van deze stoffen in de grond laag, evenals de snelheid waarmee ze beschikbaar komen voor microbiele afbraak. Wanneer de potentiele afbraakcapaciteit van de micro-organismen groter is dan de massatransportsnelheid wordt gesproken van een gereduceerde biobeschikbaarheid. In dit proefschrift is onderzoek gedaan naar de wederzijdse invloed van massatransport- en biodegradatie-processen teneinde een beter inzicht te verkrijgen in de mechanismen die de persistentie van PAKs in grond veroorzaken.
Daartoe is gebruik gemaakt van goed gedefinieerde experimentele systemen, waardoor reproduceerbare resultaten behaald konden worden. Deze model systemen bevatten ofwel vaste PAK die ge'immobiliseerd was in RVS bakjes met een gespecificeerd oppervlak, ofwel chromatografische poreuze bolletjes (Amberlite harsen) van hydrofoob materiaal waarin adsorptie van PAK optrad.
Aan de hand van het eerste model systeem is in Hoofdstuk 2 de invloed onderzocht van de menging in geroerde fermentoren op de oplos- en biodegradatiesnelheid van vast naftaleen. De resultaten van gecombineerde oplos-en degradatie-experimenten hebben het belang aangetoond van de kwantificering van de hydrodynamica voor het bestuderen van de afbraak van slecht oplosbare verbindingen die aanvankelijk in vaste vorm aanwezig zijn. Indien namelijk de potentiele afbraaksnelheid van de aanwezige bacteriele populatie hoger is dan de maximale oplossnelheid, ontstaat er een massatransport gelimiteerde situatie. Aangezien de maximale oplossnelheid in sterke mate afhankelijk is van de mate van menging in de reactor, wordt de omzettingssnelheid van de PAK verhoogd naarmate de menging toeneemt.
Tijdens de voorgenoemde experimenten werd de vorming van biofilms door het toegepaste organisme (Pseudomonas 8909N) waargenomen op het vaste naftaleen-oppervlak. Uit relatief langdurige experimenten, waarbij biofilms werden
197

gekweekt in chemostaatculturen, bleek dat de biofilmvorming aan het naftaleen-water grensvlak leidde tot een sterke (90%) reductie van de biologische beschikbaarheid van de naftaleen (Hoofdstuk 3).
De lage oplosbaarheden van PAKs in water resulteren in relatief lage oplossnelheden. Door de toevoeging van oppervlakte actieve stoffen (surfactants) wordt de schijnbare oplosbaarheid van hydrofobe verbindingen verhoogd en daardoor kan het massatransport versneld worden. Onder massatransport gelimiteerde afbraak omstandigheden kan dit dus leiden tot een verhoging van de biologische beschikbaarheid. De model systemen, ontwikkeld in Hoofdstuk 2, zijn uitermate geschikt gebleken om de invloed van surfactants op de oplos- en biodegradatiesnelheid van (aanvankelijk) vast naftaleen te bepalen en modelleren te verifieren (Hoofdstuk 4). Uit de resultaten is gebleken dat naast de schijnbare verhoging van de water-oplosbaarheid als gevolg van partitie van naftaleen in micellen (aggregaten van surfactant-moleculen), ook de diffusiecoefficient van de micellen bepalend is voor de effectiviteit van surfactants. Naarmate de partitie van de PAK in de micellen groter wordt en de diffusiecoefficient van de micellen hoger, wordt de flux van PAK naar de bulk van de vloeistoffase vergroot. Hierdoor kan de biologische beschikbaarheid sterk toenemen.
Wanneer PAKs als diffuse verontreiniging in de grond aanwezig zijn, zullen deze in gesorbeerde toestand voorkomen. Om inzicht te verkrijgen in de invloed van sorptieprocessen en massatransport in poreuze bodemaggregaten op de biodegradatie van PAKs is gebruik gemaakt van een tweede model systeem dat bestond uit chromatografisch materiaal (XAD4 en XAD7) (Hoofdstuk 5). Er is een mathematisch model ontwikkeld, dat tegelijkertijd niet-lineaire sorptie, intern en extern diffusief massatransport en niet-lineaire bacteriele omzettingskinetiek beschrijft. Dit model is op geldigheid gecontroleerd op basis van experimenten, waarbij naftaleen werd gebruikt als modelverontreiniging. Het belang van de karakterisering van het externe transport bij het gebruik van dit modelsysteem is aangetoond door middel van variatie van de menging in geroerde reactoren. Tevens is gebleken dat de mechanistische modellering van de genoemde processen een adequate beschrijving van het lot van PAKs in dergelijke systemen geeft. De belangrijkste model parameters die het massatransport van PAKs in grond-aggregaten bepalen zijn: de straal van de aggregaten, de sorptiecoefficient en de effectieve diffusiecoefficient. De niet-lineaire sorptie resulteert in een verlaging van de desorptiesnelheid in vergelijking tot lineaire partitie, waardoor de reinigingsperiode verlengd wordt.
Het model dat ontwikkeld werd in Hoofdstuk 5 is getest op de bruikbaarheid voor echte bodemaggregaten aan de hand van experimenten met Koopveen grond. Uit deze grond zijn aggregaten van verschillende grootten maar met een identiek
198

organisch stofgehalte (±30%) geproduceerd die tijdens dynamische desorptie- en biodegradatie-experimenten stabiel bleken te zijn. Zij werden kunstmatig verontreinigd met naftaleen of fenantreen. Uit de resultaten is gebleken dat bij hoge beladingen de verontreinigingsprocedure waarschijnlijk heeft geleid tot de aanwezigheid van vaste PAKs in het materiaal. De massatransport- en biodegradatieprocessen blijken bij lagere beladingen goed te beschrijven met het wiskundige model. Resultaten uit eerder onderzoek met dezelfde grond, eerder goed gefit met een empirisch compartimenten model blijken ook te beschrijven met het huidige model. Omdat de modelparameters in dit huidige model direct gekoppeld zijn aan fysisch meetbare grootheden, heeft dit echter een grotere voorspellende waarde.
Tenslotte zijn drie verschillende fysische toestanden van PAKs in grond gepostuleerd en bijbehorende massatransportmodellen uitgewerkt voor slurry systemen. Deze modellen zijn gekoppeld aan een beschrijving van de biodegradatiekinetiek. Door middel van mathematische exercities is geevalueerd wat de invloed van de verschillende toestanden is op de periode die nodig is om een bepaalde reinigingsgraad te realiseren (Hoofdstuk 7). Onder massatransport gelimiteerde omstandigheden kunnen bacterien de opgeloste PAK concentraties effectief verlagen en zodoende de drijvende kracht voor het massatransport van PAK maximaliseren. Relatief simpele oplossingen van de massatransportmodellen kunnen in dat geval de benodigde behandelingstijd voorspellen.
De belangrijkste conclusies die getrokken konden worden op basis van de resultaten uit het onderhavige proefschrift alsmede enkele aanbevelingen voor vervolgonderzoek zijn gepresenteerd in Hoofdstuk 8. De belangrijkste conclusie is dat het gebruik van modelsystemen een zeer krachtig middel is om de interacties tussen massatransport en biologische transformatie van slecht oplosbare hydrofobe verbindingen te bestuderen onder goed controleerbare omstandigheden. Op basis van de experimenten met de beide modelsystemen kan de wederzijdse invloed tussen fysisch-chemische en microbiologische processen bestudeerd worden en kunnen mechanistische modellen geverifieerd worden. Met deze modellen is het mogelijk om een betere inschatting te maken van het gedrag van PAKs in de bodem. Daarmee is het mogelijk om bijvoorbeeld ecotoxicologische risico's te bepalen op basis van werkelijk vrijkomende hoeveelheden PAKs in plaats van op basis van de hoeveelheden die beschikbaar zijn in de evenwichtsituatie. Verder kunnen de modellen gebruikt worden om de haalbaarheid van biologische bodemsanering in te schatten en nieuwe behandelingstechnieken te ontwikkelen.
199

DANKWOORD
Nu de beruchte laatste loodjes achter de rug zijn, is het moment daar om de mensen te bedanken die bijgedragen hebben aan de totstandkoming van dit proefschrift.
Ik herinner me het sollicitatiegesprek voor de AiO-baan op de LUW nog goed. Wie me vooral opviel was een man met een warrige baard die, ontspannen op twee stoelpoten achteroverleunend, zijn vragen stelde. Deze wat uiterlijk betreft stereotiepe microbioloog bleek later mijn co-promotor en uitermate rommelige kamergenoot Ton Breure te zijn. Nu zijn we viereneenhalf jaar verder en kan ik terugkijken op een optimale en zeer gezellige samenwerking. Beste Ton, jouw enthousiasme voor wetenschappelijk onderzoek was erg aanstekelijk en vaak aanleiding om er nog een tandje bij te zetten. De snelheid, grondigheid en interesse waarmee je mijn manuscripten corrigeerde was enorm motiverend, met name in de eindfase van het onderzoek. Ik had me wat betreft mijn vakinhoudelijke maar ook persoonlijke ontwikkeling geen betere begeleider kunnen wensen. Bedankt!
Mijn promotor Wim Rulkens wil ik bedanken voor zijn stimulerende inbreng en het feit dat hij mij op het fysisch-chemische vlak scherp hield. Beste Wim, ook jou heb ik vooral in de laatste maanden flink belast met manuscripten, waarvan de kwaliteit steeds verhoogd werd middels je opbouwende kritiek. Tijdens een bezoek aan de vakgroep kon ik altijd even bij je binnenlopen en dit stond garant voor frisse impulsen en een hernieuwde zin in het onderzoek.
Mijn onderzoek op het RIVM is aanvankelijk gestart in de afdeling Biotechnologisch Onderzoek (BTO) van het Laboratorium voor Afvalstoffen en Emissies en hierbij geldt zeker dat een goed begin het halve werk is. Daarbij wil ik Johan van Andel bedanken voor zijn bijdrage aan het begin van het onderzoek en zijn deelname aan de begeleidingscommissie na zijn vertrek van het RIVM. Beste Johan, door je grote vakinhoudelijke kennis en heldere visie op onderzoek was deze periode voor mij erg leerzaam. Ook de andere leden van de afdeling, Michiel, Aart, Loes, Dik, Jaap, Bea, Marc, en Wouter, maakten het werken in deze afdeling tot een waar genoegen. Ik had in de eerste maanden nog enige overlap met mijn voorganger Frank Volkering en zijn werk was duidelijk de goede basis voor het vervolg. Dat de oud-medewerkers van de BTO nog steeds elk jaar bijeenkomen en de omstreken van Giethoorn een weekend lang onveilig maken in een aantal zeilpunters, geeft wel aan dat de sfeer 'aan boord' erg goed was.
Later is deze club biotechnologen hoofdzakelijk opgegaan in het Laboratorium
201

voor Ecotoxicologie (ECO) en werden andere onderzoeksvelden betreden. Het promotieonderzoek werd echter gecontinueerd en daarbij wil ik de staf van ECO, Herman Eijsackers en Hans Canton, bedanken voor de mogelijkheid om mijn onderzoek af te ronden. Behalve alle medewerkers van ECO wil ik met name de EBB-ers: Arthur, Carlo, Emiel, Helene, Patrick, Rens, Rob, Willie en Jaap Struijs bedanken voor de prettige samenwerking. Ook al omdat de aanwezigheid van een (relatief) rommelige bioprocestechnoloog op het inmiddels meer analytisch georienteerde lab werd getolereerd. Behalve een getallenkraker bleek ik ook een 'computer-crasher', maar de gevolgen daarvan bleven gelukkig beperkt dankzij Henri en Evert-Jan.
Het begeleiden van studenten vanuit de LUW vond ik een van de leukste aspecten van het AiO-schap. Ronald Vroon, Theo Bussink, Thijs Gerrits, Annegreet de Groene, Dagmar van Honschooten, Gerben Wassink en Ahce van Es hebben zich enorm ingezet voor het onderzoek en dit was zeer stimulerend. Met name na de reorganisatie droegen zij in belangrijke mate bij aan de kritische massa van het project en aan mijn plezier in het onderzoek. Ik hoop dat jullie de samenwerking even gezellig en leerzaam hebben gevonden als ikzelf. Bedankt!
Als gedetacheerde LUW-er had ik regelmatig contact met de vakgroep Milieutechnologie middels besprekingen met de werkgroep Bodem onder leiding van Tim Grotenhuis. Beste Tim, jouw bijdrage aan de begeleidingscommissie was zeer waardevol. Daarnaast wil ik je bedanken voor je begeleiding van de studenten vanuit de LUW. De overige bodem-AiO's: Erna, Chiel, Luc en Rene wil ik bedanken voor de discussies en feedback vanuit hun meer prakrijkgerichte onderzoeken. Heleen Vos en Liesbeth Kesaulya stroomlijnden de administratieve aspecten van mijn detachering.
De geroerde reactoren die gebruikt zijn tijdens het experimentele werk, werden vakkundig in eigen huis gemaakt door Walter Steenbergen en Erik Staakman. Ook de glasblazerij van de LUW heeft mooi werk geleverd met de fabricage van de glazen reactoronderdelen.
Verder wil ik Marjo Mittelmeijer van de UvA en Katja Grolle van de LUW bedanken voor de bepalingen die zij verrichtten en voor de discussies over de resultaten. Ruth de Wijs-Christensen wordt bedankt voor het corrigeren van het Engels in het tweede hoofdstuk.
Dankzij Rolf Kliffen en mijn vader is dit proefschrift omgeven door een mooi vierkleuren omslag.
Tenslotte had ik in de prive-sfeer een aantal trouwe supporters. Hun bijdrage mag niet onderschat worden, want zij zorgden voor de noodzakelijke ontspanning. Allereerst gaat mijn dank daarbij uit naar mijn ouders die mij altijd de mogelijkheid hebben gegeven om hetgeen te bereiken wat ik ambieerde. Mijn
202

vaders relativerende uitspraken, zoals: 'Dat is toch logisch!' (over diffusieve zuurstoflimitaties in biofilms), of: 'Wanneer komt nu de volgende?' (na acceptatie van de eerste publicatie), zijn daarbij inmiddels legendarisch geworden. Dezelfde nuchterheid was ook te vinden bij mijn schoonouders, waar het altijd gezellig op adem komen was. De hoogte- en dieptepunten van het (tw)AiO-bestaan werden gedeeld met Laura, Ilja en Frank.
Lest best, en dat geldt zeker voor Paulien. Lieverd, bedankt voor je geduld en je onvoorwaardelijke steun!
203
CURRICULUM VITAE
Hendrikus Mulder (Eric) werd op 21 januari 1971 geboren te Heemskerk. Na het behalen van het VWO-B diploma op het St. Michael College te Zaandam, ging hij Scheikunde studeren aan de Universiteit van Amsterdam. Daar specialiseerde hij zich in de Chemische Technologie en studeerde af in de werkgroep Bioproces-kunde. Tijdens het afstudeeronderzoek aldaar heeft hij een studie verricht naar de intrinsieke microbiele kinetiek van gesuspendeerde en ge'immobiliseerde schimmelculturen.
Na het afstuderen in oktober 1994 is hij in november 1994 gestart aan een promotieonderzoek, waarvan de resultaten grotendeels beschreven staan in het onderhavige proefschrift. Hij was hierbij verbonden aan de vakgroep Milieu-technologie van de Landbouwuniversiteit Wageningen en gedetacheerd bij het Rijksinstituut voor Volksgezondheid en Milieu te Bilthoven. Het onderzoek is ge'rnitieerd in de afdeling voor Biotechnologisch Onderzoek van het Laboratorium voor Afvalstoffen en Emissies en is afgerond in de afdeling Ecotoxicologische Blootstellingsbeoordeling van het Laboratorium voor Ecotoxicologie. Tijdens de zesde internationale FZK/TNO Conference on Contaminated Soil (Consoil '98, Edinburgh, Schotland) ontving hij naar aanleiding van een presentatie de 'ENERO Young Scientist Award1 van het European Network of Environmental Research Organisations. Na november 1998 is zijn aanstelling aan de LUW met enkele maanden verlengd en heeft hij gewerkt als toegevoegd onderzoeker in het RTVM-project 'Functionele Biodiversiteit'.
205

BIBLIOGRAPHY
Papers
Breure AM, Mulder H, Volkering F, Van Andel JG (1996) Bioavailability-limited degradation of polycyclic aromatic compounds and the effect of non-ionic surfactants. In: M Cuno (ed), Biologische und chemische Behandlung von PAK-haltigen Boden und Abwassern, Kolloquium an der TU Berlin, 18-19 November 1996, Schriftenreihe Biologische Abwasserreinigung 7, Technische Universitat Berlin, Germany, pp 283-298
Breure AM, Volkering F, Mulder H, Rulkens WH, Van Andel JG (1995) Enhancement of bioavailability by surfactants. In: WJ van den Brink, R Bosman, F Arendt (eds), Contaminated Soil '95, Vol 2, Kluwer Academic Publishers, Dordrecht, The Netherlands, pp 939-948
Hellendoorn L, Mulder H, Ottengraf SPP, Van den Heuvel JC (1998) Oxygen concentration profiles in pellets of artificially immobilized Aspergillus. Biotechnol. Bioeng. 58:478-485.
Mulder H (1995) Effecten van fysisch-chemische processen op de biobeschikbaar-heid en microbiologische omzetting van aan grondfracties gebonden prioritaire afvalstoffen. RIVM nr 715901001, RIVM, Bilthoven, The Netherlands
Mulder H, Breure AM, Rulkens WH (1998) Bioremediation potential as influenced by the physical status of PAH pollutants. In: Contaminated Soil '98, Vol 1, Thomas Telford, London, UK, pp 133-142
Mulder H, Breure AM, Rulkens WH (1999) Effect of mass-transfer limitations on the bioavailability of sorbed naphthalene in artificial soil aggregates, submitted for publication
Mulder H, Breure AM, Rulkens WH (1999) Prediction of bioremediation periods for PAH soil pollutants in different physical states by mechanistic models, submitted for publication.
Mulder H, Breure AM, Van Andel JG, Grotenhuis JTC, Rulkens WH (1997) Physicochemical processes affecting the bioavailability of PAHs. In: In Situ and On-Site bioremediation Vol 5, Battelle Press, Columbus, Ohio, USA, pp 643-648
Mulder H, Breure AM, Van Andel JG, Grotenhuis JTC, Rulkens WH (1998) Influence of hydrodynamic conditions on naphthalene dissolution and subsequent biodegradation. Biotechnol. Bioeng. 57:145-154
Mulder H, Breure AM, Van Honschooten D, Grotenhuis JTC, Van Andel JG, Rulkens WH (1998) Effect of biofilm formation by Pseudomonas 8909N on the bioavailability of solid naphthalene. Appl. Microbiol. Biotechnol. 50: 277-283
207

Mulder H, Wassink GR, Breure AM, Van Andel JG, Rulkens WH (1998) Effect of nonionic surfactants on naphthalene dissolution and biodegradation. Biotechnol. Bioeng. 60: 397-407
Abstracts
Mulder H, Breure AM, Rulkens WH (1996) Effect of hydrodynamics on PAH bioavailability. In: MJ Lexmond (ed), Bodem Breed '96, Blije Werelt, Lunteren, Programmabureau Bodemonderzoek, Wageningen, The Netherlands, pp 159-160
Mulder H, Breure AM, Van Andel JG, Grotenhuis JTC, Rulkens WH (1996) Phenomena related to a lack of bioavailability. In: Workshop on soil sanitation, Technische Universitat Hamburg Harburg, Hamburg, Germany
Mulder H, Breure AM, Van Andel JG, Grotenhuis JTC, Rulkens WH (1997) Physicochemical processes affecting the bioavailability of PAHs In: MJ Lexmond (ed), Bodem Breed '97, Blije Werelt, Lunteren, The Netherlands, Programmabureau Bodemonderzoek, Wageningen, pp 113-114
Mulder H, Breure AM, Rulkens WH (1998) Bioremediation potential as influenced by the physical states of PAH pollutants. In: Wageningen meets Hamburg-Harburg '98, Wageningen Agricultural University, Wageningen, The Netherlands
Mulder H, Breure AM, Rulkens WH (1998) Mass transfer and sorption processes influence PAH bioavailability and biodegradation. In: Interfaces in environmental chemistry and toxicology, 8th annual meeting of SETAC-Europe, Bordeaux, France
208