Relating fracture mechanics and fatigue lifetime prediction · PDF fileRelating fracture...
17
1 Relating fracture mechanics and fatigue lifetime prediction Kalman Ziha University of Zagreb, Faculty of Mechanical Engineering and Naval Architecture E-mail: [email protected] Department of Naval Architecture and Ocean Engineering, Ivana Lucica 5, Zagreb, Croatia Abstract: This article presents how to link together the results of fatigue crack growth tests, analytic fracture mechanics and experimental methods of fatigue lifetime predictions. The study at the beginning investigates the effect of mechanical load redistribution among failed and intact micro-structural bonds along fatigue crack growth to final crack at vulnerable locations in materials and structures under cyclic loads. The microstructural load redistribution model is analytically formulated as a mechanical interaction between fatigue crack growth and fatigue endurance on the macroscopic level. The article in continuation investigates how to link the parameters of fatigue crack growth in fracture mechanics to parameters of fatigue life directly from the work done on crack growth determined by testing. The article at the end illustrates the application of the analytic procedure for fatigue lifetime prediction that combines fracture mechanics and the load redistribution model for determination of S-N curve parameters important in structural analysis and design. In this research the fatigue life time parameters are derived from a single fatigue crack growth experiment instead from normally required sets of fatigue tests for different loading conditions. Keywords: fatigue; fracture mechanics; crack growth; interaction; fatigue life; S-N curves; 1. Introduction The aim of this work is to evaluate and verify fatigue characteristics of materials and structures under cyclic loads common to analytic fracture mechanics and experimental fatigue lifetime predictions straightforwardly from precisely recorded Fatigue Crack Growth (FCG) curves. The article keep hold of the characteristics of FCG and FCG rates as defined in fracture mechanics 1–3 by using Stress Intensity Factors (SIF) determined through investigation of stress fields in materials at the end of the crack 4-5 Fatigue parameters in fracture mechanics in general can be determined analytically, by testing on carefully prepared test specimen 6–7 or computationally by using complex numerical models and finite element stress analysis 8-10. The investigations in this article of practical analytical procedures in which fatigue parameters can be evaluated directly from FCG curves are encouraged through the reported improvements in precision of fatigue crack size measurements 1112. The article at the beginning presents the mechanical load redistribution model along the crack to its end on a lattice of microstructural particles in crystalline materials following the concept of crack growth kinetics 13. The study reveals the empirical concept of Cause-and- Effect-Interaction (CEI) 14-17 for mathematical formulation of Fatigue crack growth and Endurance Interaction (FEI) induced by overstressing due to load redistribution under cyclic loads. The mechanical interaction model of load redistribution replaces in the article the commonly used numerical methods for fitting of crack growth and crack growth rate 18. Lasting efforts and numerous experiments have been devoted since earlier 19 to investigation of fatigue life prediction methods 20 and of safer criteria for the prediction of fatigue failures 21. It is recognized earlier in the energy-based approach how the local strain energy density can be taken as a consistent fatigue damage parameter [22- 26]. The strain energy-based life prediction criterion can be extended to include the effects of both mean stress and ratcheting [27]. Moreover, the Neuber’s rule can be interpreted in terms of the total
Transcript of Relating fracture mechanics and fatigue lifetime prediction · PDF fileRelating fracture...
1
Relating fracture mechanics and fatigue lifetime prediction
Kalman Ziha University of Zagreb, Faculty of Mechanical Engineering and Naval Architecture
E-mail: [email protected] Department of Naval Architecture and Ocean Engineering, Ivana Lucica 5, Zagreb, Croatia
Abstract: This article presents how to link together the results of fatigue crack growth tests, analytic fracture
mechanics and experimental methods of fatigue lifetime predictions. The study at the beginning investigates the effect
of mechanical load redistribution among failed and intact micro-structural bonds along fatigue crack growth to final
crack at vulnerable locations in materials and structures under cyclic loads. The microstructural load redistribution
model is analytically formulated as a mechanical interaction between fatigue crack growth and fatigue endurance on
the macroscopic level. The article in continuation investigates how to link the parameters of fatigue crack growth in
fracture mechanics to parameters of fatigue life directly from the work done on crack growth determined by testing.
The article at the end illustrates the application of the analytic procedure for fatigue lifetime prediction that combines
fracture mechanics and the load redistribution model for determination of S-N curve parameters important in structural
analysis and design. In this research the fatigue life time parameters are derived from a single fatigue crack growth
experiment instead from normally required sets of fatigue tests for different loading conditions.
Keywords: fatigue; fracture mechanics; crack growth; interaction; fatigue life; S-N curves;
1. Introduction
The aim of this work is to evaluate and verify fatigue characteristics of materials and structures under cyclic loads
common to analytic fracture mechanics and experimental fatigue lifetime predictions straightforwardly from precisely
recorded Fatigue Crack Growth (FCG) curves. The article keep hold of the characteristics of FCG and FCG rates as
defined in fracture mechanics 1–3 by using Stress Intensity Factors (SIF) determined through investigation of stress
fields in materials at the end of the crack 4-5Fatigue parameters in fracture mechanics in general can be determined
analytically, by testing on carefully prepared test specimen 6–7 or computationally by using complex numerical
models and finite element stress analysis 8-10. The investigations in this article of practical analytical procedures in
which fatigue parameters can be evaluated directly from FCG curves are encouraged through the reported
improvements in precision of fatigue crack size measurements 1112. The article at the beginning presents the
mechanical load redistribution model along the crack to its end on a lattice of microstructural particles in crystalline
materials following the concept of crack growth kinetics 13. The study reveals the empirical concept of Cause-and-
Effect-Interaction (CEI) 14-17 for mathematical formulation of Fatigue crack growth and Endurance Interaction
(FEI) induced by overstressing due to load redistribution under cyclic loads. The mechanical interaction model of load
redistribution replaces in the article the commonly used numerical methods for fitting of crack growth and crack
growth rate 18. Lasting efforts and numerous experiments have been devoted since earlier 19 to investigation of
fatigue life prediction methods 20 and of safer criteria for the prediction of fatigue failures 21.
It is recognized earlier in the energy-based approach how the local strain energy density can be taken as a consistent
fatigue damage parameter [22- 26]. The strain energy-based life prediction criterion can be extended to include the
effects of both mean stress and ratcheting [27]. Moreover, the Neuber’s rule can be interpreted in terms of the total

2
energy densities [28]. It is also reported that the local strain energy approach to some types of welded joints showed a
quite satisfactory assessment of the fatigue life [29]. A unified theory based on the cyclic strain energy density
criterion can be applied for cumulative fatigue damage assessment [30]. The link between the strain energy density
and the notch stress intensity factors is discussed recently considering some typical welded joints and sharp notches.
The use of a coarse mesh in the finite element models and multiscaling based on local strain energy density evaluation
were found promising [31-34] in fatigue analysis. The energy approach based on the internal strain energy density
formulation has been found useful in practical computation of notch stress intensity factors [35]. The minimum strain
energy density criterion can be modified by employing the von Mises elasto-plastic boundary [36]. Life prediction
models have been developed with the energy-based approach to define a temperature-compensating parameter [37] as
well as for thermo-mechanical fatigue [38] and for materials under biaxial loading [39]. It is also demonstrated that
some processes in metallurgy such as martensite formation can be modeled as function of the cumulative strain energy
density [40]. Investigation of temperature effects revealed that the plastic strain energy density was nearly invariant
through the entire fatigue life [41].
However, in contrast to the energy formulation based on the internal strain energy density in materials under cyclic
loads, the article investigates the possibility of extraction of fatigue life parameters directly from externally
measurable work done along the crack growth obtainable by fatigue testing. The energy of resistance to cracking
investigated in this article i.e. the energy absorption equivalent to the work done on crack growth by externally applied
cyclic loads can be calculated through integration of experimentally derived FCG curves. The external energy
approach based on work done on crack growth advocated in the article links the parameters of FCG to fracture
mechanics for assessment of the fatigue life time parameters of S-N curves [42] The mathematical FEI model
elaborated in the article may provide additional analytical tool for faster evaluation and verification of fatigue life with
less experimental efforts directly from a single FCG test.
Reported FCG test data for steel and weldments [43] were utilized in the article to demonstrate the application of the
mathematical formulation developed in this research on the basis of load redistribution model and on FEI concept to
support the analytical procedure for FCG presentation and fatigue life time prediction in materials engineering.
2. Mechanical load redistribution model of FCG
Fracture mechanics 1–3 focuses on changes of stress fields in materials under cyclic loads at the crack tip 4
Instead, this aericle focuses on the possibility of interaction between the FCG and redistribution of loads among failed
and intact micro-structural mechanical bonds of material particles along the growing crack to its end. The load
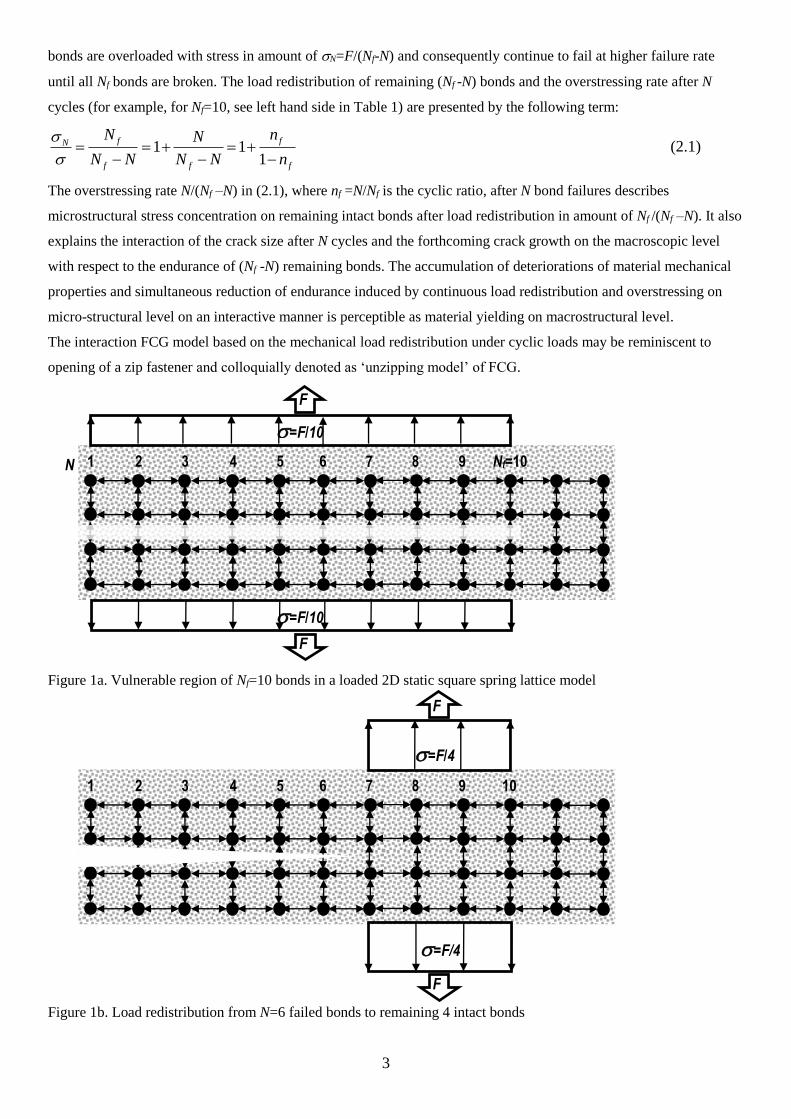
redistribution process is described in the sequel on an example of a 2D square spring lattice 13 of bonds of equal or
similar mechanical properties among material particles in a parallel systemic arrangement (Fig. 1). The stress =F/Nf
induced by uniaxial tensile cyclic force of fixed intensity in nominal amount of F activates successive bond failures at
increasing failure rate in each load cycle N until the finite possible number Nf of bond failures in the vulnerable region
(highlighted in Fig. 1a). After the first bond has failed, the load of unchanged intensity F redistributes in the second
cycle to remaining Nf -1 bonds simultaneously increasing the stress in intact bonds to amount of 1=F/(Nf -1).
Subsequently, the load F redistributes after each of N cycles to remaining (Nf -N) intact bonds (for example, Nf=10 and
for N=6 failed bonds see Fig. 1b). The result of the load redistribution after N cycles is that the remaining (Nf -N) intact
3
bonds are overloaded with stress in amount of N=F/(Nf-N) and consequently continue to fail at higher failure rate
until all Nf bonds are broken. The load redistribution of remaining (Nf -N) bonds and the overstressing rate after N
cycles (for example, for Nf=10, see left hand side in Table 1) are presented by the following term:
1 11
f fN
f f f
N nN
N N N N n
(2.1)
The overstressing rate N/(Nf –N) in (2.1), where nf =N/Nf is the cyclic ratio, after N bond failures describes
microstructural stress concentration on remaining intact bonds after load redistribution in amount of Nf /(Nf –N). It also
explains the interaction of the crack size after N cycles and the forthcoming crack growth on the macroscopic level
with respect to the endurance of (Nf -N) remaining bonds. The accumulation of deteriorations of material mechanical
properties and simultaneous reduction of endurance induced by continuous load redistribution and overstressing on
micro-structural level on an interactive manner is perceptible as material yielding on macrostructural level.
The interaction FCG model based on the mechanical load redistribution under cyclic loads may be reminiscent to
opening of a zip fastener and colloquially denoted as ‘unzipping model’ of FCG.
Figure 1a. Vulnerable region of Nf=10 bonds in a loaded 2D static square spring lattice model
Figure 1b. Load redistribution from N=6 failed bonds to remaining 4 intact bonds
5 1 2 3 4 6 7 8 9 Nf=10
F
F
=F/10
=F/10
N
5 1 2 3 4 6 7 8 9 10
F
F
=F/4
=F/4
4
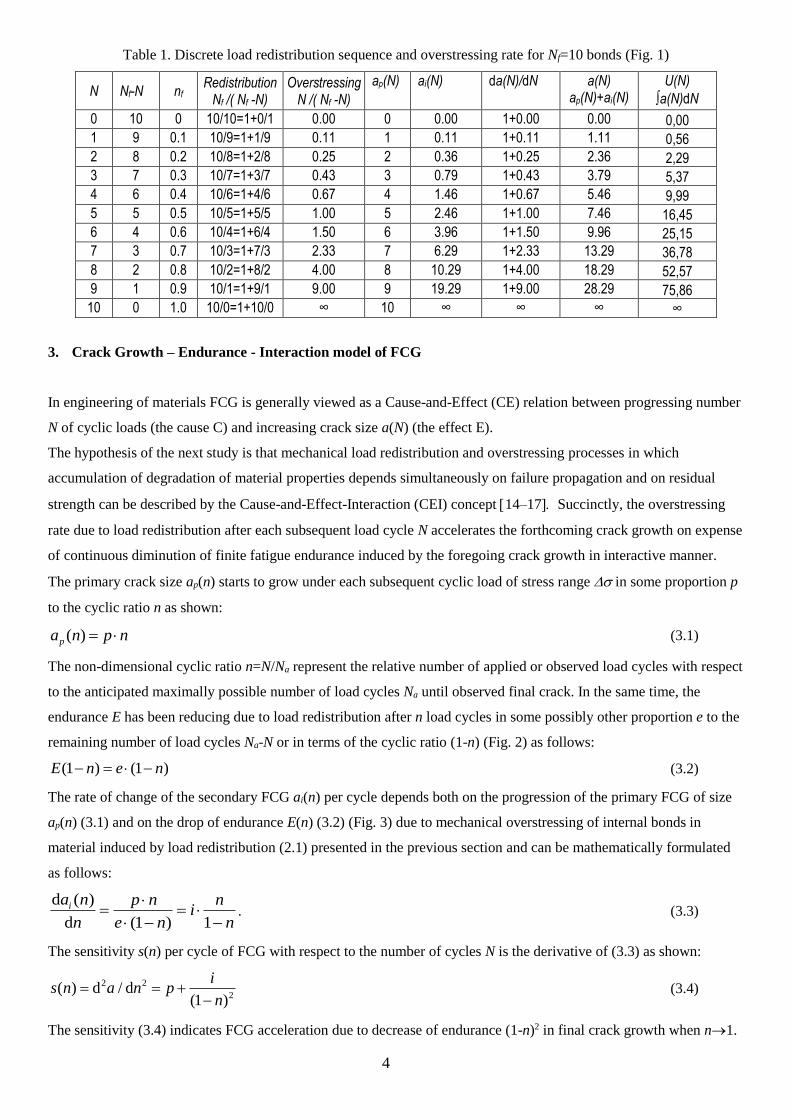
Table 1. Discrete load redistribution sequence and overstressing rate for Nf=10 bonds (Fig. 1)
N Nf-N nf Redistribution
Nf /( Nf -N) Overstressing
N /( Nf -N)
ap(N) ai(N) da(N)/dN a(N) ap(N)+ai(N)
U(N)
a(N)dN
0 10 0 10/10=1+0/1
0
0.00 0 0.00 1+0.00 0.00 0,00
1 9 0.1 10/9=1+1/9 0.11 1 0.11 1+0.11 1.11 0,56
2 8 0.2 10/8=1+2/8 0.25 2 0.36 1+0.25 2.36 2,29
3 7 0.3 10/7=1+3/7 0.43 3 0.79 1+0.43 3.79 5,37
4 6 0.4 10/6=1+4/6 0.67 4 1.46 1+0.67 5.46 9,99
5 5 0.5 10/5=1+5/5 1.00 5 2.46 1+1.00 7.46 16,45
6 4 0.6 10/4=1+6/4 1.50 6 3.96 1+1.50 9.96 25,15
7 3 0.7 10/3=1+7/3 2.33 7 6.29 1+2.33 13.29 36,78
8 2 0.8 10/2=1+8/2 4.00 8 10.29 1+4.00 18.29 52,57
9 1 0.9 10/1=1+9/1 9.00 9 19.29 1+9.00 28.29 75,86
10 0 1.0 10/0=1+10/0 ∞ 10 ∞ ∞ ∞ ∞
3. Crack Growth – Endurance - Interaction model of FCG
In engineering of materials FCG is generally viewed as a Cause-and-Effect (CE) relation between progressing number
N of cyclic loads (the cause C) and increasing crack size a(N) (the effect E).
The hypothesis of the next study is that mechanical load redistribution and overstressing processes in which
accumulation of degradation of material properties depends simultaneously on failure propagation and on residual
strength can be described by the Cause-and-Effect-Interaction (CEI) concept 14–17Succinctly, the overstressing
rate due to load redistribution after each subsequent load cycle N accelerates the forthcoming crack growth on expense
of continuous diminution of finite fatigue endurance induced by the foregoing crack growth in interactive manner.
The primary crack size ap(n) starts to grow under each subsequent cyclic load of stress range in some proportion p
to the cyclic ratio n as shown:
( )pa n p n (3.1)
The non-dimensional cyclic ratio n=N/Na represent the relative number of applied or observed load cycles with respect
to the anticipated maximally possible number of load cycles Na until observed final crack. In the same time, the
endurance E has been reducing due to load redistribution after n load cycles in some possibly other proportion e to the
remaining number of load cycles Na-N or in terms of the cyclic ratio (1-n) (Fig. 2) as follows:
(1 ) (1 )E n e n (3.2)
The rate of change of the secondary FCG ai(n) per cycle depends both on the progression of the primary FCG of size
ap(n) (3.1) and on the drop of endurance E(n) (3.2) (Fig. 3) due to mechanical overstressing of internal bonds in
material induced by load redistribution (2.1) presented in the previous section and can be mathematically formulated
as follows:
d ( )
d (1 ) 1
ia n p n ni
n e n n
. (3.3)
The sensitivity s(n) per cycle of FCG with respect to the number of cycles N is the derivative of (3.3) as shown:
2 2
2( ) d / d
(1 )
is n a n p
n
(3.4)
The sensitivity (3.4) indicates FCG acceleration due to decrease of endurance (1-n)2 in final crack growth when n1.

5
The example of discrete FCG and advancement of overstressing for Nf=10 bonds where ai(N)=Naai(n)=(N/(Na-N) for
N=1, 2, ..., 10, illustrates the mechanical load redistribution model. The work done on crack growth is then represented
by the integral U(N)=a(N)dN (right hand side in Table 1).
The transition from micro to macro-structural level instead of the discrete model (2.1) (Table. 1, Fig.2 and Fig. 3)
requires calculus for continuous analytic formulation of FCG for innumerable but finite number of bonds. The specific
increase of the crack size in each load cycle of stress range , for example in mm/cycles, can be calculated as the
integral up to an arbitrary number of cycles represented by the cyclic ratio n using (3.1-3.4) as follows:
0
d ( )( ) ( ) ( ) ( ) ln(1 )
d
n
ip i
a na n a n a n p n dn p i n i n
n (3.5)
The integration of (3.5) up to an arbitrary cyclic ratio n provides the expression for specific energy absorption of work
done during crack growth per loading cycle that can be considered as the measure of fatigue strength equal to the
energy of resistance to fatigue under cyclic stress of constant range , for example in J/(N x cycles) or in mm/cycles,
as shown:
2
0
( ) ( ) ( ) / 2 (1 ) ln(1 )
n
u n a n dn p i n i n n n (3.6)
For n1 in (3.9) the full specific energy of resistance to cracking per cycle is u(n)=(p+i)/2 (Fig. 3).
The interaction intensity parameter i can be directly evaluated from the specific work u done on FCG (3.6) as follows:
2
2
( ) / 2( )
/ 2 (1 ) ln(1 )
u n p ni n
n n n n
(3.7)
The CEI model of FCG holds the load redistribution for the physical cause of interaction between the number of load
cycles N of stress range (the cause C) and the size of crack growth a(N) (the effect E). The Fatigue crack growth
and Endurance Interaction (3.3) denoted in the article as the FEI model describes the stress concentration process in
remained intact parts along a crack in material caused by overstressing due to load redistribution during cyclic loading
as described in previous section (2.1). The FEI is geometrically interpretable by continuous increase of the angle of
tangent n/(1-n) on the FCG curve during crack growth (Fig. 3). The crack size curve a(N,) for anticipated
asymptote Na of crack growth under applied cyclic load of stress range , for example in mm, is then simply as
shown:
( , ) ( ) ( )aa N N a n (3.8)
The overall fatigue crack size a(N) after N load cycles (3.8) consists of the primary linear growth ap(N)=Na ap(n) (3.1)
that depends on the initial state of fatigue strength at the beginning of loading and of observable and quantifiable
secondary growth ai(N) induced by the interaction between fatigue and endurance due to load redistribution.
Propensity p expresses the initial state of fatigue strength of material or structure at the beginning of the loading
process. The parameter i=p/e in (3.3 - 3.6) is the measure of intensity of interaction of ensuing structural fatigue
failures with the remaining fatigue endurance. The term (3.5) represents the fatigue yielding curve per cycle (Fig. 3)
which characterizes the effect of overstressing and stress concentration due to load redistribution and the yielding
induced by interaction between fatigue and endurance.
The next consideration aims to define and make practical use of the quantifiable work W(N) done on crack growth
until N cycles during fatigue testing under applied external cyclic load of constant stress range t.
6
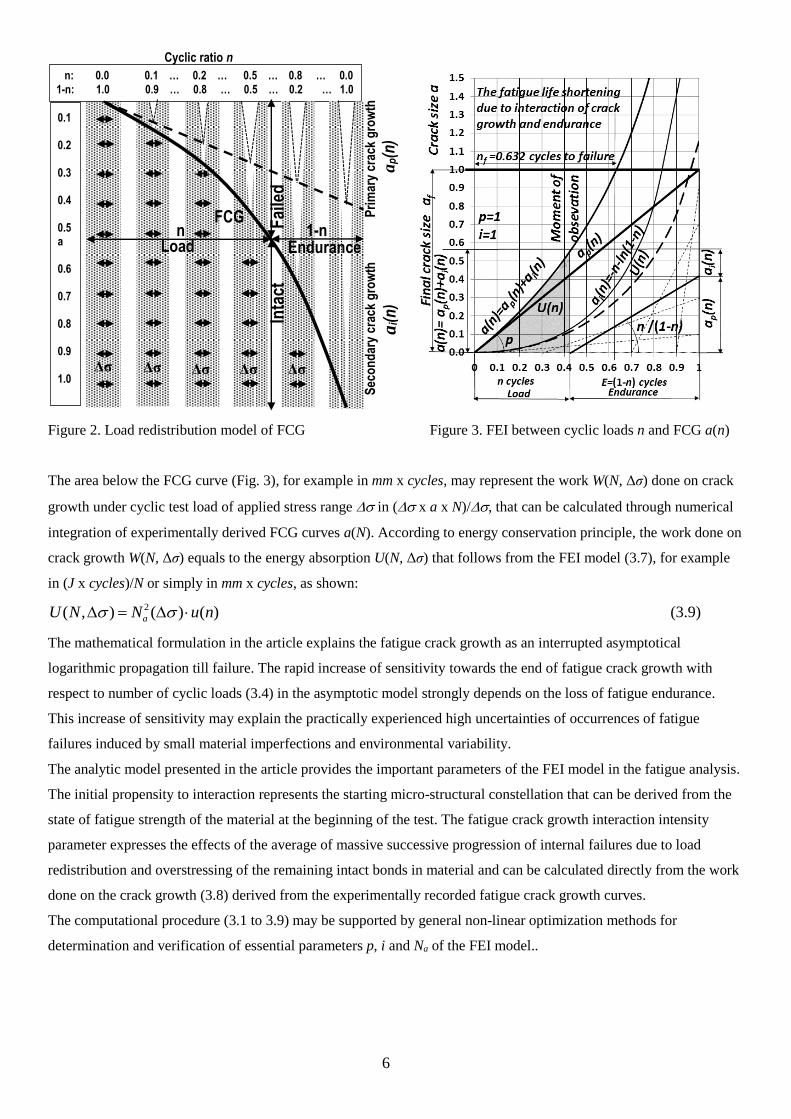
Figure 2. Load redistribution model of FCG Figure 3. FEI between cyclic loads n and FCG a(n)
The area below the FCG curve (Fig. 3), for example in mm x cycles, may represent the work W(N, Δσ) done on crack
growth under cyclic test load of applied stress range in ( x a x N)/, that can be calculated through numerical
integration of experimentally derived FCG curves a(N). According to energy conservation principle, the work done on
crack growth W(N, Δσ) equals to the energy absorption U(N, Δσ) that follows from the FEI model (3.7), for example
in (J x cycles)/N or simply in mm x cycles, as shown:
2( , ) ( ) ( )aU N N u n (3.9)
The mathematical formulation in the article explains the fatigue crack growth as an interrupted asymptotical
logarithmic propagation till failure. The rapid increase of sensitivity towards the end of fatigue crack growth with
respect to number of cyclic loads (3.4) in the asymptotic model strongly depends on the loss of fatigue endurance.
This increase of sensitivity may explain the practically experienced high uncertainties of occurrences of fatigue
failures induced by small material imperfections and environmental variability.
The analytic model presented in the article provides the important parameters of the FEI model in the fatigue analysis.
The initial propensity to interaction represents the starting micro-structural constellation that can be derived from the
state of fatigue strength of the material at the beginning of the test. The fatigue crack growth interaction intensity
parameter expresses the effects of the average of massive successive progression of internal failures due to load
redistribution and overstressing of the remaining intact bonds in material and can be calculated directly from the work
done on the crack growth (3.8) derived from the experimentally recorded fatigue crack growth curves.
The computational procedure (3.1 to 3.9) may be supported by general non-linear optimization methods for
determination and verification of essential parameters p, i and Na of the FEI model..
n: 0.0 0.1 … 0.2 … 0.5 … 0.8 … 0.0
1-n: 1.0 0.9 … 0.8 … 0.5 … 0.2 … 1.0
0.1 0.2 0.3 0.4 0.5 a 0.6 0.7 0.8 0.9 1.0
Load
Pri
mar
y cr
ack
gro
wth
ap(n
) S
eco
nd
ary
crac
k g
row
th
ai(n
)
Δσ Δσ Δσ Δσ Δσ
Fai
led
In
tact
n 1-n Endurance
FCG
Cyclic ratio n
7
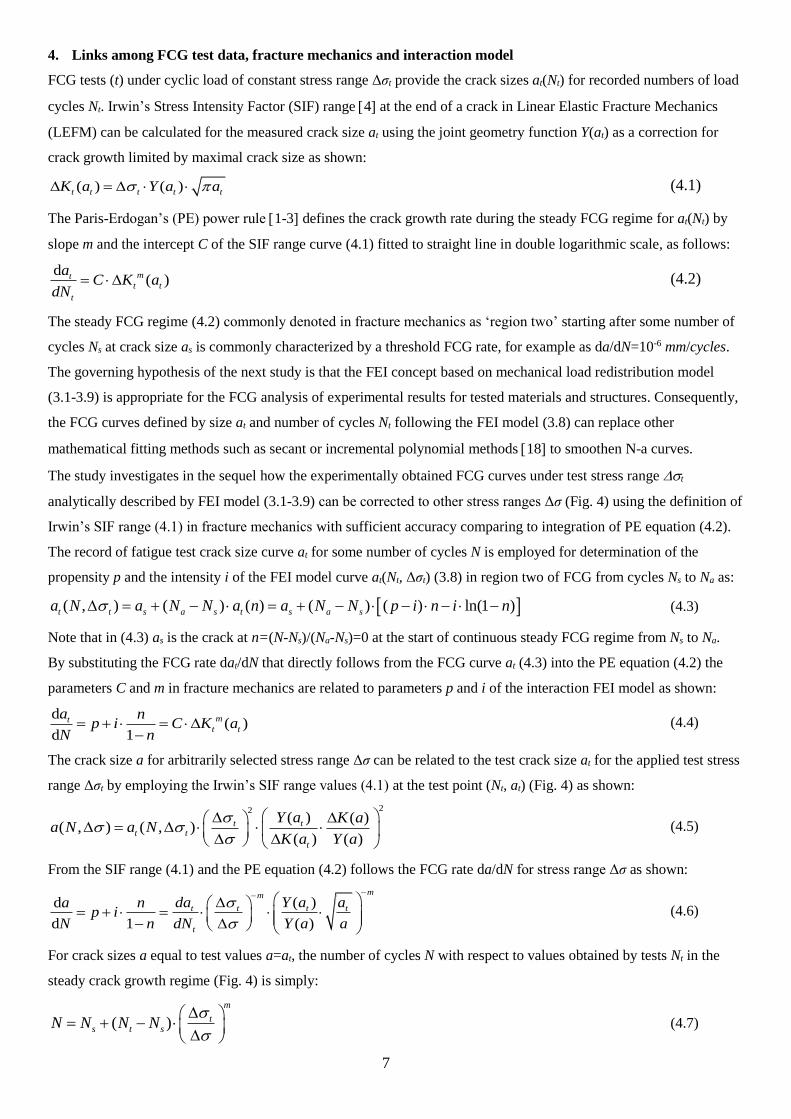
4. Links among FCG test data, fracture mechanics and interaction model
FCG tests (t) under cyclic load of constant stress range Δσt provide the crack sizes at(Nt) for recorded numbers of load
cycles Nt. Irwin’s Stress Intensity Factor (SIF) range 4at the end of a crack in Linear Elastic Fracture Mechanics
(LEFM) can be calculated for the measured crack size at using the joint geometry function Y(at) as a correction for
crack growth limited by maximal crack size as shown:
( ) ( )t t t t tK a Y a a (4.1)
The Paris-Erdogan’s (PE) power rule 1-3defines the crack growth rate during the steady FCG regime for at(Nt) by
slope m and the intercept C of the SIF range curve (4.1) fitted to straight line in double logarithmic scale, as follows:
d( )mt
t t
t
aC K a
dN (4.2)
The steady FCG regime (4.2) commonly denoted in fracture mechanics as ‘region two’ starting after some number of
cycles Ns at crack size as is commonly characterized by a threshold FCG rate, for example as da/dN=10-6 mm/cycles.
The governing hypothesis of the next study is that the FEI concept based on mechanical load redistribution model
(3.1-3.9) is appropriate for the FCG analysis of experimental results for tested materials and structures. Consequently,
the FCG curves defined by size at and number of cycles Nt following the FEI model (3.8) can replace other
mathematical fitting methods such as secant or incremental polynomial methods 18 to smoothen N-a curves.
The study investigates in the sequel how the experimentally obtained FCG curves under test stress range t
analytically described by FEI model (3.1-3.9) can be corrected to other stress ranges Δσ (Fig. 4) using the definition of
Irwin’s SIF range (4.1) in fracture mechanics with sufficient accuracy comparing to integration of PE equation (4.2).
The record of fatigue test crack size curve at for some number of cycles N is employed for determination of the
propensity p and the intensity i of the FEI model curve at(Nt, Δσt) (3.8) in region two of FCG from cycles Ns to Na as:
( , ) ( ) ( ) ( ) ( ) ln(1 )t t s a s t s a sa N a N N a n a N N p i n i n (4.3)
Note that in (4.3) as is the crack at n=(N-Ns)/(Na-Ns)=0 at the start of continuous steady FCG regime from Ns to Na.
By substituting the FCG rate dat/dN that directly follows from the FCG curve at (4.3) into the PE equation (4.2) the
parameters C and m in fracture mechanics are related to parameters p and i of the interaction FEI model as shown:
d( )
d 1
mtt t
a np i C K a
N n
(4.4)
The crack size a for arbitrarily selected stress range Δσ can be related to the test crack size at for the applied test stress
range Δσt by employing the Irwin’s SIF range values (4.1) at the test point (Nt, at) (Fig. 4) as shown:
22( ) ( )
( , ) ( , )( ) ( )
t tt t
t
Y a K aa N a N
K a Y a
(4.5)
From the SIF range (4.1) and the PE equation (4.2) follows the FCG rate da/dN for stress range Δσ as shown:
( )d
d 1 ( )
mm
t t t t
t
da Y a aa np i
N n dN Y a a
(4.6)
For crack sizes a equal to test values a=at, the number of cycles N with respect to values obtained by tests Nt in the
steady crack growth regime (Fig. 4) is simply:
( )
m
ts t sN N N N
(4.7)
8
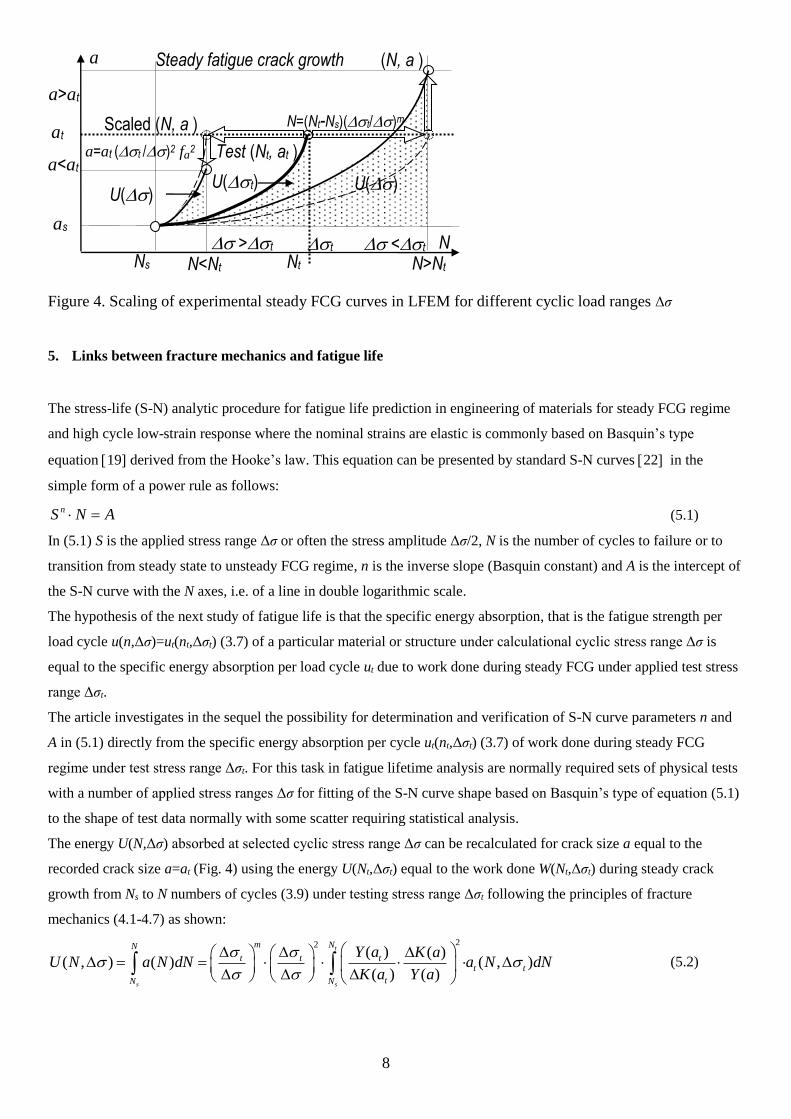
Figure 4. Scaling of experimental steady FCG curves in LFEM for different cyclic load ranges Δσ
5. Links between fracture mechanics and fatigue life
The stress-life (S-N) analytic procedure for fatigue life prediction in engineering of materials for steady FCG regime
and high cycle low-strain response where the nominal strains are elastic is commonly based on Basquin’s type
equation 19derived from the Hooke’s law. This equation can be presented by standard S-N curves 22 in the
simple form of a power rule as follows:
nS N A (5.1)
In (5.1) S is the applied stress range Δσ or often the stress amplitude Δσ/2, N is the number of cycles to failure or to
transition from steady state to unsteady FCG regime, n is the inverse slope (Basquin constant) and A is the intercept of
the S-N curve with the N axes, i.e. of a line in double logarithmic scale.
The hypothesis of the next study of fatigue life is that the specific energy absorption, that is the fatigue strength per
load cycle u(n,Δσ)=ut(nt,Δσt) (3.7) of a particular material or structure under calculational cyclic stress range Δσ is
equal to the specific energy absorption per load cycle ut due to work done during steady FCG under applied test stress
range Δσt.
The article investigates in the sequel the possibility for determination and verification of S-N curve parameters n and
A in (5.1) directly from the specific energy absorption per cycle ut(nt,Δσt) (3.7) of work done during steady FCG
regime under test stress range Δσt. For this task in fatigue lifetime analysis are normally required sets of physical tests
with a number of applied stress ranges Δσ for fitting of the S-N curve shape based on Basquin’s type of equation (5.1)
to the shape of test data normally with some scatter requiring statistical analysis.
The energy U(N,Δσ) absorbed at selected cyclic stress range Δσ can be recalculated for crack size a equal to the
recorded crack size a=at (Fig. 4) using the energy U(Nt,Δσt) equal to the work done W(Nt,Δσt) during steady crack
growth from Ns to N numbers of cycles (3.9) under testing stress range Δσt following the principles of fracture
mechanics (4.1-4.7) as shown:
22( ) ( )
( , ) ( ) ( , )( ) ( )
t
s s
m NN
t t tt t
tN N
Y a K aU N a N dN a N dN
K a Y a
(5.2)
Nt N
at
U()
N>Nt
a<at
a>at
N<Nt
Test (Nt, at )
as
U(t) U()
a=at (t /)2 fa2
Steady fatigue crack growth a
N=(Nt-Ns)(t/)m Scaled (N, a )
(N, a )
>t <t t Ns

9
Scaling factor fa(Δσ) with respect to the known energy absorption determined in test condition under cyclic stress
range Δσt follows from (5.2) and for each applied stress range Δσ can be calculated as shown:
2
2 2( ) ( )( , ) ( ) ( , ) ( ) ( , )
( ) ( )
t t
s s
N N
tt t a t t a t t
tN N
Y a K aa N dN f a N dN f U N
K a Y a
(5.3)
The relation between the specific energy absorption under optional stress range S=Δσ and under test stress range
St=Δσt follows from (5.3) and from the FEI model (3.9) in the following form:
2 21 1
2 2( ) ( , ) ( ) ( , )m m
s t a t s t t tS N N u n S f N N u n
(5.4)
Accepting the hypothesis of constant fatigue strength u=ut, the above relation (5.4) can be rewritten in the form of
standard S-N curve format as Sn N=A in (5.1) but additionally shifted with respect to total number of cycles N to
transition from the steady to unsteady FCG.
The scaling factor fa(Δσ) in (5.3) represents the effects of crack size on crack growth for finite sheet implying the joint
geometry function Y and the SIF range ΔK according to laws of fracture mechanics (4.5). For infinite sheet with
constant joint geometry function Y(a) and for critical SIF Kcr the correction factor is fa=1. The value of the inverse
slope n of S-N curve (Basquin’s constant) in (5.1) for steady FCG regime in infinite sheet is then a simple linear
function of the slope m of the SIF range curve according to PE law in (4.2) as presented below:
12
mn (5.5)
For nonlinear or non-constant geometry function Y(a) typical for finite sheets or structures and for critical SIF Kcr the
scaling factor fa(Δσ) in (5.4) depends on the effect of crack size on crack growth Y(at)/Y(a) for tested Δσt and applied
Δσ stress ranges and can be adjusted by finding correction c to inverse slope n from the following condition:
12 2
( )
m mc
t taf
(5.6)
The correction c in (5.6) implies the changes caused by effect of crack size to crack growth for optional stress range
Δσ as shown:
log ( )1
log( / )
a
t
fc
(5.7)
The variable inverse slope n in (5.1) is modified for different stress ranges Δσ for finite structures as follows:
2
mn c (5.8)
The intercept A of the S-N curve with the N-axis in (5.1) follows from test data Δσt and Nt. ,For appropriate value of
FCG rate (4.2) that characterizes the transition from steady to unsteady FCG it is A= Δσtn Nt cycles. For the reported
number of cycles to total fatigue failure of Nft cycles under constant stress range Δσt, the S-N curve constant A with
limited information about unsteady FCG, can be estimated for the same inverse slope n as A= Δσtn Nft cycles.
The link between fracture mechanics and fatigue life (5.1-5.8) make possible to estimate the characteristics of S-N
curves by numerical calculation for selected calculational values of stress ranges Δσ instead of sets of tests with a
number of material specimens under different cyclic loads.
10
6. Examples
In this section is demonstrated the appropriateness of the FEI model on examples of FCG tests reported for Base
Material (BM) and for Friction Stir Welded joints (FSW) of AISI 409M grade ferritic stainless steel joints [43] (Figs.
5–10).
A. Firstly, the evaluation of interaction parameters of the FEI model based on the reported FCG curve for BM
obtained under testing cyclic load of constant range t=150 MPa at R=0.1 [43] is performed in following steps:
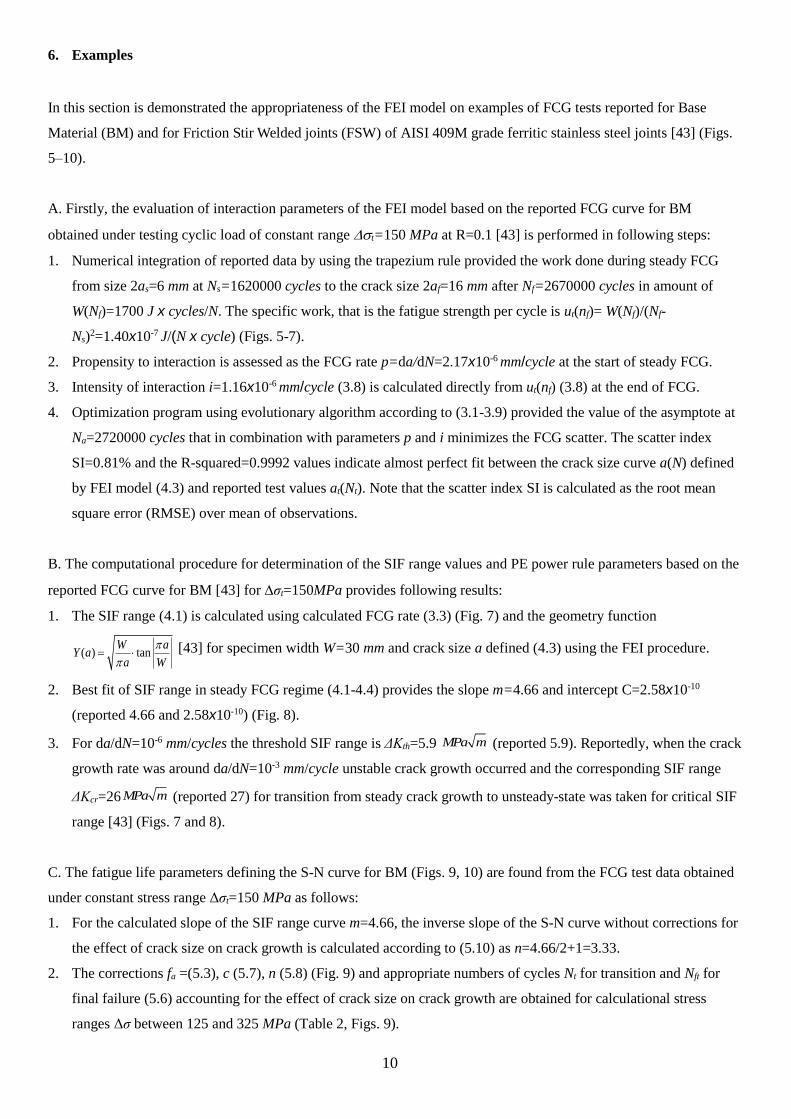
1. Numerical integration of reported data by using the trapezium rule provided the work done during steady FCG
from size 2as=6 mm at Ns=1620000 cycles to the crack size 2af=16 mm after Nf=2670000 cycles in amount of
W(Nf)=1700 J x cycles/N. The specific work, that is the fatigue strength per cycle is ut(nf)= W(Nf)/(Nf-
Ns)2=1.40x10⁻⁷ J/(N x cycle) (Figs. 5-7).
2. Propensity to interaction is assessed as the FCG rate p=da/dN=2.17x10-6 mm/cycle at the start of steady FCG.
3. Intensity of interaction i=1.16x10⁻⁶ mm/cycle (3.8) is calculated directly from ut(nf) (3.8) at the end of FCG.
4. Optimization program using evolutionary algorithm according to (3.1-3.9) provided the value of the asymptote at
Na=2720000 cycles that in combination with parameters p and i minimizes the FCG scatter. The scatter index
SI=0.81% and the R-squared=0.9992 values indicate almost perfect fit between the crack size curve a(N) defined
by FEI model (4.3) and reported test values at(Nt). Note that the scatter index SI is calculated as the root mean
square error (RMSE) over mean of observations.
B. The computational procedure for determination of the SIF range values and PE power rule parameters based on the
reported FCG curve for BM [43] for σt=150MPa provides following results:
1. The SIF range (4.1) is calculated using calculated FCG rate (3.3) (Fig. 7) and the geometry function
( ) tanW a
Y aa W
[43] for specimen width W=30 mm and crack size a defined (4.3) using the FEI procedure.
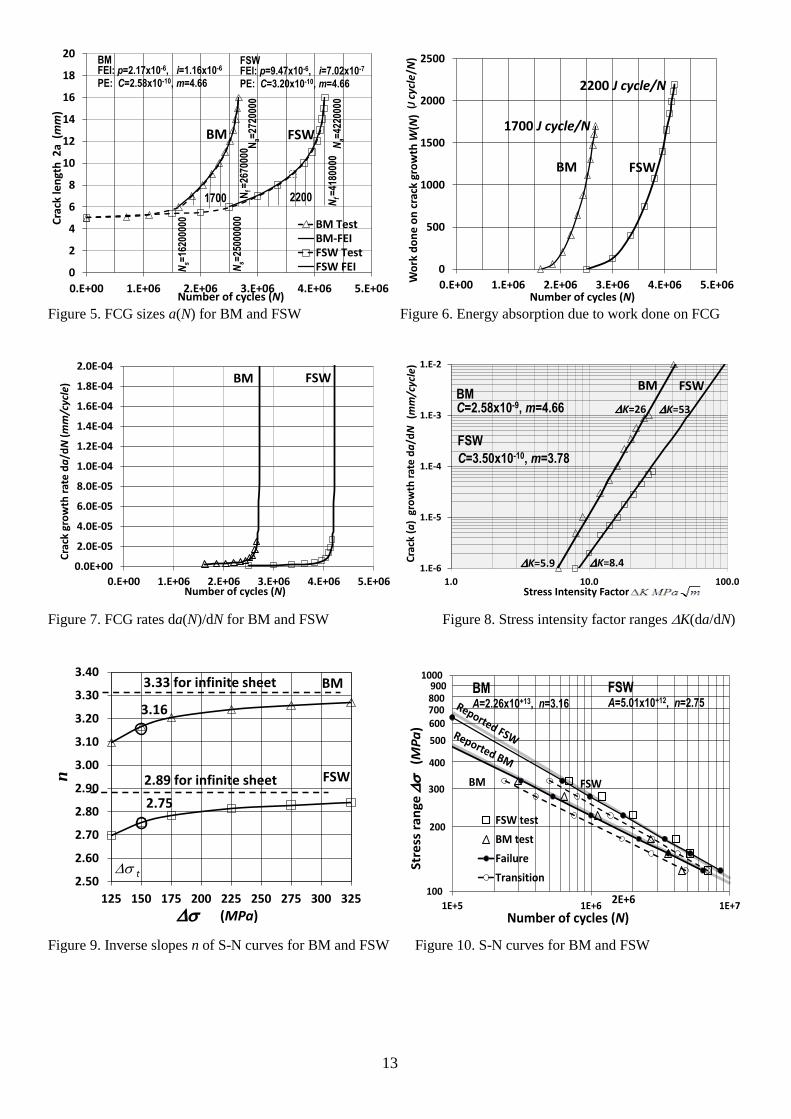
2. Best fit of SIF range in steady FCG regime (4.1-4.4) provides the slope m=4.66 and intercept C=2.58x10⁻¹⁰
(reported 4.66 and 2.58x10⁻¹⁰) (Fig. 8).
3. For da/dN=10-6 mm/cycles the threshold SIF range is ΔKth=5.9 MPa m (reported 5.9). Reportedly, when the crack
growth rate was around da/dN=10-3 mm/cycle unstable crack growth occurred and the corresponding SIF range
ΔKcr=26 MPa m (reported 27) for transition from steady crack growth to unsteady-state was taken for critical SIF
range [43] (Figs. 7 and 8).
C. The fatigue life parameters defining the S-N curve for BM (Figs. 9, 10) are found from the FCG test data obtained
under constant stress range Δσt=150 MPa as follows:
1. For the calculated slope of the SIF range curve m=4.66, the inverse slope of the S-N curve without corrections for
the effect of crack size on crack growth is calculated according to (5.10) as n=4.66/2+1=3.33.
2. The corrections fa =(5.3), c (5.7), n (5.8) (Fig. 9) and appropriate numbers of cycles Nt for transition and Nft for
final failure (5.6) accounting for the effect of crack size on crack growth are obtained for calculational stress
ranges Δσ between 125 and 325 MPa (Table 2, Figs. 9).

11
3. The inverse slope of the S-N curve in amount of n=3.16 (reported n=3.14) that accounts for the corrections for the
effect of crack size on crack growth is assessed for t=150 MPa from Table 2 and Fig. 9.
Note that the reported value n=3.14 is obtained by fitting to a set of fatigue life tests with four specimens for each
of the five loading conditions [43].
4. The transition of steady to unsteady FCG for Δσt=150 MPa occurs reportedly at about FCG rate of da/dN=10-3
mm/cycles for calculated number of cycles Nt=2718700 calculated by FEI model (4.7) providing the S-N curve
intercept A=2.26x10+13 cycles (lower dashed line on Fig. 10).
5. For the reported number of cycles to total fatigue failure of Nft=3600000 for Δσt=150 MPa the S-N curve constant
is Af=2.99x10+13 cycles (upper full line on Fig. 10). Reportedly the stress range of Δσ=185 MPa corresponding to
2x10+6 cycles was taken as an indication of the fatigue strength [43].
The scatter index for the reported S-N curve (n=3.14) with respect to reported experimental data is 37.11% (R-squared
is 0.7416) and for calculated S-N curve data (n=3.16) is 37.58% (R-squared is 0.7349). The scatter index between the
FEI calculated S-N curve data (n=3.16) and reported S-N curve (n=3.14) is 0.11% (R-squared is 0.9999) indicates
very high matching of results.
Table 2. Corrections of S-N curves for the effect of crack size on crack growth for BM
Δσ Δσt/Δσ N
test
fa
(5.3)
c
(5.7)
n
(5.8)
Nt
Transition
Nft
Failure
125.00
1.20 4500000 0.958 0.77 3.10 4854647 6428340 150 1.00 3600000 1.000 0.84 3.16 2718642 3599924 175
.00 0.86 2700000 1.020 0.87 3.20 1665216 220501
6 225.00
0.67 1120000 1.037 0.91 3.24 748844 991590
275.00
0.55 640000 1.045 0.93 3.26 395597 523835
325.00
0.46 300000 1.048 0.94 3.27 232564 307952
D. Secondly, the evaluation of interaction parameters of the FEI model based on the reported FCG curve for FSW
obtained under testing cyclic load of constant range t=150 MPa at R=0.1 [43] is performed in following steps:
1. Numerical integration of reported data by using the trapezium rule provided the work done during steady FCG
from size 2as=6 mm at Ns=2500000 cycles to crack size 2af=16 mm after Nf=4180000 cycles in amount of
W(Nf)=2200 J x cycles/N. The specific work, that is the fatigue strength per cycle is then ut(nf)= W(Nf)/(Nf-
Ns)2=7.44x10⁻⁷ J/(N x cycle) (Figs. 5-7).
2. Propensity to interaction is assessed as the FCG rate p=da/dN=9.47x10-6 mm/cycle at the start of steady FCG.
3. Intensity of interaction i=7.02x10⁻⁷ mm/cycle (3.8) is calculated directly from ut(nf) (3.8) to the end of FCG.
4. Optimization program using evolutionary algorithm according to (3.1-3.9) provided the value of the asymptote at
Na=4220000 cycles that in combination with parameters p and i minimizes the FCG scatter. The scatter index
SI=1.02% and the R-squared=0.9985 indicate very high fit between the crack size curve a(N) defined by FEI
model (4.3) and reported test values at(Nt).
E. The computational procedure for determination of the SIF range values and PE power rule parameters based on the
reported FCG curve for FSW [43] for σt=150MPa provides following results:
1. The SIF range (4.1) is calculated using calculated FCG rate (3.3) (Fig. 7) and the geometry function
( ) tanW a
Y aa W
[43] for specimen width W=30 mm and crack size a defined (4.3) using the FEI procedure.

12
2. Best fit of SIF range in steady FCG regime (4.1-4.4) provides the slope m=3.78 and intercept C=3.20x10⁻¹⁰
(reported 3.78 and 7.48x10⁻¹⁰) (Fig. 8).
3. For da/dN=10-6 mm/cycles the threshold SIF range is ΔKth=8.4 MPa m (reported 8.2). Reportedly, when the crack
growth rate was around da/dN=10-3 mm/cycle unstable crack growth occurred and the corresponding SIF range
ΔKcr=53 MPa m (reported 55) for transition from steady crack growth to unsteady-state was taken for critical SIF
range [43] (Figs. 7 and 8).
F. The fatigue life parameters defining the S-N curve for FSW (Figs. 9, 10) are found from the FCG test data obtained
under constant stress range Δσt=150 MPa as follows:
1. For the calculated slope of the SIF range curve m=3.78, the inverse slope of the S-N curve without corrections for
the effect of crack size on crack growth is calculated according to (5.10) as n=3.78/2+1=2.89.
2. The inverse slope of the S-N curve in amount of n=2.75 (reported n=2.44) that accounts for the corrections for the
effect of crack size on crack growth is assessed for t=150 MPa from Table 3 and Fig. 9.
3. The transition of steady to unsteady FCG for Δσt=150 MPa occurs reportedly at about FCG rate of da/dN=10-3
mm/cycles for number of cycles Nt=4218800 calculated by FEI model (4.7) providing the S-N curve intercept
A=4.07x10+12 cycles (lower dashed line on Fig. 10).
4. For the reported number of cycles to total fatigue failure of Nft=3600000 for Δσt=150 MPa the S-N curve constant
is Af=5.01x10+12 cycles (upper full line on Fig. 10). Reportedly the stress range of Δσ=230 MPa corresponding to
2x10+6 cycles was taken as an indication of the fatigue strength [43]. The scatter index (SI=RMSE/MV) for the
reported S-N curve (n=2.44) with respect to reported experimental data is 15.00% (R-squared is 0.9757) and for
calculated S-N curve data (n=2.75) is 21.50% (R-squared is 0.9502). The scatter index between the FEI calculated
S-N curve data (n=2.75) and reported S-N curve (n=2.44) is 7.40% (R-squared is 0.9945) indicates slightly lower
but still good matching of results.
Table 3. Corrections of S-N curves for the effect of crack size on crack growth for FSW
Δσ Δσt/Δσ N
test
fa
(5.3)
c
(5.7)
n
(5.8)
Nt
Transition
Nft
Failure
125.00
1.20 4500000 0.958 0.77 2.70 6965204 8585227 150 1.00 3600000 1.000 0.84 2.75 4217993 5199047 175
.00 0.86 2700000 1.020 0.87 2.78 2761098 340329
6 225.00
0.67 1120000 1.037 0.91 2.81 1383358 1705110 275
.00 0.55 640000 1.045 0.93 2.83 796657 981950
325.00
0.46 300000 1.048 0.94 2.84 503219 620262 Note: The results in examples are derived in MS-Excel work sheets using intrinsic Solver add-ins with evolutionary
algorithm and Generalized Reduced Gradient (GRG) optimization methods.
7. Discussion
Examples in this article confirmed the agreement of calculated and reported data. However, the differences can be
understood having on mind that the methods of fracture mechanics applied in this research for fatigue lifetime
assessments are developed for steady FCG regime known as ‘region two’, since the experimental methods consider
the whole span of lifetime with high statistical scatter of test data till total failure including the unstable FCG known
as ‘region three’.
13
0
2
4
6
8
10
12
14
16
18
20
0.E+00 1.E+06 2.E+06 3.E+06 4.E+06 5.E+06
Cra
ck le
ngt
h 2
a (
mm
)
Number of cycles (N)
BM TestBM-FEIFSW TestFSW FEI
BM
Nf=
2670
000 N
a=27
2000
0
BMFEI: p=2.17x10⁻⁶, i=1.16x10⁻⁶
PE: C=2.58x10⁻¹⁰, m=4.66
Ns=
1620
0000
FSWFEI: p=9.47x10⁻⁶, i=7.02x10⁻⁷
PE: C=3.20x10⁻¹⁰, m=4.66
Ns=
2500
0000
Nf=
4180
000
Na=
4220
000
FSW
22001700
0
500
1000
1500
2000
2500
0.E+00 1.E+06 2.E+06 3.E+06 4.E+06 5.E+06Wo
rk d
on
e o
n c
rack
gro
wth
W(N
)
Number of cycles (N)
BM
Nf=2700000
1700 J cycle/N
(J c
ycle
/N)
2200 J cycle/N
FSW
Figure 5. FCG sizes a(N) for BM and FSW Figure 6. Energy absorption due to work done on FCG
0.0E+00
2.0E-05
4.0E-05
6.0E-05
8.0E-05
1.0E-04
1.2E-04
1.4E-04
1.6E-04
1.8E-04
2.0E-04
0.E+00 1.E+06 2.E+06 3.E+06 4.E+06 5.E+06
Cra
ck g
row
th r
ate
da
/dN
(mm
/cyc
le)
Number of cycles (N)
BMNf=2700000
FSW
1.E-6
1.E-5
1.E-4
1.E-3
1.E-2
1.0 10.0 100.0
Cra
ck (
a)
gro
wth
rat
e d
a/d
N
Stress Intensity Factor
BMBMC=2.58x10⁻⁹, m=4.66
K=5.9
K=26(m
m/c
ycle
)
K=8.4
K=53
FSW
FSW
C=3.50x10⁻¹⁰, m=3.78
Figure 7. FCG rates da(N)/dN for BM and FSW Figure 8. Stress intensity factor ranges K(da/dN)
2.50
2.60
2.70
2.80
2.90
3.00
3.10
3.20
3.30
3.40
125 150 175 200 225 250 275 300 325
n
BM
FSW
3.33 for infinite sheet
2.89 for infinite sheet
3.16
2.75
t
(MPa)
100
1000
1E+5 1E+6 1E+7
Stre
ss r
an
ge
(MP
a)
Number of cycles (N)
FSW test
BM test
Failure
Transition
BMA=2.26x10+13, n=3.16
500
400
300
200
BM FSW
FSWA=5.01x10+12, n=2.75
2E+6
600700800900
Figure 9. Inverse slopes n of S-N curves for BM and FSW Figure 10. S-N curves for BM and FSW

14
Conclusion
The article elaborates the link between analytic fracture mechanics, fatigue crack growth tests and experimental
lifetime predictions in materials science and engineering.
The results of calculations performed on the reported fatigue test data uphold the thesis revealed at the beginning of
the article that the macroscopically observable fatigue crack growth can be modeled as a mechanical yielding process
induced by overstressing due to redistribution of loads among huge but finite number of failed and intact internal
micro-structural bonds. Interpretation of fatigue experiments in this study allows rethinking of the argument that there
are measurable interactions between the preceding fatigue crack growth and impending fatigue endurance.
Consequently, fatigue crack growth is regarded in the study as an interaction governed by propensity to and intensity
of interaction between the increasing number of load cycles and the resulting crack growth that simultaneously affects
and is affected by the residual fatigue endurance. The fatigue crack growth-endurance-interaction model in the article
replaces the numerical fitting methods for analytic definition of experimental fatigue crack growth and fatigue crack
growth rate for definition of stress intensity factors suitable for steady fatigue crack growth in fracture mechanics.
The interaction model provides the mathematical formulation of energy conservation principle between the work done
on crack growth under external cyclic loadings and the energy absorption due to internal material resistance to fatigue
propagation all over the fatigue life that can be considered as the measure of fatigue strength.
The research of fatigue lifetime in continuation of this article corroborates the thesis that the fatigue life parameters
can be extracted directly from a single experimentally derived FCG curve. The internal energy of resistance to
cracking i.e. the energy absorption equivalent to the work done by cyclic external forces on crack growth can be
calculated through numerical integration of precisely recorded crack size. Accordingly, the article reinterprets the
Basquin’s equation for prediction of fatigue life as the relation of the energy absorption of work done during fatigue
crack growth for different applied cyclic loads until fatigue failure of test specimens or of realistic structures. The
method presented in the article allows assessment of the parameters of S-N curves of importance to life time
predictions directly from a single fatigue crack growth experiment rather than from sets of stress-life tests of lifetime
duration to failure under various loading conditions. The article recommended analytical corrections for the effect of
crack size on crack growth for finite geometries of specimens and structures in order to provide S-N curves for
practical use in their standardized form. The number of repeated physical FCG test to failure can be replaced by a
numerical procedure for different loading conditions illustrated by examples in the article. The method exposed in this
article is found sufficiently simple and numerically accurate for application to problems of fatigue in engineering of
materials appropriate for structural analysis and design.
Acknowledgement
This work was supported by the Ministry of Science, Education and Sports of the Republic of Croatia under
grant No. 120-1201703-1702.

15
Nomenclature
a crack size
A intercept of S-N curves
c correction of S-N curve slope for crack size
C intercept of SIF range curves
CE Cause-Effect relation
CEI Cause-Effect-Interaction
E fatigue endurance
fa scaling factor for effects of crack size
FCG Fatigue Crack Growth
FEI Fatigue-Endurance-Interaction
i interaction intensity FEI parameter
m slope of SIF range curves
n inverse slope of S-N curves, also cyclic ratio
N number of loading cycles
p propensity to interaction FEI parameter
PE Paris-Erdogan power rule
R stress ratio
s sensitivity to cracking
S stress range σ or amplitude in S-N approach
SI scatter index
SIF stress intensity factor
Y joint geometric function
W specimen width
K stress intensity factor (SIF) range
σ cyclic stress range

16
References
[1] P. Paris, F. Erdogan, A critical analysis of crack propagation laws. Journal of Basic Engineering, Trans. ASME,
528-534, 1963.
[2] N. Pugno, M. Ciavarella, P. Conneti, A. Carpinteri, A generalized Paris’ low for fatigue crack growth. Journal of
the Mechanics and Physics of Solids, 54 1333-1349, 2006.
[3] B. Brighenti, A. Carpinteri, N. Corbari, Damage mechanics and Paris regime in fatigue life assessment of metals.
International Journal of Pressure Vessels and Piping, 104 57-68, 2013.
[4] G.R. Irwin, Analysis of stress and strains near the end of a crack traversing a plate. Journal of Applied Mechanics
24 3 361–364, 1957.
[5] C. Macabe, H. Kaneshiro, S. Nishida, H. Sakihama, A Consideration on Evaluation of Fatigue-Crack Propagation
Rate from Effective Stress Intensity Factor Range. Journal of Testing and Evaluation, 23 3 153-159, 1995.
[6] P. Ljustell, F. Nilssen, Effects of different load schemes on the fatigue crack growth rate. Journal of Testing and
Evaluation, 34 4 333-441, 2006.
[7] E.R. Abril, The influence of initial crack length on critical stress intensity factor K-1. Journal of Testing and
Evaluation, 34 3 430-436, 2006.
[8] D. Benuzzi, E. Bormetti, G. Donzella, Stress intensity factor range and propagation mode of surface cracks under
rolling-sliding contact. Theoretical and Applied Fracture Mechanics, 40 1 55-74, 2003.
[9] X.P. Huang, T. Moan, W.C. Cui, An engineering model of fatigue crack growth under variable amplitude loading.
International Journal of Fatigue, 30 1 2-10, 2007.
[10] A. Carpinteri, R. Brighenti, S. Vantadori, Influence of the cold-drawing process on fatigue crack growth of a V-
notched round bar. International Journal of Fatigue, 32 7 1136-1145, 2010.
[11] M. Oore, Minimization and Quantification of Error Associated With the K-Gradient and the Interval of Crack
Length Measurement in Fatigue Crack-Growth Testing. Journal of Testing and Evaluation, 21 2 107-113, 1993.
[12] H.Y., Chung, S.H., Liu, R.S. Lin, S.H. Ju, Assessment of stress intensity factors for load-carrying fillet welded
cruciform joints using a digital camera. International Journal of Fatigue, 30 10-11 1861–1872, 2008.
[13] I. L. Slepian, Models and Phenomena in Fracture Mechanics, Springer 2002
[14] K. Ziha, Fatigue Yield. International Journal of Fatigue, 31 7 1211–1214, 2009.
[15] K. Ziha, Stress-Strain Interaction Model of Plasticity. Acta Polytechnica Hungarica, 12 1 42-54, 2015.
[16] K. Ziha, Modeling of worsening. Journal of Systemics, Cybernetics and Informatics, 10 4 11-16, 2012.
[17] K. Ziha, Cause-and-Effect Interactions in Natural Sciences, Journal of Pensee, 76 3 Part 3, 2014.
[18] ASTM E647-08 Standard Test Method for Measurements of Fatigue Crack Growth Rates. ASTM Intern., 2005.
[19] O. H. Basquin, The exponential law of endurance tests, Proc. ASTM, 10 625–630, 1910.
[20] S. Stefanov, Fatigue Life Prediction without Cycle Counting (by Means of the Integral Method). Journal of
Theoretical and Applied Mechanics, 32 1 34-47, 2002.
[21] E. Macha, C.M. Sonsino, Energy criteria of multiaxial fatigue failure. Fatigue and Fracture of Engineering
Materials and Structures. 22 1053-1070, 1999.
[22] D. Kujawski, Fatigue Faulure Crierion Based on Strain Energy Density, Mechanika Teoretyczna i Stosowana, 1
27, 1989.
[23] D. Kujawski, F. Ellyn, A fatigue crack propagation model, Engineering Fracture Mechanics 20 5-20 695-707,
1984.
[24] D. Kujawski, F. Ellyn, A cumulative damage theory for fatigue crack initiation and propagation, International
Journal of Fatigue 6 2-6 83-88, 1984.
[25] F. Ellyn, D. Kujawski, Plastic Strain Energy in Fatigue Failure, Journal of Pressure Vessel Technology 11/1984;
106(4). DOI:10.1115/1.3264362 · 0.36 Impact Factor
[26] Kujawski, F. Ellyn, A unified approach to mean stress effect on fatigue threshold conditions, International
Journal of Fatigue 17 2 101-106, 1995.

17
[27] Z. Xia, Kujawski, F. Ellyn, Effect of mean stress and ratcheting strain on fatigue life of materials, International
Journal of Fatigue 18 5 335-341, 1996.
[28] D. Kujawski, On energy interpretations of the Neuber’s rule, Theoretical and Applied Fracture Mechanics 73 91-
96 2014.
[29] P. Livieri, F. Berto, P. Lazzarin, Local strain energy approach applied to fatigue analysis of welded rectangular
hollow section joints, International Journal of Materials & Product Technology, 30 1-3 124-140, 2007.
[30] K. Golos, F. Ellyn, A Total Strain Energy Density Theory for Cumulative Fatigue Damage, Journal of Pressure
Vessel, 110 1 36-41, 2009.
[31] F. Berto, P. Lazzarin, Fatigue strength of Al7075 notched plates based on the local SED averaged over a control
volume, SCIENCE CHINA, Physics, Mechanics & Astronomy, 57 1 30-38, 2014
[32] P. Lazzarin, M. Zappalorto, F. Berto, Averaged strain energy density and J-integral for U- and blunt V-shaped
notches under torsion, International Journal of Fracture, 188 2 173-186, 2014.
[33] R. Afshar, F. Bero, P. Lazzarin, L.P. Pook, Analytical expressions for the notch stress intensity factors of periodic
V-notches under tension by using the strain energy density approach, Journal of StrainA for Engineering Design,
48 5 291-305, 2013.
[34] M. Zappalorto, P. Lazzarin, A Strain energy-based evaluations of plastic notch stress intensity factors at pointed
V-notches under tensio, Engineering Frature Mechanics, 78 15 2691-2706, 2011.
[35] A.R.. Torabi, M.R. Jafarinezhad, Comprehensive data for rapid calculation of notch stress intensity factors in U-
notched Brazilian disc specimen under tensile-shear loading, Materials Science and Engineering A, 541 135-142,
2012.
[36] L. Bian, F. Taheri, Fatigue fracture criteria and microstructures of magnesium alloy plates, Materials Science and
Engineering A, 487 1-2 74-85, 2008.
[37] K.O. Lee, S.G. Hong, S.B., Lee, A new energy-based fatigue damage parameter in life prediction of high-
temperature structural materials, Materials Science and Engineering A, 496 1-2 471-477, 2008.
[38] K.H. Bae, H.H. Kim, S.B. Lee, A simple life prediction method for 304L stainless steel structures under fatigue-
dominated thermo-mechanical fatigue loadings, Materials Science and Engineering A, 529 370-377, 2011.
[39] M. Noban, H. Jahed, S. Winkler, A. Ince, Fatigue characterization and modeling of 30CrNiMo8HH under
multiaxial loading, Materials Science and Engineering A, 528 6 2484-2494, 2011.
[40] M. Smaga, E. Walter, D. Eifler, Deformation-induced martensitic transformation in metastable austenitic steels,
Materials Science and Engineering A, 483-84 394-397, 2008.
[41] S.G. Hong, S.B. Lee, T.S., Byun, Temperature effect on the low-cycle fatigue behavior of type 316L stainless
steel: Cyclic non-stabilization and an invariable fatigue parameter, Materials Science and Engineering A, 457 1-2
1391-147, 2007.
[42] ASTM E739-91, Standard Practice for Statistical Analysis of Linear or Linearized Stress–life (S–N) and Strain–
Life (E–N) Fatigue Data, ASTM International, 2004.
[43] A.K. Lakshminarayanan, V. Balasubramanian, Assessment of fatigue life and crack growth resistance of friction
stir welded AISI 409M ferritic stainless steel joints. Materials Science and Eng. A, 539 143–153, 2012.