
Related Literature - Virginia Tech · Related Literature Michelson's (1976) Intersystems Congruence...
73
1 I. Introduction Statement of the Problem The concept of personal space has been studied by many authors, including, but not limited to Hall (1966), Sommer (1969), Altman (1975), and De Long (1976). Hall (1966) discussed personal space as an invisible bubble that surrounds an individual. The bubble can be large or small and Hall (1966) described it has having four basic sizes, defined by distance, which he called proxemic zones. These invisible boundaries serve to maintain proper spacing between individuals with the size of the zones varying across cultural, social, personality, and environmental dimensions. Many facets of personal space have been explored, including cultural influences, social influences, seating arrangements, and crowding perception. However, few studies have attempted to examine how illumination may affect personal space behavior. Hall's (1966) initial research alludes to the possibility that lighting may have an effect on proxemic behavior. Baum and Davis (1976) examined the condition of light-colored versus dark-colored spaces on the perception of crowding. Adams and Zuckerman (1991) studied personal space distances in dim and bright conditions, but did not take into account a particular behavior setting. Few studies to date have attempted to examine the potential effect of illumination level on personal space in a particular environmental/behavior setting. This study will attempt to examine this potential effect within the theoretical framework of Michelson's (1976) Intersystems Congruence Model (ICM). The ICM states that social, cultural, personality, and environmental systems co-exist and affect human behavior. The variable within this model is space. The research will also work within Hall's (1966) definition of personal space as defined by four major personal space distances called proxemic zones. A waiting/reception area will be used as the environmental setting the research is to be conducted within. This type of environmental/behavior setting was chosen because no apparent prior research exists in this type of setting regarding illumination levels and personal space behavior. Specifically, this research will investigate the effect of dim and bright illumination levels on proxemic zones within waiting/reception area settings.
Transcript of Related Literature - Virginia Tech · Related Literature Michelson's (1976) Intersystems Congruence...

1
I. Introduction
Statement of the Problem
The concept of personal space has been studied by many authors, including, but
not limited to Hall (1966), Sommer (1969), Altman (1975), and De Long (1976). Hall
(1966) discussed personal space as an invisible bubble that surrounds an individual. The
bubble can be large or small and Hall (1966) described it has having four basic sizes,
defined by distance, which he called proxemic zones. These invisible boundaries serve to
maintain proper spacing between individuals with the size of the zones varying across
cultural, social, personality, and environmental dimensions. Many facets of personal space
have been explored, including cultural influences, social influences, seating arrangements,
and crowding perception. However, few studies have attempted to examine how
illumination may affect personal space behavior. Hall's (1966) initial research alludes to the
possibility that lighting may have an effect on proxemic behavior. Baum and Davis (1976)
examined the condition of light-colored versus dark-colored spaces on the perception of
crowding. Adams and Zuckerman (1991) studied personal space distances in dim and
bright conditions, but did not take into account a particular behavior setting.
Few studies to date have attempted to examine the potential effect of illumination
level on personal space in a particular environmental/behavior setting. This study will
attempt to examine this potential effect within the theoretical framework of Michelson's
(1976) Intersystems Congruence Model (ICM). The ICM states that social, cultural,
personality, and environmental systems co-exist and affect human behavior. The variable
within this model is space. The research will also work within Hall's (1966) definition of
personal space as defined by four major personal space distances called proxemic zones. A
waiting/reception area will be used as the environmental setting the research is to be
conducted within. This type of environmental/behavior setting was chosen because no
apparent prior research exists in this type of setting regarding illumination levels and
personal space behavior. Specifically, this research will investigate the effect of dim and
bright illumination levels on proxemic zones within waiting/reception area settings.

2
Related Literature
Michelson's (1976) Intersystems Congruence Model provides the theoretical
framework used to organize the components of this study. The following literature review
discusses this framework and provides information on the concepts of territoriality,
crowding, privacy and personal space. Further information is provided regarding visual
perception, waiting/reception area design, lighting design of reception/ waiting areas, and
simulation as it pertains to the format of this proposed study.
Intersystems Congruence Model
Human behavior is studied using three different systems, either independently or in
combination, including the cultural, social, and personality systems. Anthropologists
concern themselves with the cultural systems, focusing on the generally accepted rules and
goals that guide behavior in a particular culture. Sociologists examine the relation-ships
and behaviors between people with particular social groups. Psychologists study
personality and attempt to understand the behaviors people internalize as a result of their
life experiences (Michelson, 1976). These three systems are studied independently in an
effort to understand and demonstrate the relationships of variables within each system.
However, these three systems, cultural, social, and personality, are closely inter-related.
Studies exist that focus on intersystem relationships, such as culture and personality or
personality and social structure. In addition to these three systems, a fourth system can
also be examined in its inter-relation with culture, social, and personality systems - the
built environment.
Restricting study to the built environment, Michelson (1976) suggests a frame-
work to study the interdependence of the physical environment, cultural environment,
social organization, and elements of individual personality. The systems can be studied
separately in terms of how each affects and influences human behavior. However,
Michelson (1976) proposes a framework that does not suggest that only one system
determines human behavior, or that one particular system dominates another. Rather, the
systems co-exist and interact to influence human behavior. One system may set limitations
upon another, thereby limiting the possible behaviors that could potentially

3
occur in a particular behavior setting. "Each system can still be viewed as analytically
distinct from the others, but the significance of mutual contact and interchange must be
noted" (Michelson, 1976, p. 24) (see Figure 1).
Michelson (1976) refers to this model as the Intersystems Congruence Model.
"Research can proceed from the point of view that a particular physical environment sets
broad limits as to the range of phenomena from other systems which can be found there.
Some social systems, personalities, or cultural goals (possibly only a few) may be given in
possible settings. Beyond this limit, an environment may make some phenomena in other
systems either easier or more difficult to maintain, so that, all else equal, these phenomena
will tend to be found successfully maintaining themselves more in some types of settings
than in others" (Michelson, 1976. p. 25). The environment as a restrictive agent on human
behavior is not a novel notion. Louis Wirth (1969) notes "physical factors …. are at best
conditioning factors offering the possibilities and setting limits for social and psychological
existence and development" (p. 177). However, the intersystems congruence model
recognizes that environments may be limited by people's cultural, social, and personality
traits or needs. "…people rationally seeking to best match a specific social, cultural, or
personality variable with a planned setting may find their range of possible environments
narrowed " (Michelson, 1976, p. 25).
The intersystems congruence model also suggests that incongruence between
systems is possible. Mismatches of cultural, social, personality, and environmental settings
may occur because of economic or political constraints. For example, a family may choose
to live in a public housing high rise with reduced security and increased crime because
such housing is more affordable. This choice would be a mismatch with the family's social
desire to live in a safer dwelling and more secure environment to raise their children.
Michelson (1976) states "Congruence carries with it the opposite, incongruence, and the
latter may be found in real life situations linking the environmental system with the others.
Mismatches are possible and they may even be frequent due to the extingencies of
economics and politics " (p. 26).
There are two approaches to researching how people relate to their spatial
environment. It is necessary to understand both when examining the different systems

4
Figure 1. Intersystems Congruence Model (Michelson, 1976) as adapted by author.
E = ENVIRONMENTAL INFLUENCE
BEHAVIOR
CULTURAL INFLUENCE
SOCIALINFLUENCE
PERSONALITY INFLUENCE
EE

5
that affect human behavior. Michelson (1976) states, "Man, as a thinking being, relates to
his spatial environment both in his mind and in his actual presence." (p. 30). This approach
suggests both a mental congruence and an experiential congruence between people and
the environment. Mental congruence is defined when an individual feels that particular
spatial patterns will successfully accommodate his/her personal characteristics, values, and
style of life (Michelson, 1976). Experiential congruence "deals with how well the
environment actually accommodates the characteristics and behaviors of people"
(Michelson, 1976, p. 30). Thus, people use both mental and experiential congruence to
make decisions on what behaviors and what physical surroundings are appropriate/
inappropriate in particular environments.
The Intersystems Congruence Model is demonstrated in Michelson's studies of
cities and urban housing. Michelson's gives the example that working class families living
in crowded older sections of a city depend on relatives for companionship, recreations,
and assistance (Michelson, 1976). When these families relocate to suburban type areas,
they experience a deterioration of family activities. Michelson explains that this
deterioration is due to environmental factors. In the crowded area of a city, the family
interactions were congruent with the physical factors. In the suburban area of the city, the
family interactions were incongruent with the physical factors.
The Intersystems Congruence Model is not limited to application to only macro-
environments. It can also be applied to micro-environments. The behavior in micro-
environments is affected by cultural, social, personality, and physical man-made
characteristics just as behavior is affected by these systems in macro-environments.
Michelson (1976) presents the following argument: "Just when the positivists have come
up with what they think is a design that is congruent with a specified social variable (e.g.,
chairs spaced around a hotel lobby just well enough to let people talk if they want or
ignore others if they want). Perceptionists [explain] it won't always work…because people
from different backgrounds learn on the basis of their culture to give different meanings to
the separations involved. As result, they perceive them differently, and hence act
differently in the same objective spatial orientations." (p. 28).
The Intersystems Congruence Model (ICM) (Michelson, 1976) provides a

6
framework to study human behavior and environment. The ICM states that there are three
systems typically used to analyze human behavior, the cultural, social, and personality
systems, and these three systems co-exist to influence and affect human behavior. These
three systems may work together and limit possible behaviors, or variables present in each
system. At the same time, the built environment sets broad limits on what behaviors
(influence by cultural, social, and personality factors) can occur in a particular
environment. Congruence results when "variables in one system co-exist better with states
of variables in other systems than with others of alternative states" (Michelson, 1976, p.
26). Incongruence can also result when variables of one system interact with variables of
another system and stress results. The variable always under study in the ICM is the
variable of space. "Space is treated as a variable, not as an indeterminate medium to which
people give meanings" (Michelson, 1976, p. 30).
The ICM provides the framework for this research. It is understood that the
cultural, social, and personality systems interact with each other and with the environ-
mental system. Each system can be studied independently and each system can also be
studied in terms of how they interact with each other. In the following literature review,
the method of looking at each system independently is followed. For the purposes at hand,
the issues to be considered within the cultural, social, and personality systems are
territoriality, privacy, crowding, proxemics, and visual perception. The variables that will
be manipulated within this study are seating arrangements within waiting/reception areas
and lighting design of waiting/reception areas. The literature review will address both the
issue of appropriate waiting area design and the lighting design of waiting areas. The
research design will look for how the variable of personal space is influenced by the
variable of light within the environmental setting of a typical waiting/reception area. As
Michelson (1976) suggests, the variable of space, is the variable under scrutiny. Space is
the result of how limitations of the physical environment and behaviors (dependent upon
cultural, social, personality factors) interact. In this study, space will be the result of
environmental changes and influences from the cultural, social, and personality systems.

7
Territoriality
Territoriality is often thought of as the behaviors exhibited by animals in defending
their territory, or home. However, humans also exhibit territorial behaviors. In chapter one
of Spatial Behavior of Older People, Altman (1970) looks at several definitions of territory
and points out that they all make common references to a geographical area, which is
claimed for purposes of feeding, child rearing, and reproduction. The geographical area
may change with the need to satisfy these basic urges. These definitions also were noted
when referring to several behaviors associated with the concept of territoriality. These
behaviors included marking territory and using defenses when territory is invaded.
Corresponding to the idea of territoriality, there is a behaving unit. This unit may be an
individual, a family, or a group (Altman, 1970).
Altman (1970) suggests that there are four concepts connected with human
territoriality. The first is behavior forms. At any time, there may be action to mark or
defend territory. Humans do this by using environmental props. These props may be
pictures, objects, or fences placed strategically to lay claim to an area. Aggressive
behavior is common when territory is invaded by those unwelcome in it. Humans may use
verbal and non-verbal threats to notify the trespasser to be aware and to get out of
someone else’s space. The second concept refers to situational factors. The amount of
territory humans require changes from place to place in any given period of time.
However, the idea of territoriality can surpass geographic location. Humans are possessive
towards objects, relationships, and even ideas. Thirdly, there is the concept of antecedent
factors playing a role in human behavior in regards to territoriality. There may be personal
relationships (between individuals or groups of people) that are influential in stimulating
behavior. Finally, humans not only need to satisfy their basic organismic needs (food and
shelter), they need to associate themselves with certain social groups. Territoriality plays a
role in this association. By defining territorial boundaries, people know where to and how
to interact and associate with each other.
The concept of territoriality also takes on different forms. There is the notion of
personal space. Personal space is the territory that a person carries around himself or
herself (Hall, 1966). The boundary is invisible, with the body at the center. Next,

8
situational territory is the space that is a person’s only while he or she is using it. Fixed
territory defines a space that belongs to a person even when its not in use. An example of
this type of territoriality may be a car, a dormitory room, a private office, or a house.
Lastly, there is public territory. Many people may have access to a space, but they do not
have the freedom of action with in the space. For example, public nudity or drunkenness
may not be permitted (Flannery, 1992).
Any of these territories are subject to some form of intrusion. Sommer (1969)
describes three types of territorial encroachment; violation, invasion, and contamination.
Violation is using a territory without permission. Invasion involves the physical presence
of an intruder or intruders within the boundaries of a specific territory. Contamination
causes the territory to become impure in some way.
Closely related to the concept of territoriality are the concepts of crowding and
privacy. Crowding occurs when many people occupy the same space at the same time.
Privacy is a state desired by an individual(s) at some point in time when they do not wish
to be disturbed by others (Altman, 1975). Mechanisms are employed by individuals to
protect themselves in crowded situations and to gain privacy in other situations. Both
concepts deal with the issue of personal space. Crowding is perceived when personal
space violations are sensed, and as a result, greater personal space distances are desired,
perhaps resulting in an increased need for privacy.
Crowding
Crowding can be referred to in both large and small scales. Crowding can occur in
a relatively large geographic location, or in small spaces such as a house. There are many
problems that are created when too many people interact within an area. Personal space
violations are a result of crowding. People tend to experience a reduction in their sense of
personal control and they feel more stress. Crowding intensifies perceived characteristics
of certain situations, and as a result people have heightened feelings of excitement,
friendliness, antagonism, and fear. The sense of crowding is affected by the duration of
exposure and the predictability of exposure. Feelings of crowding are also affected by
whether they are experienced in public spaces or personal spaces (Flannery, 1992).

9
Often when people feel crowded by others, they desire a feeling of privacy, they may or
seek out another place to establish physical privacy.
Privacy
Westin (1967) described privacy as the right of an individual to decide what
information about him or herself should be communicated to others. That decision of what
information should be conveyed unto others may vary depending on the situation. Westin
(1967) categorizes privacy into four states and describes four functions of privacy. The
four states of privacy are solitude, intimacy, anonymity, and reserve. In the solitude state,
individuals seek withdrawal from others. Typically, this withdrawal is physical in nature.
The reasons for this withdrawal vary, but commonly, the individual seeks privacy to be
alone with one’s own thoughts or to perform bodily functions. In the intimacy state,
individuals interact in a small group. The small group setting may be used to achieve a
relaxed atmosphere so as to share personal confidences. The anonymity state refers to
when individuals in public spaces do not want to be recognized or acknowledged. The
individual is physically not alone, but is still private because he or she is not engaging in
social interaction with others. In the reserve state, individuals feel the need to limit the
interaction with others so as to preserve the self. Altman (1975) gives this example, "One
literally 'tunes other people out'. Whether in the presence of one person or one hundred
other people, we have all learned how not to listen to others and ignore them
psychologically, often without anyone even knowing" (p.18).
Westin (1967) also describes four functions of privacy including personal
autonomy, emotional release, self evaluation, and limited/protected communication.
Personal autonomy refers to an individual concentrating on issues of self-identity, self-
independence, and self-worth. Emotional release allows the individual to relax from social
roles and doing personal things typically not allowed in public. Self-evaluation allows the
individual to assess past experiences and plan actions for the future. "Generally,
(individuals) meditate about themselves in relation to the world" (Altman, 1975, p. 19).
Limited and protected communication refers to the individual's right to determine when to
communicate with others and how much information to convey to others.

10
Altman (1975) maintains that privacy is "central to understanding environment and
behavior relationships; it provides the key link among the concepts of crowding, territorial
behaviors and personal space" (p. 6). Various states of privacy can be achieved through
different behavior mechanisms including verbal mechanisms, paraverbal mechanisms, non-
verbal mechanisms, environmental mechanisms, and cultural mechanisms (Altman, 1975).
Verbal mechanisms include the use of words to convey personal states and desires.
Paraverbal mechanisms refer to the structural components of speech such as vocabulary,
pronunciation, voice quality, and vocalizations such as yawning and/or crying to convey
certain meaning to others. Nonverbal mechanisms use parts of the body to express
communication to assure privacy. This expression may be accomplished by using arms,
legs, body positions, and facial expressions. Nonverbal behaviors such as glaring, leaning
away, or re-orienting the body may be gestures used to protect privacy and personal
space. Other nonverbal behaviors such as sitting closer to another, more eye-contact,
frequent smiling, and leaning towards another may indicate the welcome closeness of
others (Altman, 1975).
Environmental mechanisms of privacy concern clothing and adornment, personal
space, and territory. The use of clothing can signal a person's approachability as well as
express acceptance or dissatisfaction with particular social situations. Restrictions of an
individual's use of clothing and adornments may be considered a violation of that
individual's right to express themselves and these restrictions also interfere with the
individual's privacy regulation mechanism (Altman, 1975). Personal space as a mechanism
of privacy regulation allows an individual to have contact with others or choose not to
have contact with others. Territorial mechanisms use the distant environment to control
levels of privacy by using physical spaces to provide identity and security (Altman, 1975).
Cultural differences play a role in the management of privacy. Some cultures may
divide their interior spaces with physical barriers to ensure privacy, while other cultures
may not. Instead of using physical barriers to ensure privacy within a group or family,
11
psychological barriers may be practiced. These types of barriers may include not
expressing feelings towards others or about situations, talking softly, or allowing
individual autonomy (Altman, 1975). Ultimately, privacy is used to protect oneself from
the intrusion of others, to set boundaries and to protect communication (Westin, 1970).
The process of achieving various states of privacy is very dynamic. The exercise of control
on privacy is not always successful in achieving in a desired state of privacy. Privacy
regulating mechanisms such as verbal, paraverbal, nonverbal, and environmental
mechanisms are put to use in many combinations. These mechanisms may change with any
given situation and circumstance, and they may also change over time (Altman, 1975).
Thus, Altman (1975) described personal space as a mechanism of privacy
regulation. This concept of personal space has been explored in depth by other authors as
well, such as Hall (1966) and Sommer (1969). Further research on personal space has
been carried out by many authors such as Baldassare and Fellar (1975), De Long (1976),
Hayduk (1978), Scott (1993), White (1975) and Adams and Zuckerman (1991). The
research of Hall, Sommer, De Long, Altman, Adams and Zuckerman is presented next.
Proxemics
Edward T. Hall (1966) has observed the personal space aspect of territoriality and
how individuals use this space as a form of social communication. He described personal
space as proxemic zones. Hall (1966) described the study of proxemic zones as being
“…interrelated observations and theories of man’s use of space as a specialized elabora-
tion of culture” (p. 1). There are many aspects of personal space, from the biology of how
humans perceive space, to more unique factors such as age, gender, cultural associations,
ethnic characteristics and personality (Hall, 1966 & Sommer 1969).
Hall (1966) describes the invisible space that surrounds animals and people as “a
series of bubbles or irregularly shaped balloons that serve to maintain proper spacing
between individuals" (p. 10). In studying territoriality in animals, it is recognized that there
are four types of spacing mechanisms. These mechanisms can also be identified in terms of
human behavior. When individuals of different species meet either flight distance or critical
distance is used. Flight distance is the distance at which one animal gets too close to a

12
second animal and the second animal flees. Critical distance is the distance at which the
second animal will attack the first when it cannot flee. When individuals of the same
species meet, personal distance and social distance mechanisms are at play. Personal
distance refers to the invisible bubble that surrounds an animal. Only others that are well
known or trusted are allowed in this space. In humans, this space is the closest an
individual will let others get without feeling discomfort. Social distance is the farthest an
animal is allowed to drift away from a group. In humans, this distance is the amount of
interpersonal space beyond which individuals begin to feel anxious about being separated
from others (Hall, 1966).
People sense space not only with their eyes, but also with auditory and olfactory
capabilities. Hall (1966) calls the use of these senses as distance receptors. Individuals are
concerned with the examination of distant objects. When using the skin, individuals are
using immediate receptors to experience their world up-close and personal (Hall, 1966).
The skin is the largest sense organ, detecting heat, cold and various textures for the spatial
experience of an environment. Not only is space perceived by what information individuals
take in through their senses, it also perceived by what they filter out. Humans have the
ability to use their senses to filter out noises, smells, and other sensations while focusing
their attention to other specific noises and smells, deemed important. These experiences
are processed and play a significant role in how people orient themselves in space and with
one another. There are several other factors that influence interpersonal spacing patterns
as well. These include individual factors, cultural factors, interpersonal factors, and
situational factors.
Hall (1966) describes four categories of personal space zones. These zones radiate
from the body including an intimate distance, personal distance, social distance, and public
distance. Each of these distances has a close and a far phase (see Figure 2). The intimate
distance, close phase is zero to six inches from the body. This distance is the closest
physical contact people can interact. Reproduction, wrestling, and comforting occur at this
distance. The sense of smell and sense of radiant heat are intensified. Vision is blurred
because the space between people is so close. Vocal communication is reduced

13
1 2 3 4 5 6 7 8
Figure 2. Personal space zones as defined by Edward T. Hall (1966).
Legend
1 - Intimate distance, close phase (0" - 6")2 - Intimate distance, far phase (6" - 18")3 - Personal distance, close phase (18" - 30")4 - Personal distance, far phase (30" - 4'-0")5 - Social distance, close phase (4'-0" - 7'-0")6 - Social distance, far phase (7'-0" - 12'-0")7 - Public distance, close phase (12'-0" - 25'-0")8 - Public distance, far phase (25'-0"+)

14
or is involuntary (Hall, 1966). Intimate distance, far phase is six inches to eighteen inches
from the body. This distance is close enough for hands and feet to come into contact, but
the head, thighs and pelvis are not easily brought into contact. At six inches to eighteen
inches vision is still slightly distorted and heat and odor from another person may still be
detected. Vocal communication may be performed, but is usually done at a whisper or low
level (Hall, 1966).
Personal distance, close phase is eighteen inches to thirty inches from the body.
Vision is no longer distorted and there is still an exchange of smell, touch, and verbal
communication. One can easily hold or grasp another person at this distance. Where
people place themselves in relation to each other signals their relationship and/or how they
feel about each other. Personal distance, far phase is thirty inches to four feet from the
body. This distance extends just outside of easy touching distance of another person. If
two people extend their arms, they can touch fingers. Beyond this distance, a person
cannot easily touch another. Details of another person can easily be seen such as wrinkles,
gray hair, and fine details of the skin (Hall, 1966). At personal distance, far phase,
personal conversations and interaction can occur.
Social distance, close phase is four feet to seven feet from the body. At this
distance heat, olfactory, and touch cues are unimportant, and the visual perception of fine
details is reduced. Impersonal business tends to occur at this distance. Interaction among
people in a work setting typically occurs at this distance. It is also an acceptable, appropri-
ate distance in public settings for interaction among casual acquaintances. Social distance,
far phase is seven feet to twelve feet from the body. The whole figure of another person
can be seen with one sweep of the eyes. Fine details of the face are no longer perceived,
but hair and condition of clothes are still readily visible. Heat and odor from another
person are not usually detected at social distance, far phase. Eye contact during
conversations of significant length becomes important and voice levels may be noticeably
louder. At social distance, far phase, people may use the space to insulate or screen others
out if involvement is not desired. This social separation can be achieved by placing chairs
back to back, making it possible for people to be uninvolved (Hall, 1966).
Public distance, close phase is twelve feet to twenty-five feet from the body. This

15
distance is considered to be formal because changes in the voice and tone of voice shift as
compared to other distances. Fine details of the skin and eyes are no longer perceived, but
the whites of the eyes can be seen. At this distance, an alert person can either take evasive
or defensive action if there is a perceived threat (Hall, 1966). Commonly this distance is
used for arrangements of official dinners, lecture classrooms, and courtrooms. Public
distance, far phase is twenty-five feet or more from the body. To communicate at this
distance, facial expressions and movements are exaggerated and the voice is amplified.
Words are enunciated more clearly. Much of the nonverbal communicated is done by hand
gestures and body positioning (Hall, 1966). This distance is used for important public
figures and public speakers.
Within each of these personal space zones, behaviors are perceived. These
behaviors can be categorized as follows: (a) postural-sex identifiers: standing, sitting,
squatting, (b) sociofugal/sociopetal orientation: body angling or facing positions, (c)
potentiality for touch, (d) touching, (e) visual possibilities, (f) thermal cues, (g) olfactory
cues, and (h) voice loudness (Altman, 1975). These behaviors within each of the personal
space zones is not necessarily universal. There are wide cultural variations in what
behaviors are permissible within each zone. There are also wide cultural variations in
which distances are appropriate in certain settings and between certain people. These
zones may not be important in terms of physical distance, but they are important in terms
of what interpersonal communication possibilities each zone offers (Altman, 1975).
The personal distance zones described by Hall (1966) allow for the regulation of contact
with other people and make the boundaries around the self more or less permeable. "By
moving closer to or away from other people, we change their accessibility to us. By
moving away we signal a desire for more privacy and use personal space as a mechanism
to shut off certain channels of communication. By moving closer to someone, we permit
greater access to our self and open up an increasing richness of communication" (Altman,
1975, p. 61).
Robert Sommer (1969) describes personal space as "an area with invisible
boundaries surrounding a person's body into which intruders may not come" (p. 26).
Sommer (1969) further explains that personal space is a "portable territory since the

16
individual carries it with him wherever he goes" (p. 27). Unlike Hall's description of
personal space, Sommer (1969) describes personal space as not being specifically spherical
in form. Personal space may not be extended equally in all directions from the body.
However, Sommer does agree with Hall that there are cultural differences among what
distances people maintain between themselves.
Personal space is similar to individual distance. Individual distance refers to the
spacing animals keep between themselves. Individual distance exists only when two or
more species are present. When only one member of a species is present, the individual
distance is infinite (Sommer, 1969). Sommer states that the interaction of individual
distance and personal space affects spacing distances between people. "The violation of
individual distance is the violation of society's expectations; the invasion of personal space
is an intrusion into a person's self-boundary" (Sommer, 1969, p. 27). A specific figure for
individual distance cannot be calculated. Individual distance and personal space is formed
and varies by the relationship between individuals, the bodily orientations of individuals
towards one another, and the distances at which others in the situation are placed
(Sommer, 1969).
In studies performed observing people and how they maintain their personal space,
three particular distances were observed (Sommer, 1969). These distances were arrival
distance, settled distance, and distance after departure. Arrival distance refers to how far a
newcomer will place themselves from an already placed individual. Settled distance refers
the resulting distance individuals place themselves after adjustments are made. Distance
after departure refers to how far apart individuals remain after some individuals have left.
These distance behaviors are based on J.H. Cook's studies of bird behavior (Sommer,
1969).
Sommer (1969) describes studies conducted in a college library and in a mental
hospital to observe people's spatial behavior. Results showed that when a newcomer
would come close to an individual who had already placed him or herself, the newcomer
could maintain the arrival distance, but a comfortable settled distance was not achieved. It
was also shown that if the newcomer ignored or did not recognize defensive gestures and
shifts in posture, the placed individual would eventually leave (Sommer, 1969).

17
In maintaining personal space and protecting it from invasion, many defense
mechanisms may be used. Because personal space boundaries are invisible, people must
use gestures, postures, and specific locations to express meaning to others. In public
spaces, people may keep a stiff posture and lower their eyes to ward off any social
interaction. Sommer (1969) offers the following example, "During rush hour, subway
riders lower their eyes and sometimes 'freeze' or become rigid as a form of minimizing
unwanted social intercourse" (p. 29). Even in intimate contact, people will close their eyes.
Sommer (1969) offers this example, "Lovers pressed together close their eyes when they
kiss. On intimate occasions lights are typically dim to reduce not only distracting external
cues, but also to permit two people to remain close together" (p. 28).
Behavior observed in animals suggests that individual distance is learned during
early years of development. At some point during the early stage of life, an individual
learns how far and how close it can come to other members of its species. If the individual
comes too close, it may be perceived as a threat. However, if it strays too far, it may not
be considered as part of the group (Sommer, 1969). Learned individual space is also
recognized in humans.
Altman (1975) reviews personal space as affected by three broad classes of factors
including individual factors, interpersonal factors, and situational factors. Individual
factors include properties that are specific to the person such as age, sex, cultural
characteristics, personal skills, and personality. Research on each of these properties has
dealt with the differences among people and their personal space zones and the
permeability of these zones (Altman, 1975). Research in regard to personal space and age
suggests that personal spacing stabilizes early in life, but its not until adolescence is
reached that the personal space boundary system is well established and can handle a
variety of situations and social relationships. Children gradually seem to learn only
appropriate distances to maintain from others on different social situations. Some parents
may actually place their children at specific distances away from them to teach the children
where and how to stand (Altman, 1975). Studies of sex differences in relation to personal
space generally show that males have larger space zones than do females, and people in
general maintain greater distances from males than they do from females (Altman, 1975).

18
Sex differences should be examined in regard to whether males or females are interacting
with males or females. Male and female pairs have typically been found to be closer in
proximity to one another than same sex pairs. However, in homosexual pairs, closer
proximity is noted. These results are less clear when age, ethnic and other situational
factors are considered (Altman, 1975).
Data on cultural influences of personal space shows that there are both similarities
and differences among cultures in how personal space is used and maintained. Several
studies have looked at personal space characteristics of Asian, American, Latin American,
Middle Eastern, Mediterranean, and European countries. Little empirical evidence exists,
but data has suggested that some cultures generally have closer interaction distances,
while other cultures have larger interaction distances. Interaction distance refers to the
physical distance people stand or sit away from each other while in conversation. People
from Mediterranean cultures showed closer interaction distances, people from European
cultures showed larger interaction distances, and Americans demonstrated intermediate
interaction spaces (Altman, 1975).
Personality characteristics have also been examined in regard to personal space.
Research suggests that anxiety-prone people place greater distances between themselves
and others. These people indicate that close distances provoke more anxiety and stress.
Data has also been collected to support the idea that extroverts maintain closer personal
space than do introverts (Altman, 1975). Other studies have been conducted to see how
people space themselves in relation to those with social stigmas. In general, it was found
that people placed themselves at a greater distance from those who had some sort of
abnormality, such as mental patients, amputees, or obese people (Altman, 1975).
Interpersonal factors act to regulate personal space zones. Differences in personal
space distances are noted in differing social relationships. Many studies on interpersonal
space have indicated that "(1) Positive relationships between people are associated with
closer interpersonal distances or smaller personal spaces zones, and (2) people located at
close (but not overly close) distances are viewed as having good interpersonal
relationships" (Altman, 1975, p. 80). In both laboratory and field studies designed to
compare the spacing of strangers, casual acquaintances, and close friends, it was found

19
that friends kept a closer distance than did acquaintances or strangers. In studies designed
to examine the outcomes of social interaction along positive and negative dimensions, it
was found that people place themselves closer to figures with pleasant expressions, and
farther from figures with negative expressions, thus closer distances are associated with
favorable social exchange than unfavorable social exchange (Altman, 1975).
Situational factors also determine personal space distances. Existing research has
looked at the formality or informality of settings and the familiarity or strangeness of
situations and the effect on personal space. People in formal settings may act in a
restrained way, "adopting stylized roles and modes of behavior, using barriers such as
distance, and thereby not making the self very accessible to others" (Altman, 1975, p. 84).
When people are in places they are more familiar with, they may be more willing to be
closer to others than compared to places they are unfamiliar such as streets and parks.
Research regarding Hall’s theories is continuously being done. De Long (1992) has
taken Hall’s concept of four personal space categories and expanded upon them. In
studying how individuals orient themselves to one another in seating arrangements, De
Long has revised these categories. De Long (1992) found that compared to Hall’s circular
personal space zones, zones were “more ovoid in shape” (p. 21). De Long also discusses
how furniture arrangement can change the perception of how people relate to one another
in space. The arrangement of furniture in relation to where people sit can give signals to
passageways and direct people through space. These passageways sometimes direct others
right through personal and social space zones.
The concept of personal space has also been studied by Adams and
Zuckerman (1991), and it was quantified that lighting appears to alter an individuals sense
of closeness to others. Adams and Zuckerman (1991) conducted experiments with female
college students and found that in dim lighting conditions, personal space distance
increases compared to personal space distances in bright conditions. In low illumination
levels, feelings of inappropriate intimacy may be aroused, which can cause an increase in
personal space distances. This study found that under dim lighting conditions as compared
to bright lighting conditions, there was an increase in the personal space bubbles on the
sides and to the rear of the study participants (Adams & Zuckerman,1991).

20
Hall's (1966) research suggests that personal space bubbles are round as the
individual is standing. Adams and Zuckerman's (1991) research was also conducted on
standing participants and it suggests that the personal space bubbles are not round, but
greater in the rear and sides than in the front. This finding suggests that personal space
bubbles are not round as in Hall’s research, but are more irregularly shaped. In contrast,
De Long's (1992) research was conducted on seated individuals, and the personal space
bubbles were described to be ovoid in shape. Thus, further research on the shape of
personal space bubbles appears in order.
In studying how people behave within the personal space bubbles or within the
proxemic zones, it is necessary to understand how people perceive space and their
environment. Therefore, it is necessary to understand how people see and how they
process the information that they see. This process is called visual perception. Visual
perception has an influence on how the information people see is processed and given
meaning. When meaning is given to the information received from the visual environment,
behavior may be affected.
Visual Perception
Much of the way people experience the world is through the sense of sight. What
people experience and perceive is influenced by cultural, social, and personality systems.
In studying how people perceive space, its is necessary to understand how information
received from the visual field is processed. There is an extraordinary amount of
information taken in by the process of sight and transmitted to the brain for interpretation
and classification at any given moment. At any particular moment, the interpretation of
information is done either consciously or subconsciously, because the amount of incoming
information is so vast. Some information may be determined important and is immediately
put into the consciousness of the observer for further action (Lam, 1977). Other
information is determined to be unimportant, and may be put into the memory for later
use. The process of visual perception is very complicated because so much of what is seen
by the eye and transmitted to the brain becomes shaped by cultural, social, and

21
personality characteristics of an individual.
To understand how the process of visual perception begins, it is necessary to
understand how the eyes operate. The eyes are constantly scanning the environment and
receiving information which is then transmitted to the brain through the process of sight.
The brain dictates the scanning pattern of the eyes by a focus selector (Lam, 1977). When
the eyes are not under the conscious control of the brain to view something particular, it is
constantly monitoring the environment to assure that no significant changes have occurred
that warrant specific conscious attention. The focus selector is also influenced by past
memories, personal habits, expectations, and the current emotional state of the observer.
Because of the physical construction of the eye, two types of vision are possible;
central (foveal) vision and peripheral vision. Central vision occurs as the eyes scan the
environment and collect detailed information about elements within the visual field, as
directed by the focus selector. Peripheral vision monitors the remainder of the
environment for any changes that may require the attention of central vision, or redirection
of the focus selector. As visual stimuli (raw data) are received by the eyes, the process of
visual perception begins.
Lam (1977) describes three components of the process of visual perception that
occur after information is received by the eyes, including the attributive, expectation, and
affective components. Although these three components can be examined independently of
each other, they do not function independently of each other.
"All three aspects of perception - the attributive, the
expectant, and the affective - are inexplicably interwoven in
real life…The attributive establishes links prior to
experience, activating expectations and provoking
emotional responses. Expectations, in turn, influence what
will be chosen as the next object of sensory attention, and
can trigger any emotion from joy to fear to apathy
depending on the nature of the anticipated developments.
The affective qualities of a perception determine the

22
importance which we give it, which in turn influences what
impact it has in terms of re-calibrating the experience"
(Lam, 1977, p. 34).
The attributive component of visual perception begins after raw data is brought in
through the eye and transmitted to the brain. Data is begun to be interpreted, sorted and
classified, and subsequently given meaning. Meaning is assigned through association with
past experiences. This association is accomplished by the use of the experience filter (Lam,
1977). The experience filter is the portion of the unconscious memory that warehouses all
the data received from past experiences. When raw data is received by the eyes, the
experience filter compares new data with old data, deciding what characteristics the new
data have in common with previously stored data (e.g., objects, situations). After
comparisons are made, meaning is then assigned to the new data. "…Linkages to prior
experience, established by subconscious mechanism which matches or 'recognizes'
analogous items in the experience filter, are essential to the assignment of meaning to
incoming data…Attributive classification involves the simplification of incoming data by
classifying it according to the highest level of order which can be found in the experience
filter" (Lam, 1977, p. 32). The association of meaning to visual stimuli by the experience
filter is not performed on the basis of individual characteristics of the raw data alone. The
association of meaning is also attributed to the context within which the stimuli are
viewed. The experience filter stores not only information about visual stimuli, but the
context within which the visual stimuli are viewed (see Figure 3).
The expectation component of visual perception establishes a standard for
comparative judgment and evaluation for the incoming visual stimuli already given
meaning through the attributive stage. An incoming visual stimulus is expected to be like
something previously experienced and stored in the experience filter. Lam (1977) gives the
following example, "If one is lost in a city, one expects that the streets will be arranged in
some rational order and that the houses will be numbered consecutively. Prior experience
tells us that the signs of a certain shape located on poles of a certain height will probably
be helpful direction indicators; the scanning pattern of the eyes is directed

23
Figure 3. The process of visual perception (Lam, 1977) as adapted by author.
FOCUS SELECTOR
VISUALSTIMULUS
RAW DATA
EXPERINCE FILTER
ATTRIBUTIVE EXPECTATION
AFFECTIVE
ADJUST FOCUSSELECTOR
EYE

24
accordingly" (p. 34). The expectation component also establishes expected sequences of
events. The expectation component redirects attention, controls eye movement, scanning
patterns, and determines which data stored in the experience filter will be used to compare
to new incoming data.
The affective component of visual perception is concerned with the emotional
response elicited or affected by a visual stimulus. "The attributive classification to which a
stimulus is assigned and the expectations which are activated by that classification trigger
emotional responses which in the aggregate determine how we feel in a given situation or
environment" (Lam, 1977, p. 34). Depending on the triggered emotional response,
attention to something in the visual field is assigned when the visual stimulus is determined
to be important, interesting, or attractive. If the visual stimulus is determined to be
unimportant, dull, or irrelevant, little attention is assigned to it, and the data may not be
stored in the experience filter. To some degree, the affective component decides where in
the experience filter data or "memories" are stored (Lam, 1977).
The experience filter is constantly being updated with new information as new
visual stimuli are received, interpreted, classified, and expectations and attention are
directed to new stimuli. "If the environment behaves as expected, the web of associative
relationships which constitute the experience filter will remains essentially unchanged; the
relevant association will merely be strengthened by confirmation" (Lam, 1977, p. 35).
However, if the environment does not behave as expected, the experience filter is adjusted
as the unfamiliar new visual stimuli are re-evaluated and classified.
Throughout this process of visual perception, there is tremendous selectivity, and a
search for meaning to the information obtained. Because meaning is given to what is seen,
this process of visual perception may have some kind of influence on behavior. Thus, the
perception of how a space is illuminated may have an effect on spatial behavior. An
exploratory study by Flynn, Spencer, Martyniuk, and Hendrick (1973) considered this
potential influence.
Lighting Variation Influence on Behavior
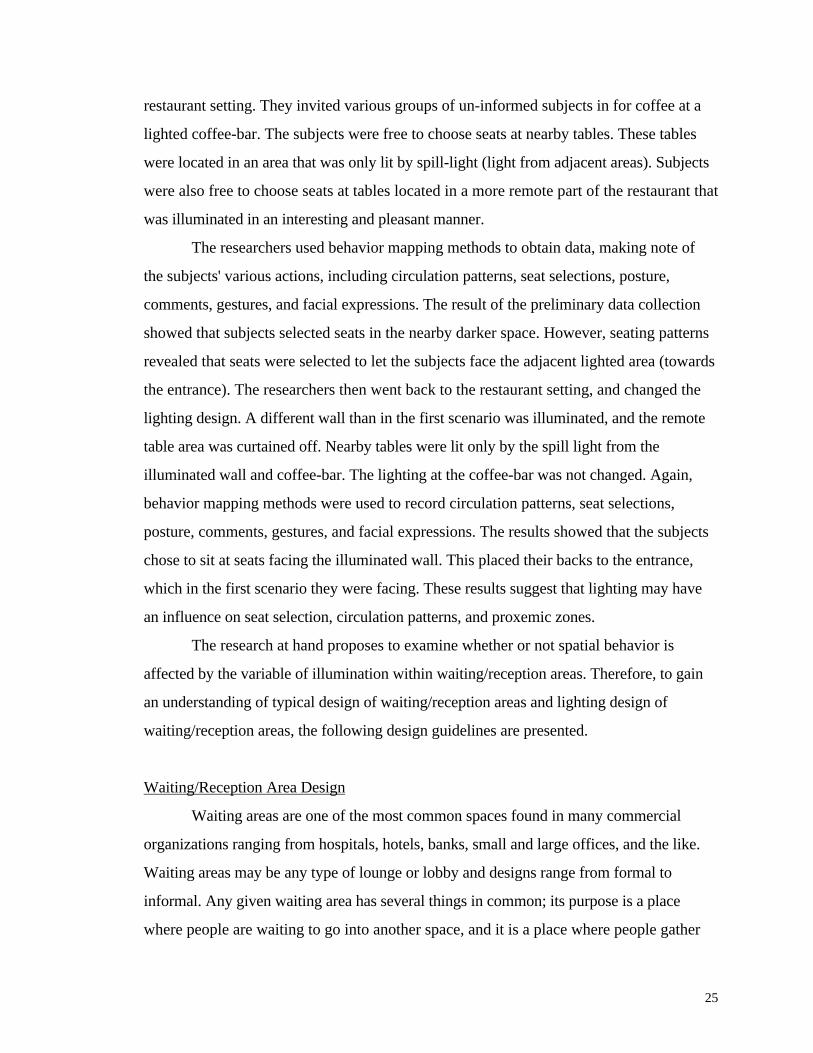
Flynn, Spencer, Martyniuk, and Hendrick (1973) set up an experiment in a
25
restaurant setting. They invited various groups of un-informed subjects in for coffee at a
lighted coffee-bar. The subjects were free to choose seats at nearby tables. These tables
were located in an area that was only lit by spill-light (light from adjacent areas). Subjects
were also free to choose seats at tables located in a more remote part of the restaurant that
was illuminated in an interesting and pleasant manner.
The researchers used behavior mapping methods to obtain data, making note of
the subjects' various actions, including circulation patterns, seat selections, posture,
comments, gestures, and facial expressions. The result of the preliminary data collection
showed that subjects selected seats in the nearby darker space. However, seating patterns
revealed that seats were selected to let the subjects face the adjacent lighted area (towards
the entrance). The researchers then went back to the restaurant setting, and changed the
lighting design. A different wall than in the first scenario was illuminated, and the remote
table area was curtained off. Nearby tables were lit only by the spill light from the
illuminated wall and coffee-bar. The lighting at the coffee-bar was not changed. Again,
behavior mapping methods were used to record circulation patterns, seat selections,
posture, comments, gestures, and facial expressions. The results showed that the subjects
chose to sit at seats facing the illuminated wall. This placed their backs to the entrance,
which in the first scenario they were facing. These results suggest that lighting may have
an influence on seat selection, circulation patterns, and proxemic zones.
The research at hand proposes to examine whether or not spatial behavior is
affected by the variable of illumination within waiting/reception areas. Therefore, to gain
an understanding of typical design of waiting/reception areas and lighting design of
waiting/reception areas, the following design guidelines are presented.
Waiting/Reception Area Design
Waiting areas are one of the most common spaces found in many commercial
organizations ranging from hospitals, hotels, banks, small and large offices, and the like.
Waiting areas may be any type of lounge or lobby and designs range from formal to
informal. Any given waiting area has several things in common; its purpose is a place
where people are waiting to go into another space, and it is a place where people gather

26
(Deasy & Lasswell, 1985). Some of the people in the waiting area will be acquainted with
one another, and others will not. Beyond those commonalties waiting areas vary in their
size, spaces adjacent to waiting areas, furniture arrangement, furniture comfort, and
finishes. The design varies greatly with the type of organization it is located within and
cost of materials used. However, no matter what type of organization, the size,
arrangement, and decorations of the waiting area project a message about the organization
and the way it views its visitors (Deasy & Lasswell, 1985.)
In Designing Places for People, Deasy and Lasswell (1985) recommend several
guidelines for the design of waiting areas and spaces where people gather as they either
enter a space, or wait in a space before going on into an organization to accomplish their
business. Generally, all waiting areas should consider providing cues to help visitors find
their way, make them comfortable, consider any special needs and demonstrate that the
visitors are important to the organization. If a waiting area is located right off an entry
from the outdoors, it should provide a transition area from the outside to the inside where
visitors can stow coats, umbrellas and the like. To help visitors find their way, either a
receptionist should be easily accessed to check-in or to ask questions, or an information
center should be provided. Seating must be offered, and should be of an appropriate kind
and amount. The design of the furniture and the layout of the furniture should consider
ADA guidelines and universal design recommendations. Where people must wait for
service, a queuing system is recommended of the appropriate type for the organization. If
the people in the waiting area are going to spend a lot of time waiting, it is necessary to
provide some sort of entertainment for them. Entertainment may be provided through
magazines, brochures, aquariums, and televisions. The type of entertainment should be
appropriate to the facility.
There are several guidelines for arranging the seating in a waiting area (Deasy &
Lasswell, 1985). The number of people who will need to use the waiting area at any one
time is considered foremost. The type of seating specified for the waiting area may be
decided upon based on how many people will be using the space. The use of the space,
and how long people will be waiting may affect the comfort level of the seating to be
specified. Understanding peoples' seating preferences influences what types of furniture

27
LONG SEATS ARE NOTUSED EFFICIENTLY
6'-0
" P
RE
FE
RR
ED
5'-0
" M
INIM
UM
Figure 4. Seating Preferences. (Adapted from Deasy & Lasswell, 1985)
Not used due to lack ofdefined territory or ability toprotect territory

28
should be provided. People tend to prefer individual chairs or short couches that seat two
people (see Figure 4). When long couches that seat three or more are used in public
spaces, people tend to choose the end seats. When the end seats are occupied newcomers
tend to not take the center seats unless there is no where else to sit (Deasy & Lasswell,
1985).
Seating arrangements should favor small groups, because most informal groups
rarely exceed three people. It is suggested that seating arrangements in parks, hotel
lobbies, and other waiting areas where people meet should be designed with small group
gatherings in mind. In studies that have observed informal groups in public space and how
many people comprised these groups, it was observed that 71% contained only two
individuals, 21% contained three individuals, 6% four individuals, and only 2% five or
more individuals (Deasy & Lasswell, 1985). There is a human tendency to form into
groups, and so these groups tend to congregate in lounges, lobbies, and recreation type
areas.
When furniture such as ganged seats, or sectional type seating are used in waiting
areas, some sort of distinct separation between arm rests or seats should be made so that
territorial boundaries are well-defined (Deasy & Lasswell, 1985). Providing seat dividers,
or some type of clear boundary marker between seats helps to resolve sources of annoy-
ance or discomfort to strangers that are forced to sit next to each other in situations such
as airplanes, airport terminals, or hospital waiting areas where ganged seating is commonly
used (see Figure 5).
Seating arrangements in waiting areas should also accommodate conversations. If
small groups are in the waiting area, seating should facilitate their desire to communicate.
Face-to-face and side-to-side conversations are generally not preferred. Most people
prefer to sit at an angle to converse with a companion, and will adjust the seating
arrangement to sit at an angle if it is not already adjusted (Deasy & Lasswell, 1985)
(see Figure 6).
Seating arrangements may also encourage or discourage the formation of groups.
When a socialfugal seating arrangement is used, the formation of groups and discussion is
discouraged due to the separation of spaces because only peripheral vision is

29
Arms define territory boundaries
Figure 5. Utilize arms in ganged seating to define territory.

30
APPROXIMATE
5'-0
"
Figure 6. Optimum conversation distance. (Adapted from Deasy & Lasswell, 1985)

31
incorporated. These types of arrangements seem to isolate people or minimize interaction
with others. However, when a sociopetal seating arrangement is provided, it encourages
people to form groups and to interact (Deasy & Lasswell, 1985)
(see Figure 7).
There are many ways in which waiting areas may be designed for accommodating
the needs of the people who will use the space. The design is dependent upon the type of
organization the waiting area is to be located within, how many people will be using it,
and what the mission of the organization is. However, there are recommended arrange-
ments to benefit the design of such spaces. De Chiara, Panero, and Zelnick (1991)
recommend specific distances between groups of chairs, and particular arrangements of
chairs be used. De Chiara, Panero, and Zelnick (1991) also indicate that individual seats in
waiting areas are preferred over sofas (see Figure 8). This may be due to people wanting
to sit in their own defined space, rather than having to share a sofa with a stranger. The
personal proxemic and social proxemic zones are better defined with chairs than with
sofas.
Lighting of Waiting/reception Areas
When lighting any type of space, it is essential to understand both the quantitative
and qualitative aspects of lighting. In interiors, light is considered to be an element of
design, such as color, texture, line, shadow, and form (IESNA, 1995). How spaces are
perceived is greatly dependent upon the placement of light and shadow. "Design solutions
should not only provide the needed illumination, but should enhance the aesthetic qualities
of the space" (IESNA, 1995, p. 1). The lighting of a waiting area is approached with the
same methodology used to light any given space, and it is critical to understand that the
lighting within a space has a great effect on the perception of a space.
Lighting can effect the way space is perceived due to the placement and quantity of light in
space. Different effects can be achieved through the manipulation of light sources and light
direction. This manipulation can effect the visual appearance of the space itself, objects in
the space, people in the space, and affect the performance of tasks in a space. There are
three basic types of lighting methods used to develop lighting solutions;

32
Sociofugal arrangement: Groups are separated.
Sociopetal arrangement: Groups are integrated.
Figure 7. Sociofugal and sociopetal seating arrangements (Sommer, 1969) as illustrated by
author.

33
14'-0"
10'-6
"
3'-0" 2-6"
8'-6"
13'-6
"
7'-0
"
14'-6"
2'-6" 3'-0" 2'-6"
7'-6"
6'-6
"
6'-4
"
Figure 8. Typical seating arrangements for lounge or waiting areas. (Adapted from De
Chiara, Panero & Zelnick, 1991)

34
ambient lighting, task lighting, and accent lighting (Egan, 1983).
The first of these lighting methods is ambient lighting. It appears as a non-
directional, un-concentrated, soft, and uniform light. It is used for general lighting
purposes and is achieved by using a diffuse point or linear sources that may be either
incandescent, fluorescent, or high intensity discharge. Spaces tend to be bland or dull in
appearance with ambient lighting because objects and their background are equally visible
and no highlights are created. In spaces where harsh shadows are a problem, or make
visual tasks difficult to perform, ambient lighting can be used to soften harsh contrasts
(IESNA, 1995) (see Figure 9).
The second method, accent lighting, focuses light on an object with very little spill-
light and creates a high contrast from the object to its background. This effect creates
sharp shadows and visual interest. Accent lighting can be achieved with the use of point
sources of high intensity such as low voltage incandescents or line-voltage incandescents
(IESNA, 1995). The source used should cast narrow beams of light and is typically
recessed into the ceiling and aimed downward. Any type of fixture used for accent lighting
purposes should allow for adjusting the aim of the beam of light. Care must be taken to
aim the light away from normal viewing angles so that direct glare and reflected glare
problems can be avoided. Accent lighting should be used in combination with other
lighting systems for balance (IESNA, 1995) (see Figure 10).
Thirdly, task lighting is lighting provided for the performance of specific activities
such as cooking, reading, sewing, drafting, writing, etc. Any activity that requires detailed
visual tasks, should have additional lighting. Light should be placed at the task, but care
must be taken in the placement of the light so that shadows or glare problems are not
created and eye-strain is minimized (see Figure 11). These three types of lighting methods
used in combination or alone can influence the perception of space. A space can be made
to look larger or smaller than it really is by the placement of light, the quantity of light and
the distributed pattern of light. To make a space appear larger, indirect or ambient lighting
should be used to either illuminate the floor, the walls, or the ceiling. The illuminated
surfaces should be highly reflective to enhance the perception of brightness. The enhanced
perception of brightness on either the walls, floor, or ceiling lends to the appearance

35
Figure 9. Ambient lighting (Adapted by author from IESNA, 1995).

36
Figure 10. Accent lighting (Adapted by author from IESNA, 1995).

37
Figure 11. Task lighting (Adapted by author from IESNA, 1995).

38
of expanding space. Light sources that produce this effect include diffuse point and linear
sources that may be either incandescent, fluorescent or high intensity discharge. With the
surfaces evenly illuminated and uniformly illuminated, the room dimensions will appear
larger (see Figure 12). However, with only this type of lighting, there is little contrast,
colors may appear less vibrant and sparkle from shiny surfaces is reduced. To improve the
dull appearance, direct shielded luminaires can be used to focus light on objects to create
interest. This type of accent light should be two-to-twenty-times as bright on particular
objects of interest (IESNA, 1995).
Lighting effects such as grazing or washing can be utilized to give a space a larger
appearance. Grazing is achieved by using well-shielded luminaires that are either recessed
into the ceiling or surface mounted onto a wall or ceiling and cast light down upon a
surface. Grazing is best used on surfaces such as brick or stone because aesthetically
pleasing shadow patterns are produced (see Figure 13). This effect is dependent upon the
sharp angle of incidence of light against the surface being illuminated (IESNA, 1995). The
type of light source used to create a grazing effect can either be incandescent, fluorescent
or high intensity discharge, and can either be a point, diffuse, or linear source. Grazing
gives the impression of expanding space and emphasizing texture and colors of surfaces.
Washing also gives the impression of expanding space by providing even
illumination across the planes of walls or ceilings. Washing effects are produced through
the use of well-shielded directional luminaires that may be either recessed into the ceiling
or surface mounted onto a ceiling or wall. Such types of luminaires may also be floor-
mounted. The light source itself may either be a point-source or linear-source and it can be
either incandescent, fluorescent, or high intensity discharge. Washing a surface with light
adds ambient light to a space, softens shadows, and makes the wall or ceiling planes
illuminated appear larger (IESNA, 1995.) Washing should only be used on matte surfaces
because a glary reflection may occur if used on highly specular surfaces (see Figure 14).
Washing should also be used with other lighting systems for balance. Changing the
pattern of distribution and quantity of light can make a space appear smaller and more
intimate. To create the appearance of a smaller space, shielded luminaires recessed into

39
Figure 12. Lighting can expand the appearance of space (Adapted by author from
IESNA, 1995).

40
Figure 13. Grazing (Adapted by author from IESNA, 1995).

41
Figure 14. Washing (Adapted by author from IESNA, 1995).

42
the ceiling, or mounted along walls or ceilings aiming light downwards, should be used
(see Figure 15). Such luminaires should have concentrated beam spreads. Typically
incandescent light sources are used because warm, yellow light sources are considered to
be more intimate (Gordon & Nuckols, 1995.) With this type of lighting, high contrasts are
created, colors will appear more vibrant, and sparkle and glitter are enhanced. The
shadows created from the high contrast emphasize textures, but human faces are modeled
very harshly. A space with this type of lighting is perceived as being very dramatic and
intimate, but the performance of prolonged visual tasks is not recommended without task
lighting (IESNA, 1995). High contrasts should be balanced with ambient lighting.
The above approaches to lighting space may be applied to lighting waiting and
reception areas. However, it is important to recognize that many waiting areas are part of
a larger space such as a lobby where people are making a transition from one space to
another, stopping to ask a question to a receptionist, or reading. The design of the space
may also establish the main theme for a facility. The lighting design needs to address both
the architectural design intent and the functions of the space. IESNA (1993) states:
Reception areas are designed for people who are waiting for
their appointments. While they are waiting they can read or
converse with others. The lighting should be restful yet
provide enough illumination for reading. One way to
provide a restful atmosphere without direct glare is by
illuminating one or more of the walls. Another way is to
light the ceiling and part of the walls. Accent lighting for
pictures or a piece of sculpture enlivens the appearance of
the room. If there is a receptionist located in the area, the
ambient light may need to be augmented depending upon
the visual tasks involved. Care should also be taken to light
the receptionist's face, so as to make this person look
approachable and also to eliminate harsh shadows caused by
downlight directly overhead (p. 534).

43
Figure 15. Lighting can make a space appear smaller (Adapted by author from IESNA,
1995).

44
Reception areas may also serve as an entrance area into a building
acting as a transition between facilities, so adaptation must be considered in
terms of going from outside-to-inside or inside-to-outside. IESNA (1993)
states:
First Impressions of office buildings are often perceived in
entrance lobbies. The lighting should compliment the
architecture and provide a safe transition from the exterior
to the interior. Consideration must be given to readaptation
by the visual system from bright daylight conditions to
darker interior lighting conditions, or vice versa. The degree
of readaptation depends upon the fenestration and the
changing exterior lighting conditions (p. 534).
The difference in the adaptation process from daylight to nighttime conditions
must also be considered. "If the lobby is enclosed with glass, the interior walls need to be
at a higher luminance during the day in order to be seen from the outside against the high
luminance of daylight. At night, much lower luminance is required. The variable luminance
also makes it easier for the eyes to adapt to the luminance difference when entering or
leaving a building. For these reasons, the lobby lighting should incorporate dimming or
switching controls" (IESNA, 1993, p. 534.)
In addition to be being aware of the different methods of lighting a space and their
effect on the perception and appearance of a space, there are several additional concepts
that must be considered when choosing the appropriate design. Consideration should be
given to the appropriate luminance levels for any given space and there must be an
evaluation of the users' needs, age and life style and function of the space. The age of the
users affects the quantity of light needed. The older the user, more light is required to
enhance visual acuity (IESNA, 1995). The life style or cultural orientation of the users
may also effect the quantity of light needed as well as the distribution of light. It is also
critical to analyze the needs of the users. What kinds of tasks will they be doing in the
space? What kinds of equipment will be used? The answers to these questions affects the

45
lighting system and controls needed for a space. The use of the space is important to
understand, because the lighting can be designed to create a serene or stimulating mood,
for example.
However, the above questions are not the only concerns that must be addressed
when a lighting solution is being developed. The architectural qualities of a space should
also be considered, including the architectural lines, forms, patterns, and textures of a
space. Then, it is necessary to determine what should be emphasized or possibly
minimized by use the lighting. Architectural limitations may effect the placement of
luminaires within a space, so it becomes necessary to consider the following: the height,
width and depth of the space, the type of ceiling -- wood, plaster, concrete, or
plasterboard, the slope of the ceiling, plenum depth, insulation, HVAC ducts/plumbing,
the location of structural beams and joist spacing (IESNA,1995). The location of doors,
windows, and orientation to sunlight, as well as the finishes of a space will also affect
decisions in developing a lighting design. It is necessary to consider vertical and horizontal
surfaces, noting their color, texture, and reflectance characteristics. The type of furniture
in a space, its scale, placement, and surface color, finish, texture, and reflectance
characteristics will also influence luminaire decisions. The code requirements for a space
need to be considered as well. Note the electrical, energy and equipment requirements.
When all the above information has been obtained, luminaire and lamp choices can then be
made (IESNA, 1995).
In understanding the users' needs of a space and selecting the appropriate
illumination level, seeing zones should be evaluated. One person's visual field consists of
three zones. Zone One is the task-at-hand, Zone Two is the area immediate around the
task, and Zone Three consists of the general surroundings (IESNA, 1995). To maintain
visual comfort, particular luminance ratios need to be maintained. In Zone Two, the
luminance should not noticeably exceed Zone One or be less than one-third of Zone One.
Zone Three should never be less than one-tenth as bright as Zone One (IESNA, 1995)
(see Figure 16).

46
TASK
ZONE 2
ZONE 3GENERAL SURROUNDINGS
IMMEDIATE SURROUNDINGS
ZONE 1
Figure 16. Illuminance Ratios (Adapted by author from IESNA, 1995).
ZONE LUMINANCE RATIO
Zone 1 - The Task Typically task luminance is 4 to 12 cansdelas/ft2
Seldom exceeds 20 candelas/ft2
Zone 2- Intermediate Surroundings- Desirable ratio: 1/3 to equal to task
- Minimum accepted ratio: 1/5 to equal to task
Zone 3- General Surroundings- Desirable ratio: 1/5 to 5 times task
- Minimum accepted ratio: 1/10 to 10 times task

47
The lighting of waiting areas, reception areas, lobbies may be achieved in many
ways, but ultimately the design must meet the needs of the various tasks performed within
the space; reading, paper and computer tasks of the receptionist, entry and transition space
from one area to another. The lighting must also enhance the image and architecture of the
facility, while taking into consideration the users of the space, their needs, and their age.
IESNA (1995) recommends that twenty to fifty footcandles be supplied to areas where
casual reading tasks are performed. For more critical tasks and prolonged reading tasks,
fifty to one hundred footcandles should be supplied. For general lighting for passageways,
five to ten footcandles should be the minimum supplied.
The lighting methods described above along with the design guidelines for
waiting/reception area design will be used to create an environmental setting to examine
the potential effect illumination level changes may have on proxemic behavior. One way to
collect this information is through the use of simulation. Simulation as a means for
collecting data for behavioral research studies has been tested by several authors such as
Baum and Davis (1976), De Long (1976), and Lau (1970). The results have shown that
data results are similar between simulations performed at full-scale and simulations
performed in scale-model.
Simulation as means of behavioral research
A primary reason for doing behavioral research is to define activities performed in
a given environment and to gain insight helpful in resolving specific research problems
concerning how people interact within space. Behavior is described as the activities that an
organism is observed doing at any one moment (Bechtel & Zeisel, 1987). Behavior
can be observed in both molar units and molecular units. Most environmental behavior
research looks at molar behavior; the researcher(s) wants to know where people go and
how they get there. Molecular behavior is studied when examining the interaction
individuals have with machines or furniture. Molecular behavior is sometimes associated
with human factors research (Bechtel & Zeisel, 1987). These units of behavior are
recorded and then analyzed. Questions are raised asking why this behavior occurs and
what it means.

48
It is necessary then to understand the environment-behavior paradox (Bechtel &
Zeisel, 1987). This paradox is based on the assumption that the environment is dominant
over behavior, that is, it is the environment that causes or influences the behaviors that
occur within it. More research is necessary to determine if this paradox is the reality of the
environment-behavior relationship. A frequent study done in environmental behavior
research is one that looks for behavior changes when environmental factors are
manipulated. When looking at behavior changes as a result from environmental changes, a
stimulus-response relationship is anticipated. "The unit of analysis is the S-R or stimulus-
response relationship, in which observable behavior is elicited by equally observable and
measurable stimuli" (Ittleson, Rivlin, Proshanky, & Winkel, 1974, p. 65). Ittleson, et. al.
(1974) go on to state that "in human behavior only those events that can be observed and
empirically specified have any legitimacy for a science of man" (p. 65). S-R units are either
biologically determined or are reliant upon an essential response system that is learned
through forming new S-R relationships. S-R units are evoked and created to lead to the
ultimate satisfaction of an individual. The need to find satisfaction may be in response to
drive-related needs as the search for food, water, or shelter. Or, it may be in response to
the avoidance of situations that are potentially dangerous, painful or threatening to the
individual (Ittleson, et.al., 1974).
An environmental/behavioral study may either be executed in an existing space
where observations and methods such as behavior mapping are used to collect data, or it
may be executed by use of some type of simulation of an existing or proposed environ-
ment. When conditions do not allow for natural observations of an existing space,
simulation may be a better option for studying and recording human behavior. The
conditions that do not allow for natural observation may include prohibitive cost factors,
or there may be too many variables to control in an existing space. Use of simulations may
also facilitate the manipulation of environmental variables for their apparent effect or in-
effect on human behavior. Many authors have discussed the effectiveness, reliability, and
validity of simulations (Bosselmann & Craik, 1987; Baum & Davis, 1976; De Long, 1976,
1977; Lau, 1970).

49
Bosselmann and Craik (1987) describe various techniques of simulations to study
the environment constructed from McKecnie's (1977, In Bosselmann and Craik, 1987)
typology of environmental simulations. The techniques are characterized by whether they
are conceptual or perceptual and either static or dynamic. "A conceptual simulation seeks
to convey abstract forms of environmental information" (p. 162). Conversely, a perceptual
simulation attempts to convey specific information about the physical environmental
setting or place (Bosselmann & Craik, 1987). A conceptual simulation may be either static
or dynamic. Static conceptual simulation may use maps or floorplans, whereas a dynamic
conceptual simulation may use computer modeling to simulate an environment
(Bosselmann & Craik, 1987). A perceptual simulation may be either static or dynamic, as
well. Static perceptual simulation includes photographs or sketches of an environment,
and dynamic perceptual simulation may include filmed modelscope tours of scale-models
of places (Bosselmann & Craik, 1987). These types of simulations are further
differentiated by their context of application. A simulation may be used in environmental
planning and design, auto, flight or navigational training, or the simulation seen in
entertainment and feature films or television.
The interest here is with simulation of environments and their design, however,
there are similarities between the three types of simulations described above. The goal of
environmental planning, design, and visual simulation is to "convey accurate impressions
of a place" (Bosselmann & Craik, 1987, p. 163). These impressions would include what is
supposed to be seen within the environment, what descriptions the environment provokes,
and what evaluation it provokes (Bosselmann & Craik, 1987). The typical purpose of this
type of simulation is to provide a preview of a proposed environment so that responses
can be collected and considered throughout the design decision making process. The type
of simulation is commonly performed through the use of scale-models or sketches
(Bosselmann & Craik, 1987).
This study of environmental perception through simulation seeks to understand the
impressions people form of settings, environments, and places. When viewing a
simulation, the observers response is generally a first impression, because the observers
are viewing a proposed project for the first time and rarely are given a chance to view the

50
presentation model repeatedly over a period of time. Thus, in the evaluation of how
effective a simulation is in generating accurate perceptions of an environment, it is
necessary to judge the effectiveness of a simulation in predicting the first-impressions of a
real-world setting (Bosselmann & Craik, 1987).
In the evaluation of a simulation's effectiveness for predicting accurate impressions
of real-world settings, the following factors should be analyzed: (1) characteristics of the
observers, (2) medium for selected for presenting the setting, (3) the response formats
used, (4) the environmental attributes of the setting, and (5) the nature of the transaction
with the simulated setting (Bosselmann & Craik, 1987). The characteristics of the
observers may include their attitudes towards the environment in question, their cultural
backgrounds and beliefs. The medium of presentation for the setting is how the observers
view the simulation, either through slides, a direct site visit, scale-models, sketches, or
floorplans. The response format deals with how observers are required to report their
impressions of the simulation. The observers may be given instruction to freely write out
their impressions, or fill-in descriptive checklists, or make evaluative judgments.
"Although research in environmental perception and assessment has sought to identify a
basic set of descriptive and evaluative measures, it has not yet produced a standard set of
response formats commonly accepted in evaluation research of visual simulation"
(Bosselmann & Craik,1987, p. 165). The environmental attributes of a setting refer to how
closely the real-world setting and its characteristics are represented in the simulation. The
nature of the transaction with the simulated setting refers to how the observers are
instructed to view or experience the situation and whether they have had or have not had
prior familiarity with the simulated environment.
The use of simulation methods, in the study of proxemic behavior, has been tested
by both Baum and Davis (1976) and A.J. De Long (1976, 1977). Baum and Davis (1976)
used scale-model environments to examine the impact of color, visual complexity, and
sensory stimulation on the perception of crowding. Subjects were presented with scale-
model rooms constructed from plywood, painted like an interior and given clothespin
people to use as scale figures. Subjects were asked to place the scale figures in the scale-
model rooms. The results of the study showed that light colored interiors, which appear

51
larger, maintained more scale figures than darker colored rooms. Thus, in lighter colored
rooms, the perception of crowding was not as severe as in darker colored rooms (Baum &
Davis, 1976).
De Long (1976) used the distance for a comfortable conversation as reported by
Sommer (1969) as the basis of a study comparing the accuracy and reliability of data
collected in scale-model environments with those data collected in full-scale environments.
De Long (1976) used data from Sommer's (1969) study to replicate four scale-model
conditions, arranging scale-model sofas similar to those used in Sommer's (1969) full-scale
study. Subjects viewed scale-model arrangements of sofas placed facing each other, and
the distance between the sofas was gradually increased from 1'-0" to 6'-0". Subjects were
asked to place scale figures on the sofas where they could have a conversation at a
comfortable distance. The results showed that scale figures were placed side-by-side on
one sofa for conversation when the sofas were approximately 3'-6" apart. These results
were nearly identical to Sommer's (1969) full-scale study.
De Long (1977) also tested the accuracy of spatial perception by participants in
scale-model environments. De Long (1977) set up an experiment to compare the accuracy
of dimensional and spatial perception of scale-model environments to the accuracy of
dimensional and spatial perception of full-scale environments. The scale-models used in
De Long's (1977) study were 1" = 1'-0". The participants of the study were asked to view
a scale-model consisting of two lounge chairs, each occupied by a scale figure. The two
chairs were gradually moved closer to one another, and as they were the participants were
asked to note any changes they felt in the spatial relationship between the chairs as if they
were seated in the chairs. As changes in feelings were noted, distances between the chairs
were measured. This type of spatial measurement was also performed using full-scale
lounge chairs. Participants were asked to sit in a lounge chair, and each of the two lounge
chairs were gradually moved closer to one another. The participants were asked to note
when a change in spatial relationship was felt. When the change was noted, the distance
between the two chairs was measured. Three different orientations of the chairs were
used. One orientation had the chairs facing each other, one had them at right angles to
each other, and the third orientation had them side-by-side, facing the same direction. The

52
participants used in De Long's (1977) study were considered to be "spatially-naïve." The
participants were considered to have not had any special training or education in any type
of design profession.
The results of De Long's (1977) study showed a remarkable consistency of spatial
perception between full-scale environments and scale-model environments. "The
deviations in distance setting in scale and full-size vary no more than repeated trials in full-
size. The results which show an average difference of 6% are even more remarkable when
volumetric and informational reduction involved in moving from full-size to 1/12 size
[model] environments is considered" (De Long, 1977, p. 58). De Long (1977) goes on
further to suggest that "human beings [may] encode certain spatial relationships
independently of scale" (p. 58). De Long (1977) emphasizes that "when working in scale
with informants…they must be instructed to respond in terms of how they feel. If they are
informed to 'think' carefully, to be as 'accurate' as possible or to 'rationalize' what they
experience, responses deviate far beyond the constant factor of 6-7% identified in this
study" (p. 57).
Lau (1970) studied the differences between full-scale and scale-model rooms to
evaluate the perception of lighting quality. Lau (1970) was interested in the perception of
pleasantness or gloominess of a room in relation to lighting quality. Lau (1970) states:
"…in the investigation of lighting quality, and indeed in lighting design when the
qualitative aspects are to be appraised, there is a general preference for reduced scale
physical models, because of convenience and ease of manipulation" (p. 43).
In Lau's (1970) study, subjects were asked to assess the different lighting
arrangements for a single bedroom with study area. The lighting in the full-scale room was
created by placing a fixture at the center of the room or at the side of the room and used
either a 100W lamp or a 40W lamp. The scale-model used similar lighting fixtures that
replicated the luminous distribution of the full-scale-model. Care was taken to prevent
light from the room the models were viewed within from entering the model by using
viewing apertures and placing the models at a standard height for viewing. The
independent variables for the study consisted of: the mounting position of the light-source,
the type of lighting fixture, and the luminous flux output. The dependent variable

53
was the pleasant or gloomy quality of the lighting.
In Lau's (1970) experiment it was apparent in either viewing condition that "…as
the illumination increases, the room becomes more 'pleasant', but beyond a certain point,
further increases in illumination result in decreases of 'pleasantness'….and for the
assessment of gloom, there is a direct relationship with the level of illumination" (p. 44).
Lau's study (1970) did indicate that subjects agreed on the pleasant or gloomy quality of
lighting of the scale-model more so than they agreed on the pleasant or gloomy quality of
lighting in the full-scale room. Overall, there was consistency on what was considered
pleasant or gloomy according to the lighting arrangements in either the scale-model or
full-scale condition.
Simulation methods have been used successfully to study personal space behavior
in both scale-model and full-scale environments. DeLong (1977) used scale-models to
evaluate personal space as affected by furniture, as well as compare scale-model results
with full-scale results. Baum and Davis (1976) used scale-models appropriately to analyze
the effect of visual complexity and perception of crowding upon individuals. Simulation
methods have also been used successfully to examine lighting quality impressions. Lau
(1970) used scale-models to record impressions of lighting characteristics compared to
full-scale models, finding very similar results between the two models. Therefore, it is
reasonable to claim that accurate data can be collected on personal space behavior as
influenced by manipulations of illumination level changes in a scale-model environment.
Rationale
Research on personal space behavior has focused on many aspects that affect
human spatial behavior, such as cultural, social, and personality influences. People from
different cultures may have different interaction distances. For instance, people from
Mediterranean cultures converse at closer distances than do Americans. In public spaces,
social influences may affect the way people behave. If someone does not wish to interact
with others, he or she may not make eye-contact, and keep a stiff posture. Also, studies
have shown that friends keep closer distances than do acquaintances or strangers. Because

54
of personal experiences or personality characteristics, individuals may also exhibit unique
spatial behavior (Altman, 1975). Males and females also exhibit different spatial zones.
Generally, mixed sex pairs exhibit closer distances than do same sex heterosexual pairs
(Altman, 1975). The distances that individuals maintain is also influenced by the
environmental setting and the arrangement of space.
Research on personal space behavior has examined the effect of seating
arrangement selection. Sommer's (1969) research demonstrated that people who wish to
engage in causal conversation tend to choose corner-to-corner or face-to-face seating
arrangements. People desiring to interact or participate in an activity together where
sharing is involved tend to choose side-to-side seating arrangements. In contrast, people
that do not wish to interact tend to choose catty-corner seating arrangements (Sommer,
1969).
The color of finishes within a space has also been examined for its effect on
perception of personal space and crowding. Generally, light-colored spaces tend to be
perceived to be less crowded than do darker-colored spaces (Baum & Davis, 1976). The
idea of perceived light or perceived dark-color is related to the same perception of
perceived brightness or perceived gloominess of a space due its lighting. Depending on
how a space is illuminated, it may be perceived differently. Spaces that are evenly
illuminated on either the walls, ceiling or floor tend to be perceived as larger, where as
spaces that have high contrasts in illumination are perceived to be smaller (IESNA, 1995).
Although research has been conducted to study the effect of illumination changes
on personal space requirements, little research has been conducted to examine the effect of
illumination level change on personal space behavior in a particular environment/ behavior
setting. Flynn, Spencer, Martyniuk, and Henrick's (1973) study involving light distribution
changes and its effect on behavior, did indicate that lighting does play some role in human
spatial behavior. However, this study did not attempt to keep room dimensions the same
under two testing conditions.
To the author's knowledge, no study, to date, has taken into account that personal
space behavior may be affected by illumination level changes in a public space such as a

55
waiting/reception area. Partly, this is due to the fact that it is very difficult to control
extraneous variables that could affect personal space behavior in a real-world setting. It is
also difficult to locate a real-world setting in which the users of the space would allow the
researcher to manipulate lighting fixtures and lighting levels without causing disruption.
To control for extraneous variables and facilitate the manipulation of illumination changes,
simulation methods may be used to conduct the research at hand. Research on proxemic
zones and simulation as a means to collect data has been performed. Results of this data
conclude that data collected in either scale-model environments or full-scale environments
is remarkably consistent (De Long 1977).
The proposed study is designed to investigate the effect of low and bright
illumination levels on proxemic zones within waiting/reception area settings simulated in a
scale-model environment. The scale-model environment will follow the design
recommendations for both the design of waiting/reception areas and the lighting design of
waiting/reception areas.
Research Question
This study will examine the potential effect of bright versus dim illumination level
on personal space requirements, specifically the intimate, personal, and social proxemic
distances defined by Hall (1966) in simulated waiting/reception areas. Is there a difference
in proxemic distances due to light level in a simulated hotel lobby waiting area, a simulated
physician's office waiting area, and a service-oriented waiting area?
Hypotheses
H10: In a simulated hotel lobby waiting/reception area, there is no difference in
proxemic distances between bright and dim lighting conditions.
H20: In a simulated physician's office waiting/reception area, there is no difference in
proxemic distances between bright and dim lighting conditions.
H30: In a simulated service-oriented waiting/reception area, there is no difference in
proxemic distances between bright and dim lighting conditions.

56
Operalization of Variables
The following variables have been identified as independent variables: illumination
level and environmental/behavioral setting of a waiting/reception area. There are two
levels to the illumination level variable: bright lighting level and dim lighting level. These
two conditions will be simulated following IESNA recommendations for creating
perceived bright illumination conditions and perceived dim illumination conditions. There
are three levels to the variable of setting, a hotel lobby waiting/reception area, a physician's
office waiting/reception area, and a service-oriented waiting/reception area. The furniture
layout of these typical waiting/reception areas will follow design guidelines recommended
by Deasy and Lasswell (1985) and De Chiara, Panero, and Zelnick (1991).
The following dependent variable has been identified: space, the proxemic distance
between people. This distance is defined by Hall's (1966) description of proxemic zones.
The intimate distance close phase is 0"-6" and far phase is 6"-18". The personal distance
close phase is 18"-30" and far phase is 30"-48". The social distance close phase is 4'-0"-7'-
0" and far phase is 7'-0"-12'-0". The public distance close phase is 12'-0" - 25'-0" and far
phase is 25'-0" and beyond. For the purposes of this study, attention will focus on the
close and far phases of the intimate, personal, and social zones as well as the close phase
of the public zone.
Significance of the Study
Interior designers and designers in related fields understand that environmental
factors influence behavior, but it is unclear how lighting has an impact on human spatial
behavior. Research on how illumination levels may have an effect on proxemic behavior in
a social environmental setting such as a waiting/reception area will be a part of the
understanding of light's effect on human behavior. The findings of this study may indicate
what light levels and light distribution patterns cue users of a space where to sit. Designers
can take this information to better integrate lighting design and furniture space planning so
that waiting areas can be designed more efficiently and effectively for users.

57
II. Methodology
The research question asks if there a difference in proxemic distances between
bright or dim illumination level in simulated waiting/reception areas. To investigate this
question, it is necessary to understand Michelson's (1976) Intersystems Congruence
Model (ICM) for how cultural, social, personality and built-environment systems interact
to limit or promote human behavior, particularly human spatial behavior. The dependent
variable of the ICM is space. For the research at hand, the variable of space is defined as
the intimate, personal, social, and public proxemic distances described by Hall (1966). It is
also necessary to understand the design guidelines for the type of behavioral setting
chosen for this research. Deasy and Lasswell (1985) recommend several considerations for
the furniture arrangement and types of seating to be used in waiting areas. The IESNA
(1995) also recommend several guidelines to follow for the lighting design of waiting/
reception areas. In this study, the design of the scale-models used for simulating
waiting/reception areas followed these design recommendations.
Simulation methods were chosen to collect data in this study so that several
extraneous variables could be controlled. These extraneous variables included color,
temperature, texture, behavioral setting, and cultural background of participants. Three
types of waiting/reception areas were chosen to evaluate proxemic behavior so that
comparisons between the waiting areas could be made. The simulation method chosen for
the research included gathering volunteers to participate in the research and asking them
to interact with scale-models of brightly or dimly illuminated waiting/reception area
environments. Participants viewed the models, were instructed to place scale-figures in the
models, were given both quantitative and qualitative questionnaires, and their interaction
with the models was video and audio recorded.
Sample
Subjects for this study were volunteers from the faculty and staff at a large
university located in southwest Virginia. Volunteers were obtained from sending a campus
wide e-mail requesting their participation in this study (see Appendix A). Faculty

58
and staff were chosen as the population for this sample because they were expected to
have more experiences in waiting areas, such as hotels and physician's offices. This differs
from previous studies (Baum and Davis, 1976; Adams and Zuckerman, 1991) where
students were used as the subjects. As Hall (1966) stated, cultural influences do affect
proxemic behavior. For the purposes of this study, only subjects who had lived in the
United States for at least seven years were included.
Measures and Procedures
In order to examine the effect of illumination level on proxemic zones, subjects
were asked to consider scale-models of waiting/reception areas. The procedures used in
this study followed Baum and Davis (1976), with some exceptions. Subjects were tested
individually, and each subject worked with all the models presented to them. Six models
were presented to the subjects; a brightly illuminated condition and a dimly illuminated
condition of a hotel lobby scenario, a brightly illuminated condition and a dimly
illuminated condition of a physician's office scenario, and a brightly illuminated condition
and a dimly illuminated condition of a service-oriented waiting area scenario. The order in
which the subjects viewed the models was randomized, and the subject worked with one
model at a time. Each subject was asked to place three scale-figures inside of each model
as if each figure was a person entering the space to choose a place to sit. One scale-figure,
representing a stranger seated, was already placed in each scale-model. The location of
this "antecedent" figure was determined through the pilot study.
Upon entering the laboratory, a subject was told that he or she was participating in
a study regarding environmental perception. He or she was asked to read and sign an
informed consent form for research using human subjects (see Appendix B). At that time,
the subject was told the session would be video and audio taped, but only the gestures and
movements of the subject's hands would be video taped. The purpose of the video and
audio tapes was to allow for qualitative analysis of the subject's interaction with the
models to be performed.
When explanations were completed and any questions answered, the subject was
placed in front of a randomly assigned model. He or she was asked to pick up the first of

59
three figures placed on top of the model and told to pretend the figure was himself or
herself walking into the space for the first time to wait approximately fifteen minutes. The
subject was then told to choose a place to sit. Once this task was completed, the subject
was informed that the person was no longer himself or herself, but a stranger. The subject
was instructed to pick up the second figure, pretend it was him or herself, and choose a
place to sit, and all other people sitting in the waiting area were strangers. Once this task
was completed, the subject was informed again that the figure was no longer him or
herself, but a stranger. Then, the subject was instructed to pick up the third figure, pretend
it was him or herself, and choose a place to sit, and all other people sitting in the waiting
area were strangers. Each time the subject was instructed to choose a place to sit, he or
she was told the waiting time would be approximately fifteen minutes. This script for
instructing the subject to place figures in a model was followed for each of the six models
(see Appendix C).
Each time a subject completed placing the three scale-figures in a model, the
subject was asked to fill out a short semantic differential questionnaire (see Appendix D)
located on a clipboard beside the model. The purpose of this short questionnaire was to
obtain data concerning the subject's perception of the space the model represented. This
questionnaire was prepared following the semantic differential format used by Lau (1970).
At the completion of the experiment, there were six semantic differential questionnaires,
one per each model.
After completing the interaction with the six models and answering the six short
semantic differential questionnaires, one last open-ended questionnaire (see Appendix E)
was given for further qualitative analysis. Demographic information with respect to the
subjects' background was also obtained (see Appendix F). After each subject completed
these tasks, a full explanation of the study was given, and the subject was dismissed.
At that time, the experimenter measured the distance between the scale-figures
placed in the model. The placement and noted distances of the scale-figures was
transposed onto an in-scale drawing of each model. These drawings serve as a permanent
record of scale-figure placement. See Appendix G for a typical example of this record.

60
Description of Models
The six scale-models and all furnishings were built in 1"=1'-0" scale, the same
model size as used by De Long (1976). The lighting of these models was limited by the
types of light sources available to illuminate scale-models. This study attempted only to
create a contrast in bright versus dim lighting condition, and not simulate the color and
type of light source found in real-life situations. The light source used in each model for
this study was a 12" undercounter fluorescent fixture with a T-5, 8 watt cool-white
fluorescent lamp. The furniture arrangement remained the same between lighting
conditions in each scenario. To control for any effect of color on spatial behavior, all
models were constructed of white foam core, white matte-board, and any other materials
used were painted white. (Baum & Davis, 1976).
The hotel lobby waiting/reception area models represent a space that is 30'-6" wide
by 27'-6" deep. With a combination of three-seat sofas, two-seat sofas, and lounge chairs,
this waiting area accommodates fourteen individuals. The reception desk is included in the
waiting area space and openings were created that would lead into adjacent hallways and
elevator bays. This floorplan was adapted from the Williamsburg Lodge lobby which
represents a typical average sized hotel lobby space based upon a literature search of
typical hotel lobby plans (Janjigian, 1995) (see Figure 17.) The lighting plan of the hotel
models remained the same between the bright and dim conditions. Differences in the light
emitted into each model was created by using different diffusers. See Figure 18 for the
footcandle readings for the bright and dim lighting conditions. See Figure 19 for a
photographs of the each of the hotel lobby lighting conditions.
The physician's office waiting/reception area models represent a space that is 21'-
0" wide by 23'-0" deep. With a combination of two-seat sofas and arm chairs, this waiting
area accommodates twenty individuals. The receptionist can be approached through a
window looking into the receptionist station, and an adjacent doorway would lead to the
physician's office. This floorplan was adapted from a typical waiting area in a medical
office (Malkin, 1982) (see Figure 20). The lighting plan of the physician's waiting/
reception area models remained the same between the bright and dim lighting conditions.

61
FLOORPLAN
LIGHTING PLAN
Figure 17. Floorplan of model representing a typical hotel lobby waiting area, adapted
from Janjigian (1995). Drawing not to scale.
Entrance Entrance
FLOORPLAN
LIGHTING PLAN

62
Figure 18. Floorplans of hotel waiting/reception lobby with footcandle readings noted.
Each number represents the footcandle reading taken at that particular location in the
model. Drawing not to scale.
Bright lighting condition
Dim lighting condition

63
Figure 19. Photographs of hotel waiting/reception area scenarios. (Photographed by
author).
Hotel Lobby Waiting/Reception Area - Bright Condition
Hotel Lobby Waiting/Reception Area - Dim Condition

64
FLOORPLAN
LIGHTING PLAN
Figure 20. Floorplan of model representing a typical physician's office waiting/reception
area, adapted from Malkin (1982). Drawing not to scale.
FLOORPLAN
LIGHTING PLAN
Entrance

65
Differences in the light emitted into each model was created by using different diffusers.
See Figure 21 for the footcandle readings for the bright and dim conditions. See Figure 22
for a photograph of the each of the physician's waiting/reception area lighting conditions.
The service-oriented waiting area models represent a space that is 26'-0" wide by
20'-0" deep. This waiting area accommodates up to sixteen individuals. The customer
service/receptionist desk is part of the waiting area. The design of this waiting area is
adapted from a typical waiting area layout (Malkin, 1982) (see Figure 23). The lighting
plan of the customer service waiting/reception area models remained the same between the
bright and dim conditions. Differences in the light emitted into each model were created by
using different diffusers. See Figure 24 for the footcandle readings for each of the bright
and dim conditions. See Figure 25 for a photograph of the each of the customer service
waiting/reception area lighting conditions.
The laboratory where this experiment was conducted was set up with six drafting
tables set at 37" above finished floor. A scale-model was placed on top of each table.
Castered, adjustable task chairs were placed in front of each model. When the subject sat
at in the chair, his or her eyes were eye level with the interior of each model. Figure 26
depicts the layout of the lab.
Pilot Testing and Analysis
A pilot test using the scale-models and questionnaire was performed with faculty
and staff representing the sample for this study before being administered to the actual
subjects. The pilot test aided the researcher in adjusting the video camera and the wording
of the script for the employment of the actual experiment. The pilot test determined the
location of the antecedent figure within each waiting/reception area scenario. The
determination for this location was based upon the pattern of placement established by the
subjects' location of the first scale-figure. The placement of the antecedent figure was the
same between bright and dim lighting conditions for each scenario. The pilot study also
determined how many subjects were needed for the full experiment. It was decided that
sixty subjects would be needed for the completion of the experiment.

66
Figure 21. Floorplans of physician's office waiting/reception area with footcandle readings
noted. Each number represents the footcandle reading taken at that particular location in
the model. Drawing not to scale.
Bright lighting condition
Dim lighting condition

67
Figure 22. Photographs of physician's office waiting/reception area scenarios.
(Photographed by author).
Physician's Office Waiting/Reception Area - Bright Condition
Physician's Office Waiting/Reception Area - Dim Condition

68
Figure 23. Floorplan of model representing a typical service-oriented waiting area,
adapted from Malkin (1982). Drawing not to scale.
FLOORPLAN
LIGHTING PLAN
Entrance
Table Table

69
Figure 24. Floorplans of service-oriented waiting/reception area with footcandle readings
noted. Each number represents the footcandle reading taken at that particular location in
the model. Drawing not to scale.
Bright lighting condition
Dim lighting condition

70
Figure 25. Photographs of service-oriented waiting/reception area scenarios.
(Photographed by author).
Service Waiting/Reception Area - Bright Condition
Service Waiting/Reception Area - Dim Condition

71
VIDEO CAMERA
Figure 26. Schematic layout of laboratory space where experiment was performed.
Drawing not to scale.

72
This study was designed to use a two-factor mixed model experiment in a
randomized complete block design where the subject equals the block. A contingency
table analysis was to be performed that would analyze the number of subjects placed
within the three proxemic zones in question (intimate, personal, and social zones) and the
two lighting level conditions (bright and dim). The basic design of the experiment is shown
in Table 1.
In addition to the contingency table analysis, composite maps of the placement of
figures in the bright and dim illumination conditions for each of the three scenarios was to
be prepared to evaluate seating preference differences and proxemic differences under the
two lighting conditions. Content analysis of the video and audio tapes of the subjects
working with models was also to be performed after all subjects had completed the
experiment. The content analysis looked for common movements of how scale-figures
were placed in the models. Common movements and dialogue were coded to better
comprehend the data (Kincade, 1997). The qualitative analysis was performed to give a
richer understanding of the quantitative analysis of the proxemics demonstrated in the
models.

73
Table 1
Two factor mixed model experiment in a randomized complete block design
Seating ArrangementHotel Lobby Physician's Office Service-Oriented
Lighting Condition A B CBright Ab1
Ab2
Ab3
Bb1
Bb2
Bb3
Cb1
Cb2
Cb3
Dim Ad1
Ad2
Ad3
Bd1
Bd2
Bd3
Cd1
Cd2
Cd3
Note. Subscript numbers represent the following: 1 = intimate zone (0"-18"), 2 = personal
zone (18" - 4'-0"), 3 = social zone (4'-0" - 7'-0").


![CHAPTER TWO REVIEW OF RELATED LITERATURE 2.1 …studentsrepo.um.edu.my/3306/5/CHAPTER-2[3].pdf18 CHAPTER TWO REVIEW OF RELATED LITERATURE 2.1 Introduction 2.2 Theory on related literature](https://static.fdocuments.us/doc/165x107/5eb4d92be7038907b0585082/chapter-two-review-of-related-literature-21-3pdf-18-chapter-two-review-of-related.jpg)


