
Reinventing the City: Three Prerequisites for
12
REINVENTING THE CITY THREE PREREQUISITES FOR GREENING URBAN INFRASTRUCTURES REPORT
Transcript of Reinventing the City: Three Prerequisites for

REINVENTING THE CITYTHREE PREREQUISITES FOR GREENING URBAN INFRASTRUCTURES
WWF_Low_Carbon_Cities.FINAL.4.indd 1 4/27/10 6:33 PM
REINVENTING THE CITYTHREE PREREQUISITES FOR GREENING URBAN INFRASTRUCTURES
WWF_Low_Carbon_Cities.FINAL.4.indd 1 4/27/10 6:33 PM
REPORT

1
Executive Summary
OUR CITIES HOLD THE KEY TO GLOBAL ECOLOGICAL SUSTAINABILITY. They are the source of more than 70 per cent of carbon dioxide emissions, and depending on how we develop and manage our urban infrastructures during the next three decades, they could become either a force for environmental destruction or a primary source of ecological rejuvenation.
To achieve the latter result, the US$350 trillion to be spent on urban infrastructure and usage over the next 30 years will have to be directed towards low to zero carbon emissions, partic-ularly in the world’s small but fastest-growing cities and developing nations, where the largest impacts can be made. There are three prerequisites for this effort:
• Cities must adopt aggressive energy reduction goals and best-practice approaches to urban planning.
• Innovative financing strategies are needed to provide $20 trillion to $30 trillion in funding for additional up-front capital costs, with developed nations working together to assist developing nations in their low-carbon urban infrastructure initiatives.
• The latest technological advances must be utilized to support and enable the planning, construction, and usage of urban infrastructure in all cities.
If the will can be mustered to aggressively pursue urban sustain ability, and these three prerequisites can be put into place, forward-thinking and aspiring urban leaders can generate urgently needed reductions in global emissions, produce attractive economic returns by transforming their cities into centres for ecological innovation, and enhance their energy security.
The Urban ChallengeOur cities play a vital role in the quest to achieve global ecological sustainability. They are the largest contribu-tors to greenhouse gases and climate change. Howev-er, if we can achieve sustainable construction and use of urban infrastructure, our cities could become a criti-cal leverage point in global efforts to drastically reduce emissions and avoid the social and economic costs associated with climate change, as well as enhance energy security and resilience in the face of high fossil energy prices.
The world’s urban centres already account for more than 70 per cent of CO2 emissions.1 In the next three decades, the global population will continue to grow and become ever more urban. Booz & Company analysis conducted for this report shows that under business-as-usual (BAU) assumptions, $350 trillion will be spent on urban infrastructure and usage during this period. This huge expenditure either can cause the ecological impact of our cities to become even more
pronounced or can be a tremendous opportunity to reduce that impact.
To meet the urban challenge, cities around the world—in developed and developing nations—need to tackle climate change directly. Cities in developed nations can apply new technologies to mitigate greenhouse gas emissions stemming from the usage of their exist-ing infrastructure. They can invest in mobility manage-ment and incentivize sustainable lifestyle choices. Cities in developing nations can adopt best practices in urban planning and mobility management, as well as technological advances, to design sustainability into their new infrastructure. Every city is part of the solu-tion—now is the time to act!
Business as Usual Is a Prescription for FailureIf our cities don’t act, it is likely that the opportunity to control global warming will be lost and costs will continue to spiral out of control. There is a growing consensus that the average global temperature
WWF_Low_Carbon_Cities.FINAL.4.indd 1 4/27/10 6:33 PM
2
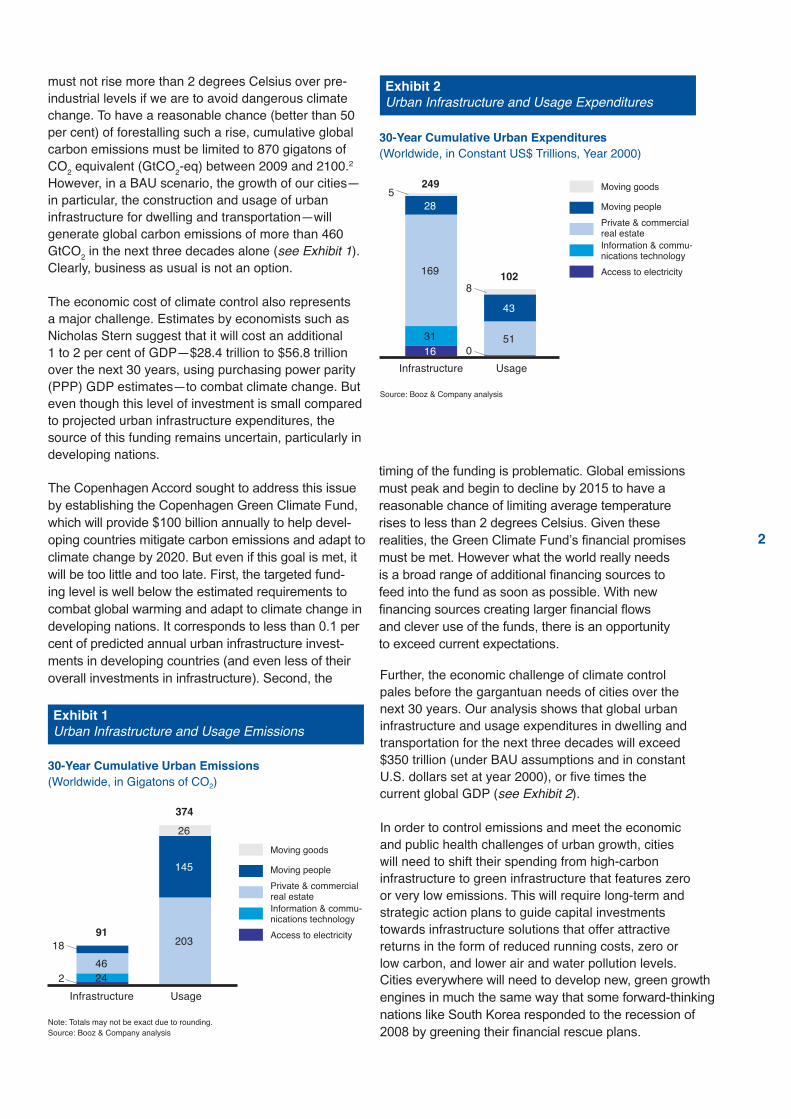
must not rise more than 2 degrees Celsius over pre-industrial levels if we are to avoid dangerous climate change. To have a reasonable chance (better than 50 per cent) of forestalling such a rise, cumulative global carbon emissions must be limited to 870 gigatons of CO2 equivalent (GtCO2-eq) between 2009 and 2100.2 However, in a BAU scenario, the growth of our cities—in particular, the construction and usage of urban infrastructure for dwelling and transportation—will generate global carbon emissions of more than 460 GtCO2 in the next three decades alone (see Exhibit 1). Clearly, business as usual is not an option.
The economic cost of climate control also represents a major challenge. Estimates by economists such as Nicholas Stern suggest that it will cost an additional 1 to 2 per cent of GDP—$28.4 trillion to $56.8 trillion over the next 30 years, using purchasing power parity (PPP) GDP estimates—to combat climate change. But even though this level of investment is small compared to projected urban infrastructure expenditures, the source of this funding remains uncertain, particularly in developing nations.
The Copenhagen Accord sought to address this issue by establishing the Copenhagen Green Climate Fund, which will provide $100 billion annually to help devel-oping countries mitigate carbon emissions by 2020. But it may be too little and too late. First, the targeted funding level is well below the estimated requirements to combat global warming and adapt to climate change in developing nations. It corresponds to less than 0.1 per cent of predicted annual urban infrastructure in-vestments in developing countries (and even less of their overall investments in infrastructure). Second, the
Exhibit 1Urban Infrastructure and Usage Emissions
30-Year Cumulative Urban Emissions(Worldwide, in Gigatons of CO2)
Note: Totals may not be exact due to rounding. Source: Booz & Company analysis
46
203
145
26
24
Moving goods
Moving peoplePrivate & commercial real estateInformation & commu- nications technologyAccess to electricity
Infrastructure Usage
9118
2
374
timing of the funding is problematic. Global emissions must peak and begin to decline by 2015 to have a rea-sonable chance of limiting average temperature rises to less than 2 degrees Celsius. Given these realities, the Copenhagen Accord’s financial promises are best used as seed capital for a stronger mechanism capa-ble of producing a broad range of additional financing sources as soon as possible. In fact, a new high-level panel on climate finance, also established through the Copenhagen Accord, has been assigned the very im-portant task of identifying financing sources that world governments can agree on.
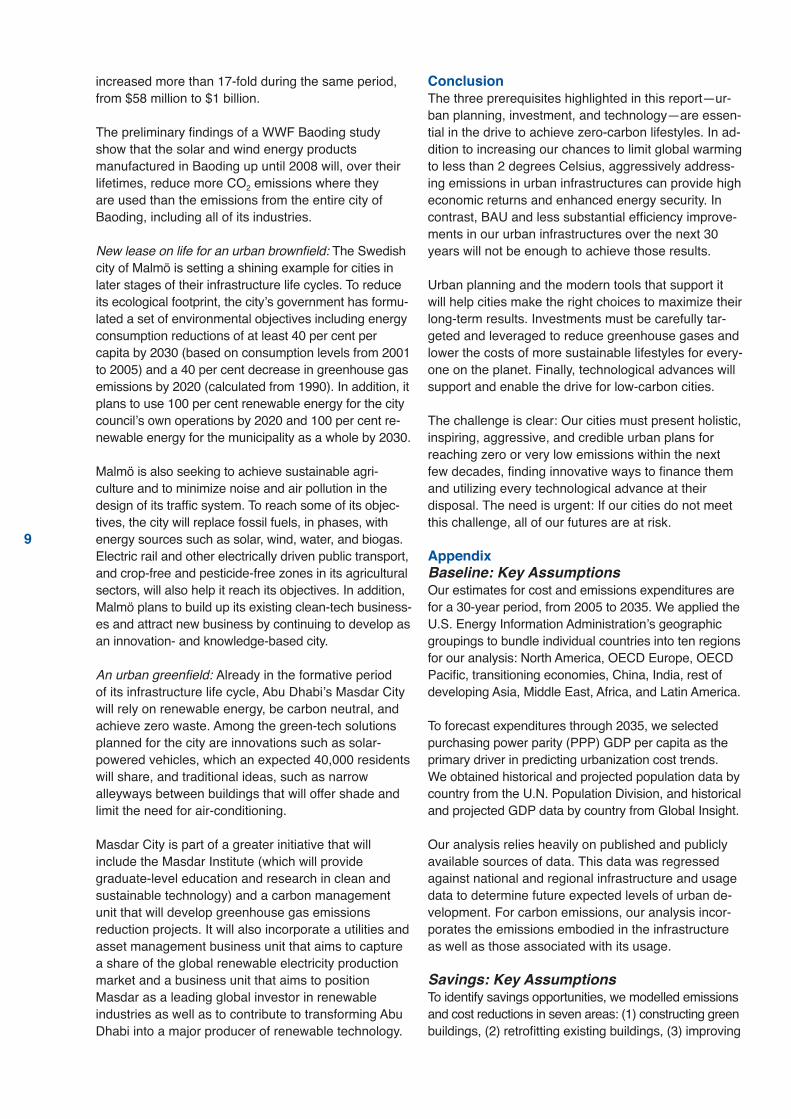
Further, the economic challenge of climate control pales before the gargantuan needs of cities over the next 30 years. Our analysis shows that global urban infrastructure and usage expenditures in dwelling and transportation for the next three decades will exceed $350 trillion (under BAU assumptions and in constant U.S. dollars set at year 2000), or five times the current global GDP (see Exhibit 2).
In order to control emissions and meet the economic and public health challenges of urban growth, cities will need to shift their spending from high-carbon infrastructure to green infrastructure that features zero or very low emissions. This will require long-term and strategic action plans to guide capital investments towards infrastructure solutions that offer attractive returns in the form of reduced running costs, zero or low carbon, and lower air and water pollution levels. Cities everywhere will need to develop new, green growth engines in much the same way that some forward-thinking nations responded to the recession of 2008 by greening their financial rescue plans.
51
30-Year Cumulative Urban Expenditures(Worldwide, in Constant US$ Trillions, Year 2000)
Source: Booz & Company analysis
Infrastructure Usage
31
285
249
43
102
0
8
16
169
Exhibit 2Urban Infrastructure and Usage Expenditures
Moving goods
Moving peoplePrivate & commercial real estateInformation & commu- nications technologyAccess to electricity
WWF_Low_Carbon_Cities.FINAL.4.indd 2 4/27/10 6:33 PM
The Copenhagen Accord sought to address this issue by establishing the Copenhagen Green Climate Fund, which will provide $100 billion annually to help devel- oping countries mitigate carbon emissions and adapt to climate change by 2020. But even if this goal is met, it will be too little and too late. First, the targeted fund-ing level is well below the estimated requirements to combat global warming and adapt to climate change in developing nations. It corresponds to less than 0.1 per cent of predicted annual urban infrastructure invest-ments in developing countries (and even less of their overall investments in infrastructure). Second, the
timing of the funding is problematic. Global emissions must peak and begin to decline by 2015 to have a reasonable chance of limiting average temperature rises to less than 2 degrees Celsius. Given these realities, the Green Climate Fund’s financial promises must be met. However what the world really needs is a broad range of additional financing sources to feed into the fund as soon as possible. With new financing sources creating larger financial flows and clever use of the funds, there is an opportunity to exceed current expectations.
Cities everywhere will need to develop new, green growth engines in much the same way that some forward-thinking nations like South Korea responded to the recession of 2008 by greening their financial rescue plans.

3
Urbanization TrendsThe challenge of urban sustainability will grow larger with time, and counterintuitively it will focus on smaller cities and developing nations. The world’s population is moving inexorably towards the 9 billion mark, and more and more people are aspiring to and achieving developed-economy lifestyles. The ecological footprint created by these two trends is currently distributed unevenly among regions. For example, the ecological footprint of the average Tanzanian or Indian is approximately a quarter of the ecological footprint of a European and a ninth of that of an American. Nevertheless, if the trend continues and the expected growth in carbon emissions is generated, humanity will need the equivalent of two planets to maintain those lifestyles by the 2030s3 (see Exhibit 3).
Most of this growth will be in our cities. Cities are already the source of more than 70 per cent of global CO2 emissions, and they will account for an ever-higher percentage in the coming years, as more and more people reside in and move to cities in search of more prosperous lifestyles (see Exhibit 4).
Green urban investment can be used to turn this trend by promoting attractive “one-planet” lifestyles on a large scale. Typically, a city’s absolute carbon footprint—including imports of emissions—increases as it develops and its citizens become wealthier. (On average, as nations become wealthier, their carbon footprints increase by 57 per cent for each doubling of consumption levels.4) If we are to avoid an average
temperature increase of 2 degrees Celsius or greater, this historical reality must be altered.
Focusing on Small CitiesThe bulk of urban population growth will not occur in well-known and mature megacities like Beijing, London, Los Angeles, Mexico City, and Mumbai. Instead, it will occur in smaller cities (fewer than 1 million), which already account for more than 60 per cent of urban dwellers globally5 (see Exhibit 5). For example, the population of Gaborone, the capital of Botswana, rose from 17,700 in 1971 to more than 186,000 in 2007. By 2020, its population is expected to exceed 500,000.6
Built-up land
Fishing ground
Forest
Grazing land
Cropland
Carbon footprint
Ecological Footprint by Component(In Increments of Planetary Capacity)
Source: WWF International Living Planet Report 2008; Booz & Company analysis
1.41.21.00.80.60.40.2
01961 05
Num
ber o
f Pla
net E
arth
s
World biocapacity
Exhibit 3Growth of the Ecological Footprint (1961–2005)
Exhibit 4Our Cities Continue to Grow (1980–2050)
Rural 0.82% -0.44%
Urban 2.53% 1.60%
1980–2005CAGR
2005–2050CAGR
World Population (1980–2005 Historical, 2005–2050 Forecast)
1980 1990 2000 2010 2020 2030 2040 2050
1086420
Historical Forecast
Popu
latio
n (B
illion
s)Urbanization by Region (1980–2005 Historical, 2005–2050 Forecast)
North America 0.39% 0.26%
OECD Europe 0.27% 0.33%
OECD Pacific 0.64% 0.36%
China 2.89% 1.31%
India 0.87% 1.46%
ROW 0.86% 0.65%
1980–2005CAGR
2005–2050CAGR
1980 1990 2000 2010 2020 2030 2040 2050
10080604020
0
Historical Forecast
% U
rban
Source: U.N. Population Division; Booz & Company
1970 1980 1990 2000
WWF_Low_Carbon_Cities.FINAL.4.indd 3 4/27/10 6:33 PM

4
As the world’s smaller cities mature, they generally follow predictable patterns in the mix of expenditures and emissions related to infrastructure development and usage (see Exhibit 6). During the early stages of city development, the bulk of expenditures and emissions stems from construction of buildings, public transportation, and utility infrastructure, such as energy and water. As the maturation process continues, ongoing energy usage increases as the city grows in extent (and, not entirely coincidentally, in wealth) until the bulk of expenditures and emissions
comes from the use of existing infrastructure. Hence, it is during the formative period of a city’s life that opportunities to dramatically impact long- term infrastructure expenditures and emissions are greatest.
The fact that growth is occurring fastest in small cities that are still in the process of developing their infrastructure creates a valuable opportunity to decouple the global urban future from expensive, high-carbon lifestyles. But it also represents a major challenge: Smaller cities typically have fewer resources available to support infrastructure planning and address climate change. In a global survey, conducted by Booz & Company and WWF, of the measures being adopted by cities to address climate change, only one of three smaller cities had developed even a preliminary strategy for managing climate change, compared to more than 50 per cent of larger cities.7
Focusing on Developing NationsEnergy usage in residential and commercial buildings in some industrial regions, such as North America and the Pacific members of the Organisation for Economic Co-operation and Development (OECD), will be relatively high compared to investments over the next three decades. But investments in developing economies will be high overall compared to usage. This suggests that there is a window of opportunity to drive down emissions and expenditures in a cost-
Exhibit 5Urban Population Growth
Exhibit 6The Infrastructure Life Cycle of Cities
Urban Population Growth Rates by City Size (2009–2025)
Source: “Demographia World Urban Areas & Population Projections” (www.demographia.com/db-worldua2015.pdf); Booz & Company analysis
<1.0 million
1.0–2.5 million
2.5–5.0 million
5.0–10.0 million
>10.0 million
4.19%
1.98%1.56% 1.37% 1.16%
Typical City Expenditures and Emissions Trajectory
Initial City Growth(Formative Period) • Infrastructure
build-out• Low energy
consumption intensity
Increasing City Wealth• Incremental infrastructure
to keep up with growth• Increasing energy
consumption intensity with rising wealth & population
City Maturation• City saturation requires
little additional new build• Consumption high,
but leveling off
Expe
nditu
res
($)
Time
Usage
Infrastructure
Types of Expenditures• Power grid• Road infrastructure• Mass transit system• Buildings
• Incremental road network• Private vehicles• Basic household necessities• Power generation to
keep up with demand• Buildings
• Additional household appliances• Commuter travel• Goods & services
Source: John E. Fernandez, “Resource Consumption of New Urban Construction in China,” Journal of Industrial Ecology, Vol. 11, No. 2; Booz & Company analysis
WWF_Low_Carbon_Cities.FINAL.4.indd 4 4/27/10 6:33 PM

5
efficient way over the long term in the developing world (see Exhibit 7).
These infrastructure outlays will mainly be driven by the growth of urban populations in the developing nations of Asia and Africa, where an additional 1.7 billion people are expected to make cities their home over the next 30 years (see Exhibit 8).
Given the rate of urban growth in developing nations and the early stage of their infrastructure development efforts, it is clear that they can offer the highest returns in the quest for urban sustainability, even if they are currently less equipped to deal with the challenge. And given the outsized energy usage of cities in developed nations, it is also clear that developing nations should not adopt their inadequate transportation systems and energy-wasting house and building stock as a norm. Instead, developing nations must be supported in a drive to minimize energy use and undertake a shift to renewable energy sources that will enable low-carbon lifestyles for city dwellers.
The first step in such an effort should be long-term, strategic-level, low-carbon action plans, supported by a holistic national urban planning approach that enables the integration of large mainstream investment flows rather than a project-by-project approach on the sidelines of core development strategies and decisions. It will also require capacity building for policy making and financial
instruments to assist the cities in developing nations with the up-front investments needed to create and undertake low-carbon initiatives. Such support should be an impor-tant part of any global climate negotiation outcome.
The Planning Prerequisite A city’s energy intensity per capita tends to decrease as it matures. This decrease occurs due to a shift in the mix of industries from energy-intensive manufacturing to the lower energy requirements of service industries. It can also occur because of the natural responses to high population density.
The most obvious example of the positive role of urban density is transportation, one of the major components of energy and emissions intensity. For example, in Toronto, transportation emissions per capita are almost four times higher in low-density areas than in high-density areas (see Exhibit 9). Cities with high densities tend to have better-developed public transportation infrastructures and lower transportation emissions. They restrict car use and limit parking spaces, they make cycling and walking at-tractive, and they provide easy access to public transpor-tation. In short, they plan for more effective transportation.
The effect of urban planning on emissions is best illus-trated by comparing U.S. and European transportation emissions. Since the 1950s, a period during which the U.S. experienced a high urbanization rate, most cities
Source: Booz & Company analysis
North A
merica
China
India
Middle
East
Rest o
f Dev
elopin
g Asia
Africa
Latin
America
Trans
itionin
g Eco
nomies
OECD Pacific
OECD Europe
30-Year Cumulative Energy Usage Spend in Households and Commercial Buildings(2005–2035, in Constant US$ Trillions, Year 2000)
11.0
5.13.9 4.5
12.3
3.42.1
3.12.2
3.9
Developed Economies
Developing Economies
North A
merica
China
India
Middle
East
Rest o
f Dev
elopin
g Asia
Africa
Latin
America
Trans
itionin
g Eco
nomies
OECD Pacific
OECD Europe
30-Year Cumulative Household and Building Construction Investment(2005–2035, in Constant US$ Trillions, Year 2000)
24.919.8
4.7 5.2
49.6
17.1 15.3
6.912.3 13.0
Developed Economies
Developing Economies
Buildings
Households
Exhibit 7Construction Investment and Energy Usage by Region (2005–2035)
WWF_Low_Carbon_Cities.FINAL.4.indd 5 4/27/10 6:33 PM

6
30-Year Cumulative Household and Building Construction Investment(2005–2035, in Constant US$ Trillions, Year 2000)
Exhibit 8Urban Population Growth by Region (2005–2035)
Exhibit 9Higher Density, Lower Emissions Per Capita
Urban Population Growth Rates by Region(2005-2035)
Total Population CAGR 2005–2035
1,168
540
144101181277127
Industrialized regions
Developing regions
22% of growth in urban populations will come from India & China
North America
OECD Europe
OECD Pacific
Transitioning Economies
Middle East
Latin America
Africa Developing Asia
1.04% 0.60% 0.28% 0.46% 2.00% 1.16% 3.01% 2.25%
Source: U.N. Population Division; Booz & Company analysis
have been planned to accommodate auto transporta-tion for every individual. In contrast, European cities were largely planned before the widespread ownership of cars. As a result, transportation emissions per capita are almost three times higher in the U.S. than in most European countries, including Germany, the United Kingdom, and France.8
Population density also has a significant impact on emissions associated with habitation. Denser land use is highly correlated with denser individual housing units, which in turn lead to lower demands for heating, cooling, and lighting, the principal uses of residential energy in the industrialized world.
The net result is that increasing urbanization, industrialization, and wealth not only are inevitable but will generally have a negative ecological impact. Higher population densities may have lower emissions per capita, but their total energy usage is higher. The solution is better planning, with high density as one of the central aspects of that planning.
With an integrated approach to urban planning that utilizes modern technology, it is possible to achieve lower carbon emissions from transport and buildings in any city. For example, there are proven solutions, such as electrified public and private transportation fuelled by renewable energy and zero-energy buildings, that work regardless of population density. What they require is careful and holistic planning, such as the development of smart grids that can collect and store energy, manage variations in electricity loading, and allow for the increased use of renewables.
The Investment PrerequisiteGiven the estimated $350 trillion that will be spent on global urban infrastructure and usage for dwelling
and transportation over the next three decades, it is essential that these investments be directed towards zero-carbon infrastructure. An investment of $22 trillion—only 6 per cent more than BAU estimates—in green dwelling and transportation technology in cities globally over the next 30 years will decrease the emissions from usage of the urban infrastructure by more than 50 per cent, as well as reduce the need for future expenditures by $55 trillion. This represents a relatively aggressive case, but it offers an attractive trajectory towards zero emissions and a reasonable chance for limiting global warming to below 2 degrees (see Exhibit 10). With a much less aggressive
Estimated Greenhouse Gas Emissions/Person (Kg CO2 Equivalent/Year, Toronto)
Source: “Comparing High and Low Residential Density: Life-Cycle Analysis of Energy Use and Greenhouse Gas Emissions,” Journal of Urban Planning and Development, March 2006
Low Density(57 Persons/ha)
High Density(269 Persons/ha)
Construction material
Building operations
Transportation
8,637
3,341
WWF_Low_Carbon_Cities.FINAL.4.indd 6 4/27/10 6:33 PM
5
efficient way over the long term in the developing world (see Exhibit 7).
These infrastructure outlays will mainly be driven by the growth of urban populations in the developing nations of Asia and Africa, where an additional 1.7 billion people are expected to make cities their home over the next 30 years (see Exhibit 8).
Given the rate of urban growth in developing nations and the early stage of their infrastructure development efforts, it is clear that they can offer the highest returns in the quest for urban sustainability, even if they are currently less equipped to deal with the challenge. And given the outsized energy usage of cities in developed nations, it is also clear that developing nations should not adopt their inadequate transportation systems and energy-wasting house and building stock as a norm. Instead, developing nations must be supported in a drive to minimize energy use and undertake a shift to renewable energy sources that will enable low-carbon lifestyles for city dwellers.
The first step in such an effort should be long-term, strategic-level, low-carbon action plans, supported by a holistic national urban planning approach that enables the integration of large mainstream investment flows rather than a project-by-project approach on the sidelines of core development strategies and decisions. It will also require capacity building for policy making and financial
instruments to assist the cities in developing nations with the up-front investments needed to create and undertake low-carbon initiatives. Such support should be an impor-tant part of any global climate negotiation outcome.
The Planning Prerequisite A city’s energy intensity per capita tends to decrease as it matures. This decrease occurs due to a shift in the mix of industries from energy-intensive manufacturing to the lower energy requirements of service industries. It can also occur because of the natural responses to high population density.
The most obvious example of the positive role of urban density is transportation, one of the major components of energy and emissions intensity. For example, in Toronto, transportation emissions per capita are almost four times higher in low-density areas than in high-density areas (see Exhibit 9). Cities with high densities tend to have better-developed public transportation infrastructures and lower transportation emissions. They restrict car use and limit parking spaces, they make cycling and walking at-tractive, and they provide easy access to public transpor-tation. In short, they plan for more effective transportation.
The effect of urban planning on emissions is best illus-trated by comparing U.S. and European transportation emissions. Since the 1950s, a period during which the U.S. experienced a high urbanization rate, most cities
Source: Booz & Company analysis
North A
merica
China
India
Middle
East
Rest o
f Dev
elopin
g Asia
Africa
Latin
America
Trans
itionin
g Eco
nomies
OECD Pacific
OECD Europe
30-Year Cumulative Energy Usage Spend in Households and Commercial Buildings(2005–2035, in Constant US$ Trillions, Year 2000)
11.0
5.13.9 4.5
12.3
3.42.1
3.12.2
3.9
Developed Economies
Developing Economies
North A
merica
China
India
Middle
East
Rest o
f Dev
elopin
g Asia
Africa
Latin
America
Trans
itionin
g Eco
nomies
OECD Pacific
OECD Europe
30-Year Cumulative Household and Building Construction Investment(2005–2035, in Constant US$ Trillions, Year 2000)
24.919.8
4.7 5.2
49.6
17.1 15.3
6.912.3 13.0
Developed Economies
Developing Economies
Buildings
Households
Exhibit 7Construction Investment and Energy Usage by Region (2005–2035)
WWF_Low_Carbon_Cities.FINAL.4.indd 5 4/27/10 6:33 PM

7
approach by our cities focusing on smaller, incremental changes, modelling of a medium case shows that the emission reductions become significantly smaller and the chance for limiting global warming to below 2 degrees will thereby completely disappear eventually.
Accordingly, nations that are in the later stages of the urban infrastructure life cycle with high-carbon infrastructures should give high priority to large-scale programs designed to reduce the emissions that have been built into the infrastructures of their cities. They should apply the latest technologies to mitigate carbon emissions from their old stock and also set ambitious and challenging standards for guiding their future investments.
Decision makers, especially mayors, in developing countries must also seize the opportunity to allocate their financial resources in a strategic way that frees urbanites from high-cost, high-emission infrastructures. Surely, they will need support, particularly in funding up-front capital costs. This support will also accelerate the global development of green technology and re-duce solution costs through economies of scale for all of the world’s cities and nations.
The Technology PrerequisiteThe application of transformational socio-technical solutions is the third prerequisite for providing zero-carbon energy services in our cities. Over the next 30 years, we will need to develop and apply costly and energy-efficient technologies at an unprecedented
rate and on a global scale if we are to enable sustain-able lifestyles.
We cannot afford to continue to focus on small, incre-mental technology changes, such as car engines that offer a few more miles per gallon or air-conditioners that offer 5 per cent increases in efficiency. Incremen-tal technological improvements cannot provide the ab-solute emission reductions needed given the rates at which our cities and consumption levels are growing.
The technological solutions that we seek must offer transformational levels of improvement. We need to plan infrastructures and use financial leverage from the enormous investments to create zero-carbon infrastruc-tures that feature the intelligent use of renewable energy sources. These will likely include solutions integrating renewables like the electrification of private vehicles, public transportation run on electricity and biogas, and the use of district cooling and heating, LED, and natural lighting in buildings.
Some of the technologies needed for meeting the urban challenge are already competitively priced, but there are many others whose deployment costs must decrease rapidly if they are to be widely adopted. It is essential that we see the $350 trillion that will be invested in urban infrastructure and usage in the next 30 years as an opportunity for cities to become early adopters and investors in these solutions. In this way, cities can play an instrumental role not only in reducing our global carbon footprint but also in helping to reduce
30-Year Cumulative Urban Expenditure(Aggressive Case, in Constant US$ Trillions, Year 2000)
Base Case
Cost to Achieve
Savings End Case
Usage
Infrastructure
$351$77
$296
$249
$22
$23
$248
$102
$54
$48
30-Year Cumulative Urban Emissions(Aggressive Case, in Gigatons CO2)
Base Case
Cost to Achieve
Savings End Case
Usage
Infrastructure
465 198
280
91 100
374
194
180
Note: Totals may not be exact due to rounding. Source: Booz & Company analysis
13
3
Exhibit 10Urban Infrastructure Expenditures and Emissions with Green-Tech Investments
WWF_Low_Carbon_Cities.FINAL.4.indd 7 4/27/10 6:33 PM

8
technology costs by driving scale. Reducing the price for solar electricity can exemplify these challenges. More investments in solar photovoltaic development projects and installations can push down costs faster than the current rate (see Exhibit 11).
As early adopters, cities can also take an active role in spurring corporate, private, and governmental entre-preneurship around these solutions. In the best cases, as described in the next section, this activity will also create new streams of revenue for cities to serve as entrepreneurial hubs that sell successful solutions to other cities and countries.
There is also a unique historic opportunity to utilize the information and communications technology (ICT) developments of the last 15 years to reduce energy use and emissions. Consider the application of ICT to busi-ness meetings. Remote meetings, conducted via com-puters over networks, can totally eliminate expensive and carbon-emitting travel for participants. Another alternative available today, e-shopping, makes it easier for families and businesses to purchase goods in a more energy-efficient way.
Further, ICT can play an important enabling role in the avoidance of high-emission infrastructures. It supports the construction of smart/green buildings with features such as leverage sensors and controls designed to im-prove efficiency and tailor energy use to actual demand. ICT also provides tools for urban planning, such as simu-lation software that can help planners optimize the loca-
tion of schools, health services, and public transportation routes in order to reduce mobility needs and support low-carbon lifestyles. Finally, ICT is an essential enabler of smart grids, which we will need in order to significantly increase the share of renewables in our power grids.9
The Low-Carbon City Is Already Emerging Urban sustainability is a great challenge that will require a major and concerted effort by cities and nations around the world. But our vision of low-carbon cities is no pipe dream. The WWF’s Low-Carbon City Initiative in China is exploring low-carbon development models in different cities and disseminating its findings throughout the country.
There are also several notable examples of sustainable urban planning and emerging clean-tech hubs that are leading the way to a low-carbon future. Among them:
• Baoding, a city in the Chinese province of Hebei that is building its local economy by providing clean technology to other cities
• Malmö, in the south of Sweden, which is undergoing a green metamorphosis through sustainable urban planning
• Masdar, the planned urban environment in Abu Dhabi that aims to utilize clean tech to minimize its own ecological footprint, as well as to house about 1,500 clean-tech companies in the future
The challenge for these cities is to provide attractive zero-carbon lifestyles for inhabitants and jobs in the emerging industries that are increasingly providing solutions around the world.
From urban brownfield to global solution provider: As in many cities in developing nations, emissions levels are rising in the Chinese city of Baoding, but unlike with other cities, a share of Baoding’s emissions growth is caused by fuelling its workforce and the machinery it is developing to provide low-carbon solutions to the rest of the world. Solar photovoltaics, wind power, and energy-efficiency industries have been a major source of Bao-ding’s green growth engine for the past five years, and the city is determined to expand further.
Nationally recognised as the “Green Electric Valley of China,” Baoding has seen the number of its green energy companies expand from 64 in 2005 to 200 in 2008, and its green revenues have more than quadrupled in the same period, from $700 million to $3.5 billion. An estimated 13,500 new jobs (mainly low-paying labour jobs)—almost 10 per day—were created in Baoding’s renewable energy and energy-efficiency industries between 2005 and 2008, and exports
Exhibit 11The More We Invest in the Solutions, the Faster the Solution Cost Decreases
Prices of Crystalline Silicon PV vs. Thin-Film, Low-Price Bulk-Purchase Crystalline PV(2007–2025, in US$)
Source: “Utility Solar Assessment (USA) Study: Reaching Ten Percent Solar by 2025,” Clean Edge and Co-op America, June 2008
Crystalline silicon PV Thin-film, low-price bulk-purchase crystalline PV
$7
$6
$5
$4
$3
$2
$1
02007
Aver
age
Pric
e pe
r Pea
k W
att I
nsta
lled
2010 2015 2020 2025
WWF_Low_Carbon_Cities.FINAL.4.indd 8 4/27/10 6:33 PM
7
approach by our cities focusing on smaller, incremental changes, modelling of a medium case shows that the emission reductions become significantly smaller and the chance for limiting global warming to below 2 degrees will thereby completely disappear eventually.
Accordingly, nations that are in the later stages of the urban infrastructure life cycle with high-carbon infrastructures should give high priority to large-scale programs designed to reduce the emissions that have been built into the infrastructures of their cities. They should apply the latest technologies to mitigate carbon emissions from their old stock and also set ambitious and challenging standards for guiding their future investments.
Decision makers, especially mayors, in developing countries must also seize the opportunity to allocate their financial resources in a strategic way that frees urbanites from high-cost, high-emission infrastructures. Surely, they will need support, particularly in funding up-front capital costs. This support will also accelerate the global development of green technology and re-duce solution costs through economies of scale for all of the world’s cities and nations.
The Technology PrerequisiteThe application of transformational socio-technical solutions is the third prerequisite for providing zero-carbon energy services in our cities. Over the next 30 years, we will need to develop and apply costly and energy-efficient technologies at an unprecedented
rate and on a global scale if we are to enable sustain-able lifestyles.
We cannot afford to continue to focus on small, incre-mental technology changes, such as car engines that offer a few more miles per gallon or air-conditioners that offer 5 per cent increases in efficiency. Incremen-tal technological improvements cannot provide the ab-solute emission reductions needed given the rates at which our cities and consumption levels are growing.
The technological solutions that we seek must offer transformational levels of improvement. We need to plan infrastructures and use financial leverage from the enormous investments to create zero-carbon infrastruc-tures that feature the intelligent use of renewable energy sources. These will likely include solutions integrating renewables like the electrification of private vehicles, public transportation run on electricity and biogas, and the use of district cooling and heating, LED, and natural lighting in buildings.
Some of the technologies needed for meeting the urban challenge are already competitively priced, but there are many others whose deployment costs must decrease rapidly if they are to be widely adopted. It is essential that we see the $350 trillion that will be invested in urban infrastructure and usage in the next 30 years as an opportunity for cities to become early adopters and investors in these solutions. In this way, cities can play an instrumental role not only in reducing our global carbon footprint but also in helping to reduce
30-Year Cumulative Urban Expenditure(Aggressive Case, in Constant US$ Trillions, Year 2000)
Base Case
Cost to Achieve
Savings End Case
Usage
Infrastructure
$351$77
$296
$249
$22
$23
$248
$102
$54
$48
30-Year Cumulative Urban Emissions(Aggressive Case, in Gigatons CO2)
Base Case
Cost to Achieve
Savings End Case
Usage
Infrastructure
465 198
280
91 100
374
194
180
Note: Totals may not be exact due to rounding. Source: Booz & Company analysis
13
3
Exhibit 10Urban Infrastructure Expenditures and Emissions with Green-Tech Investments
WWF_Low_Carbon_Cities.FINAL.4.indd 7 4/27/10 6:33 PM
Urban sustainability is a great challenge that will require a major and concerted effort by cities and na-tions around the world. But our vision of low- carbon cities is no pipe dream. The WWF Earth Hour City Challenge is an initiative which aims to highlight inspiring examples from cities around the globe.
The following are notable examples of sustainable urban planning and emerging clean-tech hubs that are leading the way to a low-carbon future:
9
increased more than 17-fold during the same period, from $58 million to $1 billion.
The preliminary findings of a WWF Baoding study show that the solar and wind energy products manufactured in Baoding up until 2008 will, over their lifetimes, reduce more CO2 emissions where they are used than the emissions from the entire city of Baoding, including all of its industries.
New lease on life for an urban brownfield: The Swedish city of Malmö is setting a shining example for cities in later stages of their infrastructure life cycles. To reduce its ecological footprint, the city’s government has formu-lated a set of environmental objectives including energy consumption reductions of at least 40 per cent per capita by 2030 (based on consumption levels from 2001 to 2005) and a 40 per cent decrease in greenhouse gas emissions by 2020 (calculated from 1990). In addition, it plans to use 100 per cent renewable energy for the city council’s own operations by 2020 and 100 per cent re-newable energy for the municipality as a whole by 2030.
Malmö is also seeking to achieve sustainable agri-culture and to minimize noise and air pollution in the design of its traffic system. To reach some of its objec-tives, the city will replace fossil fuels, in phases, with energy sources such as solar, wind, water, and biogas. Electric rail and other electrically driven public transport, and crop-free and pesticide-free zones in its agricultural sectors, will also help it reach its objectives. In addition, Malmö plans to build up its existing clean-tech business-es and attract new business by continuing to develop as an innovation- and knowledge-based city.
An urban greenfield: Already in the formative period of its infrastructure life cycle, Abu Dhabi’s Masdar City will rely on renewable energy, be carbon neutral, and achieve zero waste. Among the green-tech solutions planned for the city are innovations such as solar-powered vehicles, which an expected 40,000 residents will share, and traditional ideas, such as narrow alleyways between buildings that will offer shade and limit the need for air-conditioning.
Masdar City is part of a greater initiative that will include the Masdar Institute (which will provide graduate-level education and research in clean and sustainable technology) and a carbon management unit that will develop greenhouse gas emissions reduction projects. It will also incorporate a utilities and asset management business unit that aims to capture a share of the global renewable electricity production market and a business unit that aims to position Masdar as a leading global investor in renewable industries as well as to contribute to transforming Abu Dhabi into a major producer of renewable technology.
ConclusionThe three prerequisites highlighted in this report—ur-ban planning, investment, and technology—are essen-tial in the drive to achieve zero-carbon lifestyles. In ad-dition to increasing our chances to limit global warming to less than 2 degrees Celsius, aggressively address-ing emissions in urban infrastructures can provide high economic returns and enhanced energy security. In contrast, BAU and less substantial efficiency improve-ments in our urban infrastructures over the next 30 years will not be enough to achieve those results.
Urban planning and the modern tools that support it will help cities make the right choices to maximize their long-term results. Investments must be carefully tar-geted and leveraged to reduce greenhouse gases and lower the costs of more sustainable lifestyles for every-one on the planet. Finally, technological advances will support and enable the drive for low-carbon cities.
The challenge is clear: Our cities must present holistic, inspiring, aggressive, and credible urban plans for reaching zero or very low emissions within the next few decades, finding innovative ways to finance them and utilizing every technological advance at their disposal. The need is urgent: If our cities do not meet this challenge, all of our futures are at risk.
AppendixBaseline: Key AssumptionsOur estimates for cost and emissions expenditures are for a 30-year period, from 2005 to 2035. We applied the U.S. Energy Information Administration’s geographic groupings to bundle individual countries into ten regions for our analysis: North America, OECD Europe, OECD Pacific, transitioning economies, China, India, rest of developing Asia, Middle East, Africa, and Latin America.
To forecast expenditures through 2035, we selected purchasing power parity (PPP) GDP per capita as the primary driver in predicting urbanization cost trends. We obtained historical and projected population data by country from the U.N. Population Division, and historical and projected GDP data by country from Global Insight.
Our analysis relies heavily on published and publicly available sources of data. This data was regressed against national and regional infrastructure and usage data to determine future expected levels of urban de-velopment. For carbon emissions, our analysis incor-porates the emissions embodied in the infrastructure as well as those associated with its usage.
Savings: Key AssumptionsTo identify savings opportunities, we modelled emissions and cost reductions in seven areas: (1) constructing green buildings, (2) retrofitting existing buildings, (3) improving
WWF_Low_Carbon_Cities.FINAL.4.indd 9 4/27/10 6:33 PM

10
public transportation, (4) increasing clean vehicles, (5) ap-plying smart logistics, (6) teleworking, and (7) e-shopping.
For each opportunity, we aggregated our geographic groupings into developed or developing countries to adjust the savings impact depending on regional developmental progress.
We estimated cost and emissions savings based on pub-lished information and subject matter expertise on future trends for each opportunity. The calculated total savings includes the cost of the infrastructure investments and the cost and carbon reductions achieved. Furthermore, the estimated total savings represents the cumulative impact of the seven savings opportunities combined.
Additionally, we applied a medium-case and an aggressive-case scenario for each opportunity to esti-mate the full range of future savings (see Exhibit A).
Savings/Efficiency & Cost Assumptions
Assumptions also include factors for: • Occupations amenable to teleworking
(included as part of the percentage below)• Decrease in commuter travel (33%)• Increase in residential space (1%)• Reduction in commercial space requirements (5%)• ICT needed for support (0.2%)
Assumptions also include factors for: • Reduction in car travel (14%)• Reduction in retail storage requirements (28%)• Reduction in freight travel (16%)• ICT needed for support (26%)
Assumptions also include factors for: • Reduction in private car travel (90%)• ICT needed for support (0.1%)
Assumptions also include factors for: • Increase in vehicle energy efficiency
(20% cars, 25% trucks)
Assumptions also include factors for: • Household and commercial efficiency
improvements (41% residential, 71% commercial)• Green building cost premiums (2%)
Assumptions also include factors for: • Household and commercial efficiency
improvements (33% residential, 35% commercial)• Cost of green retrofitting (17%)
Assumptions also include factors for: • Reduction in road traffic (14%)• Reduction in warehouse space requirements (24%)• ICT needed for support (19%)
Medium-Case Penetration Assumptions
• 50% developed• 50% developing
• 35% developed• 35% developing
• 20% developed• 40% developing
• 10%/25% developed (cars/trucks)
• 10%/25% developing (cars/trucks)
• 25%/60% developed (residential/commercial)
• 40%/50% developing (residential/commercial)
• 10%/30% developed (residential/commercial)
• 10%/20% developing (residential/commercial)
• 50% developed• 50% developing
Aggressive-Case Penetration Assumptions
• 100% developed• 100% developing
• 100% developed• 100% developing
• 50% developed• 50% developing
• 100% developed• 100% developing
• 100% developed• 100% developing
• 75% developed• 75% developing
• 100% developed• 100% developing
Teleworking
E-Shopping
Improved Public Transit
Increased Introduction of Green Vehicles
Green Building Construction
Retrofitting of Existing Buildings
Smart Logistics
Penetration Assumptions by 2035 (All Other Assumptions Remain Constant)
Exhibit AAssumptions for Medium- and Aggressive-Case Scenarios
References1 Anon, 2005. Climate Change: The Role of Cities. UN-HABITAT2 Höhne, N. and Moltmann, S. 2009. Sharing the Effort under a Global Carbon Budget. WWF International, Ecofys.3 Anon. 2008. Living Planet Report 2008. WWF International.4 Hertwich, E.G. and Peters, G.P. 2009. Carbon Footprint of Nations: A Global, Trade-Linked Analysis. Environmental Science & Technology (Vol. 43, No. 16), pp 6414–6420.5 Anon. 2007. State of World Population 2007: Unleashing the Potential of Urban Growth. United Nations Population Fund.6 Ibid.7 Anon. 2009. The World’s First Global Market Survey on Low Carbon IT: 100 Cities and 100 Companies’ Expectations from IT in Relation to a Low Carbon Future. WWF International, Booz & Company.8 Höhne, N., Eisbrenner, K., Hagemann, M. and S. Moltmann. 2009. G8 Climate Scorecards 2009. WWF International, Allianz.9 Pamlin, D., Pahlman, S. and E. Weidman. 2009. A Five-Step-Plan for a Low Carbon Urban Development. WWF Sweden, Ericsson.10 http://www.wwfchina.org/english/.
WWF_Low_Carbon_Cities.FINAL.4.indd 10 4/27/10 6:33 PM
9
increased more than 17-fold during the same period, from $58 million to $1 billion.
The preliminary findings of a WWF Baoding study show that the solar and wind energy products manufactured in Baoding up until 2008 will, over their lifetimes, reduce more CO2 emissions where they are used than the emissions from the entire city of Baoding, including all of its industries.
New lease on life for an urban brownfield: The Swedish city of Malmö is setting a shining example for cities in later stages of their infrastructure life cycles. To reduce its ecological footprint, the city’s government has formu-lated a set of environmental objectives including energy consumption reductions of at least 40 per cent per capita by 2030 (based on consumption levels from 2001 to 2005) and a 40 per cent decrease in greenhouse gas emissions by 2020 (calculated from 1990). In addition, it plans to use 100 per cent renewable energy for the city council’s own operations by 2020 and 100 per cent re-newable energy for the municipality as a whole by 2030.
Malmö is also seeking to achieve sustainable agri-culture and to minimize noise and air pollution in the design of its traffic system. To reach some of its objec-tives, the city will replace fossil fuels, in phases, with energy sources such as solar, wind, water, and biogas. Electric rail and other electrically driven public transport, and crop-free and pesticide-free zones in its agricultural sectors, will also help it reach its objectives. In addition, Malmö plans to build up its existing clean-tech business-es and attract new business by continuing to develop as an innovation- and knowledge-based city.
An urban greenfield: Already in the formative period of its infrastructure life cycle, Abu Dhabi’s Masdar City will rely on renewable energy, be carbon neutral, and achieve zero waste. Among the green-tech solutions planned for the city are innovations such as solar-powered vehicles, which an expected 40,000 residents will share, and traditional ideas, such as narrow alleyways between buildings that will offer shade and limit the need for air-conditioning.
Masdar City is part of a greater initiative that will include the Masdar Institute (which will provide graduate-level education and research in clean and sustainable technology) and a carbon management unit that will develop greenhouse gas emissions reduction projects. It will also incorporate a utilities and asset management business unit that aims to capture a share of the global renewable electricity production market and a business unit that aims to position Masdar as a leading global investor in renewable industries as well as to contribute to transforming Abu Dhabi into a major producer of renewable technology.
ConclusionThe three prerequisites highlighted in this report—ur-ban planning, investment, and technology—are essen-tial in the drive to achieve zero-carbon lifestyles. In ad-dition to increasing our chances to limit global warming to less than 2 degrees Celsius, aggressively address-ing emissions in urban infrastructures can provide high economic returns and enhanced energy security. In contrast, BAU and less substantial efficiency improve-ments in our urban infrastructures over the next 30 years will not be enough to achieve those results.
Urban planning and the modern tools that support it will help cities make the right choices to maximize their long-term results. Investments must be carefully tar-geted and leveraged to reduce greenhouse gases and lower the costs of more sustainable lifestyles for every-one on the planet. Finally, technological advances will support and enable the drive for low-carbon cities.
The challenge is clear: Our cities must present holistic, inspiring, aggressive, and credible urban plans for reaching zero or very low emissions within the next few decades, finding innovative ways to finance them and utilizing every technological advance at their disposal. The need is urgent: If our cities do not meet this challenge, all of our futures are at risk.
AppendixBaseline: Key AssumptionsOur estimates for cost and emissions expenditures are for a 30-year period, from 2005 to 2035. We applied the U.S. Energy Information Administration’s geographic groupings to bundle individual countries into ten regions for our analysis: North America, OECD Europe, OECD Pacific, transitioning economies, China, India, rest of developing Asia, Middle East, Africa, and Latin America.
To forecast expenditures through 2035, we selected purchasing power parity (PPP) GDP per capita as the primary driver in predicting urbanization cost trends. We obtained historical and projected population data by country from the U.N. Population Division, and historical and projected GDP data by country from Global Insight.
Our analysis relies heavily on published and publicly available sources of data. This data was regressed against national and regional infrastructure and usage data to determine future expected levels of urban de-velopment. For carbon emissions, our analysis incor-porates the emissions embodied in the infrastructure as well as those associated with its usage.
Savings: Key AssumptionsTo identify savings opportunities, we modelled emissions and cost reductions in seven areas: (1) constructing green buildings, (2) retrofitting existing buildings, (3) improving
WWF_Low_Carbon_Cities.FINAL.4.indd 9 4/27/10 6:33 PM

Why we are here
panda.org
To stop the degradation of the planet’s natural environment andto build a future in which humans live in harmony with nature.
• 2011 ANNUAL CONFERENCE REPORTWWF.ORG
© 1986 Panda symbol WWF – World Wide Fund For nature (Formerly World Wildlife Fund) ® “WWF” is a WWF Registered trademarks. WWF, avenue du mont-Blanc, 1196 Gland, Switzerland – tel. +41 22 364 9111 Fax +41 22 364 0332. For contact details and further information, please visit our international website at wwf.panda.org
1961WWF was founded in 1961
+100WWF is in over 100 countries, on 5 continents
+5,000WWF has over 5,000 staff worldwide
+5MWWF has over 5 million supporters
WWF in numbers©
na
Sa
WWF’s mission is to stop the degradation of the planet’s natural environment and to build a future in which humans live in harmony with nature, by:
• conserving the world’s biological diversity
• ensuring that the use of renewable natural resources is sustainable
• promoting the reduction of pollution and wasteful consumption.
WWF InternationalAvenue du Mont-Blanc1196 GlandSwitzerland
www.panda.org
Produced in cooperation with Booz & Company
WWF_Low_Carbon_Cities.FINAL.4.indd 11 4/27/10 6:33 PM
• REINVENTING THE CITY – THREE PREREQUISITES FOR GREENING URBAN INFRASTRUCTURESWWW.PANDA.ORG
WWF in numbers
+100WWF is in over 100 countries, on 5 continents
1961WWF was founded in 1961
+5MWWF has over 5 millionsupporters +5,000
WWF has over 5,000 staffworldwide