Reindustrialization in Northeast China: The Good, The … MULLER.pdf · Reindustrialization in...
39
Reindustrialization in Northeast China: The Good, The Bad & the Unlikely Dr. Larissa MULLER Faculty of Environmental Design, University of Calgary IACP 2010, Shanghai, 19-20 June, 2010
Transcript of Reindustrialization in Northeast China: The Good, The … MULLER.pdf · Reindustrialization in...
Reindustrialization in Northeast China:
The Good, The Bad & the Unlikely
Dr. Larissa MULLERFaculty of Environmental Design, University of Calgary
IACP 2010, Shanghai, 19-20 June, 2010

Overview of Northeast Reindustrialization Strategies
Evidence of successful industrial revitalization
Strength of industrialization policies
Spatial implications & key concerns
Take Away: Key Lessons
Outline
4
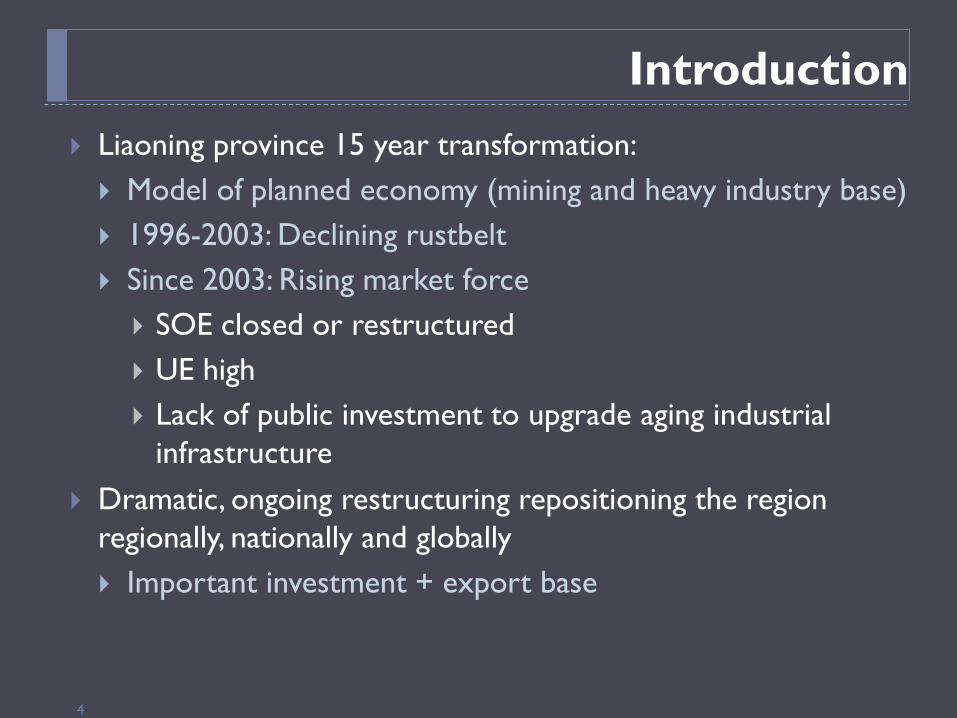
Liaoning province 15 year transformation: Model of planned economy (mining and heavy industry base) 1996-2003: Declining rustbelt Since 2003: Rising market force SOE closed or restructured UE high Lack of public investment to upgrade aging industrial
infrastructure Dramatic, ongoing restructuring repositioning the region
regionally, nationally and globally Important investment + export base
Introduction

28-May-20105
Overview of Northeast Reindustrialization Strategies
5

6
Global and national restructuring / repositioning Potential to play key role in NE Asia cross border economic
development Tumenjiang Cross Border Strategy (ADB)
3 National Strategies Northeast Revitalization Shenyang 1+7 economic region Liaoning Coastal Corridor
Golden Industry Corridor: Shenyang – Liaoyang – Anshan –Yingkou Promotion of port-oriented industry
Repositioning & Restructuring
7
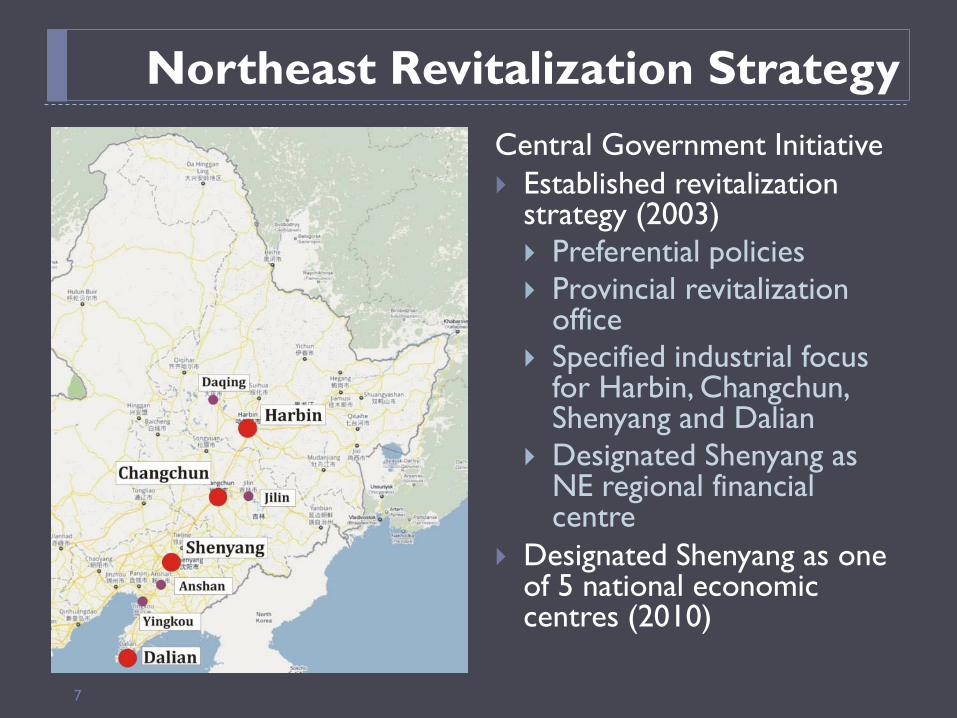
Central Government Initiative Established revitalization
strategy (2003) Preferential policies Provincial revitalization
office Specified industrial focus
for Harbin, Changchun, Shenyang and Dalian
Designated Shenyang as NE regional financial centre
Designated Shenyang as one of 5 national economic centres (2010)
Northeast Revitalization Strategy
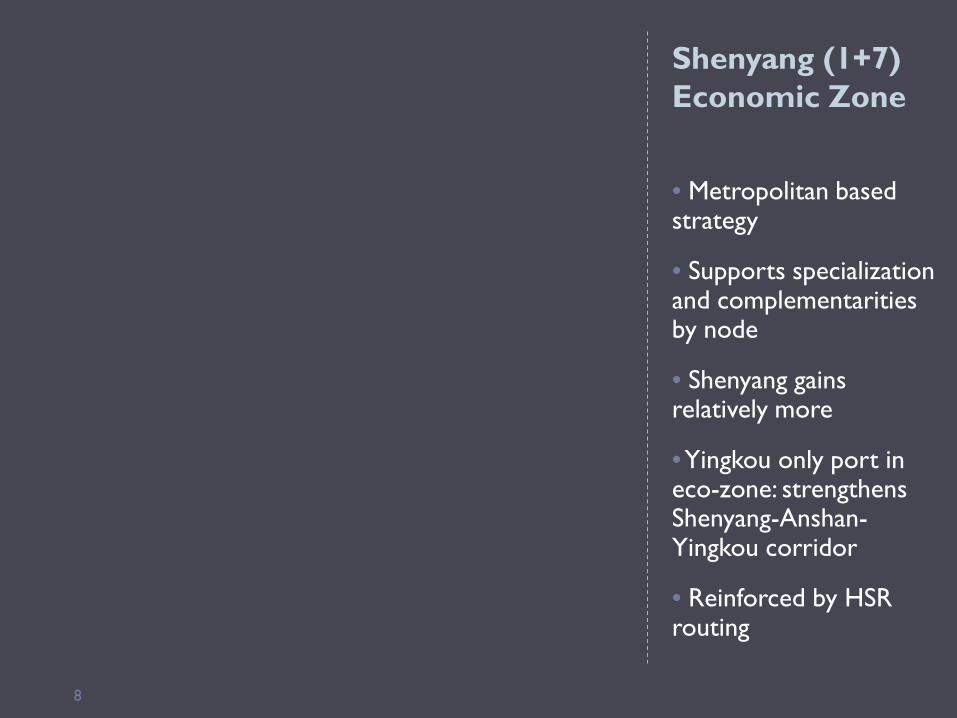
Shenyang (1+7) Economic Zone
• Metropolitan based strategy
• Supports specialization and complementarities by node
• Shenyang gains relatively more
•Yingkou only port in eco-zone: strengthens Shenyang-Anshan-Yingkou corridor
• Reinforced by HSR routing
8
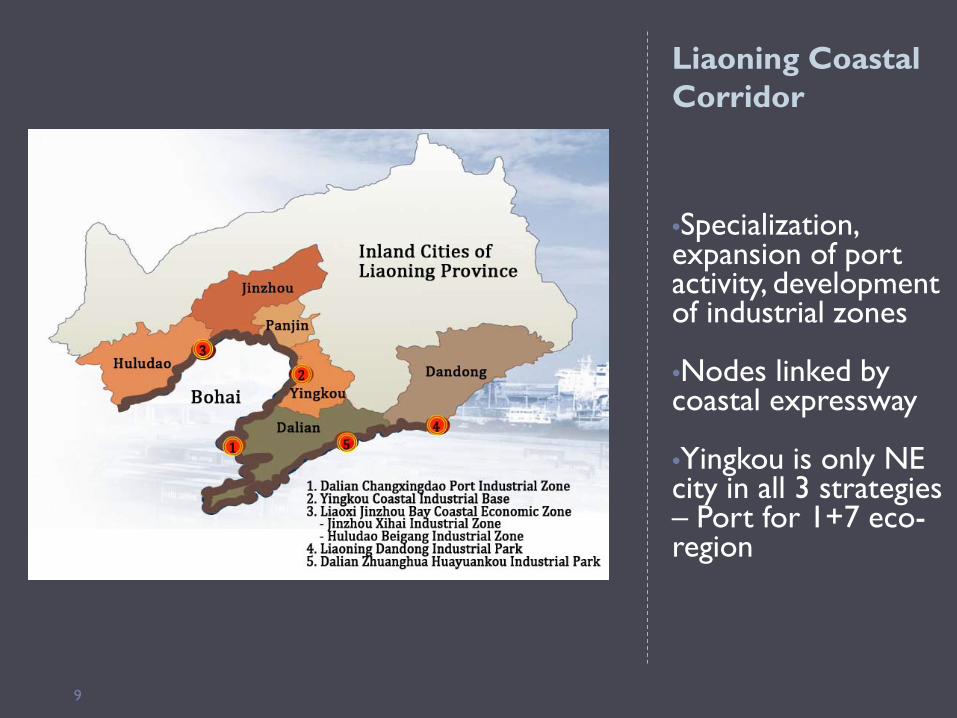
Liaoning Coastal Corridor
•Specialization, expansion of port activity, development of industrial zones
•Nodes linked by coastal expressway
•Yingkou is only NE city in all 3 strategies – Port for 1+7 eco-region
9

28-May-201010
Evidence of Success
10
Shenyang
Anshan
Yingkou

Liaoning Province: GDP Performance
Doubled GDP in last 5 years (Nominal Data)
From laggard to leader in economic growth rate
11
279
600
1,346
-
300
600
900
1,200
1,500
1990
1991
1992
1993
1994
1995
1996
1997
1998
1999
2000
2001
2002
2003
2004
2005
2006
2007
2008
GD
P in
Bill
ion
RM
B
6%
7%
8%
9%
10%
11%
12%
13%
14%
15%
Liaoning
China
12
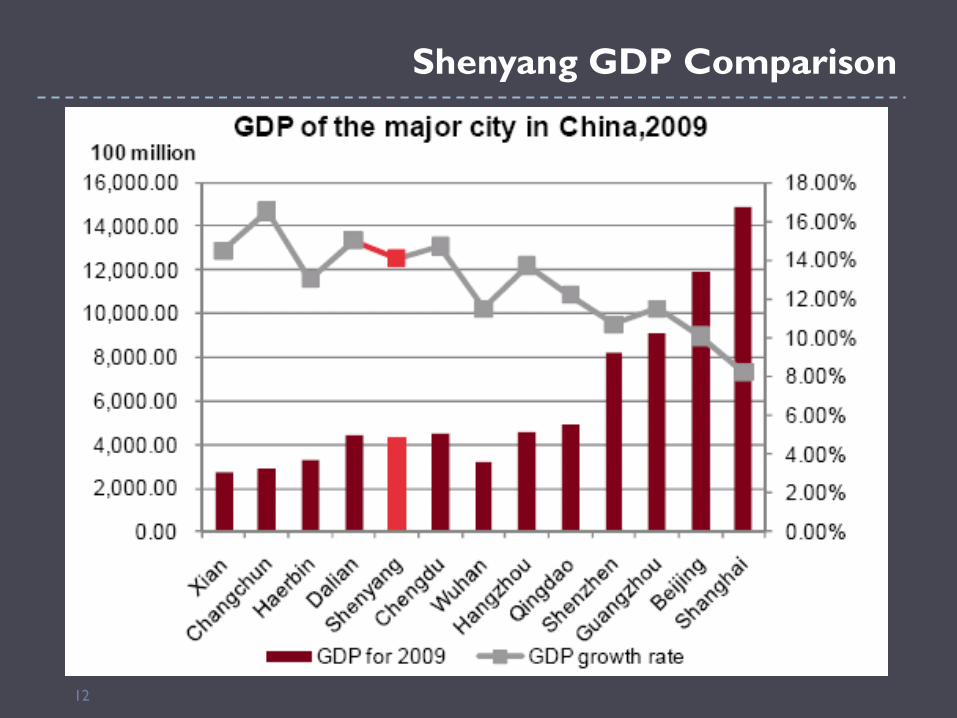
Shenyang GDP Comparison
13
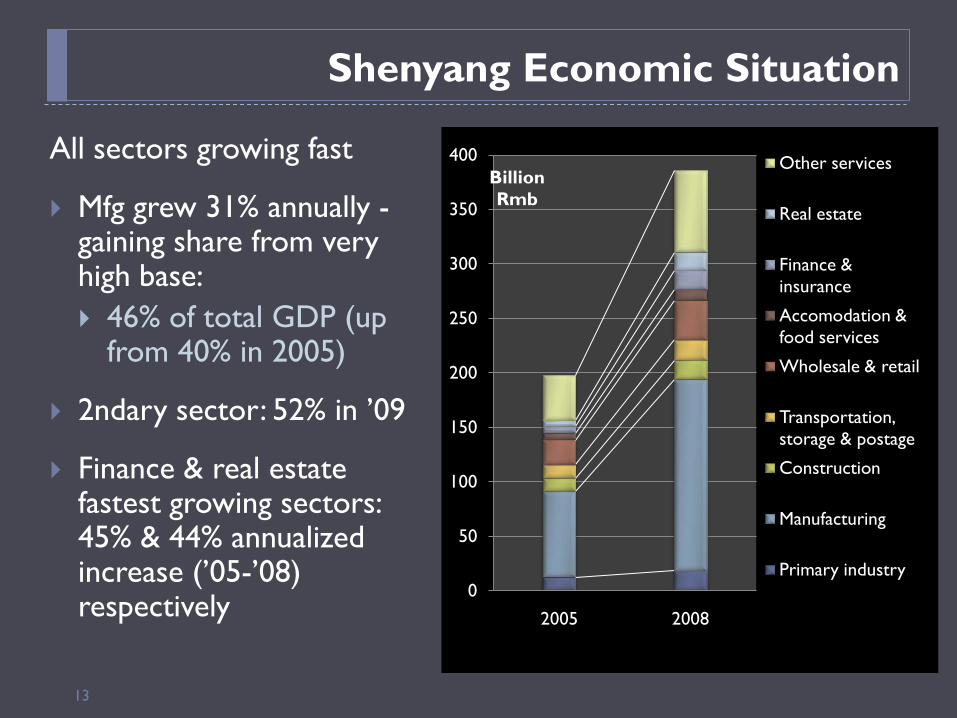
All sectors growing fast
Mfg grew 31% annually -gaining share from very high base: 46% of total GDP (up
from 40% in 2005)
2ndary sector: 52% in ’09
Finance & real estate fastest growing sectors: 45% & 44% annualized increase (’05-’08) respectively
Shenyang Economic Situation
0
50
100
150
200
250
300
350
400
2005 2008
Billion Rmb
Other services
Real estate
Finance & insurance
Accomodation & food services
Wholesale & retail
Transportation, storage & postage
Construction
Manufacturing
Primary industry
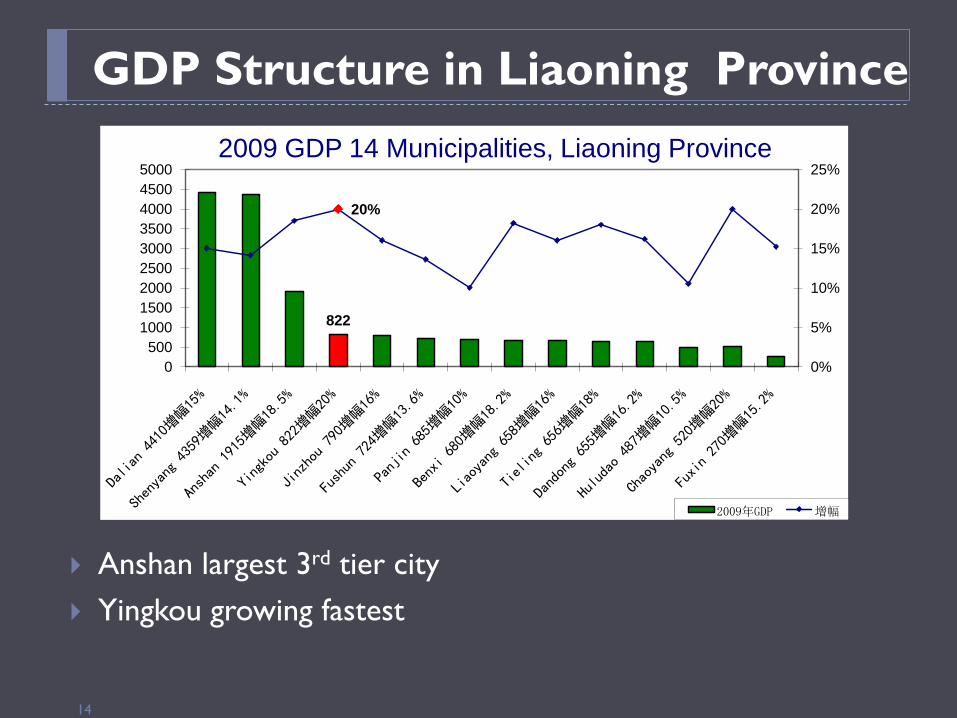
14
Anshan largest 3rd tier city Yingkou growing fastest
GDP Structure in Liaoning Province
822
20%
0%
5%
10%
15%
20%
25%
0500
100015002000250030003500400045005000
2009 GDP 14 Municipalities, Liaoning Province
2009年GDP 增幅
Urban population Income Retail Sales2008
(million persons)
annual growth, 2005-08
Urbaniz-ation Level
Avg. urban per capita disposal income (RMB)
2008 (billion RMB)
per capita (RMB)
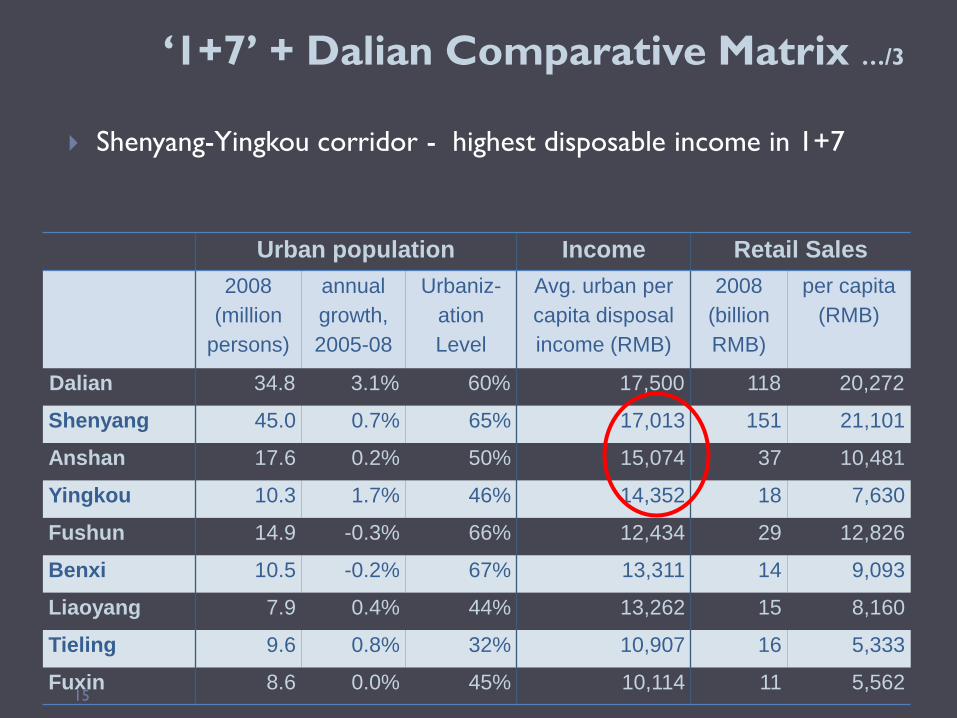
Dalian 34.8 3.1% 60% 17,500 118 20,272
Shenyang 45.0 0.7% 65% 17,013 151 21,101
Anshan 17.6 0.2% 50% 15,074 37 10,481
Yingkou 10.3 1.7% 46% 14,352 18 7,630
Fushun 14.9 -0.3% 66% 12,434 29 12,826
Benxi 10.5 -0.2% 67% 13,311 14 9,093
Liaoyang 7.9 0.4% 44% 13,262 15 8,160
Tieling 9.6 0.8% 32% 10,907 16 5,333
Fuxin 8.6 0.0% 45% 10,114 11 5,562 15
‘1+7’ + Dalian Comparative Matrix …/3
Shenyang-Yingkou corridor - highest disposable income in 1+7
16
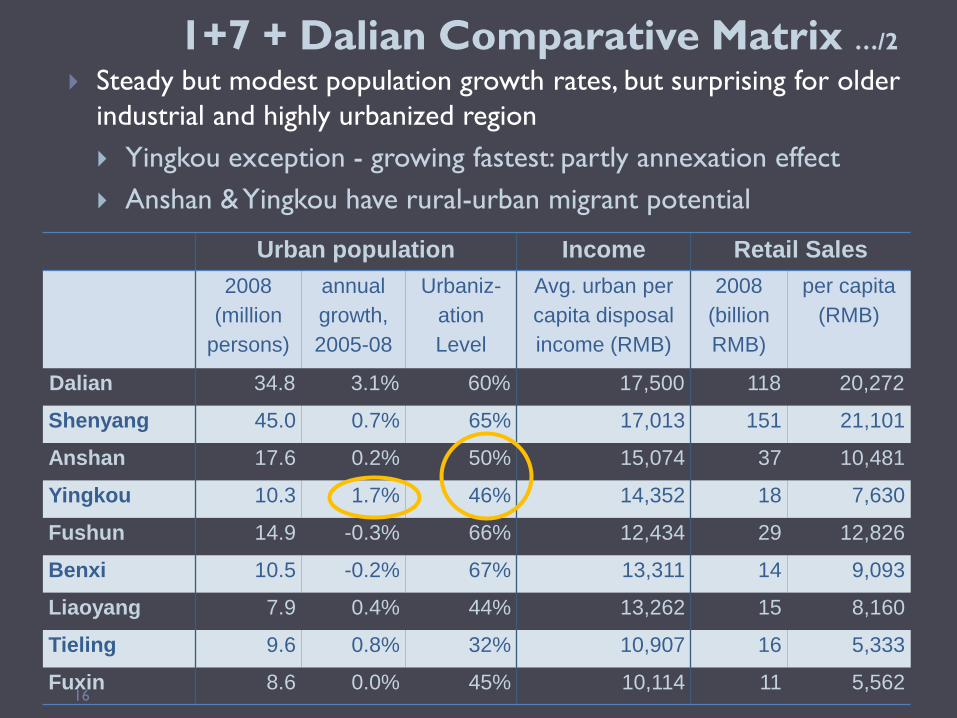
1+7 + Dalian Comparative Matrix …/2
Steady but modest population growth rates, but surprising for older industrial and highly urbanized region Yingkou exception - growing fastest: partly annexation effect Anshan & Yingkou have rural-urban migrant potential
Urban population Income Retail Sales2008
(million persons)
annual growth, 2005-08
Urbaniz-ation Level
Avg. urban per capita disposal income (RMB)
2008 (billion RMB)
per capita (RMB)
Dalian 34.8 3.1% 60% 17,500 118 20,272
Shenyang 45.0 0.7% 65% 17,013 151 21,101
Anshan 17.6 0.2% 50% 15,074 37 10,481
Yingkou 10.3 1.7% 46% 14,352 18 7,630
Fushun 14.9 -0.3% 66% 12,434 29 12,826
Benxi 10.5 -0.2% 67% 13,311 14 9,093
Liaoyang 7.9 0.4% 44% 13,262 15 8,160
Tieling 9.6 0.8% 32% 10,907 16 5,333
Fuxin 8.6 0.0% 45% 10,114 11 5,562

28-May-201017
Strength of Industrialization Policies
17

18
Highly successful economic restructuring
Build on traditional strengths (pillar industries), particularly metallurgy and heavy equipment manufacture
Utilizing selective SOE restructuring and privatization Allowed to fail in spite of job losses
Joint ventures and foreign investment (113 Fortune 500 businesses) Inject capital +introduce more advanced technology and products
Extend value chain and upgrade Introduce IT Greater investment in R&D – Shenyang currently invests 3-7% of
industrial output value

19
Highly successful economic restructuring
Focus on intermediate goods to high growth industries Construction, automobile and ship building, new energy
Diversify market: development of export markets continuing to grow its domestic market;
Government role in expanding port capacity to support its growth
Vocational training emphasized Highly urbanized + migration predominantly from within NE region
Integrated spatial + economic restructuring: Spatially decentralizing + clustering by specialization within cities for
deeper supply chains Specialization + integration in megapolitan system

20
Senior government support to facilitate private investment, spatial clustering and upgrading of infrastructure within cities and networked region Spatial policies and preferential investment policies: 1+7 Shenyang
economic zone, 1+5 coastal corridor Provincial Economic Revitalization Office SOE policies Accessibility improvements: Priority investment in HSR,
expressways, port capacity devt, industrial facilities Approval of local development plans ensure convergence
North America & EU blunter instruments: more private sector led, democratic politics led
Aggressive provincial and municipal economic leadership e.g., chasing firms such as Bombardier and Cessna
28-May-201021
Local Spatial Integration, Implications & Key Concerns
21
22
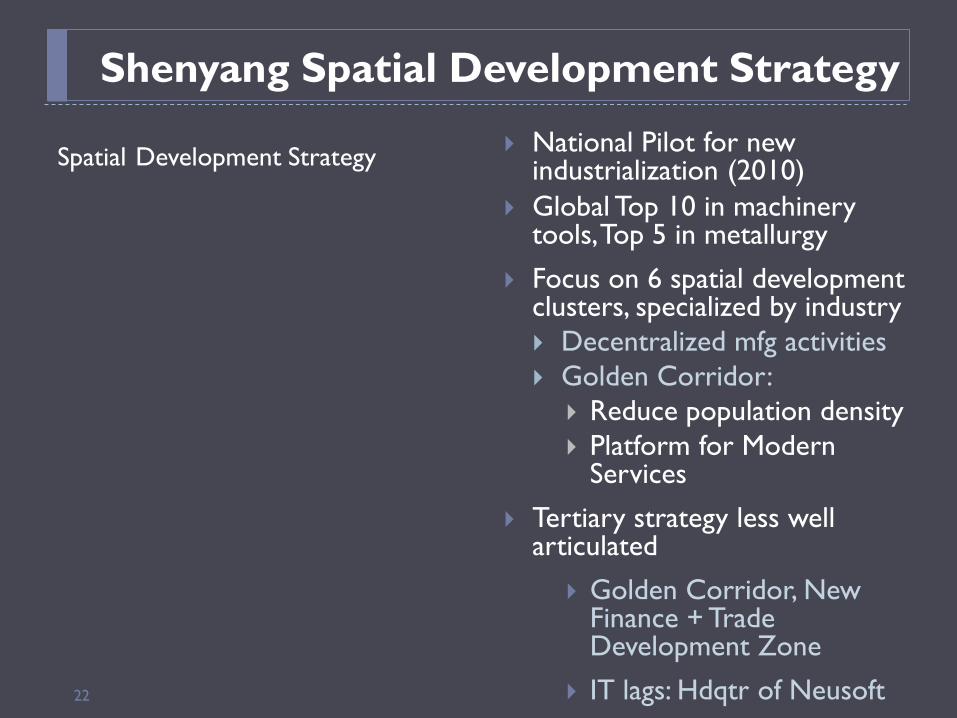
Spatial Development Strategy National Pilot for new industrialization (2010)
Global Top 10 in machinery tools, Top 5 in metallurgy
Focus on 6 spatial development clusters, specialized by industry Decentralized mfg activities Golden Corridor:
Reduce population density Platform for Modern
Services
Tertiary strategy less well articulated
Golden Corridor, New Finance + Trade Development Zone
IT lags: Hdqtr of Neusoft
Shenyang Spatial Development Strategy

23
Population Growth Rate by District
• Slow pop growth: Municipality growing at 0.7% per year (2009)
• Relocation from core to suburban areas:
• N & S new town growth access: Dongling & Shenbei fastest growing districts
• Southwest mfg corridor (Tiexi)
• Diversified mfg economy attractive to NE migrants
• Retain most university graduates
Average annual growth rate 2005-2008
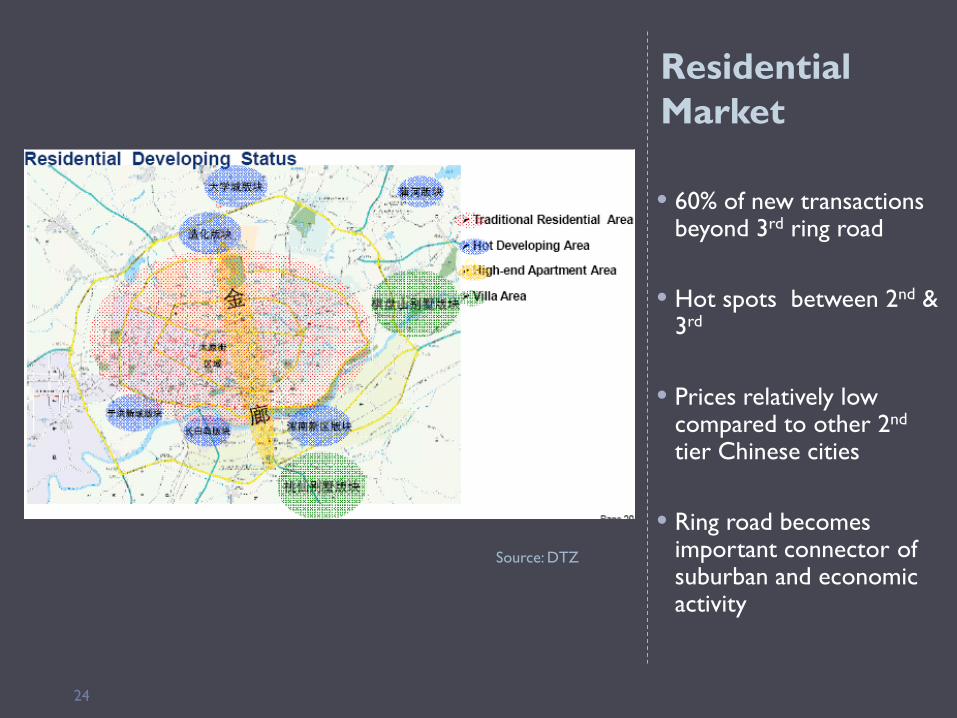
Residential Market
24
Source: DTZ
• 60% of new transactions beyond 3rd ring road
• Hot spots between 2nd & 3rd
• Prices relatively low compared to other 2nd
tier Chinese cities
• Ring road becomes important connector of suburban and economic activity

25
Shenyang Spatial Dynamics
Southern subcenters developing quickly
Northern subcenter could emerge around HSR
New industry & population locating
beyond 3rd ring road
Tiexi District restructuring largely completed: strong SW industrial corridor- Metro lines to centre

26
Shenyang Spatial Dynamics
’
Golden Corridor assuming necklace form - extending, especially to south
Will be reinforced by Line 2 Metro
- Extending to new towns
Severe traffic congestion within 2nd ring road

27
Shenyang Spatial Dynamics
Under-utilized TOD potential at Line1&2 intersection
East-west silver belt (Line 1) less dynamic:

28
Positioning: Key city of South-central Liaoning Capital of steel, resources, & equipment machinery mfg Tourism & health city, logistic center, commercial centre
Emulating Shenyang’s economic & spatial development strategy
Anshan Development Strategy
29
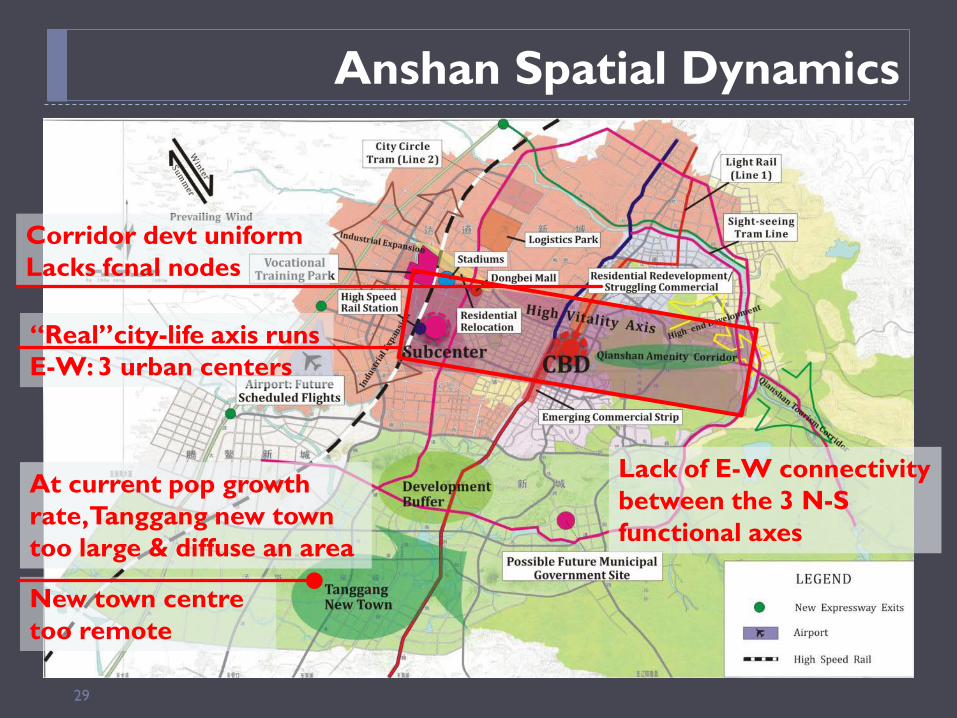
Anshan Spatial Dynamics
“Real”city-life axis runs E-W: 3 urban centers
At current pop growth rate, Tanggang new town too large & diffuse an area
New town centre too remote
Corridor devt uniformLacks fcnal nodes
Lack of E-W connectivity between the 3 N-S functional axes

30
Spatial concept – consolidation of industry to west, amenity to east sound planning
High confidence in strong mayor reduces development risk
Whole urban structure in flux, making planning difficult Caution should be exercised to avoid over supply
Overbuilding: Too much leapfrogging, especially South Town
HSR access advantage: only stop for express Shenyang-Dalian HSR Anchors subcenter and creates unique premium land-use
opportunities
Anshan Critical Assessment

31
City life corridor too long, linear, uniform Should focus on CBD and HSR-based subcentre Danger of disinvestment in CBD if relocate municipal
government & promote Tanggang new town expansion
Need to reconsider tram lines / LRT routing Line 1 routing OK Require 2nd line through E-W vitality corridor: could be
extended to Qianshan tourism corridor Trams inappropriate for long distances & widely spaced
stations
Anshan Critical Assessment …/2
32
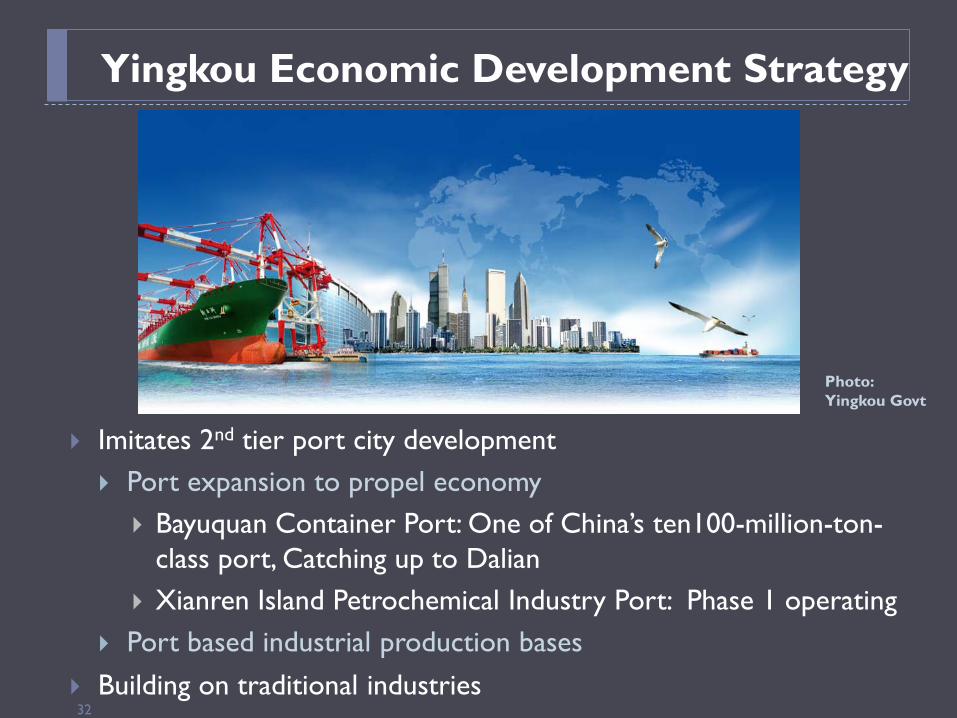
Imitates 2nd tier port city development Port expansion to propel economy
Bayuquan Container Port: One of China’s ten100-million-ton-class port, Catching up to Dalian
Xianren Island Petrochemical Industry Port: Phase 1 operating Port based industrial production bases
Building on traditional industries
Yingkou Economic Development Strategy
Photo: Yingkou Govt
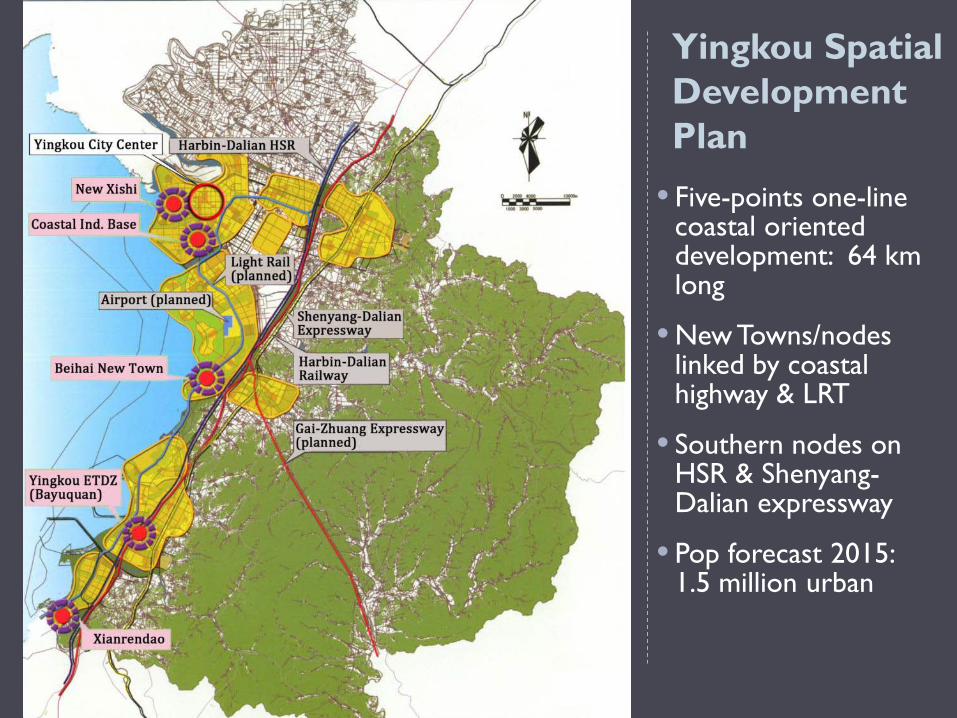
Yingkou Spatial Development Plan
• Five-points one-line coastal oriented development: 64 km long
• New Towns/nodes linked by coastal highway & LRT
• Southern nodes on HSR & Shenyang-Dalian expressway
• Pop forecast 2015: 1.5 million urban
33
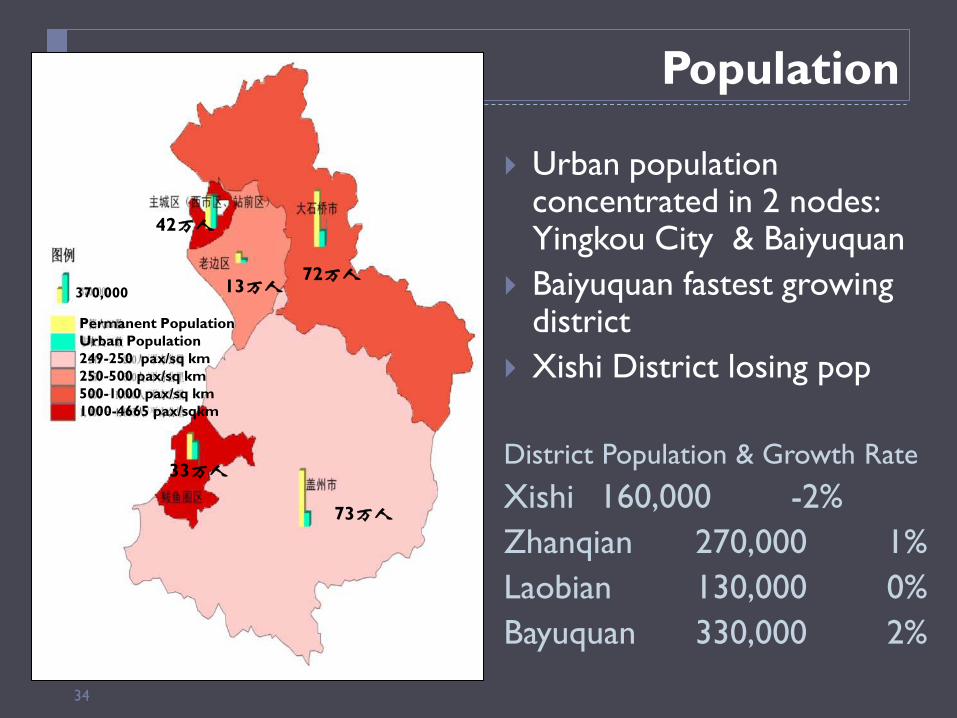
34
Urban population concentrated in 2 nodes: Yingkou City & Baiyuquan
Baiyuquan fastest growing district
Xishi District losing pop
District Population & Growth Rate
Xishi 160,000 -2%Zhanqian 270,000 1%Laobian 130,000 0%Bayuquan 330,000 2%
Population
73万人
72万人
33万人
13万人
42万人
Permanent PopulationUrban Population249-250 pax/sq km250-500 pax/sq km500-1000 pax/sq km1000-4665 pax/sqkm
370,000
35
Significant labour cost advantage vis-à-vis Dalian
One node too many: - Beihai Danger of dilution of investment & vitality
Recommend two-city strategy: Yingkou city, includes Coastal Industrial Base and New Xishi
and existing CBD (Zhanqian District) Southern city focused on Baiyuquan ETDZ
Danger of conflict between heavy industry and beach tourism Need more careful planning
Critical Assessment

36
Third Tier cities imitating second tier despite different tertiary functions, population size
Functional Separation & Dispersal Future donut cities? Loss of intensity Lack of integration among functional pieces
Too much in flux?
Third tier spatial planning

28-May-201037
Key Learning
37

38
Government plays bigger role in restructuring Spatial redevelopment integral to economic restructuring Clustering + regional specialization: deepening industrial
structure Global + local transportation linkages Modern spaces for investment Urban environmental quality
Regional urban network linkages benefit major centre (Shenyang) relatively more Global Cities phenomenon on smaller scale Enables higher end business, professional, personal services
Builds on existing strengths (Porter) rather than chase hot sectors
Local vocational and in-house training critical to continued upgrading success
Lack top university or first mover advantage: migrants prefer closer opportunities
Key Lessons: Industrial Revitalization

39
Fcnal land use separation just as N. Am & EU exploring reintegration
Avoid going to extremes
Excessive New Town Development
Need to be based on major infrastructure advantage: port, HSR stations, airports, municipal govt relocations
3rd Tier dispersal: Risk donut effect, increasing leakage to regional centres, leapfrogging and poor transportation connections
Tertiary sector not well understood
Role of intensity, critical mass
Greater differentiation in products: e.g., expressway / ring road based big box
Role of ring roads as suburban connector Missed opportunities to use public transit to shape form High intensity nodes (necklace) not uniform corridor
Key Findings – Local Redevt