
Reimagining Retirement 2030: A Roadmap for Action
36
Reimagining Retirement 2030: A Roadmap for Action CRI Annual Policy Innova0on Forum October 20, 2020 @cri_states Social media: #2030CRIForum
Transcript of Reimagining Retirement 2030: A Roadmap for Action
ReimaginingRetirement2030:
ARoadmapforAction CRIAnnualPolicyInnova0onForum
October20,2020
@cri_states
Socialmedia:#2030CRIForum

How Will Demographic, Economic, and Political Trends
Shape the Future of Retirement?
Moderator|AngelaAntonelliResearchProfessorandExecu2veDirector,
CenterforRe2rementIni2a2ves,Georgetown
University
PanelPar0cipants
JamesPoterbaPresident and CEO, National
Bureau of Economic Research
AliceHenriquesVolzPrincipal Economist, Federal
Reserve Board
MichaelKrepsPrincipal, Groom Law
Group
PrestonRutledgeFounder, Rutledge Policy
Group LLC
James Poterba
President and CEO
National Bureau of Economic Research
Reimagining Retirement 2030:
Economic and Demographic
Challenges
James Poterba – MIT, NBER, and TIAA
Georgetown University Seminar
20 October 2020
7
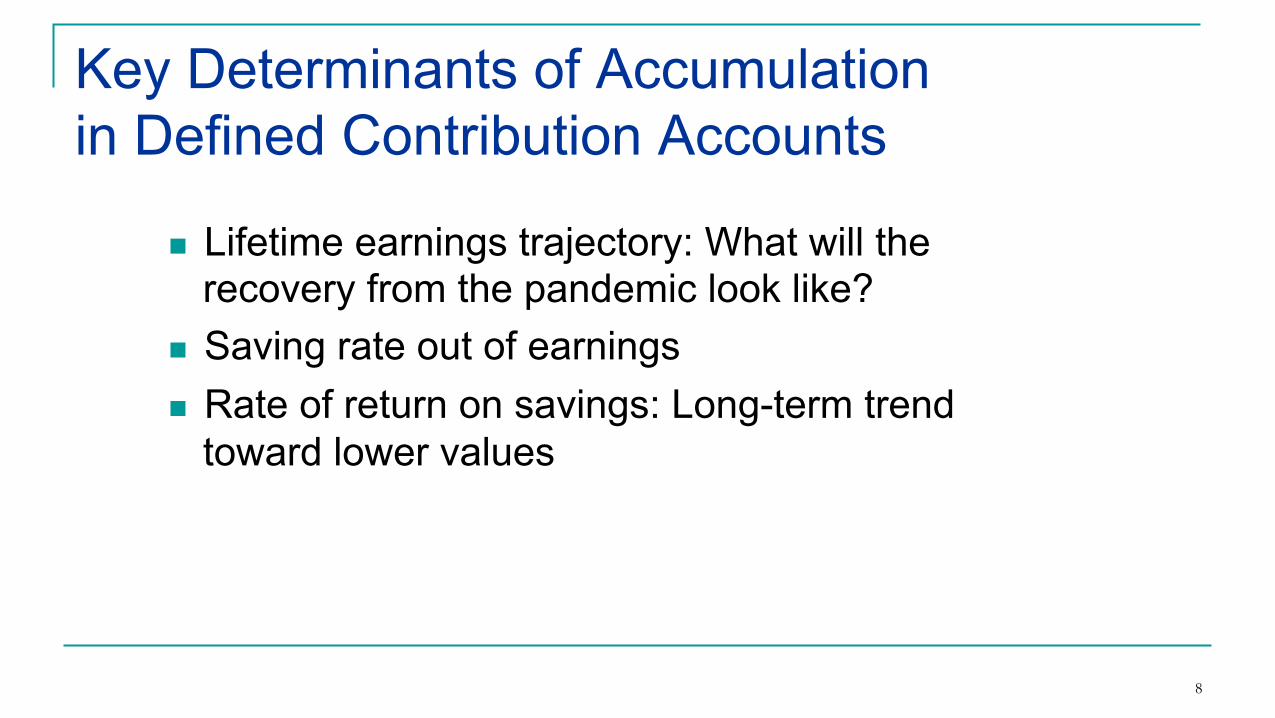
Key Determinants of Accumulation
in Defined Contribution Accounts
n Lifetime earnings trajectory: What will the
recovery from the pandemic look like?
n Saving rate out of earnings
n Rate of return on savings: Long-term trend
toward lower values
8

10-Year U.S. Treasury Yield
Source: Board of Governors of the Federal Reserve System (US), 10-Year Treasury Constant Maturity Rate [GS10], retrieved from FRED, Federal Reserve Bank of St. Louis; https://fred.stlouisfed.org/series/GS10, August 10, 2020.
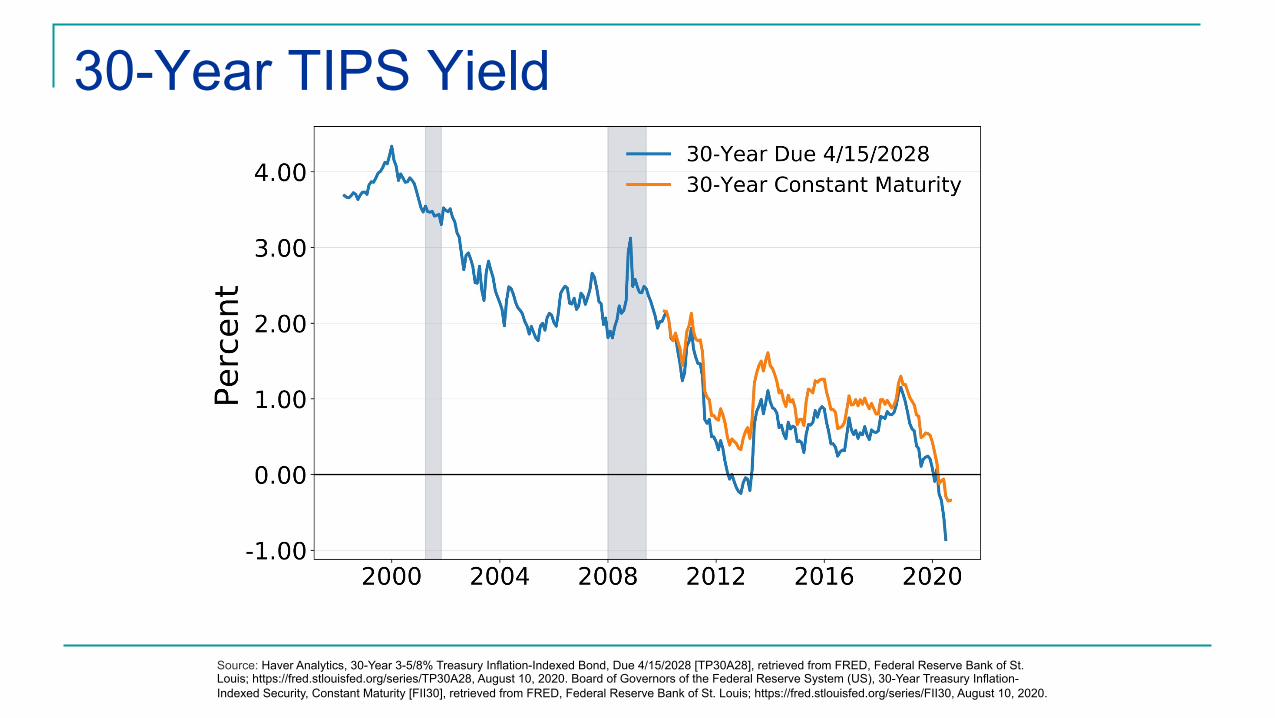
30-Year TIPS Yield
Source: Haver Analytics, 30-Year 3-5/8% Treasury Inflation-Indexed Bond, Due 4/15/2028 [TP30A28], retrieved from FRED, Federal Reserve Bank of St. Louis; https://fred.stlouisfed.org/series/TP30A28, August 10, 2020. Board of Governors of the Federal Reserve System (US), 30-Year Treasury Inflation-
Indexed Security, Constant Maturity [FII30], retrieved from FRED, Federal Reserve Bank of St. Louis; https://fred.stlouisfed.org/series/FII30, August 10, 2020.

Real Interest Rates on Inflation-Indexed Bonds
11 Source: Bloomberg, August 10 2020.

Equity Exposure in US 401(k) Plans
0
10
20
30
40
50
60
70
80
90
20-29 30-39 40-49 50-59 60-69
Series 1
12 Source: Investment Company Institute, ICI Research Perspective 24 (Sept 2018).
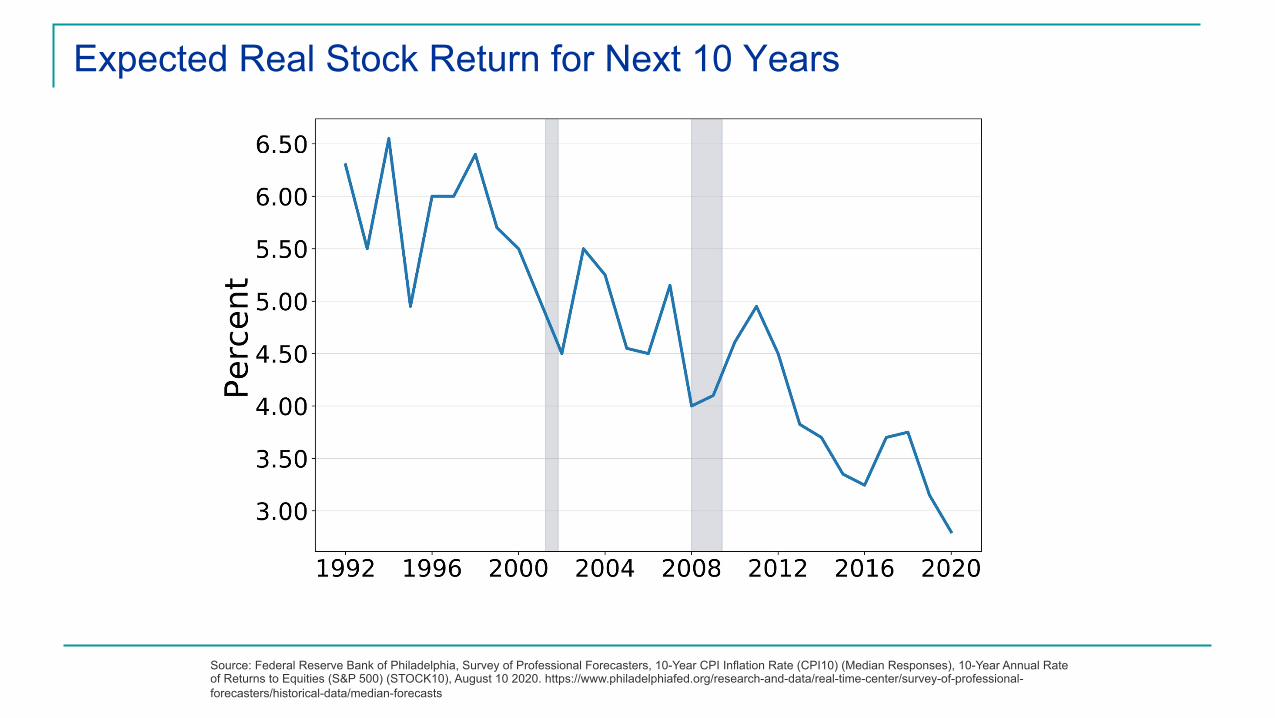
Expected Real Stock Return for Next 10 Years
Source: Federal Reserve Bank of Philadelphia, Survey of Professional Forecasters, 10-Year CPI Inflation Rate (CPI10) (Median Responses), 10-Year Annual Rate of Returns to Equities (S&P 500) (STOCK10), August 10 2020. https://www.philadelphiafed.org/research-and-data/real-time-center/survey-of-professional-
forecasters/historical-data/median-forecasts
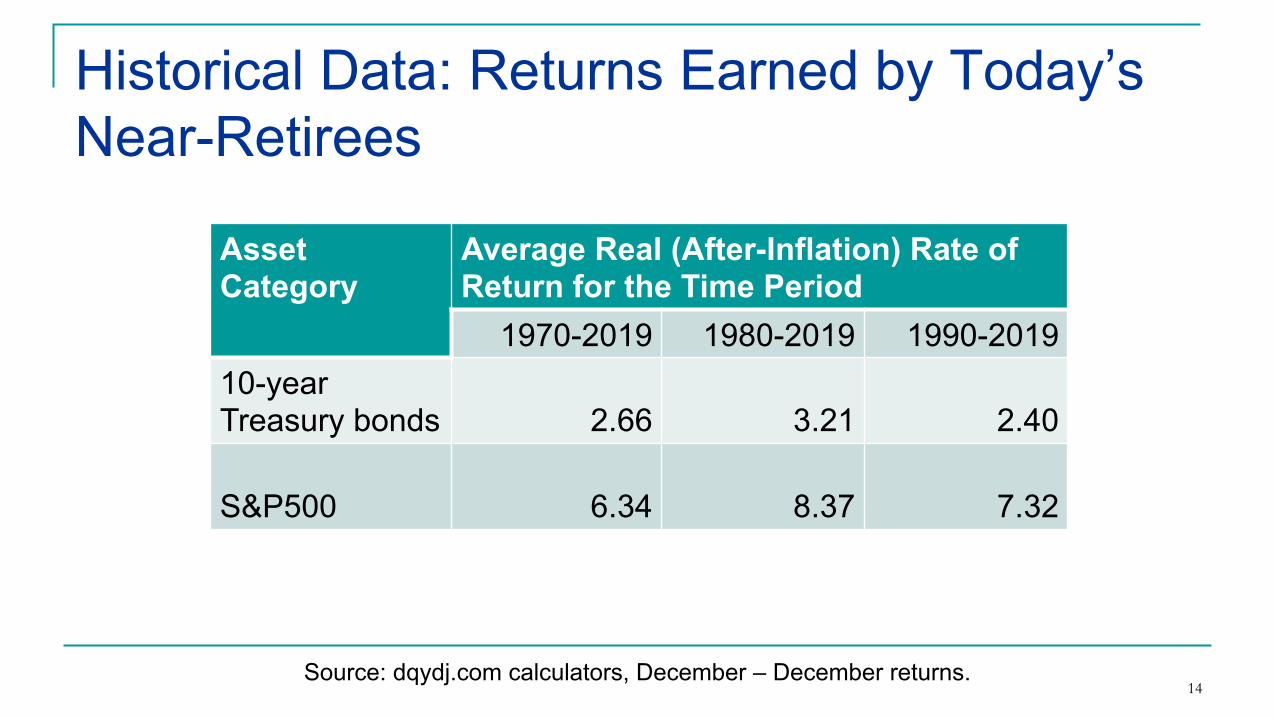
Historical Data: Returns Earned by Today’s
Near-Retirees
Asset Category
Average Real (After-Inflation) Rate of Return for the Time Period
1970-2019 1980-2019 1990-2019
10-year Treasury bonds
2.66
3.21
2.40
S&P500
6.34
8.37
7.32
14 Source: dqydj.com calculators, December – December returns.
Why Are Riskless Returns so Low?
n Global savings glut
n Scarcity of safe assets
n Changing risk profile of Treasury Bonds
n Expansionary Fed policy
15

Adaptation Strategies for Low-Return
Environment
n Raise saving rates
n Work longer: Double effect, more saving &
shorter payout period
n Reach for yield: Take on additional risk
n Intergenerational risk-sharing?
16
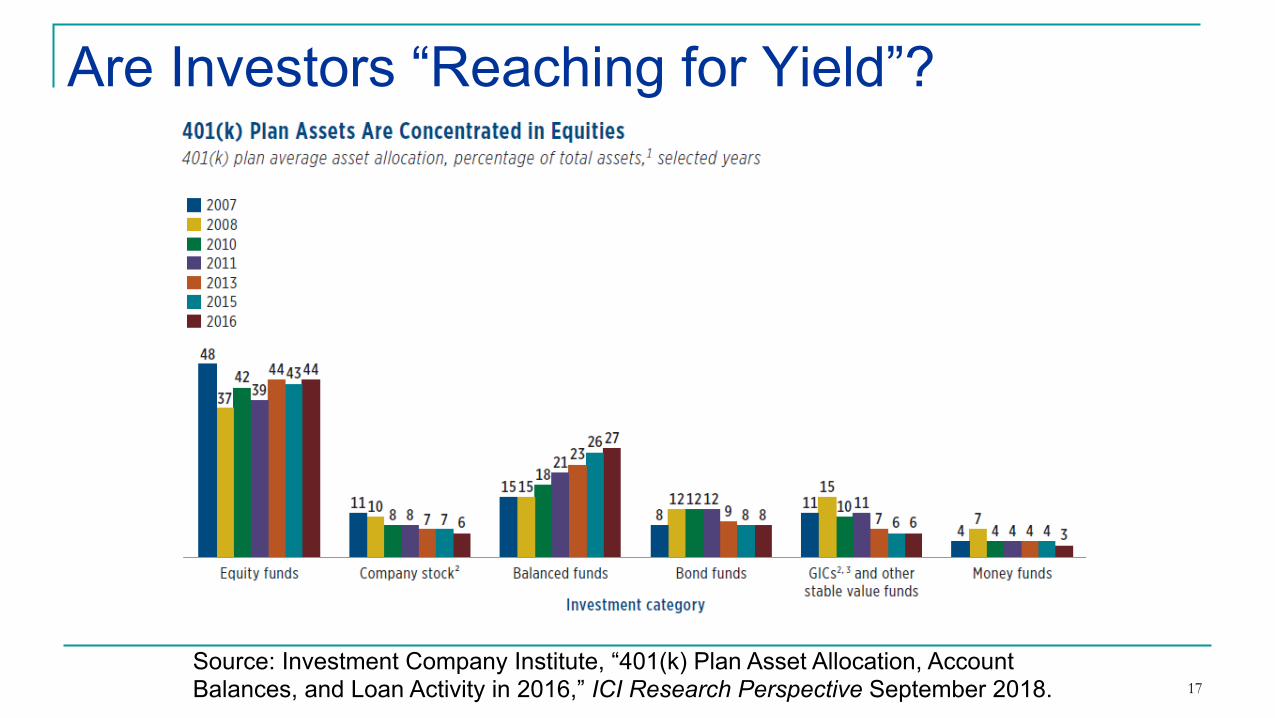
Are Investors “Reaching for Yield”?
17
Source: Investment Company Institute, “401(k) Plan Asset Allocation, Account Balances, and Loan Activity in 2016,” ICI Research Perspective September 2018.
Longer Lives Make Lower Returns Even
More Challenging
n Life expectancy at age 65 has been rising
n Disparities across the socio-economic
spectrum are pronounced
18

Married Couple Longevity @ 65
Poor Health Average Health Excellent Health
Either
Alive
Both
Alive
Either Both Either Both
75 97% 69% 98% 75% 99% 79%
85 78 28 84 36 89 44
90 55 11 66 17 74 24
95 29 2 39 4 49 8
100 9 0 15 1 21 1
19
Source: www.longevityillustrator.org assuming married non-smoker couple both born 1/1/55.
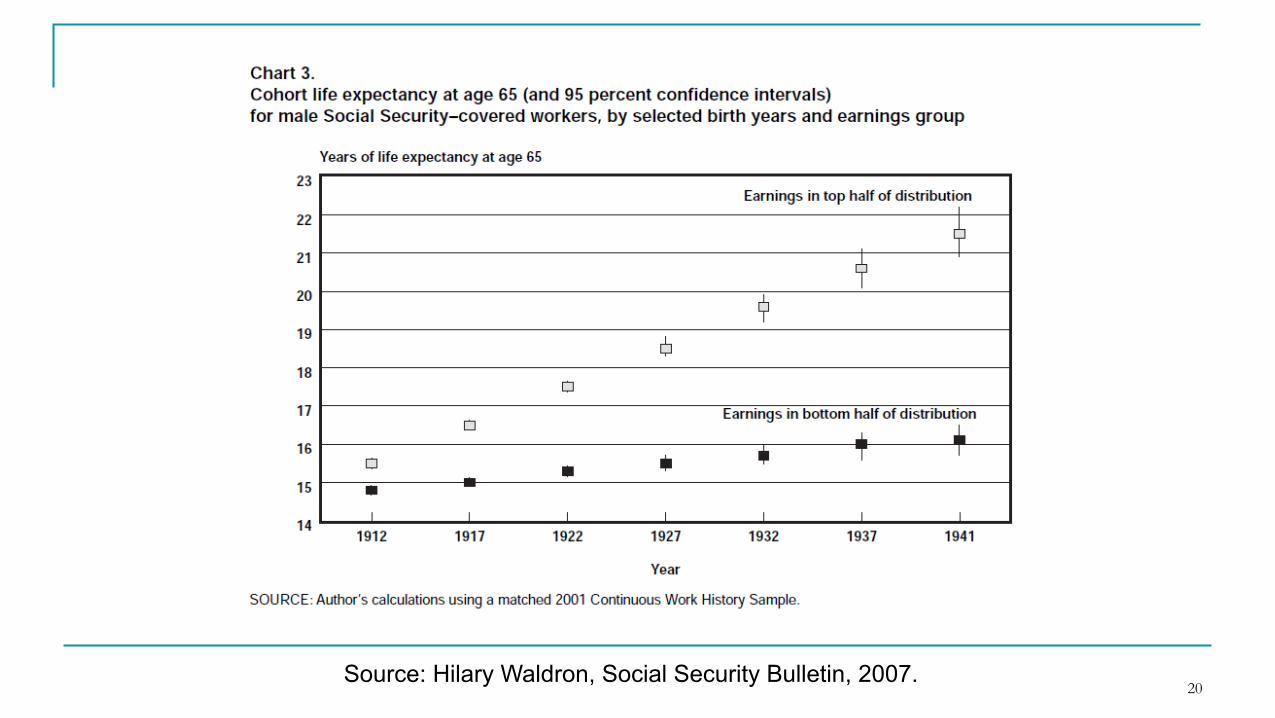
20 Source: Hilary Waldron, Social Security Bulletin, 2007.

Alice Henriques Volz
Principal Economist
Federal Reserve Board

Dispari'es in Re'rement Wealth
AliceHenriquesVolz
FederalReserveBoard
October20,2020
2020CRIAnnualPolicyInnova2onForum
Theanalysisandconclusionssetfortharethoseoftheauthorsanddonot
indicateconcurrencebyothermembersoftheresearchstaffortheBoardofGovernors.

Avenues to Save for Re'rement
• Individualsaccessthroughemployerprovidedplansandindividualre2rementaccounts(IRAs)
• LaSerrequiresindividualac2ontosetup
• Individualscanbeautoenrolledintheformer
• Limitstocontribu2onsintaxpreferredre2rementsavings
• Definedbenefitplansarelessprominentbuts2llsignificantresourceforthoseinandapproachingre2rement
• Householdscansaveoutsideofpreferredaccountstofundtheirconsump2oninre2rement

Overview
• Lookatpar2cipa2oninre2rementsavingsbyage,sexandrace/ethnicity
• UseSurveyofConsumerFinances• Crosssec2onal,triennialsurveyonhouseholdbalancesheets(1989-2019)
• Collectsdataonhouseholdassets,debts,incomeanddemographics
• SeeBhuSaetal(2020)foroverviewof2019survey
• Definedbenefitassetes2matesfromSabelhausandVolz(2019)

Gender dispari'es partly reflect employment choices
• ASachmenttolabormarketisbestwaytomaximizebenefitsoftaxpreferredre2rementsavings
• Genderdifferencesinlaborforcepar2cipa2on
• Re2rementassetscanbeexaminedwithinamarriedcouple,duetoindividualownershipofplansandaccounts
• Furtherchallengeiswomen’slongerlifeexpectancyrela2vetomen

Men are more likely to have re'rement plan
50%
55%
60%
65%
70%
75%
80%
2007 2019
%withAnyRe2rementPlan,ages35-49
Men
Women
50%
55%
60%
65%
70%
75%
80%
2007 2019
%withAnyRe2rementPlan,ages50-64
Men
Women

Men have more assets in re'rement savings (DB assets in blue, DC in orange)
$0
$50,000
$100,000
$150,000
$200,000
$250,000
$300,000
$350,000
Meanre2rementassetsinDBandDCplans,ages35-49
Women
2007 2019
MenMen
Women
$0
$50,000
$100,000
$150,000
$200,000
$250,000
$300,000
$350,000
Meanre2rementassetsinDBandDCplans,ages50-64
2007
Women
Women
Men
Men
2019

Compare across race and ethnicity groups
• Raceandethnicityisofthesurveyrespondent,noteachindividualinfamily
• Therehavebeensmallchangesover2meinsizeofeachrace/ethnicitygroup(i.e.Blackfamilieswere12%ofsamplein2007and14%in2019)
Racial dispari'es can also reflect employment histories
• CurrentemploymentstatusandeverhadFTjob• Blackhouseholdshavelowerlaborforcepar2cipa2onandfeweryearsoffull2meworkthanwhiteandHispanicfamilies
• Typeofjobsthatofferre2rementplans

White families are more likely to have a re'rement plan compared to Black and Hispanic families
0%
10%
20%
30%
40%
50%
60%
70%
80%
90%
100%
2007 2019
%withanyre2rementplan,ages35to49
White Black Hispanic
0%
10%
20%
30%
40%
50%
60%
70%
80%
90%
2007 2019
%withanyre2rementplan,ages50to64
White Black Hispanic
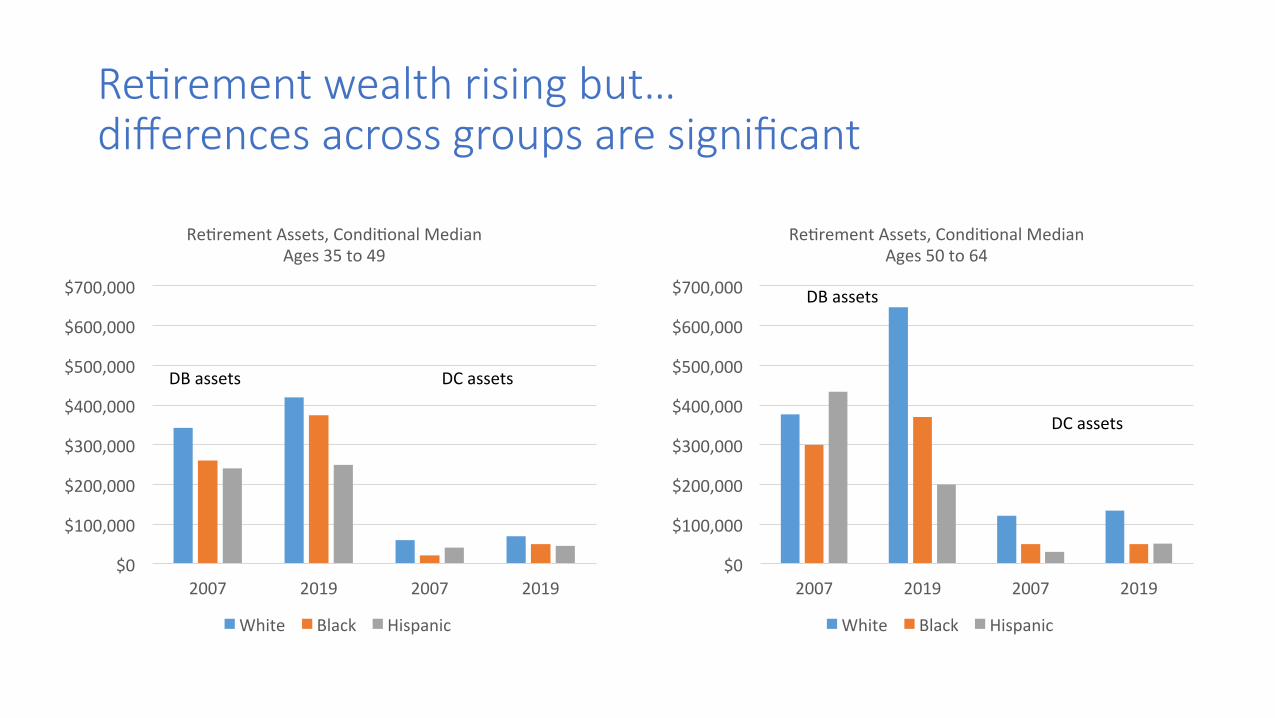
Re'rement wealth rising but… differences across groups are significant
$0
$100,000
$200,000
$300,000
$400,000
$500,000
$600,000
$700,000
2007 2019 2007 2019
Re2rementAssets,Condi2onalMedianAges35to49
White Black Hispanic
DCassets
$0
$100,000
$200,000
$300,000
$400,000
$500,000
$600,000
$700,000
2007 2019 2007 2019
Re2rementAssets,Condi2onalMedianAges50to64
White Black Hispanic
DCassets
DBassets
DBassets
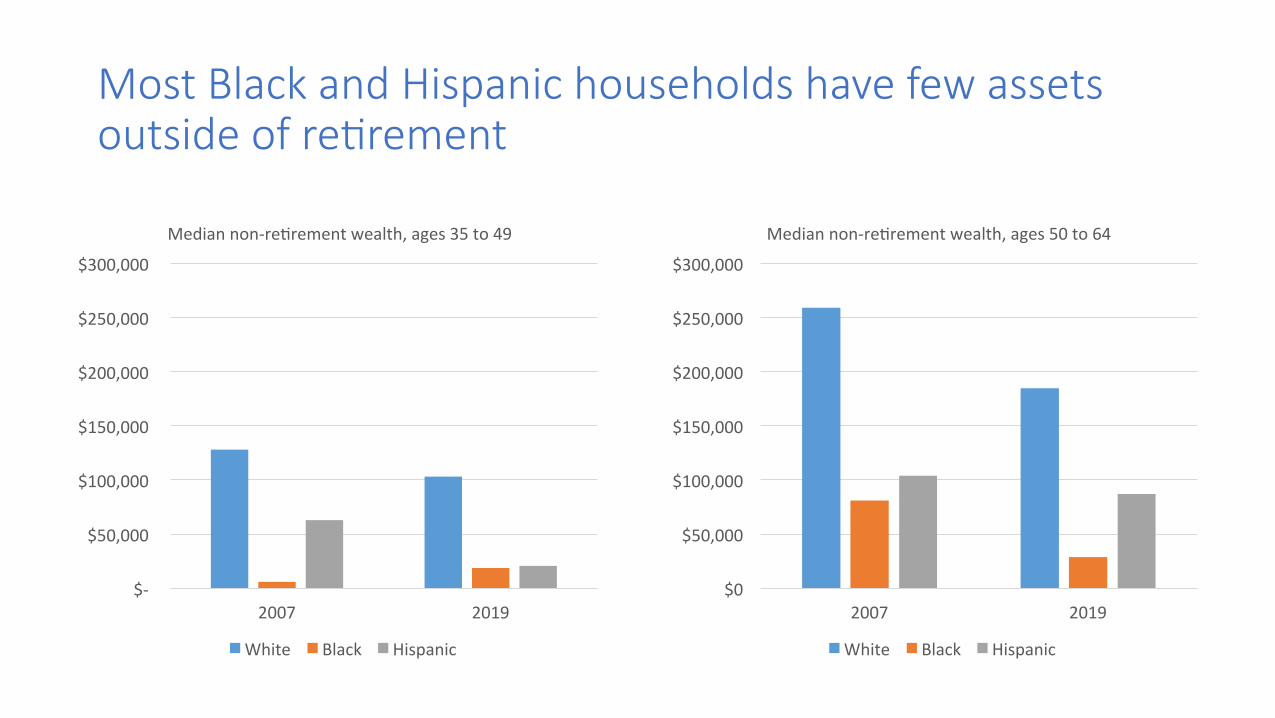
Most Black and Hispanic households have few assets outside of re'rement
$-
$50,000
$100,000
$150,000
$200,000
$250,000
$300,000
2007 2019
Mediannon-re2rementwealth,ages35to49
White Black Hispanic
$0
$50,000
$100,000
$150,000
$200,000
$250,000
$300,000
2007 2019
Mediannon-re2rementwealth,ages50to64
White Black Hispanic

Can’t forget Social Security
• GivenprogressivenatureofSocialSecurityprogram,BlackandHispanichouseholdsrelyrela2velymorethanwhitefamiliestofundre2rementconsump2on
• IncludingSocialSecurityinassessmentofre2rementprepara2onsuggestsBlackandHispanicsmaybemorereadyforre2rementthanifweonlylookatprivatere2rementwealth
• SocialSecurityprovidesgoodlongevityprotec2onforwomen
• Withincreasedlaborforcepar2cipa2onover2me,womenwillbelessreliantonhusband’schoicesandSocialSecuritybenefitsinre2rement
Takeaway
• Mostre2rementsavingsaccessedthroughemployer
• BlackandHispanichouseholdsandwomenhavelessaccess
• Approximately1/3householdshaveno“re2rement”savings
• Slightlylowerpar2cipa2onin2019comparedto2007butmoreassetsaccumulatedoverall
• Alotofhouseholdshave*no*re2rementsavings,thesehouseholdshavelowerwealththanthosewithre2rementsavings

Michael Kreps
Principal
Groom Law Group
36
Legislation
• Multiemployer pensions • Butch Lewis Act, HEROES Act
• Universal coverage • E.g., Automatic IRA, Automatic Retirement Plan Act, State programs
• Retirement tax incentives • “Equalization”
• SECURE Act II / Portman-Cardin
37
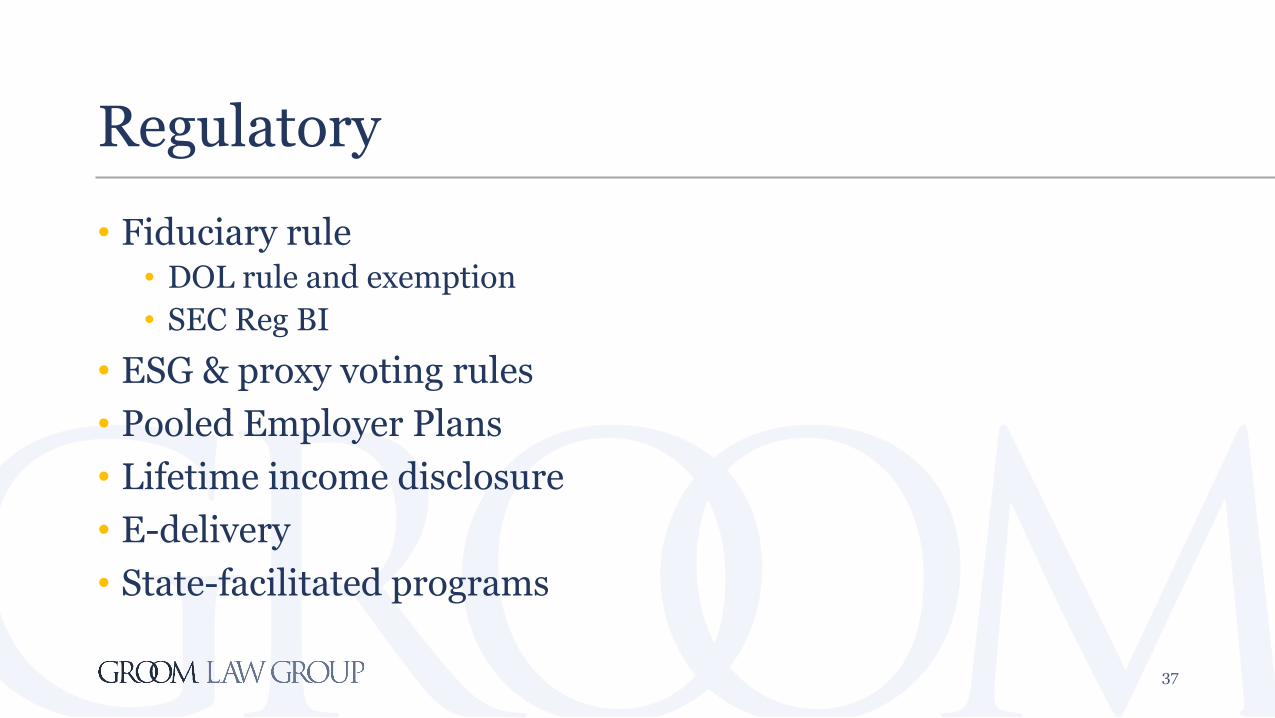
Regulatory
• Fiduciary rule • DOL rule and exemption
• SEC Reg BI
• ESG & proxy voting rules
• Pooled Employer Plans
• Lifetime income disclosure
• E-delivery
• State-facilitated programs
Preston Rutledge
Founder
Rutledge Policy Group LLC
600 New Jersey Avenue, NW, 4th floor | Washington, DC 20001 | 202-687-4901
cri.georgetown.edu
Angela M. Antonelli Research Professor
Executive Director, Center for Retirement Initiatives [email protected]
Follow us on social media for updates: