
Rehabilitation of Waste Landforms Consolidated Minerals ...
90
Rehabilitation of Waste Landforms Consolidated Minerals Limited Woodie Woodie Manganese Operation September 2010 Landloch Pty Ltd Contact: Evan Howard [email protected]
Transcript of Rehabilitation of Waste Landforms Consolidated Minerals ...

Rehabilitation of
Waste Landforms
Consolidated Minerals Limited
Woodie Woodie Manganese
Operation
September 2010
Landloch Pty Ltd Contact: Evan Howard

© Landloch Pty Ltd
© 2010 Landloch Pty Ltd
All rights reserved.
This report is copyright. Apart from any use as permitted under the Copyright Act 1968, all other rights are reserved.
Requests and inquiries concerning reproduction and rights should be addressed to Landloch at [email protected].
To reference this report:
Landloch Pty Ltd (2010), Rehabilitation of waste landforms. Report prepared for Consolidated Minerals Ltd.
Landloch Pty Ltd
A.C.N. 011 032 803
A.B.N. 29011032803
TOOWOOMBA OFFICE
PO Box 57
HARLAXTON QLD 4350
Phone (07) 4613 1825
Fax (07) 4613 1826
PERTH OFFICE
PO Box 5175
SOUTH LAKE WA 6164
Phone (08) 9417 3733
Fax (08) 9417 3744
Web site: www.landloch.com.au
Email: [email protected]
Disclaimer: All care and diligence has been exercised in testing, interpreting data and the development of recommendations
presented in this report. The monitoring and testing have been undertaken in a skilled, professional manner, according to
accepted practices. Specific circumstances and research findings after the date of publication may influence the accuracy of
the data and recommendations within this report.
The landscape is not uniform. Because of this non-uniformity, no monitoring, testing or sampling technique can produce
completely precise results for any site. Any conclusions based on the monitoring and/or testing presented in this report can
therefore only serve as a ‘best’ indication of the environmental condition of the site at the time of preparing this document. It
should be noted that site conditions can change with time.
The information that comprises this report should only be used within the limitations stipulated in this report. Landloch does
not accept any risks and responsibilities for losses, damages, costs and other consequences resulting from using any
information, material and recommendations in this report.

© Landloch Pty Ltd -i-
TABLE OF CONTENTS
EXECUTIVE SUMMARY ........................................................................................... 3
1 BACKGROUND .................................................................................................. 6
1.1 WOODIE WOODIE MANGANESE OPERATION ......................................................... 6
1.2 ENVIRONMENTAL CONTEXT ................................................................................. 9
1.2.1 Climate ..................................................................................................... 9
1.2.2 Soils and landform .................................................................................. 10
1.2.3 Mining wastes and existing waste landforms .......................................... 11
2 REHABILITATION EXPECTATIONS ............................................................... 14
2.1 REGULATOR‟S PERSPECTIVE ............................................................................. 14
2.2 MINING PROPONENT‟S PERSPECTIVE .................................................................. 15
3 SCOPE OF WORKS ......................................................................................... 16
4 STUDY OVERVIEW .......................................................................................... 17
4.1 MATERIALS STUDIED......................................................................................... 17
4.2 MATERIAL PROPERTIES ASSESSED ..................................................................... 17
4.3 MATERIAL ERODIBILITY ..................................................................................... 18
4.3.1 Rainfall simulation and overland flows ................................................... 18
4.4 COMPUTER SIMULATION OF RUNOFF AND EROSION FROM LANDFORM BATTERS ...... 20
4.5 COMPUTER SIMULATION OF LANDFORM EVOLUTION ............................................. 21
5 LABORATORY RESULTS ............................................................................... 22
5.1 CHARACTERISTICS OF THE FINE COMPONENT OF MATERIALS ................................ 23
5.1.1 pH1:5 and EC1:5, ...................................................................................... 23
5.1.2 Effective Cation Exchange Capacity (ECEC) ......................................... 23
5.1.3 Exchangeable Sodium Percentage (ESP) .............................................. 24
5.1.4 Particle size distribution .......................................................................... 24
5.1.5 Fertility .................................................................................................... 24
5.2 CHARACTERISTICS OF THE COARSE COMPONENT OF MATERIALS ........................... 25
5.2.1 Rock competence ................................................................................... 25
5.3 RESULTS AND OBSERVATIONS FROM RAINFALL SIMULATION AND OVERLAND FLOW
STUDIES ................................................................................................................. 26
5.3.1 Effective hydraulic conductivity (Ke) derived using simulated rain .......... 26
5.3.2 Interrill erodibility, Ki ................................................................................ 29
5.3.3 Rill erodibility (KR) and cri c) ............................................... 30
5.4 DERIVATION OF SIBERIA INPUT PARAMETERS FROM LABORATORY DATA .............. 33
5.5 MATERIALS AND THEIR USEFULNESS TO WASTE DUMP REHABILITATION ................. 34
5.5.1 Radio Hill (with fines) and Radio Hill/Topsoil mixture ............................. 34
5.5.2 Big Mack ................................................................................................. 35
5.5.3 Radio Hill rock (with fines removed) ....................................................... 35
5.5.4 Topsoil .................................................................................................... 35
5.5.5 Clay wastes (Yellow and White) ............................................................. 35
© Landloch Pty Ltd -ii-
6 WEPP RUNOFF AND EROSION SIMULATIONS ............................................ 36
6.1 SIMULATION ASSUMPTIONS ............................................................................... 36
6.2 DEFINITION OF “ACCEPTABLE” SOIL LOSS ............................................................ 37
6.3 DEFINITION OF THE MAXIMUM ALLOWABLE BATTER GRADIENT ............................... 38
6.4 TEMPORAL VARIATION IN PREDICTED RUNOFF AND EROSION ................................ 38
6.5 VARIATION IN EROSION CAUSED BY MATERIALS ................................................... 41
7 DEVELOPMENT OF STABLE SLOPE PROFILES FOR THE
GREENSNAKE DUMP ..................................................................................... 43
7.1 BERMS AND LANDFORM STABILITY ..................................................................... 43
7.2 LINEAR BATTER PROFILE – 50 M HIGH ................................................................ 43
7.3 CONCAVE BATTER PROFILE – 50 M HIGH ............................................................ 44
7.4 BATTERS FOR OTHER DUMP HEIGHTS ................................................................. 46
7.4.1 Linear batter profile ................................................................................ 46
7.5 REQUIRED DEPTH OF SHEETING MATERIAL .......................................................... 47
8 DEVELOPMENT OF STABLE SLOPE PROFILES USING BIG MACK
WASTE MATERIAL .......................................................................................... 49
8.1 10 M HIGH CONTINUOUS BATTER ........................................................................ 49
8.2 20 M HIGH CONTINUOUS BATTER ........................................................................ 50
8.3 30 M HIGH CONTINUOUS BATTER ........................................................................ 50
8.4 40 M HIGH CONTINUOUS BATTER ........................................................................ 50
8.5 50 M HIGH CONTINUOUS BATTER ........................................................................ 53
9 GENERAL LANDFORM RECOMMENDATIONS ............................................. 53
9.1 TIMING OF REHABILITATION WORKS .................................................................... 53
9.2 FERTILISER APPLICATION .................................................................................. 53
9.3 REHABILITATION REQUIREMENTS FOR SPECIFIC WASTE TYPES .............................. 54
9.3.1 Dispersive and potentially saline clay wastes ......................................... 54
9.3.2 Non-dispersive wastes ........................................................................... 54
9.4 LANDFORM TOPS AND BUNDING ......................................................................... 54
9.4.1 Perimeter and cross bunding .................................................................. 55
9.5 BATTER SLOPES ............................................................................................... 57
9.6 DUMP CONSTRUCTION ...................................................................................... 57
9.7 SHEETING BATTER SLOPES WITH ROCK ARMOUR ................................................. 58
9.8 LANDFORM SHAPE ............................................................................................ 58
10 REFERENCES.................................................................................................. 59
11 DISCLAIMER .................................................................................................... 62
12 GLOSSARY OF TERMS .................................................................................. 63
APPENDIX A: LANDFORMS INSPECTED BY LANDLOCH DURING SITE
INSPECTION .................................................................................................... 64
APPENDIX B: MATERIAL CHARACTERISATION DATA ...................................... 67
APPENDIX C: GENERATION OF A WEPP CLIMATE SEQUENCE FOR
WOODIE WOODIE ........................................................................................... 71

© Landloch Pty Ltd -3-
EXECUTIVE SUMMARY Consolidated Minerals Limited (CML) seeks to improve their management of waste dump rehabilitation by aiming to consistently achieve successful rehabilitation that thoroughly considers material properties and regulatory requirements. Consequently, Landloch Pty Ltd was engaged by CML to characterise materials for properties important to landform stability and rehabilitation, including basic chemical and physical properties; competency and persistence of rock within the blocky wastes; dispersion potential; and material erodibility and infiltration properties. These characteristics were used to develop specific landform designs for dumps containing clay wastes and other wastes. Designs considered batter slope profiles for a range of dump heights from 10-50 m; maximum stable batter heights; rock armouring requirements; landform requirements for the top of waste dumps. Long-term evolution modelling was also conducted on the Greensnake waste dump batter profile to investigate the long term stability of this waste landform and determine the depth of material required to sheet the potentially dispersive and erodible underlying clay wastes. Studies were carried out on 7 different materials:
1) Topsoil from Greensnake; 2) Yellow clay waste from Greensnake; 3) White clay waste from Greensnake; 4) Chert breccia dominated waste from Big Mack that contained both small
rock and fines; 5) Rocky waste material from Radio Hill that contained fines and a high
proportion of rock; 6) Radio Hill waste rock with particles with diameters <16 mm removed; and 7) Radio Hill rock (fines removed) mixed with topsoil from Greensnake.
The suitability of the 7 materials can be summarised as follows:
Topsoil by itself is highly erodible and not suitable for use on the typical slope lengths used at Woodie Woodie.
The clay wastes are unsuitable for placement near the waste dump surface due to their basic characteristics and erosion characteristics.
Chert breccia is moderately erosion resistant and suitable for use when fertilised.
Rock from Radio Hill is competent and highly erosion resistant, but lacks fine-grained particles that hold moisture and nutrients.
Radio Hill rock with fines or mixture of Radio Hill rock with soil are the most suitable materials assessed for use in waste dump rehabilitation activities.
© Landloch Pty Ltd -4-
Batter profile designs were developed for the chert breccia material (from Big Mack), and a mixture of Radio Hill rock and topsoil. Key characteristics of dump rehabilitation are as follows:
Linear or concave batter profiles are recommended. Use of multiple linear batters separated by berms (current practice) is not recommended, as it greatly increases the risk of both tunnel erosion and the development of gullies through concentration of surface water flow.
Soils are highly erodible, and use of rock as armouring is required, even for batters with relatively low height.
The Greensnake dump requires sheeting with a 50:50 mixture of soil and rock to a depth of 400 mm. This will form the growth media layer.
Erosion potential is greatest during the wetter months of December to March and rehabilitation works should be scheduled to finish no later than November each year.
Successful and rapid re-establishment of native vegetation will require fertiliser application. Likely fertiliser requirements are not high, with requirements supplied through application of 100-150 kg/ha of DAP (diammonium phosphate) and 1 t/ha of gypsum (1 t/ha).
For batters constructed from clay wastes, amendment of the clay wastes with gypsum at a rate of 2 t/ha to a depth of 300 mm is recommended prior to spreading the sheeting material.
It is crucial that runoff be retained on the top of the rehabilitated landform dump top. Perimeter bunding should be designed to cope with a maximum ~320 mm depth of rain falling in a 72 hour period. The perimeter bunds should be:
At least 1 metre high;
Thoroughly compacted and constructed of stable material;
Have their outer face continuous with the outer batter profile and have the same surface treatments applied to it;
Have a width across the top of the bund of at least 2 m; and
Have their inner face sloping gradually inwards at a gradient of 1V:10H.
Cross-bunding the dump top will prevent large flow concentrations, and should be constructed such that:
Compacted bunds are 0.75 m high and 2 m wide across the top
Cells of 1-3 ha in area are created on the top of the landform;
The land surface within each cell is as close to level as possible; and
Surface ripping will hold rainfall excess close to its point of origin.
To maximise infiltration into the dump top it is recommended that the dump top is amended with gypsum at a rate of 5 t/ha, and ripped with tines on a <1 m spacing to the greatest depth possible, prior to spreading soil. Soil should then be spread to a depth of 200 mm and vegetation seeded, with the seeding mix focussing on deep-rooted and perennial species.

© Landloch Pty Ltd -5-
For dump tops only, greater depths of rip lines (and heights of mounds between them) can be tolerated, as there is not the concern of rip lines increasing the distance between rill lines.
For batter slopes it is critical that flow concentration be minimised. Concentration of overland flow can be prevented by minimising the size of cross-slope rip lines, and maximising surface coverage by rock. Rip lines should be no deeper than 200 mm.
Dozers are less successful at cross-ripping on-contour when the dozer works around corners, irrespective of the skill of the operator. Not surprisingly, the problem is accentuated when the corner is sharp. Ideally, all corners should have a radius of curvature of at least 100 m.
Batters being sheeted with a rock/soil mixture must use rock with a D50 of ~75-100 mm and a rock particle density >2.7 g/cm³.Sufficient rock should be added such that >20-30% cover is achieved. A sufficiently thick layer (400mm) of rock/topsoil mixture should be applied to reduce the risk of exposure of the underlying clay waste.
If possible, equipment used for rehabilitation works should have precision guidance systems installed. Operators should be highly skilled and experienced. Rehabilitation earthworks require great precision and adherence to the specified designs if successful rehabilitation is to be achieved.
© Landloch Pty Ltd -6-
1 BACKGROUND
1.1 Woodie Woodie Manganese Operation
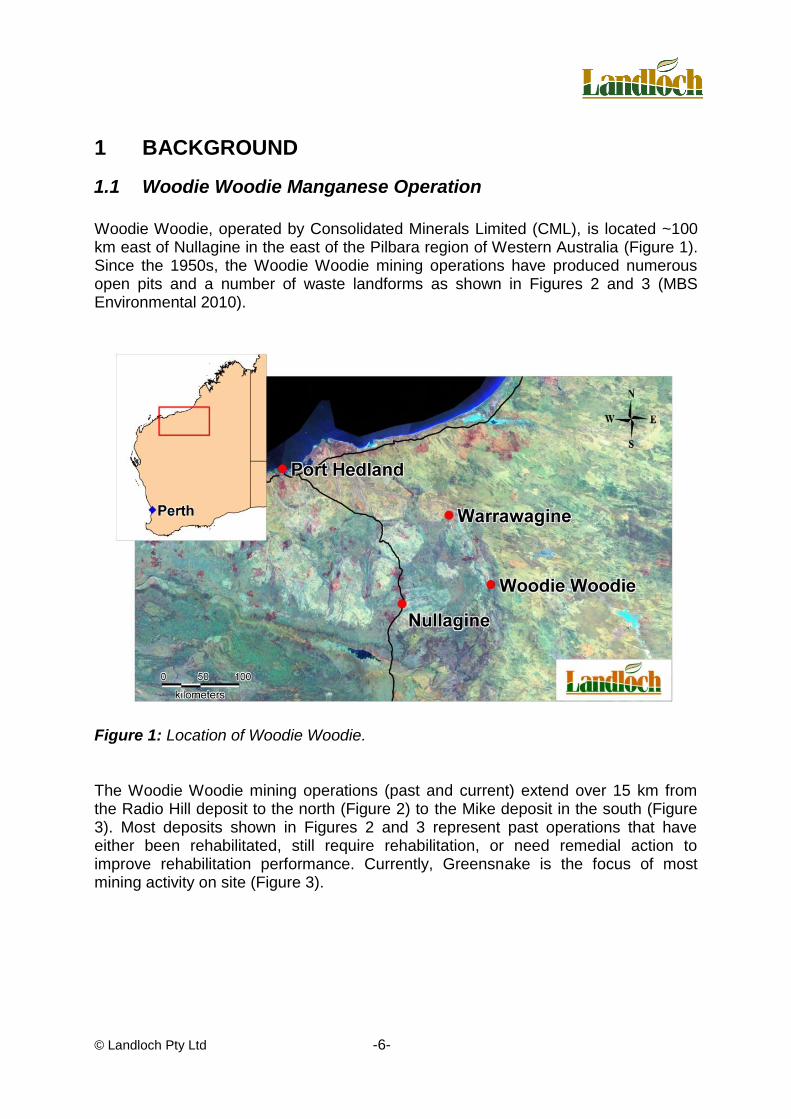
Woodie Woodie, operated by Consolidated Minerals Limited (CML), is located ~100 km east of Nullagine in the east of the Pilbara region of Western Australia (Figure 1). Since the 1950s, the Woodie Woodie mining operations have produced numerous open pits and a number of waste landforms as shown in Figures 2 and 3 (MBS Environmental 2010).
Figure 1: Location of Woodie Woodie. The Woodie Woodie mining operations (past and current) extend over 15 km from the Radio Hill deposit to the north (Figure 2) to the Mike deposit in the south (Figure 3). Most deposits shown in Figures 2 and 3 represent past operations that have either been rehabilitated, still require rehabilitation, or need remedial action to improve rehabilitation performance. Currently, Greensnake is the focus of most mining activity on site (Figure 3).

© Landloch Pty Ltd -7-
Figure 2: Northern mining deposits of Woodie Woodie.

© Landloch Pty Ltd -8-
Figure 3: Southern mining deposits of Woodie Woodie.
© Landloch Pty Ltd -9-
Landloch inspected several waste landforms as part of a site inspection on 16-17 September, 2009 (Landloch 2009a). The success of rehabilitation was observed to vary greatly. Rehabilitation of some landforms is relatively successful, with batters being erosionally stable and supporting vegetation. Unsuccessful rehabilitation is characterised by actively eroding batters, sparse or non-existent vegetation, or a combination of these. Problems with rehabilitation at this site are a result of:
Properties of the materials, particularly for dumps containing clay wastes;
The way materials were handled and placed within the waste landforms;
The adopted shape of the rehabilitated landform; and
Inappropriate rehabilitation practices.
1.2 Environmental context
1.2.1 Climate
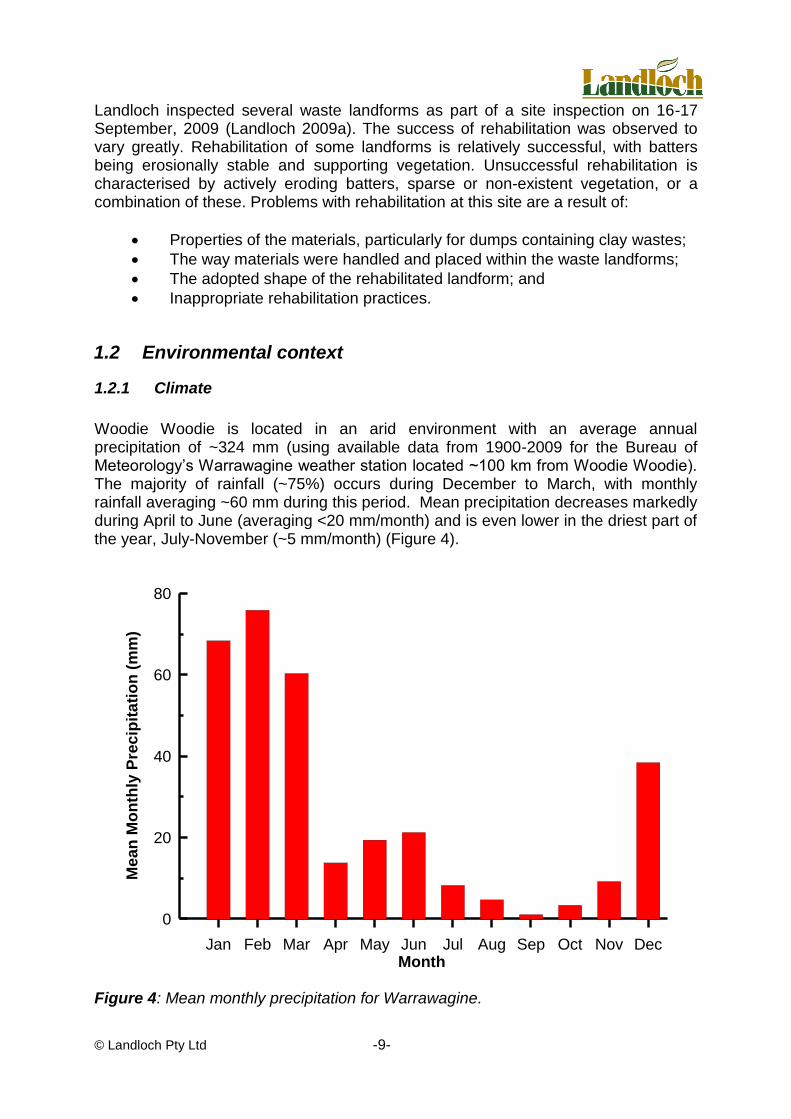
Woodie Woodie is located in an arid environment with an average annual precipitation of ~324 mm (using available data from 1900-2009 for the Bureau of Meteorology‟s Warrawagine weather station located ~100 km from Woodie Woodie). The majority of rainfall (~75%) occurs during December to March, with monthly rainfall averaging ~60 mm during this period. Mean precipitation decreases markedly during April to June (averaging <20 mm/month) and is even lower in the driest part of the year, July-November (~5 mm/month) (Figure 4).
Jan Feb Mar Apr May Jun Jul Aug Sep Oct Nov DecMonth
0
20
40
60
80
Mean
Mo
nth
ly P
recip
ita
tio
n (
mm
)
Figure 4: Mean monthly precipitation for Warrawagine.
© Landloch Pty Ltd -10-
Annual rainfall in the Pilbara region is highly variable, largely associated with sporadic cyclonic rainfall/tropical lows generating large or extreme rainfall events in any given year, whilst little rainfall can occur in other years. The average rainfall for the driest 10% of years is 149 mm whilst 536 mm falls on average in the wettest 10% of years. With the cyclone season from November to May, it is reasonable to assume that there is an increased likelihood of extreme rainfall events occurring during that season. This markedly increases the erosion potential at the Woodie Woodie mine site due to the impacts of high intensity rainfall and prolonged runoff. Thus extreme rainfall events pose the highest risk to landform failure.
1.2.2 Soils and landform
Woodie Woodie is predominantly located within the Coongimah Land System (Van Vreeswyk et al. 2004). The landform of the Woodie Woodie region is dominated by plateaux and hillcrests (~30%) with relief of ~80 m, gently inclined stony footslopes (~20%) extending from the plateaux and hillcrests, and merging into level stony plains (~32%) with relief of up to 40 m. Small areas of drainage lines (~15%) and sand plains (~3%) also exist. Soils within the Coongimah Land System – separated by location within the landscape – are broadly characterised as:
Plateaux and hillcrests – Stony shallow sands with abundant pebbles, cobbles, and stones on the surface, and frequent bedrock outcrops.
Footslopes and stony plains – Shallow loam soils with abundant pebbles and cobbles on the surface.
Drainage lines – Deeper river bed soils containing higher clay content than soils located higher in the landscape.
Sandplains – Shallow sands.
1.2.2.1 Differences between natural and constructed landforms
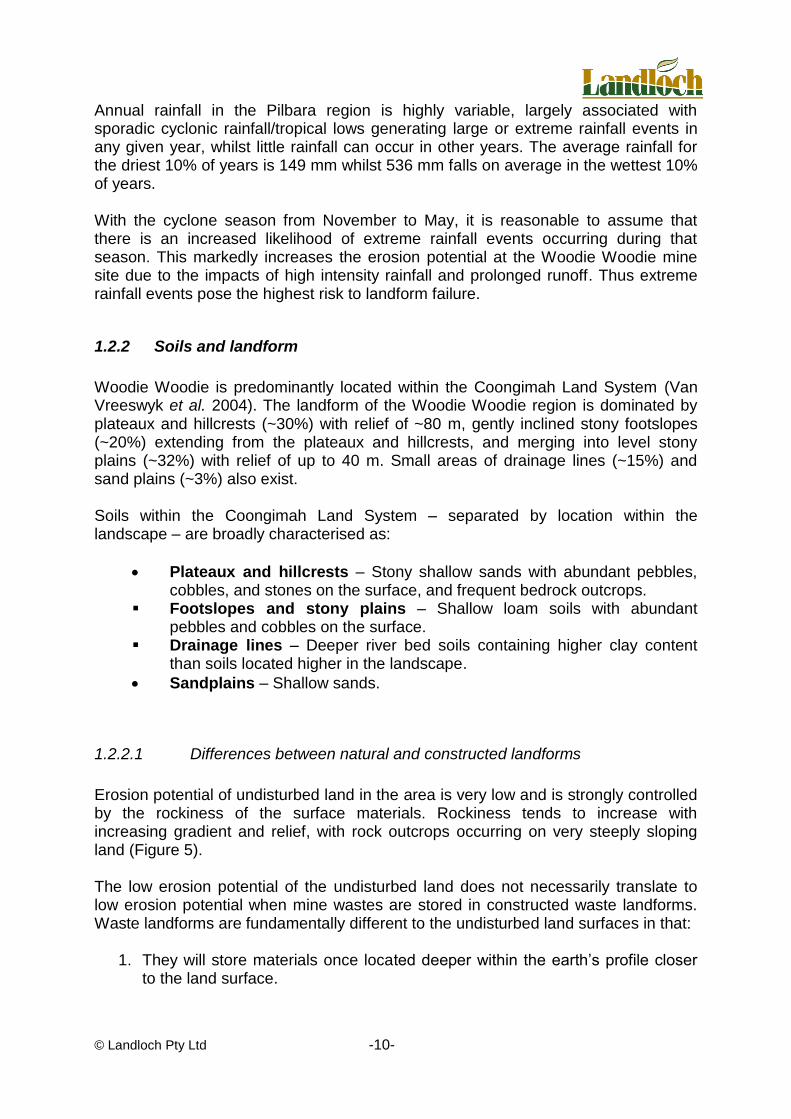
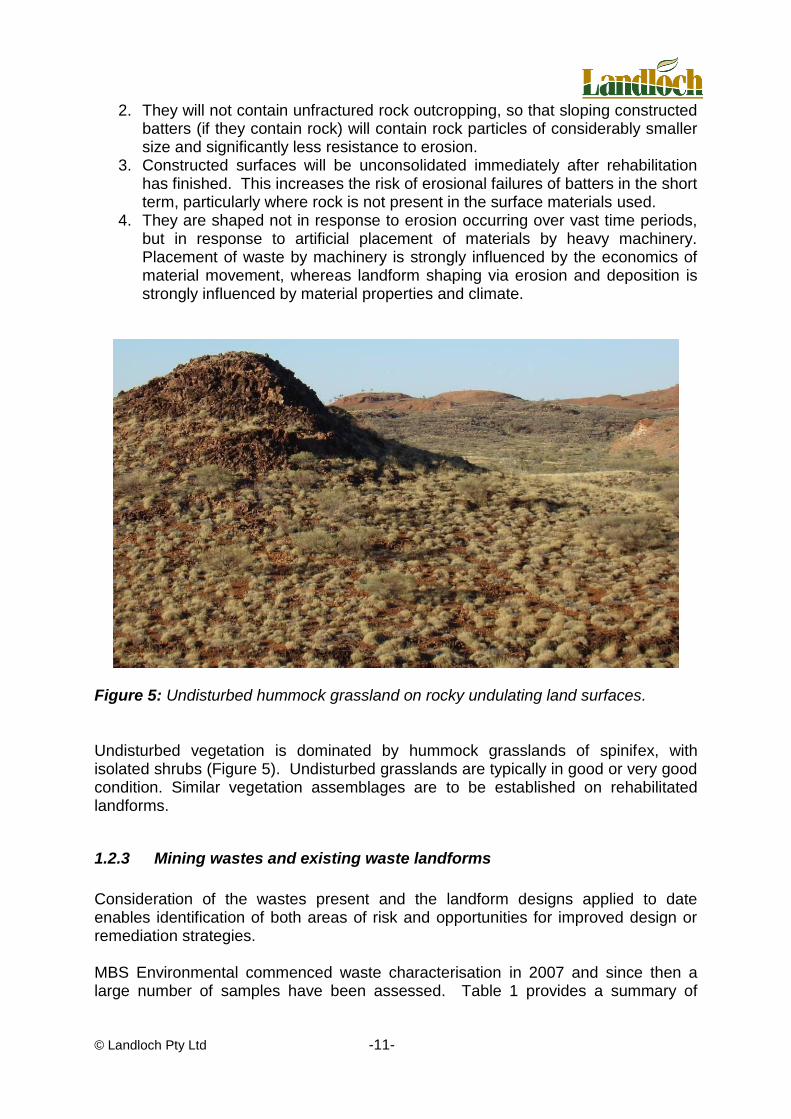
Erosion potential of undisturbed land in the area is very low and is strongly controlled by the rockiness of the surface materials. Rockiness tends to increase with increasing gradient and relief, with rock outcrops occurring on very steeply sloping land (Figure 5). The low erosion potential of the undisturbed land does not necessarily translate to low erosion potential when mine wastes are stored in constructed waste landforms. Waste landforms are fundamentally different to the undisturbed land surfaces in that:
1. They will store materials once located deeper within the earth‟s profile closer to the land surface.
© Landloch Pty Ltd -11-
2. They will not contain unfractured rock outcropping, so that sloping constructed batters (if they contain rock) will contain rock particles of considerably smaller size and significantly less resistance to erosion.
3. Constructed surfaces will be unconsolidated immediately after rehabilitation has finished. This increases the risk of erosional failures of batters in the short term, particularly where rock is not present in the surface materials used.
4. They are shaped not in response to erosion occurring over vast time periods, but in response to artificial placement of materials by heavy machinery. Placement of waste by machinery is strongly influenced by the economics of material movement, whereas landform shaping via erosion and deposition is strongly influenced by material properties and climate.
Figure 5: Undisturbed hummock grassland on rocky undulating land surfaces. Undisturbed vegetation is dominated by hummock grasslands of spinifex, with isolated shrubs (Figure 5). Undisturbed grasslands are typically in good or very good condition. Similar vegetation assemblages are to be established on rehabilitated landforms.
1.2.3 Mining wastes and existing waste landforms
Consideration of the wastes present and the landform designs applied to date enables identification of both areas of risk and opportunities for improved design or remediation strategies. MBS Environmental commenced waste characterisation in 2007 and since then a large number of samples have been assessed. Table 1 provides a summary of

© Landloch Pty Ltd -12-
waste characteristics for several different mining prospects (MBS Environmental 2010). Table 1: Dominant waste lithologies for various mining deposits at the Woodie
Woodie mine site (adapted from MBS Environmental, 2010).
Deposit Dominant Lithologies
Chris-D Permian clay over chert
Lox Clay, chert and dolomite
Demon Chert and dolomite
Whodowe Sandstone, chert and dolomite
Greensnake Clay over brecciated chert and dolomite
Hunter Dolomite with minor clay and brecciated chert
Big Mack Chert breccia over dolomite
MC272 Clay over chert breccia
Austin Chert over dolomite
Rhodes Clay and chert over dolomite
Lucy Mack Sandstone, chert and dolomite
Mineralisation occurs within the weathered regolith and as a result, little fresh (blocky and competent) rock is extracted. Wastes are predominantly dolomite or chert breccia, though very rarely sandstones can be present. Of the various wastes recorded on site, clay wastes (waste dumps containing significant proportions of clay wastes are shaded yellow in Table 1) are characterised by:
Dispersive clay;
Low infiltration capacities;
Surface sealing; and
High potential to develop gully and tunnel erosion. These materials are problematic for rehabilitation. Their exposure near the surface of waste dumps can be expected to cause poor vegetation growth and unacceptably high erosion rates, as was observed during the 2009 site inspection undertaken by Landloch. When coupled with inappropriate management of surface water, erosion of these materials is likely to be dominated by gully and/or tunnel erosion. Appendix A provides images of waste landforms listed in Table 1 and inspected during Landloch‟s site inspection in 2009. These images highlight the problematic properties of the main waste that have adversely impacted upon the rehabilitation. Chert breccia and dolomite wastes are more competent, and are potentially useful for effective rehabilitation if placed on the soil surface, as they can supply instantaneous erosion resistance that is likely to persist. Appendix A also includes images of landforms where more competent materials are present at the surface.
© Landloch Pty Ltd -13-
The waste landform design that has been applied to existing landforms on the site includes the use of 20 m high linear batters at gradients of ~16º (~28.5%) separated by 20 m wide berms. Well-documented consequences of this approach (Vacher et al. 2004; Landloch 2006), particularly where dispersive, clay-rich wastes are present, include:
Failures of berms at points where tunnels or gullies develop;
Instability of rock drains constructed over such materials;
High levels of suspended sediment in runoff with high potential to adversely impact the receiving environment;
Creation of potentially unsafe landforms; and
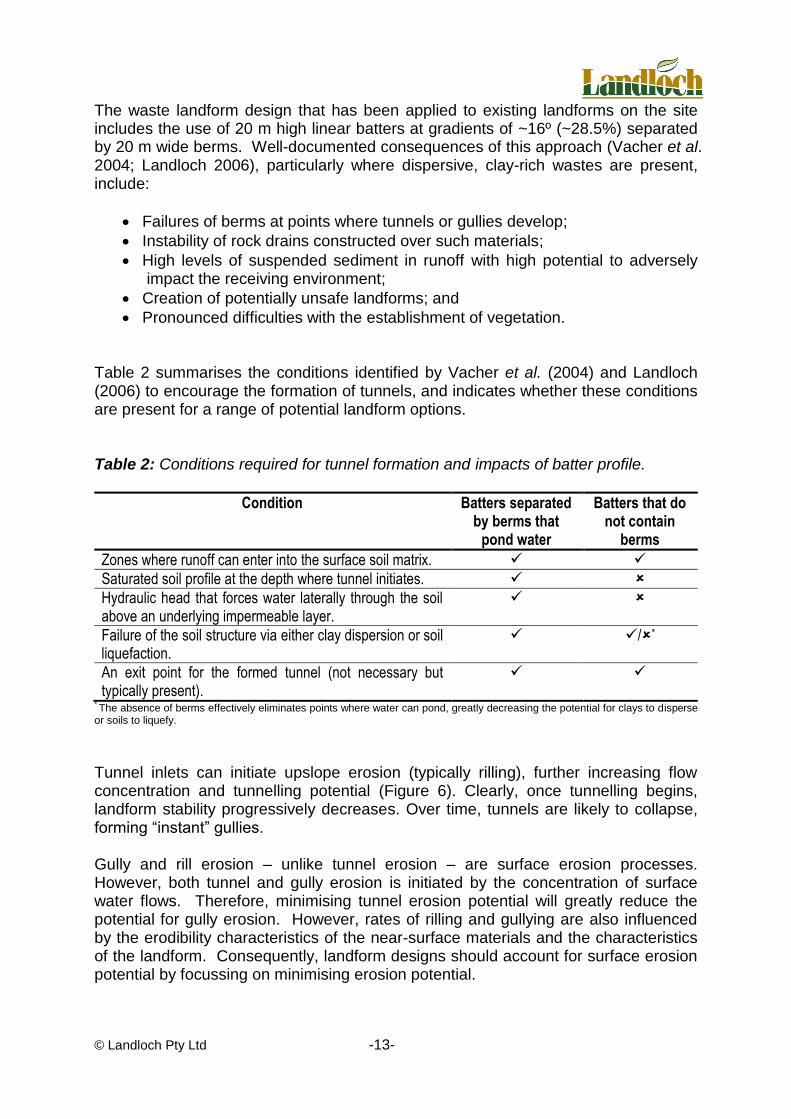
Pronounced difficulties with the establishment of vegetation. Table 2 summarises the conditions identified by Vacher et al. (2004) and Landloch (2006) to encourage the formation of tunnels, and indicates whether these conditions are present for a range of potential landform options. Table 2: Conditions required for tunnel formation and impacts of batter profile.
Condition Batters separated by berms that
pond water
Batters that do not contain
berms
Zones where runoff can enter into the surface soil matrix.
Saturated soil profile at the depth where tunnel initiates.
Hydraulic head that forces water laterally through the soil above an underlying impermeable layer.
Failure of the soil structure via either clay dispersion or soil liquefaction.
/*
An exit point for the formed tunnel (not necessary but typically present).
* The absence of berms effectively eliminates points where water can pond, greatly decreasing the potential for clays to disperse
or soils to liquefy.
Tunnel inlets can initiate upslope erosion (typically rilling), further increasing flow concentration and tunnelling potential (Figure 6). Clearly, once tunnelling begins, landform stability progressively decreases. Over time, tunnels are likely to collapse, forming “instant” gullies. Gully and rill erosion – unlike tunnel erosion – are surface erosion processes. However, both tunnel and gully erosion is initiated by the concentration of surface water flows. Therefore, minimising tunnel erosion potential will greatly reduce the potential for gully erosion. However, rates of rilling and gullying are also influenced by the erodibility characteristics of the near-surface materials and the characteristics of the landform. Consequently, landform designs should account for surface erosion potential by focussing on minimising erosion potential.

© Landloch Pty Ltd -14-
Figure 6: Diagram illustrating the tunnelling process and the morphology of tunnels
(Boucher 1990).
2 REHABILITATION EXPECTATIONS Post-mining waste dumps are recognised by both regulators and mining companies as posing a significant risk to the successful closure of a mine site.
2.1 Regulator’s perspective
The Department of Mines and Petroleum (DMP), formerly the Department of Industry and Resources (DoIR), is the lead agency for issues relating to mining and the environment. They state that waste rock landforms should be designed to “ensure that the final structure is safe, stable, and not prone to significant erosion” (DoIR 2001). The WA Environmental Protection Authority (EPA) has proposed similar standard objectives for rehabilitation of terrestrial ecosystems (EPA 2006):
Safe, stable and resilient landforms and soils;
Appropriate hydrology;
Providing visual amenity, retaining heritage values and suitable for agreed land uses;
Resilient and self sustaining vegetation of local provenance species;
Reaching agreed numeric targets for vegetation recovery; and
Comprising habitats capable of supporting all types of biodiversity. Safety of landforms is largely concerned with the integrity of the landform to contain encapsulated materials. For Woodie Woodie, these may include acid generating and

© Landloch Pty Ltd -15-
fibrous materials. Erosion processes – in particular concentrated flows causing gullying – can therefore have a significant impact on long-term landform safety if there is potential for gullies to expose encapsulated wastes. Mass failure of batter slopes is of little concern for rehabilitated landforms, particularly dumps located in arid climates evident in the eastern Pilbara and for landforms with geotechnically shallow batter gradients. Stability of landforms is fundamentally concerned with erosion processes and their impact on batter design. Development of a sustainable ecosystem requires a stable soil or growth medium layer. Without adequate depths of suitable material, there is little opportunity for vegetation to establish, vegetation assemblages to develop, and for fauna to return at closure. Therefore, Western Australian regulators‟ expectation of a safe, stable landform that can support sustainable vegetation is fundamentally related to the interactions between material properties, climate, and the way in which the waste materials are stored (landform design). Importantly, this means that waste dumps that do not meet these standards are likely to be deemed unacceptable, and regulators may insist on re-shaping and re-working of landforms until they do meet expectations.
2.2 Mining proponent’s perspective
Disturbance of land by mining typically results in environmental performance bonds being placed on the mining company that estimate the relative cost of rehabilitation for different landforms, but not necessarily the actual cost of rehabilitation. Mining disturbances assumed to be high risk may be bonded at a higher rate than lower risk disturbances. High risk structures include waste dumps that contain problematic wastes that may be potentially acid-forming and/or highly erodible, and dumps with heights >25 m. Low risk structures include roads, pipelines, lay-down areas, and exploration involving land clearing. In Western Australia, the total amount of mining security held is estimated to be 25% of the WA mining industry‟s total rehabilitation liability (DoIR 2006). Importantly, the cost of rehabilitation can be expected to be significantly higher than the bond rate that is currently applied. Clearly, waste dump rehabilitation should be given serious consideration, with rehabilitation planning starting as early as possible to ensure that successful rehabilitation can be achieved as cost effectively as possible. In Landloch‟s experience, where rehabilitation is not properly planned, rehabilitation can become very expensive or potentially unachievable (e.g., where no growth media reserves are available). Further, decisions about landform designs can also greatly increase the costs of dump construction (as opposed to rehabilitation costs). Given the size of disturbance caused by mining and Woodie Woodie, and the fact that many wastes and dump heights would render dumps high risk, there are clear economic imperatives for Woodie Woodie to ensure that the landform design process used is not only able to establish safe and stable landforms with the ability to sustain suitable vegetation, but also to provide quantitative verification of potential stability.

© Landloch Pty Ltd -16-
3 SCOPE OF WORKS CML seeks to improve their management of waste dump rehabilitation by aiming to consistently achieve successful rehabilitation that thoroughly considers material properties and regulatory requirements. To achieve this outcome in a quantitative manner, landforms must be designed using measurable parameters to describe the prevailing climate and available materials. The approach used by Landloch provides scientifically credible designs. As well, the design process and the information provided will enable CML to objectively assess rehabilitation performance and its progress towards closure. This work can also be used in discussions with regulators regarding environmental bond relinquishment. Consequently, Landloch was engaged by CML to undertake the following tasks:
1) Material Characterisation – Characterise the representative clay, competent wastes and topsoil materials. Characterisation included assessment of basic chemical and physical properties; competency of rock within the competent wastes and their likely persistence as rock armouring; dispersion potential; and material erodibility and infiltration properties.
2) Landform Batter Designs – Develop separate landform designs for dumps
containing clay wastes and competent wastes. Designs will consider batter slope profiles for a range of dump heights from 10-50 m; maximum stable batter heights; rock armouring requirements (if needed); use of other surface treatments such as tree debris (if available); and landform requirements for the top of waste dumps.
3) Long-term Landform Evolution – Conducted solely on the Greensnake waste dump batter, this approach explores the long term stability of this waste landform; determines the depth of topsoil required to sheet the potentially dispersive and erodible underlying waste materials, and investigates likely interactions between the constructed landform and the surrounding landscape.

© Landloch Pty Ltd -17-
4 STUDY OVERVIEW
4.1 Materials studied
Studies were carried out on 7 different materials:
8) Topsoil - topsoil from Greensnake; 9) Yellow clay waste – waste material from Greensnake; 10) White clay waste – waste material from Greensnake; 11) Big Mack - Chert breccia dominated waste from Big Mack that contains
both small rock and fines; 12) Radio Hill (with fines) - waste material from Radio Hill, which contains
fines and a high proportion of rock; 13) Radio Hill Rock – Radio Hill waste rock with particle diameters <16 mm
removed; and 14) Radio Hill/Topsoil Mix – Radio Hill rock (fines removed) mixed with
topsoil from Greensnake. Based on Landloch‟s previous experience with fine-grained materials similar to the Greensnake clay wastes (yellow and white), it was anticipated that these will be the most problematic of the existing wastes to rehabilitate. The rocky Radio Hill (with fines) waste was expected to represent Woodie Woodie‟s most competent and erosion resistant material. The Big Mack material is not as rocky as Radio Hill (especially in terms of the size of rock present), and was therefore expected to represent an intermediate waste material between the fine-grained clay wastes and the rocky Radio Hill wastes.
4.2 Material properties assessed
Samples from the fine component (<2 mm) of all materials except for Radio Hill Rock and Radio Hill/Topsoil Mix, listed above in section 4.1 were sent to a commercial soil laboratory and analysed for:
Soil pH1:5;
EC1:5 as a measured of salinity;
Exchangeable cations (Ca2+, Mg2+, Na+, K+), used to calculate Exchangeable Sodium Percentage (ESP);
Effective Cation Exchange Capacity (ECEC), again used to calculate ESP;
Particle size distribution;
Total N;
Total P;
Available P (Colwell method);
Available S (KCl); and
Trace elements (Cu, Fe, Mn, Zn).

© Landloch Pty Ltd -18-
These properties were used to parameterise the runoff and erosion model, to assess the potential for these materials to disperse or liquefy, and to provide information on their suitability to support plant growth. Results from these analyses were also compared where possible with results for similar materials previously characterised by MBS Environmental (2010). The coarse components (>2 mm) of the rocky wastes (Big Mack and Radio Hill) were assessed to indicate their likely competence and rate of weathering. Properties assessed include:
Rock particle density; and
Rock water absorption.
4.3 Material erodibility
Although the concept of “erodibility” is broadly understood, its precise meaning can vary considerably within the framework of some erosion prediction models. In the Water Erosion Prediction Program (WEPP model) (Flanagan and Livingston 1995) used in designing landform batters for waste landforms presented in this report because of its detailed treatment of slope profiles and erosion responses, erodibility is described via a number of specific parameters:
Interrill erodibility (Ki);
Rill erodibility (KR);
Critical shear for rill initiation (τc); and
Effective hydraulic conductivity (Ke). The WEPP erodibility parameters were derived from data collected using laboratory-based experimental methods involving the:
Application of simulated rain to a soil or waste surface and measurement of runoff and sediment in runoff to obtain estimates of Ki and Ke; and
Application of surface water flows to obtain estimates of KR and τc.
Those parameters were then used in computer simulations of runoff and erosion in determining a range of landform design options that are presented in this report.
4.3.1 Rainfall simulation and overland flows
Loch et al. (2001) present a detailed description of the rainfall simulator configuration as used in this report (refer to Figure 7). Flat fan nozzles mounted on an oscillating manifold produce the simulated rain. Kinetic energy generated by the nozzles is ~29.5 J/m2/mm: consistent with the energy of natural rainfall at intensities >40 mm/h. The nozzles uniformly sweep back and forth across the plot, achieving good spatial distribution of the generated rainfall.

© Landloch Pty Ltd -19-
Figure 7: Laboratory-based rainfall simulator installation Interrill and rill erosion were determined by employing the following methodology:
1) Interrill erosion was measured by applying a simulated "storm" with known rainfall intensity to plots 0.75 m wide and 0.75 m long (Figure 7). Three plots of each material were run, each set to a gradient of 10%, 20%, or 30%. The rainfall intensity applied was maintained until steady runoff rates were reached. Runoff rates were measured and sediment and runoff samples taken. Any variations in the applied intensity were measured by rain gauges on the plots and accounted for in the data analysis.
2) Rill erosion was measured by applying various rates of overland flow to flumes 0.4 m wide and 2.0 m long (Figure 8). Three plots of each material type are run, with each set to a gradient of 10%, 20%, or 30%. The rate of water applied was determined using a calibrated rotameter. Samples of sediment in runoff were taken for each applied flow rate. Each flow rate was applied for a period of 5 minutes. No rainfall was used during the overland flow study.
Simulation plots
Water supply
Rainfall simulator head
unit with nozzles

© Landloch Pty Ltd -20-
4.4 Computer simulation of runoff and erosion from landform batters
The Water Erosion Prediction Program (WEPP) was used in this project for simulations of runoff and erosion. It was developed by the United States Department of Agriculture (USDA) to predict runoff, erosion, and deposition for hillslopes and watersheds. WEPP is a simulation model with a daily input time step, although internal calculations can use shorter time steps. Plant and soil characteristics important to erosion processes are updated every day. When rainfall occurs, those plant and soil characteristics are considered in determining the likelihood of any runoff. If runoff is predicted to occur, the model computes sediment detachment, transport and deposition at points along the slope profile. The erosion component of the WEPP model uses a steady-state sediment continuity equation as the basis for the erosion computations. Soil detachment in interrill areas is calculated as a function of the effective rainfall intensity and runoff rate. Soil detachment in rills is predicted to occur if the flow hydraulic shear stress is greater than the soil‟s critical shear stress, and when the sediment load of the flow is below transport capacity. Deposition in rills is computed when the sediment load is greater
Figure 8: Example of flume plot setup used to apply overland flows.
Test surface
Water supply at upstream
entrance of plot
Water discharge and sampling area at
downstream end of plot

© Landloch Pty Ltd -21-
than the capacity of the flow to transport it. Adjustments to soil detachment are made in WEPP to incorporate the effects of canopy cover, ground cover, and buried residue. All WEPP simulations developed by Landloch used a 100-year stochastic climate sequence for the Woodie Woodie site.
4.5 Computer simulation of landform evolution
Long-term (hundreds of years) simulations of the impacts of erosion on a constructed landform can only be done using landform evolution models, of which the SIBERIA model (Willgoose et al. 1989, Willgoose et al. 1991) is the most developed and accepted. The SIBERIA model simulates runoff and erosion from a landform that evolves in response to predicted erosion and deposition. It is a 3-dimensional topographic evolution model, which predicts the long-term evolution of channels and hillslopes in a catchment on the basis of runoff and erosion and has been successfully applied to explain aspects of geomorphology of natural landforms (Willgoose 1994). The location and speed with which gullies develop are controlled by a channelisation function that is related to runoff and soil erodibility (Willgoose et al. 1989). The model solves for two variables:
1. Elevation, from which slope geometries are determined, and 2. An indicator function that determines where channels exist.
Channel growth is governed by an activation threshold. It is possible for a modelled surface to initially have no gullies, and for channels to develop when the activation threshold is exceeded. When the activation threshold (which depends on discharge and slope gradient) is exceeded, a channel develops. SIBERIA has been extensively used by the Supervising Scientist division of the Commonwealth Department of Environment, Water, Heritage and the Arts, and subjected to extensive validation. In general, the tests indicate that – provided the model is adequately calibrated – SIBERIA predictions appear to be reasonable (Hancock et al. 2000, Hancock et al. 2002, Hancock et al. 2003, Willgoose et al. 2003). In addition, Hancock (2004a) notes that rates of erosion predicted by SIBERIA for a catchment in the Northern Territory compared very favourably with estimates of erosion derived using the caesium-137 method for soil erosion assessment. As the two methods used completely independent input information, the agreement is particularly significant. The SIBERIA model has been widely used for assessment of the evolution of constructed landforms on a range of minesites across Australia and overseas (Willgoose 1993, Willgoose and Riley 1995, Boggs et al. 2000, Hancock et al. 2003, Hancock and Willgoose 2004, Hancock 2004b, Mengler et al. 2004, Hancock and

© Landloch Pty Ltd -22-
Turley 2006). The model is equally applicable to any climatic regime as its input parameters are derived by calibration to runoff and erosion data. SIBERIA simulations used input parameters derived from WEPP output using methods developed by Landloch in consultation with the developers of SIBERIA.
5 LABORATORY RESULTS Results outlining the chemical and physical characteristics of the materials tested are presented for both the fine component (<2 mm) of materials (Section 5.1: Tables 3-5) and the coarse component of the rocky wastes (Section 5.2: Table 6). Full characterisation data is provided in Appendix B. Furthermore, comparisons between these results and those previously obtained by both Landloch Pty Ltd (2009a) and MBS Environmental (2010) involving 10 soils and 7 wastes will also be provided. Results of the rainfall simulation and overland flow studies are outlined in Section 5.3 (Tables 7 and 8). Table 3: Chemical properties of the fine component of materials
Sample pH1:5
(-) EC1:5
(dS/m) ECEC
(meq/100g) ESP (%)
Topsoil 8.9 0.1 25.8 0.9
Yellow clay waste 9.1 2.1 24.7 45.7
White clay waste 8.6 0.1 2.6 14.6
Big Mack 8.1 0.1 3.3 5.1
Radio Hill (with fines) 9.0 0.1 8.5 3.6
Table 4: Particle size distributions of the fine component (<2 mm diameter) of
materials1
Sample Coarse sand (%)
Fine sand (%)
Silt (%)
Clay (%)
Topsoil 32 38 9 20
Yellow clay waste 12 35 15 37
White clay waste 10 20 27 41
Big Mack 51 19 15 17
Radio Hill (with fines) 41 27 11 19
1 Gravel: >2,000 m; Coarse sand: 2000-200 m; Fine sand: 200-20 m; Silt: 20-2 m; Clay: <2 m.
© Landloch Pty Ltd -23-
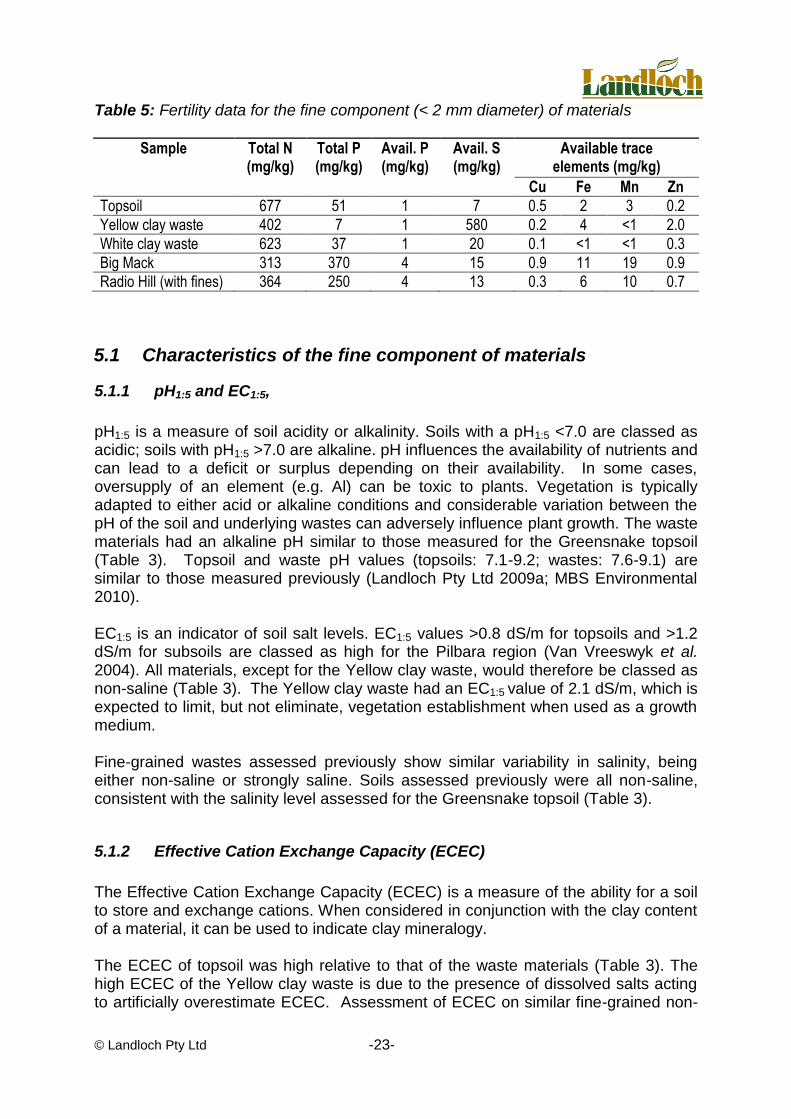
Table 5: Fertility data for the fine component (< 2 mm diameter) of materials
Sample Total N (mg/kg)
Total P (mg/kg)
Avail. P (mg/kg)
Avail. S (mg/kg)
Available trace elements (mg/kg)
Cu Fe Mn Zn
Topsoil 677 51 1 7 0.5 2 3 0.2
Yellow clay waste 402 7 1 580 0.2 4 <1 2.0
White clay waste 623 37 1 20 0.1 <1 <1 0.3
Big Mack 313 370 4 15 0.9 11 19 0.9
Radio Hill (with fines) 364 250 4 13 0.3 6 10 0.7
5.1 Characteristics of the fine component of materials
5.1.1 pH1:5 and EC1:5,
pH1:5 is a measure of soil acidity or alkalinity. Soils with a pH1:5 <7.0 are classed as acidic; soils with pH1:5 >7.0 are alkaline. pH influences the availability of nutrients and can lead to a deficit or surplus depending on their availability. In some cases, oversupply of an element (e.g. Al) can be toxic to plants. Vegetation is typically adapted to either acid or alkaline conditions and considerable variation between the pH of the soil and underlying wastes can adversely influence plant growth. The waste materials had an alkaline pH similar to those measured for the Greensnake topsoil (Table 3). Topsoil and waste pH values (topsoils: 7.1-9.2; wastes: 7.6-9.1) are similar to those measured previously (Landloch Pty Ltd 2009a; MBS Environmental 2010). EC1:5 is an indicator of soil salt levels. EC1:5 values >0.8 dS/m for topsoils and >1.2 dS/m for subsoils are classed as high for the Pilbara region (Van Vreeswyk et al. 2004). All materials, except for the Yellow clay waste, would therefore be classed as non-saline (Table 3). The Yellow clay waste had an EC1:5 value of 2.1 dS/m, which is expected to limit, but not eliminate, vegetation establishment when used as a growth medium. Fine-grained wastes assessed previously show similar variability in salinity, being either non-saline or strongly saline. Soils assessed previously were all non-saline, consistent with the salinity level assessed for the Greensnake topsoil (Table 3).
5.1.2 Effective Cation Exchange Capacity (ECEC)
The Effective Cation Exchange Capacity (ECEC) is a measure of the ability for a soil to store and exchange cations. When considered in conjunction with the clay content of a material, it can be used to indicate clay mineralogy. The ECEC of topsoil was high relative to that of the waste materials (Table 3). The high ECEC of the Yellow clay waste is due to the presence of dissolved salts acting to artificially overestimate ECEC. Assessment of ECEC on similar fine-grained non-

© Landloch Pty Ltd -24-
saline wastes conducted previously by Landloch Pty Ltd (2009a) and MBS Environmental (2010) showed low ECEC. The high ECEC of the topsoil – when considering the clay content – indicates that smectite is the dominant clay. Smectite tends to shrink and swell under changing moisture conditions and can be highly erodible. By contrast, the low ECEC values for White clay waste indicate that these materials will not shrink and swell as moisture content changes.
5.1.3 Exchangeable Sodium Percentage (ESP)
ESP is an indicator of soil chemical stability. Typically, non-saline materials with clay content >~10% and ESP values <6%, indicate a non-dispersive material. The Greensnake topsoil and the rocky wastes are not likely to be dispersive. However, the high ESP of the Yellow and White clay wastes (Table 3) will render these materials dispersive and, therefore, erosion prone irrespective of ECEC.
5.1.4 Particle size distribution
The particle size distributions of the topsoil and the fine component of the rocky wastes are similar (Table 4). Although the size of the coarse and fine sand fractions varies slightly between materials, total sand content (coarse and fine sand sizes combined) is generally ~70%. Clay content ranges from 17-20%, giving these materials a loamy texture (Hazelton and Murphy 2007). Similar particle size distributions were measured previously for the topsoils (Landloch Pty Ltd 2009a; MBS Environmental 2010), with total sand contents ranging from 55-90% and textures included loamy sands, loams and sandy loams. In comparison, the Yellow clay waste and White clay waste have much higher clay contents (37% and 41% respectively; Table 4) and a distinctly lower coarse sand content (12% and 10% respectively; Table 4). These materials have a silty-clay or clayey texture, similar to the textures of similar samples assessed previously (Landloch Pty Ltd 2009a; MBS Environmental 2010). These materials are prone to liquefaction that, if allowed to occur, can result in tunnel erosion.
5.1.5 Fertility
No previous fertility data exist to enable comparison with the results shown in Table 5, particularly for the undisturbed soils that currently support vegetation. Therefore, ratings of fertility (i.e., whether values are high or low) are based on Landloch‟s previous experience with materials in the Pilbara region. Total N values for all materials assessed are low (Table 5). Total P is low for the topsoil and clay wastes, but high for the rocky wastes (Big Mack and Radio Hill). Available P is low for all samples, indicating that the P present will not be readily available for vegetation.
© Landloch Pty Ltd -25-
Available S is marginally low for the topsoil, very high for the Yellow clay waste, and adequate for the remainder of samples. The clay wastes both have low plant available Mn; but available trace elements for all other materials are adequate.
5.2 Characteristics of the coarse component of materials
5.2.1 Rock competence
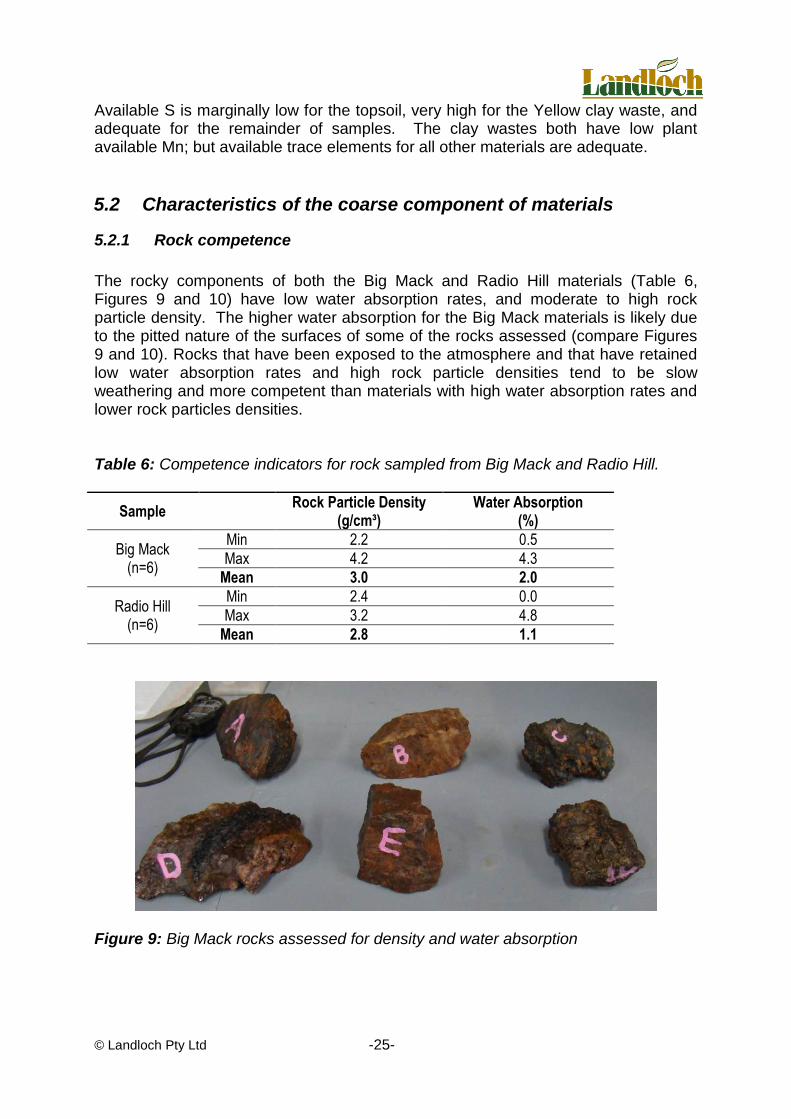
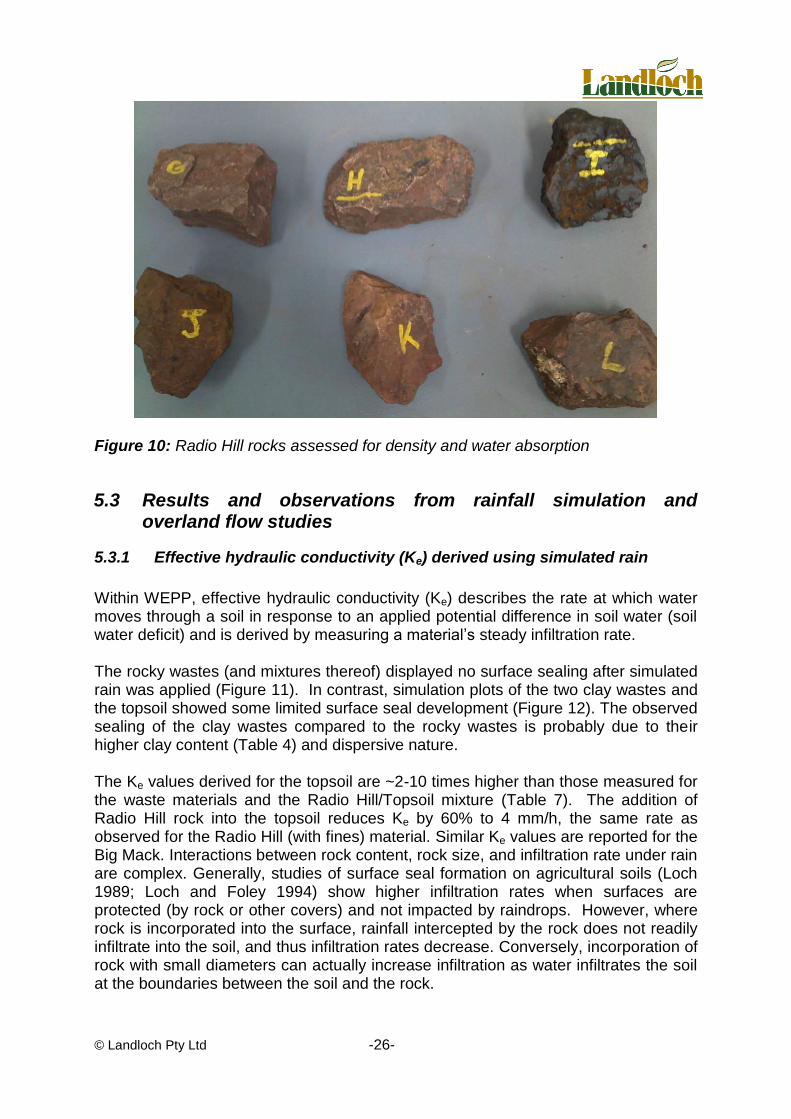
The rocky components of both the Big Mack and Radio Hill materials (Table 6, Figures 9 and 10) have low water absorption rates, and moderate to high rock particle density. The higher water absorption for the Big Mack materials is likely due to the pitted nature of the surfaces of some of the rocks assessed (compare Figures 9 and 10). Rocks that have been exposed to the atmosphere and that have retained low water absorption rates and high rock particle densities tend to be slow weathering and more competent than materials with high water absorption rates and lower rock particles densities. Table 6: Competence indicators for rock sampled from Big Mack and Radio Hill.
Sample Rock Particle Density
(g/cm³) Water Absorption
(%)
Big Mack (n=6)
Min 2.2 0.5
Max 4.2 4.3
Mean 3.0 2.0
Radio Hill (n=6)
Min 2.4 0.0
Max 3.2 4.8
Mean 2.8 1.1
Figure 9: Big Mack rocks assessed for density and water absorption
© Landloch Pty Ltd -26-
Figure 10: Radio Hill rocks assessed for density and water absorption
5.3 Results and observations from rainfall simulation and overland flow studies
5.3.1 Effective hydraulic conductivity (Ke) derived using simulated rain
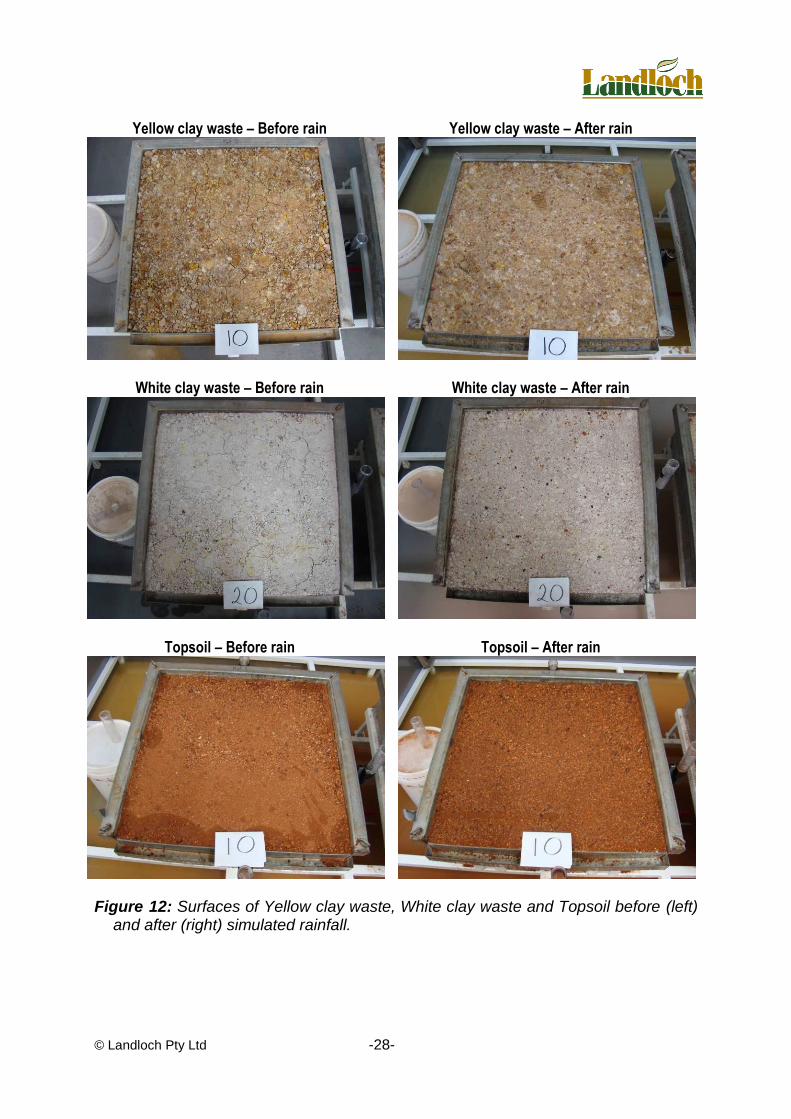
Within WEPP, effective hydraulic conductivity (Ke) describes the rate at which water moves through a soil in response to an applied potential difference in soil water (soil water deficit) and is derived by measuring a material‟s steady infiltration rate. The rocky wastes (and mixtures thereof) displayed no surface sealing after simulated rain was applied (Figure 11). In contrast, simulation plots of the two clay wastes and the topsoil showed some limited surface seal development (Figure 12). The observed sealing of the clay wastes compared to the rocky wastes is probably due to their higher clay content (Table 4) and dispersive nature. The Ke values derived for the topsoil are ~2-10 times higher than those measured for the waste materials and the Radio Hill/Topsoil mixture (Table 7). The addition of Radio Hill rock into the topsoil reduces Ke by 60% to 4 mm/h, the same rate as observed for the Radio Hill (with fines) material. Similar Ke values are reported for the Big Mack. Interactions between rock content, rock size, and infiltration rate under rain are complex. Generally, studies of surface seal formation on agricultural soils (Loch 1989; Loch and Foley 1994) show higher infiltration rates when surfaces are protected (by rock or other covers) and not impacted by raindrops. However, where rock is incorporated into the surface, rainfall intercepted by the rock does not readily infiltrate into the soil, and thus infiltration rates decrease. Conversely, incorporation of rock with small diameters can actually increase infiltration as water infiltrates the soil at the boundaries between the soil and the rock.

© Landloch Pty Ltd -27-
The Ke for the Yellow Clay waste (4 mm/h) is higher than anticipated (Table 7). This is largely due to clay aggregation in response to the high salinity of the clay material (Table 3), which then resulted in increased permeability. The Ke of the non-saline White clay waste is very low, which is consistent with dispersive clay materials (Table 7). Finally, the Ke of the Radio Hill rock material is very high, with runoff not observed when the simulator was operated at its maximum rainfall rate (250 mm/h). Consequently, when fines are absent, there is essentially nothing to impede the rapid entry and movement of water into and through the soil profile.
Big Mack – Before rain Big Mack – After rain
Radio Hill/Topsoil mix – Before rain Radio Hill/Topsoil mix – After rain
Figure 11: Surfaces of rocky materials (Big Mack and Radio Hill/Topsoil mix) before
(left) and after (right) simulated rainfall.
© Landloch Pty Ltd -28-
Yellow clay waste – Before rain Yellow clay waste – After rain
White clay waste – Before rain White clay waste – After rain
Topsoil – Before rain Topsoil – After rain
Figure 12: Surfaces of Yellow clay waste, White clay waste and Topsoil before (left)
and after (right) simulated rainfall.
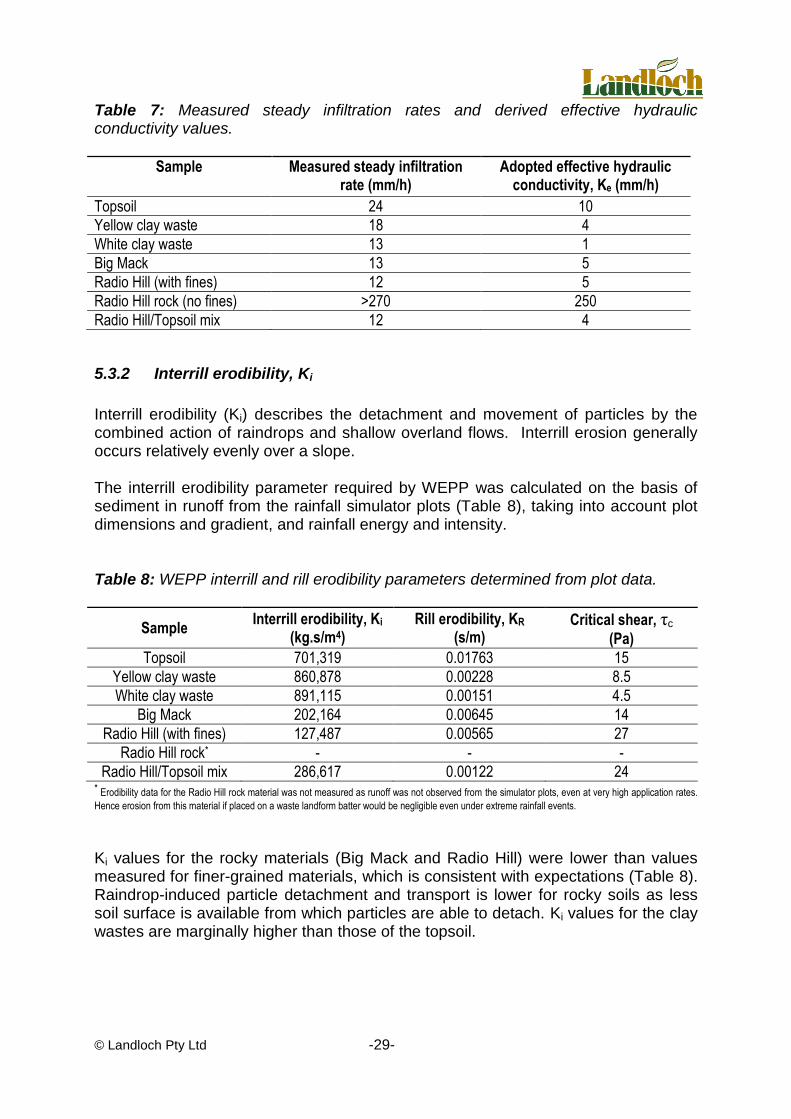
© Landloch Pty Ltd -29-
Table 7: Measured steady infiltration rates and derived effective hydraulic conductivity values.
Sample Measured steady infiltration rate (mm/h)
Adopted effective hydraulic conductivity, Ke (mm/h)
Topsoil 24 10
Yellow clay waste 18 4
White clay waste 13 1
Big Mack 13 5
Radio Hill (with fines) 12 5
Radio Hill rock (no fines) >270 250
Radio Hill/Topsoil mix 12 4
5.3.2 Interrill erodibility, Ki
Interrill erodibility (Ki) describes the detachment and movement of particles by the combined action of raindrops and shallow overland flows. Interrill erosion generally occurs relatively evenly over a slope. The interrill erodibility parameter required by WEPP was calculated on the basis of sediment in runoff from the rainfall simulator plots (Table 8), taking into account plot dimensions and gradient, and rainfall energy and intensity. Table 8: WEPP interrill and rill erodibility parameters determined from plot data.
Sample Interrill erodibility, Ki
(kg.s/m4) Rill erodibility, KR
(s/m) Critical shear, τc
(Pa)
Topsoil 701,319 0.01763 15
Yellow clay waste 860,878 0.00228 8.5
White clay waste 891,115 0.00151 4.5
Big Mack 202,164 0.00645 14
Radio Hill (with fines) 127,487 0.00565 27
Radio Hill rock* - - -
Radio Hill/Topsoil mix 286,617 0.00122 24 * Erodibility data for the Radio Hill rock material was not measured as runoff was not observed from the simulator plots, even at very high application rates.
Hence erosion from this material if placed on a waste landform batter would be negligible even under extreme rainfall events. Ki values for the rocky materials (Big Mack and Radio Hill) were lower than values measured for finer-grained materials, which is consistent with expectations (Table 8). Raindrop-induced particle detachment and transport is lower for rocky soils as less soil surface is available from which particles are able to detach. Ki values for the clay wastes are marginally higher than those of the topsoil.

© Landloch Pty Ltd -30-
5.3.3 Rill erodibility (KR) and critical shear (c)
Rill erosion refers to the detachment and transport of sediment by turbulent flow within concentrated lines of overland flow.
Rill erodibility parameters required for the WEPP model are KR (rill erodibility) and c (critical shear for rill initiation). These parameters are used to predict changes in erosion processes and rates in response to changes in runoff rates, slope length, gradient and land management. KR is the rate of detachment per unit area in a rill per unit of effective shear stress
(see Equation 1 below) where c is the flow shear stress at which particle detachment commences. This threshold is a function of both particle size and cohesion: the more cohesive the material, the higher the shear stress needed to commence sediment entrainment, whereas less shear stress is needed to entrain comparable-sized particles from less cohesive material. Neglecting any effect of existing sediment loads, rill detachment capacity (Dc) in WEPP is calculated as:
Dc = KR ( - c) (1)
where is the flow shear stress.
KR and c values for the materials tested are shown in Table 8. c values are highest
for the rocky Radio Hill materials, including its mixture with topsoil. c of the Radio
Hill/Topsoil mixture is ~50% greater than the c measured for the topsoil alone. Further, addition of rock reduces rill erodibility of the topsoil by an order of magnitude
(Table 8). The Radio Hill materials had higher c and lower KR values than the topsoil. The lower critical shear and higher rill detachment values for the topsoil (Table 8) indicate that it is highly susceptible to erosion. Rapid initiation and development of rills was in fact observed in the topsoil (Figure 13) during laboratory studies. In contrast, the higher critical shear and lower rill detachment values for the rocky Radio Hill material (including its mixture with topsoil) suggest that these materials will be comparatively resistant to erosion. Figure 14 shows negligible rill development for the Radio Hill material after exposure to overland flows in the laboratory.
The Big Mack material had similar c but lower KR values when compared to the
topsoil (Table 8). Importantly, c values previously estimated for Big Mack using Landloch‟s digital imagery techniques, were higher than the value measured in the
laboratory (Landloch 2009b). From field photographs, c values of 60 Pa were estimated, assuming a mean rock size of ~85 mm. In comparison the mean rock size in the sample tested in the laboratory was significantly less than 85 mm (Figure 11), confirming that the surfaces assessed previously (Landloch 2009b) were much rockier than the Big Mack sample provided to Landloch for assessment in the laboratory. The parameter values produced from the laboratory measurements are consistent with the presence of smaller sized rock. When assessing erosion stability
© Landloch Pty Ltd -31-
for dumps sheeted with Big Mack materials, simulations were run using the
measured c and an adjusted c (c=30 Pa was adopted) consistent with a rockier
surface, as has been observed on site for the Big Mack materials. A c value of 30 Pa can be expected to exist on an armoured surface with a mean rock size of 40 mm. The other erodibility parameters values measured as part of this project were adopted for both critical shear values.
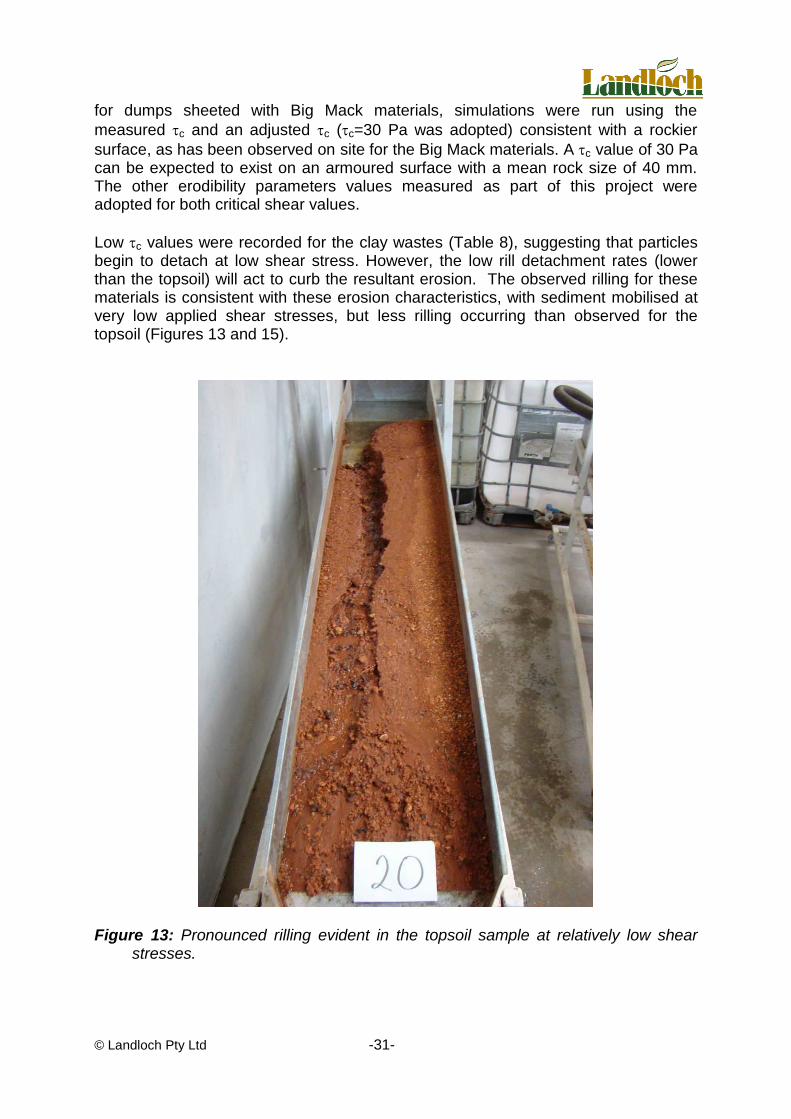
Low c values were recorded for the clay wastes (Table 8), suggesting that particles begin to detach at low shear stress. However, the low rill detachment rates (lower than the topsoil) will act to curb the resultant erosion. The observed rilling for these materials is consistent with these erosion characteristics, with sediment mobilised at very low applied shear stresses, but less rilling occurring than observed for the topsoil (Figures 13 and 15).
Figure 13: Pronounced rilling evident in the topsoil sample at relatively low shear
stresses.

© Landloch Pty Ltd -32-
Figure 14: Rills failed to form on the Radio Hill (including fines)
materials.
Figure 15: Typical rilling of clay wastes when exposed to
overland flow.
© Landloch Pty Ltd -33-
5.4 Derivation of SIBERIA input parameters from laboratory data
SIBERIA predicts the long-term average change in elevation of a point by predicting the volume of sediment lost from a node. Fluvial sediment transport rate through a point (qs, in units of m3/y) is determined by the equation:
qs = 1 qm
1 Sn1 (2)
where S = slope (m/m), q = discharge (m3/y), 1 = sediment transport rate coefficient. SIBERIA does not directly model runoff, but uses sub-grid effective parameterisation which relates discharge to area (A) draining through a point as:
q = 3 Am
3 (3)
To run SIBERIA, the parameters 1, m1, n1, and m3 are usually needed. However, if the batter area to be modelled is identical to the batter for which erosion data are available for calibration, m3 can be taken as 1.0 (Willgoose, pers. comm.), and a value of n1 = 1.5 can be adopted for situations where slope gradient does not affect slope erodibility (Willgoose, pers. comm.). Where steeper slopes are subject to greater armouring, the exponent n1 may be as low as 0.7 (Evans et al. 1998).
Effectively, the 1 parameter could be described as a “rate parameter”, as it primarily controls the rate of sediment movement. The m1 parameter could be considered as primarily controlling slope length responses. However, in practice, there is interaction
between all of the parameters 1, m1, n1, and m3 with the result that an almost infinite number of parameter sets will all show the same rate of erosion (though some aspects of the pattern of erosion that is predicted will vary). It is for this reason that, where possible, fixed values of n1 and m3 are adopted – thereby reducing the difficulty of deriving parameter values. Input parameters for SIBERIA are typically derived by fitting the various model equations to time series data of rainfall and erosion. However, in many instances, sufficiently long series of these data are not available for landforms of interest. Therefore, in conjunction with University of Newcastle researchers (G. Hancock and G. Willgoose) who have been heavily involved in SIBERIA development and validation, Landloch has developed an alternative approach to the estimation of SIBERIA model parameters. The general approach applied is to:
(a) Make measurements on materials to derive WEPP model parameters. (b) Run the WEPP model to generate data sets of runoff and erosion for slopes
and materials of interest using site specific rainfall data. (c) Analyse the WEPP output to derive SIBERIA input parameters.
© Landloch Pty Ltd -34-
Using the above approach, derived SIBERIA parameters for the Radio Hill/Topsoil mixture are2:
1: 0.002 m1: 1.399
Parameters for other materials were not derived as WEPP modelling showed that their use on the Greensnake waste dump was predicted to produce unacceptable high erosion rates (discussed further below).
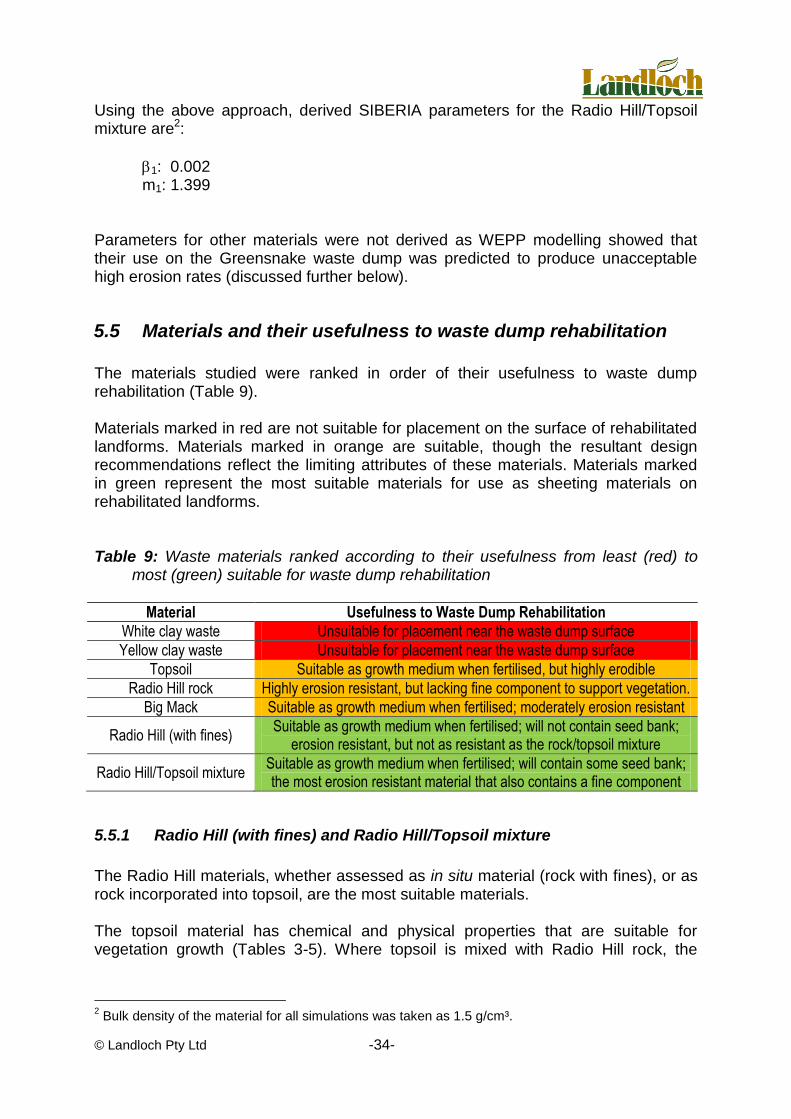
5.5 Materials and their usefulness to waste dump rehabilitation
The materials studied were ranked in order of their usefulness to waste dump rehabilitation (Table 9). Materials marked in red are not suitable for placement on the surface of rehabilitated landforms. Materials marked in orange are suitable, though the resultant design recommendations reflect the limiting attributes of these materials. Materials marked in green represent the most suitable materials for use as sheeting materials on rehabilitated landforms. Table 9: Waste materials ranked according to their usefulness from least (red) to
most (green) suitable for waste dump rehabilitation
Material Usefulness to Waste Dump Rehabilitation
White clay waste Unsuitable for placement near the waste dump surface
Yellow clay waste Unsuitable for placement near the waste dump surface
Topsoil Suitable as growth medium when fertilised, but highly erodible
Radio Hill rock Highly erosion resistant, but lacking fine component to support vegetation.
Big Mack Suitable as growth medium when fertilised; moderately erosion resistant
Radio Hill (with fines) Suitable as growth medium when fertilised; will not contain seed bank;
erosion resistant, but not as resistant as the rock/topsoil mixture
Radio Hill/Topsoil mixture Suitable as growth medium when fertilised; will contain some seed bank; the most erosion resistant material that also contains a fine component
5.5.1 Radio Hill (with fines) and Radio Hill/Topsoil mixture
The Radio Hill materials, whether assessed as in situ material (rock with fines), or as rock incorporated into topsoil, are the most suitable materials. The topsoil material has chemical and physical properties that are suitable for vegetation growth (Tables 3-5). Where topsoil is mixed with Radio Hill rock, the
2 Bulk density of the material for all simulations was taken as 1.5 g/cm³.

© Landloch Pty Ltd -35-
resulting mixture will also contain some seed bank that will improve vegetation establishment
5.5.2 Big Mack
The Big Mack material is generally suitable for use as a growth medium, though its fertility is low - particularly in terms of N and available P (Table 5). The Big Mack materials are likely to be more erosion resistant than the topsoil, but not as fertile. Ideally, if topsoil reserves are limited, the Big Mack materials could be placed near the surface of the waste landforms and used to encapsulate the potentially dispersive clay wastes. Preference should be given to Big Mack materials with larger rock sizes.
5.5.3 Radio Hill rock (with fines removed)
The Radio Hill rock (with fines removed) is highly erosion resistant (Table 8), but contains insufficient fines to store and supply water and nutrients to the vegetation. Radio Hill rock does not contain any soil seed bank. Where topsoil reserves are limited, this material could be used to construct a stable waste dump that supports minimal vegetation.
5.5.4 Topsoil
The topsoil alone has low erosion resistance, and its use on steep batters will:
Pose a high risk of erosive failure;
Likely expose (via gullying) underlying wastes that are highly dispersive and tunnel prone;
Significantly limit the height to which stable batters can be constructed;
Limit vegetation establishment and growth through continual mobilisation and removal of material (including both soil and seeds) from the soil surface.
Rapidly fill constructed rip lines with sediment causing them to fail, creating a landform that is inherently unstable and unlikely to improve with time.
5.5.5 Clay wastes (Yellow and White)
Clay wastes pose a genuine and substantial risk to successful waste dump rehabilitation. With their very high clay and silt content (Table 4), coupled with high ESP and variable salinity (Table 3), the clay waste materials are unsuitable for placement near the surface of waste dumps. They are likely to set hard when placed within the active wetting front (~0.5 m below the soil surface), and form impermeable layers at depth. This will reduce water infiltration and limit the capacity of vegetation to source
© Landloch Pty Ltd -36-
moisture, particularly during the drier winter and spring seasons. Where saline, these clay waste materials are also likely to limit vegetation establishment and growth. The high silt and clay content of these materials also has the potential to cause soil liquefaction. Landloch has previously observed silty wastes from the Telfer mine site (close to Woodie Woodie) as being highly prone to tunnel failure as a result of liquefaction (Vacher et al. 2004). These materials typically had a combined clay and silt content of ~70% - similar to those reported for the white clay wastes (Table 4) and measured in previous material characterisation studies (Landloch Pty Ltd 2009a; MBS Environmental 2010).
6 WEPP RUNOFF AND EROSION SIMULATIONS
6.1 Simulation assumptions
Simulations of runoff and erosion for a range of slopes were carried out using the Windows version of the WEPP (Water Erosion Prediction Program) model (Flanagan and Livingston 1995). General assumptions made and model settings adopted in modelling the batter slopes include:
(a) Simulations were run for a 100-year climate sequence for the site. Appendix C contains greater detail on the derivation of that file.
(b) Rill spacing was set at 1 m for rocky wastes and mixtures thereof; 2 m for clay wastes; and 5 m for topsoils.
(c) Surface roughness was set at 3 cm for all materials. This is consistent with a relatively smooth surface.
(d) No allowance was made for the effects of vegetation on erosion. (e) Light cross-slope ripping will be applied to the final batter surface. (f) No allowance was made for water from the top of the landform to
discharge onto the batter slopes. Retention of water on top of the landform will considerably reduce potential erosion rates.
Rill spacing values adopted are based on Landloch‟s extensive experience with these and similar wastes on constructed landforms. The rill spacing parameter in the WEPP model sets the slope width over which predicted runoff is automatically concentrated. Increased rill spacing increases the amount of flow in individual rills, increases the potential for critical shear to be exceeded and thereby increases the likelihood of rilling becoming more active in a given event. Surface roughness of 3 cm is consistent with a relatively smooth surface, effectively simulating the surface that will develop after some years of exposure to rainfall. Although vegetation is to be planted on the batter slopes, no vegetative cover was considered in the modelling. This reflects a general observation that levels of surface contact cover developed by vegetation in this arid environment are likely to be too low to have appreciable impacts on erosion potential. Therefore, the aim of the simulation was to identify a slope that would initially be stable without vegetation.
© Landloch Pty Ltd -37-
6.2 Definition of “acceptable” soil loss
The concept of “tolerable” or “acceptable” soil loss is widely mentioned when considering erosion from agricultural land. Tolerable soil loss is defined as a rate of erosion such that land productivity is sustained (Wischmeier and Smith 1978), and is therefore of greatest relevance to agricultural situations rather than mine site rehabilitation. It also ignores the pronounced temporal variations in erosion rates evident in arid regions. Currently, there is no widely adopted methodology for assessing what is an acceptable erosion rate for rehabilitated lands. Also, a simple measure of average erosion rate in tonnes per hectare per year gives no information on the way in which that erosion may develop and impact on a landform over the long term. Erosion models such as The Revised Universal Soil Loss Equation or WEPP simply consider the same land surface year after year. In practice, rilling in one year may well develop into gullies in subsequent years if the erosion continues to incise the soil surface. Alternatively, a rill may become armoured, and erosion rates may reduce through time3.
Therefore, Landloch’s approach to landform design aims to create slopes where rilling and consequently, gullying potential, will be minimised. (Interrill erosion is generally relatively insignificant relative to potential rates of erosion by rilling on steep slopes. Surfaces eroded by interrill erosion typically become armoured in any case.) If conditions that encourage gullying are avoided, the slope should be sustainable. Gully erosion potential is increased by:
Use of inappropriate surface materials;
Use of inappropriate batter shapes (including heights, and gradients); and
Increasing flow shear stress through concentration of surface water flows. Based, on Landloch‟s considerable experience in modelling erosion, and assessing erosion processes and erosion rates in the field, landforms designed with a predicted average erosion rate (averaged over the entire slope length) of <5 t/ha/y, together with a predicted maximum erosion rate at any point on the slope of <10 t/ha/y, exhibit a low tendency to rill. These values were adopted as the threshold above which a landform batter was deemed to erode at an unacceptable rate.
3 Landform evolution models – of which SIBERIA is the most validated and acceptable – provide
useful insight into issues of gully development and landform stability in the long term. SIBERIA is particularly useful as the input parameters are strongly related to the prevailing climate and the characteristics of the eroding materials present.
© Landloch Pty Ltd -38-
6.3 Definition of the maximum allowable batter gradient
The maximum allowable batter gradient (or batter gradient section in the case of a concave slope) is a function of the:
Ability of vegetation to establish and grow on those batters, and
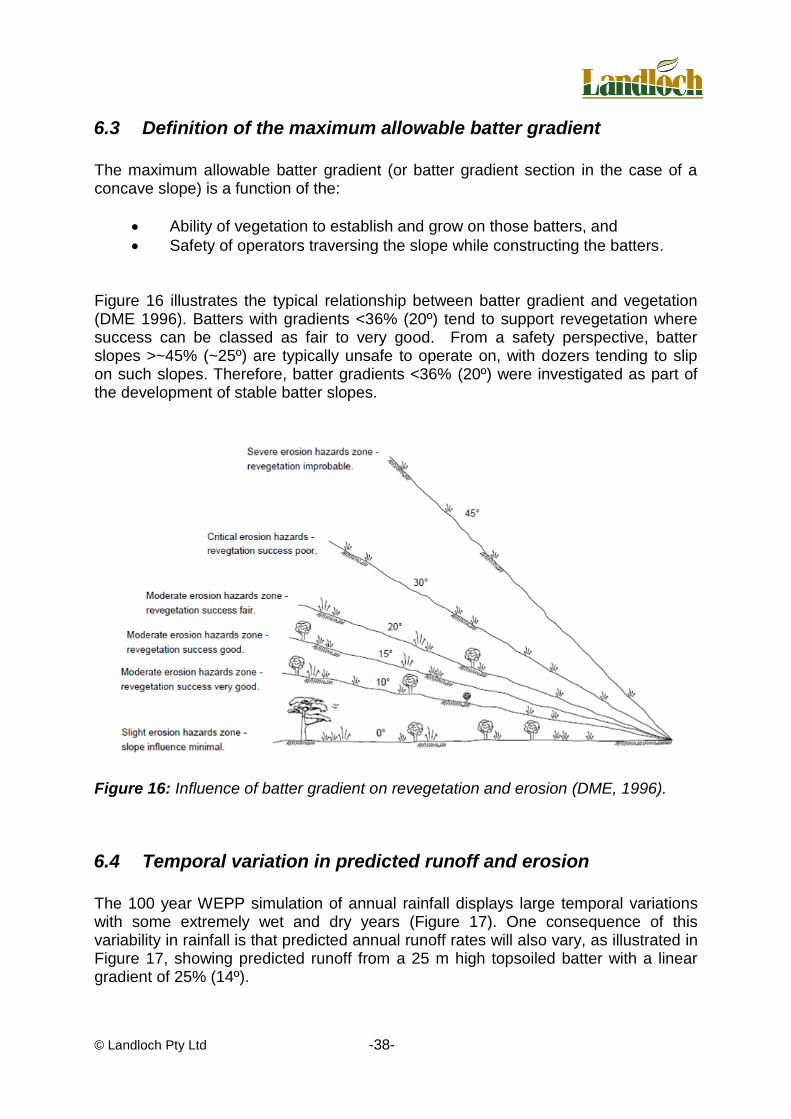
Safety of operators traversing the slope while constructing the batters. Figure 16 illustrates the typical relationship between batter gradient and vegetation (DME 1996). Batters with gradients <36% (20º) tend to support revegetation where success can be classed as fair to very good. From a safety perspective, batter slopes >~45% (~25º) are typically unsafe to operate on, with dozers tending to slip on such slopes. Therefore, batter gradients <36% (20º) were investigated as part of the development of stable batter slopes.
Figure 16: Influence of batter gradient on revegetation and erosion (DME, 1996).
6.4 Temporal variation in predicted runoff and erosion
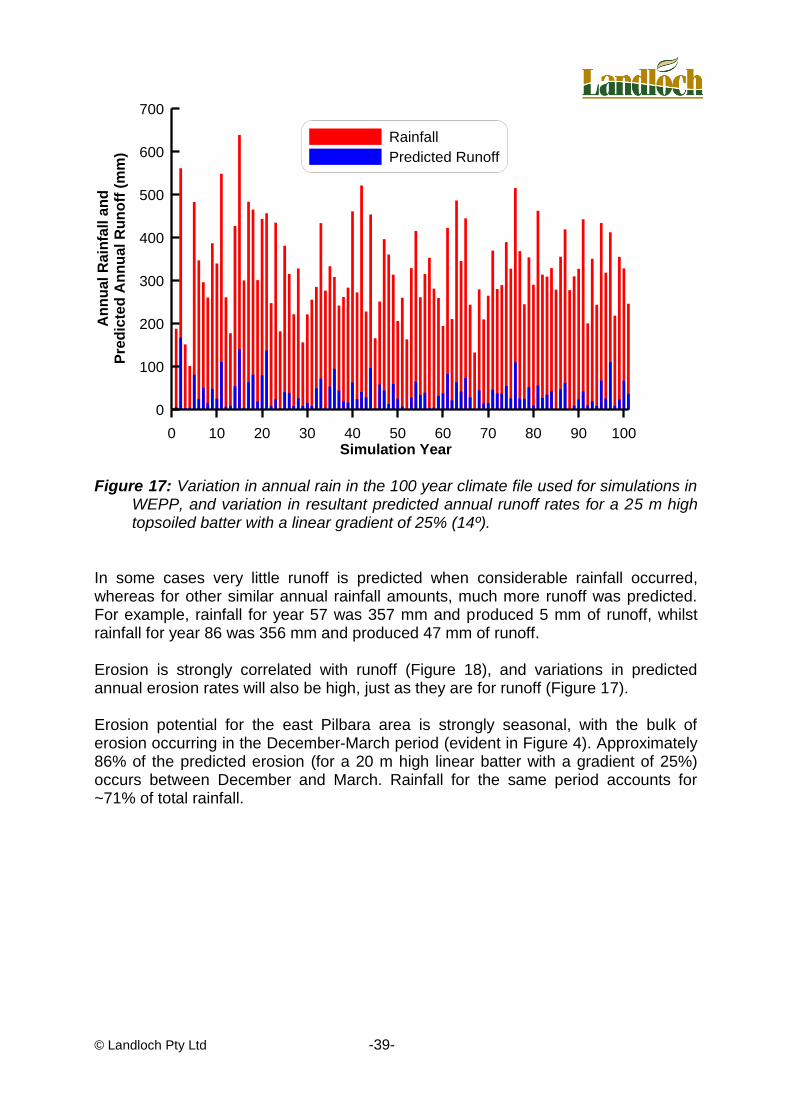
The 100 year WEPP simulation of annual rainfall displays large temporal variations with some extremely wet and dry years (Figure 17). One consequence of this variability in rainfall is that predicted annual runoff rates will also vary, as illustrated in Figure 17, showing predicted runoff from a 25 m high topsoiled batter with a linear gradient of 25% (14º).
© Landloch Pty Ltd -39-
0 10 20 30 40 50 60 70 80 90 100Simulation Year
0
50
100
150
Pre
dic
ted
An
nu
al
Ru
no
ff (
mm
)
0 10 20 30 40 50 60 70 80 90 100Simulation Year
0
100
200
300
400
500
600
700A
nn
ual
Ra
infa
ll a
nd
Pre
dic
ted
An
nu
al R
un
off
(m
m)
Rainfall
Predicted Runoff
Figure 17: Variation in annual rain in the 100 year climate file used for simulations in
WEPP, and variation in resultant predicted annual runoff rates for a 25 m high topsoiled batter with a linear gradient of 25% (14º).
In some cases very little runoff is predicted when considerable rainfall occurred, whereas for other similar annual rainfall amounts, much more runoff was predicted. For example, rainfall for year 57 was 357 mm and produced 5 mm of runoff, whilst rainfall for year 86 was 356 mm and produced 47 mm of runoff. Erosion is strongly correlated with runoff (Figure 18), and variations in predicted annual erosion rates will also be high, just as they are for runoff (Figure 17). Erosion potential for the east Pilbara area is strongly seasonal, with the bulk of erosion occurring in the December-March period (evident in Figure 4). Approximately 86% of the predicted erosion (for a 20 m high linear batter with a gradient of 25%) occurs between December and March. Rainfall for the same period accounts for ~71% of total rainfall.

© Landloch Pty Ltd -40-
0 40 80 120 160 200Predicted Annual Runoff (mm)
0
100
200
300
Pre
dic
ted
An
nu
al E
rosio
n (
t/h
a/y
)
Figure 18: Relationship between predicted annual erosion and predicted annual runoff for a 25 m high topsoiled batter with a linear gradient of 25% (14º.)
Jan Feb Mar Apr May Jun Jul Aug Sep Oct Nov DecMonth
0
5
10
15
20
25
30
35
Pro
po
rtio
n o
f P
red
icte
d A
nn
ual
Ero
sio
n (
%)
Figure 19: Predicted monthly erosion as a proportion of predicted annual erosion.
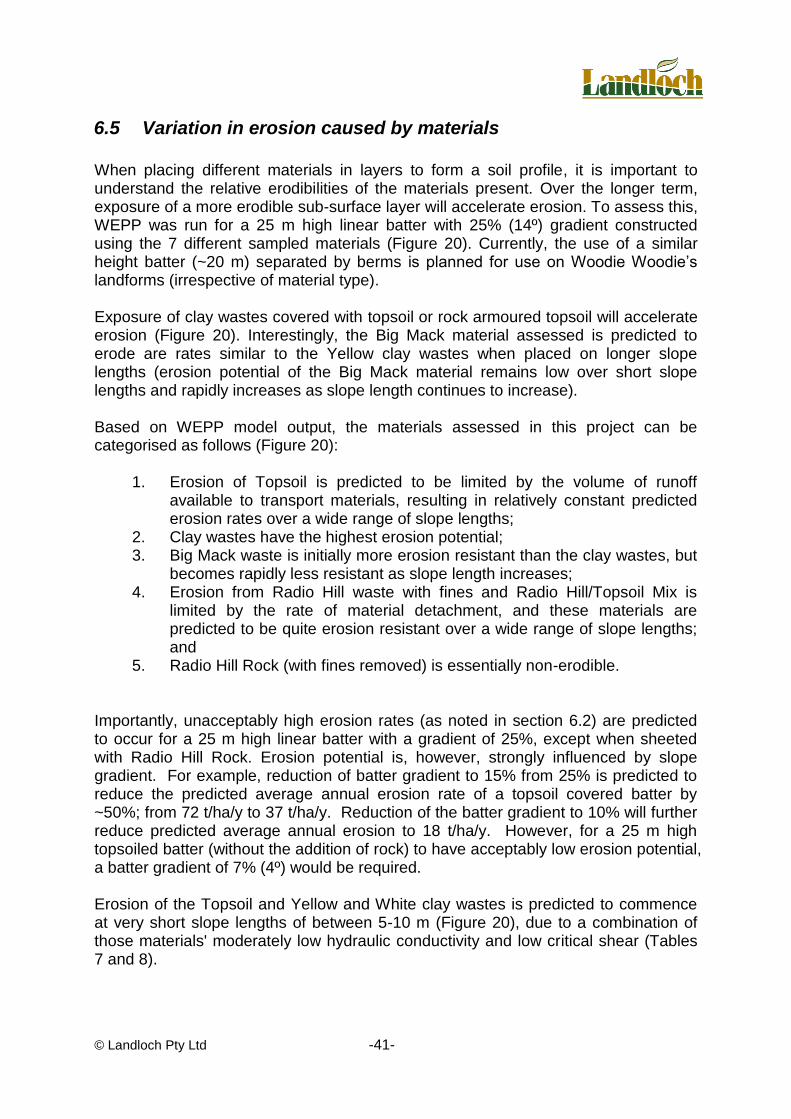
© Landloch Pty Ltd -41-
6.5 Variation in erosion caused by materials
When placing different materials in layers to form a soil profile, it is important to understand the relative erodibilities of the materials present. Over the longer term, exposure of a more erodible sub-surface layer will accelerate erosion. To assess this, WEPP was run for a 25 m high linear batter with 25% (14º) gradient constructed using the 7 different sampled materials (Figure 20). Currently, the use of a similar height batter (~20 m) separated by berms is planned for use on Woodie Woodie‟s landforms (irrespective of material type). Exposure of clay wastes covered with topsoil or rock armoured topsoil will accelerate erosion (Figure 20). Interestingly, the Big Mack material assessed is predicted to erode are rates similar to the Yellow clay wastes when placed on longer slope lengths (erosion potential of the Big Mack material remains low over short slope lengths and rapidly increases as slope length continues to increase). Based on WEPP model output, the materials assessed in this project can be categorised as follows (Figure 20):
1. Erosion of Topsoil is predicted to be limited by the volume of runoff available to transport materials, resulting in relatively constant predicted erosion rates over a wide range of slope lengths;
2. Clay wastes have the highest erosion potential; 3. Big Mack waste is initially more erosion resistant than the clay wastes, but
becomes rapidly less resistant as slope length increases; 4. Erosion from Radio Hill waste with fines and Radio Hill/Topsoil Mix is
limited by the rate of material detachment, and these materials are predicted to be quite erosion resistant over a wide range of slope lengths; and
5. Radio Hill Rock (with fines removed) is essentially non-erodible. Importantly, unacceptably high erosion rates (as noted in section 6.2) are predicted to occur for a 25 m high linear batter with a gradient of 25%, except when sheeted with Radio Hill Rock. Erosion potential is, however, strongly influenced by slope gradient. For example, reduction of batter gradient to 15% from 25% is predicted to reduce the predicted average annual erosion rate of a topsoil covered batter by ~50%; from 72 t/ha/y to 37 t/ha/y. Reduction of the batter gradient to 10% will further reduce predicted average annual erosion to 18 t/ha/y. However, for a 25 m high topsoiled batter (without the addition of rock) to have acceptably low erosion potential, a batter gradient of 7% (4º) would be required. Erosion of the Topsoil and Yellow and White clay wastes is predicted to commence at very short slope lengths of between 5-10 m (Figure 20), due to a combination of those materials' moderately low hydraulic conductivity and low critical shear (Tables 7 and 8).

© Landloch Pty Ltd -42-
0 20 40 60 80 100Horizontal Distance From Crest of Batter (m)
0
100
200
300
400P
red
icte
d A
vera
ge A
nn
ual
Ero
sio
n (
t/h
a/y
)Topsoil
Yellow clay waste
White clay waste
Big Mack
Radio Hill (with fines)
Radio Hill Rock
Radio Hill/Topsoil Mix
Figure 20: Predicted average annual erosion rates along a 25 m high slope sheeted
with each of the tested materials on a 25% (14º) gradient. The Radio Hill (with fines) and Radio Hill/Topsoil mix materials are predicted to not erode for this batter configuration until the final 1/3 of the batter slope (Figure 20). These materials require an accumulation of flow (and hence increased shear stress) before sediment detachment commences. In contrast, the Radio Hill Rock material is predicted to not erode, as all rain infiltrates and thus no runoff or particle detachment can occur. Three conclusions emerge from the modelling outputs above:
Without the incorporation of rock, batters sheeted solely with Topsoil will require very low gradients or very low maximum final batter heights to achieve acceptable erosional stability.
Exposure of the clay wastes will cause unacceptably high levels of erosion. Exposure may result from erosion (rilling and gullying) of the overlying soils; gullying will encourage increasingly unstable batters over time. Exposure of the clay wastes may also occur if water is allowed to pond on the soil surfaces, causing the clay wastes to saturate, disperse, and tunnel. Tunnels eventually collapse, forming “instantaneous gullies”.
The Big Mack material, although relatively stable at short slope lengths, becomes increasingly subject to erosion as slope length increases.
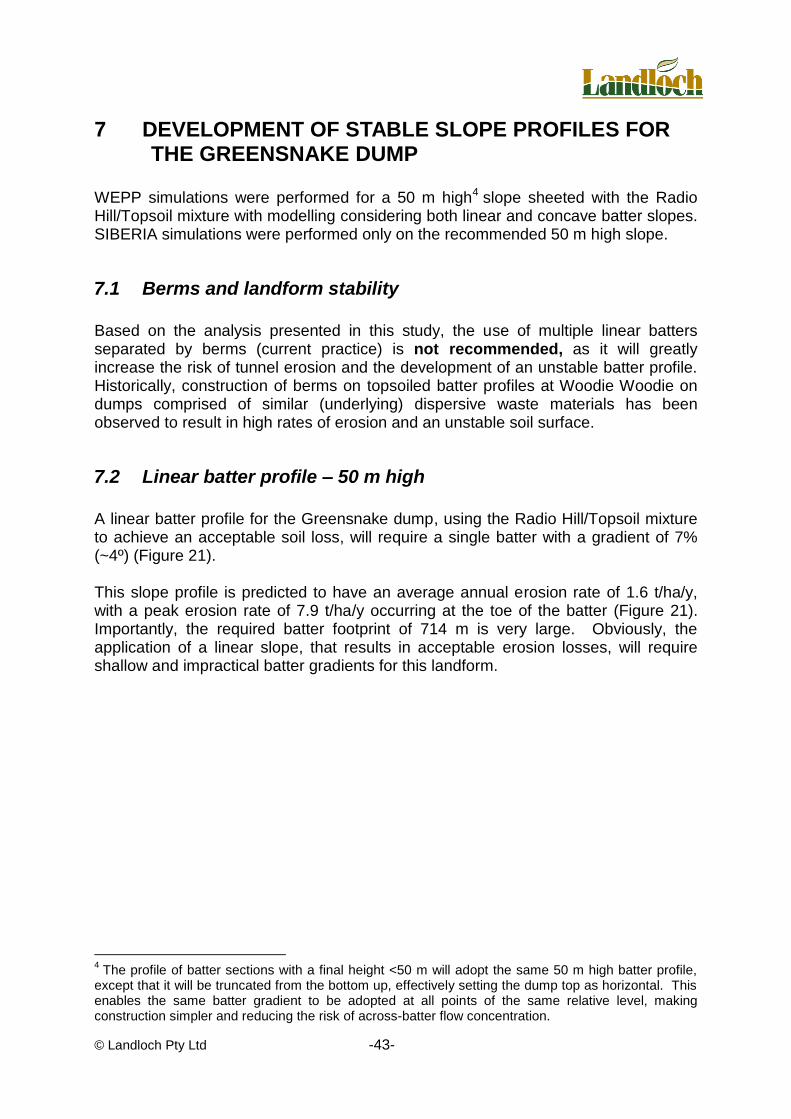
© Landloch Pty Ltd -43-
7 DEVELOPMENT OF STABLE SLOPE PROFILES FOR THE GREENSNAKE DUMP
WEPP simulations were performed for a 50 m high4 slope sheeted with the Radio Hill/Topsoil mixture with modelling considering both linear and concave batter slopes. SIBERIA simulations were performed only on the recommended 50 m high slope.
7.1 Berms and landform stability
Based on the analysis presented in this study, the use of multiple linear batters separated by berms (current practice) is not recommended, as it will greatly increase the risk of tunnel erosion and the development of an unstable batter profile. Historically, construction of berms on topsoiled batter profiles at Woodie Woodie on dumps comprised of similar (underlying) dispersive waste materials has been observed to result in high rates of erosion and an unstable soil surface.
7.2 Linear batter profile – 50 m high
A linear batter profile for the Greensnake dump, using the Radio Hill/Topsoil mixture to achieve an acceptable soil loss, will require a single batter with a gradient of 7% (~4º) (Figure 21). This slope profile is predicted to have an average annual erosion rate of 1.6 t/ha/y, with a peak erosion rate of 7.9 t/ha/y occurring at the toe of the batter (Figure 21). Importantly, the required batter footprint of 714 m is very large. Obviously, the application of a linear slope, that results in acceptable erosion losses, will require shallow and impractical batter gradients for this landform.
4 The profile of batter sections with a final height <50 m will adopt the same 50 m high batter profile,
except that it will be truncated from the bottom up, effectively setting the dump top as horizontal. This enables the same batter gradient to be adopted at all points of the same relative level, making construction simpler and reducing the risk of across-batter flow concentration.

© Landloch Pty Ltd -44-
0 200 400 600 800Horizontal distance from batter crest (m)
0
2
4
6
8
10
Pre
dic
ted
avera
ge a
nn
ual ero
sio
n (
t/h
a/y
)
Batter profile
Predicted erosion
0
25
50
Batt
er
heig
ht
(m)
0 200 400 600 800Horizontal distance from batter crest (m)
Figure 21: Linear batter profile (top) and predicted average annual erosion for a 50
m high linear slope (bottom) sheeted with Radio Hill/Topsoil mix on 7% (~4º) gradient.
7.3 Concave batter profile – 50 m high
Simulations show that the modelled concave slope shown in Figure 22 (and Table 10) has a similar predicted rate of average annual erosion as the linear profile shown in Figure 21, despite slope length being more than halved by adoption of the concave profile. The predicted average annual erosion rate for the concave profile is 2.0 t/ha/y. Erosion rates are predicted to peak at points along the slope where the gradient is changed. The peak erosion rate predicted is 7.2 t/ha/y, occurring at a horizontal distance of 125 m from the crest of the batter (Figure 22).
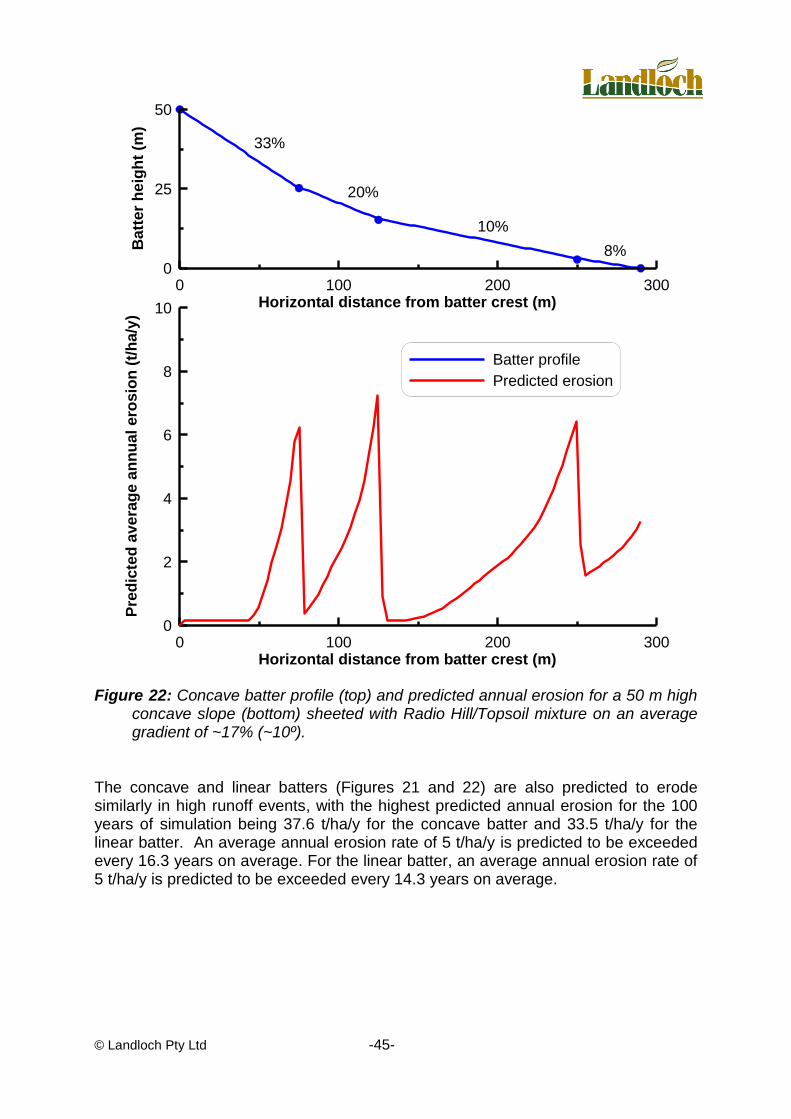
© Landloch Pty Ltd -45-
0 100 200 300Horizontal distance from batter crest (m)
0
2
4
6
8
10
Pre
dic
ted
avera
ge a
nn
ua
l ero
sio
n (
t/h
a/y
)
Batter profile
Predicted erosion
0
25
50
Batt
er
he
igh
t (m
)
0 100 200 300Horizontal distance from batter crest (m)
33%
20%
10%
8%
Figure 22: Concave batter profile (top) and predicted annual erosion for a 50 m high
concave slope (bottom) sheeted with Radio Hill/Topsoil mixture on an average gradient of ~17% (~10º).
The concave and linear batters (Figures 21 and 22) are also predicted to erode similarly in high runoff events, with the highest predicted annual erosion for the 100 years of simulation being 37.6 t/ha/y for the concave batter and 33.5 t/ha/y for the linear batter. An average annual erosion rate of 5 t/ha/y is predicted to be exceeded every 16.3 years on average. For the linear batter, an average annual erosion rate of 5 t/ha/y is predicted to be exceeded every 14.3 years on average.

© Landloch Pty Ltd -46-
Table 10: Detailed information on the concave slope profile shown in Figure 22.
Horizontal Distance From the Crest (m)
Batter Gradient (%)
Batter Gradient (º)
0-75 33 18.3
75-125 20 11.3
125-250 10 5.7
250-290 8 4.6
7.4 Batters for other dump heights
Simulations also assessed a range of maximum dump heights ranging from 10-40 m. The profile required for a dump height of 50 m is given in Section 7.3. For batters of lower height, the use of rock as armouring is still required. Simulations of 10 m high batters sheeted solely with Greensnake topsoil with gradients ranging from 10-40% (~6-22º) predicted average annual erosion rates increasing from 12.3 t/ha/y to 48.6 t/ha/y as batter gradients increase from 10% to 40%. Predicted erosion from Greensnake topsoil is strongly transport limited, with erosion rates increasing rapidly over relatively short slope lengths (Figure 20), rendering this material highly sensitive to slope gradient and relatively insensitive to batter height (slope length). For example, increasing slope gradient from 20% to 30% (while holding batter height constant) increases erosion potential by a factor of ~40-60%; increasing batter height from 10 m to 40 m (while holding gradient constant) results in a change in erosion potential of <1%. Therefore, simulations were conducted making use of the more stable Radio Hill/Topsoil mixture for a range of dump heights (10-40 m).
7.4.1 Linear batter profile
Table 11 outlines the maximum linear batter gradient that can be used to produce a batter slope with acceptably low erosion potential. Table 11: Various batter configurations constructed using Radio Hill/Topsoil mix.
Batter Height (m) Maximum linear
gradient (%) Maximum linear
gradient (º)
10 40 21.8
20 15 8.5
30 10 5.7
40 8 4.6
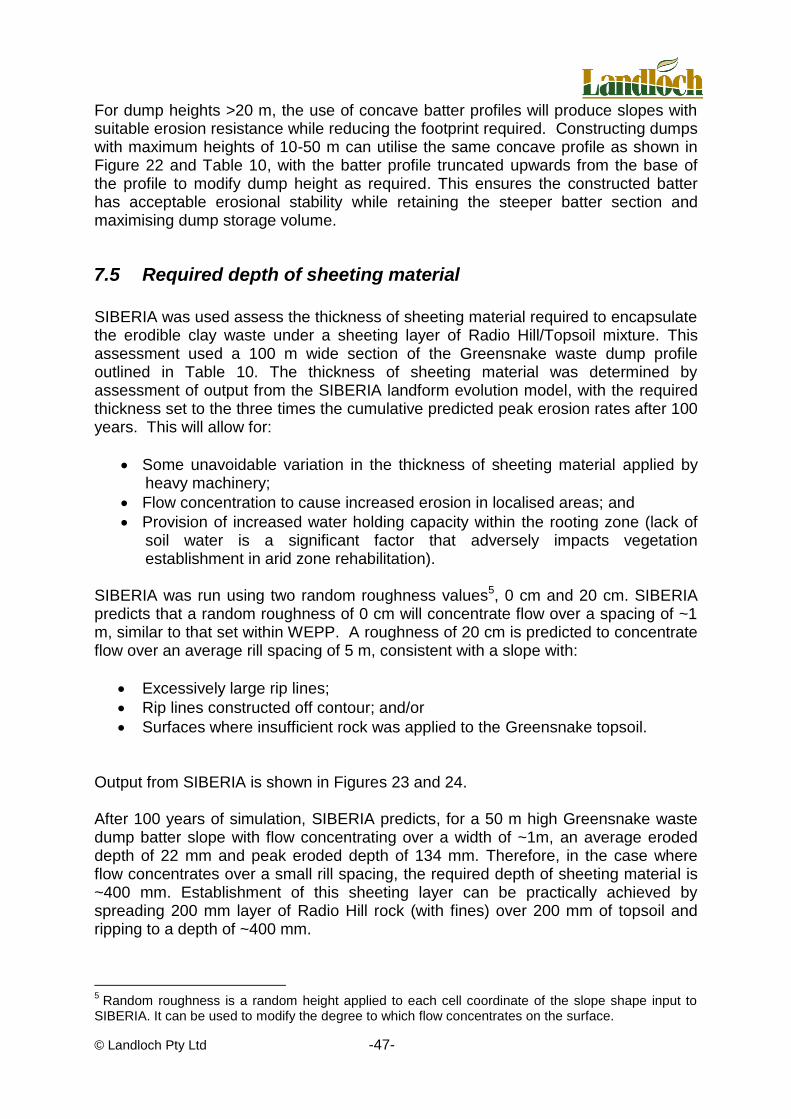
© Landloch Pty Ltd -47-
For dump heights >20 m, the use of concave batter profiles will produce slopes with suitable erosion resistance while reducing the footprint required. Constructing dumps with maximum heights of 10-50 m can utilise the same concave profile as shown in Figure 22 and Table 10, with the batter profile truncated upwards from the base of the profile to modify dump height as required. This ensures the constructed batter has acceptable erosional stability while retaining the steeper batter section and maximising dump storage volume.
7.5 Required depth of sheeting material
SIBERIA was used assess the thickness of sheeting material required to encapsulate the erodible clay waste under a sheeting layer of Radio Hill/Topsoil mixture. This assessment used a 100 m wide section of the Greensnake waste dump profile outlined in Table 10. The thickness of sheeting material was determined by assessment of output from the SIBERIA landform evolution model, with the required thickness set to the three times the cumulative predicted peak erosion rates after 100 years. This will allow for:
Some unavoidable variation in the thickness of sheeting material applied by heavy machinery;
Flow concentration to cause increased erosion in localised areas; and
Provision of increased water holding capacity within the rooting zone (lack of soil water is a significant factor that adversely impacts vegetation establishment in arid zone rehabilitation).
SIBERIA was run using two random roughness values5, 0 cm and 20 cm. SIBERIA predicts that a random roughness of 0 cm will concentrate flow over a spacing of ~1 m, similar to that set within WEPP. A roughness of 20 cm is predicted to concentrate flow over an average rill spacing of 5 m, consistent with a slope with:
Excessively large rip lines;
Rip lines constructed off contour; and/or
Surfaces where insufficient rock was applied to the Greensnake topsoil.
Output from SIBERIA is shown in Figures 23 and 24. After 100 years of simulation, SIBERIA predicts, for a 50 m high Greensnake waste dump batter slope with flow concentrating over a width of ~1m, an average eroded depth of 22 mm and peak eroded depth of 134 mm. Therefore, in the case where flow concentrates over a small rill spacing, the required depth of sheeting material is ~400 mm. Establishment of this sheeting layer can be practically achieved by spreading 200 mm layer of Radio Hill rock (with fines) over 200 mm of topsoil and ripping to a depth of ~400 mm.
5 Random roughness is a random height applied to each cell coordinate of the slope shape input to
SIBERIA. It can be used to modify the degree to which flow concentrates on the surface.
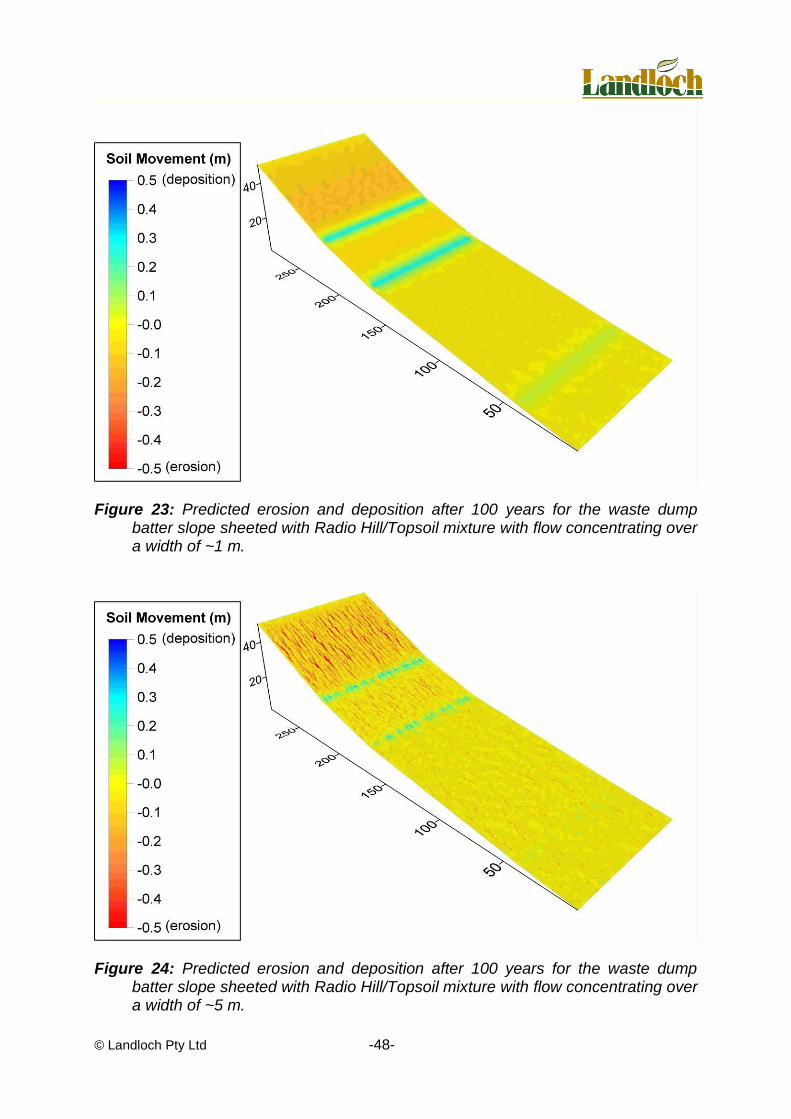
© Landloch Pty Ltd -48-
Figure 23: Predicted erosion and deposition after 100 years for the waste dump
batter slope sheeted with Radio Hill/Topsoil mixture with flow concentrating over a width of ~1 m.
Figure 24: Predicted erosion and deposition after 100 years for the waste dump
batter slope sheeted with Radio Hill/Topsoil mixture with flow concentrating over a width of ~5 m.

© Landloch Pty Ltd -49-
In the case where flow concentrates over a wider spacing (~5 m), as will occur if rip lines are excessively large or poorly constructed, or where insufficient rock is supplied to armour the surface layer, an average eroded depth of 37 mm and peak eroded depth of 603 mm is predicted. Figure 24 clearly demonstrates that significant gully development is predicted to occur on the slope where flow is allowed to concentrate over 5 m rill spacing, particularly on the upper two batter sections.
8 DEVELOPMENT OF STABLE SLOPE PROFILES USING BIG MACK WASTE MATERIAL
WEPP simulations were performed for a continuous batter slope sheeted with Big Mack waste material. The batter heights investigated ranged from 10-50 m with both linear and concave batter slopes modelled. Gully erosion currently exists on the Big Mack dump at locations where poor dump construction has allowed water to pond and concentrate, particularly within large rip lines. Similar to the dump containing clay wastes (in the future, Big Mack material may be used to sheet the clay waste in any case), use of a continuous batter (without berms) is strongly recommended. The Big Mack material tested in this study contained smaller diameter rocks than has
been observed on site. Therefore critical shear (c) was adjusted to reflect the
rockier, less erodible material that has been observed. Critical shear (c) values used were 14 Pa (as measured in the laboratory) and 30 Pa (a conservative estimate based on digital imagery techniques, achievable for a rocky surface with a mean rock diameter of 75-100 mm). Table 12 outlines the results of the WEPP modelling.
8.1 10 m high continuous batter
For the Big Mack material with larger-sized rock (and correspondingly high c value of 30 Pa), simulations of a 10 m high linear batter with a gradient of 36% (20º) is predicted to be sufficiently stable, having an average annual erosion rate of 0.2 t/ha/y, with peak erosion rates of 1.5 t/ha/y at the toe of the dump. Use of a concave profile for this material on this height is not required as use of a continuous linear batter with the maximum allowable batter gradient (36%) is stable.
For the Big Mack material with smaller sized rock (c value = 14 Pa) a batter gradient of 6% is required for a batter to be sufficiently stable (Table 12). The stable linear batter has a batter footprint of 167 m (horizontal distance from the batter crest), compared with 67 m for the 10 m high concave batter option for the same material (Table 12).
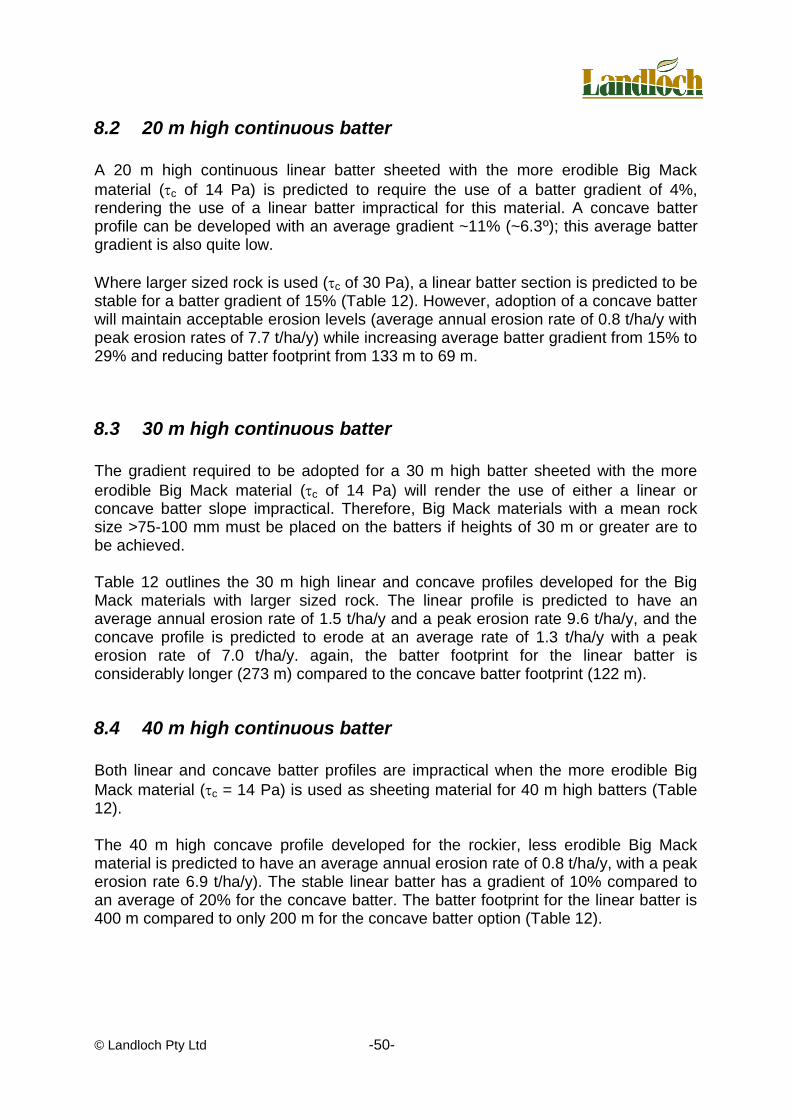
© Landloch Pty Ltd -50-
8.2 20 m high continuous batter
A 20 m high continuous linear batter sheeted with the more erodible Big Mack
material (c of 14 Pa) is predicted to require the use of a batter gradient of 4%, rendering the use of a linear batter impractical for this material. A concave batter profile can be developed with an average gradient ~11% (~6.3º); this average batter gradient is also quite low.
Where larger sized rock is used (c of 30 Pa), a linear batter section is predicted to be stable for a batter gradient of 15% (Table 12). However, adoption of a concave batter will maintain acceptable erosion levels (average annual erosion rate of 0.8 t/ha/y with peak erosion rates of 7.7 t/ha/y) while increasing average batter gradient from 15% to 29% and reducing batter footprint from 133 m to 69 m.
8.3 30 m high continuous batter
The gradient required to be adopted for a 30 m high batter sheeted with the more
erodible Big Mack material (c of 14 Pa) will render the use of either a linear or concave batter slope impractical. Therefore, Big Mack materials with a mean rock size >75-100 mm must be placed on the batters if heights of 30 m or greater are to be achieved. Table 12 outlines the 30 m high linear and concave profiles developed for the Big Mack materials with larger sized rock. The linear profile is predicted to have an average annual erosion rate of 1.5 t/ha/y and a peak erosion rate 9.6 t/ha/y, and the concave profile is predicted to erode at an average rate of 1.3 t/ha/y with a peak erosion rate of 7.0 t/ha/y. again, the batter footprint for the linear batter is considerably longer (273 m) compared to the concave batter footprint (122 m).
8.4 40 m high continuous batter
Both linear and concave batter profiles are impractical when the more erodible Big
Mack material (c = 14 Pa) is used as sheeting material for 40 m high batters (Table 12). The 40 m high concave profile developed for the rockier, less erodible Big Mack material is predicted to have an average annual erosion rate of 0.8 t/ha/y, with a peak erosion rate 6.9 t/ha/y). The stable linear batter has a gradient of 10% compared to an average of 20% for the concave batter. The batter footprint for the linear batter is 400 m compared to only 200 m for the concave batter option (Table 12).
© Landloch Pty Ltd -51-
Table 12: WEPP model output for a range on batter heights, slope types, and sheeting materials
Vertical batter height (m)
Slope type Erosion
resistance
Horizontal distance from
batter crest (m)
Batter gradient
(%)
Batter gradient
(°)
Average annual erosion (t/ha/y)
Peak average annual erosion
(t/ha/y)
10
Linear Low, c = 14 Pa 0-167 6 3.4 1.5 7.4
High, c = 30 Pa 0-28 36 20.0 0.2 1.5
Concave Low, c = 14 Pa
0-24 25 14.0 1.6 7.6
24-67 9 5.1
High, c = 30 Pa Continuous linear batter with maximum allowable gradient is stable.
20
Linear Low, c = 14 Pa 0-500 4 2.3 1.4 6.7
High, c = 30 Pa 0-133 15 8.5 0.8 7.3
Concave Low, c = 14 Pa
0-35 25 14.0
1.8 7.2 35-75 12 6.8
75-130 7 4.0
130-180 5 2.3
High, c = 30 Pa 0-48 33 18.3
0.8 7.7 48-69 20 11.3
30
Linear Low, c = 14 Pa Not practically achievable
High, c = 30 Pa 0-273 11 6.3 1.5 9.6
Concave
Low, c = 14 Pa Not practically achievable
High, c = 30 Pa
0-55 33 18.3
1.3 7.0 55-95 20 11.3
95-122 15 8.5

© Landloch Pty Ltd -52-
Table 12 cont’d: WEPP model output for a range on batter heights, slope types, and sheeting materials
Vertical batter height (m)
Slope type Erosion
resistance
Horizontal distance from
batter crest (m)
Batter gradient
(%)
Batter gradient
(°)
Average annual erosion (t/ha/y)
Peak average annual erosion
(t/ha/y)
40
Linear Low, c = 14 Pa Not practically achievable
High, c = 30 Pa 0-400 10 5.7 2.1 8.4
Concave
Low, c = 14 Pa Not practically achievable
High, c = 30 Pa
0-60 36 19.8
0.8 6.9 60-150 15 8.5
150-200 10 5.7
50
Linear Low, c = 14 Pa Not practically achievable
High, c = 30 Pa 0-625 8 4.6 1.2 6.9
Concave
Low, c = 14 Pa Not practically achievable
High, c = 30 Pa
0-65 36 19.8
1.1 5.1 65-160 15 8.5
160-210 12 6.8
210-285 9 5.1

© Landloch Pty Ltd -53-
8.5 50 m high continuous batter
Only a concave batter profile using the more erosion resistant Big Mack material
(mean rock diameter of 40 mm and correspondingly high c value of 30 Pa) is predicted to be stable (Table 12). The average annual erosion for this batter is predicted to be 1.1 t/ha/y, with a peak erosion rate of 5.1 t/ha/y.
9 GENERAL LANDFORM RECOMMENDATIONS The following recommendations refer to all landforms to be rehabilitated, irrespective of material type (unless otherwise stated).
9.1 Timing of rehabilitation works
Erosion potential is greatest during the wetter months of December to March (Figure 18). Therefore, rehabilitation works should be scheduled to finish no later than November each year, giving disturbed surfaces some chance to consolidate under smaller rainfall events at the beginning of the wet season and also the opportunity for vegetation to establish prior to the erosive December to March period.
9.2 Fertiliser application
Soil nutrient status of all materials is low (Table 5), though not expected to be high given the seasonally-controlled low rainfall regime and the local (native) vegetation that is considered to be adapted to low-fertility conditions. However, when topsoils are stripped, handled and stockpiled, the existing nutrient in standing biomass is commonly lost. Waste materials typically have low fertility. Therefore, successful and rapid re-establishment of native vegetation will require fertiliser application. Likely fertiliser requirements are not high – N and P requirements could be supplied through application of 100-150 kg/ha of DAP (diammonium phosphate). Application of a low level of gypsum (1 t/ha) would be desirable to address the low levels of S (Table 5). Application of a typically immobile element such as P to the surface of soils high in iron oxides is unlikely to be successful. Therefore, incorporation/mixing of fertiliser to a depth of at least 0.1 m is strongly recommended. Trialling fertiliser rates is encouraged, particularly because there may be considerable fixation of P in the soils, and application rates may need to be increased to obtain a response to P if fixation rates are high. It is also advisable to trial application and incorporation of single superphosphate as a source of P, as it is likely to be less susceptible to rapid immobilisation of P than, for example DAP. Single superphosphate would also have the advantage of being a source of S.

© Landloch Pty Ltd -54-
9.3 Rehabilitation requirements for specific waste types
9.3.1 Dispersive and potentially saline clay wastes
There are risks associated with storing dispersive and potentially saline wastes – such as the clay wastes – in above-ground waste dumps. Ideally, these wastes should be back-filled to pits, though this is often not possible. These risks can be managed by appropriate landform design. In practice, poor construction and inadequate design of surface water management features are major contributors to problems associated with dispersive materials in general and with tunnel erosion in particular. For waste dumps that contain clay wastes, surface stability of the batters can be increased by:
a) Amendment of the clay wastes with gypsum at a rate of 2 t/ha to a depth of 300 mm.6.
b) Deep ripping of the clay waste as deep as possible with tynes spaced <1 m apart. The close ripping is to ensure that large rip lines (>200 mm) are not produced.
c) Application of 400 mm of rock/topsoil mixture on to the surface of the amended and ripped clay waste.
d) Fertiliser being applied to maximise vegetation vigour and density. e) Lightly ripping the topsoil mixture on-contour to remove any distinct
boundaries between the topsoil and the underlying waste and to incorporate the applied fertiliser. Care should be taken not to bring up large quantities of clay waste during this process; and
f) Establishing perennial and deep-rooted vegetation.
9.3.2 Non-dispersive wastes
Dumps that do not contain clay wastes are not prone to tunnelling and therefore these non-dispersive wastes do not require amendment with gypsum. However, it is recommended that the sheeting materials be fertilised to maximise vegetation growth.
9.4 Landform tops and bunding
For the recommended batter profile to be stable and sustainable, it will be critical to retain runoff on the top of the rehabilitated landform. Discharge of concentrated flows from the top of waste landforms onto the outer batter slopes is a very common cause of gullying and landform failure. This is particularly true in the Pilbara, where the majority of runoff occurs from relatively few rainfall events.
6 Calculation assumes ESP will be reduced to 4%, a soil bulk density of 1.4 g/cm³, and 70%
effectiveness of gypsum.

© Landloch Pty Ltd -55-
Although average annual rainfall is low, the Woodie Woodie area is subject to high intensity (cyclonic) rainfall events. The median storm duration, based upon rainfall intensities derived from values observed at Warrawagine, is ~4 hours. A storm with a duration of 4 hours and an average recurrence interval of 100 years will deliver 80 mm of rain (BOM 2010. A 1 in 100 year 72 hour event will deliver ~320 mm of rain at an average intensity of ~4.5 mm/hr. Therefore, dump top areas should be designed to cope with a maximum ~320 mm depth of rain falling in a 72 hour period. To maximise infiltration into the dump top, reduce the time of ponding and increase the availability of water to vegetation, it is recommended that prior to spreading topsoil, this area is amended with gypsum at a rate of 5 t/ha, and ripped with tines on a <1 m spacing to the greatest depth possible. The aim of the initial deep ripping is to incorporate the gypsum, break up any compaction of the surface due to vehicle traffic and to increase the depth of drainage. Soil should then be spread to a depth of 200 mm and vegetation seeded, with the seeding mix focussing on deep-rooted and perennial species. Use of deep rooted vegetation will maximise the rooting depth available to use infiltrating water (and in turn reduce the potential for deep drainage to depths below the active root zone).
9.4.1 Perimeter and cross bunding
Uncontrolled discharge of runoff from the tops of dumps is a major cause of gullying on the outer batter slopes, and dump top perimeter and cross-bunding are essential. Figure 25 shows an example of this bunding. The perimeter bunds should be:
At least 1 metre high;
Thoroughly compacted and constructed of stable material;
Have their outer face continuous with the outer batter profile and have the same surface treatments applied to it;
Have a width across the top of the bund of at least 2 m; and
Have their inner face sloping gradually inwards at a gradient of 1V:10H.

© Landloch Pty Ltd -56-
Figure 25: Example of cross bunding and perimeter bunding on a dump in the northern WA Goldfields (image sourced from Google Earth)
The gentle inward gradient ensures that any water that ponds will be ponded well away from the outer batter slope, thereby minimising the potential for any sink-hole or tunnel that forms to reach the outer batter slope. It is critical to ensure that any runoff generated on the top of a constructed landform does not travel significant distances and concentrate to create prolonged ponding. Cross-bunding is used to prevent flow concentrations, and should be constructed such that:
compacted bunds are 0.75 m high – 2 m wide across the top – to create cells of 1-3 ha in area on the top of the landform;
the land surface within each cell is as close to level as possible; and
surface ripping will hold rainfall excess close to its point of origin. For dump tops, greater depths of rip lines (and heights of mounds between them) can be tolerated, as there is not the concern of rip lines increasing the distance between rill lines.
© Landloch Pty Ltd -57-
9.5 Batter slopes
To achieve long-term stability of batter slopes on this landform, it is critical that flow concentration be minimised. Concentration of overland flow can be prevented by:
(a) Minimising the size of cross-slope rip lines; and (b) Maximising surface coverage by rock.
Rip lines should be no deeper than 200 mm. Ripping will be desirable to incorporate fertiliser to encourage vegetation growth. Note that – given the low annual rainfall - vegetation is highly unlikely to establish at levels sufficient to cause any significant reduction in erosion. Vegetation is aesthetically desirable, but is unlikely to modify runoff or erosion on the batter slopes. Given the extreme importance of minimising flow concentration on the batter slopes, it will be essential that construction does not create flow-concentrating features. Of particular concern are:
Rip lines off contour;
Indents in batter slopes; and
Sharp corners which render ripping on the contour extremely difficult. If possible, equipment used for rehabilitation works should have precision guidance systems installed. Operators should be highly skilled and experienced. It is noted that rehabilitation earthworks are significantly different to earthworks typically conducted by mining staff, and requires great precision and adherence to the specified designs if successful rehabilitation is to be achieved.
9.6 Dump construction
When constructing the waste landform, it is recommended that waste be placed in lifts with the spacing between the lifts set to minimise the amount and distance of material movement required during final reshaping to exactly balance the cut and fill. Minimising the volume of material to be moved during reshaping can significantly reduce rehabilitation costs (savings of >30% have been observed). For the concave design provided, when starting another lift during dump construction, the distance from the crest of the lower lift and the toe of the new lift will vary with the changing final batter shape. As much as possible, each lift should be completed prior to construction of the next lift. Failure to complete lifts prior to commencing the next lift tends to increase the costs and complexity of subsequent rehabilitation works.

© Landloch Pty Ltd -58-
9.7 Sheeting batter slopes with rock armour
Waste dump batters being sheeted with a rock/soil mixture must use rock with a D50 of ~75-100 mm and a rock particle density >2.7 g/cm³. This rock/soil mixture will form the growth media layer. Key requirements for the sheeting layer include:
Sufficient rock should be added such that >20-30% cover is achieved.
A sufficiently thick layer of rock/topsoil mixture should be applied to reduce the risk of exposure of the underlying clay waste.
Both these requirements can be achieved by mixing a 200 mm deep layer of rock into 200 mm of soil. Establishment of this 400 mm thick sheeting layer can be practically achieved by:
Spreading topsoil over the clay waste at a thickness of 200 mm;
Spreading the layer of rock over the topsoil at a thickness of 200 mm; and
Ripping the two layers together to a depth of ~300 mm (to avoid disturbance of the underlying clay waste).
9.8 Landform shape
Where batters are not linear or convex in plan view, there is potential for water-concentrating areas (indents) to be created (Figure 26). Indents may be large or quite small, but are of concern irrespective of magnitude. Such features should be avoided if at all possible. From Landloch‟s experience with many waste dumps across Australia, one consistent observation is that erosion (rills, gullies) occurs most frequently on corners of waste dumps. Dozers are less successful at cross-ripping on-contour when the dozer works around corners, irrespective of the skill of the operator. Not surprisingly, the problem is accentuated when the corner is sharp. Ideally, all corners should have a radius of curvature of at least 100 m.
Figure 26: Conceptual plan view of a waste landform showing flow-concentrating
features.
Converging geometries

© Landloch Pty Ltd -59-
10 REFERENCES Boggs, G. S., Evans, K. G., Devonport, C. C., Moliere, D. R., and Saynor, M. J.
(2000). Assessing catchment-wide mining-related impacts on sediment movement in the Swift Creek catchment, Northern Territory, Australia, using GIS and landform-evolution modelling techniques. Journal of Environmental Management 59: 321-334.
Boucher, S.C., 1990: Field Tunnel Erosion: its Characteristics and Amelioration.
Monash University, Clayton and Department of Conservation and Environment,
East Melbourne.
Bureau of Meteorology (BOM), (2010) Rainfall intensity frequency duration data,
http://www.bom.gov.au/hydro/has/cdirswebx/cdirswebx.shtml
Department of Industry and Resources (DoIR), 2001, Environmental notes on mining.
Waste rock dumps, State of Western Australia.
Department of Industry and Resources (DoIR), 2006, Review of environmental
performance bonds in Western Australia, Mining Environmental Management
Guidelines, State of Western Australia.
Department of Minerals and Energy (DME), (1996), Guidelines for mining in arid
environments, State of Western Australia.
Environmental Protection Authority (EPA), (2006), Guidance for the assessment of
environmental factors (in accordance with the Environmental Protection Act
1986). Rehabilitation of terrestrial ecosystems. Guidance statement No. 6, State
of Western Australia
Evans, K.G., Willgoose, G.R., Saynor, M.J., and House, A. (1998). Effect of vegetation and surface amelioration on simulated landform evolution of the post-mining landscape at ERA Ranger Mine, Northern Territory. Supervising Scientist Report 134, Environment Australia.
Flanagan, D.C., and Livingston, S.J. (1995). Water Erosion Prediction Project
(WEPP) Version 95.7 User Summary. In (Flanagan and Livingston, editors)
„WEPP user summary‟, NSERL Report No 11, July 1995.
Hancock, G.R. (2004 a) Modelling soil erosion on the catchment and landscape scale using landscape evolution models – a probabilistic approach using digital elevation model error. In “SuperSoil 2004”. Australian Society of Soil Science Inc.
Hancock, G.R. (2004 b). The use of landscape evolution models in mining
rehabilitation design. Environmental Geology 46: 1432-1495
© Landloch Pty Ltd -60-
Hancock, G., Evans, K.G., Willgoose, G.R., Moliere, D., Saynor, M. and Loch, R.J. (2000). Long-term erosion simulation on an abandoned mine site using the SIBERIA landscape evolution model Australian Journal of Soil Research 38: 249-264.
Hancock, G.R., Loch, R.J., and Willgoose, G.R. (2003). The design of post-mining
landscapes using geomorphic principles. Earth Surface Processes and Landforms 28: 1097-1110.
Hancock, G.R. and Turley, E. (2006). Evaluation of proposed waste rock dump
designs using the SIBERIA erosion model. Environmental Geology 49: 765-779.
Hancock G.R., Willgoose G.R. (2004) An experimental and computer simulation
study of erosion on a mine tailings dam wall, Earth Surface Processes and Landforms. 29, 457-475.
Hancock, G., Willgoose, G.R., and Evans, K.G. (2002). Testing of the SIBERIA
landscape evolution model using the Tin Camp Creek, Northern Territory, Australia, field catchment. Earth Surface Processes and Landforms 27: 125 – 143.
Hazelton P, and Murphy B. (2007), Interpreting soil test results. What do all the
numbers mean?, CSIRO Publishing, Collingwood.
Landloch Pty Ltd (2006). Validation of a risk assessment model for tunnel erosion on
waste dumps. ACMER Project R68. Australian Centre for Minerals Extension
and Research.
Landloch Pty Ltd (2009a), Site Visit Report. Report prepared for Consolidated
Minerals Limited.
Landloch Pty Ltd (2009b), Assessment of erosion potential – Big Mack West waste
dump on Woodie Woodie. Memorandum prepared for Consolidated Minerals
Limited.
Loch, R.J. (1989), Aggregate breakdown under rain: its measurement and
interpretation. PhD Thesis, University of New England.
Loch, R.J and Foley, J.L. (1994). Measurement of aggregate breakdown under rain:
comparison with tests of water stability and relationships with field measurements
of infiltration. Australian Journal of Soil Research 32: 701-720.
Loch, R. J., Robotham, B. G., Zeller. L., Masterman, N., Orange, D. N., Bridge, B. J.,
Sheridan, G., and Bourke, J. J. (2001). A multi-purpose rainfall simulator for
field infiltration and erosion studies. Australian Journal of Soil Research 39:
599–610.

© Landloch Pty Ltd -61-
MBS Environmental (2010), Waste characterisation report, Woodie Woodie
Manganese Operations, East Pilbara, Western Australia, Report prepared for
Pilbara Manganese Pty Ltd.
Mengler, F.C., Hancock, G.R., Gilkes, R., and Grant, C. (2004). Managing erosion in rehabilitated bauxite mine soils using the SIBERIA landform evolution model. In “SuperSoil 2004”. Australian Society of Soil Science Inc.
Vacher CA, Loch RJ, Raine SR, (2004) Identification and Management of Dispersive
Mine Spoils, Australian Centre of Mining Environmental Research.
Van Vreeswyk A.M.E., Payne A.L., Leighton K.A. and Hennig P., 2004. An inventory and condition survey of the Pilbara region, Western Australia. Technical Bulletin No 92. Department of Agriculture, State of Western Australia.
Willgoose, G.R. (1993). „A preliminary assessment of the effect of vegetation on the long-term erosional stability of the proposed above-grade rehabilitation strategy at Ranger Uranium Mine‟, Open File Record 119, Supervising Scientist for the Alligator Rivers Region, Canberra.
Willgoose, G.R., Bras, R.L., and Rodrigues-Iturbe, I. (1989). Modelling of the
erosional impacts of land use change: A new approach using a physically based catchment evolution model. [In] Hydrology and Water Resources Symposium 1989, Christchurch, NZ. National Conf. Publ. no 89/19, The Institution of Engineers, Australia, pp. 325-329.
Willgoose, G.R., Bras, R.L., and Rodriguez-Iturbe, I. (1991). A physically-based
channel network and catchment evolution model: I Theory. Water Resources Research 27: 1671-1684.
Willgoose, G.R. (1994). A physical explanation for an observed area-slope-elevation
relationship for declining catchments. Water Resources Research 30: 151-159.
Willgoose, G., Hancock, G., and Kuczera, G. (2003). Testing of an erosion-based
landform evolution model using objective statistics. Geophysical Research Abstracts, Vol. 5, EAE03-A-11904.
Willgoose, G.R. and Riley, S.R. (1995). „Application of a catchment evolution model to the prediction of long term erosion on the spoil heap at Ranger Uranium Mine: Stage 1 report‟, Open File Rec. 107, Supervising Scientist for the Alligator Rivers Region, Canberra.
Wischmeier, W. H., and Smith, D. D. (1978). Predicting rainfall erosion losses - a
guide to conservation planning. US Department of Agriculture. Agriculture
Handbook No. 537. US Government Printing Office, Washington, DC

© Landloch Pty Ltd -62-
11 DISCLAIMER 1. The calculations leading to results listed in the attached document are based on
experimental information on soil/waste properties. They are also based on climate information which was supplied to the person making the calculations. It remains impossible to check the accuracy and relevance of that climate information, and, therefore, relevance of the results shown in the attached document are only probabilities (chances).
2. Erosion calculations used the WEPP model. Landloch can take no responsibility for any errors that may be the result of inadequacies in the coding or content of that model.
3. The information relating to weather patterns and other information on which the calculations for the attached document are based, was supplied to Landloch and used to develop a WEPP climate file. While all endeavours have been used to check the information, Landloch cannot guarantee that there are no inaccuracies in the data, which in turn may generate errors in calculations or modelling outputs.
4. It is impossible and has been impossible to verify the accuracy or relevance of any of that information.
5. The calculations in the attached document are based on that unverified climate information.
6. It is not possible to guarantee that any prediction or result contained in the attached document will or might occur.
7. No guarantee is given that any prediction or result contained in the attached document will or might occur.
8. All models used in the preparation of information included in this document can have errors or inadequacies that may generate miscalculation and provide data that could be misleading. Whilst making every endeavour to ensure these limitations of the models do not impact on the final recommendations, management options and landform design, Landloch cannot guarantee the complete accuracy of interpretation and therefore limits liability for the results of actions resulting from implementation of this report to the fees charged.

© Landloch Pty Ltd -63-
12 GLOSSARY OF TERMS Consolidation refers to increases in soil bulk density and cohesive strength that occur as a consequence of repeated wetting and drying under natural conditions. Armouring refers to the accumulation of coarse (rocky) particles at the soil surface due to preferential removal of finer size fractions. Interrill erosion describes the detachment and movement of particles by the combined action of raindrops and shallow overland flows. When a drop impacts the flow, the resulting turbulence ejects particles up into the flow, and the particles remain in the flow for a period of time, during which the particle travels some distance in the direction of flow. In the absence of raindrop impact, such shallow flows have little or no erosive capacity. Rill erosion refers to the detachment and transport of sediment by concentrated lines of overland flow. Rill development is associated with development of characteristic turbulence patterns that cause the incision of rill channels. In agriculture, rills are defined as flow channels small enough to be removed by tillage. Gullies are defined in agriculture as overland flow channels too large to be removed by tillage. Erodibility refers to the rate of detachment and/or movement of soil in response to some erosive force. The exact definition of erodibility varies from model to model, depending on the types of erosive forces considered. Equally, the units of erodibility may seem somewhat counter-intuitive, but are a function of the units used in calculating erosive forces. Some models, such as WEPP, use different erodibility factors for different erosion process. Rill erodibility (WEPP) is the rate of detachment in a rill per unit of effective shear stress. Critical flow shear stress for rill initiation is the flow shear stress at which rill detachment commences. Flow shear stress is a function of flow depth and gradient, with effective shear stress being calculated as total shear less critical shear.
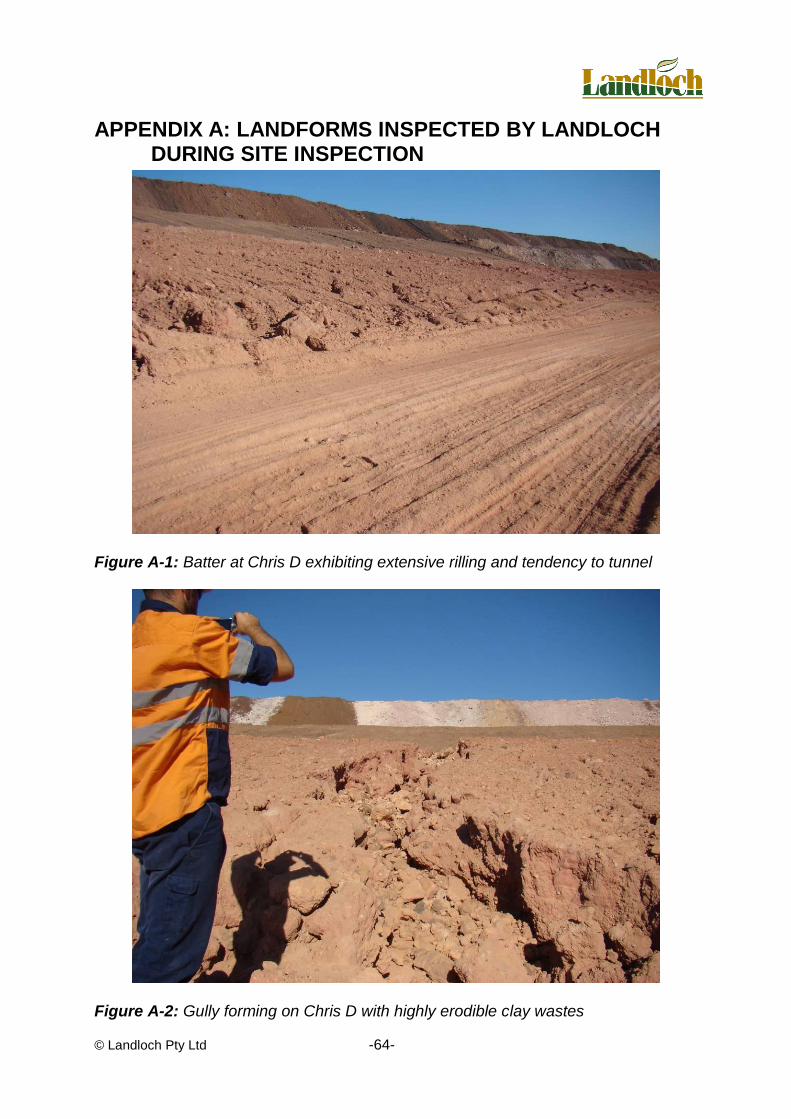
© Landloch Pty Ltd -64-
APPENDIX A: LANDFORMS INSPECTED BY LANDLOCH DURING SITE INSPECTION
Figure A-1: Batter at Chris D exhibiting extensive rilling and tendency to tunnel
Figure A-2: Gully forming on Chris D with highly erodible clay wastes

© Landloch Pty Ltd -65-
Figure A-3: Hanna/Lox vegetation establishment is poor, and surfaces are extensively rilled and gullied.
Figure A-4: Gully erosion resulting from failure to adequately control surface water.

© Landloch Pty Ltd -66-
Figure A-5: Tunnels forming in dispersive clay wastes where water is allowed to
pond for extended periods. Importantly, application of soils at shallow depths has done little to minimise tunnel potential.

© Landloch Pty Ltd -67-
APPENDIX B: MATERIAL CHARACTERISATION DATA
Agricultural Chemistry Pty Ltd
Soil Analysis Report
Batch Number: 10/33 Date Received: 28/4/2010
Date Completed: 18/5/2010
Client: Landloch Pty Ltd
Lab No Client Ref No Profile PSA-CS
PSA-
FS
PSA-
Silt
PSA-
Clay ADMC
% % % % %
1 Woodie Woodie GS Top Soil 32 38 9 20 2.8
2 Woodie Woodie GS White 10 20 27 41 2.7
3 Woodie Woodie GS Yellow 12 35 15 37 4.5
4 Woodie Woodie Radio Hill 41 27 11 19 2.4
5 Woodie Woodie Big Mack 51 19 15 17 8.1
All results for particle size analysis and R1 are reported on oven-dried basis (no pre-treatment applied to
test samples)
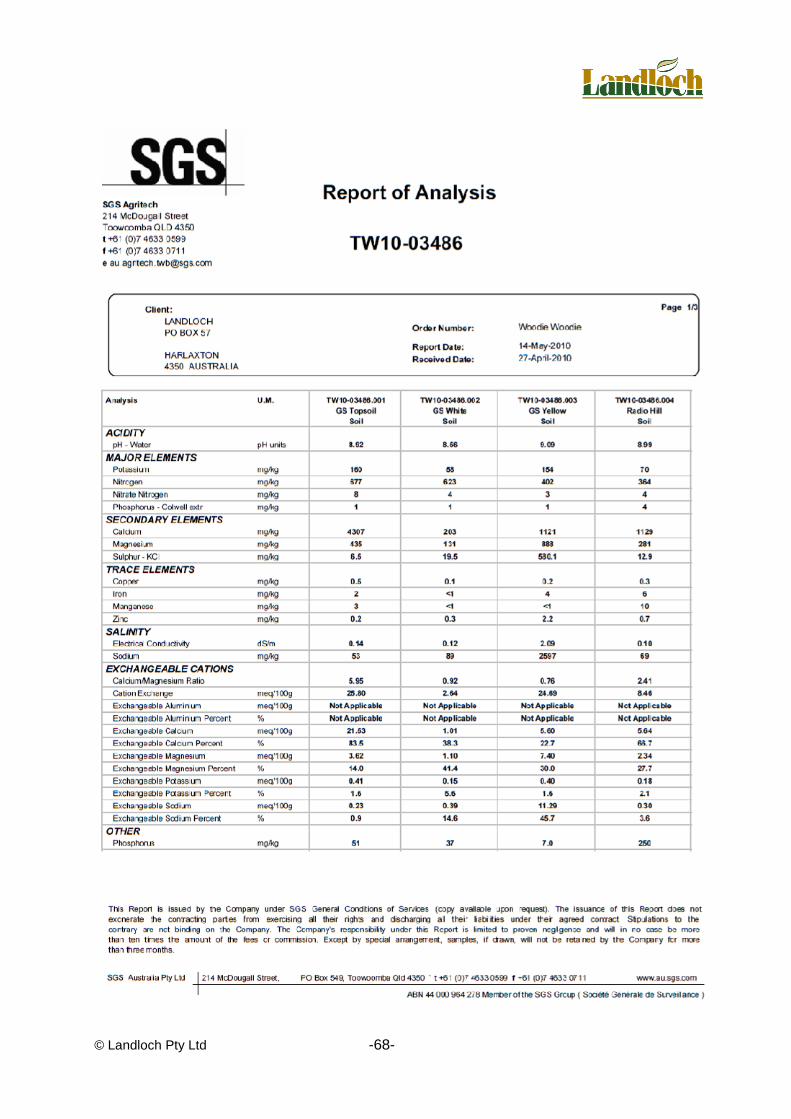
© Landloch Pty Ltd -68-

© Landloch Pty Ltd -69-

© Landloch Pty Ltd -70-

© Landloch Pty Ltd -71-
APPENDIX C: GENERATION OF A WEPP CLIMATE SEQUENCE FOR WOODIE WOODIE
INTRODUCTION Climate input files for Woodie Woodie are needed to simulate runoff and soil loss with the Water Erosion Prediction Project (WEPP) model. For each day of simulation, WEPP requires ten daily weather variables:
Precipitation (mm),
Precipitation duration (hrs),
Peak storm intensity,
Time to storm peak,
Average minimum temperature,
Average maximum temperature,
Dew point temperature,
Solar radiation,
Wind speed, and
Wind direction. Of these, the four precipitation-related variables (underlined in list above) are of particular importance because previous studies have shown that predicted runoff and soil loss are most sensitive to these precipitation variables (Nearing et al., 1990; Chaves and Nearing, 1991). For most sites around the world, complete historical weather data on these variables are not available. To use WEPP for runoff and erosion prediction, synthetic weather sequences that statistically preserve the mean and variations in the historical observations are required. CLIGEN is a stochastic weather generator that can be used to provide WEPP climate input files. CLIGEN has been extensively assessed for a wide range of climates in Australia, and it was found that CLIGEN was most suitable to provide the required climate input for WEPP to predict runoff and soil loss in Australia (Yu, 2003). This report briefly summarises how climate parameter values were prepared for CLIGEN to generate 100 years of daily data for the Woodie Woodie site.
DATA AND METHOD Daily climate data for Warrawagine were sourced from the Bureau of Meteorology (data available from 1900-2009). Pluviograph (rainfall intensity) data are available from the BOM‟s Warrawagine weather station (4041). This site contains data from August 1997 to August 2006. These data were used to generate rainfall intensity parameters for Woodie Woodie site.

© Landloch Pty Ltd -72-
Using the data sets outlined above, the following parameter values were computed and used for the Woodie Woodie site:
Mean daily precipitation on wet days for each month,
Standard deviation and skewness coefficient of daily precipitation for each month,
Probability of a wet day following a dry day for each month,
Probability of a wet day following a wet day for each month,
Mean daily max. temperature for each month,
Standard deviation of daily max. temperature for each month,
Mean daily min. temperature for each month,
Standard deviation of daily min. temperature for each month,
Mean maximum 30-min rainfall intensity for each month, and
Probability distribution of the dimensionless time to peak storm intensity. These parameter values were assembled to create a CLIGEN parameter file for the site. A 100-year climate sequence was generated using CLIGEN version 5.1 (Yu, 2002). The generated file is called Woodie.cli, and was generated for the arbitrary dates from 1 Jan 2100 to 31 December 2199. A random seed of 091110 was used for CLIGEN. This particular climate sequence can be reproduced with this specific random seed. Use of generated wind data has been switched off because no long-term wind data were available for the site, and Priestley-Taylor‟s method for estimating the potential evaporation will automatically be used by WEPP.
DATA ASSESSMENT The quality of the simulated climate sequence was compared with the observed data for the Warrawagine weather station. The long-term mean annual rainfall for the observed data set from Warrawagine is 324 mm, and the mean annual rainfall for the CliGEN climate sequence is 324 mm for the 100 years. The discrepancy is only 0%. Figure C-1 shows that mean monthly rainfall is also well preserved. The average absolute error between observed data and CliGEN data was 2.4 mm, a discrepancy of <1%.

© Landloch Pty Ltd -73-
Jan Feb Mar Apr May Jun Jul Aug Sep Oct Nov Dec
Month
0
20
40
60
80
Mean
Mo
nth
ly R
ain
fall (
mm
)
Observed Data
CLIGEN
Figure C-1: Observed and CLIGEN simulated mean monthly rainfall for the Woodie
Woodie site. The extreme daily rainfall events were also compared. Figure C-2 shows the annual daily rainfall compared with their average recurrence interval (ARI) for both the observed data and CliGEN data sets. It can be seen that for this particular sequence, the observed and simulated maximum daily rainfall totals match quite well, especially given the fact that rainfall at the site is highly variable. It shows that the extreme events in the GLIGEN dataset occur at the same frequency as observed and measured from climate data.
CONCLUSION A 100-yr CLIGEN-generated climate file for the Woodie Woodie site is based on observed data (daily data and rainfall intensity data) from the Warrawagine weather station.

© Landloch Pty Ltd -74-
0.1 1 10 100
ARI (yrs)
10
100
Daily
Rain
(m
m)
Observed Data
CLIGEN
Figure C-2: Maximum daily rainfall amount versus average recurrence interval.
REFERENCES Chaves, H. M. L., Nearing, M. A., 1991. Uncertainty analysis of the WEPP soil
erosion model. Transactions of the ASAE, 34: 2437-2444.
Nearing, M. A., Dear-Ascough, L, Laflen, J. M., 1990. Sensitivity analysis of the
WEPP Hillslope Erosion Model. Transactions of the ASAE, 33: 839-849.
Nicks, A. D., L. J. Lane, and G. A. Gander. 1995. Weather generator. Chapter 2 in
USDA–Water Erosion Prediction Project: Hillslope Profile and Watershed
Model Documentation. D. C. Flanagan and M. A. Nearing, eds. NSERL Report
No. 10. West Lafayette, Ind.: USDA–ARS Nat. Soil Erosion Research Lab.
Yu, B., 2002. Using CLIGEN to generate RUSLE climate inputs. Transactions of the
ASAE, 48: 993-1001.
Yu,B., 2003. An assessment of uncalibrated CLIGEN in Australia. Agricultural and
Forest Meteorology, 119: 131-148.


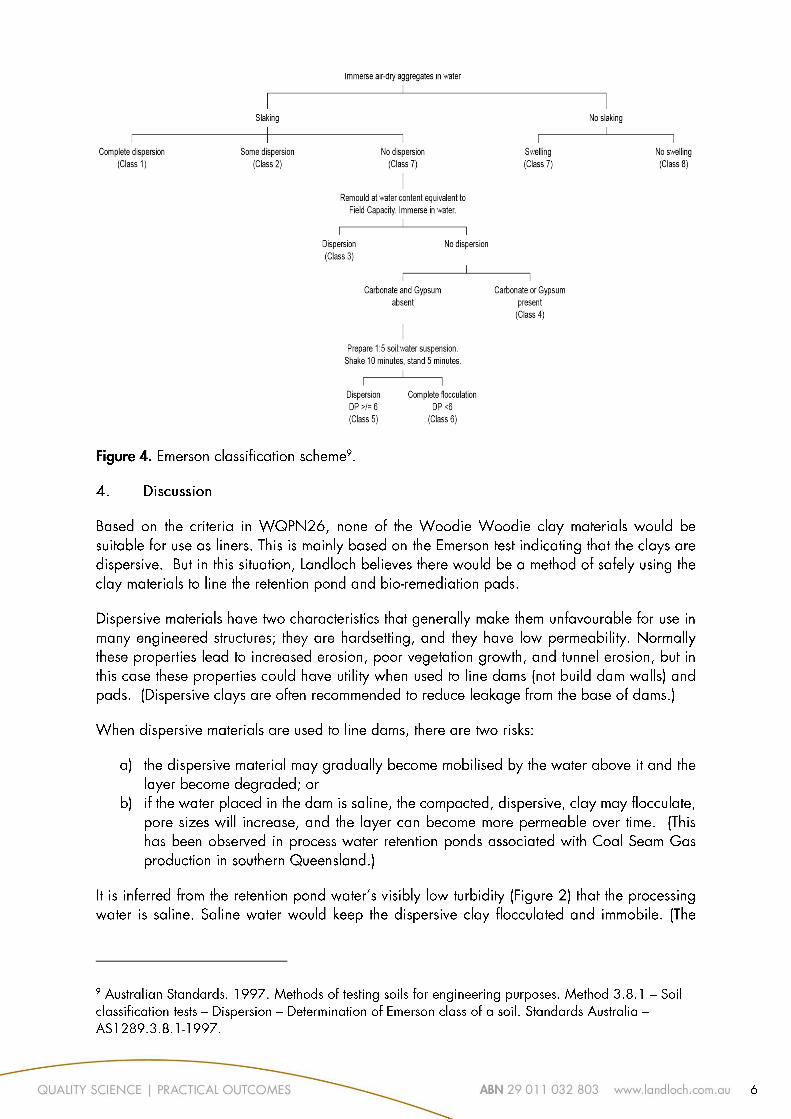


4 Cook Street West Perth WA 6005
Australia
Telephone +61 8 9226 3166 Facsimile +61 8 9226 3177
Email: [email protected]
Woodie Landform Figures 2016-5-12.docx
MEMORANDUM
Attention: Nathan Keogh From: Michael Dufty
Company: Pilbara Manganese Pty Ltd Date: 8/5/2016
Subject: Landform Conceptual Design Figures for MCP Project: Woodie Woodie MCP
1. INTRODUCTION
MBS were engaged by Pilbara Manganese Pty Ltd to provide conceptual waste rock landform designs based on site specific knowledge. These are to be included in the revised Mine Closure Plan (MCP) as what might be considered the most appropriate mine waste landform design rather than what PMPL are committing to undertake across all existing mine landforms. MBS understand these designs would be proposed as a general guide to preparation of specific landform designs in cases where the existing approved designs are thought not to be suitable to achieve closure objectives, and where completed rehabilitation has proved unsuccessful in creating a stable landform. The designs provided are based on waste material assessments carried out by Landloch on representative materials from the Woodie Woodie minesite between 2009 and 2012. Specific landform designs developed from the concepts will need to consider the specific materials and distribution of them in specific dumps, the drainage issues associated with the dump planform and location and availability of suitable additional materials to be brought in.
2. PREVIOUS LANDFORM STABILITY ANALYSIS
Three assessments of Woodie Woodie waste material for landform stability were carried out by Landloch between 2009 and 2012. The results are summarised in the following reports:
Assessment of Erosion Potential – Big Mack West Waste Dump on Woodie Woodie December 2009
Rehabilitation of Waste Landforms, Woodie Woodie Manganese Operation September 2010
Erosion Potential of Rocky Chert Waste Batters, Woodie Woodie Manganese Operation, February 2012. The majority of testing was done for the 2010 report. The 2012 report followed up assumptions made about rocky Chert Breccia waste in the 2010 report with physical testing of an additional sample and demonstrated this material was more erosion resistant than was assumed in the 2010 report. The assessments included laboratory testing of physical and erosion characteristics of samples of six different waste material types listed below:
White Clay (from Greensnake, 2010 report).
Yellow Clay (from Greensnake, 2010 report).
Topsoil (from Greensnake, 2010 report).
Chert Breccia with high ‘fines’ content (from Big Mack, 2010 report).

PILBARA MANGANESE PTY LTD WOODIE WOODIE OPERATIONS
CONCEPTUAL WASTE LANDFORMS
Woodie Landform Figures 2016-5-12.docx 2
Chert Breccia with low ‘fines’ content (from Greensnake, 2012 report).
Chert Breccia with low ‘fines’ content (from Radio Hill, 2010 report). The results of testing indicated that:
The Yellow Clay and White Clay wastes were not suitable for placement near the waste dump surface due to basic physical characteristics and erosion characteristics.
The Topsoil was highly erodible and not suitable by itself for typical slope lengths at Woodie Woodie.
The Chert Breccia with high ‘fines’ content (sampled from Big Mack) was moderately erosion resistant and suitable for use on shorter slopes.
The Chert Breccia with low ‘fines’ content (sampled from Greensnake and Radio Hill) is highly erosion resistant and suitable for use.
Landloch also advised, based on previous experience, that the Rocky material with low ‘fines’ content is not conducive to revegetation. Rock with fines or mixed with topsoil was recommended as the most suitable material for erosion resistance and revegetation.
2.1 MODELL IN G RESULT S
Landloch followed up the laboratory testing with WEPP runoff and erosion modelling and SIBERIA landform modelling using the material characteristics derived from the testing. Landloch’s criteria for acceptable erosion resistance are based on low tendency to rill as indicated by average erosion rate of <5 t/ha/yr with maximum erosion rate at any point on the slope of <10 t/ha/yr. Linear or concave batters were recommended. Use of linear batters separated by berms was not recommended as it greatly increases risk of gullies and tunnel erosion. The maximum recommended linear batter heights and slopes for the modelled materials are listed in Table 1. This shows that materials other than the rock/topsoil mixes with low ‘fines’ content are very limited in application. The 1:2 topsoil:rock mixture performed notably better than the 1:1 mixture and greater rock content will provide even greater erosion resistance. The rockier wastes are essentially non erodible. Results for concave batters have not been presented here as they are rarely suitable for application to existing landforms due to large earthworks requirements. They remain suitable for those dumps at Woodie Woodie which were designed and constructed with this profile in mind.
Table 1: Linear Slope Height and Slope Limits for Woodie Waste Mater ials
Material Linear Slope Maximum Height
White or Yellow Clay (Greensnake) Not Suitable Not Suitable
Topsoil without rock 20 degrees 3 m
Big Mack Chert Breccia (high fine content) 14 degrees 12 m
1 Topsoil: 1 Radio Hill Rock mix 18 degrees 25 m
1 Topsoil: 2 Rocky Chert mixture 20 degrees 55 m (60 m at 16 degrees)
Radio Hill Rock without fines 20 degrees non-erodible
The Greensnake Chert Breccia sample tested had very low fines content (2%) and mean particle size (D50) of 40mm. This showed no rilling when tested alone or mixed 2:1 with topsoil (~33% fines for mixture). The Radio Hill Chert Breccia also had very low ‘fines’ content though this was not quantified. This was tested in a 1:1 mixture with topsoil (~45% fines) and produced significantly worse model results, requiring concave batters for dumps

PILBARA MANGANESE PTY LTD WOODIE WOODIE OPERATIONS
CONCEPTUAL WASTE LANDFORMS
Woodie Landform Figures 2016-5-12.docx 3
greater than 25m high. Based on these results it is expected that a surface with fines content less than approximately 33% will be suitable for all dumps up to 55 m high. Higher fines content may be acceptable on lower dumps. Landloch conducted SIBERIA modelling of erosion gullies to determine the depth of rock/topsoil mix required over less competent material to ensure gullies did not penetrate. They recommended a minimum of 0.4m thickness cover of rock and soil mix over clay wastes, this being three times the maximum modelled erosion depth.
2.2 ADDIT IONAL DESIGN RECOMMENDATIONS FR OM LANDL OCH
The Landloch reports included the following additional recommendations not directly related to the model results.
Amendment of surface clay wastes with gypsum at 2 tonnes/ha to a depth of 0.3 m is recommended prior to sheeting to reduce tunnelling.
Crest bunds at top of dumps are critical to ensure no runoff from dump tops goes over the batters. These should be 1 m high, compacted, made of stable material, have top width >=2 m, and inner face gradient of 1:10. Outer face should be continuous with dump batters.
Rip lines on batters should be less than 0.2 m deep.
Mixing of rock and topsoil needs to be done effectively. The recommended method is for alternating rows of rock and topsoil to be placed and pushed down the slope by bulldozer.
3. PROPOSED CONCEPTUAL LANDFORM DESIGN .
Based on the Landloch work described above linear slopes up to 20 degrees would be suitable for all waste landforms up to 55 m high at Woodie if surfaced with suitable material equivalent to the tested 1:2 Topsoil:Chert (low fines) mixture. Two conceptual landform designs have been developed based on this criteria. One for batters without clay waste materials present near the surface (Figure 1) and one for batters with clay waste materials near the surface (Figure 2). The difference between the designs is the thickness of erosion resistant material required at the surface, 0.4m for clay wastes and 0.25m for non-clay waste. Landloch recommended a cover thickness of three times the modelled maximum gully depth over clay materials. The non-clay wastes are reasonably erosion resistant over short distances, so the consequences of gullies penetrating the cover over these materials would not be as severe as for clay. The proposed cover thickness of 0.25 metres for these materials is still twice the modelled maximum gully depth. The proposed crest bund specification differs slightly from the Landloch recommendations to facilitate easier construction while still preventing ponding of water near the batter crest.
3.1 LANDF ORM SPEC IF ICAT ION
Both conceptual designs have similar landform requirements:
Waste dump batters steeper than 20 degrees or containing intermediate berms are to be pushed down to a constant linear slope of 20 degrees or less.
Crest bunds and backsloped dump tops are to be completed to contain all rainfall on dump top surfaces. The bunds are to be 1.5m high, made of stable rocky material, and have top width >=2m, The top surface of the dump is be backsloped at a gradient of 1:10 for 15 m inward from the bund.
The surface of the batters is to be composed of erosion resistant rock/topsoil mix to a depth of 0.4m over clay wastes and 0.25m over other waste rock.

PILBARA MANGANESE PTY LTD WOODIE WOODIE OPERATIONS
CONCEPTUAL WASTE LANDFORMS
Woodie Landform Figures 2016-5-12.docx 4
3.1.1 Speci f icat ion for Batter Surface Cover .
Based on the Landloch studies, to achieve suitable erosion resistance the surface rock/soil mix should have a fines content of less than 33%. This can be achieved in a number of ways depending on the specific dump composition:
Waste dump batters covered with competent rocky waste with low fine content only require mixing of topsoil into the surface rock to promote revegetation.
Waste dump batters covered with rocky waste with high fines content will require more suitable rocky waste (with lower fine content) to be brought in and used to sheet the dump surface after mixing with topsoil.
Waste dumps batters with clay waste will require suitable rocky waste with low fines content to be brought in and used to sheet the dump surface after mixing with topsoil.
Gentler slopes than 20 degrees are preferable where possible. Older Woodie Woodie dumps constructed with 10 m wide berms at 10 m intervals will typically produce a 16 degree slope if pushed down to a single linear batter. Table 2 shows some examples of how rock and topsoil could be mixed to achieve the required specification. For cover over the clay wastes the additional thickness below 0.25m could be made up with rock alone (no topsoil). Rock with 16% to 33% fines content is not recommended to be used if topsoil is available but could be used without topsoil if no topsoil is available.
Table 2: Example Cover Composit ion
Rock fines content Application over non-clay waste Application over clay waste
< 5% fines 0.1 m topsoil/0.2 m rock As for non-clay over 0.1 m rock layer underneath
5 to 16% fines 0.05 m topsoil/0.2 m rock As for non-clay over 0.15 m rock layer underneath
3.2 L IM ITATION S A ND APPLICATION
The designs provided are supported by laboratory tests and modelling of specific material collected from the Greensnake area. Modelling was used to extrapolate short term small scale test results to likely long term performance of the design. Effective erosion resistance of the proposed designs if implemented is dependent on many factors including:
The specific characteristics of the materials used.
Effective management of runoff from dump tops.
Effective mixing of rock and topsoil.
Dump shape not causing concentration of runoff.
Construction inconsistencies (eg off contour ripping) not causing concentration of runoff.
Actual rainfall depth and intensity on the dump.

PILBARA MANGANESE PTY LTD WOODIE WOODIE OPERATIONS
CONCEPTUAL WASTE LANDFORMS
Woodie Landform Figures 2016-5-12.docx 5
While the conceptual designs provide a guide to the likely characteristics required for stable landforms, specific designs are required for each dump before rehabilitation work. These designs must take into account the specific materials available, construction methods, the current form of the dump and surrounding topography and drainage.
Yours sincerely MBS Environmental
Michael Dufty Senior Environmental Engineer enc. Figure 1: Conceptual Waste Landform – Non Clay
Figure 2: Conceptual Waste Landform – Clay Wastes
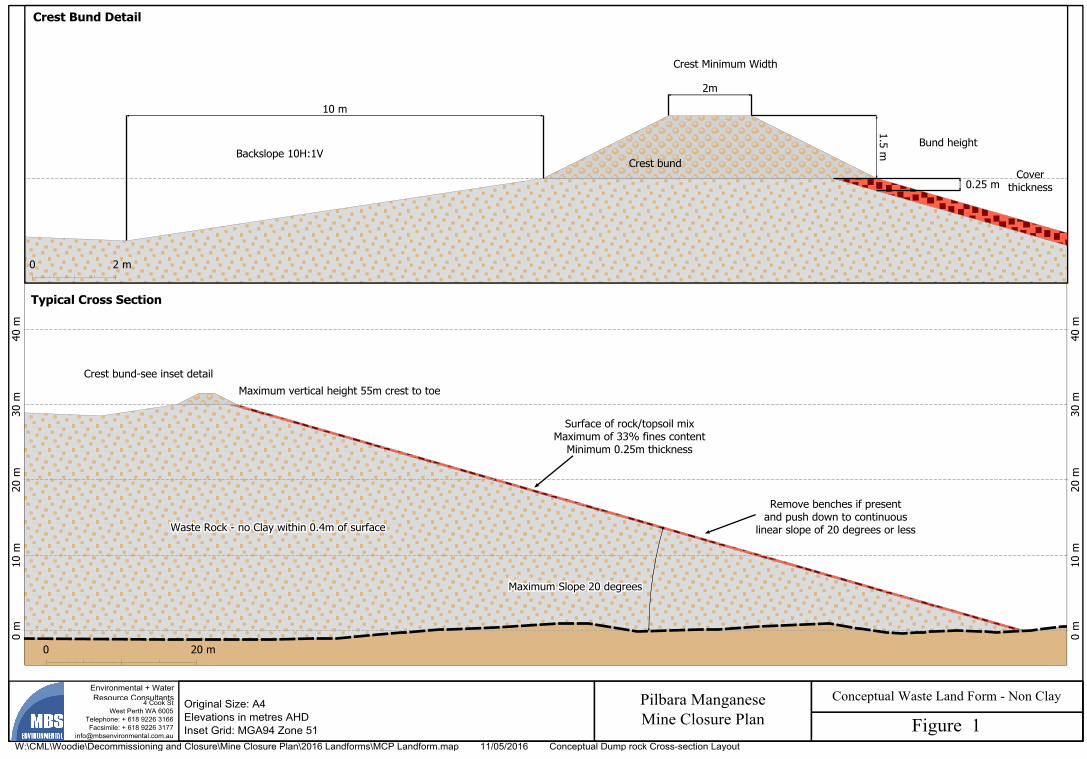


![Landforms Mady By Wind [Desert Landforms]](https://static.fdocuments.us/doc/165x107/56813971550346895da1066c/landforms-mady-by-wind-desert-landforms.jpg)