
Regulatory Trends in Renewable Energy Self Supply · Regulatory Trends in ... public grid as a...
38
Regulatory Trends in Renewable Energy Self -Supply A Summary of International Debates
Transcript of Regulatory Trends in Renewable Energy Self Supply · Regulatory Trends in ... public grid as a...

Regulatory Trends in Renewable Energy Self-Supply A Summary of International Debates

Edición: Deutsche Gesellschaft für Internationale Zusammenarbeit (GIZ) GmbH Friedrich-Ebert-Allee 40 53113 Bonn • Alemania Dag-Hammarskjöld-Weg 1-5 65760 Eschborn • Alemania Nombre del proyecto : Energía Solar para la Generación de Electricidad y Calor Marchant Pereira 150 7500654 Providencia Santiago • Chile T +56 22 30 68 600 I www.giz.de Responsable: Matthias Grandel En coordinación: Ministerio de Energía de Chile Alameda 1449, Pisos 13 y 14, Edificio Santiago Downtown II Santiago de Chile T +56 22 367 3000 I www.minenergia.cl Título: Regulatory Trends in Renewable Energy Self-Supply Autor: Stephan Franz, Büro F www.burof.de
Aclaración: Esta publicación ha sido preparada por encargo del proyecto “Energía Solar para la Generación de Electricidad y Calor” implementado por el Ministerio de Energía y Deutsche Gesellschaft für Internationale Zusammenarbeit (GIZ) GmbH en el marco de la cooperación intergubernamental entre Chile y Alemania. El proyecto se financia a través de la Iniciativa Internacional para la Protección del Clima (IKI) del Ministerio Federal de Medio Ambiente, Protección de la Naturaleza, Obras Publicas y Seguridad Nuclear (BMUB). Sin perjuicio de ello, las conclusiones y opiniones de los autores no necesariamente reflejan la posición del Gobierno de Chile o de GIZ. Además, cualquier referencia a una empresa, producto, marca, fabricante u otro similar en ningún caso constituye una recomendación por parte del Gobierno de Chile o de GIZ. Santiago de Chile, Febrero 2016

Deutsche Gesellschaft für Internationale Zusammenarbeit (GIZ) GmbH
Proyecto Energía Solar para la Generación de Electricidad y Calor Página 3
Content
EXECUTIVE SUMMARY .............................................................................................................. 4
1 INTRODUCTION ................................................................................................................... 5
2 STATUS OF NET METERING WORLDWIDE .................. .................................................... 6
3 RECENT DEVELOPMENTS IN NET METERING LEAD MARKETS .. ................................ 9
3.1 NET METERING “BATTLE” IN THE U.S................... ...................................................... 9
3.2 CALIFORNIA ........................................ .......................................................................... 10
3.3 HAWAII ............................................ ............................................................................... 13
3.4 DENMARK ........................................... ........................................................................... 15
3.5 ITALY ............................................. ................................................................................. 16
3.6 CONCLUSIONS ON THE DEBATES AND REGULATORY MEASURES .................... 17
4 ACADEMIC DEBATE ON SELF-SUPPLY INCENTIVE SCHEMES .. ................................ 18
4.1 LIMITING THE NET METERING SCHEME .................................................................... 18
4.2 ELECTRICITY RATE REFORM ........................... .......................................................... 19
4.3 VOS – VALUE OF SOLAR APPROACH ..................... .................................................. 20
4.4 MARKET VALUE APPROACH ............................. ......................................................... 24
5 OUTLOOK: NEW BUSINESS MODELS FOR UTILITIES OR “UTIL ITY IN A BOX”? ..... 24
6 CONCLUSION AND IMPLICATIONS ....................... .......................................................... 26
ANNEX 1: LITERATURE REVIEW......................... .................................................................... 27
ANNEX 2: TABLES ................................... ................................................................................. 32
ANNEX 3: FIGURES .................................. ................................................................................. 32
ANNEX 4: REFERENCES ............................... ........................................................................... 33

Deutsche Gesellschaft für Internationale Zusammenarbeit (GIZ) GmbH
Proyecto Energía Solar para la Generación de Electricidad y Calor Página 4
Executive Summary
Incentive schemes for renewable energy self-supply of residential homeowners and commercial facilities have gained momentum worldwide. Especially net metering schemes have proven themselves to be a potentially successful tool for fostering distributed electricity generation. In regions with high electricity rates, retail-rate net metering led to shares of distributed photovoltaic generation capacity of 4% (California), 6.2% (Australia) or even 13.3% (Hawaii) on the total electricity generation capacity. It appears that above a 3% threshold, the debate on the attractiveness of the promotion scheme keeps intensifying. Many successful net metering legislations were amended in recent months, most prominently in California and Hawaii.
The debates are mostly spurred by conventional utilities that are active in generation and grid operation (unbundled or not). However, the declining revenue stream of these companies due to the increased self-supply of their (wealthiest) electricity customers is not first and foremost in the public debates. The public debate, spurred by press releases and proposals from utilities, usually centers on the cost-shift from “solar customers” to “non-solar customers”. Another often stressed argument is the impact of distributed generation on the grid and system stability.
The regulatory reaction varies, but certain patterns can be derived from amendments in net metering lead markets and from academic literature. The limitation of net metering schemes through caps and even the phase-out is a common response (Hawaii). An electricity price reform with higher fixed surcharges (Italy) or with the introduction time-of-use tariffs (California) are other solutions. A newer approach is the calculation of a value of solar tariff that remunerates distributed PV generation according to the benefits and costs distributed solar provides or imposes to the electricity system.
The analysis of international debates in the electricity sector in general revealed that the changing, and in some cases eroding business model of the conventional utilities poses the main obstacles to future deployment of distributed generation.
Typical pattern of a public debate on net metering and regulatory responses

Deutsche Gesellschaft für Internationale Zusammenarbeit (GIZ) GmbH
Proyecto Energía Solar para la Generación de Electricidad y Calor Página 5
Assuming that continuously lowering costs of distributed renewable energy generation will lead to increasing shares of self-supply, an electricity tariff reform or the introduction of value of solar remunerations seem to be the logical steps for a pro-active development of the regulatory framework for self-supply renewable energies.
1 Introduction
This study aims at providing an overview of the international debates on incentive schemes for renewable energy self-supply. The focus is on the trigger points that imposed regulatory changes on incentive schemes such as net metering.
Net energy metering (NEM) is the generic term for promotion schemes for distributed electricity generation through small generation units (for instance renewable energy sources or combined heat and power - CHP). Net metering typically compensates each unit of distributed generation at the customer’s prevailing retail electricity rate. Other compensation rates are oriented at wholesale prices or include more complex calculations. Net metering allows homes and businesses with onsite generation facilities to offset their electricity consumption regardless of the temporal match between PV production and electricity consumption (Darghouth, et al., 2015, p. 2). From the PV system owner’s perspective, a net metering regime allows him to use the public grid as a “virtual” storage for his intermittent electricity production.
In this paper, net metering is for simplicity reasons used as the generic term for incentivized self-consumption that includes a compensation mechanism for injected electricity, be it at retail electricity rate level or below. Hence, net billing regimes such as the Italian Scambio Sul Posto are also surveyed and labelled as net metering regimes, but with lower compensation rates. As most of the installations under the net metering regimes are photovoltaic power plants, the terms “solar self-supply” is used interchangeably with “renewable energy self-supply (RESS)”, “distributed generation photovoltaic systems (DGPV)” and so on.
After a short overview on the relevance of net metering schemes worldwide (2), current developments in electricity self-supply “lead markets” is summarized (3). The then following chapter focuses on the changes that regulators imposed and the academic debate on the evolution of self-supply incentive schemes (4). Subsequently, a brief analysis on the changing role of utilities in increasingly distributed electricity markets is given (5). In the conclusión, some implications for regulative authorities are outlined (6).

Deutsche Gesellschaft für Internationale Zusammenarbeit (GIZ) GmbH
Proyecto Energía Solar para la Generación de Electricidad y Calor Página 6
2 Status of net metering worldwide
In recent years, net metering has become one of the most important promotion schemes for distributed renewable energy generation, most notably photovoltaic. As of May 2015, 48 countries worldwide had implemented net metering schemes, in most of the cases on a national level (REN21, 2015, pp. 101-103). Net metering became the incentive policy choice in 26 countries since 2012, when around 22 countries had adopted net metering schemes (REN21, 2012, pp. 70-72). From a macro perspective, net energy metering is a widespread promotion scheme in the Americas (19 countries have adopted net metering schemes) as well as for smaller islands states (9 countries). In Europe, net metering applies only in 9 countries. Australia, Japan and the U.S. can be considered as the net metering frontrunners, where early net metering regulations already led to substantial installation figures.
Figure 1: Countries with a Net Metering Scheme
Source: Büro F, based on (REN21, 2015, pp. 101-103)
Net metering and other forms of subsidized self-consumption accounted for 16% of the world market (IEA PVPS, 2015, p. 32). However, the main promotion scheme for renewable energy sources remains the feed-in tariff, it accounted for almost 60% of newly installed PV capacity in 2014.

Deutsche Gesellschaft für Internationale Zusammenarbeit (GIZ) GmbH
Proyecto Energía Solar para la Generación de Electricidad y Calor Página 7
Figure 2: Share of different market incentives sche mes on 2014 PV installations (global PV market, all system sizes)
Source: IEA PVPS, 2015, p. 33.
Figure 3 gives an overview on the share of distributed PV generation capacity on the total electricity generation mix in self-consumption lead markets. However, the high share of distributed generation capacity in Italy and Belgium stems partially from older feed-in tariff regimes of these countries that have been phased-out. A description of the regulatory developments regarding PV self consumption is given for the blue-bared countries (Italy, Hawaii, Denmark and California). These countries can be seen as regional net metering lead markets and underwent regulatory changes of their respective incentive schemes in recent years and months.

Deutsche Gesellschaft für Internationale Zusammenarbeit (GIZ) GmbH
Proyecto Energía Solar para la Generación de Electricidad y Calor Página 8
Figure 3: Share of distributed PV generation capaci ty on total electrical generation capacity
Source: Büro F based on IEA PVPS National Survey Reports 2014, EIA State Profile and
Energy Estimates 2015, EIA International energy data and analysis 2015, EIA Today in Energy
2015.1
As a rule of thumb it can be stated that discussion on net metering schemes intensifies, when three percent of the generation capacity stems from distributed small-scale sources. The 3% threshold keeps returning:
� Portugal: when self-supply systems reach the equivalent of 3% of the total installed power capacity, new projects will have to contribute in part to the grid costs (European Commission, 2015, p. 9).
� In 2014, the U.S. states Massachusetts, Nevada, New Jersey, New York, Rhode Island and West Virginia had a net metering cap between 2.5 and 4% (NREL, 2014a, p. 13).
� Interestingly, the average of the U.S. net metering capacity caps is 3.3%, ranging from 0.2% (Georgia) to 20% (Utah) (NREL, 2014a, p. 13).
1 Definitions: US states : “Small-scale distributed solar photovoltaic (PV) systems”, defined as systems having a capacity of less than 1 MW, usually located at the customer's site of electricity consumption (EIA category) Non-US countries: “Grid-connected distributed PV power system”, defined as a system installed to provide power to a grid-connected customer or directly to the electricity grid (IEA PVPS category). Chile : Assumption of 1 MW of cumulated installations under the net metering/net-billing scheme.

Deutsche Gesellschaft für Internationale Zusammenarbeit (GIZ) GmbH
Proyecto Energía Solar para la Generación de Electricidad y Calor Página 9
3 Recent developments in net metering lead markets
In this chapter, a brief description of debates and regulatory actions in net metering lead markets is elaborated. The case studies include a general overview on the debater in the U.S. (3.1) and summaries of recent developments in California (3.2), Hawaii (3.3), Denmark (3.4) and Italy (3.5). Based on this, a schematic illustration on typical courses of debates on net metering schemes is elaborated (3.6).
3.1 Net metering “battle” in the U.S.
The most influential market regarding net metering regulations are the U.S., where some 48 states have introduced net metering incentive schemes. The debate on net metering is very active there, recently fueled by Hawaii’s ending of its incentive scheme and California amending it in early 2016 (see below).
In 2013/14, the debate heated up about the impact of net metering policies on the revenue stream of utilities, especially of vertically integrated utilities (IEA PVPS, 2015, p. 36). Media articles highlighted a battle over net metering (CNBC, 12.10.2014, GTM, 18.01.2016), and discussed a “Utilities campaign against rooftop solar” (Washington Post, 07.03.2015). The most commonly stated argument is that solar PV home owners are “grid freeriders” (RE World, 2014) and that system and grid costs are unevenly distributed, and unfair for non-solar households. The recent amendments in various U.S. states can be traced back to this debate.
In most of the cases, (fundamental) regulatory action is underway in order to limit the attractiveness of self-supply. Fewer states opt for an electricity tariff reform which is certainly a more fundamental intervention into the electricity market fundamentals. Some states are investigating and/or adopting some sort of value of solar remuneration, where injected PV electricity is valued according to its net benefit for the electricity system.

Deutsche Gesellschaft für Internationale Zusammenarbeit (GIZ) GmbH
Proyecto Energía Solar para la Generación de Electricidad y Calor Página 10
Table 1: U.S. States undergoing transformative issu es with rooftop solar
LIMIT SELF-SUPPLY
ATTRACTIVENESS
Undergoing net
metering changes
ELECTRICITY TARIFF
REFORM
Weighing policies for fixed
fees on distributed solar
VALUE OF SOLAR
REMUNERATION
Analyzing the value
of distributed solar
Arizona X X X
California X X
Florida
Hawaii X
Maine X X
Massachusetts X
Nevada X
South Carolina X X
Wisconsin X
New York X
Source: Büro F, based on Utility Dive, 25.01.2016 and NC Clean Energy Technology Center,
2015.
In the U.S., net metering regulations are implemented on state or utility levels. On the federal state level, the Congress passed a bill in late 2015 that extended the investment tax credit (ITC) for residential and commercial PV plants until the end of 2021. The ITC works like an investment subsidy, as 30% of the PV investment costs are credited to the income tax a person or company would otherwise have to pay. Following the long-term extension of the ITC on the federal level, analysts expect intensified net-metering battles on the state levels, as utilities should now focus their lobbying activities on “their” public utility commissions (GTM, 18.01.2016).
3.2 California
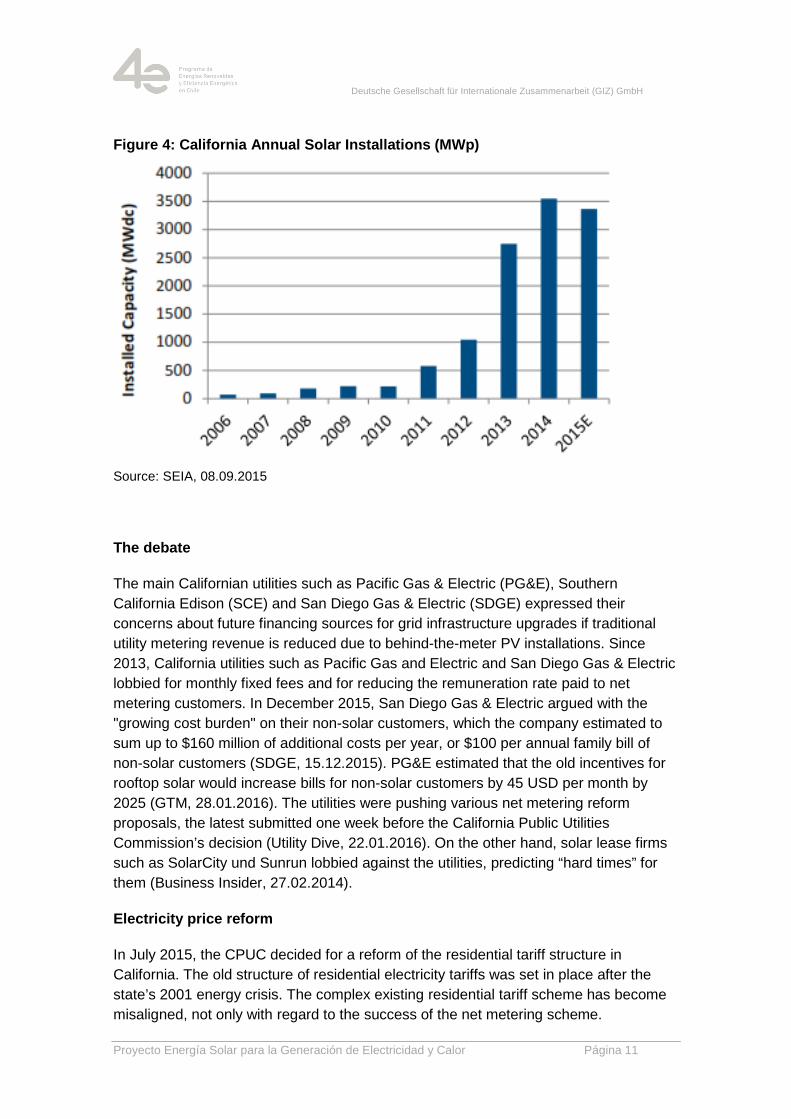
California continues to be the leading solar market in the U.S. Already in 1995, the state introduced a net metering promotion scheme for distributed electricity generation. Until mid-2015, some cumulated 11 GW of photovoltaic power plants were installed in the state. In 2014 alone, some 614 MW of residential PV plants have been installed, some 450.000 electricity customers have installed solar systems (SEIA, 28.01.2016). The Californian net metering scheme credits retail rates to residential and small commercial PV plant owners. However, some important changes to the scheme have been implemented in early 2016 (see below).
Deutsche Gesellschaft für Internationale Zusammenarbeit (GIZ) GmbH
Proyecto Energía Solar para la Generación de Electricidad y Calor Página 11
Figure 4: California Annual Solar Installations (MW p)
Source: SEIA, 08.09.2015
The debate
The main Californian utilities such as Pacific Gas & Electric (PG&E), Southern California Edison (SCE) and San Diego Gas & Electric (SDGE) expressed their concerns about future financing sources for grid infrastructure upgrades if traditional utility metering revenue is reduced due to behind-the-meter PV installations. Since 2013, California utilities such as Pacific Gas and Electric and San Diego Gas & Electric lobbied for monthly fixed fees and for reducing the remuneration rate paid to net metering customers. In December 2015, San Diego Gas & Electric argued with the "growing cost burden" on their non-solar customers, which the company estimated to sum up to $160 million of additional costs per year, or $100 per annual family bill of non-solar customers (SDGE, 15.12.2015). PG&E estimated that the old incentives for rooftop solar would increase bills for non-solar customers by 45 USD per month by 2025 (GTM, 28.01.2016). The utilities were pushing various net metering reform proposals, the latest submitted one week before the California Public Utilities Commission’s decision (Utility Dive, 22.01.2016). On the other hand, solar lease firms such as SolarCity und Sunrun lobbied against the utilities, predicting “hard times” for them (Business Insider, 27.02.2014).
Electricity price reform
In July 2015, the CPUC decided for a reform of the residential tariff structure in California. The old structure of residential electricity tariffs was set in place after the state’s 2001 energy crisis. The complex existing residential tariff scheme has become misaligned, not only with regard to the success of the net metering scheme.

Deutsche Gesellschaft für Internationale Zusammenarbeit (GIZ) GmbH
Proyecto Energía Solar para la Generación de Electricidad y Calor Página 12
With regard to net metering, the introduction of time-of-use (TOU) tariffs and the rejection of high monthly fixed charges are highly relevant. TOU rates encourage lower consumption, where electricity is more expensive to buy (and extra solar energy is more valuable to sell), at times of high electricity demand. No fixed provisions were given with regard to the design of the time-of-use rates. According to the CPUC decision, utilities shall “promptly begin the process of designing TOU pilots,” and by 2018 come up with default TOU rates for all customers to start in 2019.
The tariff reform rejected utility requests for broad permission to impose fixed monthly charges that could make rooftop solar less cost-competitive, opting for a minimum bill approach instead, at least as a default for future rate plans. The commission approved a “minimum bill” for residential customers, deciding that each will pay at least $10 a month, or $5 for low-income households (Utility Dive, 13.07.2015).
The new regulation
The January 2016 decision of the California Public Utilities Commission (CPUC) preserves retail rate net metering. Solar customers are not obliged to pay transmission charges, as proposed in an earlier draft of the Commission’s decision (GTM, 28.01.2016). However, net metering customers have to pay “non-bypassable” charges of 2-3 cents per kWh consumed from the grid, regardless of the amount of energy they have exported to the grid. Non-bypassable charges are used to fund low-income and efficiency programs. The main shift is towards a time-of-use net metering: new solar customers will be required to be on a time-of-use (TOU) tariff. As a result, the feed-in of electricity from distributed generation plants will be remunerated according to time-of-use tariffs which are being introduced through the electricity tariff reform. Existing net metering customers keep receiving the previous remuneration scheme, through a 20 year grandfathering.
Conclusion
The amendment of the Californian net metering scheme followed long public debates and numerous proposals and interventions from the state’s utilities. The CPUC decision on maintaining the net metering scheme at retail rates has been welcomed by solar associations and has been valued as very influential for future developments in other U.S. states. However, the linkage to the electricity tariff reform indicates a way forward for the structural incorporation of distributed self-supply into the electricity system.

Deutsche Gesellschaft für Internationale Zusammenarbeit (GIZ) GmbH
Proyecto Energía Solar para la Generación de Electricidad y Calor Página 13
3.3 Hawaii
The state of Hawaii introduced a retail-rate Net metering Law in 2001 that was amended several times and finally replaced by a new scheme in 2015. Due to the Island State’s high electricity prices, the installation of small-scale distributed solar systems boomed from 2010 on. As of December 2014, about 12 percent of Hawaiian Electric customers have rooftop solar (Hawaiian Electric, 20.01.2015). A total cumulated PV capacity of 497 MW was installed at mid-2015 (SEIA, 08.09.2015).
Figure 5: Hawaii Annual Solar Installations (MWp)
Source: SEIA, 08.09.2015
The debate
In April 2014, the Hawaiian Public Utility Commission released an action plan that included decisions on the distribution grid reliability. In this document, system level challenges related to the increased PV penetration and the resulting cost-shift to non-solar customers are highlighted:
“Unrealistic to expect that the high growth in distributed solar PV capacity additions experienced in the 2010 - 2013 time period can be sustained, in the same technical, economic and policy manner in which it occurred, particularly when electric energy usage is declining, distribution circuit penetration levels are increasing, system level challenges are emerging and grid fixed costs are increasingly being shifted to nonsolar PV customers.” (Hawaiian Public Utility Commission, 29.04.2014).
In early 2015 the state’s largest utility, Hawaiian Electric, stated in a press release:

Deutsche Gesellschaft für Internationale Zusammenarbeit (GIZ) GmbH
Proyecto Energía Solar para la Generación de Electricidad y Calor Página 14
“At the end of 2013, the annualized cost shift from customers who have rooftop solar to those who don’t totaled about $38 million. As of the end of 2014, the annualized cost shift had grown to $53 million – an increase of $15 million. And that number keeps growing. So change is needed to ensure a program that’s fair and sustainable for all customers.” (Hawaiian Electric, 20.01.2015).
Regarding the system stability, Hawaiian Electric has repeatedly warned of technical issues stemming from high levels of solar penetration. According to Greentech Media, not all claims have been found to be true. But the Hawaii’s Public Utility Commission was forced to change the state’s distributed energy policy by the confluence of high solar penetration, grid issues, changing customer demands and a backlog of solar applications (GTM, 23.10.2015).
The new regulation
In October 2015, the Hawaii Public Utilities Commission moved to eliminate retail rate remuneration for new net metering customers. The plan mirrors a proposal filed by Hawaiian Electric in January. The new scheme replaces old net metering regulation since October 2015 and leaves PV system owners to choose between a grid-supply option and a self-supply option:
The grid-supply option: customers receive a fixed credit for electricity sent to the grid and are billed at the retail rate for electricity they use from the grid. Currently, the credits for injected electricity are $0.151/kWh for Oahu, $0.154/kWh for Hawaii, and $0.172/kWh for Maui. The credits are derived from the avoided cost of fossil fuel during peak generation hours measured from July 2014 to June 2015.
The self-supply option is primarily aimed at creating solar owners who do not export generation to the grid, though the commission stressed no non-export design should prevent solar systems from providing grid support. All power produced by the customer's system will need to be used or stored on-site. (Utility Dive, 26.10.2015).
Under both schemes, the PV system owner is obliged to pay a minimum monthly bill of 25 USD to help cover the fixed costs of providing grid services (Hawaiian Electric, 2015). However, net metering customers that had their PV system connected before the amendment (or had applied for grid-connection before Oct. 13, 2016) are not affected by the changes.
Conclusion
To sum up, system level reliability issues as well as the unfair shift of system operation costs to non-solar PV customers were the driving factor for the ending of Hawaii’s NEM. The new regulation makes solar self-supply less attractive – most notably through the introduction of a fixed charge of 25 USD for self-suppliers.

Deutsche Gesellschaft für Internationale Zusammenarbeit (GIZ) GmbH
Proyecto Energía Solar para la Generación de Electricidad y Calor Página 15
0
50
100
150
200
250
300
350
400
2011 2012 2013 2014
3.4 Denmark
In 2012, the Danish net metering system for private households and institutions came into force. The scheme allowed for annual compensation of supply and demand, at the high Danish retail electricity rates. The market boomed in 2012, fueled by installation companies from neighboring Germany. The installation figures declined already in 2013 before the market collapsed in 2014. A total PV capacity of 606 MW were connected to the grid by the end of 2014 (Solar Power Europe, 2015).
Figure 6: Denmark Annual Solar Installations (MWp)
Source: Büro F, based on (EurObserv'ER, 2015)
The high electricity prices combined with the country’s retail-rate net metering scheme for plants below 6 kW made this fast development possible. Until November 2012, the yearly net metering balance allowed for an annual settlement of the balance between total injected electricity and total consumption (over the course of a year). In November 2012, the government reacted to the high level of market development and modified the net metering law. Lost revenues of the distribution grid operators and lost tax revenues of the Danish government led to this fast amendment. The quick change was to allow compensation between energy supply and demand to take place only during one hour. Hence, excess electricity that was fed into the grid had to be self-consumed within an hour in order to be credited. Hence, the annual balance was replaced by 8760 hourly balances. In addition to these changes, the duration of the net metering system for PV systems has been reduced to 10 or 15 years depending on the installation time. The effect was a decline of PV installations in Denmark in 2013, with many of the new installations in 2013 possibly stemming from 2012 applications.

Deutsche Gesellschaft für Internationale Zusammenarbeit (GIZ) GmbH
Proyecto Energía Solar para la Generación de Electricidad y Calor Página 16
The new regulation
In 2014, this transitory net metering scheme was suspended. Since then, PV system owners can choose between to remuneration schemes (IEA PVPS, 2015, p. 21) and (RES Legal, 2014):
The premium tariff system promotes the generation of electricity from renewable sources based on bonus payments. The operators of renewable energy plants usually receive a variable bonus, which is paid on top of the market price. The sum of the market price and the bonus shall not exceed a statutory maximum per kWh, which depends on the source of energy used and the date of connection of a given plant. FiT for the excess electricity guaranteed during 20 years, with a decreasing value after 10 years.
The new “net metering” scheme allows electricity producers using all or part of the electricity produced for their own needs to be totally or partly exempt from paying Public Service Obligation on this electricity. The Public Service Obligation is a charge levied to support renewable energy. The net metering system has now a cap of 800 MW (+20 MW for municipal buildings) until 2020.
Conclusion
The 2012 Danish net metering scheme was an unexpected success and caused immediate regulatory action. After a longer decision making process, a new scheme has been introduced that proved to be much less attractive for potential solar home owners. Furthermore, a cap on the schemes has been introduced.
3.5 Italy
Italy, through its Scambio Sul Posto, attributes different prices to consumed and produced electricity and allows a financial compensation with additional features (guaranteed export price for instance) (IEA PVPS, 2015, p. 36). In this regard, the Italian system is more a net-billing regime. It should be stated that the Italian case is slightly different to the above described schemes, as the country phased-out the feed-in tariff remuneration for renewable energy plants. Hence, the net metering is already a “downgrade” with regard to the supportive measures for RE deployment.
On 01 January 2016, the country introduced a electricity rate reform that is to be implemented until 2019. At the core of the reform is the phase-out of the electricity tariff scheme where tariffs increased progressively with the energy demand. The Italian regulator AEEG wants every residential customer to pay the same grid and system surcharges, independently from the electricity consumption. This means, that the burden increases for smaller electricity consumers that might purchase less electricity from its electricity retail company due to the Scambio Sul Posto incentive scheme. Energy intensive households and larger electrical appliances such as e-mobility and
Deutsche Gesellschaft für Internationale Zusammenarbeit (GIZ) GmbH
Proyecto Energía Solar para la Generación de Electricidad y Calor Página 17
heat pumps are going to be incentivized by the new regime (Rinnovabili.it, 2015). According to first calculations, the electricity price reform lowers the revenue stream for PV plant owners under the Scambio Sul Posto by 170-550€ per year, depending on plant design and self-consumption rate (Solarexpo, 2015).
3.6 Conclusions on the debates and regulatory measu res
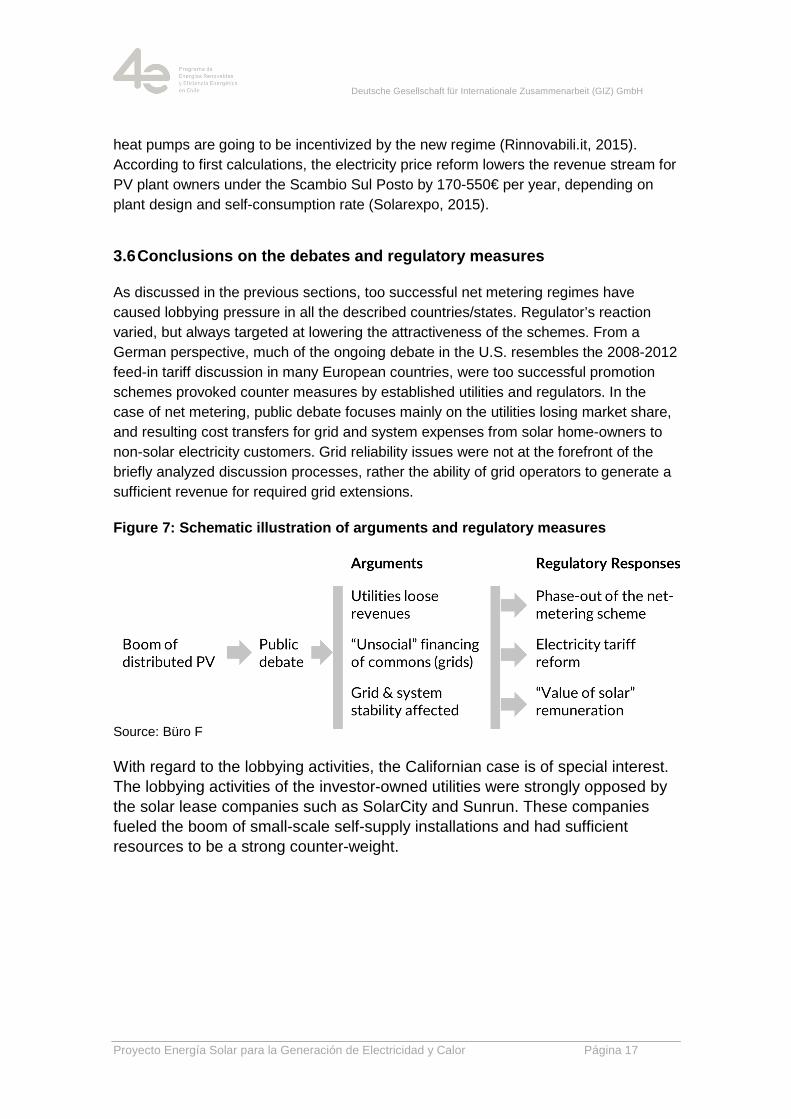
As discussed in the previous sections, too successful net metering regimes have caused lobbying pressure in all the described countries/states. Regulator’s reaction varied, but always targeted at lowering the attractiveness of the schemes. From a German perspective, much of the ongoing debate in the U.S. resembles the 2008-2012 feed-in tariff discussion in many European countries, were too successful promotion schemes provoked counter measures by established utilities and regulators. In the case of net metering, public debate focuses mainly on the utilities losing market share, and resulting cost transfers for grid and system expenses from solar home-owners to non-solar electricity customers. Grid reliability issues were not at the forefront of the briefly analyzed discussion processes, rather the ability of grid operators to generate a sufficient revenue for required grid extensions.
Figure 7: Schematic illustration of arguments and r egulatory measures
Source: Büro F
With regard to the lobbying activities, the Californian case is of special interest. The lobbying activities of the investor-owned utilities were strongly opposed by the solar lease companies such as SolarCity and Sunrun. These companies fueled the boom of small-scale self-supply installations and had sufficient resources to be a strong counter-weight.

Deutsche Gesellschaft für Internationale Zusammenarbeit (GIZ) GmbH
Proyecto Energía Solar para la Generación de Electricidad y Calor Página 18
4 Academic debate on self-supply incentive schemes
In this chapter, an overview on the academic debate on self-supply regulations will be given. A first set of measures is to limit net metering schemes, mostly by a hard cap (4.1). Another, intensively discussed approach in the academia are electricity tariff reforms (4.2). A relatively new approach is the value of solar remuneration (4.3). A pure market-based approach is favored by European Commission and will be summarized only briefly (4.4).
4.1 Limiting the net metering scheme
Many net metering regulations set a cap on the programs, in most of the cases as a percent of peak demand, capacity or load. The typical percentage rate on peak demand/capacity/load is between 1-5%. However, when considering the historical development of net metering schemes, caps have always increased over time (NREL, 2014a). The new net metering regulation in Denmark is capped, and most of the programs of U.S. states impose a limit on the promotion.
Figure 8: U.S. state net metering program cap polic ies
Source: NREL, 2014a

Deutsche Gesellschaft für Internationale Zusammenarbeit (GIZ) GmbH
Proyecto Energía Solar para la Generación de Electricidad y Calor Página 19
4.2 Electricity Rate Reform
Electricity tariff design has become a major issue in all electricity markets with a high percentage of self-supply renewable energy generation. The debate in the U.S., and in Europe as well is now focused on how to deal with the rapid growth of distributed self-generation, its impacts on utility revenues, on the distribution network and the equity issues arising from the fact that under existing tariffs, solar customers end up getting subsidized by non-solar ones.
Residential customers are generally only billed based on total energy consumption, there is an implied expectation that total energy use corresponds directly with a certain contribution to peak demand. While these two variables may have been linked more strongly in the past, new technologies and consumer behaviors are changing that relationship. The old volumetric tariff pattern becomes outdated in times of distributed self-generation, and fixed surcharges or other solutions seem to become more relevant.
Figure 9: Spectrum for Electricity Rates
Source: EPRI, 2015, p. 26
A large part of recent regulatory action focuses on tariff rate reforms that allow for efficient and smart price signals in order to achieve an economical equilibrium of the benefits for the PV plant owner and the energy system and its stakeholders. The most common adoptions include:
Time of Use tariffs
Time-varying rates generally aim towards reflecting marginal cost trends. However, the design of time-varying rates varies greatly. TOU rates encourage lower consumption, where electricity is more expensive to buy (and extra solar energy is more valuable to sell), at times of high electricity demand (see 3.2 on the Californian rate reform).
Increased fixed charges
In order to cover system-related costs, fixed charges or minimum bills are becoming a more relevant part of the electricity rates, coupled with a corresponding reduction in the energy-based rate. Hence, the sensitivity of the customer’s bill to changes in energy consumption is reduced (see 3.5 on the Italian rate reform).

Deutsche Gesellschaft für Internationale Zusammenarbeit (GIZ) GmbH
Proyecto Energía Solar para la Generación de Electricidad y Calor Página 20
Special rates for solar homes
Another model is to introduce special tariffs for solar home owners. These could include higher fixed charges and/or different TOU tariffs. The new PV incentive scheme in Hawaii leads into this direction (see 3.3¡Error! No se encuentra el origen de la referencia. ). This option is debated in Europe as well (DIW, 2016, p. 4).
An analysis on the effect of rate-design changes on PV deployment has been conducted by Berkeley National Laboratory. According to their simulations, two feedback mechanisms on rate reforms cancel one another to a large extent with regard to new PV installations:
“The current design of retail electricity rates and the presence of net metering have elicited concerns that the possible under-recovery of fixed utility costs from PV system owners may lead to a feedback loop of increasing retail prices that accelerate PV adoption and further rate increases. However, a separate and opposing feedback loop could offset this effect: increased PV deployment may lead to a shift in the timing of peak-period electricity prices that could reduce the bill savings received under net metering where time varying retail electricity rates are used, thereby dampening further PV adoption” (Berkeley Lab, 2015, p. 1).
Table 2: Feedback mechanisms between PV adoption an d retail electricity prices
Rate Description Effect on PV deployment
Fixed Cost Recovery Feedback
Increases in average retail rates are required to ensure fixed-cost recovery
PV becomes more profitable and PV adoption is accelerated
Time of Use Tariff Feedback
Changes in the timing of peak and off-peak periods under time-varying rate structures
Bill savings received under net metering are reduced and PV adoption is slowed
Source: Büro F, based on Berkeley Lab, 2015, p. 3
According to the Berkeley Lab study, the effect of retail rate design on PV net metering is big: time varying rates increase PV deployment in the medium term, but decrease it in the long term. Higher fixed customer charges lead generally to a substantial reduction in the future PV deployment (Berkeley Lab, 2015).
4.3 VOS – Value of Solar Approach
The value of solar (VOS) is a relatively new mechanism for the purchase of distributed solar generation. A VOS tariff is intended to be compensation for real value provided by

Deutsche Gesellschaft für Internationale Zusammenarbeit (GIZ) GmbH
Proyecto Energía Solar para la Generación de Electricidad y Calor Página 21
the solar installations to the electric system. A VOS rate is determined through a bottom-up calculation of each of the benefits and costs that distributed solar provides to or imposes on the electricity system. The values generally represent avoided costs to the utility and the overall system (e.g., avoided transmission and distribution services) and the costs of incorporating solar into the system (NREL, 2015).
There has been a vast debate in the U.S. regarding the most effective or appropriate method to calculate the variety of benefits and costs associated with distributed solar, as well has how those could be monetized in a rate. Depending on which factors are being included in the calculation of the value of solar, the results may differ extremely. A stark example came to light in early 2013 in Arizona, where two benefit and cost studies were released in consecutive order by that State’s largest utility and then by the solar industry. The utility-funded study showed a net solar value of less than four cents per kWh, while the PV industry funded study found a value in excess of 21 cents per kWh (IREC, 2013, p. 3).
There is some agreement in the academic literature on the factors that influence the value of solar. The main difference between the various approaches is the weight that is given to the “softer factors” such as the societal value of solar. Based on four recent studies from the U.S., the following parameters for calculating the value of solar should be considered (IREC, 2013, p. 21ff, Rocky Mountain Institute, 2013, p. 13ff, Frontier Group, 2015, p. 5, NREL, 2014b, pp. vii-x)
Energy Benefits and Costs
The energy benefit of PV is based on the generation displaced when PV electricity is supplied to the grid. The net effect of distributed renewable energy generation is to displace the highest-variable-cost generators that are “on the margin” and able to reduce output in response to distributed PV generation. Beside the effects of zero marginal cost renewables on wholesale electricity prices, renewable energy generation also lowers the exposure to volatile fuel prices. This factor is sometimes referred to as the fuel price hedge.
Transmission and Distribution Capacity Benefits and Costs
Whereas decentralized PV generation can effectively reduce the need for additional transmission capacity, it can decrease or increase distribution system capacity investments necessary to maintain reliability, accommodate growth, and/or provide operating flexibility. Even without distributed generation, the distribution system requires replacement of aging equipment and upgrading of transformers and wires to handle load growth. Under the right conditions, PV can reduce or defer the need for such investments by providing power locally, thus reducing the required electric flow through the grid. In other scenarios, accommodating large quantities of distributed generation might require adding or upgrading wires, transformers, voltage-regulation devices, control systems,

Deutsche Gesellschaft für Internationale Zusammenarbeit (GIZ) GmbH
Proyecto Energía Solar para la Generación de Electricidad y Calor Página 22
and/or protection equipment. Some reports highlight the increased grid resiliency through distributed generation (increased diversity in the generation mix with geographically dispersed small-scale generators).
Environmental Benefits and Costs
The reduction of environmental or health impacts that are being reduced through the deployment of distributed RE generation. All methods require linking an emissions rate to the fuel consumption (or generation) from the generator type assumed to be avoided by PV.
Avoided Capacity Investment
Distributed solar generation has the potential to avoid investments into central generation capacity and/or distribution and transmission capacity. Estimating the generation capacity value of DGPV requires calculating the actual fraction of a DGPV system’s capacity that could reliably be used to offset conventional capacity and also applying an adjustment factor to account for T&D losses.
Transmission and Distribution Losses
Because DGPV is typically placed close to the load, it can avoid losses in the transmission and distribution systems, thus enhancing its value. However, in some situations, such as very high penetration levels where solar production is considerably greater than the original load, the reverse flow of power generated by DGPV could result in increased losses.
Ancillary services Benefits and Costs
Two general categories of ancillary services could be affected by decentralized PV generation: operating reserves and voltage control (including provision of reactive power). In short: an increased grid penetration with fluctuant renewables increases the requirements for ancillary services.
Societal value
Some reports defined social value in economic terms, operationalized through jobs created, economic development, local tax revenues, etc.
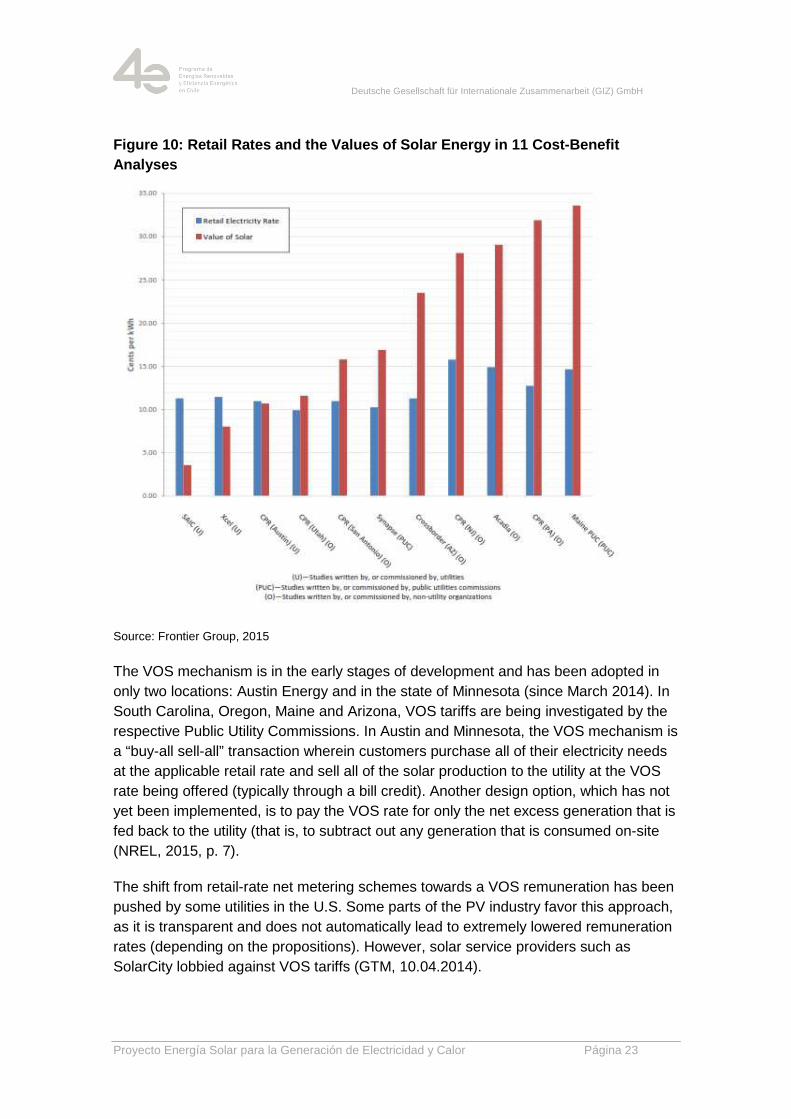
The broad range of categories that have to be considered for a VOS calculation leaves some room for interpreting the assumptions differently. A meta-study conducted by the pro-renewable Frontier Group compared the results of 11 VOS studies (see figure 10)¡Error! No se encuentra el origen de la referencia. .
Deutsche Gesellschaft für Internationale Zusammenarbeit (GIZ) GmbH
Proyecto Energía Solar para la Generación de Electricidad y Calor Página 23
Figure 10: Retail Rates and the Values of Solar Ene rgy in 11 Cost-Benefit Analyses
Source: Frontier Group, 2015
The VOS mechanism is in the early stages of development and has been adopted in only two locations: Austin Energy and in the state of Minnesota (since March 2014). In South Carolina, Oregon, Maine and Arizona, VOS tariffs are being investigated by the respective Public Utility Commissions. In Austin and Minnesota, the VOS mechanism is a “buy-all sell-all” transaction wherein customers purchase all of their electricity needs at the applicable retail rate and sell all of the solar production to the utility at the VOS rate being offered (typically through a bill credit). Another design option, which has not yet been implemented, is to pay the VOS rate for only the net excess generation that is fed back to the utility (that is, to subtract out any generation that is consumed on-site (NREL, 2015, p. 7).
The shift from retail-rate net metering schemes towards a VOS remuneration has been pushed by some utilities in the U.S. Some parts of the PV industry favor this approach, as it is transparent and does not automatically lead to extremely lowered remuneration rates (depending on the propositions). However, solar service providers such as SolarCity lobbied against VOS tariffs (GTM, 10.04.2014).

Deutsche Gesellschaft für Internationale Zusammenarbeit (GIZ) GmbH
Proyecto Energía Solar para la Generación de Electricidad y Calor Página 24
4.4 Market Value Approach
The European Commission prepared a summary of best practices on renewable energy self-consumption. In this report, a pure market basis is being emphasized: the electricity that is not self-consumed but injected into the grid would be rewarded at a (wholesale) market price. By offering a lower tariff for electricity injections into the grid during certain parts of the day, for instance, consumers could be incentivized to consume more of their electricity onsite. If sufficiently high, price-based incentives could begin to increase the generation and consumption in a way that is more optimal for the grid, deferring or avoiding altogether the need for upgrades and investments (European Commission, 2015, p. 11).
5 Outlook: New Business Models for Utilities or “Ut ility in a Box”?
As elaborated above, conventional utilities very strongly involved in the lobbying towards a watering down of net metering promotion schemes. The arguments raised circled around social unfairness and system reliability issues.
Most utilities worldwide have discovered that the introduction of renewable energies could become a major threat to their traditional business model. The new distributed generation plants are typically owned by a homeowner or business (not by the utility). They require no fuel and produce no emissions; they generate electricity at or near the point of consumption. These unique characteristics have complex, interconnected, and often no intuitive effects on the benefits and costs of distributed generation for utilities. The disruption dynamics for the utility sector is described in various studies and articles (for instance: West, 2016, PWC, 2015, (Utility Dive, 21.01.2016).
The chief innovation manager of the German utility RWE put it like this: “Our business model is obsolete. Where we earn money today will stop in the future. Our customers are consuming less, saving more and producing more energy themselves. At the same time, we’ve got targets to become more CO2 neutral as well as overcapacity in conventional generation, certainly in northwest Europe. Our strategic imperative must be to invent and invest in our own disruptive business model before somebody else does that against us” (PWC, 2014, p. 13).
However, the evolving distributed power landscape offers chances for classical energy companies as well – if they are fast enough to adopt to the new environment. The coupling of the energy sectors through e-mobility and power-to-heat open up new business opportunities for classical electrical companies. And in the ever more complex electricity market future, utilities might play an important role – probably not in their traditional businesses, but in new segments. They could function as an agregator or “pool manager” tying together the loose ends of distributed generation, storage and finance.

Deutsche Gesellschaft für Internationale Zusammenarbeit (GIZ) GmbH
Proyecto Energía Solar para la Generación de Electricidad y Calor Página 25
Figure 11: The future utility is a “pool manager”
Source: (Büro F, 2015)
However, as the prices for home storage systems are declining between 15-20% per year in Germany, the next wave of the energy transition is already ahead. The disruptive potential of the combination of PV and Storage is sometimes called “Utility in a Box” . For this, countries with a net metering legislation are better prepared, as the virtual storage of excess generation through the public grid is replaced by a physical on-site storage. The pooling of various home storage systems should make extensive distribution grid extensions obsolete in the nearer future (Rocky Mountain Institute, 2014).

Deutsche Gesellschaft für Internationale Zusammenarbeit (GIZ) GmbH
Proyecto Energía Solar para la Generación de Electricidad y Calor Página 26
6 Conclusion and Implications
Net metering schemes can be very successful in fostering photovoltaic self-supply. Depending on design of the scheme, the retail electricity rates (and the solar irradiation), installation rates might surge. In this regard, net metering schemes resemble the “good old” European feed-in tariffs. Regulators worldwide are struggling to smoothen market development, in order to make it sustainable. In some cases, the PV market was virtually killed by the amendments. Academic discussion and first experiences in the U.S. and in Europe lead the way for a new wave of regulatory approaches for the promotion of renewable energy self-supply. Very widely discussed are electricity rare reforms that allow a fair contribution of solar home owners on the grid operation costs. Another approach that requires a transparent discussion process is a value of solar remuneration, oriented at the benefits and costs of PV electricity for the system. Assuming that continuously lowering costs of distributed renewable energy generation will lead to increasing shares of self-supply, an electricity tariff reform or the introduction of value of solar remunerations seem to be the logical steps for a pro-active development of the regulatory framework for self-supply renewable energies.
Any regulatory amendment should consider the dramatic price increases of home storage systems (-18% per year in Germany). Net metering can be seen as a virtual storage for PV generators, and hinders the deployment of battery storage systems. However, from a system stability perspective, storage systems are strongly needed in electricity markets with a relevant share of intermittent renewable energies on the generation mix.
The analysis of international debates in the electricity sector in general revealed that the changing, and in some cases eroding business model of the conventional utilities poses the main obstacles to future deployment of distributed generation. This important factor should be considered by regulators worldwide, for instance by encouraging utilities already at early stages of the market development to participate in the component sale of self-supply systems. Furthermore, necessary grid extensions on the distribution grid level should be incentivized for an enhanced deployment of renewable energy self-consumption.
Deutsche Gesellschaft für Internationale Zusammenarbeit (GIZ) GmbH
Proyecto Energía Solar para la Generación de Electricidad y Calor Página 27
Annex 1: Literature Review
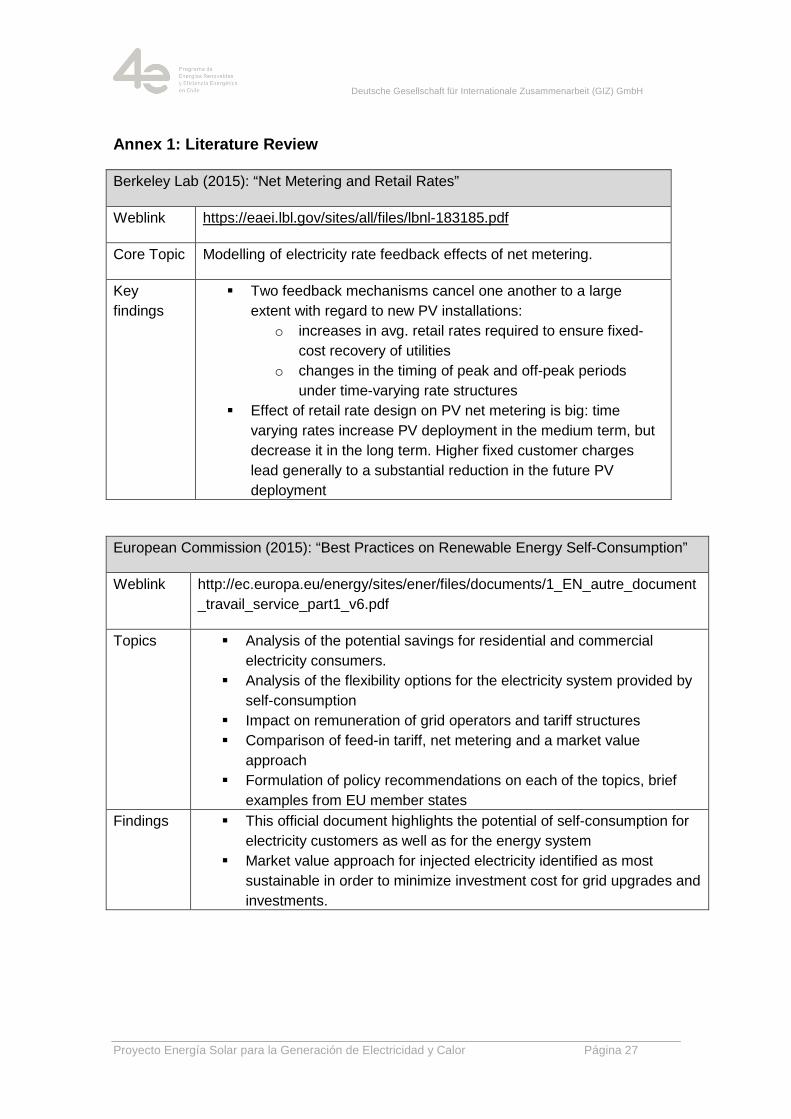
Berkeley Lab (2015): “Net Metering and Retail Rates”
Weblink https://eaei.lbl.gov/sites/all/files/lbnl-183185.pdf
Core Topic Modelling of electricity rate feedback effects of net metering.
Key findings
� Two feedback mechanisms cancel one another to a large extent with regard to new PV installations:
o increases in avg. retail rates required to ensure fixed-cost recovery of utilities
o changes in the timing of peak and off-peak periods under time-varying rate structures
� Effect of retail rate design on PV net metering is big: time varying rates increase PV deployment in the medium term, but decrease it in the long term. Higher fixed customer charges lead generally to a substantial reduction in the future PV deployment
European Commission (2015): “Best Practices on Renewable Energy Self-Consumption”
Weblink http://ec.europa.eu/energy/sites/ener/files/documents/1_EN_autre_document_travail_service_part1_v6.pdf
Topics � Analysis of the potential savings for residential and commercial electricity consumers.
� Analysis of the flexibility options for the electricity system provided by self-consumption
� Impact on remuneration of grid operators and tariff structures � Comparison of feed-in tariff, net metering and a market value
approach � Formulation of policy recommendations on each of the topics, brief
examples from EU member states Findings � This official document highlights the potential of self-consumption for
electricity customers as well as for the energy system � Market value approach for injected electricity identified as most
sustainable in order to minimize investment cost for grid upgrades and investments.
Deutsche Gesellschaft für Internationale Zusammenarbeit (GIZ) GmbH
Proyecto Energía Solar para la Generación de Electricidad y Calor Página 28
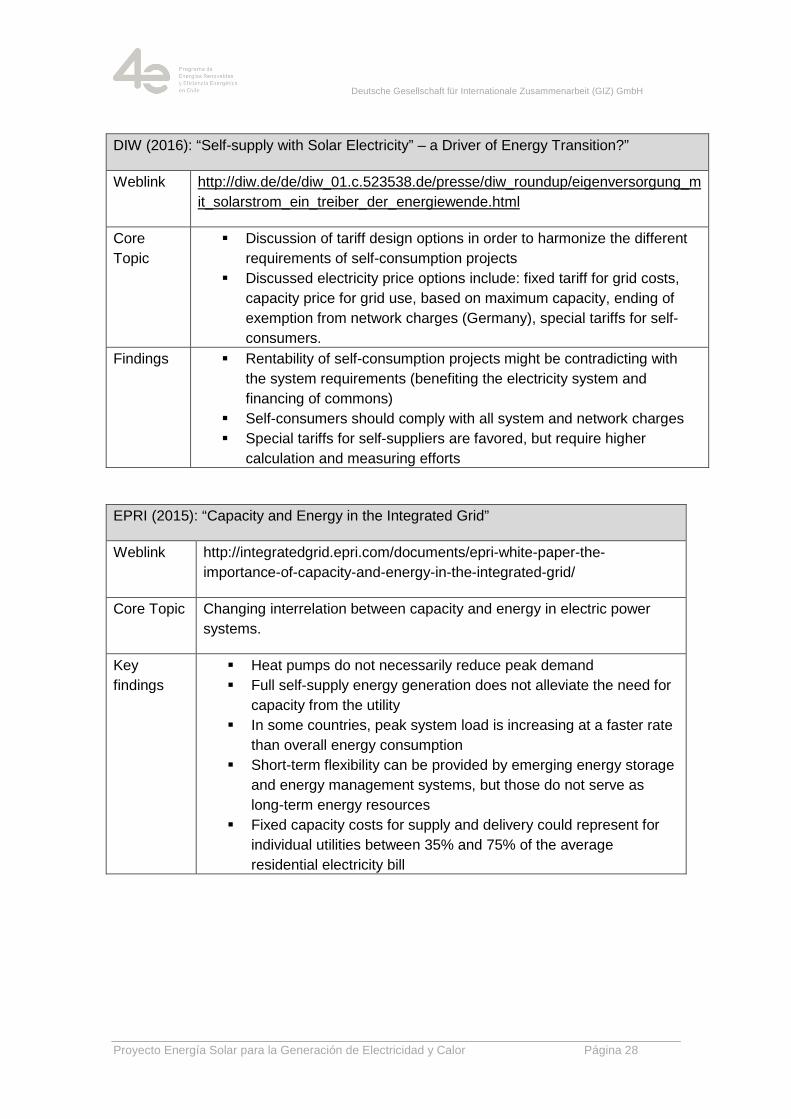
DIW (2016): “Self-supply with Solar Electricity” – a Driver of Energy Transition?”
Weblink http://diw.de/de/diw_01.c.523538.de/presse/diw_roundup/eigenversorgung_mit_solarstrom_ein_treiber_der_energiewende.html
Core Topic
� Discussion of tariff design options in order to harmonize the different requirements of self-consumption projects
� Discussed electricity price options include: fixed tariff for grid costs, capacity price for grid use, based on maximum capacity, ending of exemption from network charges (Germany), special tariffs for self-consumers.
Findings � Rentability of self-consumption projects might be contradicting with the system requirements (benefiting the electricity system and financing of commons)
� Self-consumers should comply with all system and network charges � Special tariffs for self-suppliers are favored, but require higher
calculation and measuring efforts
EPRI (2015): “Capacity and Energy in the Integrated Grid”
Weblink http://integratedgrid.epri.com/documents/epri-white-paper-the-importance-of-capacity-and-energy-in-the-integrated-grid/
Core Topic Changing interrelation between capacity and energy in electric power systems.
Key findings
� Heat pumps do not necessarily reduce peak demand � Full self-supply energy generation does not alleviate the need for
capacity from the utility � In some countries, peak system load is increasing at a faster rate
than overall energy consumption � Short-term flexibility can be provided by emerging energy storage
and energy management systems, but those do not serve as long-term energy resources
� Fixed capacity costs for supply and delivery could represent for individual utilities between 35% and 75% of the average residential electricity bill

Deutsche Gesellschaft für Internationale Zusammenarbeit (GIZ) GmbH
Proyecto Energía Solar para la Generación de Electricidad y Calor Página 29
Frontier Group (2014): “Value of Solar”
Authors Lindsey Hallock (Frontier Group), Rob Sargent (Environment America Research & Policy Center)
Weblink http://www.frontiergroup.org/reports/fg/shining-rewards
Core Topic Meta-Study that reviews 11 analyses on the value of solar in different regions in the U.S.
Key findings
� All 11 analyses found that PV brought net benefits to the grid � 8 studies found that the value of PV was worth more than the
avg. residential electricity rate � The studies that estimated lower values for PV did not include
environmental and societal benefits from PV
IREC (2013): “Calculating the Benefits and Costs of Distributed Solar Generation”
Weblink http://www.irecusa.org/a-regulators-guidebook-calculating-the-benefits-and-costs-of-distributed-solar-generation/
Core Topics
Development and explanation of a calculation method for the value of solar as a standardized valuation methodology for public utility commissions.
Key findings
� Distributed solar generation installations are predictable and should be included in utility forecasts of capacity needs, so DSG should be credited with a capacity value upon interconnection.
� The societal benefits of DSG policies, such as job growth, health benefits and environmental benefits, should be included in valuations, as these were typically among the reasons for policy enactment in the first place.

Deutsche Gesellschaft für Internationale Zusammenarbeit (GIZ) GmbH
Proyecto Energía Solar para la Generación de Electricidad y Calor Página 30
NC Clean Energy Technology Center (2015): “The 50 States of Solar”
Weblink https://nccleantech.ncsu.edu/wp-content/uploads/50-States-of-Solar-Q3-FINAL_25.pdf
Core Topics
Overview on policy changes in the U.S. regarding small-scale distributed PV generation. Special focus on net metering policy changes, community solar, fixed charges and value of solar.
Key findings
� Distributed solar continues to thrive in many U.S. markets � Despite strong near-term growth projections for distributed
solar, mid- to long-term policy uncertainties pose a challenge for the industry
� Rate design, net metering, and distributed solar ownership are among the most contentious ongoing renewable energy policy issues.
� Many utilities have proposed or advocated for changes to net metering rules or residential customer rate design.
NREL (2014): “Net Metering Caps”
Weblink http://www.nrel.gov/docs/fy14osti/61858.pdf
Core Topic � Analysis of policy design for net metering program caps in the U.S.
� Forecast, when net metering caps will be reached in the different states and jurisdictions.
� Many case studies from the different states and the status Key findings
� 64% of the U.S. net metering regulations place a cap on the scheme (% on peak demand, capacity or load, MW cap and others).
� California, Delaware, Nevada and New York might reach their net metering cap by 2018, based on installation forecasts
� Recommendations for policy makers include: reduce market uncertainty through a notification system, transparent data, and clear cap definitions

Deutsche Gesellschaft für Internationale Zusammenarbeit (GIZ) GmbH
Proyecto Energía Solar para la Generación de Electricidad y Calor Página 31
NREL (2014): “Methods for Analyzing the Benefits and Costs of Distributed PV”
Weblink http://www.nrel.gov/docs/fy14osti/62447.pdf
Core Topic This report describes the current and potential future methods, data, and tools that could be used with different levels of sophistication and effort to estimate the benefits and costs of distributed generation. Focus on benefits and costs from the utility or electricity-generation system perspective.
Key findings
� The various calculation methods for the different aspects of the VOS presented in this report are a simplification of interrelated aspects
� The conclusion outlines the need for a complex, comprehensive modeling in the long run.
NREL (2015): “Value of Solar: Program Design”
Weblink http://www.nrel.gov/docs/fy15osti/62361.pdf
Core Topic Analysis of value-of-solar (VOS) program design options – for a replacement of net-energy-metering (NEM). This report is designed for utilities, regulators, and stakeholders who are interested in issues related to VOS program design and implementation.
Key findings
� Modeling comparing the current LCOE-PV in 50 U.S. cities with 15 different scenarios for compensating and incentivizing customers for distributed solar generation.
� Details on VOS program design options, regulatory specifications, incentive options, administrative issues.
Rocky Mountain Institute (2013): “A Review of Solar PV Benefit & Costs Studies”
Weblink http://www.rmi.org/elab_empower
Core Topic Meta-study that reviews 16 benefit/cost studies (2005-2013).
Key findings
� .None of the included studies evaluated the benefits and costs of decentralized PV comprehensively
� There is a significant range of estimated value across studies

Deutsche Gesellschaft für Internationale Zusammenarbeit (GIZ) GmbH
Proyecto Energía Solar para la Generación de Electricidad y Calor Página 32
Annex 2: Tables
Table 1: U.S. States undergoing transformative issues with rooftop solar ................... 10
Table 2: Feedback mechanisms between PV adoption and retail electricity prices ..... 20
Annex 3: Figures
Figure 1: Countries with a Net Metering Scheme .......................................................... 6
Figure 2: Share of different market incentives schemes on 2014 PV installations ......... 7
Figure 3: Share of distributed PV generation capacity on total generation capacity ...... 8
Figure 4: California Annual Solar Installations (MWp) ................................................. 11
Figure 5: Hawaii Annual Solar Installations (MWp) ..................................................... 13
Figure 6: Denmark Annual Solar Installations (MWp) .................................................. 15
Figure 7: Schematic illustration of arguments and regulatory measures ..................... 17
Figure 8: U.S. state net metering program cap policies ............................................... 18
Figure 9: Spectrum for Electricity Rates ...................................................................... 19
Figure 10: Retail Rates and the Values of Solar Energy in 11 Cost-Benefit Analyses . 23
Figure 11: The future utility is a “pool manager” .......................................................... 25
Deutsche Gesellschaft für Internationale Zusammenarbeit (GIZ) GmbH
Proyecto Energía Solar para la Generación de Electricidad y Calor Página 33
Annex 4: References
Berkeley Lab, 2015. Net Metering and Market Feedback Loops: Exploring the Impact of Retail Rate Design on Distributed PV Deployment, https://emp.lbl.gov/publications/net-metering-and-market-feedback-0 [Access on 03 02 2016].
Büro F, 2015. Fit für die nächste Phase der Energiewende: Durch Speicher und Digitalisierung erfolgreiche Geschäftsmodelle finden. Energiewirtschaftliche Tagesfragen, 11, pp. 43-45.
Business Insider, 27.02.2014. MUSK: Hard Times Must Come For Utilities, http://www.businessinsider.com/musk-on-utilities-2014-2?IR=T [Access on 01 02 2016].
CNBC, 12.10.2014. Solar firms, power companies battle over 'net metering', http://www.cnbc.com/2014/10/12/utilities-battle-over-net-metering.html [Access on 01 02 2016].
Darghouth, N. R., Wiser, R., Barbose, G. & Mills, A., 2015. Net Metering and Market Feedback Loops: Exploring the Impact of Retail Rate Design on Distributed PV Deployment. https://eaei.lbl.gov/sites/all/files/lbnl-183185.pdf [Access on 01 02 2016].
DIW, 2016. Eigenversorgung mit Solarstrom - ein Treiber der Energiewende?, http://diw.de/de/diw_01.c.523538.de/presse/diw_roundup/eigenversorgung_mit_solarstrom_ein_treiber_der_energiewende.html [Access on 03 02 2016].
EPRI, 2015. Capacity and Energy in the Integrated Grid, http://www.epri.com/abstracts/Pages/ProductAbstract.aspx?ProductId=000000003002006692 [Access on 03 02 2016].

Deutsche Gesellschaft für Internationale Zusammenarbeit (GIZ) GmbH
Proyecto Energía Solar para la Generación de Electricidad y Calor Página 34
EurObserv'ER, 2015. Photovoltaic Barometer 2015, http://www.eurobserv-er.org/category/all-photovoltaic-barometers/ [Access on 07 02 2016].
European Commission, 2015. COMMISSION STAFF WORKING DOCUMENT Best practices on Renewable Energy Self-consumption, http://eur-lex.europa.eu/legal-content/en/TXT/?uri=CELEX:52015SC0141 [Access on 03 02 2016].
Frontier Group, 2015. Shining Rewards: The Value of Rooftop Solar Power for Consumers and Society, http://www.frontiergroup.org/reports/fg/shining-rewards [Access on 03 02 2016].
GTM, 10.04.2014. A Rising Tension: ‘Value-of-Solar’ Tariff Versus Net Metering, https://www.greentechmedia.com/articles/read/A-Rising-Tension-Within-the-Solar-Industry-Value-of-Solar-Versus-NEM [Access on 03 02 2016].
GTM, 18.01.2016. The Solar Tax Credit Extension Will Make Net Metering Battles Much More Intense, https://www.greentechmedia.com/articles/read/Solar-ITC-Extension-Could-Fan-the-Fires-of-Net-Metering-Battles, [Access on 01 02 2016].
GTM, 21.01.2016. Nevada PUC to Reconsider Grandfathering Rooftop Solar Customers Into New Net-Metering Policy, https://www.greentechmedia.com/articles/read/nevada-puc-to-reconsider-grandfathering-rooftop-solar-customers-into-new-ne [Access on 01 02 2016].
GTM, 23.10.2015. The Growth Rate of Rooftop Solar in Hawaii Hangs in Limbo, https://www.greentechmedia.com/articles/read/the-rate-of-rooftop-solar-growth-in-hawaii-hangs-in-limbo [Access on 31 01 2016].
GTM, 28.01.2016. California’s NEM 2.0 Decision Keeps Retail Rate for Rooftop Solar, Adds Time-of-Use, https://www.greentechmedia.com/articles/read/Californias-Net-Metering-2.0-Decision-Rooftop-Solar-to-Keep-Retail-Payme [Access on 01 02 2016].

Deutsche Gesellschaft für Internationale Zusammenarbeit (GIZ) GmbH
Proyecto Energía Solar para la Generación de Electricidad y Calor Página 35
Hawaiian Electric, 20.01.2015. Hawaiian Electric Companies propose plan to sustainably increase rooftop solar, http://www.hawaiianelectric.com/heco/_hidden_Hidden/CorpComm/Hawaiian-Electric-Companies-propose-plan-to-sustainably-increase-rooftop-solar?cpsextcurrchannel=1 [Access on 30 01 2016].
Hawaiian Electric, 2015. Customer Grid Supply and Self Supply Programs, http://www.hawaiianelectric.com/heco/Clean-Energy/Renewables-and-Customer-Generation/Customer-Grid-Supply-and-Self-Supply-Programs#link2 [Access on 30 01 2016].
Hawaiian Public Utility Commission, 29.04.2014. PUC Orders Action Plans to Achieve State's Energy Goals, http://puc.hawaii.gov/wp-content/uploads/2014/04/Press-Release-Summaries.2014-04-29.pdf [Access on 30 01 2016].
IEA PVPS, 2015. Trends 2015 in Photovoltaic Appliances, http://iea-pvps.org/fileadmin/dam/public/report/national/IEA-PVPS_-_Trends_2015_-_MedRes.pdf
IREC, 2013. A regulator's Guidebook: Calculating the Benefits and Costs of Distributed Solar, http://www.irecusa.org/a-regulators-guidebook-calculating-the-benefits-and-costs-of-distributed-solar-generation/ [Access on 03 02 2016].
NC Clean Energy Technology Center, 2015. The 50 States of Solar, https://nccleantech.ncsu.edu/wp-content/uploads/50-States-of-Solar-Q3-FINAL_25.pdf [Access on 01 02 2016].
NREL, 2014a. Status of Net Metering: Assessing the Potential to Reach Program Caps, http://www.nrel.gov/docs/fy14osti/61858.pdf [Access on 03 02 2016].
NREL, 2014b. Methods for Analyzing the Benefits and Costs of Distributed Photovoltaic Generation to the U.S. Electric Utility System, http://www.nrel.gov/docs/fy14osti/62447.pdf [Access on 03 02 2016].
Deutsche Gesellschaft für Internationale Zusammenarbeit (GIZ) GmbH
Proyecto Energía Solar para la Generación de Electricidad y Calor Página 36
NREL, 2015. Value of Solar: Program Design and Implementation Considerations, http://www.nrel.gov/docs/fy15osti/62361.pdf [Access on 03 02 2016].
PWC, 2014. Digital Utility Transformation, http://www.pwc.com/gx/en/utilities/publications/assets/pwc-digital-utility-transformation.pdf [Access on 03 02 2016].
PWC, 2015. The road ahead: Gaining momentum from energy transformation, http://www.pwc.com/gx/en/industries/energy-utilities-mining/power-utilities/publications/road-ahead-gaining-momentum-energy-transformation.html [Access on 03 02 2016].
RE World, 2014. Renewable Energy World, http://www.renewableenergyworld.com/articles/2014/01/net-metering-in-2014-where-the-first-battles-will-be-fought.html [Access on 02 02 2016].
REN21, 2012. Renewables 2012 Global Status Report. Paris
REN21, 2015. Renewables 2015 Global Status Report, http://www.ren21.net/status-of-renewables/global-status-report/ [Access on 07 02 2016].
RES Legal, 2014. Promotion in Denmark, http://www.res-legal.eu/search-by-country/denmark/tools-list/c/denmark/s/res-e/t/promotion/sum/95/lpid/96/ [Access on 07 02 2016].
Rinnovabili.it, 2015. Riforma della bolletta elettrica, ecco cosa cambia, http://www.rinnovabili.it/energia/efficienza-energetica/riforma-della-bolletta-elettrica-cosa-cambia-666/ [Access on 01 02 2016].
Rocky Mountain Institute, 2013. A Review of Solar PV Benefit & Cost Studies, http://www.rmi.org/elab_empower [Access on 03 02 2016].

Deutsche Gesellschaft für Internationale Zusammenarbeit (GIZ) GmbH
Proyecto Energía Solar para la Generación de Electricidad y Calor Página 37
Rocky Mountain Institute, 2014. The economics of grid defection, http://www.rmi.org/electricity_grid_defection [Access on 23 02 2016].
SDGE, 15.12.2015. Media Statement: Rooftop Solar Subsidy, http://www.sdge.com/newsroom/press-releases/2015-12-15/media-statement-rooftop-solar-subsidy [Access on 31 01 2016].
SEIA, 08.09.2015. Solar Spotlight California, http://www.seia.org/state-solar-policy/california [Access on 31 01 2016].
SEIA, 08.09.2015. Solar Spotlight Hawaii, http://www.seia.org/state-solar-policy/hawaii [Access on 30 01 2016].
SEIA, 28.01.2016. Solar Industry Commends California Public Utilities Commission for Maintaining Net Metering, https://www.seia.org/news/solar-industry-commends-california-public-utilities-commission-maintaining-net-metering [Access on 01 02 2016].
SF Gate, 04.07.2015. California electricity rates to undergo biggest change in 15 years, http://www.sfgate.com/bayarea/article/California-electricity-rates-to-undergo-biggest-6365394.php [Access on 01 02 2016].
Solar Power Europe, 2015. Global Market Outlook 2015-201, http://www.solarpowereurope.org/insights/global-market-outlook/?tx_powermail_pi1[action]=create&tx_powermail_pi1[controller]=Form&cHash=e7b50b0be64a3d46b58c5aae9418b88f [Access on 01 02 2016].
Solarexpo, 2015. Riforma tariffe elettriche: come cambia la convenienza per il fotovoltaico, http://www.solarexpo.com/ita/news/news/Riforma-tariffe-elettriche-come-cambia-la-convenienza-per-il-fotovoltaico/ [Access on 02 02 2016].

Deutsche Gesellschaft für Internationale Zusammenarbeit (GIZ) GmbH
Proyecto Energía Solar para la Generación de Electricidad y Calor Página 38
Utility Dive, 13.07.2015. Inside California's rate restructuring plan and the battle for fixed charges looming over it, http://www.utilitydive.com/news/inside-californias-rate-restructuring-plan-and-the-battle-for-fixed-charge/402117/ [Access on 01 02 2016].
Utility Dive, 2016. Can utilities learn to love distributed solar like central station arrays?, http://www.utilitydive.com/news/can-utilities-learn-to-love-distributed-solar-like-central-station-arrays/412246/ [Access on 03 02 206].
Utility Dive, 22.01.2016. California utilities propose alternative to regulators' net metering policy, http://www.utilitydive.com/news/california-utilities-propose-alternative-to-regulators-net-metering-policy/412516/ [Access on 31 01 2016].
Utility Dive, 25.01.2016. 10 state rooftop solar debates to watch in 2016 and beyond. http://www.utilitydive.com/news/10-state-rooftop-solar-debates-to-watch-in-2016-and-beyond/412087/ [Access on 01 02 2016].
Utility Dive, 26.10.2015. Hawaii PUC chair defends landmark decision to end retail rate net metering, http://www.utilitydive.com/news/hawaii-puc-chair-defends-landmark-decision-to-end-retail-rate-net-metering/407984/ [Access on 30. 01. 2016].
Washington Post, 07.03.2015. Utilities wage campaign against rooftop solar, https://www.washingtonpost.com/national/health-science/utilities-sensing-threat-put-squeeze-on-booming-solar-roof-industry/2015/03/07/2d916f88-c1c9-11e4-ad5c-3b8ce89f1b89_story.html [Access on 01 02 2016].
West, 2016. West Monroe, http://www.westmonroepartners.com/Insights/White-Papers/Distributed-Energy-Resources [Access on 03 02 2016].