Regulatory Impact Analysis of Financial Responsibility ... · Regulatory Impact Analysis of...
203
Regulatory Impact Analysis of Financial Responsibility Requirements under CERCLA § 108(b) for Classes of Facilities in the Hardrock Mining Industry Proposed Rule December 1, 2016 U.S. Environmental Protection Agency Office of Land and Emergency Management
Transcript of Regulatory Impact Analysis of Financial Responsibility ... · Regulatory Impact Analysis of...
Regulatory Impact Analysis of Financial Responsibility
Requirements under CERCLA § 108(b)
for Classes of Facilities in the
Hardrock Mining Industry Proposed Rule
December 1, 2016
U.S. Environmental Protection Agency
Office of Land and Emergency Management
i
Table of Contents
Executive Summary ................................................................................................................................ ES-1
Chapter 1. Introduction ............................................................................................................................. 1-1
1.1 Background and Need for Regulatory Action ............................................................................... 1-1
1.1.1 Background ...................................................................................................................... 1-1
1.1.2 Need for Regulatory Action and Regulatory History of the Proposed Rulemaking ........ 1-2
1.2 Summary of the Proposed Rule and Regulatory Alternatives ...................................................... 1-3
1.2.1 Facilities Subject to the Proposed Rule ........................................................................... 1-3
1.2.2 Summary of the Proposed Rule ....................................................................................... 1-4
1.3 Organization of the Report ............................................................................................................ 1-6
Chapter 2. Potentially Affected Facilities ................................................................................................. 2-1
2.1 Identification of the Universe ....................................................................................................... 2-1
2.2 Description of the Universe .......................................................................................................... 2-4
2.3 Economic Profile of Affected Entities .......................................................................................... 2-8
Chapter 3. Analytic Framework and Estimation of Financial Responsibility Amounts ............................ 3-1
3.1 Analytic Framework ..................................................................................................................... 3-1
3.2 Estimation of CERCLA Liability Financial Responsibility Amounts .......................................... 3-6
3.3 Extrapolation of FR Amounts from the Modeled Universe to the Regulated Universe ............. 3-10
Chapter 4. Assessment of Financial Responsibility Instruments .............................................................. 4-1
4.1 Introduction ................................................................................................................................... 4-1
4.2 Assessment of Financial Test/Corporate Guarantee Options........................................................ 4-1
4.3 Cost to Industry of Financial Responsibility Instruments ............................................................. 4-3
4.3.1 Availability of Financial Responsibility Instruments ...................................................... 4-9
4.4 Costs to Government................................................................................................................... 4-10
Chapter 5. Analytic Results ...................................................................................................................... 5-1
5.1 Introduction and Summary ........................................................................................................... 5-1
5.2 Methods – Modeled Universe ....................................................................................................... 5-2
5.3 Industry Costs and Transfers from Government ........................................................................... 5-5
5.4 Social Costs and Intra-Industry Transfers ................................................................................... 5-10
5.5 Administrative Compliance Burden ........................................................................................... 5-10
5.6 Cash (Accounting) Outlays ......................................................................................................... 5-12
ii
5.7 Limitations .................................................................................................................................. 5-14
Chapter 6. Economic Impact Analysis ...................................................................................................... 6-1
6.1 Introduction ................................................................................................................................... 6-1
6.2 Industry Profile and Analytic Approach ....................................................................................... 6-1
6.3 Discussion of Results .................................................................................................................... 6-3
6.3.1 Screening Analysis for Potentially Significant Economic Impacts ................................. 6-3
6.3.2 Employment Impacts ....................................................................................................... 6-4
Chapter 7. Benefits of Proposed CERCLA Financial Responsibility Requirements ............................... 7-1
7.1 Introduction ................................................................................................................................... 7-1
7.1.1 Methodological Approach ............................................................................................... 7-1
7.1.2 Overview of Benefits ....................................................................................................... 7-1
7.2 Capital Market Effects .................................................................................................................. 7-2
7.2.1 Liability Uncertainty and Market Valuation .................................................................... 7-3
7.2.2 Disclosure and Market Valuation .................................................................................... 7-4
7.2.3 Impact of Disclosure on Cost of Capital .......................................................................... 7-6
7.2.4 Implications ..................................................................................................................... 7-7
7.3 Improvements in Environmental Performance ............................................................................. 7-8
7.3.1 Literature on Environmental Performance and Financial Responsibility ........................ 7-8
7.3.2 Effect on Impaired Waters and Wild and Scenic Rivers ............................................... 7-12
7.4 Speed of Site Cleanups ............................................................................................................... 7-15
Chapter 8. Equity Considerations and Other Impacts ............................................................................... 8-1
8.1 Introduction ................................................................................................................................... 8-1
8.2 Impacts on Small Business and Governments: Regulatory Flexibility Analysis .......................... 8-1
8.3 Environmental Justice ................................................................................................................... 8-6
8.4 Executive Order 13211: Actions that Significantly Affect Energy Supply, Distribution, or Use .. 8-
10
8.5 Executive Order 13045: Protection of Children from Environmental Health & Safety Risks ... 8-11
8.6 Executive Order 12866: Regulatory Planning and Review Executive Order 13563: Improving
Regulation and Regulatory Review ............................................................................................ 8-12
8.7 Unfunded Mandates Reform Act ................................................................................................ 8-13
8.8 Executive Order 13132: Federalism ........................................................................................... 8-13
8.9 Executive Order 13175: Consultation and Coordination with Indian Tribal Governments ....... 8-14
iii
Appendices
Appendix A. “Maximum Extent” Potentially Regulated Universe” ......................................................... A-1
Appendix B. Technical Background on the Development of the Maximum Financial Responsibility and
Reduction Formulas .................................................................................................................................. B-1
Appendix C. Acreage Scaling ................................................................................................................... C-1
Appendix D. Parameters and Methods that Inform the Annualized Price of Financial Assurance .......... D-1
Appendix E. Results Using the 3 Percent Social Discount Rate ............................................................... E-1
Appendix F. Results Using Average FR-Based Extrapolation and Facility-Based Pricing ....................... F-1
Appendix G. Environmental Justice Analyses .......................................................................................... G-1
Appendix H. Calculating Administrative Costs to Industry ..................................................................... H-1
iv
List of Exhibits
Exhibit ES-1. Conceptual Schematic of Analytic Steps (As Described in Section ES.3,
Methodology) .................................................................................................................. ES-4
Exhibit ES-2. Summary of Industry Costs for Potentially Regulated Universe ................................... ES-9
Exhibit ES-3. Summary of Potential Government Costs .................................................................... ES-10
Exhibit ES-4. Summary of Social Costs and Intra-Industry Transfers ............................................... ES-11
Exhibit ES-5. Summary of Social Benefits and Costs ($2015 Millions) ............................................ ES-12
Exhibit 2-1. Hardrock Commodities Considered for the Potentially Regulated Universe .................... 2-3
Exhibit 2-2. Included Universe, by Facility Type and Operating Status ............................................... 2-5
Exhibit 2-3. Included Universe, by Commodity and Operating Status ................................................. 2-5
Exhibit 2-4. Geographic Distribution of the Included Currently Operating Universe .......................... 2-6
Exhibit 2-5. Mining and Mineral Processing States, by Commodity: Nevada, Arizona, Minnesota,
California, Idaho, and Utah ................................................................................................ 2-7
Exhibit 2-6. Distribution of Mine Life for a Sample of Facilities (n=40) .............................................. 2-8
Exhibit 2-7. Summary of Potentially Affected Companies .................................................................... 2-9
Exhibit 3-1. Conceptual Schematic of Analytic Steps (As Described in Section 3.1) ........................... 3-2
Exhibit 3-2. Financial Responsibility Calculation for an Example Facility ........................................... 3-7
Exhibit 3-3. Adjusted, Reduced FR Amounts by Facility .................................................................... 3-10
Exhibit 3-4. Median FR Amounts per Facility: For Extrapolation from the Modeled Universe to
the Potentially Regulated Universe .................................................................................. 3-11
Exhibit 4-1. Key Inputs and Analytic Components of the Pricing Analysis .......................................... 4-2
Exhibit 4-2. Generic Pricing Examples .................................................................................................. 4-7
Exhibit 5-1. Summary Results for Modeled Universe............................................................................ 5-3
Exhibit 5-2. Modeled Universe Self-Insurance and Third-Party Instrument Utilization (Option 2:
Proposed Financial Test) .................................................................................................... 5-4
Exhibit 5-3. Instrument Pricing Outcomes by Company Category ........................................................ 5-5
Exhibit 5-4. Median-Based Extrapolation from the Modeled Universe to the Potentially Regulated
Universe .............................................................................................................................. 5-7
Exhibit 5-5. Summary of Industry Costs for Potentially Regulated Universe ........................................ 5-8
Exhibit 5-6. Summary of Potential Government Costs .......................................................................... 5-9
Exhibit 5-7. Summary of Social Costs and Intra-Industry Transfers ................................................... 5-11
Exhibit 5-8. Annualized Administrative Costs ..................................................................................... 5-12
v
Exhibit 5-9. First Year Administrative Costs ....................................................................................... 5-12
Exhibit 5-10. Annual Cash-Out-of-Pocket as a Percent of FR Amount (Option 1) ............................... 5-13
Exhibit 5-11. Annual Cash-Out-of-Pocket as a Percent of FR Amount (Option 2) ............................... 5-14
Exhibit 6-1. Summary of Relevant Financial Metrics ............................................................................ 6-2
Exhibit 6-2. Cost of FR as a Percent of Revenue, by Revenue Volume (Modeled Universe) ............... 6-4
Exhibit 6-3. Historical Employment in Mining Industries ..................................................................... 6-5
Exhibit 7-1. Facilities Within 24-Hour Travel Distance of CWA Impaired Waters by State ............. 7-14
Exhibit 8-1. Summary of Small Business Statistics (Company Revenues) ............................................ 8-4
Exhibit 8-2. Distribution of Small Entities by Facility Type .................................................................. 8-6
Exhibit 8-3. Baseline Demographics for Census Block Groups ............................................................. 8-8
Exhibit 8-4. Baseline Minority Group Demographics for Census Block Groups .................................. 8-9
Exhibit 8-5. Number and Percentage of Census Block Groups Exceeding National Minority and
Poverty Percentages............................................................................................................ 8-9
Exhibit 8-6. Number and Percentage of Census Block Groups Exceeding State-wide Minority and
Poverty Percentages.......................................................................................................... 8-10
Exhibit 8-7. Baseline Demographics for Census Block Groups ........................................................... 8-11
Exhibit 8-8. Number and Percentage of Census Block Groups Exceeding State-wide Under 18
Percentages ....................................................................................................................... 8-12
Exhibit 8-9. Map of Tribal Lands and Facilities in the Regulated Universe ........................................ 8-16
Exhibit 8-10. Tribal Lands Intersecting with Half-Mile Buffer ............................................................ 8-17
Exhibit 8-11. Tribal Lands Intersecting with One-Mile Buffer ............................................................. 8-18
Exhibit 8-12. Tribal Lands Intersecting with Ten-Mile Buffer ............................................................. 8-19
vi
Acronyms
ACS - American Community Survey
AMD - Acid Mine Drainage
ANVSAs - Alaska Native Village Statistical Areas
ATSDR - Agency for Toxic Substances and Disease Registry
CERCLA - Comprehensive Environmental Response, Compensation, and
Liability Act
CWA - Clean Water Act
EABs - Environmental Assurance Bonds
EIA - U.S. Energy Information Administration
FA - Financial Assurance
FR - Financial Responsibility
FRRs - Financial Responsibility Requirements
FRS - Facility Registry System
GAAP - Generally Accepted Accounting Principles
GAO - Government Accountability Office
HA - Public Health Assessment or Health Consultation
HHLs - Hawaiian Home Lands
IRFA - Initial Regulatory Flexibility Analysis
LOC - Letter of Credit
MCSs - Mineral Commodity Summaries
MDRS - Mine Data Retrieval System
MSHA - U.S. Mine Safety and Health Administration
NPV - Net Present Value
NRD - Natural Resource Damages
NRSRO - Nationally Recognized Statistical Rating Organization
O&M - Operations and Maintenance
OIG - EPA Office of Inspector General
OIRA - Office of Information and Regulatory Affairs
OMB - Office of Management and Budget
OSWER - Office of Solid Waste and Emergency Response
OTSAs - Oklahoma Tribal Statistical Areas
vii
PRPs - Potentially Responsible Parties
RFA - Regulatory Flexibility Act
RIA - Regulatory Impact Assessment
S&P - Standard & Poor’s
SARA - Superfund Amendments and Reauthorization Act of 1986
SBA - Small Business Administration
SBREFA - Small Business Regulatory Enforcement Fairness Act of 1996
SDTSAs - State-Designated Tribal Statistical Areas
SERs - Small Entity Representatives
SISNOSE - Significant Impact on a Substantial Number of Small Entities
TDSAs - Tribal-Designated Statistical Areas
TMDL - Total Maximum Daily Load
UMRA - Unfunded Mandates Reform Act
USEPA - U.S. Environmental Protection Agency
USGS - U.S. Geological Survey
UST - Underground Storage Tank
WACC - Weighted Average Cost of Capital
ES-1
Executive Summary
ES.1 Background and Overview
The Comprehensive Environmental Response, Compensation, and Liability Act (CERCLA)
authorizes EPA to conduct cleanup at abandoned and non-operating sites contaminated with
hazardous substances. CERCLA was enacted to provide for cleanup of hazardous substances and
to hold responsible parties liable for cleanup. The Act therefore addresses threats posed by
existing contamination through remediation and discourages future contamination through
enforcement. Under the current baseline responsible parties are liable for financial responsibility
FR) pertaining to cleanup; however, if a party defaults on all or a portion of that obligation, the
firm’s liability shifts to the government and the public.
Section 108(b) of CERCLA establishes the government’s authority to promulgate financial
responsibility requirements for facilities involved in the production, transport, storage, or
disposal of hazardous material. The 1986 Superfund Amendments and Reauthorization Act
(SARA) amendments to CERCLA clarified that section 108(b) can require regulated facilities to
demonstrate financial responsibility through one of the following financial assurance
mechanisms: insurance, guarantee, surety bond, letter of credit, or qualification as self-insurer.
CERCLA 108(b) allows EPA to require facility owners and operators to acquire financial
assurance for their environmental liabilities and stipulates the instruments through which an
owner or operator may do so.
A series of studies and reviews conducted by the EPA Office of Inspector General (OIG) and the
Government Accountability Office (GAO) from 2004 through 2008 demonstrated that the
hardrock mining industry presented a risk to EPA and taxpayers with respect to the amount of
cleanup costs for which they would be responsible. In accordance with CERCLA section 108(b)
and in response to these concerns, EPA is publishing the proposed rule that would create a
financial assurance regime for CERCLA liabilities in the hardrock mining industry. The
proposed rule endeavors to increase the likelihood that owners and operators will provide funds
necessary to address the CERCLA liabilities at their facilities, thus preventing the burden from
shifting to the taxpayer. In addition, the rule would provide an incentive for implementation of
sound practices at hardrock mining facilities that would decrease the need for future CERCLA
actions. This Regulatory Impact Analysis (RIA) document assesses the costs, benefits, and other
economic impacts of the proposed rule.
ES.2 Summary of the Proposed Rule
The proposed rule establishes financial responsibility requirements for certain facilities within
the hardrock mining industry, thus ensuring that the industry more fully internalizes the costs
associated with the risk of potential future cleanup. At present these potential costs impose a
negative externality on the public. EPA’s Federal Register notice (the Priority Notice) defined
hardrock mining facilities as “those which extract, beneficiate or process metals (e.g., copper,
gold, iron, lead, magnesium, molybdenum, silver, uranium, and zinc) and non-metallic, non-fuel
minerals (e.g., asbestos, gypsum, phosphate rock, and sulfur).”1 With respect to the proposed
1 “Identification of Priority Classes of Facilities for Development of CERCLA Section 108(b) Financial
Responsibility Requirements.” Federal Register Vol. 74, No. 143. July 28, 2009.
ES-2
rule, these facilities include: (1) mining facilities that fall within the classes described in the
Priority Notice and (2) mineral processing facilities identified in the Priority Notice that receive
ore from mining facilities subject to the rule and that are also proximate and under common
operational control of the mining operation.
Owners and operators of facilities subject to this rule are required to demonstrate financial
responsibility for future CERCLA liabilities identified in CERCLA section 107, i.e., for
response, health assessment, and natural resource damages.
The proposed rule requires that owners and operators subject to the rule:
Notify EPA that they are subject to the rule and intend to comply and provide
basic facility information, within 30 days of the rule’s effective date;
Identify a CERCLA section 108(b) financial responsibility level for their facility;
Demonstrate evidence of financial responsibility to EPA; and
Maintain the required amount of financial responsibility until the requirements for
financial responsibility are released by EPA.
The rule proposes a financial responsibility formula that owners and operators will use to
determine a financial responsibility amount sufficient to cover response, health assessment, and
natural resource damages. Based on that formula, the proposed rule requires owners and
operators to calculate and submit to EPA an estimate of a financial responsibility amount
necessary to cover response and health assessment activities and to address natural resource
damages. The formula is also structured to allow facilities, upon meeting certain criteria, to
reduce their FR liability to account for enforceable reclamation plans that meet environmental
performance standards.
The proposed rule would allow for the use of third-party financial responsibility instruments
identified in CERCLA section 108(b)(2). Under Option 1 (preferred option), EPA is proposing
an approach under which a financial test would not be available for use by hardrock mining
facilities subject to this rule. Under this approach, owners or operators could demonstrate
financial responsibility only by using a trust fund, insurance, a letter of credit, or a surety bond,
or a combination of those instruments. Alternatively, EPA is co-proposing making a financial
test available for use by hardrock mining facilities subject to this rule, which if passed would
allow facilities to self-insure all or a portion of their financial responsibility without third-party
instruments (Option 2).
The proposed rule allows owners and operators to demonstrate the financial responsibility level
required at a facility using one or a combination of these instruments. In addition, the proposed
rule allows the owner or operator to demonstrate financial responsibility for multiple facilities
using a single instrument.
ES-3
ES.3 Methodology
EPA developed a multi-dimensional analysis to estimate the costs of the proposed rule. This
analysis involves identification of the potentially regulated universe, estimation of regulated
facilities’ financial responsibility obligations, and assessment of the costs associated with
obtaining financial assurance for those facilities. Regarding the distribution of costs, EPA’s
analysis also examines the extent to which the rule shifts the burden of financing Superfund
cleanups and related expenditures away from the public (through EPA) and toward regulated
facilities. The specific steps in the analysis are as follows (step numbers refer to related boxes in
the flow diagram, presented in Exhibit ES-1 below).
1. Identify the universe of facilities and companies subject to the proposed
rulemaking. EPA identified a list of mines and mineral processors that may be
subject to the proposed rule. From this list, EPA ultimately identified 221
facilities and 121 ultimate parent companies in the affected universe that this RIA
evaluates. The facilities in the included universe were identified based on their
operating status, commodity mined or processed, and other relevant
characteristics. Chapter 2 describes the approach by which EPA identified the
potentially regulated universe.
2. Develop “modeled universe” of facilities. Ideally, this analysis would rely on
company-level financial information and facility-specific engineering cost
estimates for each company affected by the proposed rule to estimate the impacts
of obtaining financial assurance. This information, however, is not readily
available for all facilities and companies. EPA therefore utilized a sample of
mining facilities and related owner companies to create a modeled universe,
which is assumed to be representative of the full universe. This modeled universe
includes 49 individual facilities. Chapters 3 and 4 provide additional detail on
development of these data sets and the potential bias they may introduce.
3. Estimate the financial responsibility amounts for the modeled universe of
facilities. EPA estimated the financial obligations of modeled facilities based on a
financial responsibility formula developed by EPA which relates the
characteristics of individual facilities to facility-specific engineering cost
estimates. The details of this estimation process are described in Chapter 3. EPA
also evaluated whether facilities could reduce their financial responsibility
liability amount based on documents laying out future reclamation actions that
meet environmental performance standards.
4. Obtain financial information for a subset of publicly-traded companies. As
indicated above, financial data are not readily available for many of the
companies likely to be affected by the proposed rule. This is particularly true of
privately held companies, which face less stringent financial reporting
requirements than public companies. Given these limitations in the availability of
financial data, the analysis is based on a sample of publicly-traded companies.
Chapter 4 includes more detailed discussion of the financial information and
methods utilized in the analysis.
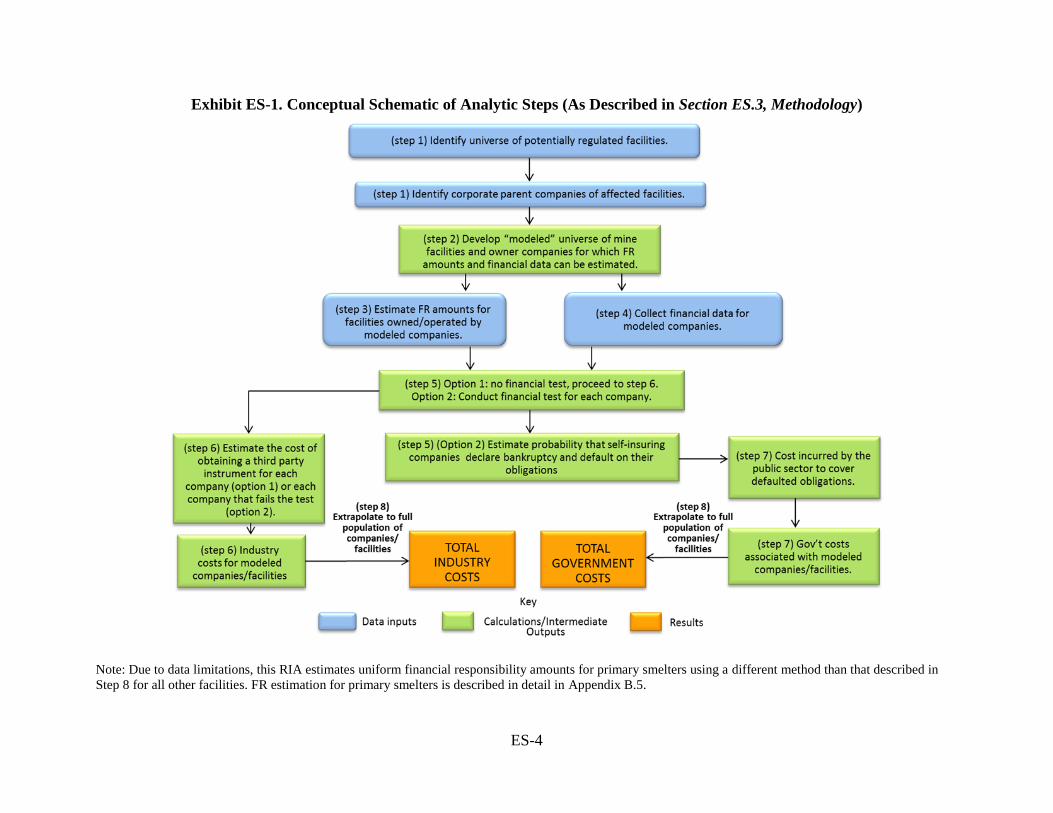
ES-4
Exhibit ES-1. Conceptual Schematic of Analytic Steps (As Described in Section ES.3, Methodology)
Note: Due to data limitations, this RIA estimates uniform financial responsibility amounts for primary smelters using a different method than that described in
Step 8 for all other facilities. FR estimation for primary smelters is described in detail in Appendix B.5.
ES-5
5. Subject the sampled companies to the proposed financial test and the two
regulatory alternatives. Based on the financial responsibility amounts estimated
in step 3 and financial data for each modeled company (when available) in step 4,
EPA subjected the entities to the two regulatory alternatives: (1) the preferred
option that does not contemplate the financial test (Option 1) and (2) the financial
test alternative (Option 2). Under this step, a measure of default probability is
derived for modeled entities in the baseline and for those entities passing a
financial test under Option 2. This analysis assumes that companies that pass the
financial test choose self-insurance over third-party FR instruments.
6. Estimate industry costs currently incurred in the baseline and with the
regulatory alternatives. EPA defines industry costs as the resources expended to
obtain third-party financial responsibility instruments for companies that are
obligated to do so. In the baseline (absent the rule), industry does not face a
requirement to obtain third-party instruments estimated in step 3. Under the
proposed rule under Option 1, these costs are borne by all companies to secure
financial responsibility amounts for the obligations estimated in step 3. Similarly,
under Option 2, companies that fail the financial test will also incur these costs.
For each entity, given a financial responsibility amount, this RIA separately
estimates the cost of three representative FR instruments: a letter of credit, trust
fund, and insurance policy. Finally, this analysis assumes that under Option 2,
companies that pass the financial test may still default on their obligations (see
step 5 above); however, a zero default rate is assumed for third-party FR. The
methods for pricing third-party instruments and deriving related industry costs are
detailed in Chapter 4. For purposes of the presentation of results, EPA assumes
that companies would obtain the lowest-cost option FR.2
7. Estimate government costs associated with the baseline and regulatory
alternatives. For the purposes of estimating changes in government burden due to
the rule, this RIA calculates the government burden assuming that FR amounts
are representative of costs associated with future CERCLA cleanups. Note that
estimated FR amounts may not correspond to actual future CERCLA liabilities
due to numerous uncertainties. In the baseline, the government is burdened with
the CERCLA cost if a responsible party defaults, as no third-party instruments
will be in place. In other words, this RIA assumes that in the baseline the
government will carry the cost of future CERCLA liabilities of facilities within
the potentially regulated universe. For the baseline, the government burden rate is
estimated using the firm exit rate derived from the Census Bureau’s Business
2 Companies that do not currently possess a credit rating from a nationally recognized statistical rating organization
(NRSRO) may need to obtain one to pass the financial test, mainly in instances where the company’s tangible net
worth exceeds the regulatory standard. The resources that companies expend to obtain a credit rating represent an
incremental cost of the financial test. EPA does not consider this cost in the modeling exercise, as it likely would
apply to a small number of the companies in the potentially regulated universe.
ES-6
Dynamics Statistics (BDS).3 This represents a high-end estimate that assumes
exiting firms fail to meet any of their CERCLA obligations. Under Option 2,
government costs are calculated based on estimated probabilities of default for
firms in the modeled universe. This RIA likewise assumes that under this option,
if a company passes the financial test but later files for bankruptcy and defaults on
its financial responsibility obligations, EPA or other government entities will
assume these obligations. Under Option 1, there are no government costs, as no
company may self-insure. Third-party instruments secure all of the financial
responsibility. The methods for deriving government costs are detailed in
Chapters 4 and 5.
8. Extrapolate costs for the modeled universe to the full universe of potentially
regulated facilities with CERCLA financial responsibility amounts. Based on
the estimated industry and government costs associated with the modeled universe
(see Steps 6 and 7), the analysis then extrapolates these results to the full universe
of facilities. The extrapolation process is discussed in Chapters 3 and 5. Due to
data limitations for primary smelters (not represented in the modeled universe),
EPA applied a uniform FR amount to these facilities separately from the
extrapolation process for other types of facilities. Appendix B.5 describes the
derivation of this uniform FR amount.
EPA applies the approach outlined above to estimate the costs of the rule as well as transfers
between affected parties. One of the primary economic effects of the proposed rule is to increase
the likelihood that owners and operators will have funds necessary to address potential CERCLA
liabilities at their facilities. While the reduction in expected government burden represents an
important impact of the proposed rule, it is important to note that a majority portion of these
impacts—the financial responsibility obligations assumed by government—represent a transfer
of costs between parties. That is, the proposed rule primarily affects the distribution of costs
between the private and public sectors. By internalizing the costs of cleanup to the responsible
party, the rule should provide incentive to reduce the likelihood and magnitude of CERCLA
incidents and thus may also reduce the overall magnitude of these costs. The primary industry
cost of the rule is the incremental cost of procuring third-party instruments.
As discussed further in Chapter 3, this RIA distinguishes between industry costs (the costs that
the owner or operator of a potentially regulated facility incurs to obtain a financial instrument
that ensures that funds will be available when needed to cover the facility’s CERCLA liabilities)
and social costs which are primarily the cost of transactions (represented in this RIA by the fees
and commissions paid to financial institutions to obtain financial instruments that provide
assurance for the funding of CERCLA financial responsibility amounts as well as industry
administrative costs associated with choosing FR instruments and other compliance activities).
3 The BDS provides the number of firms operating and number of firm exits each year in the mining sector. Firm
exits identify when all establishments of a firm cease operations for reasons other than reorganization, merger, or
acquisition. Because of the “corporate veil” enjoyed by legal subsidiaries, this analysis uses a facility-based failure
rate to model government costs in the baseline due to owner/operator failure. Compared to other measures of failure
or default, the BDS firm exit rate also captures both private and public companies. The Business Dynamic Statistics
can be accessed at http://www.census.gov/ces/dataproducts/bds/
ES-7
On the other hand, the net acquisition cost of capital associated with these instruments is
presented as a transfer in this RIA.4
In addition to the cost elements described above, this RIA also estimates cash-out-of-pocket
(accounting) outlays incurred by the facilities to comply with the rule (i.e., the cash outflows
associated with compliance with the proposed rule). Note that these costs may occur in the
baseline as well, but are spread over a different time period, and thus do not represent
incremental costs of the rule. The results of this analysis are presented in Chapter 5.
Finally, the proposed rule could potentially affect the administrative costs incurred by industry
and government (note, this RIA does not quantify the government’s administrative costs). These
costs are also tabulated and reported outside of the modeling exercise. As noted above, the
industry’s administrative costs are included in the social cost calculation.
ES.4 Analytic Results
Using a period of analysis from 2021 to 2055, the key results of the analysis for the potentially
regulated universe of 221 facilities are as follows, assuming a 7 percent social discount rate:
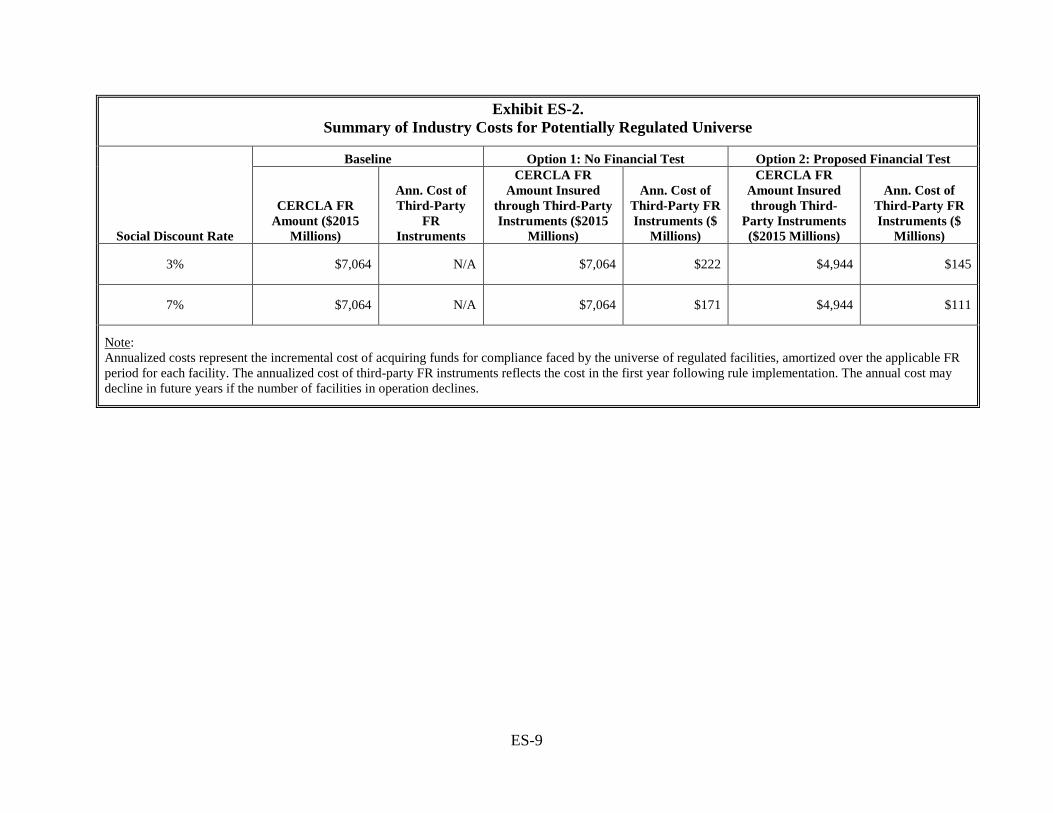
The proposed rule may require these facilities to secure approximately $7.1
billion in financial responsibility obligations.
Under Option 1, third-party instruments will cover all of the above liability totals.
Under Option 2, third-party instruments will cover 70 percent ($4.9 billion) of the
total, with the remainder self-insured due to the availability of the financial test.
The quantified annualized compliance cost to industry to procure third-party
instruments is approximately $111 to $171 million. These values represent the
proposed rule’s estimated incremental costs to industry.
Under Option 1, the total FR amount is estimated to lead to annualized
industry compliance costs of $171 million.
Under Option 2, the total FR amount is estimated to lead to an annualized
industry compliance cost of $111 million.
The rule’s annualized social cost can be estimated as the fees and commissions
paid to financial institutions to obtain financial instruments as well as the
administrative costs to industry associated with compliance activities. The
majority of the industry costs represent a transfer from the regulated industry to
the financial industry, and hence the quantified annualized net social costs are
estimated at $30 million to $44 million.
Under Option 1, the annualized net social costs are $44 million.
Under Option 2, the annualized net social costs are $30 million.
With respect to the impacts on government burden, Option 1 is expected to
transfer a burden of approximately $527 million in liability from the federal
4 This exclusion of transfers from social costs is consistent with EPA’s Guidelines for Preparing Economic
Analyses, which state that social cost analyses “attempt to estimate the total welfare costs, net of any transfers,
imposed by environmental policies.” See page 1-5 of U.S. EPA (2010) Guidelines for Preparing Economic
Analyses, p. 1-5.

ES-8
government to the regulated industry, relative to the baseline. The burden transfer
under Option 2 is approximately $511 million. These values are presented as a
total for all time periods when the transfers may occur.
Exhibits ES-2, ES-3, and ES-4 summarize the quantified results across the two regulatory
options, for both 3 percent and 7 percent social discount rates. The estimated social costs and
benefits resulting from the proposed rule are summarized in Exhibit ES-5.
ES-9
Exhibit ES-2.
Summary of Industry Costs for Potentially Regulated Universe
Social Discount Rate
Baseline Option 1: No Financial Test Option 2: Proposed Financial Test
CERCLA FR
Amount ($2015
Millions)
Ann. Cost of
Third-Party
FR
Instruments
CERCLA FR
Amount Insured
through Third-Party
Instruments ($2015
Millions)
Ann. Cost of
Third-Party FR
Instruments ($
Millions)
CERCLA FR
Amount Insured
through Third-
Party Instruments
($2015 Millions)
Ann. Cost of
Third-Party FR
Instruments ($
Millions)
3% $7,064 N/A $7,064 $222 $4,944 $145
7% $7,064 N/A $7,064 $171 $4,944 $111
Note:
Annualized costs represent the incremental cost of acquiring funds for compliance faced by the universe of regulated facilities, amortized over the applicable FR
period for each facility. The annualized cost of third-party FR instruments reflects the cost in the first year following rule implementation. The annual cost may
decline in future years if the number of facilities in operation declines.
ES-10
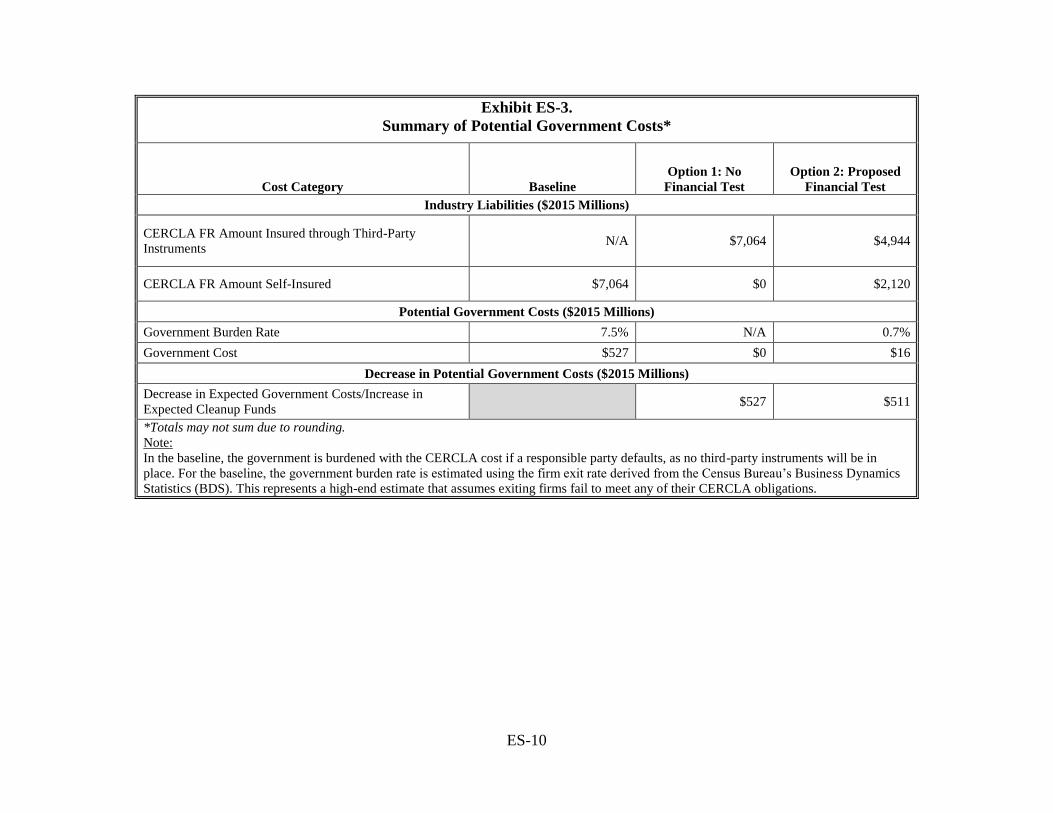
Exhibit ES-3.
Summary of Potential Government Costs*
Cost Category Baseline
Option 1: No
Financial Test
Option 2: Proposed
Financial Test
Industry Liabilities ($2015 Millions)
CERCLA FR Amount Insured through Third-Party
Instruments N/A $7,064 $4,944
CERCLA FR Amount Self-Insured $7,064 $0 $2,120
Potential Government Costs ($2015 Millions)
Government Burden Rate 7.5% N/A 0.7%
Government Cost $527 $0 $16
Decrease in Potential Government Costs ($2015 Millions)
Decrease in Expected Government Costs/Increase in
Expected Cleanup Funds $527 $511
*Totals may not sum due to rounding.
Note:
In the baseline, the government is burdened with the CERCLA cost if a responsible party defaults, as no third-party instruments will be in
place. For the baseline, the government burden rate is estimated using the firm exit rate derived from the Census Bureau’s Business Dynamics
Statistics (BDS). This represents a high-end estimate that assumes exiting firms fail to meet any of their CERCLA obligations.
ES-11
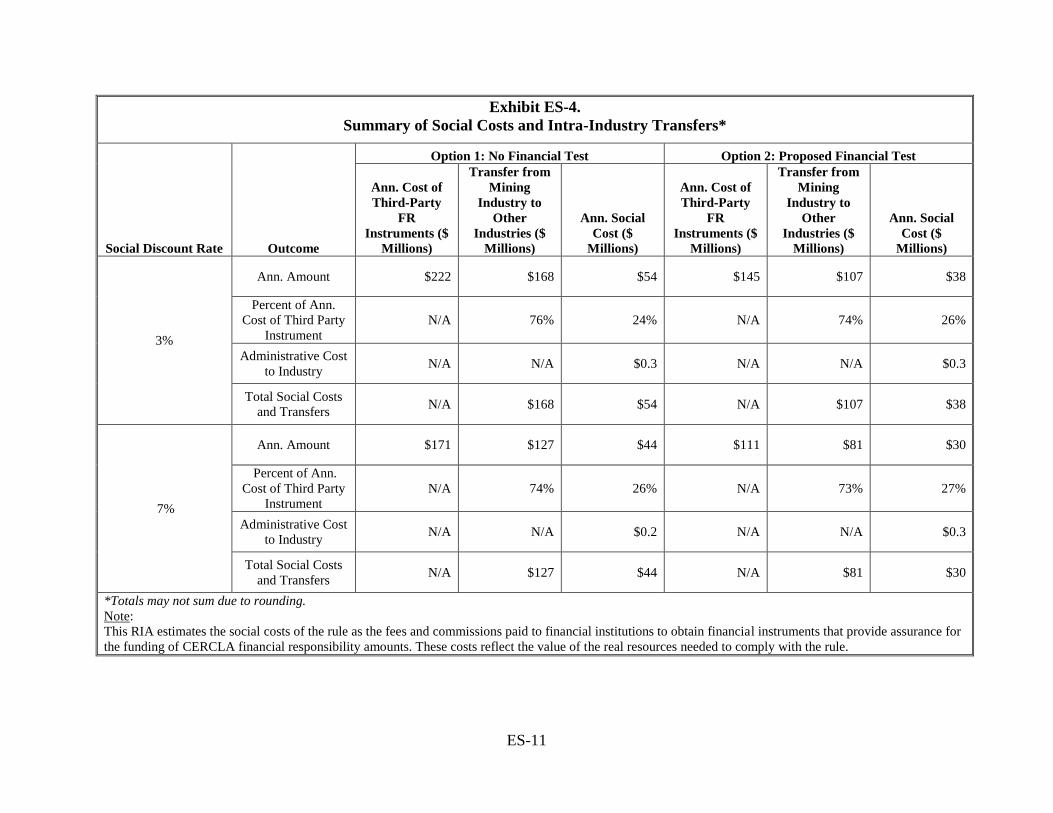
Exhibit ES-4.
Summary of Social Costs and Intra-Industry Transfers*
Social Discount Rate Outcome
Option 1: No Financial Test Option 2: Proposed Financial Test
Ann. Cost of
Third-Party
FR
Instruments ($
Millions)
Transfer from
Mining
Industry to
Other
Industries ($
Millions)
Ann. Social
Cost ($
Millions)
Ann. Cost of
Third-Party
FR
Instruments ($
Millions)
Transfer from
Mining
Industry to
Other
Industries ($
Millions)
Ann. Social
Cost ($
Millions)
3%
Ann. Amount $222 $168 $54 $145 $107 $38
Percent of Ann.
Cost of Third Party
Instrument
N/A 76% 24% N/A 74% 26%
Administrative Cost
to Industry N/A N/A $0.3 N/A N/A $0.3
Total Social Costs
and Transfers N/A $168 $54 N/A $107 $38
7%
Ann. Amount $171 $127 $44 $111 $81 $30
Percent of Ann.
Cost of Third Party
Instrument
N/A 74% 26% N/A 73% 27%
Administrative Cost
to Industry N/A N/A $0.2 N/A N/A $0.3
Total Social Costs
and Transfers N/A $127 $44 N/A $81 $30
*Totals may not sum due to rounding.
Note:
This RIA estimates the social costs of the rule as the fees and commissions paid to financial institutions to obtain financial instruments that provide assurance for
the funding of CERCLA financial responsibility amounts. These costs reflect the value of the real resources needed to comply with the rule.
ES-12
ES.5 Benefits
EPA identified and evaluated a number of qualitative social benefits resulting from the proposed
rule. Those benefits include potential improvements in environmental performance, the potential
for faster cleanup at CERCLA-designated sites, and greater transparency in capital markets.
EPA also addressed and quantified the transfer of CERCLA-related costs from the government
to private industry that the proposed rule would yield. Although this is not a social benefit, the
rule’s requirement that facility owners and operators acquire financial assurance if they are
unable to pass a financial test would shift the burden of CERCLA costs for sites where the owner
or operator has defaulted from the taxpayer to the third-party issuer of the instrument. Therefore,
the proposed rule corrects a market failure by requiring facility owners and operators to
internalize the risk of a negative externality that in the baseline would be imposed on the public
in the future. This will give facilities greater incentives to invest in a socially efficient level of
prevention against future CERCLA contamination events.
The estimated social costs and benefits resulting from the proposed rule are summarized in
Exhibit ES-5.
Exhibit ES-5.
Summary of Social Benefits and Costs ($2015 Millions)
Option 1:
No Financial Test
Option 2:
Proposed Financial Test
Ann. Quantified Costs
Cost of Third-Party FR Instruments $171 $111
Transfer from Mining Industry to
Financial Industry ($127) ($81)
Social Costs from Fees and
Commissions Paid to Financial
Institutions
$44 $30
Mining Industry Administrative
Compliance Costs $0.2 $0.3
Total Quantified Social Costs $44 $30
Unquantified Costs
Cost of incentivized actions by mining industry to improve environmental performance.
Benefits
Improved efficiency in capital markets due to increased transparency of environmental liabilities.
Decrease in human and ecosystem exposure to harmful contaminants due to more expeditious site cleanups.
Decrease in human and ecosystem exposure to harmful contaminants due to incentivized actions by mining
industry to improve environmental performance.
Note: Annualized quantified costs presented in this exhibit are discounted using a 7 percent social discount rate.
ES-13
ES.6 Equity Considerations and Other Impacts
As required by applicable statutes and executive orders, EPA assessed the potential impacts of
the rule with respect to the following issues:
Economic impact and employment analysis: EPA conducted a screening
analysis for potentially significant economic impacts. Because detailed financial
data are not available for all companies within the potentially regulated universe,
the analysis compared annualized compliance costs with company revenues and
operating cash flow for a subset of companies with public financial information.
EPA did not have sufficient data to model and quantify the potential changes in
facilities’ employment levels as a result of the proposed regulation. Potential
countervailing impacts on labor demand in both the mining and financial sectors
make the direction of change unknown.
Impacts on small business and governments (regulatory flexibility): EPA
determined that 44 to 56 small businesses may be subject to the proposed rule. An
initial screening analysis to determine the impact of the rule on small businesses
indicated that EPA could not certify that there is no Significant Impact on a
Substantial Number of Small Entities (SISNOSE). EPA worked with small entity
representatives (SERs) to evaluate the impact of the proposed rule on small
businesses and assess options for regulatory flexibility. EPA has received
comments from the panel, and the agency is in the process of assessing the
comments for applicability.
Environmental justice: EPA’s screening analysis indicates that the populations
living in close proximity to hardrock mining and processing facilities have
generally similar concentrations of minority groups and people living in poverty
to national and state averages. EPA did, however, identify a number of
communities with potential environmental justice concerns. These communities
are likely to share in any benefits that may result from the proposed rule. EPA
does not estimate that the proposed rule would result in disproportionately high or
adverse impacts for minority or low-income populations. Overall, the Agency
anticipates that the rule will support the safe operation and cleanup of hardrock
mining and processing operations, as the rule encourages environmentally sound
practices that could decrease future CERCLA liabilities.
Energy impacts: Establishing financial responsibility requirements under
CERCLA is not expected to impact energy production, distribution, or
consumption. In addition, no measurable adverse impacts concerning energy
prices or foreign supplies are expected from the proposed rule.
Children’s health impacts: EPA does not anticipate that the proposed rule will
lead to a disproportionate negative impact on children. A screening-level
proximity analysis found that overall, the number of children living close to
hardrock mining and processing facilities is comparable to the proportion of
children in the national population. As described in the Environmental Justice
section above, the proposed rule may improve environmental performance at
mining and processing facilities and accelerate the cleanup process. To the extent
ES-14
that these benefits are realized, children living in close proximity to mining
facilities are likely to benefit.
Regulatory planning and review: The Office of Management and Budget has
determined that this regulation is an economically significant regulatory action
because it may have an annual effect on the economy of $100 million or more.
EPA could not monetize all of the rule’s benefits due to data limitations. This
RIA, however, estimates that the proposed rule would lead to $511 million to
$527 million in reduced cost to government over 34 years (the period of analysis)
by increasing the likelihood that responsible parties would have access to the
necessary funds for their CERCLA liabilities. The proposed rule would also lead
to benefits, including greater transparency in capital markets, improvements in
environmental performance, improvements to impaired waters, and faster site
cleanups.
Unfunded mandates analysis: The final CERCLA 108(b) rule is subject to the
requirements of UMRA because of annual industry compliance costs greater than
$100 million. This RIA addresses the requirements of UMRA through the
identification of the Federal authority under which the regulation is being
promulgated, a qualitative and quantitative assessment of the anticipated costs and
benefits of the mandate, estimates of future compliance costs, estimates of
disproportionate budgetary effects on industries within the private sector.
Federalism: This proposed rule is not expected to have federalism implications.
EPA does not anticipate that the proposed rule will have substantial direct effects
on States, on the relationship between the national government and States, or on
the distribution of power and responsibilities among the various levels of
government. However, EPA welcomes comment from State and local officials in
response to this proposed rulemaking.
Tribal governments: EPA has determined that this action will have limited tribal
implications to the extent that facilities in the regulated universe are located in
close proximity to tribal lands. As no tribal governments own or operate any
regulated facilities, tribal governments will not incur any direct compliance costs
as a result of the proposed rule. Based on these results, the proposed rule is not
expected to impose a substantial burden on tribal governments.
1-1
Chapter 1.
Introduction
CERCLA, also known as Superfund, is a federal law designed to support the cleanup of sites
contaminated with hazardous substances. This Regulatory Impact Assessment, or RIA, presents
EPA’s assessment of the costs, benefits, and economic impacts arising from a proposed rule
under CERCLA section 108(b). This proposed rule seeks to establish specific financial
responsibility requirements for certain classes of mines and mineral processing facilities within
the hardrock mining industry. Specifically, the proposed rule defines requirements for
demonstration of financial responsibility and for maintenance of financial responsibility
instruments, while also establishing criteria that owners and operators must meet to reduce the
required financial responsibility level at their facilities.
Overall, the regulatory initiative endeavors to increase the likelihood that owners and operators
will have funds necessary to address the CERCLA liabilities at their facilities, thus preventing
the burden of cleanup from shifting to other parties, including the taxpayer. Therefore, the
proposed rule corrects a market failure by requiring facility owners and operators to internalize
the risk of a negative externality potentially imposed on the public in the future. This will give
facilities greater incentives to invest in a socially efficient level of prevention against future
CERCLA contamination events. In addition, the rule would provide an incentive for the
implementation of sound practices at hardrock mining facilities that would decrease the need for
future CERCLA actions.
1.1 Background and Need for Regulatory Action
1.1.1 Background
CERCLA authorizes EPA to conduct cleanup and enforcement activities at abandoned and non-
operating sites contaminated with hazardous substances. CERCLA was enacted with two
primary goals: (1) to provide for cleanup of hazardous substance releases or threatened
hazardous substance releases; and, (2) to hold responsible parties liable for the costs of site
cleanup. The Act addresses existing threats to human and environmental health while
simultaneously discouraging contamination of future sites.
Under CERCLA, EPA coordinates with environmental protection and waste management
agencies in each state to identify Superfund sites and conduct the monitoring and response
activities under the Act. Following its promulgation in 1980, CERCLA was expanded and
reauthorized under the Superfund Amendments and Reauthorization Act of 1986 (SARA).
SARA amended and clarified various provisions of the law, including CERCLA section 108(b),
and authorized the Emergency Planning and Community Right-to-Know Act of 1986.
Section 108(b) of CERCLA establishes the federal government’s authority to promulgate
financial responsibility requirements for facilities engaged in the production, transport,
treatment, storage, or disposal of hazardous substances. The 1986 SARA amendments to
CERCLA clarified the application of section 108(b), establishing that regulated facilities may
demonstrate financial responsibility through any one or more of the following financial
mechanisms: insurance, guarantee, surety bond, letter of credit, or qualification as a self-insurer.
1-2
SARA amendments to section 108(b) also authorized EPA to specify policy or other contractual
terms, conditions, or defenses which are necessary for facilities to demonstrate evidence of
financial responsibility. CERCLA section 108(b) regulations are intended to ensure that
businesses make financial arrangements to address risks from the hazardous substances at their
sites.
1.1.2 Need for Regulatory Action and Regulatory History of the Proposed Rulemaking
In late 2003, EPA’s Acting Deputy Administrator Stephen L. Johnson requested a
comprehensive review of the Superfund program, with the objective of identifying opportunities
for program efficiencies that would enable the Agency to ultimately complete more long-term
cleanups. The review, which came to be known as the “120-day Study”, resulted in 102
recommendations to improve the Superfund program.5 Recommendation 12 contemplated that
EPA’s Office of Solid Waste and Emergency Response (OSWER) (now Office of Land and
Emergency Management) should study whether promulgating new regulations under CERCLA’s
broad financial assurance authority could reduce the future financial needs of the Superfund
program. Following this recommendation, EPA began working to identify appropriate facility
classes that would be subject to financial responsibility requirements. In an initial study of NPL
sites listed after 1990 (known as the “Phase 1 Report”), EPA identified Superfund sites across
eight general industry sectors for further examination. 6 These industries included manufacturing,
mining, recycling, waste management, dry cleaning, retail, transportation, and agriculture.
In 2004, the EPA OIG released a report investigating the financial impact of hardrock mining
sites on the Superfund Trust Fund and on states. The OIG identified 156 hardrock mining sites
across the nation that had the potential to cost between $7 billion and $24 billion to cleanup. The
report estimated that EPA may be responsible for covering up to $15 billion in cleanup costs at
these sites. In the five years prior to the OIG report, EPA’s total annual Superfund budget was
approximately $1.2 billion. Consequently, the report cautioned that cleanup activities at these
sites could present a management challenge and financial burden.7
In reports published in 2005, 2006, and 2008, the GAO reiterated these concerns, noting that the
hardrock mining industry “presents taxpayers with an especially serious risk of having to pay
cleanup costs for thousands of abandoned, inactive, and operating mines in the United States.” 8
The 2008 report noted that from 1998 to 2007, EPA spent approximately $2.2 billion on
cleanups at abandoned hardrock mining sites.9 The GAO reports encouraged EPA to use its
authority under CERCLA section 108(b) to promulgate financial assurance regulations for
5 U.S. EPA, 2004. Superfund: Building on the Past, Looking to the Future. 6 U.S. EPA. 2008. Superfund Sites and Financial Responsibility: Background Phase 1 Analysis in Support of
Assessing the Financial Responsibility Requirements Under CERCLA 108(b): An Analysis of National Priorities
List Superfund Sites to Identify Facility Classes for Further Phase 2 Analysis. 7 U.S. EPA OIG, 2004. Nationwide Identification of Hardrock Mining Sites. 8 GAO. 2005. Environmental Liabilities: EPA Should Do More to Ensure That Liable Parties Meet Their Cleanup
Obligations. 9 GAO. 2008. Hardrock Mining: Information on Abandoned Mines and Value and Coverage of Financial
Assurances on BLM Land.
1-3
businesses handling hazardous substances to ensure that “those businesses that cause pollution
also pay to have their contaminated sites cleaned up.”10
The GAO reports described the nature of market failure at these sites. In the absence of the
regulation, there is little incentive for the owner or operator of a potentially regulated facility to
set aside funds to cover the future CERCLA liability. These costs are often incurred at the end of
the active life of the facility, when the facility is no longer generating revenues. As a result, the
hardrock mining industry is imposing a negative externality on taxpayers by not fully accounting
for the expected future cleanup costs. In addition, a profit maximizing mine would not undertake
the same level of sound mining practices it might have undertaken if these costs were fully
internalized. The proposed rule would force certain classes of mines and mineral processing
facilities within the hardrock mining industry to internalize the expected future costs of
contaminated site cleanup. This transfer of costs will improve the efficacy of precautionary
actions by the regulated industries to reduce the probability of future contamination.
In 2008, the Sierra Club and other environmental organizations brought suit against EPA for its
failure to promulgate financial assurance regulations under CERCLA section 108(b).
Consequently, on February 25, 2009 the United States District Court for the Northern District of
California issued a ruling that ordered EPA to identify priority classes of facilities that should be
subject to financial assurance requirements and to publish a notice in the Federal Register
specifying these classes.
In response, on July 28, 2009, EPA published a notice in the Federal Register (the “Priority
Notice”) identifying classes of facilities within the hardrock mining industry as those for which
the Agency would first develop financial responsibility requirements under CERCLA section
108(b). The notice defined hardrock mining facilities as “those which extract, beneficiate or
process metals (e.g., copper, gold, iron, lead, magnesium, molybdenum, silver, uranium, and
zinc) and non-metallic, non-fuel minerals (e.g., asbestos, gypsum, phosphate rock, and sulfur).”
11 The proposed rulemaking and this RIA focus on this class of facilities.
1.2 Summary of the Proposed Rule and Regulatory Alternatives
1.2.1 Facilities Subject to the Proposed Rule
The proposed rule establishes financial responsibility requirements for certain facilities within
the hardrock mining industry. These facilities include: (1) mining facilities that fall within the
classes described in the Priority Notice and (2) mineral processing facilities identified in the
Priority Notice that receive ore from mining facilities subject to the rule.
The Priority Notice initially also identified additional mining and mineral processing facilities,
but the proposed rule excludes them due to their limited operations. These facilities are: mines
conducting only placer mining activities; mines conducting only exploration activities; mines of
less than five acres of disturbance; and processors with less than five acres of disposal. Further,
the proposed rule applies only to facilities that are operating or are inactive but not closed on the
effective date of the rule.
10 GAO. 2006. Environmental Liabilities: Hardrock Mining Cleanup Obligations. 11 “Identification of Priority Classes of Facilities for Development of CERCLA Section 108(b) Financial
Responsibility Requirements.” Federal Register Vol. 74, No. 143. July 28, 2009.
1-4
1.2.2 Summary of the Proposed Rule
Owners and operators of facilities subject to this rule are required to demonstrate financial
responsibility to cover costs associated with liabilities identified in CERCLA section 107, i.e.,
for response, health assessment, natural resource damage components.
The proposed rule requires that owners and operators subject to the rule:
Notify EPA that they are subject to the rule and intend to comply and provide
basic facility information, within 30 days of the rule’s effective date;
Identify a CERCLA section 108(b) financial responsibility level for their facility;
Demonstrate evidence of financial responsibility to EPA; and
Maintain the required amount of financial responsibility until the requirement for
financial responsibility for the facility is released by EPA.
Develop and maintain a facility record that contains information related to the
financial responsibility requirements.
The rule proposes a formula by which EPA expects owners and operators to calculate a
protective financial responsibility amount. The formula is also structured to allow facilities, upon
certain showings, to reduce that amount to account for enforceable reclamation plans that meet
environmental performance standards. The proposed formula is designed to reflect the relative
risk of facility practices for managing hazardous substances to human health and the
environment, including reductions in risk that may result from compliance with other regulatory
requirements or other facility practices. The formula assigns values for a facility based on facility
and unit characteristics (e.g., open pits, waste rock, tailings, heap leach, process ponds, water
management, and operations, maintenance, and monitoring). These values correspond to
calculated cost levels, and the formula then aggregates these cost levels to establish the facility-
wide financial responsibility amount.
Based on the formula, the proposed rule requires owners and operators to calculate and submit to
EPA an estimate of a financial responsibility amount necessary to cover the response component
and to address natural resource damages. For the health assessment component, the proposal
includes a level of financial responsibility established by regulation that would be applicable at
all facilities subject to the rule. Owners and operators would then be required to obtain an
acceptable financial responsibility instrument for that level of financial responsibility, submit
evidence of the instrument to the Agency, and make information about the instrument available
to the public.
The proposed rule would allow the use of third-party financial responsibility instruments
identified in CERCLA section 108(b)(2), namely: insurance, surety bond, letter of credit, and
trust fund. The proposal also identifies two methods through which an owner or operator could
qualify as a self-insurer – passing a financial test and establishing a corporate guarantee.
Alternatively, the Agency is co-proposing an approach that would not allow the use of a financial
test or guarantee mechanism.
The proposed financial test under the self-insurance approach is a stringent credit rating-based
test that can be used to cover all or partial costs of facility’s obligations, depending on the owner
or operator’s credit rating and other relevant financial metrics. The proposed rule also allows the
1-5
facility to rely on a guarantee from a corporate parent, a firm owned by the same parent
corporation as the owner or operator of the facility, or a firm with a substantial business
relationship with the owner or operator of the facility. The details of these options include:
Preferred Option 1: No Financial Test/Corporate Guarantee. Under this
proposal, the Agency will compel owners and operators subject to this regulation
to use one or a combination of the third-party financial responsibility instruments
contemplated by the proposed rule.
Option 2: Proposed Financial Test. The proposed rule contemplates a test based
on long-term corporate issuer credit ratings. Under the terms of the proposed
financial test, an owner or operator could assure its entire financial responsibility
obligation by submitting annual verification that it holds at least one long-term
corporate credit rating equal to or higher than A- as issued by Standard & Poor’s
(S&P) or its equivalent by another Nationally Recognized Statistical Rating
Organization (NRSRO). The proposed test would further allow an owner or
operator to assure one half of its obligation by submitting annual verification that
it holds at least one long-term corporate credit rating of BBB+ or BBB from S&P
or the equivalent from another NRSRO. In addition, an owner or operator electing
to use the financial test would be required to have: (1) a tangible net worth of
unencumbered funds at least six times the amount of financial responsibility
obligations covered by a financial test, including the proposed test; and (2) U.S.
assets equal to or greater than 90 percent of its total assets, or six times the
amount of financial responsibility obligations covered by a financial test,
including the proposed test.12
o Corporate Guarantee: The proposed rule also allows owners and
operators to demonstrate financial responsibility by obtaining a written
corporate guarantee from another firm that meets the financial test
requirements. The Agency will allow guarantees from the direct or higher-
tier parent corporation of the owner or operator, a firm owned by the same
parent corporation as the owner or operator, or a firm with a substantial
business relationship with the owner or operator. Under certain conditions,
EPA will also allow a guarantee from a non-U.S. guarantor that meets the
financial test requirements outlined in the proposed regulations provided
the guarantor has identified a registered agent for service of process in the
state in which the facility covered by the guarantee is located and in the
state in which it has its principal place of business.
12 Tangible net worth (TNW) is defined as the difference between tangible assets (total assets minus intangible
assets) and total liabilities. Example intangible assets include intellectual property rights (patents, copyrights,
trademarks), non-compete agreements, goodwill, and brand recognition.
1-6
The proposed rule allows owners and operators to demonstrate the financial responsibility level
required at a facility using one or a combination of these instruments. In addition, the proposed
rule allows the owner or operator to demonstrate financial responsibility for multiple facilities
using a single instrument.
CERCLA section 108(b)(3) requires a phased-in approach to implement the financial
responsibility requirements of the proposed rule. Specifically, it requires that financial
responsibility requirements be imposed as quickly as can reasonably be achieved but in no event
more than four years after the date of promulgation of the final rule. The statute further requires
that, where possible, the level of financial responsibility be achieved through incremental, annual
increases.
Correspondingly, the proposed rule provides the following schedule for implementation of
financial responsibility requirements, under which owners and operators would be required to
demonstrate financial responsibility:
(1) For the health assessment component, 24 months after the effective date of the
final rule;
(2) For 50 percent of the financial responsibility level for the response component
and natural resource damages, by 36 months after the effective date of the final
rule; and
(3) For the full financial responsibility level for the response component and natural
resource damages, by 48 months after the effective date of the rule.
Finally, the proposed rule requires regular information submissions to assure proper maintenance
of financial responsibility. These requirements include an obligation to update financial
responsibility amount calculations every three years, at a minimum, and to notify EPA of
changes in the information on the facility’s initial notification form, facility transfer, claims filed
against the instrument or owner or operator, intent to close the facility, failure of an instrument
provider, instrument provider intent to cancel, and owner or operator bankruptcy.
1.3 Organization of the Report
To support the development of the proposed rule, EPA designed and conducted an analysis of the
rule’s costs, benefits, and economic impacts. EPA presents the data, methods, and results of this
analysis in the following chapters:
Chapter 2 – Universe of Potentially Affected Facilities and Entities: This
chapter presents a profile of the hardrock mining facilities and their owner
companies likely to be affected by the proposed rule. Information presented in
this section includes the number of potentially regulated facilities as well as their
location, commodity, and operating status. It also discusses the number of
affected companies by industry and the annual average revenues and employment
of companies in each affected industry.
Chapter 3 – Analytic Framework and Estimation of Financial Responsibility
Amounts: This chapter describes the analytic framework applied in the
assessment of regulatory impacts for the proposed rule and outlines the approach
for a key analytic step – the estimation of engineering costs that form the basis for
1-7
facility-specific CERCLA financial responsibility amounts. The chapter then
presents the results of extrapolating the median FR amounts for each facility type
in the modeled universe to the facility types in the potentially regulated universe.
Chapter 4 – Assessment of Financial Responsibility Instruments: This chapter
discusses the methods used to calculate the costs to industry and government of
assuring payment of the CERCLA financial responsibility amounts.
Chapter 5 – Analytic Results: This chapter presents the incremental costs of the
proposed rule, including industry and government costs, social costs and transfers,
cash-out-of-pocket (accounting) outlays, and administrative costs.
Chapter 6 – Economic Impact Screening Analysis: This chapter discusses the
economic impacts that may be experienced by companies potentially affected by
the proposed rule, specifically relative to the companies’ annual revenues.
Chapter 7 – Assessment of Benefits: This chapter outlines the benefits of the
proposed rule, including the transfer of burden from the federal government,
capital market effects, improvements in site environmental performance, potential
impaired water area impacts, and speed of site cleanups. Where possible, benefits
are quantified and monetized. However, the majority of the discussion in this
section is qualitative in nature, with the exception of impaired water impacts and
costs to government subsections.
Chapter 8 – Equity Considerations and Other Impacts: This chapter assesses
distributional and other impacts of the proposed rule, including small entity
impacts, environmental justice and children’s health implications, impacts to
tribal governments, assessments of the potential for unfunded mandates and
regulatory takings, and federalism implications, among others.
2-1
Chapter 2.
Potentially Affected Facilities
This chapter describes the universe of facilities potentially affected by the proposed rule.
Specifically, it discusses the approach EPA utilized to identify the facilities subject to the
proposed rule and describes the geographic distribution of the facilities, the commodities mined
or processed at these facilities, and other characteristics, such as their operating status.
The potentially regulated universe addressed in this assessment includes 221 currently operating
mining and processing facilities.13 As described below, the facilities subject to the proposed rule
include surface mines, underground mines, and non-entry mines (e.g., in-situ recovery, brine
extraction). In addition, the processors subject to the proposed rule include facilities conducting
beneficiation, primary smelting, and other forms of processing.
2.1 Identification of the Universe
Hardrock mining is the extraction and beneficiation of rock and other materials from the earth
that contain a target metallic or non-fuel non-metallic mineral. Mineral processing separates and
refines mineral concentrates to extract the target material.14
For the purposes of this RIA, EPA has identified a list of mines and mineral processors subject to
the proposed rule. However, the population of mines and mineral processors that are operating at
any given point in time can fluctuate. This is because mines and mineral processors sometimes
operate intermittently due to fluctuating commodity prices, other business-related factors, mining
and processing technical operations issues, and weather conditions in certain parts of the country.
The universe of potentially regulated facilities described in this chapter represents facilities
known to be operating as of July 2015.15
In establishing the facilities likely to be subjected to the proposed rule, EPA primarily relied on
July 2015 data in the U.S. Mine Safety and Health Administration (MSHA) Mine Data Retrieval
13 As described in Chapter 1, requirements apply to mining facilities that fall within the classes described in the
Priority Notice and mineral processing facilities identified in the Priority Notice that receive ore from mining
facilities subject to the rule and that are also proximate and under common operational control of the mining
operation. Mining facilities that fall within the classes of facilities identified in the Priority Notice but that have
limited operations also are not subject to the proposed rule. For more information, see the Preamble document for
the proposed rule, which resides in the docket for this rulemaking. 14 “Identification of Priority Classes of Facilities for Development of CERCLA Section 108(b) Financial
Responsibility Requirements.” Federal Register Vol. 74, No. 143. July 28, 2009. 15 For further information on the identification of the information, see U.S. Environmental Protection Agency,
“CERCLA 108(b) Financial Responsibility Formula for Hardrock Mining Facilities Background Document,” Office
of Land and Emergency Management (September 2016), Chapter 4.
2-2
System (MDRS),16 U.S. Energy Information Administration (EIA) (2015),17 and the 2015 U.S.
Geological Survey (USGS) Mineral Commodity Summaries (MCSs).18
MDRS
MSHA maintains information on mining and processing operations under its jurisdiction
in the MDRS database and Mines Data Set. MDRS stores an overview of each mine, as
well as violation histories, accident and injury information, and sampling data. MDRS
can be queried by company or mine and the Mines Data Set aggregates public
information on mines under MSHA’s jurisdiction. Both are updated on a regular basis.
As of July 2015, the Mines Data Set contained records of 84,780 mining facilities. From
these initial records, EPA removed 35,103 mines identified as coal mining operations not
subject to the proposed rule. Remaining non-coal facilities were retained for further
analysis.
U.S. EIA (2015)
While MSHA data provided information on traditional uranium mines and processors,
uranium facilities using more recent techniques (e.g., in-situ recovery) were
underrepresented. These facilities are, however, represented in U.S. EIA (2015). Data in
this report are based primarily on information reported on Form EIA-851A, “Domestic
Uranium Production Report (Annual)” and Form EIA-858, “Uranium Marketing Annual
Survey.” The Form EIA-851A survey collects data on uranium milling and in-situ
recovery processing, feed sources, mining, employment, drilling, expenditures, and
reserve estimates while the Form EIA-858 survey includes data collected on contracts
and deliveries. Including the in-situ recovery uranium recovery facilities in this report
resulted in an addition of eight facilities.
2015 MCSs
Certain processing facilities, including some smelters and most processors located
independently from mining operations, do not fall under MSHA’s jurisdiction and are not
included in the MSHA data. MCSs are published on an annual basis, and furnish
estimates covering nonfuel mineral industry data. Data sheets contain information on the
domestic industry structure, government programs, tariffs, and five-year salient statistics
for over 90 individual minerals and materials. Using these reports, EPA added 62
additional facilities from MCSs, and state regulatory programs.
Company and Government Agency Websites
To complete EPA’s list of currently operating hardrock mining and processing facilities,
EPA accessed company and government agency websites, as well as publicly available
Internet sources, to verify and supplement information provided in MSHA, USGS, and
EIA documents.
16 MDRS data are available at http://www.msha.gov/drs/drshome.htm and Mines Data Set,
http://www.msha.gov/OpenGovernmentData/OGIMSHA.asp 17 U.S. EIA (Energy Information Administration). 2015. 2014 Domestic Uranium Production Report. Washington,
DC. April. Available online at: http://www.eia.gov/uranium/production/annual/pdf/dupr.pdf 18 MCS can be accessed at http://minerals.usgs.gov/minerals/pubs/mcs/
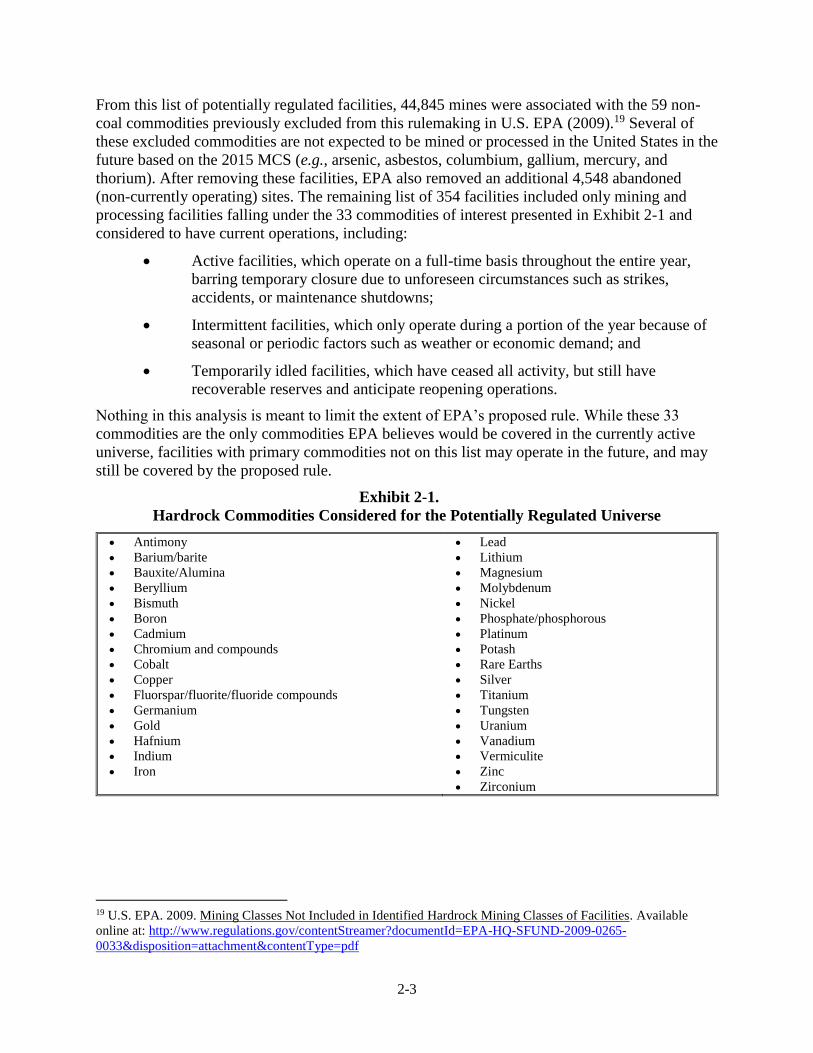
2-3
From this list of potentially regulated facilities, 44,845 mines were associated with the 59 non-
coal commodities previously excluded from this rulemaking in U.S. EPA (2009).19 Several of
these excluded commodities are not expected to be mined or processed in the United States in the
future based on the 2015 MCS (e.g., arsenic, asbestos, columbium, gallium, mercury, and
thorium). After removing these facilities, EPA also removed an additional 4,548 abandoned
(non-currently operating) sites. The remaining list of 354 facilities included only mining and
processing facilities falling under the 33 commodities of interest presented in Exhibit 2-1 and
considered to have current operations, including:
Active facilities, which operate on a full-time basis throughout the entire year,
barring temporary closure due to unforeseen circumstances such as strikes,
accidents, or maintenance shutdowns;
Intermittent facilities, which only operate during a portion of the year because of
seasonal or periodic factors such as weather or economic demand; and
Temporarily idled facilities, which have ceased all activity, but still have
recoverable reserves and anticipate reopening operations.
Nothing in this analysis is meant to limit the extent of EPA’s proposed rule. While these 33
commodities are the only commodities EPA believes would be covered in the currently active
universe, facilities with primary commodities not on this list may operate in the future, and may
still be covered by the proposed rule.
Exhibit 2-1.
Hardrock Commodities Considered for the Potentially Regulated Universe
Antimony
Barium/barite
Bauxite/Alumina
Beryllium
Bismuth
Boron
Cadmium
Chromium and compounds
Cobalt
Copper
Fluorspar/fluorite/fluoride compounds
Germanium
Gold
Hafnium
Indium
Iron
Lead
Lithium
Magnesium
Molybdenum
Nickel
Phosphate/phosphorous
Platinum
Potash
Rare Earths
Silver
Titanium
Tungsten
Uranium
Vanadium
Vermiculite
Zinc
Zirconium
19 U.S. EPA. 2009. Mining Classes Not Included in Identified Hardrock Mining Classes of Facilities. Available
online at: http://www.regulations.gov/contentStreamer?documentId=EPA-HQ-SFUND-2009-0265-
0033&disposition=attachment&contentType=pdf
2-4
A number of mine facilities are outside the scope of the proposed rule and therefore this RIA.
Specifically, EPA identified classes of facilities that may present a lower level of risk of injury
than other facilities within the 2009 Priority Notice universe, and were therefore not included.
Those classes are:
Mineral exploration projects – defined as activities conducted to ascertain the
existence, location, extent, and/or quality of a deposit of ore or other mineral that
is not at an established mine, so long as exploration activities do not exceed an
area of five acres of disturbance, owners and operators are required under federal
or state law to address environmental matters, owners and operators are compliant
with those requirements, and so long as activities do not include development or
production activities. Compared to fully-developed mining operations, the
impacts of mineral exploration and the volume of waste generated are relatively
low.
Placer mines – defined as the extraction or prospecting of materials in glacial or
alluvial deposits using water to concentrate, and recover, heavy minerals from
placer deposits, including recreational placer operations and suction dredging, so
long as no hazardous substances are used in the concentration or processing of
materials. Most modern placer mining does not utilize added chemicals,
minimizing the potential for release of hazardous substances.
Mining operations of less than five acres that do not use hazardous substances
and have no underground tunnels or adits – while individual small mines may
cause releases or contamination as a result of certain hazardous substances or
mining practices used, such contamination tends to be more limited due to their
lower volumes of mining. Further, small mine projects causing a surface
disturbance of less than five acres are currently eligible for exemptions from
certain financial responsibility requirements.
Processors with less than five acres of disposal – Large surface impoundments
and waste piles at mineral processing facilities may present elevated risk due to
releases from tailings and wastewater stored in these units. However, the risk
posed is lower at waste management units with less than five acres due to the
lower qualities of hazardous substance present, the less likelihood of spills and
structural instability, and the smaller expected impact of any releases.
EPA excluded 133 facilities in these classes, leaving 221 facilities in what is referred to here as
the “included universe.” For information on the universe of facilities and their inclusion in the
analyses in the RIA, please see Appendix A.
2.2 Description of the Universe
This section describes the facilities potentially subject to the requirements of the proposed rule.
Appendix A lists these facilities and reports their location (county and state), MSHA and EPA
Facility Registry System (FRS) identification numbers (if applicable), primary commodity,
operating status, and type of facility.
Exhibit 2-2 describes the distribution of facilities by facility type and operating status. Of the 221
facilities in the included universe, 41 facilities have co-located activities (e.g., surface mining
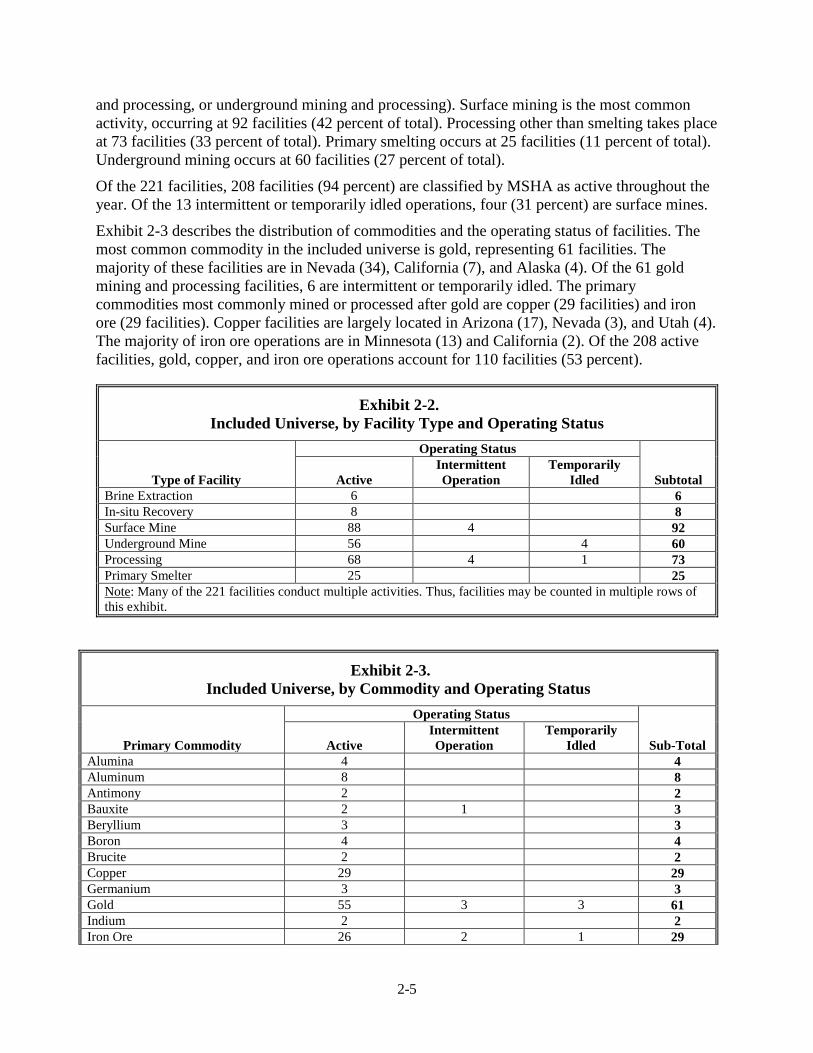
2-5
and processing, or underground mining and processing). Surface mining is the most common
activity, occurring at 92 facilities (42 percent of total). Processing other than smelting takes place
at 73 facilities (33 percent of total). Primary smelting occurs at 25 facilities (11 percent of total).
Underground mining occurs at 60 facilities (27 percent of total).
Of the 221 facilities, 208 facilities (94 percent) are classified by MSHA as active throughout the
year. Of the 13 intermittent or temporarily idled operations, four (31 percent) are surface mines.
Exhibit 2-3 describes the distribution of commodities and the operating status of facilities. The
most common commodity in the included universe is gold, representing 61 facilities. The
majority of these facilities are in Nevada (34), California (7), and Alaska (4). Of the 61 gold
mining and processing facilities, 6 are intermittent or temporarily idled. The primary
commodities most commonly mined or processed after gold are copper (29 facilities) and iron
ore (29 facilities). Copper facilities are largely located in Arizona (17), Nevada (3), and Utah (4).
The majority of iron ore operations are in Minnesota (13) and California (2). Of the 208 active
facilities, gold, copper, and iron ore operations account for 110 facilities (53 percent).
Exhibit 2-2.
Included Universe, by Facility Type and Operating Status
Type of Facility
Operating Status
Subtotal Active
Intermittent
Operation
Temporarily
Idled
Brine Extraction 6 6
In-situ Recovery 8 8
Surface Mine 88 4 92
Underground Mine 56 4 60
Processing 68 4 1 73
Primary Smelter 25 25
Note: Many of the 221 facilities conduct multiple activities. Thus, facilities may be counted in multiple rows of
this exhibit.
Exhibit 2-3.
Included Universe, by Commodity and Operating Status
Primary Commodity
Operating Status
Sub-Total Active
Intermittent
Operation
Temporarily
Idled
Alumina 4 4
Aluminum 8 8
Antimony 2 2
Bauxite 2 1 3
Beryllium 3 3
Boron 4 4
Brucite 2 2
Copper 29 29
Germanium 3 3
Gold 55 3 3 61
Indium 2 2
Iron Ore 26 2 1 29
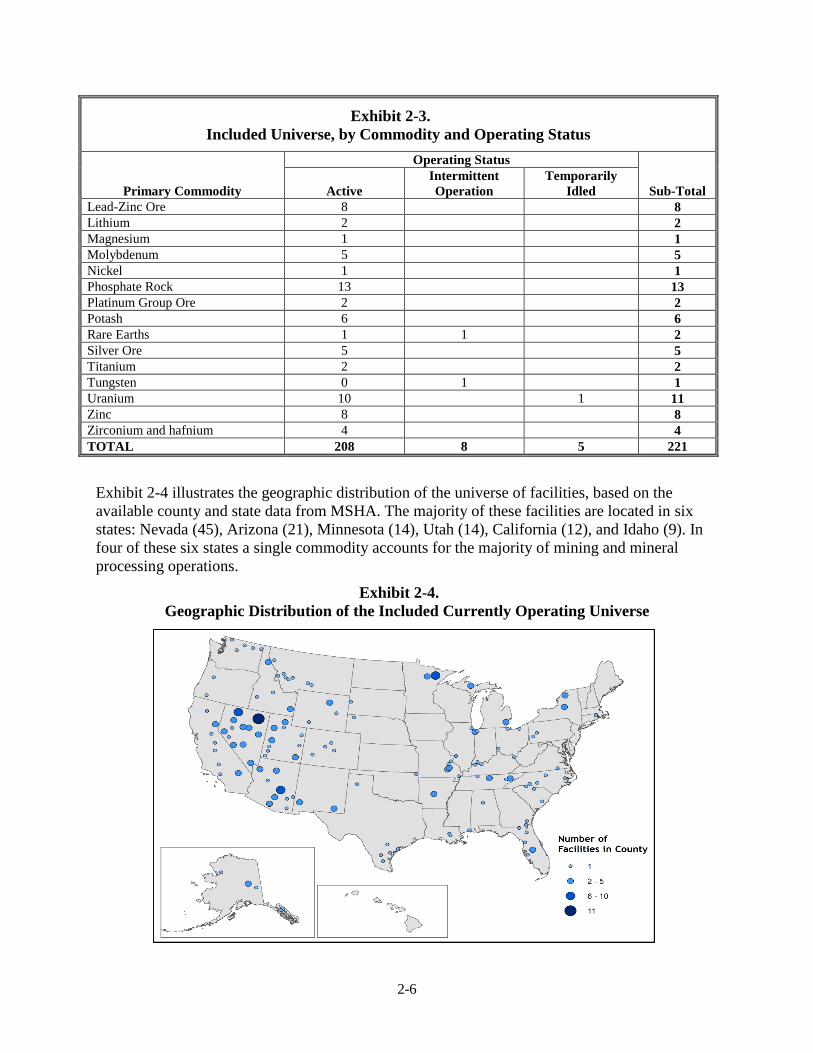
2-6
Exhibit 2-3.
Included Universe, by Commodity and Operating Status
Primary Commodity
Operating Status
Sub-Total Active
Intermittent
Operation
Temporarily
Idled
Lead-Zinc Ore 8 8
Lithium 2 2
Magnesium 1 1
Molybdenum 5 5
Nickel 1 1
Phosphate Rock 13 13
Platinum Group Ore 2 2
Potash 6 6
Rare Earths 1 1 2
Silver Ore 5 5
Titanium 2 2
Tungsten 0 1 1
Uranium 10 1 11
Zinc 8 8
Zirconium and hafnium 4 4
TOTAL 208 8 5 221
Exhibit 2-4 illustrates the geographic distribution of the universe of facilities, based on the
available county and state data from MSHA. The majority of these facilities are located in six
states: Nevada (45), Arizona (21), Minnesota (14), Utah (14), California (12), and Idaho (9). In
four of these six states a single commodity accounts for the majority of mining and mineral
processing operations.
Exhibit 2-4.
Geographic Distribution of the Included Currently Operating Universe
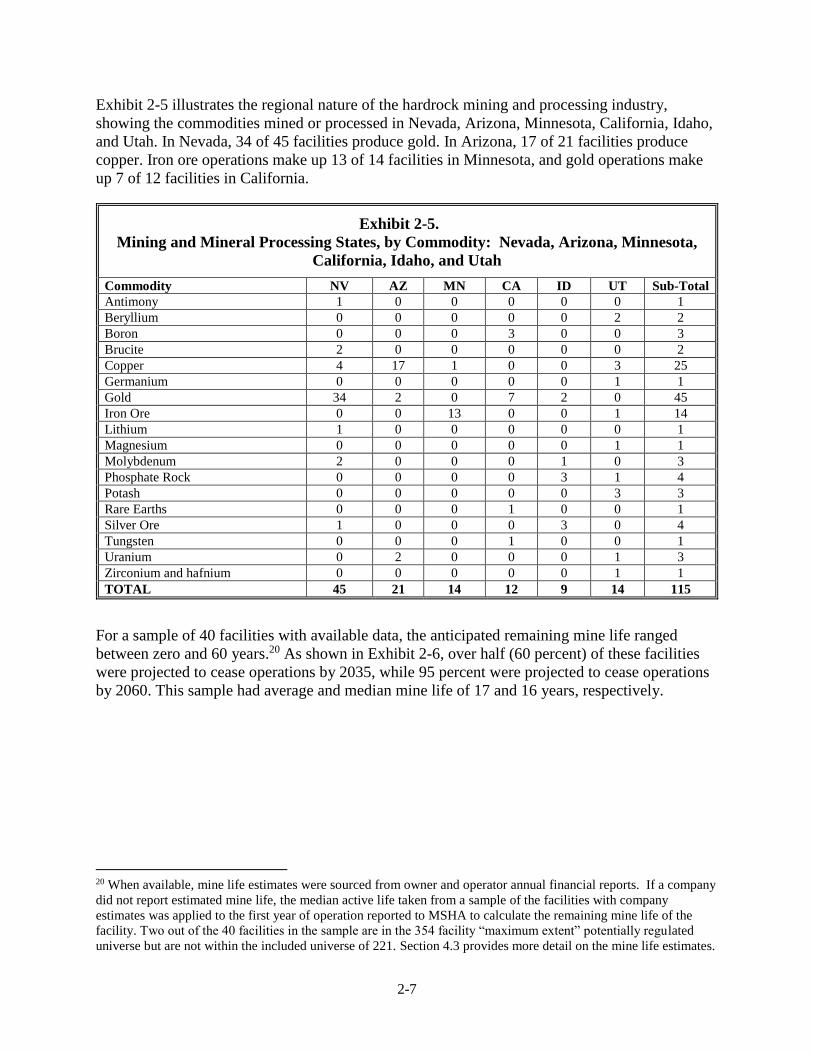
2-7
Exhibit 2-5 illustrates the regional nature of the hardrock mining and processing industry,
showing the commodities mined or processed in Nevada, Arizona, Minnesota, California, Idaho,
and Utah. In Nevada, 34 of 45 facilities produce gold. In Arizona, 17 of 21 facilities produce
copper. Iron ore operations make up 13 of 14 facilities in Minnesota, and gold operations make
up 7 of 12 facilities in California.
Exhibit 2-5.
Mining and Mineral Processing States, by Commodity: Nevada, Arizona, Minnesota,
California, Idaho, and Utah
Commodity NV AZ MN CA ID UT Sub-Total
Antimony 1 0 0 0 0 0 1
Beryllium 0 0 0 0 0 2 2
Boron 0 0 0 3 0 0 3
Brucite 2 0 0 0 0 0 2
Copper 4 17 1 0 0 3 25
Germanium 0 0 0 0 0 1 1
Gold 34 2 0 7 2 0 45
Iron Ore 0 0 13 0 0 1 14
Lithium 1 0 0 0 0 0 1
Magnesium 0 0 0 0 0 1 1
Molybdenum 2 0 0 0 1 0 3
Phosphate Rock 0 0 0 0 3 1 4
Potash 0 0 0 0 0 3 3
Rare Earths 0 0 0 1 0 0 1
Silver Ore 1 0 0 0 3 0 4
Tungsten 0 0 0 1 0 0 1
Uranium 0 2 0 0 0 1 3
Zirconium and hafnium 0 0 0 0 0 1 1
TOTAL 45 21 14 12 9 14 115
For a sample of 40 facilities with available data, the anticipated remaining mine life ranged
between zero and 60 years.20 As shown in Exhibit 2-6, over half (60 percent) of these facilities
were projected to cease operations by 2035, while 95 percent were projected to cease operations
by 2060. This sample had average and median mine life of 17 and 16 years, respectively.
20 When available, mine life estimates were sourced from owner and operator annual financial reports. If a company
did not report estimated mine life, the median active life taken from a sample of the facilities with company
estimates was applied to the first year of operation reported to MSHA to calculate the remaining mine life of the
facility. Two out of the 40 facilities in the sample are in the 354 facility “maximum extent” potentially regulated
universe but are not within the included universe of 221. Section 4.3 provides more detail on the mine life estimates.
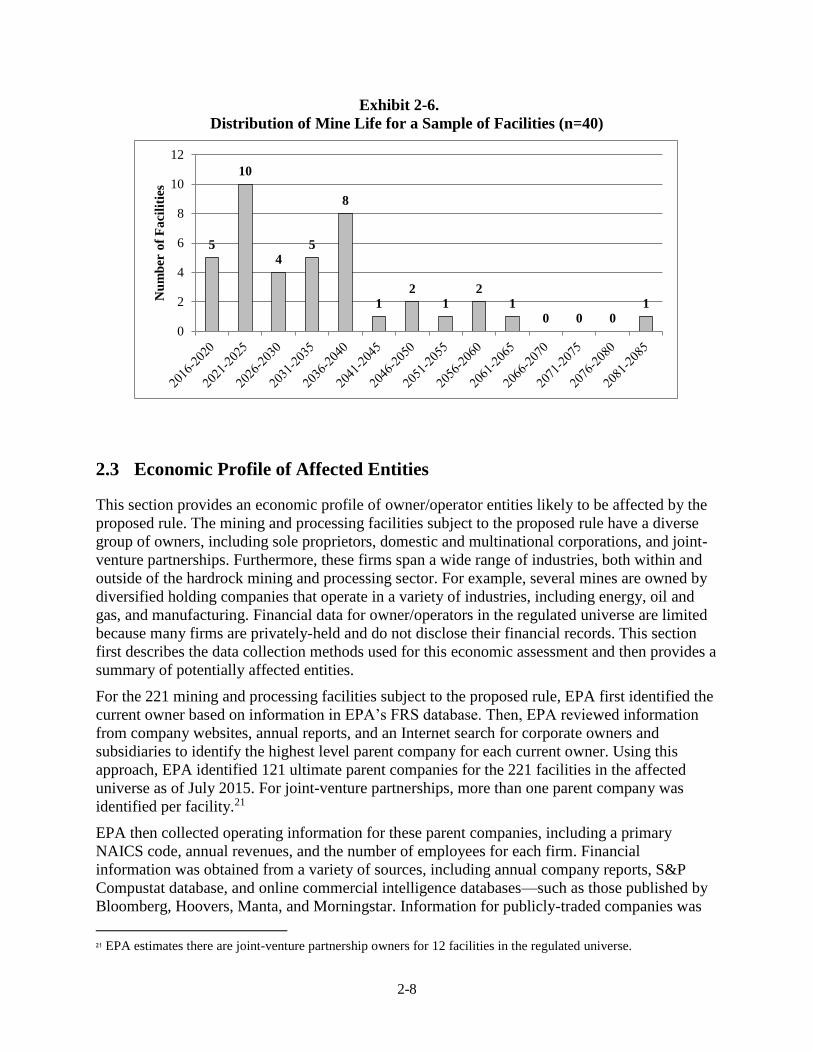
2-8
Exhibit 2-6.
Distribution of Mine Life for a Sample of Facilities (n=40)
2.3 Economic Profile of Affected Entities
This section provides an economic profile of owner/operator entities likely to be affected by the
proposed rule. The mining and processing facilities subject to the proposed rule have a diverse
group of owners, including sole proprietors, domestic and multinational corporations, and joint-
venture partnerships. Furthermore, these firms span a wide range of industries, both within and
outside of the hardrock mining and processing sector. For example, several mines are owned by
diversified holding companies that operate in a variety of industries, including energy, oil and
gas, and manufacturing. Financial data for owner/operators in the regulated universe are limited
because many firms are privately-held and do not disclose their financial records. This section
first describes the data collection methods used for this economic assessment and then provides a
summary of potentially affected entities.
For the 221 mining and processing facilities subject to the proposed rule, EPA first identified the
current owner based on information in EPA’s FRS database. Then, EPA reviewed information
from company websites, annual reports, and an Internet search for corporate owners and
subsidiaries to identify the highest level parent company for each current owner. Using this
approach, EPA identified 121 ultimate parent companies for the 221 facilities in the affected
universe as of July 2015. For joint-venture partnerships, more than one parent company was
identified per facility.21
EPA then collected operating information for these parent companies, including a primary
NAICS code, annual revenues, and the number of employees for each firm. Financial
information was obtained from a variety of sources, including annual company reports, S&P
Compustat database, and online commercial intelligence databases—such as those published by
Bloomberg, Hoovers, Manta, and Morningstar. Information for publicly-traded companies was
21 EPA estimates there are joint-venture partnership owners for 12 facilities in the regulated universe.
5
10
45
8
12
12
10 0 0
1
0
2
4
6
8
10
12N
um
ber
of
Fa
cili
ties
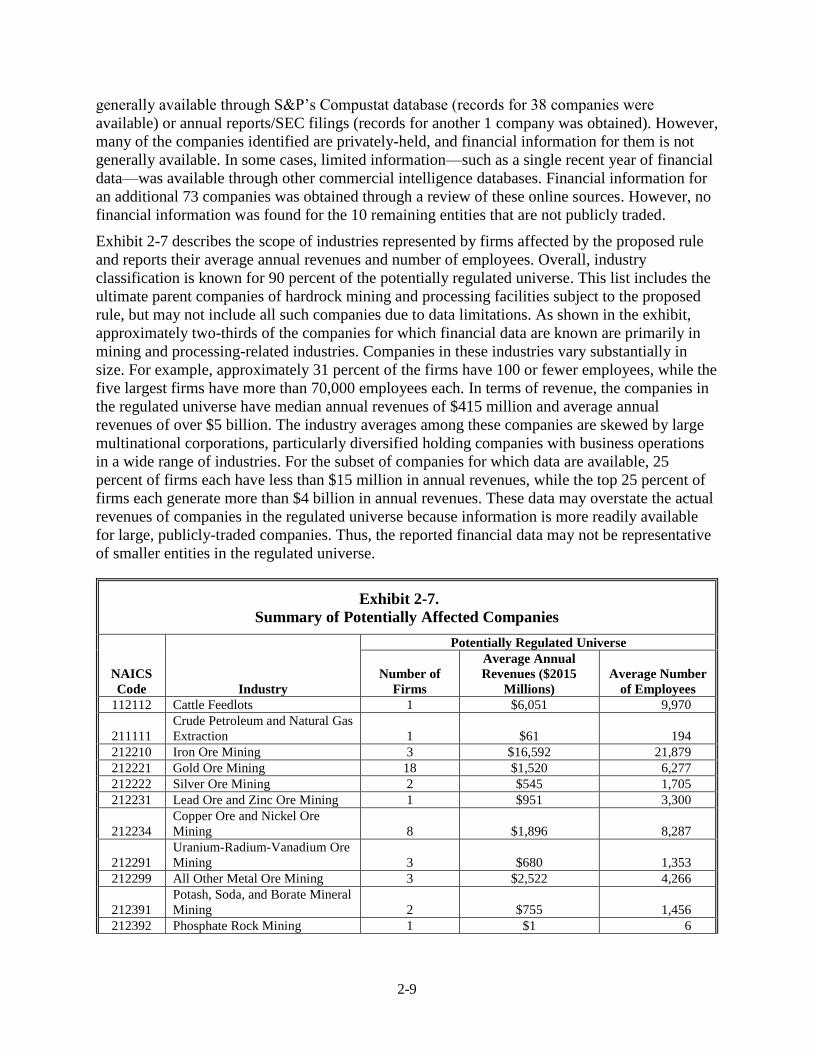
2-9
generally available through S&P’s Compustat database (records for 38 companies were
available) or annual reports/SEC filings (records for another 1 company was obtained). However,
many of the companies identified are privately-held, and financial information for them is not
generally available. In some cases, limited information—such as a single recent year of financial
data—was available through other commercial intelligence databases. Financial information for
an additional 73 companies was obtained through a review of these online sources. However, no
financial information was found for the 10 remaining entities that are not publicly traded.
Exhibit 2-7 describes the scope of industries represented by firms affected by the proposed rule
and reports their average annual revenues and number of employees. Overall, industry
classification is known for 90 percent of the potentially regulated universe. This list includes the
ultimate parent companies of hardrock mining and processing facilities subject to the proposed
rule, but may not include all such companies due to data limitations. As shown in the exhibit,
approximately two-thirds of the companies for which financial data are known are primarily in
mining and processing-related industries. Companies in these industries vary substantially in
size. For example, approximately 31 percent of the firms have 100 or fewer employees, while the
five largest firms have more than 70,000 employees each. In terms of revenue, the companies in
the regulated universe have median annual revenues of $415 million and average annual
revenues of over $5 billion. The industry averages among these companies are skewed by large
multinational corporations, particularly diversified holding companies with business operations
in a wide range of industries. For the subset of companies for which data are available, 25
percent of firms each have less than $15 million in annual revenues, while the top 25 percent of
firms each generate more than $4 billion in annual revenues. These data may overstate the actual
revenues of companies in the regulated universe because information is more readily available
for large, publicly-traded companies. Thus, the reported financial data may not be representative
of smaller entities in the regulated universe.
Exhibit 2-7.
Summary of Potentially Affected Companies
NAICS
Code Industry
Potentially Regulated Universe
Number of
Firms
Average Annual
Revenues ($2015
Millions)
Average Number
of Employees
112112 Cattle Feedlots 1 $6,051 9,970
211111
Crude Petroleum and Natural Gas
Extraction 1 $61 194
212210 Iron Ore Mining 3 $16,592 21,879
212221 Gold Ore Mining 18 $1,520 6,277
212222 Silver Ore Mining 2 $545 1,705
212231 Lead Ore and Zinc Ore Mining 1 $951 3,300
212234
Copper Ore and Nickel Ore
Mining 8 $1,896 8,287
212291
Uranium-Radium-Vanadium Ore
Mining 3 $680 1,353
212299 All Other Metal Ore Mining 3 $2,522 4,266
212391
Potash, Soda, and Borate Mineral
Mining 2 $755 1,456
212392 Phosphate Rock Mining 1 $1 6
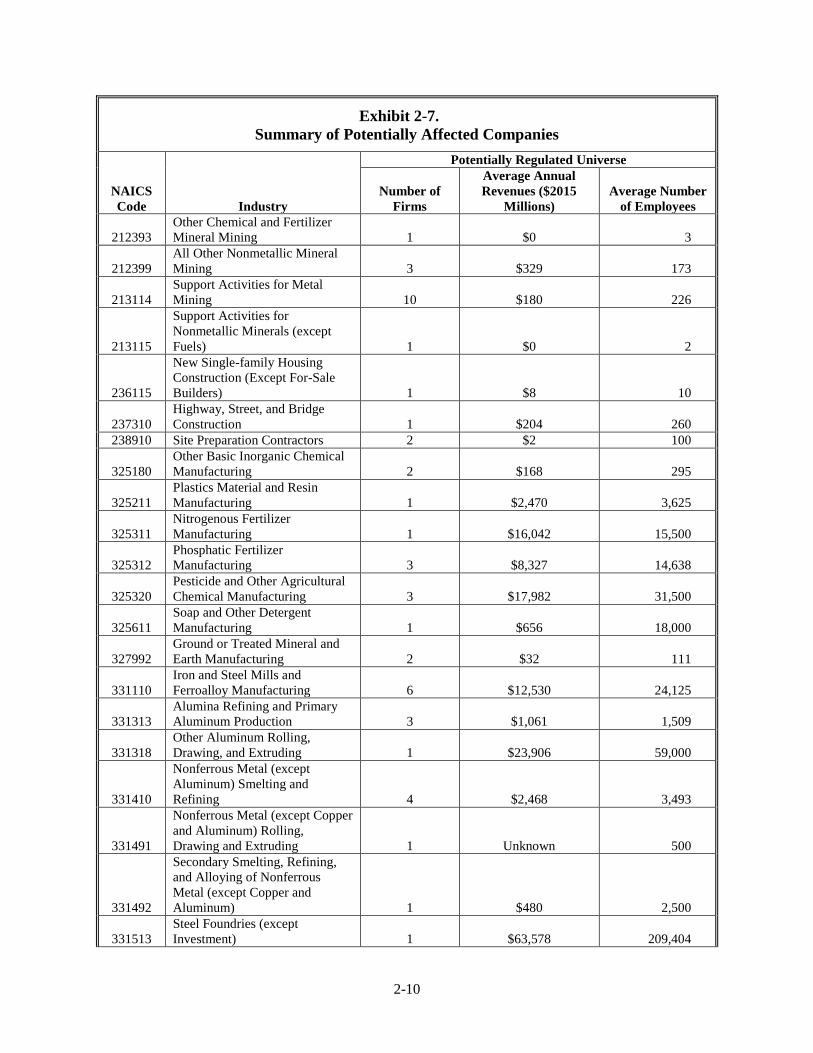
2-10
Exhibit 2-7.
Summary of Potentially Affected Companies
NAICS
Code Industry
Potentially Regulated Universe
Number of
Firms
Average Annual
Revenues ($2015
Millions)
Average Number
of Employees
212393
Other Chemical and Fertilizer
Mineral Mining 1 $0 3
212399
All Other Nonmetallic Mineral
Mining 3 $329 173
213114
Support Activities for Metal
Mining 10 $180 226
213115
Support Activities for
Nonmetallic Minerals (except
Fuels) 1 $0 2
236115
New Single-family Housing
Construction (Except For-Sale
Builders) 1 $8 10
237310
Highway, Street, and Bridge
Construction 1 $204 260
238910 Site Preparation Contractors 2 $2 100
325180
Other Basic Inorganic Chemical
Manufacturing 2 $168 295
325211
Plastics Material and Resin
Manufacturing 1 $2,470 3,625
325311
Nitrogenous Fertilizer
Manufacturing 1 $16,042 15,500
325312
Phosphatic Fertilizer
Manufacturing 3 $8,327 14,638
325320
Pesticide and Other Agricultural
Chemical Manufacturing 3 $17,982 31,500
325611
Soap and Other Detergent
Manufacturing 1 $656 18,000
327992
Ground or Treated Mineral and
Earth Manufacturing 2 $32 111
331110
Iron and Steel Mills and
Ferroalloy Manufacturing 6 $12,530 24,125
331313
Alumina Refining and Primary
Aluminum Production 3 $1,061 1,509
331318
Other Aluminum Rolling,
Drawing, and Extruding 1 $23,906 59,000
331410
Nonferrous Metal (except
Aluminum) Smelting and
Refining 4 $2,468 3,493
331491
Nonferrous Metal (except Copper
and Aluminum) Rolling,
Drawing and Extruding 1 Unknown 500
331492
Secondary Smelting, Refining,
and Alloying of Nonferrous
Metal (except Copper and
Aluminum) 1 $480 2,500
331513
Steel Foundries (except
Investment) 1 $63,578 209,404
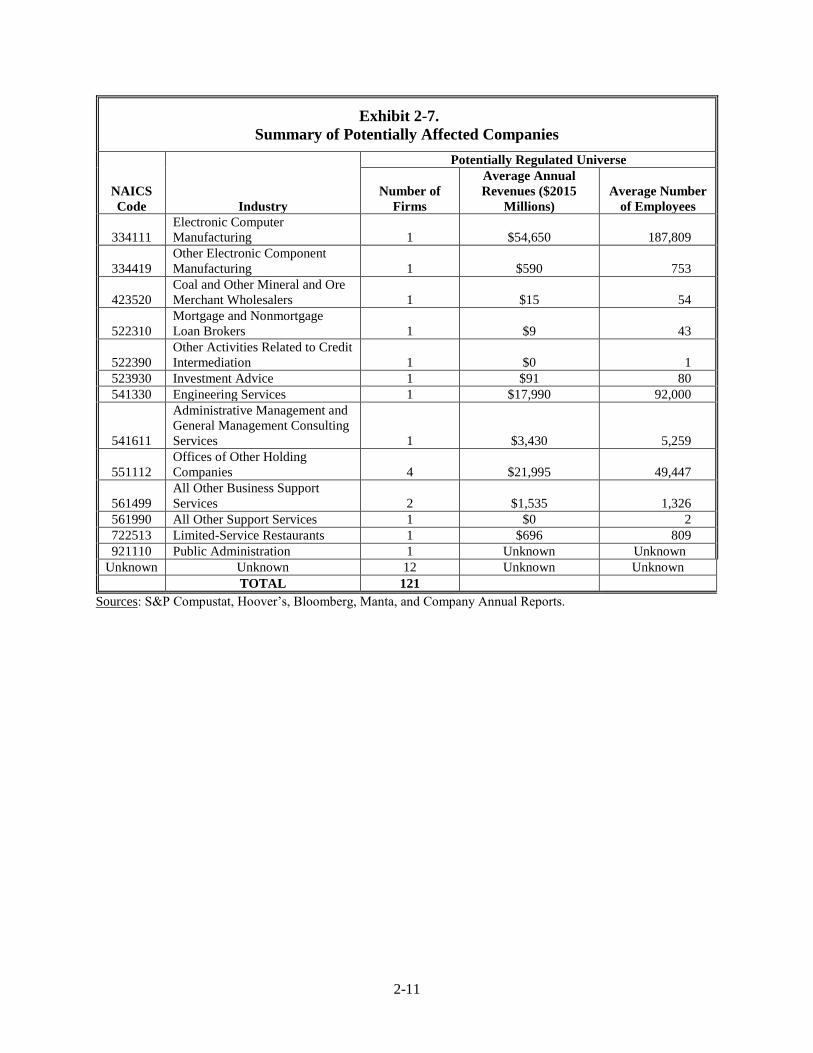
2-11
Exhibit 2-7.
Summary of Potentially Affected Companies
NAICS
Code Industry
Potentially Regulated Universe
Number of
Firms
Average Annual
Revenues ($2015
Millions)
Average Number
of Employees
334111
Electronic Computer
Manufacturing 1 $54,650 187,809
334419
Other Electronic Component
Manufacturing 1 $590 753
423520
Coal and Other Mineral and Ore
Merchant Wholesalers 1 $15 54
522310
Mortgage and Nonmortgage
Loan Brokers 1 $9 43
522390
Other Activities Related to Credit
Intermediation 1 $0 1
523930 Investment Advice 1 $91 80
541330 Engineering Services 1 $17,990 92,000
541611
Administrative Management and
General Management Consulting
Services 1 $3,430 5,259
551112
Offices of Other Holding
Companies 4 $21,995 49,447
561499
All Other Business Support
Services 2 $1,535 1,326
561990 All Other Support Services 1 $0 2
722513 Limited-Service Restaurants 1 $696 809
921110 Public Administration 1 Unknown Unknown
Unknown Unknown 12 Unknown Unknown
TOTAL 121
Sources: S&P Compustat, Hoover’s, Bloomberg, Manta, and Company Annual Reports.
3-1
Chapter 3.
Analytic Framework and Estimation of Financial Responsibility
Amounts
This chapter outlines the analytic framework applied in the assessment of regulatory impacts for
the proposed rulemaking establishing financial responsibility requirements for certain classes of
facilities within the hardrock mining sector under CERCLA 108(b). In addition, it outlines the
approach for a key analytic step – the estimation of engineering costs that form the basis for
facility-specific CERCLA financial responsibility amounts. Finally, the chapter presents the
results of extrapolating the median FR amounts for each facility type in the modeled universe to
the facility types in the potentially regulated universe.
3.1 Analytic Framework
Exhibit 3-1 presents a flow diagram of the key analytic steps in this assessment of the proposed
rule. As illustrated in the exhibit, EPA developed a multi-dimensional analysis to estimate the
costs of the proposed rule, focusing on the private costs to industry and the change in the
distribution of potential CERCLA costs between the industry and government across the baseline
and regulatory scenarios. In addition, the analysis discusses whether certain components of
industry costs may be considered transfers, from a social welfare standpoint, and derives a
related measure of social costs. Finally, the analysis presents the impacts of the rule from an
accounting standpoint, illustrating the actual cash “out-of-pocket” the regulated community may
expend to procure financial responsibility instruments.
Specifically, this analysis involves identification of the regulated universe, estimation of
regulated facilities’ financial responsibility obligations, and assessment of the costs associated
with obtaining FR instruments for those facilities. The specific steps in the analysis are as
follows (step numbers refer to related boxes in the flow diagram):
1. Identify the universe of facilities and companies subject to the proposed
rulemaking. The approach described in Chapter 2 identified 221 facilities and
121 ultimate parent companies in the affected universe.
2. Develop “modeled universe” of facilities. Ideally, this analysis would rely on
company-level financial information and facility-specific engineering cost
estimates for each company affected by the proposed rule to estimate the impacts
of obtaining financial assurance. This information, however, is not readily
available for all facilities and companies. EPA therefore utilizes a sample of
mining facilities and related owner companies to create a modeled universe,
which is assumed to be largely representative of the full universe described in the
preceding chapter. This modeled universe includes 49 individual facilities.
Section 3.2 of this chapter and Chapter 4 provide additional detail on
development of these data sets and the potential bias they may introduce.
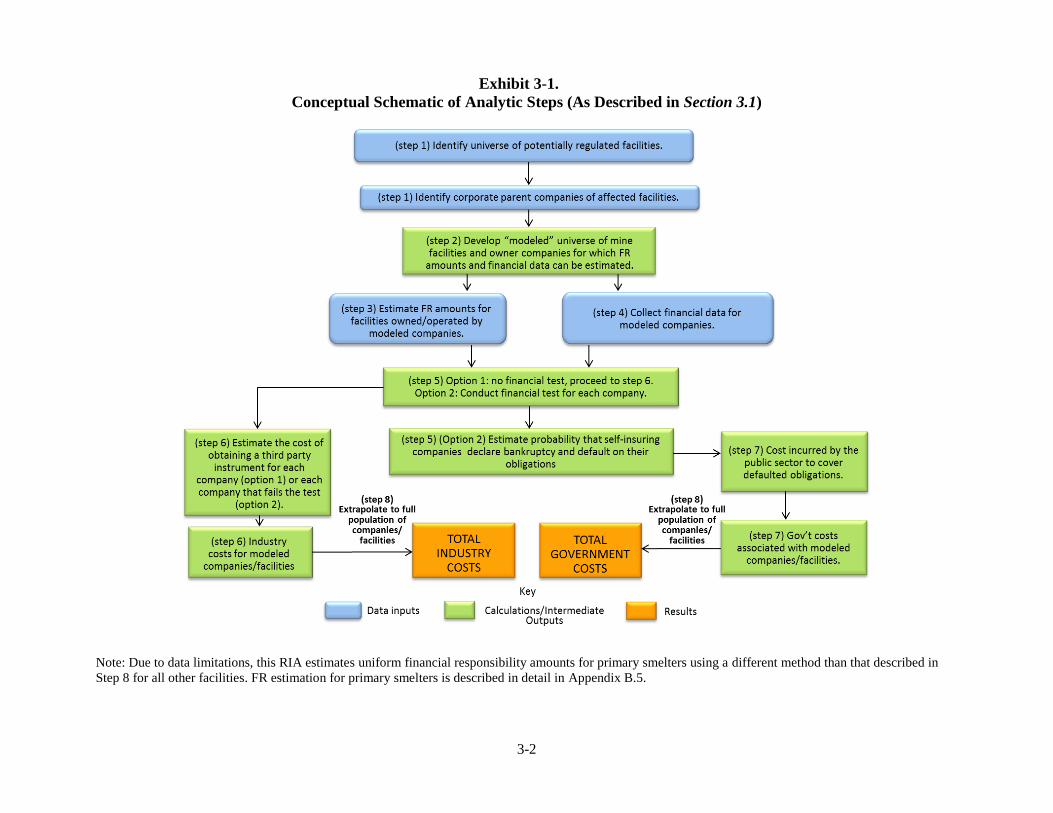
3-2
Exhibit 3-1.
Conceptual Schematic of Analytic Steps (As Described in Section 3.1)
Note: Due to data limitations, this RIA estimates uniform financial responsibility amounts for primary smelters using a different method than that described in
Step 8 for all other facilities. FR estimation for primary smelters is described in detail in Appendix B.5.
3-3
3. Estimate CERCLA financial responsibility amounts for the modeled universe
of facilities. EPA estimated the financial obligations of modeled facilities based
on a regression analysis relating the characteristics of individual facilities to
facility-specific engineering cost estimates. The details of this estimation process
are highlighted later in this chapter. EPA also evaluated whether facilities could
reduce their financial responsibility based on documents laying out future
reclamation actions that meet environmental performance standards.
4. Obtain financial information for a subset of publicly-traded companies. As
indicated above, financial data are not readily available for many of the
owner/operator companies likely to be affected by the proposed rule. This is
particularly true of privately held companies, which face less stringent financial
reporting requirements than public companies. Given these limitations in the
availability of financial data, the analysis is based on a sample of publicly-traded
companies. Chapter 4 includes more detailed discussion of the financial
information and methods utilized in the analysis.
5. Subject the sampled companies to the two regulatory alternatives. Based on
the financial responsibility amounts estimated in step 3 and financial data for each
modeled company, EPA subjected the entities to the two regulatory alternatives:
(1) the preferred alternative that does not contemplate the financial test and (2) the
proposed financial test alternative. Under this step, a measure of default
probability is derived for modeled entities in the baseline and for those entities
passing a financial test under Option 2. This analysis assumes that companies that
pass the financial test choose to self-insure or acquire a corporate guarantee over
third-party FR instruments.
6. Estimate industry costs associated with the baseline and regulatory
alternatives. EPA defines industry costs as the resources expended to obtain a
third-party financial instrument for companies that are obligated to procure one.
In the baseline (absent the rule), industry does not face a requirement to obtain
third-party instruments estimated in step 3. Under the proposed rule under Option
1, industry costs will include the costs borne by all companies to secure financial
responsibility amounts for the obligations estimated in step 3. Similarly, under
Option 2, companies that fail the financial test will also incur these costs. This
RIA separately estimates the cost of three representative FR instruments:
obtaining a letter of credit, trust fund, and insurance policy for each entity, given a
financial responsibility amount. For purposes of the analysis, EPA assumes that
companies would choose the lowest-cost option.22 Finally, this analysis assumes
that under Option 2, companies that pass the financial test may still default on
their obligations (see step 5 above); however, a zero default rate is assumed for
22 Companies that do not currently possess a credit rating from a nationally recognized statistical rating organization
(NRSRO) may need to obtain one to pass the financial test, mainly in instances where the company’s tangible net
worth exceeds the regulatory standard. The resources that companies expend to obtain a credit rating represent an
incremental cost of the financial test. EPA does not consider this cost in the modeling exercise, as it likely would
apply to a small number of the companies in the potentially regulated universe.
3-4
third-party FR instruments. The methods for pricing third-party instruments and
deriving related industry costs are detailed in Chapter 4.
7. Estimate government costs associated with the baseline and regulatory
alternatives. Estimated FR amounts may not correspond to actual future
CERCLA liabilities due to numerous uncertainties. For the purposes of estimating
changes in government burden due to the rule, this RIA calculates the government
burden assuming that FR amounts are representative of costs associated with
future CERCLA cleanups. In the baseline, the government is burdened with the
CERCLA cost if a responsible party defaults, as no third-party instruments will be
in place. In other words, this RIA assumes that in the baseline the government
will carry the cost of future CERCLA liabilities of facilities within the potentially
regulated universe. For the baseline, the government burden rate is estimated
using the firm exit rate derived from the Census Bureau’s Business Dynamics
Statistics (BDS).23 This represents a high-end estimate that assumes exiting
firms fail to meet any of their CERCLA obligations. Under Option 2, government
costs are calculated based on estimated probabilities of default for firms in the
modeled universe. Under this option, if a company passes the financial test but
later files for bankruptcy and defaults on its financial responsibility obligations,
this RIA likewise assumes that EPA or other government entities will assume
these obligations. Under Option 1, there are no government costs, as no company
may self-insure. Third-party instruments secure all of the financial responsibility.
The methods for deriving government costs are detailed in Chapters 4 and 5.
8. Extrapolate costs for the modeled universe to the full universe of facilities
with CERCLA financial responsibility amounts. Based on the estimated
industry and government costs associated with the modeled universe (see steps 6
and 7), the analysis then extrapolates these results to the full universe of facilities.
The extrapolation process is discussed later in this chapter, and in Chapter 5. Due
to data limitations for primary smelters (not represented in the modeled universe),
EPA applied a uniform FR amount to these facilities separately from the
extrapolation process for other types of facilities. Appendix B.5 describes the
derivation of this uniform FR amount.
EPA applies the approach outlined above to estimate the costs of the rule as well as the
distribution of costs between affected parties. One of the primary economic effects of the
proposed rule is a transfer of estimated CERCLA costs assumed by the government in the
baseline to private parties under the proposed rule. While the change in government costs
represents an important impact of the proposed rule, it is important to note that a portion of these
impacts—the financial responsibility obligations assumed by government—represent a transfer
of costs between parties. That is, although the proposed rule may affect the distribution of costs
between the private and public sectors, it does not affect the overall magnitude of these costs.
Under EPA’s modeling approach, quantified costs associated with CERCLA cleanups remain
unchanged, regardless of whether individual companies or the government incur these costs. The
primary industry cost of the rule is therefore the incremental cost of procuring third party
23 In the baseline, the government costs are calculated using the three-year average of the annual firm exit rate
calculated from the BDS (7.45 percent). Section 5.3 describes the application of this assumption in more detail.
3-5
financial instruments. Estimates of administrative costs to industry are also provided. Industry
costs that were not quantified, but are qualitatively discussed, include the costs of actions to
improve environmental performance, which are incentivized due to the rule and the proposed
reduction factors. EPA addresses the potential broader benefits of the rule related to improved
facility operations, accelerated cleanups, and other factors in Chapter 7.
For purposes of estimating the cost impacts of the proposed rule, this RIA distinguishes between
two types of costs: (1) the private costs imposed on facility owners and operators and (2) the
social costs imposed on society as a whole. The private costs of the rule represent the costs that
the owner or operator of a potentially regulated facility bears to obtain a financial instrument that
ensures that funds will be available when needed to cover the facility’s CERCLA liabilities. The
measurement of private costs faced by different parties is required to evaluate the distributional
impacts of the rule and to predict how different parties will respond to the change in regulation.
For example, as described in Chapter 4, the estimated private costs of different types of financial
instruments influence the choice of instruments among regulated companies.
The private costs realized by facility owners and operators to obtain a financial instrument
include the fees associated with each instrument type and the incremental cost of acquiring funds
to secure each instrument (e.g., the cost incurred to apply collateral for a letter of credit).24 To
secure FR instruments, facility owners may use available funds or procure capital from debt or
equity markets. In either case, this RIA uses each company’s weighted average cost of capital
(WACC) to estimate the net cost of acquiring funds. For financial instruments structured such
that the facility owner or operator realizes a return on capital set aside but still must acquire
incremental funds at the WACC, this RIA estimates private costs as the difference between the
two, plus the costs associated with commissions and fees.
Social costs reflect the value of the real resources (e.g., labor and capital) needed to comply with
the rule. Discerning social costs in the context of this proposed rule presents an analytic
challenge, as these costs are not fully quantifiable. However, this analysis considers the
following to be social costs of the rule: (1) costs of calculating the required FR amounts; (2) the
fees and commissions paid to financial institutions to obtain financial instruments that provide
assurance for the funding of CERCLA financial responsibility amounts; and (3) industry
administrative costs to review FA calculations and inputs, choose an FR instrument, and
otherwise comply with the proposed rule.25 On the other hand, the net acquisition cost of capital
associated with these instruments is presented as a transfer in this RIA.26 The theoretical
argument supporting this presentation suggests that, even though the rule causes society to adjust
its optimal portfolio of investments, the broader economy will re-equilibrate, and any
incremental welfare differences may be small.
24 As described in Chapter 4, the structure of capital set asides varies by financial instrument. For a letter of credit,
the capital set aside is collateral required by the bank. For a trust fund, the funding of the trust represents a capital
set aside. For an insurance policy, the premiums paid by the facility owner or operator are capital set asides. 25 A fourth category of social cost could include the cost of any technologies adopted as a result of having mines
fully internalize the expectation of a future negative externality (e.g., any engineering controls mines choose to
install in order to prevent or minimize their CERCLA FR amount). This effect is separately accounted for in the
estimation of reduction-based FR amounts and in the benefits discussion in Chapter 7. 26 This exclusion of transfers from social costs is consistent with EPA’s Guidelines for Preparing Economic
Analyses, which state that social cost analyses “attempt to estimate the total welfare costs, net of any transfers,
imposed by environmental policies.” See U.S. EPA (2010) Guidelines for Preparing Economic Analyses, p. 1-5.
3-6
In addition to the cost elements described above, this RIA also estimates cash-out-of-pocket
(accounting) outlays incurred by the facilities to comply with the rule (i.e., the cash outflows
associated with compliance with the proposed rule). Note that these costs may occur in the
baseline as well, but in the baseline, the facilities determine the time period over which they save
for these costs. In the regulatory scenario, a facility must set aside funds for these costs as
determined by the schedule in the rule. Since these costs may be incurred in either the baseline or
with the rule, these costs do not represent incremental costs of the rule. The results of this
analysis are presented in Chapter 5.
Finally, the proposed rule could potentially affect the administrative costs incurred by industry
and government (note, this RIA does not quantify the government’s administrative costs).
Industry’s administrative costs are discussed above and included in the social cost calculation.
Government administrative costs may include verifying financial responsibility amounts, facility
inspection, follow-up with financial institutions, and reviewing other documents that owners and
operators submit.
3.2 Estimation of CERCLA Liability Financial Responsibility Amounts
As described above, this chapter and subsequent chapters assess the cost to acquire and maintain
financial responsibility instruments under the proposed rule. First, this RIA identified the
universe of facilities covered by the proposed rule in Chapter 2. Next, to assess the impacts of
the proposed rule, this RIA estimates each company’s financial responsibility obligation,
focusing on the obligations of the modeled universe. The amount of financial responsibility
required includes the following components:
Response component: Response activities include the full suite of cleanup costs
that may be incurred at a facility. These include the costs of solid and hazardous
waste disposal, various feature-specific costs (e.g., engineering costs unique to
open pits or waste rock piles), drainage controls, operations and maintenance
(O&M) costs (distinguishing between interim, short-term, and long-term O&M),
and water treatment costs.
Health assessment component: The financial assurance obtained by regulated
facilities must also cover the costs associated with all phases of a Public Health
Assessment or a Health Consultation (HA) performed by the Agency for Toxic
Substances and Disease Registry (ATSDR).
Natural resource damages (NRD): CERCLA 108(b) also requires that regulated
facilities obtain financial assurance to cover the natural resource damages that
may result from releases of hazardous substances, inclusive of any costs
associated with the assessment of these damages.
Indirect costs: This category includes relevant overhead and oversight costs.
Exhibit 3.2 provides an example of how the EPA calculated the financial responsibility amount
for an example facility.27 The RIA estimated the financial responsibility amount using a
27 The data used in the example for each response category comes from site conditions that exist at facilities in the
modeled universe, but the below site conditions do not all exist together at the same facility.
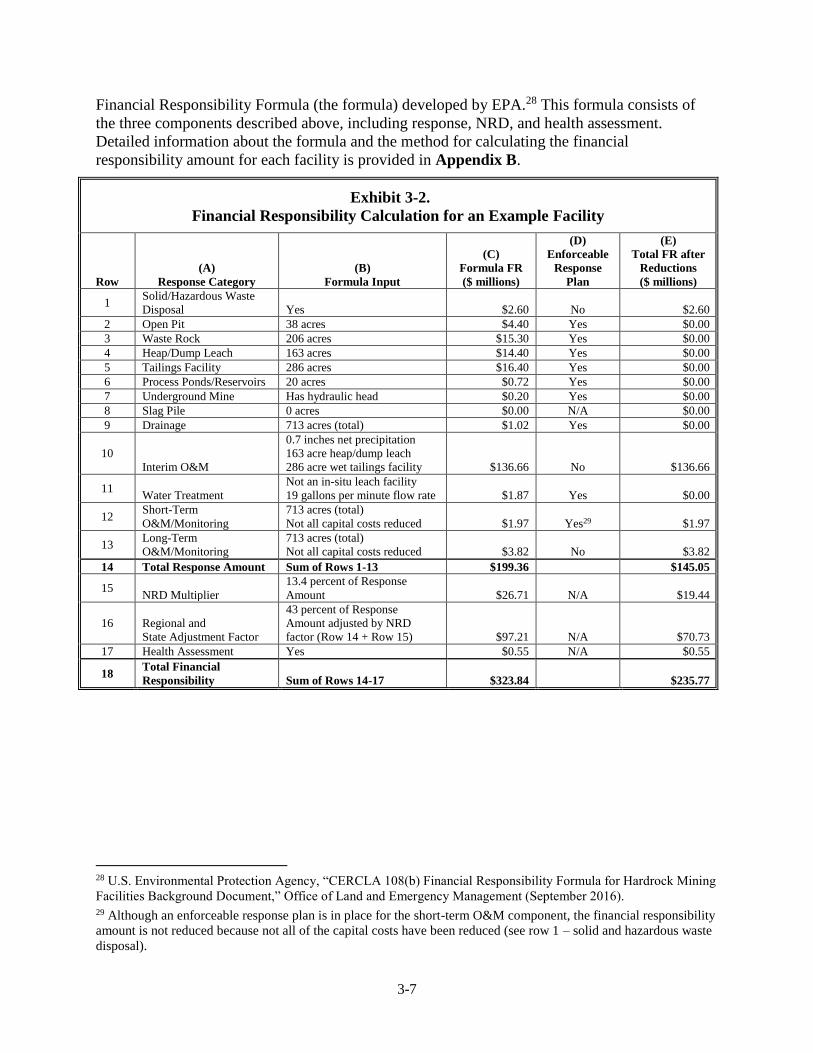
3-7
Financial Responsibility Formula (the formula) developed by EPA.28 This formula consists of
the three components described above, including response, NRD, and health assessment.
Detailed information about the formula and the method for calculating the financial
responsibility amount for each facility is provided in Appendix B.
Exhibit 3-2.
Financial Responsibility Calculation for an Example Facility
Row
(A)
Response Category
(B)
Formula Input
(C)
Formula FR
($ millions)
(D)
Enforceable
Response
Plan
(E)
Total FR after
Reductions
($ millions)
1 Solid/Hazardous Waste
Disposal Yes $2.60 No $2.60
2 Open Pit 38 acres $4.40 Yes $0.00
3 Waste Rock 206 acres $15.30 Yes $0.00
4 Heap/Dump Leach 163 acres $14.40 Yes $0.00
5 Tailings Facility 286 acres $16.40 Yes $0.00
6 Process Ponds/Reservoirs 20 acres $0.72 Yes $0.00
7 Underground Mine Has hydraulic head $0.20 Yes $0.00
8 Slag Pile 0 acres $0.00 N/A $0.00
9 Drainage 713 acres (total) $1.02 Yes $0.00
10
Interim O&M
0.7 inches net precipitation
163 acre heap/dump leach
286 acre wet tailings facility $136.66 No $136.66
11 Water Treatment
Not an in-situ leach facility
19 gallons per minute flow rate $1.87 Yes $0.00
12 Short-Term
O&M/Monitoring
713 acres (total)
Not all capital costs reduced $1.97 Yes29 $1.97
13 Long-Term
O&M/Monitoring
713 acres (total)
Not all capital costs reduced $3.82 No $3.82
14 Total Response Amount Sum of Rows 1-13 $199.36 $145.05
15 NRD Multiplier
13.4 percent of Response
Amount $26.71 N/A $19.44
16 Regional and
State Adjustment Factor
43 percent of Response
Amount adjusted by NRD
factor (Row 14 + Row 15) $97.21 N/A $70.73
17 Health Assessment Yes $0.55 N/A $0.55
18 Total Financial
Responsibility Sum of Rows 14-17 $323.84 $235.77
28 U.S. Environmental Protection Agency, “CERCLA 108(b) Financial Responsibility Formula for Hardrock Mining
Facilities Background Document,” Office of Land and Emergency Management (September 2016). 29 Although an enforceable response plan is in place for the short-term O&M component, the financial responsibility
amount is not reduced because not all of the capital costs have been reduced (see row 1 – solid and hazardous waste
disposal).
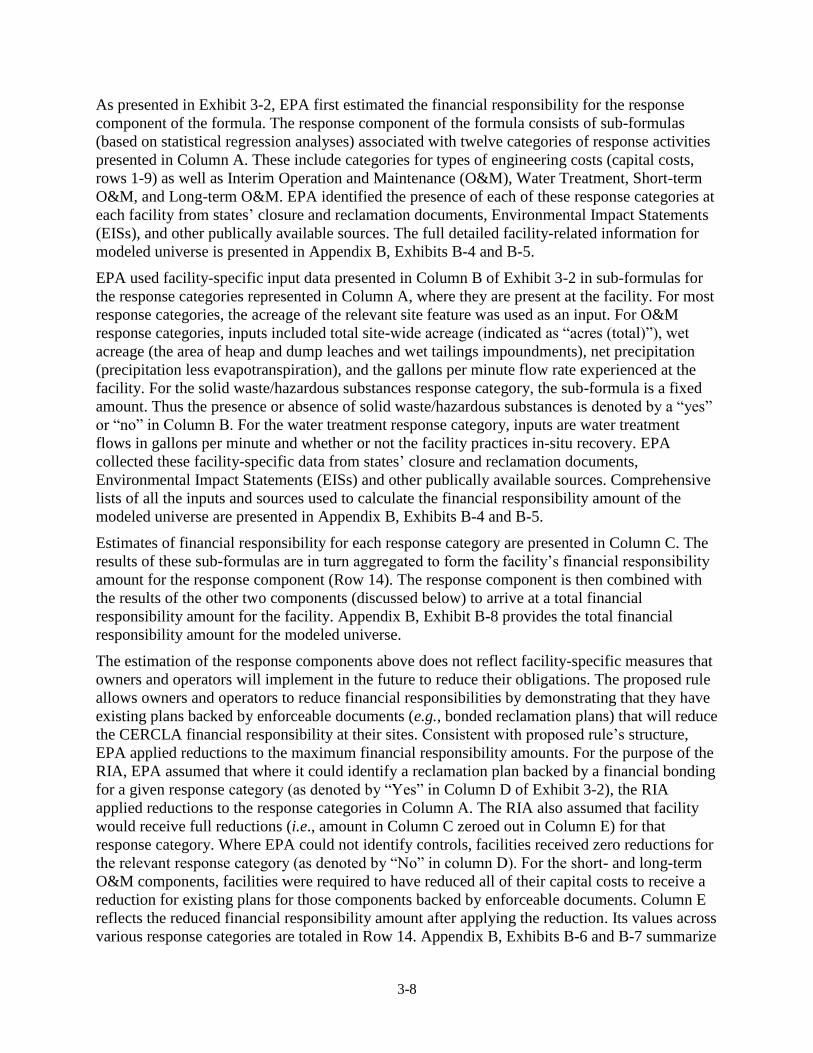
3-8
As presented in Exhibit 3-2, EPA first estimated the financial responsibility for the response
component of the formula. The response component of the formula consists of sub-formulas
(based on statistical regression analyses) associated with twelve categories of response activities
presented in Column A. These include categories for types of engineering costs (capital costs,
rows 1-9) as well as Interim Operation and Maintenance (O&M), Water Treatment, Short-term
O&M, and Long-term O&M. EPA identified the presence of each of these response categories at
each facility from states’ closure and reclamation documents, Environmental Impact Statements
(EISs), and other publically available sources. The full detailed facility-related information for
modeled universe is presented in Appendix B, Exhibits B-4 and B-5.
EPA used facility-specific input data presented in Column B of Exhibit 3-2 in sub-formulas for
the response categories represented in Column A, where they are present at the facility. For most
response categories, the acreage of the relevant site feature was used as an input. For O&M
response categories, inputs included total site-wide acreage (indicated as “acres (total)”), wet
acreage (the area of heap and dump leaches and wet tailings impoundments), net precipitation
(precipitation less evapotranspiration), and the gallons per minute flow rate experienced at the
facility. For the solid waste/hazardous substances response category, the sub-formula is a fixed
amount. Thus the presence or absence of solid waste/hazardous substances is denoted by a “yes”
or “no” in Column B. For the water treatment response category, inputs are water treatment
flows in gallons per minute and whether or not the facility practices in-situ recovery. EPA
collected these facility-specific data from states’ closure and reclamation documents,
Environmental Impact Statements (EISs) and other publically available sources. Comprehensive
lists of all the inputs and sources used to calculate the financial responsibility amount of the
modeled universe are presented in Appendix B, Exhibits B-4 and B-5.
Estimates of financial responsibility for each response category are presented in Column C. The
results of these sub-formulas are in turn aggregated to form the facility’s financial responsibility
amount for the response component (Row 14). The response component is then combined with
the results of the other two components (discussed below) to arrive at a total financial
responsibility amount for the facility. Appendix B, Exhibit B-8 provides the total financial
responsibility amount for the modeled universe.
The estimation of the response components above does not reflect facility-specific measures that
owners and operators will implement in the future to reduce their obligations. The proposed rule
allows owners and operators to reduce financial responsibilities by demonstrating that they have
existing plans backed by enforceable documents (e.g., bonded reclamation plans) that will reduce
the CERCLA financial responsibility at their sites. Consistent with proposed rule’s structure,
EPA applied reductions to the maximum financial responsibility amounts. For the purpose of the
RIA, EPA assumed that where it could identify a reclamation plan backed by a financial bonding
for a given response category (as denoted by “Yes” in Column D of Exhibit 3-2), the RIA
applied reductions to the response categories in Column A. The RIA also assumed that facility
would receive full reductions (i.e., amount in Column C zeroed out in Column E) for that
response category. Where EPA could not identify controls, facilities received zero reductions for
the relevant response category (as denoted by “No” in column D). For the short- and long-term
O&M components, facilities were required to have reduced all of their capital costs to receive a
reduction for existing plans for those components backed by enforceable documents. Column E
reflects the reduced financial responsibility amount after applying the reduction. Its values across
various response categories are totaled in Row 14. Appendix B, Exhibits B-6 and B-7 summarize
3-9
the reduction for each response component at each facility in the modeled universe. Appendix B,
Exhibit B-9 presents the reduced financial responsibility amount for the response component of
the model universe.
Once EPA estimated the financial responsibility amount for the response component, EPA then
adjusted the reduced FR amounts for each facility by applying the NRD component (Row 15),
regional and state-specific indirect cost multipliers (Row 16), and the health assessment
component (Row 17). The adjusted amount in Row 18 of Exhibit 3-2 represents the financial
responsibility obligation for an example facility. For health assessment component, EPA
assumes a fixed financial responsibility amount of $550,000 per facility based upon health
assessment information released by the Agency for Toxic Substances and Disease Registry. For
NRD, EPA estimated that such damages are on average 13.4 percent of the response component
estimated for each facility. As described in Chapter 5 of the Financial Responsibility Formula
Background Document, this figure reflects EPA’s assessment of historical NRD settlements and
historical response costs at hardrock mining and processing facilities.30 Chapter 3 of the
Financial Responsibility Formula Background Document includes additional information on
these costs.
The financial responsibility amounts were estimated using cost data normalized to national
values. Therefore, the financial responsibility formula is multiplied by the most current state cost
adjustment factors developed by the U.S. Army Corps of Engineers (2015) to derive a state-
specific cost. Appendix N of the Financial Responsibility Formula Background Document
includes a list of these state-specific factors. In addition, the direct engineering costs do not
include overhead and oversight costs related to mobilization and demobilization, engineering
design and redesign, contingency, contractor profit and overhead, contractor liability insurance,
payment and performance bonds, and direct EPA (or other government agency) contract
administration and contract management. EPA adjusts the estimated response component and
NRD component by the relevant state factors and indirect cost multipliers to derive the total FR
obligation.31
Exhibit 3-3 summarizes the reduced, adjusted FR amounts for the modeled universe by facility
type. The detailed financial responsibility amounts for the modeled universe are provided in
Appendix B, Exhibit B-10.
EPA also developed assumptions to scale the acreages of certain features, which in turn affected
the facility-wide acreage, to model facility expansion over time and the effect increasing FR
amounts would have on FR instrument maintenance. When EPA calculated the cost of FR
instruments, it used facility-specific FR amounts for facilities owned or operated by a company
with readily available financial data. EPA evaluated the cost of acquiring an initial FR
instrument immediately after rule implementation and updating and maintaining the FR
instrument over the course of facility operation. Since the acreages of each feature at a facility
and the facility-wide acreage drive both the capital and O&M costs and the maximum FR
amounts are calculated using the estimated acreage at closure, EPA expects facilities will
initially experience FR amounts lower than those at closure. FR amounts will then increase
incrementally as a result of ongoing construction and disturbance over the course of operations.
30 U.S. Environmental Protection Agency, “CERCLA 108(b) Financial Responsibility Formula for Hardrock Mining
Facilities Background Document” Office of Land and Emergency Management (September 2016). 31 These adjustments are not applied to the health assessment component.
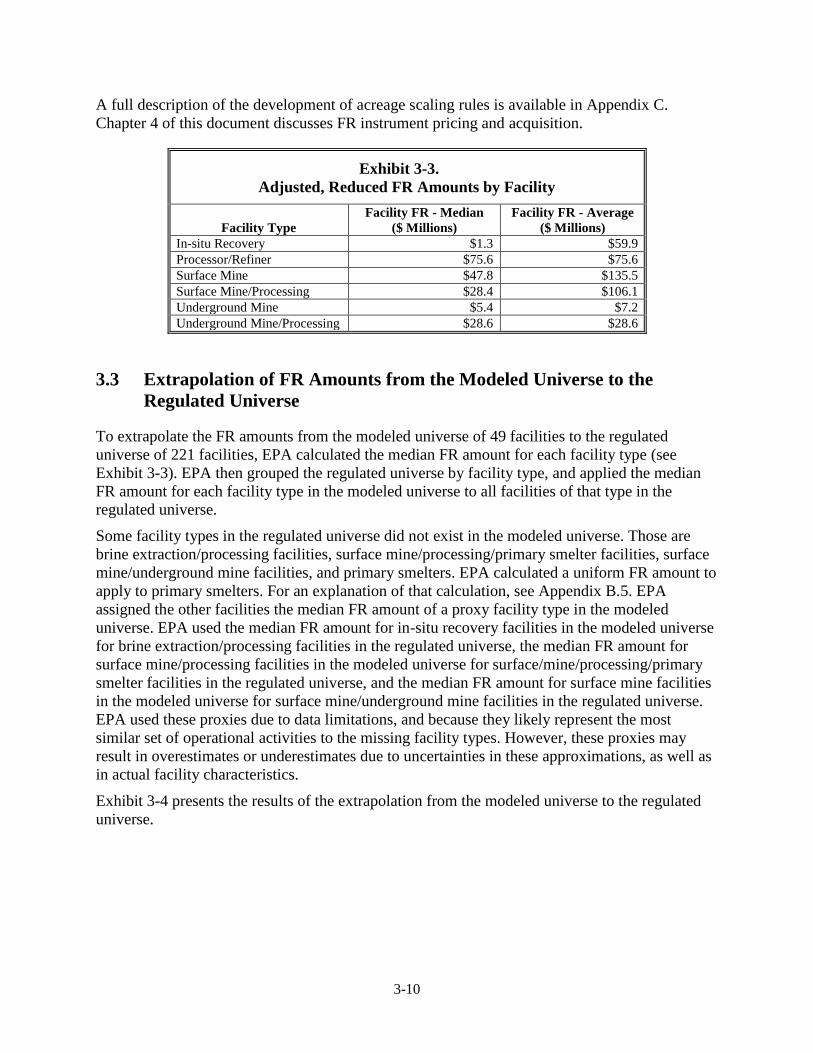
3-10
A full description of the development of acreage scaling rules is available in Appendix C.
Chapter 4 of this document discusses FR instrument pricing and acquisition.
Exhibit 3-3.
Adjusted, Reduced FR Amounts by Facility
Facility Type
Facility FR - Median
($ Millions)
Facility FR - Average
($ Millions)
In-situ Recovery $1.3 $59.9
Processor/Refiner $75.6 $75.6
Surface Mine $47.8 $135.5
Surface Mine/Processing $28.4 $106.1
Underground Mine $5.4 $7.2
Underground Mine/Processing $28.6 $28.6
3.3 Extrapolation of FR Amounts from the Modeled Universe to the
Regulated Universe
To extrapolate the FR amounts from the modeled universe of 49 facilities to the regulated
universe of 221 facilities, EPA calculated the median FR amount for each facility type (see
Exhibit 3-3). EPA then grouped the regulated universe by facility type, and applied the median
FR amount for each facility type in the modeled universe to all facilities of that type in the
regulated universe.
Some facility types in the regulated universe did not exist in the modeled universe. Those are
brine extraction/processing facilities, surface mine/processing/primary smelter facilities, surface
mine/underground mine facilities, and primary smelters. EPA calculated a uniform FR amount to
apply to primary smelters. For an explanation of that calculation, see Appendix B.5. EPA
assigned the other facilities the median FR amount of a proxy facility type in the modeled
universe. EPA used the median FR amount for in-situ recovery facilities in the modeled universe
for brine extraction/processing facilities in the regulated universe, the median FR amount for
surface mine/processing facilities in the modeled universe for surface/mine/processing/primary
smelter facilities in the regulated universe, and the median FR amount for surface mine facilities
in the modeled universe for surface mine/underground mine facilities in the regulated universe.
EPA used these proxies due to data limitations, and because they likely represent the most
similar set of operational activities to the missing facility types. However, these proxies may
result in overestimates or underestimates due to uncertainties in these approximations, as well as
in actual facility characteristics.
Exhibit 3-4 presents the results of the extrapolation from the modeled universe to the regulated
universe.
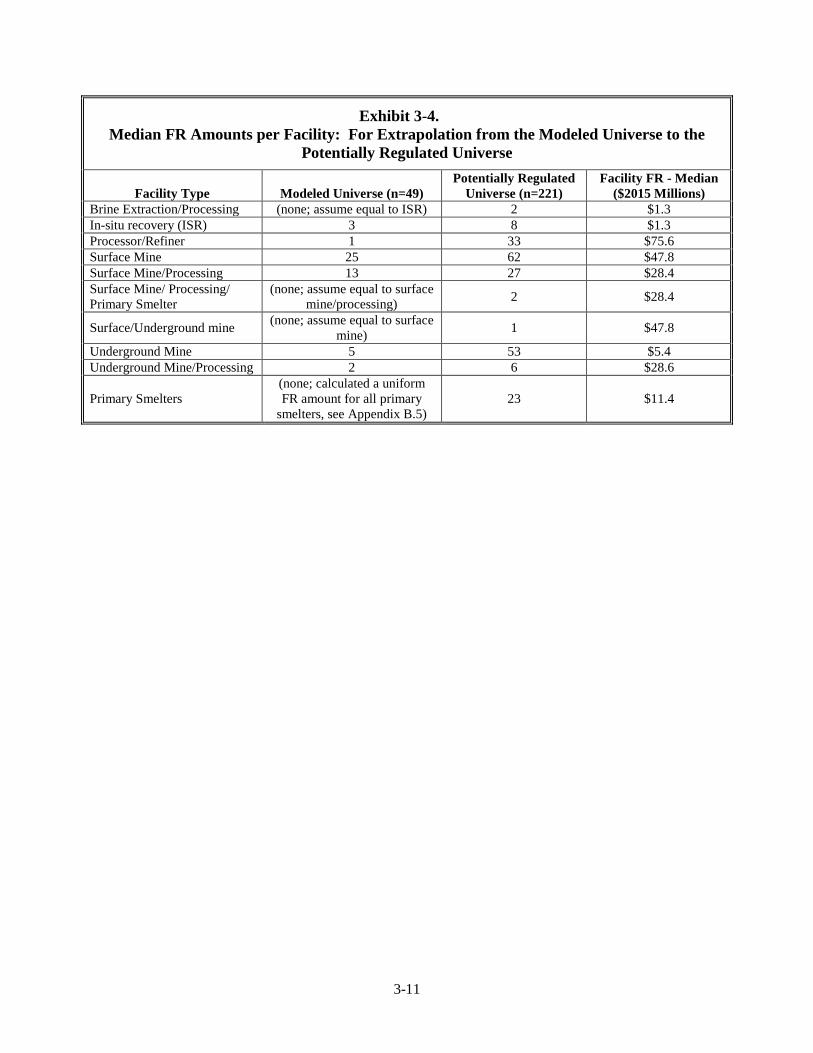
3-11
Exhibit 3-4.
Median FR Amounts per Facility: For Extrapolation from the Modeled Universe to the
Potentially Regulated Universe
Facility Type Modeled Universe (n=49)
Potentially Regulated
Universe (n=221)
Facility FR - Median
($2015 Millions)
Brine Extraction/Processing (none; assume equal to ISR) 2 $1.3
In-situ recovery (ISR) 3 8 $1.3
Processor/Refiner 1 33 $75.6
Surface Mine 25 62 $47.8
Surface Mine/Processing 13 27 $28.4
Surface Mine/ Processing/
Primary Smelter
(none; assume equal to surface
mine/processing) 2 $28.4
Surface/Underground mine (none; assume equal to surface
mine) 1 $47.8
Underground Mine 5 53 $5.4
Underground Mine/Processing 2 6 $28.6
Primary Smelters
(none; calculated a uniform
FR amount for all primary
smelters, see Appendix B.5)
23 $11.4
4-1
Chapter 4.
Assessment of Financial Responsibility Instruments
4.1 Introduction
The previous chapter discussed the methods for deriving financial responsibility amounts for
mines and mineral processing facilities. This chapter discusses the methods used to calculate the
costs to industry and government of assuring payment of these amounts, focusing on 21
owner/operator companies of 38 mining facilities32 in the modeled universe.33 This pricing
analysis has two primary components: (1) subjecting the modeled universe to the proposed
financial test, to identify entities that are able to self-insure; and (2) for entities unable to self-
insure, estimating the cost to procure third-party financial responsibility instruments. These costs
include, for example, annual commission fees paid on a LOC and the acquisition costs of capital
to fund trust contributions. Exhibit 4-1 below summarizes the key inputs and analytic
components, which are discussed in further detail below.
4.2 Assessment of Financial Test/Corporate Guarantee Options
As outlined in the introductory chapter, the Agency is co-proposing this rule with and without
financial test and corporate guarantee options for demonstrating financial responsibility. The
details of these options include:
Preferred Option 1: No Financial Test/Corporate Guarantee. Under this option,
the Agency will compel owners and operators subject to this regulation to use one
or a combination of the third-party financial responsibility instruments
contemplated by the proposed rule.
Option 2: Proposed Financial Test. The proposed rule contemplates a test based
on long-term corporate issuer credit ratings. The test would allow
owners/operators to self-insure the entire obligation by submitting annual
verification that they hold at least one long-term corporate credit rating higher,
and no long-term corporate credit rating lower than A- as issued by S&P, or the
rating’s equivalent as issued by another NRSRO. The proposed test would also
allow owners/operators to self-insure one half-of their obligation by submitting
annual verification that they hold at least one long-term corporate credit rating of,
and no long term corporate credit rating lower than, BBB+ or BBB from S&P or
the equivalent rating from another NRSRO. In addition to the ratings thresholds, a
firm electing to use the financial test would be required to have a tangible net
32 The identified owner/operator companies of the 49 facilities in the modeled universe were matched to S&P’s
financial database. This crosswalk identified the owner/operator companies of 40 facilities in S&P financial
database. Two of these facilities have entered bankruptcy and therefore did not have the necessary recent financial
data to be included in the analysis. 33 It is important to distinguish between the mine facilities, to which the FR amount applies, and the owner/operator
company that is obligated to fund, or secure, this FR amount. One owner/operator may have this obligation for
more than one mine.
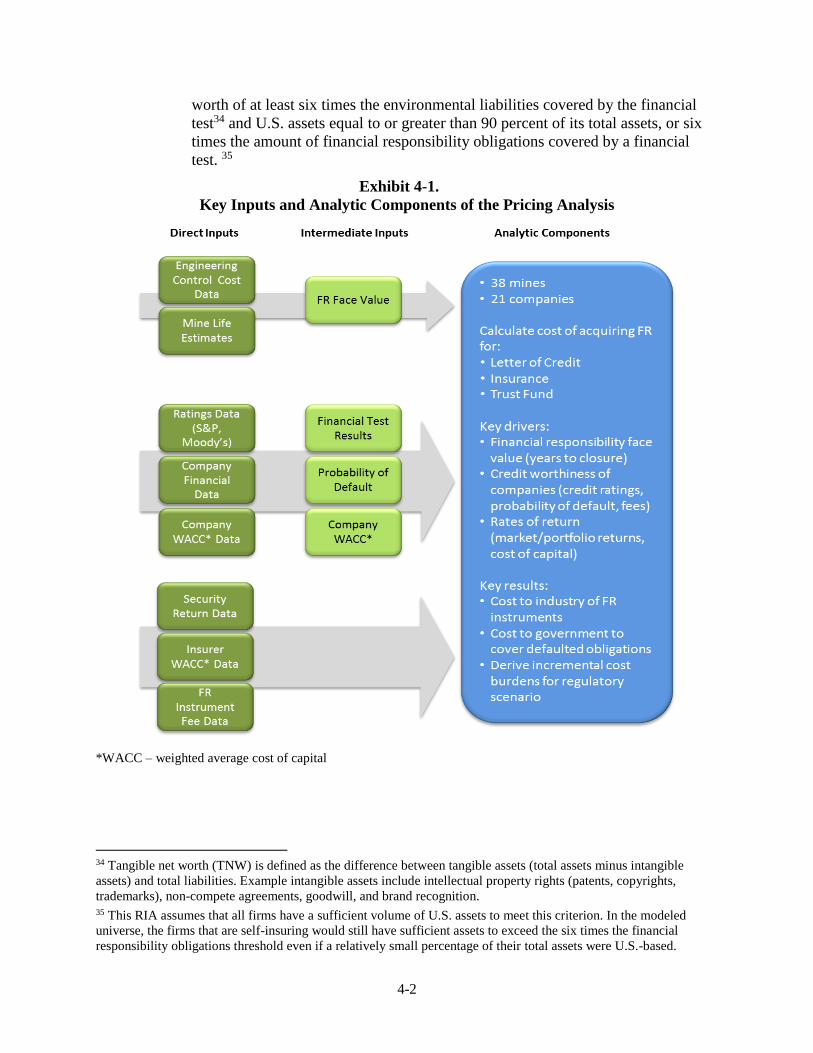
4-2
worth of at least six times the environmental liabilities covered by the financial
test34 and U.S. assets equal to or greater than 90 percent of its total assets, or six
times the amount of financial responsibility obligations covered by a financial
test. 35
Exhibit 4-1.
Key Inputs and Analytic Components of the Pricing Analysis
*WACC – weighted average cost of capital
34 Tangible net worth (TNW) is defined as the difference between tangible assets (total assets minus intangible
assets) and total liabilities. Example intangible assets include intellectual property rights (patents, copyrights,
trademarks), non-compete agreements, goodwill, and brand recognition. 35 This RIA assumes that all firms have a sufficient volume of U.S. assets to meet this criterion. In the modeled
universe, the firms that are self-insuring would still have sufficient assets to exceed the six times the financial
responsibility obligations threshold even if a relatively small percentage of their total assets were U.S.-based.
4-3
o Corporate Guarantee: Option 2 also allows owners and operators to
demonstrate financial responsibility by obtaining a written corporate
guarantee from another firm that meets the financial test requirements.
The Agency will allow guarantees from the direct or higher-tier parent
corporation of the owner or operator, a firm owned by the same parent
corporation as the owner or operator, or a firm with a substantial business
relationship with the owner or operator. Under certain conditions, EPA
will also allow a guarantee from a non-U.S. guarantor that meets the
financial test requirements outlined in the proposed regulations.36
To determine whether the owner/operator companies in the modeled universe would pass the
financial test, EPA compared the relevant financial characteristics of each company, along with
the related FR amount for each affiliated mining facility, to the Option 2 test requirements. As
discussed in detail in Chapter 5, where the analytic results are presented, a limited number of
companies satisfy the test requirements. Thus, most owner/operator companies would be
required to secure a third-party FR instrument to satisfy the standards of the proposed rule.
4.3 Cost to Industry of Financial Responsibility Instruments
EPA estimates industry costs for the owner/operator companies that are unable to utilize a self-
insurance option under the proposed rule as the resources expended and/or foregone to obtain a
third-party financial responsibility instrument. This estimate includes all companies under
Option 1 (as the financial test option is unavailable) and those companies unable to pass the
financial test under Option 2. An owner/operator of a facility subject to the proposed rule will
need to establish financial responsibility for CERCLA liabilities at the facility. The proposed rule
contemplates the following third-party FR instruments: letter of credit (LOC), trust fund,
insurance, or surety bond. In addition, under certain conditions, an owner or operator will be able
to satisfy the requirements by establishing more than one financial mechanism per facility, but
the cost associated with combining multiple instruments is not estimated in this RIA due to
modeling complexity. The proposed rule’s FR instrument details relevant to this RIA include the
following (see Appendix D for more details on these instruments):
Letter of Credit: An owner or operator will be able to satisfy the requirements of
the proposed rule by obtaining an irrevocable standby letter of credit. Through a
letter of credit, the bank provides assurance that the owner’s or operator’s
CERCLA liabilities will be paid. An owner or operator who uses a letter of credit
to satisfy the requirements of the proposed rule will also be required to establish a
standby trust fund.37
Trust Fund: Funds transferred to the trust fund by the owners and operators
would be held in the trust for the purpose of paying the owners’ and operators’
36 Note that EPA’s identification of the owner/operators of the potentially regulated universe includes identification
of the ultimate parent entity. 37 In the proposed rule, a standby trust fund is similar in structure to the trust fund described below, except its main
purpose is that it either hold the letter of credit or be established alongside the letter of credit to provide a repository
for funds drawn from the letter of credit in instances where the issuing institution declines to extend the letter of
credit. Since the standby trust simply holds the letter of credit and is not the primary method of financial assurance,
costs associated with the trust are not estimated for simplification purposes.
4-4
CERCLA liabilities as prescribed by the proposed rule. Payments into the trust
fund would be made by the owner or operator in accordance with the compliance
schedule for the CERCLA financial responsibility regulations. Thus, the four-year
implementation window established in CERCLA section 108(b)(4) would serve
as the trust fund’s initial pay-in period. Upon each three-year update described
later in this chapter, the company will have a similar pay-in period to shore up the
new financial obligation estimate.
Insurance: Through the insurance policy, the insurer agrees to pay for the
CERCLA liabilities of the owner or operator under certain circumstances should
the owner or operator fail to do so. Finally, an owner or operator who uses
insurance to satisfy the requirements of the proposed rule would also be required
to establish a standby trust fund.
Surety Bond: An owner or operator will be able to satisfy the financial
responsibility requirements of the proposed rule by obtaining a surety bond.
Through a surety bond, the Surety would guarantee that it will pay the
owner/operator’s CERCLA liabilities under certain circumstances in the event the
owner or operator is unable to do so, up to the bond limits. An owner or operator
that elected to use a surety bond to satisfy the requirements of this section will
also be required to establish a standby trust fund. Note that this analysis does not
model surety bond pricing outcomes, applying the assumption that they are
reasonably represented by pricing outcomes for LOCs and insurance.38
For each facility and its estimated financial responsibility amount, EPA modeled the costs to
obtain each financial responsibility instrument. The price of each financial responsibility
instrument is informed by several parameters, including the specific characteristics of the mine
or facility that requires coverage. For purposes of this RIA, EPA assigns the lowest cost option to
each facility. Specifically, the financial health of the facility’s owner or operator, the
corresponding fee structure of the specific financial instrument, and the project’s risk profile
(including the probability and timing of costs associated with the facility’s CERCLA liabilities)
will inform the overall price of FR instruments.
Furthermore, the actual pricing of financial responsibility instruments is case-specific and
dependent on the individual characteristics of the project or facility being underwritten, the
financial profile of the owner or operator, and the estimated timing and amounts of costs likely to
be due over the life of the project. Notwithstanding the individual nature of financial
responsibility instrument pricing, this RIA derives an array of individualized pricing options
based on mine risk curves and hypothetical price curves associated with each FR instrument.
Such analysis should not be considered a perfect substitute for actual financial assurance pricing.
38 There are two main types of surety bonds: 1) a “payment bond,” wherein a company is bonded by the surety to
complete a given array of activities, with the surety paying the agreed-upon amount in the case the company is not
able to fulfill its obligations; and, 2) a “performance bond” wherein, if a company is unable to fulfill its obligations,
the surety can either pay the agreed-upon amount or directly engage in fulfilling the obligation itself (e.g., by hiring
a contractor to complete closure activities). Payment and performance bonds are generally structured akin to
insurance policies (i.e., premiums paid to maintain the bond) or letters of credit (i.e., a collateral requirement and a
fee to maintain the bond).
4-5
The actual price structure of a financial instrument for a facility’s CERCLA liabilities may differ
from that summarized in this RIA.
Despite the subjective nature of financial assurance pricing, EPA utilizes simplified metrics to
illustrate the potential impact of various price parameters on the annualized net cash flows
associated with the suite of financial instruments contemplated by the proposed rule. As
modeled, the annual price of financial assurance is a function of three parameters:
1. The expected FR amounts that are required to cover the facility’s CERCLA
liabilities under the proposed rule. As stipulated in the proposed rule, the financial
responsibility amounts will be updated by the owner/operators every three years.
Financial responsibility amounts are allocated over time using the scaling method
described in Appendix C, and inflated to the year of update to generate an updated
financial responsibility amount every three years until the facility’s FR release
date.39
Specifically, every three years, the FR amount is updated to take into account
inflation as well as the FR amounts associated with any acres that have been
opened or closed in the past three years. The company then augments the financial
instrument for the difference between the updated FR amount and the previous FR
amount. For instance, if a company does not open any new acres in the past three
years, they must update their FR amount from $10 million to $10.8 million to
account for inflation. The financial instrument provider then calculates the
additional cash outflows needed to secure the new $0.8 million in obligations.
The additional cash outflows needed to secure the incremental amount are
calculated the same as the initial financial instrument outflows.
2. The financial credit risk of the owner or operator, which informs the probability
that the instrument provider will be called upon to pay for or perform the
attendant financial responsibility activities. All else equal, the price of FR
instruments will be highest for those owners/operators that present the greatest
financial credit risk.
3. The fee structure of the financial instrument. For example, some financial
instruments (e.g., letter of credit) may require up-front commitments in the form
of set-aside collateral, with low annual maintenance costs; whereas other financial
instruments (e.g., insurance) may require less cash up-front, but larger annual
financing costs over time.
The analysis utilizes separate pricing modules for each financial responsibility instrument. On an
instrument-by-instrument basis, inputs necessary to price the instrument include the annual
expected capital and operational costs associated with the facility’s financial responsibilities.
Specifically, the parameters include when costs are expected to begin, when they are expected to
39 The cost estimates in this RIA may be biased low due to the analytic treatment of the three year update schedule.
The analysis uses the FR amount applicable as of the last update year. Since the FR release by EPA could happen
just prior to an update year, financial responsibility amounts may not have been updated for a maximum of three
years at the time of FR release. Therefore the financial responsibility amounts would not take into account inflation
and expanded site features for the years in between the last three-year update and the FR release year.
4-6
end, and when the owner/operator will be required to purchase financial assurance. Based upon
this policy determination, the cost streams can vary by instrument.40
Under the proposed rule, the full face value of the FR amount must be secured within the four-
year implementation window established in CERCLA 108(b)(4). This approach will allow for
the instrument to be accessed during any period during a facility’s active or inactive status as a
result of a CERCLA-related incident. This pricing analysis, however, requires a set of
assumptions concerning the initial funding period for the instruments (e.g., funding of a trust
fund subsequent to the rule’s implementation date) and an overall time frame, or end date, for
instrument funding (i.e., to derive a premium payment schedule for an insurance instrument).
For the modeled results, this RIA assumes the year of implementation is 2021, or the year before
the end of the four-year implementation schedule for the rule. The estimated years of FR release
for the 38 facilities are impacted by assumptions and sourced in the following ways:
13 facility FR release dates are sourced directly from company reports.
Applying the median active life taken from a sample of these 13 facilities, nine
additional facility FR release dates are sourced by adding this median facility life
figure to the facility start date reported by MSHA.
EPA assumed that mine and mineral processing facilities will remain active
within the next four years of the implementation date, to 2025. 12 facility FR
release dates are moved out to four years after the implementation date.
The analysis recognizes that forecasting becomes increasingly difficult as the time
horizon is lengthened and thus caps the facility FR release date at 34 years past
the year of implementation, which is the 90th percentile of remaining time until
FR release in the sample of 38 facilities. Four facility FR release dates are capped
at 34 years after 2021.41
The credit risk of the owner/operator is a subjective determination made on an instrument-by-
instrument basis. An assessment of the credit risk of an entity should take into account the
financial stability and profitability of the owner/operator, as well as the non-mining business
operations of the owner/operator that may impact its ability to meet future environmental
obligations. Relevant financial metrics include, but are not necessarily limited to, the debt-to-
equity ratio, the current ratio (equal to current assets divided by current liabilities), working
capital, and operating cash flow. These financial indicators measure the company’s ability to
assume additional debt, meet its near-term obligations with liquid assets, and generate cash flow
from its business operations. In addition, long-term issuer credit ratings from NRSROs provide a
40 Note that all historical engineering cost estimates are inflated to constant dollars for the year in which the
instrument is purchased. For example, if a financial assurance instrument is purchased in 2021, all costs similarly
are inflated to year 2021 dollars.
41 For reference, the 90th percentile of the FR release dates for the 13 facilities for which data were available directly
from company reports is 26 years after 2021. Note that these 13 facilities exclude those facilities that are reported by
the companies as closing before 2021 or after 2055.
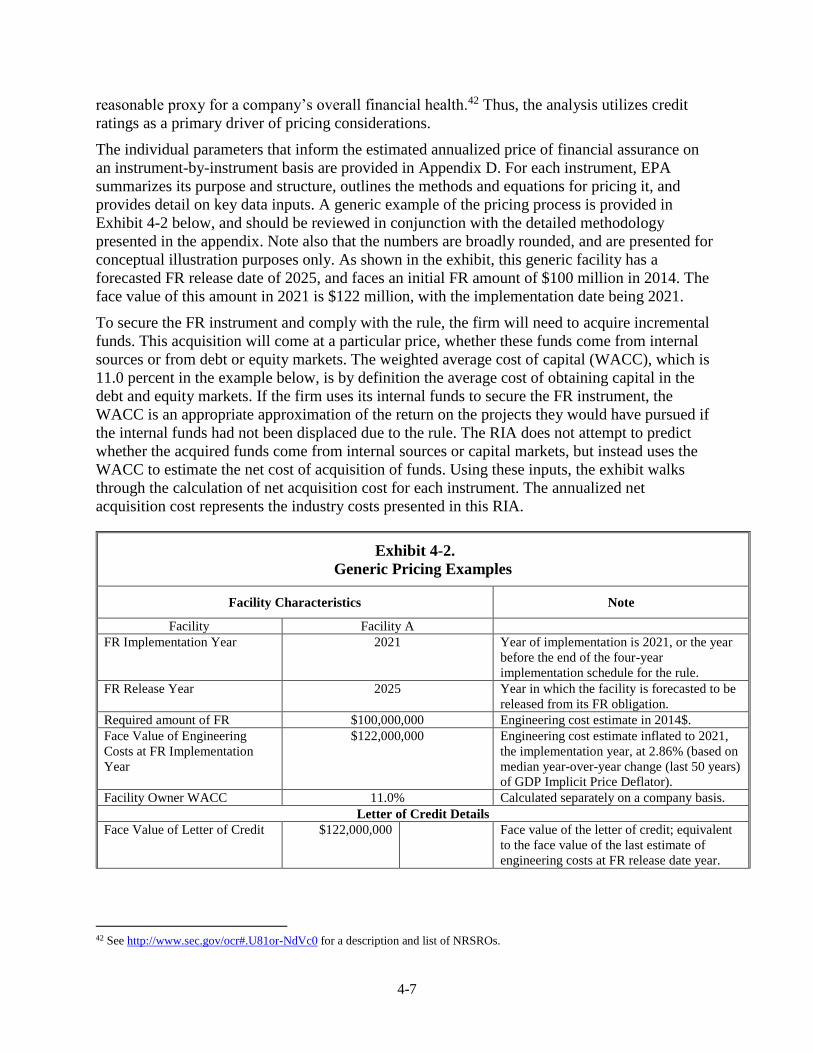
4-7
reasonable proxy for a company’s overall financial health.42 Thus, the analysis utilizes credit
ratings as a primary driver of pricing considerations.
The individual parameters that inform the estimated annualized price of financial assurance on
an instrument-by-instrument basis are provided in Appendix D. For each instrument, EPA
summarizes its purpose and structure, outlines the methods and equations for pricing it, and
provides detail on key data inputs. A generic example of the pricing process is provided in
Exhibit 4-2 below, and should be reviewed in conjunction with the detailed methodology
presented in the appendix. Note also that the numbers are broadly rounded, and are presented for
conceptual illustration purposes only. As shown in the exhibit, this generic facility has a
forecasted FR release date of 2025, and faces an initial FR amount of $100 million in 2014. The
face value of this amount in 2021 is $122 million, with the implementation date being 2021.
To secure the FR instrument and comply with the rule, the firm will need to acquire incremental
funds. This acquisition will come at a particular price, whether these funds come from internal
sources or from debt or equity markets. The weighted average cost of capital (WACC), which is
11.0 percent in the example below, is by definition the average cost of obtaining capital in the
debt and equity markets. If the firm uses its internal funds to secure the FR instrument, the
WACC is an appropriate approximation of the return on the projects they would have pursued if
the internal funds had not been displaced due to the rule. The RIA does not attempt to predict
whether the acquired funds come from internal sources or capital markets, but instead uses the
WACC to estimate the net cost of acquisition of funds. Using these inputs, the exhibit walks
through the calculation of net acquisition cost for each instrument. The annualized net
acquisition cost represents the industry costs presented in this RIA.
Exhibit 4-2.
Generic Pricing Examples
Facility Characteristics Note
Facility Facility A
FR Implementation Year 2021 Year of implementation is 2021, or the year
before the end of the four-year
implementation schedule for the rule.
FR Release Year 2025 Year in which the facility is forecasted to be
released from its FR obligation.
Required amount of FR $100,000,000 Engineering cost estimate in 2014$.
Face Value of Engineering
Costs at FR Implementation
Year
$122,000,000 Engineering cost estimate inflated to 2021,
the implementation year, at 2.86% (based on
median year-over-year change (last 50 years)
of GDP Implicit Price Deflator).
Facility Owner WACC 11.0% Calculated separately on a company basis.
Letter of Credit Details
Face Value of Letter of Credit $122,000,000 Face value of the letter of credit; equivalent
to the face value of the last estimate of
engineering costs at FR release date year.
42 See http://www.sec.gov/ocr#.U81or-NdVc0 for a description and list of NRSROs.
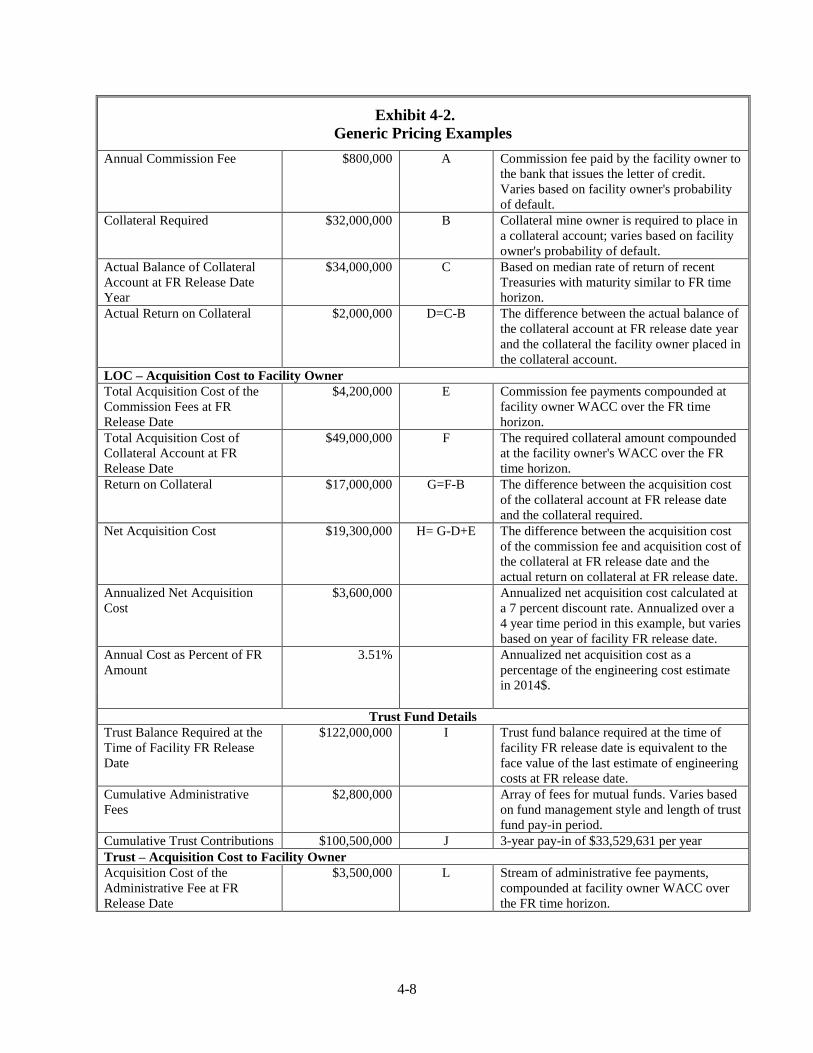
4-8
Exhibit 4-2.
Generic Pricing Examples
Annual Commission Fee $800,000 A Commission fee paid by the facility owner to
the bank that issues the letter of credit.
Varies based on facility owner's probability
of default.
Collateral Required $32,000,000 B Collateral mine owner is required to place in
a collateral account; varies based on facility
owner's probability of default.
Actual Balance of Collateral
Account at FR Release Date
Year
$34,000,000 C Based on median rate of return of recent
Treasuries with maturity similar to FR time
horizon.
Actual Return on Collateral $2,000,000 D=C-B The difference between the actual balance of
the collateral account at FR release date year
and the collateral the facility owner placed in
the collateral account.
LOC – Acquisition Cost to Facility Owner
Total Acquisition Cost of the
Commission Fees at FR
Release Date
$4,200,000 E Commission fee payments compounded at
facility owner WACC over the FR time
horizon.
Total Acquisition Cost of
Collateral Account at FR
Release Date
$49,000,000 F The required collateral amount compounded
at the facility owner's WACC over the FR
time horizon.
Return on Collateral $17,000,000 G=F-B The difference between the acquisition cost
of the collateral account at FR release date
and the collateral required.
Net Acquisition Cost $19,300,000 H= G-D+E The difference between the acquisition cost
of the commission fee and acquisition cost of
the collateral at FR release date and the
actual return on collateral at FR release date.
Annualized Net Acquisition
Cost
$3,600,000 Annualized net acquisition cost calculated at
a 7 percent discount rate. Annualized over a
4 year time period in this example, but varies
based on year of facility FR release date.
Annual Cost as Percent of FR
Amount
3.51% Annualized net acquisition cost as a
percentage of the engineering cost estimate
in 2014$.
Trust Fund Details
Trust Balance Required at the
Time of Facility FR Release
Date
$122,000,000 I Trust fund balance required at the time of
facility FR release date is equivalent to the
face value of the last estimate of engineering
costs at FR release date.
Cumulative Administrative
Fees
$2,800,000 Array of fees for mutual funds. Varies based
on fund management style and length of trust
fund pay-in period.
Cumulative Trust Contributions $100,500,000 J 3-year pay-in of $33,529,631 per year
Trust – Acquisition Cost to Facility Owner
Acquisition Cost of the
Administrative Fee at FR
Release Date
$3,500,000 L Stream of administrative fee payments,
compounded at facility owner WACC over
the FR time horizon.
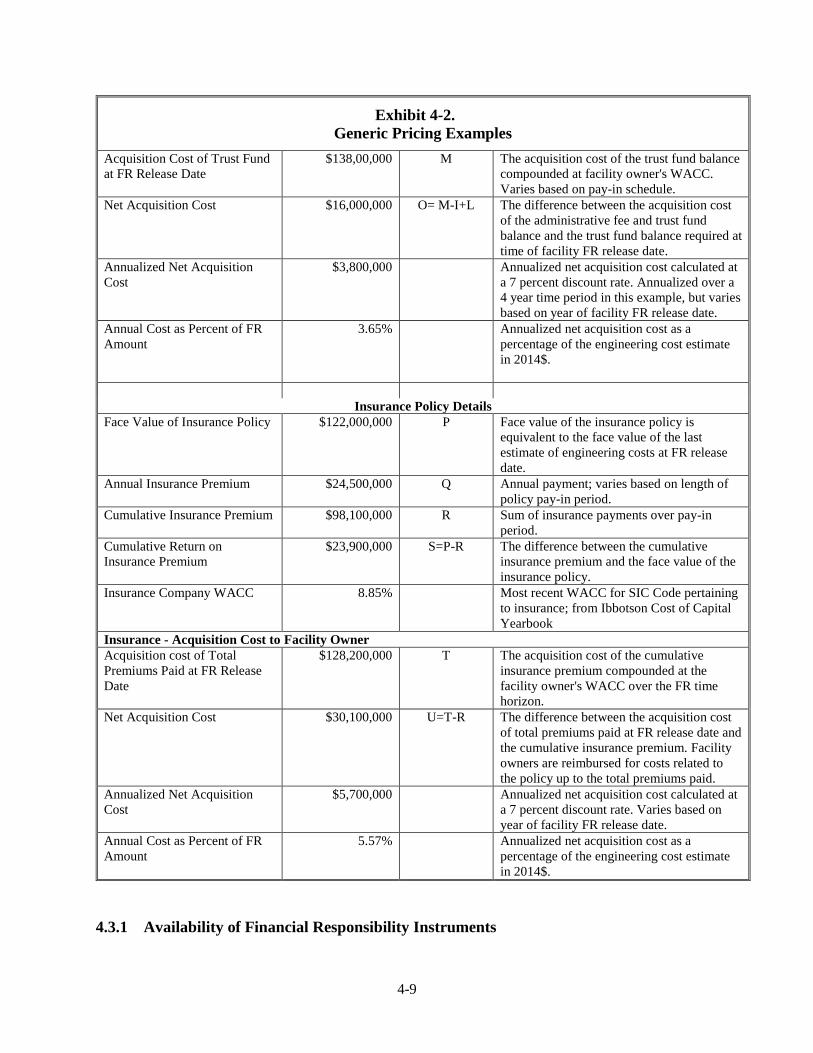
4-9
Exhibit 4-2.
Generic Pricing Examples
Acquisition Cost of Trust Fund
at FR Release Date
$138,00,000 M The acquisition cost of the trust fund balance
compounded at facility owner's WACC.
Varies based on pay-in schedule.
Net Acquisition Cost $16,000,000 O= M-I+L The difference between the acquisition cost
of the administrative fee and trust fund
balance and the trust fund balance required at
time of facility FR release date.
Annualized Net Acquisition
Cost
$3,800,000 Annualized net acquisition cost calculated at
a 7 percent discount rate. Annualized over a
4 year time period in this example, but varies
based on year of facility FR release date.
Annual Cost as Percent of FR
Amount
3.65% Annualized net acquisition cost as a
percentage of the engineering cost estimate
in 2014$.
Insurance Policy Details
Face Value of Insurance Policy $122,000,000 P Face value of the insurance policy is
equivalent to the face value of the last
estimate of engineering costs at FR release
date.
Annual Insurance Premium $24,500,000 Q Annual payment; varies based on length of
policy pay-in period.
Cumulative Insurance Premium $98,100,000 R Sum of insurance payments over pay-in
period.
Cumulative Return on
Insurance Premium
$23,900,000 S=P-R The difference between the cumulative
insurance premium and the face value of the
insurance policy.
Insurance Company WACC 8.85% Most recent WACC for SIC Code pertaining
to insurance; from Ibbotson Cost of Capital
Yearbook
Insurance - Acquisition Cost to Facility Owner
Acquisition cost of Total
Premiums Paid at FR Release
Date
$128,200,000 T The acquisition cost of the cumulative
insurance premium compounded at the
facility owner's WACC over the FR time
horizon.
Net Acquisition Cost $30,100,000 U=T-R The difference between the acquisition cost
of total premiums paid at FR release date and
the cumulative insurance premium. Facility
owners are reimbursed for costs related to
the policy up to the total premiums paid.
Annualized Net Acquisition
Cost
$5,700,000 Annualized net acquisition cost calculated at
a 7 percent discount rate. Varies based on
year of facility FR release date.
Annual Cost as Percent of FR
Amount
5.57% Annualized net acquisition cost as a
percentage of the engineering cost estimate
in 2014$.
4.3.1 Availability of Financial Responsibility Instruments
4-10
It is important to note that this pricing approach assumes that no capacity constraints exist for the
issuance of third-party instruments sufficient to cover the FR amounts contemplated under the
rule. To investigate the insurance industry’s capacity for providing mechanisms that would cover
CERCLA liabilities, EPA reviewed publicly available information from government agencies
and commercial insurers and held further discussions with commercial insurers. Based on this
review, EPA determined that the market for the types of FR instruments described above does
not yet exist to cover financial responsibility under CERCLA 108(b). See “Evaluation of
Markets for Financial Responsibility Instruments, and the Relationship of CERCLA 108(b) to
Financial Responsibility Programs of Other Federal Agencies” for more information on the
industry capacity study.43
The proposed rule, however, provides a four-year implementation window to allow the market
for such instruments to develop. Observers of the insurance industry expect that the
environmental FR instrument market capacity will increase, brokerage premiums will decrease,
and surety premiums will hold steady or increase slightly.44 At the same time, observers
acknowledge that overall capacity for risk specific to the mining industry will decrease due to the
sector’s volatility.45 As a result, EPA anticipates that the insurance market will endeavor to meet
the increased demand to underwrite the financial responsibility requirements of the proposed rule
through alternative risk transactions, such as layered risk management instruments, and the
concurrent formation of risk retention groups. The insurance market has used similar instruments
to increase capacity in other high volatility industries such as oil and gas, pharmaceuticals, and
medical malpractice.46
4.4 Costs to Government
Under the current baseline responsible parties are liable for financial responsibility pertaining to
cleanup; however, if a party defaults on all or a portion of that obligation, the firm’s costs shift to
the government and the public. Those costs include two components: the CERCLA costs and the
incremental overhead costs for the necessary management of those liabilities. The baseline
potential costs to government are therefore the sum of all financial responsibility amounts and
associated costs for facilities owned by entities that default. As noted in Chapter 3, the financial
responsibility cost estimates incorporate allowances for government overhead.
43 U.S. Environmental Protection Agency, “Evaluation of Markets for Financial Responsibility Instruments, and the
Relationship of CERCLA 108(b) to Financial Responsibility Programs of Other Federal Agencies.” August 25,
2016. https://www.epa.gov/sites/production/files/2016-09/documents/cercla_financial_assurance_market_study.pdf 44 U.S. Environmental Protection Agency, “Evaluation of Markets for Financial Responsibility Instruments, and the
Relationship of CERCLA 108(b) to Financial Responsibility Programs of Other Federal Agencies.” August 25,
2016. p. 21. https://www.epa.gov/sites/production/files/2016-
09/documents/cercla_financial_assurance_market_study.pdf 45 U.S. Environmental Protection Agency, “Evaluation of Markets for Financial Responsibility Instruments, and the
Relationship of CERCLA 108(b) to Financial Responsibility Programs of Other Federal Agencies.” August 25,
2016. p.18. https://www.epa.gov/sites/production/files/2016-
09/documents/cercla_financial_assurance_market_study.pdf 46 U.S. Environmental Protection Agency, “Evaluation of Markets for Financial Responsibility Instruments, and the
Relationship of CERCLA 108(b) to Financial Responsibility Programs of Other Federal Agencies.” August 25,
2016. p. 2-3. https://www.epa.gov/sites/production/files/2016-
09/documents/cercla_financial_assurance_market_study.pdf
4-11
Under the proposed regulation, mine and mineral processing facility owners and operators that
do not pass the financial test and would have defaulted in the absence of the regulation in the
baseline, now would have acquired a financial responsibility instrument to secure their CERCLA
liabilities and related overhead costs. The proposed regulation reduces cost to government by
transferring these costs to the responsible parties in the private sector. The government will
largely incur CERCLA costs only when firms pass the financial test but later default.
The government will also incur costs in the course of administering the rule. EPA does not
quantify those costs here, but the costs will include labor costs associated with confirming
facility financial responsibility amount estimates, reviewing documents sent to EPA, and
updating any relevant databases with facility information.
The incremental cost savings to government under the proposed regulation is therefore
dependent on the total projected CERCLA costs, the predicted firm exit rates of all entities in the
baseline, and the default rates of firms who pass the financial test under the regulatory scenario.
The change in government costs between the baseline and regulatory scenario represents the
correction of a market failure by requiring hardrock mine and mineral processor owners and
operators to fully internalize the negative externality potentially imposed on the public in the
future. The details of EPA’s methods for estimating default rates are described in Appendix D.
5-1
Chapter 5.
Analytic Results
5.1 Introduction and Summary
This chapter presents the key results of the regulatory impact assessment, building upon the
engineering cost-derived FR amount estimates presented in Chapter 3 and the pricing and related
methods outlined in Chapter 4. The chapter begins with a summary of methods used to calculate
compliance costs for the modeled universe. Then, the results for the full potentially regulated
universe are described, including a discussion of the increased likelihood that owners and
operators will have access to funds necessary to address the CERCLA liabilities at their facilities
under the regulatory scenarios relative to the baseline. A discussion framing compliance costs in
the context of overall social welfare impacts and intra-industry transfers follows. The subsequent
section compares annualized compliance costs with cash-out-of-pocket (accounting) outlays.
Finally, administrative costs attributable to the proposed rule, and not captured elsewhere in the
analysis, are also presented. The chapter concludes with an itemization of important analytic
uncertainties and limitations. All annualized costs presented in this chapter are discounted using
a 7 percent social discount rate. Supplementary results discounted using a 3 percent social
discount rate are presented in Appendix E.
The results of the analysis are presented by:
Regulatory option: As described in Chapter 1, Option 1 does not include a
financial test for self-insurance, while Option 2 allows for a financial test.
Extrapolation of FR amounts: This chapter extrapolates FR amounts from the
modeled universe to the potentially regulated universe using median FR amounts
by facility type. To account for data limitations regarding the potentially regulated
universe of 221 facilities, Appendix F presents results using average (mean) FR
amount-based extrapolation.47
FR instrument pricing assumptions: This chapter presents results using
company-based average pricing assumptions. To account for uncertainty around
the costs of obtaining FR instruments for the 121 companies in the potentially
regulated universe, Appendix F presents results using facility average-based
pricing assumptions.
The key results for the potentially regulated universe of 221 facilities vary by regulatory option
and FR instrument pricing assumptions. Specifically, the overarching results are as follows:
The proposed rule may require these facilities to secure approximately $7.1
billion in CERCLA financial responsibility amounts.
47 The results vary with FR liability amount extrapolation approaches, because the distribution of modeled facilities’
FR amounts includes outliers that can significantly skew the results.
5-2
Under Option 1, third-party instruments will cover all of the above liability totals.
Under Option 2, third-party instruments will cover 70 percent ($4.9 billion) of the
total, with the remainder self-insured due to the availability of the financial test.
The quantified annualized compliance cost to industry to procure third-party
instruments is approximately $111 to $171 million. These values represent the
estimated incremental costs to industry of the proposed rule.
o Under Option 1, the total FR amount is estimated to lead to annualized
industry compliance costs of $171 million.
o Under Option 2, the total FR amount is estimated to lead to an
annualized industry compliance cost of $111 million.
The rule’s annualized social cost can be estimated as the fees and commissions
paid to financial institutions to obtain financial instruments as well as the
administrative costs to industry associated with compliance activities. The
majority of the industry costs represent a transfer from the regulated industry to
the financial industry, and hence the quantified annualized net social costs are
estimated at $30 million to $44 million.
o Under Option 1, the annualized social costs are $44 million.
o Under Option 2, the annualized social costs are $30 million.
With respect to the impacts on government costs, over the 34 year period of
analysis, Option 1 is estimated to cumulatively result in approximately $527
million in additional CERCLA financial responsibility incurred by industry rather
than government (in instances of owner or operator failure), relative to the
baseline. The amount under Option 2 is approximately $511 million.
These results are subject to a number of analytic assumptions as outlined in the
prior chapters and limitations listed at the end of this chapter. The results should
be viewed with these uncertainties and limitations in mind.
5.2 Methods – Modeled Universe
To provide context for the presentation of results for the full universe and establish a basis for
the extrapolation exercise, EPA first discusses the simulation of the modeled universe of 49
facilities. Exhibit 5-1 provides the overall results of the modeled universe cost analysis, which
reflect the 38 facilities for which financial information could be obtained. As indicated in the
exhibit, the modeled universe faces a potential CERCLA financial responsibility amount of $4.4
billion.48 In other words, in the baseline, the government may be burdened with this liability.
Under Option 1, where no financial test is allowed, the full FR amount must be secured through
third-party instruments. Under Option 2, owner/operator entities must either pass the financial
test or secure their CERCLA obligation through a third-party FR instrument. Based upon the
financial profile of companies in this modeled universe, $3.1 billion is secured through a third-
48 Five facilities within the modeled universe of 38 facilities are expected to close prior to rule implementation in
2021. Because new facilities may also open between rule publication and rule implementation, this analysis uses
current data to approximate industry and financial conditions upon rule implementation.
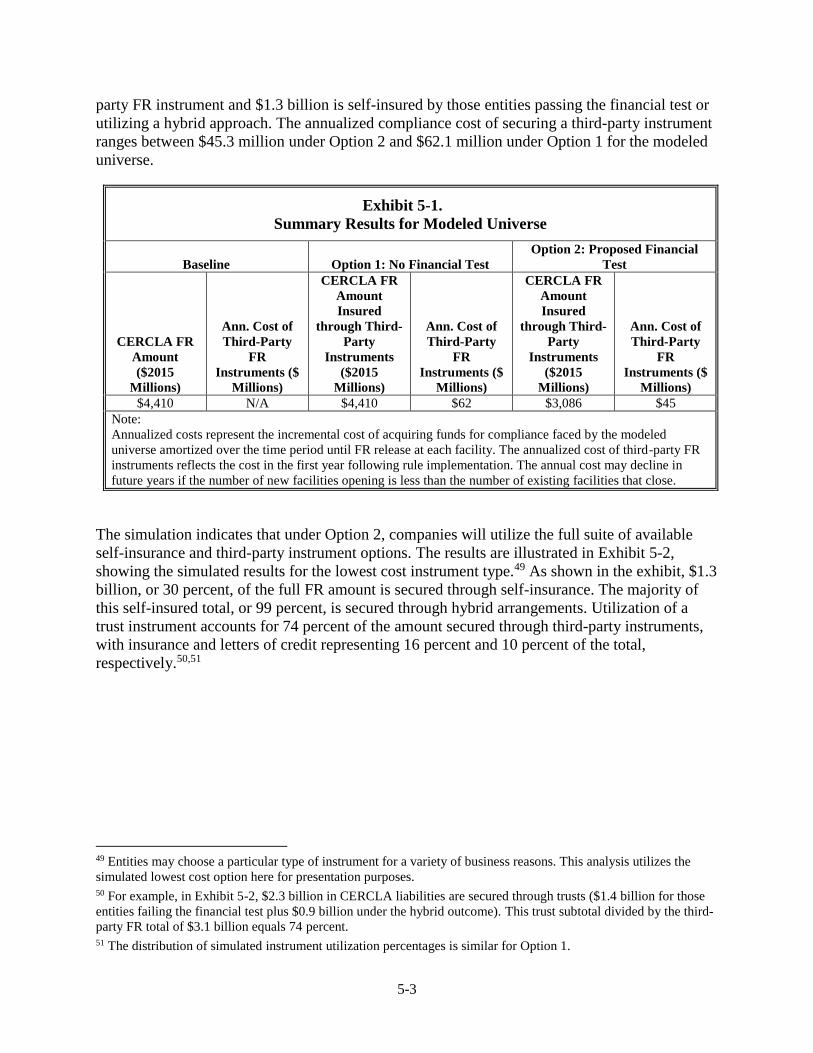
5-3
party FR instrument and $1.3 billion is self-insured by those entities passing the financial test or
utilizing a hybrid approach. The annualized compliance cost of securing a third-party instrument
ranges between $45.3 million under Option 2 and $62.1 million under Option 1 for the modeled
universe.
Exhibit 5-1.
Summary Results for Modeled Universe
Baseline Option 1: No Financial Test
Option 2: Proposed Financial
Test
CERCLA FR
Amount
($2015
Millions)
Ann. Cost of
Third-Party
FR
Instruments ($
Millions)
CERCLA FR
Amount
Insured
through Third-
Party
Instruments
($2015
Millions)
Ann. Cost of
Third-Party
FR
Instruments ($
Millions)
CERCLA FR
Amount
Insured
through Third-
Party
Instruments
($2015
Millions)
Ann. Cost of
Third-Party
FR
Instruments ($
Millions)
$4,410 N/A $4,410 $62 $3,086 $45
Note:
Annualized costs represent the incremental cost of acquiring funds for compliance faced by the modeled
universe amortized over the time period until FR release at each facility. The annualized cost of third-party FR
instruments reflects the cost in the first year following rule implementation. The annual cost may decline in
future years if the number of new facilities opening is less than the number of existing facilities that close.
The simulation indicates that under Option 2, companies will utilize the full suite of available
self-insurance and third-party instrument options. The results are illustrated in Exhibit 5-2,
showing the simulated results for the lowest cost instrument type.49 As shown in the exhibit, $1.3
billion, or 30 percent, of the full FR amount is secured through self-insurance. The majority of
this self-insured total, or 99 percent, is secured through hybrid arrangements. Utilization of a
trust instrument accounts for 74 percent of the amount secured through third-party instruments,
with insurance and letters of credit representing 16 percent and 10 percent of the total,
respectively.50,51
49 Entities may choose a particular type of instrument for a variety of business reasons. This analysis utilizes the
simulated lowest cost option here for presentation purposes. 50 For example, in Exhibit 5-2, $2.3 billion in CERCLA liabilities are secured through trusts ($1.4 billion for those
entities failing the financial test plus $0.9 billion under the hybrid outcome). This trust subtotal divided by the third-
party FR total of $3.1 billion equals 74 percent. 51 The distribution of simulated instrument utilization percentages is similar for Option 1.
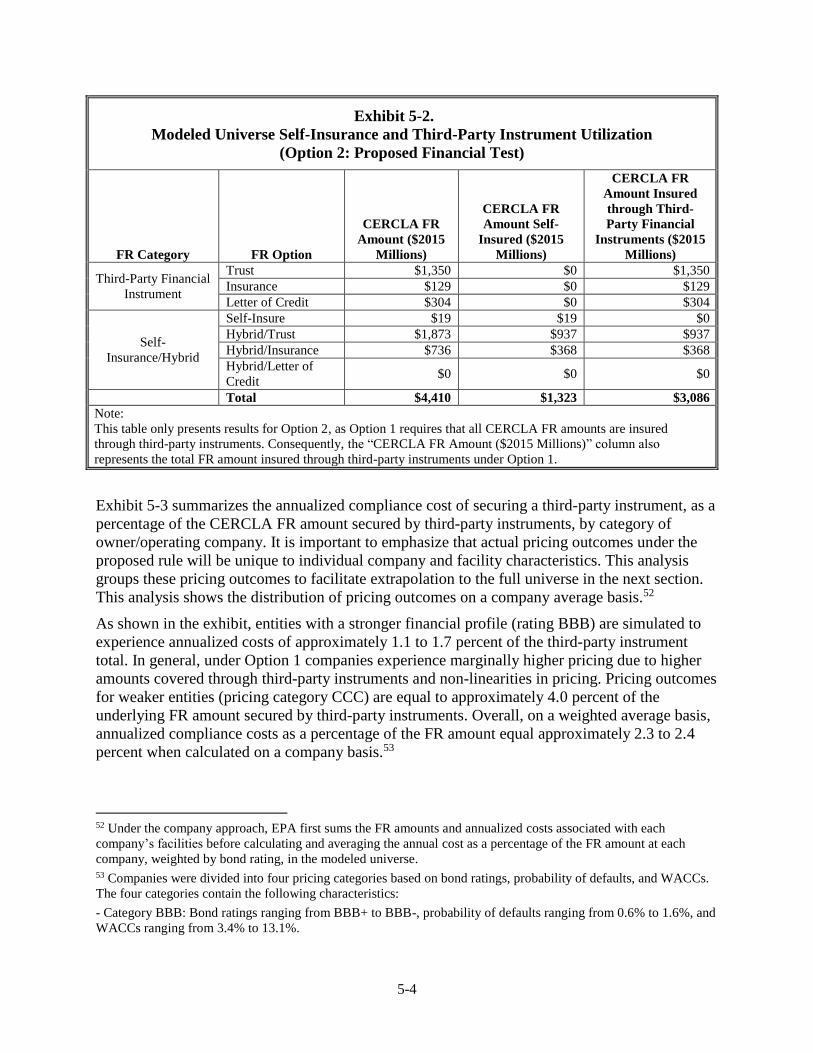
5-4
Exhibit 5-2.
Modeled Universe Self-Insurance and Third-Party Instrument Utilization
(Option 2: Proposed Financial Test)
FR Category FR Option
CERCLA FR
Amount ($2015
Millions)
CERCLA FR
Amount Self-
Insured ($2015
Millions)
CERCLA FR
Amount Insured
through Third-
Party Financial
Instruments ($2015
Millions)
Third-Party Financial
Instrument
Trust $1,350 $0 $1,350
Insurance $129 $0 $129
Letter of Credit $304 $0 $304
Self-
Insurance/Hybrid
Self-Insure $19 $19 $0
Hybrid/Trust $1,873 $937 $937
Hybrid/Insurance $736 $368 $368
Hybrid/Letter of
Credit $0 $0 $0
Total $4,410 $1,323 $3,086
Note:
This table only presents results for Option 2, as Option 1 requires that all CERCLA FR amounts are insured
through third-party instruments. Consequently, the “CERCLA FR Amount ($2015 Millions)” column also
represents the total FR amount insured through third-party instruments under Option 1.
Exhibit 5-3 summarizes the annualized compliance cost of securing a third-party instrument, as a
percentage of the CERCLA FR amount secured by third-party instruments, by category of
owner/operating company. It is important to emphasize that actual pricing outcomes under the
proposed rule will be unique to individual company and facility characteristics. This analysis
groups these pricing outcomes to facilitate extrapolation to the full universe in the next section.
This analysis shows the distribution of pricing outcomes on a company average basis.52
As shown in the exhibit, entities with a stronger financial profile (rating BBB) are simulated to
experience annualized costs of approximately 1.1 to 1.7 percent of the third-party instrument
total. In general, under Option 1 companies experience marginally higher pricing due to higher
amounts covered through third-party instruments and non-linearities in pricing. Pricing outcomes
for weaker entities (pricing category CCC) are equal to approximately 4.0 percent of the
underlying FR amount secured by third-party instruments. Overall, on a weighted average basis,
annualized compliance costs as a percentage of the FR amount equal approximately 2.3 to 2.4
percent when calculated on a company basis.53
52 Under the company approach, EPA first sums the FR amounts and annualized costs associated with each
company’s facilities before calculating and averaging the annual cost as a percentage of the FR amount at each
company, weighted by bond rating, in the modeled universe. 53 Companies were divided into four pricing categories based on bond ratings, probability of defaults, and WACCs.
The four categories contain the following characteristics:
- Category BBB: Bond ratings ranging from BBB+ to BBB-, probability of defaults ranging from 0.6% to 1.6%, and
WACCs ranging from 3.4% to 13.1%.
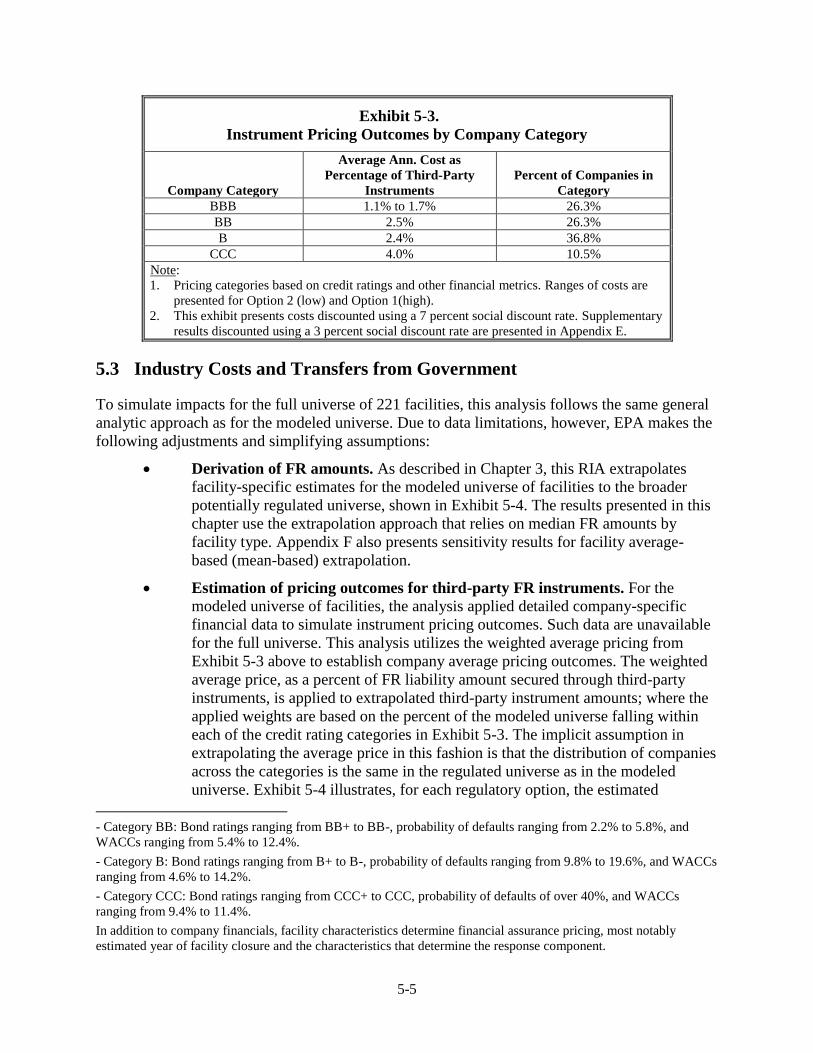
5-5
Exhibit 5-3.
Instrument Pricing Outcomes by Company Category
Company Category
Average Ann. Cost as
Percentage of Third-Party
Instruments
Percent of Companies in
Category
BBB 1.1% to 1.7% 26.3%
BB 2.5% 26.3%
B 2.4% 36.8%
CCC 4.0% 10.5%
Note:
1. Pricing categories based on credit ratings and other financial metrics. Ranges of costs are
presented for Option 2 (low) and Option 1(high).
2. This exhibit presents costs discounted using a 7 percent social discount rate. Supplementary
results discounted using a 3 percent social discount rate are presented in Appendix E.
5.3 Industry Costs and Transfers from Government
To simulate impacts for the full universe of 221 facilities, this analysis follows the same general
analytic approach as for the modeled universe. Due to data limitations, however, EPA makes the
following adjustments and simplifying assumptions:
Derivation of FR amounts. As described in Chapter 3, this RIA extrapolates
facility-specific estimates for the modeled universe of facilities to the broader
potentially regulated universe, shown in Exhibit 5-4. The results presented in this
chapter use the extrapolation approach that relies on median FR amounts by
facility type. Appendix F also presents sensitivity results for facility average-
based (mean-based) extrapolation.
Estimation of pricing outcomes for third-party FR instruments. For the
modeled universe of facilities, the analysis applied detailed company-specific
financial data to simulate instrument pricing outcomes. Such data are unavailable
for the full universe. This analysis utilizes the weighted average pricing from
Exhibit 5-3 above to establish company average pricing outcomes. The weighted
average price, as a percent of FR liability amount secured through third-party
instruments, is applied to extrapolated third-party instrument amounts; where the
applied weights are based on the percent of the modeled universe falling within
each of the credit rating categories in Exhibit 5-3. The implicit assumption in
extrapolating the average price in this fashion is that the distribution of companies
across the categories is the same in the regulated universe as in the modeled
universe. Exhibit 5-4 illustrates, for each regulatory option, the estimated
- Category BB: Bond ratings ranging from BB+ to BB-, probability of defaults ranging from 2.2% to 5.8%, and
WACCs ranging from 5.4% to 12.4%.
- Category B: Bond ratings ranging from B+ to B-, probability of defaults ranging from 9.8% to 19.6%, and WACCs
ranging from 4.6% to 14.2%.
- Category CCC: Bond ratings ranging from CCC+ to CCC, probability of defaults of over 40%, and WACCs
ranging from 9.4% to 11.4%.
In addition to company financials, facility characteristics determine financial assurance pricing, most notably
estimated year of facility closure and the characteristics that determine the response component.
5-6
annualized costs of obtaining third-party FR instruments using company average-
based estimated pricing. Appendix F presents results using facility average-based
pricing assumptions.
Estimation of performance under the financial test. For this metric, the
analysis assumes the full universe of companies will perform similarly to the
modeled universe of companies with respect to the financial test. Namely, the
same proportion of the FR amount will be self-insured in the full universe as was
simulated in the modeled universe.
The results for the potentially regulated universe are presented in Exhibit 5-5. The results are
presented by the company-based pricing and median-based extrapolated FR amounts. As shown
in the exhibit, the total estimated FR obligation amount for the regulated universe is $7.1 billion.
Under Option 1, the amount of FR obligations covered through third-party instruments is
equivalent to the total FR amount. Under Option 2, the FR amount covered through third-party
instruments is lower, estimated at $4.9 billion. Under Option 2, the annualized compliance cost
to secure the third-party financial instruments is $111 million. The results for Option 1 can be
interpreted similarly. These values represent the range of potential incremental costs of the
proposed rule to industry.
As discussed in the prior chapter, a primary effect of the proposed rule is the increased likelihood
between the baseline and regulatory scenarios that owners and operators will have access to
funds necessary to address the CERCLA liabilities at their facilities, reducing government
burden. Because actual data on Superfund recovery rates for these companies are unavailable,
this analysis uses proxy measures based on default and firm failure. The government’s burden
under the baseline is a function of the extent to which entities in the full regulated universe may
default on their CERCLA liabilities.54 Due to data limitations, this analysis uses the firm exit rate
from the Census Bureau’s Business Dynamics Statistics. This modeling assumption presents a
“worst-case” scenario in that 1) all facilities incur CERCLA liabilities exactly equal to the FR
amounts estimated in this analysis, and that 2) no exiting firms meet any of their potential
CERCLA obligations. As a result, the baseline represented in this RIA presents estimated
CERCLA FR amounts. In reality, facilities’ actual future CERCLA liabilities may be either
higher or lower than their FR obligations, and exiting (and even defaulting) firms may be able to
meet a portion or all of their CERCLA liabilities.
54 In the baseline, government costs are derived using a proxy measure for the extent to which mining entities may
default on CERCLA liabilities: the three-year average of the annual firm exit rate calculated from the Census
Bureau’s Business Dynamics Statistics (BDS), which is 7.45 percent. The BDS provides the number of firms
operating and number of firm exits each year in the mining sector. Firm exits identify when all establishments of a
firm cease operations for reasons other than reorganization, merger, or acquisition. Because of the “corporate veil”
enjoyed by legal subsidiaries, this analysis uses a facility-based failure rate to model government costs in the
baseline due to owner/operator failure. Compared to other measures of failure or default, the BDS firm exit rate also
captures both private and public companies.

5-7
Exhibit 5-4.
Median-Based Extrapolation from the Modeled Universe to the Potentially Regulated Universe
Facility Type
Potentially
Regulated
Universe
(n=221)
Modeled
Universe
(n=49)
Modeled
Universe
Facility FR -
Median
($2015
Millions)
Potentially
Regulated Universe
Total FR Amount
Across Facilities,
Median-Based
Extrapolation
($2015 Millions)
Third-Party
FR
Instruments
– Option 2
($2015
Millions)
Ann. Cost of
Third-Party
FR
Instruments
- Option 1
($ Millions)
Ann. Cost of
Third-Party
FR
Instruments
- Option 2
($ Millions)
Brine Extraction/Processing 6 (none; assume
equal to ISR) $1 $8 $5 $0.2 $0.1
In-situ recovery 8 3 $1 $10 $7 $0.2 $0.2
Processor/Refiner 33 1 $76 $2,496 $1,747 $60 $39
Surface Mine 62 25 $48 $2,961 $2,073 $72 $47
Surface Mine/Processing 27 13 $28 $766 $536 $18 $12
Surface Mine/Processing/Primary
Smelter 2
(none; assume
equal to surface
mine/processing)
$28 $57 $40 $1 $1
Surface/Underground mine 1
(none; assume
equal to surface
mine)
$48 $48 $33 $1 $1
Underground Mine 53 5 $5 $284 $199 $7 $4
Underground Mine/Processing 6 2 $29 $172 $120 $4 $3
Primary Smelter 23
(none;
approximated
separately)
$11 $263 $184 $6 $4
ALL FACILITIES 221 49 $37 $7,064 $4,944 $171 $111
Note:
This exhibit presents costs discounted using a 7 percent social discount rate. Supplementary results discounted using a 3 percent social discount rate are presented
in Appendix E.
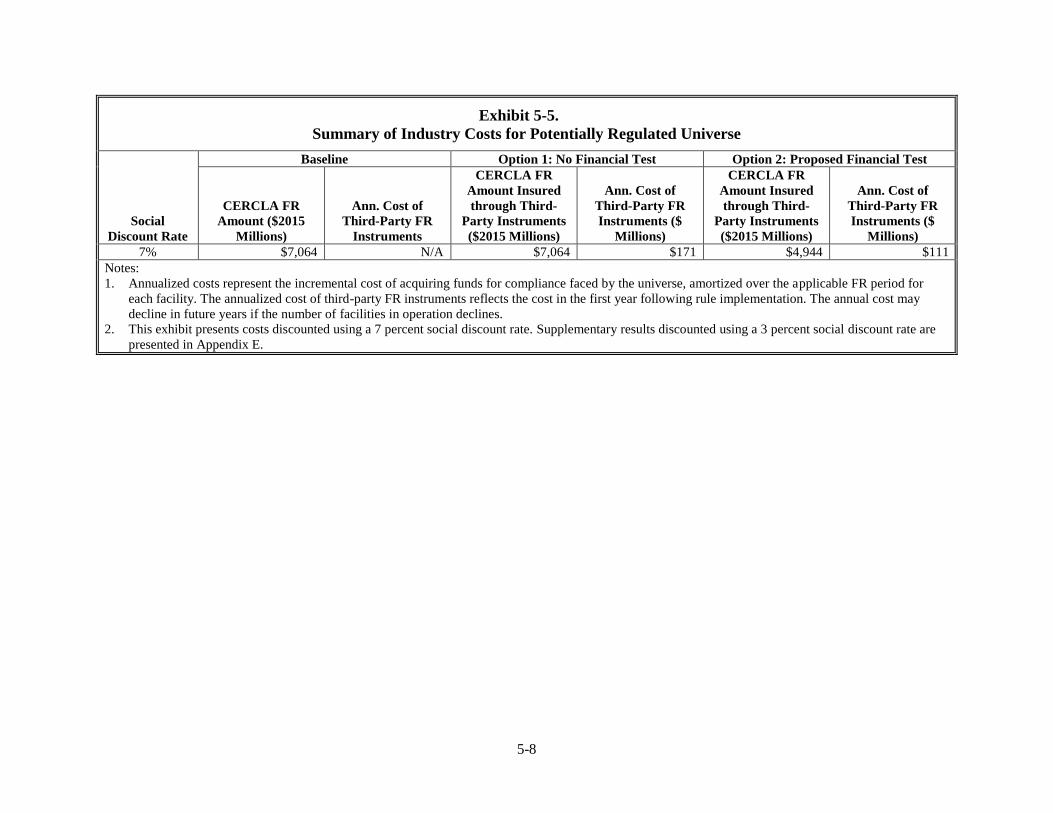
5-8
Exhibit 5-5.
Summary of Industry Costs for Potentially Regulated Universe
Social
Discount Rate
Baseline Option 1: No Financial Test Option 2: Proposed Financial Test
CERCLA FR
Amount ($2015
Millions)
Ann. Cost of
Third-Party FR
Instruments
CERCLA FR
Amount Insured
through Third-
Party Instruments
($2015 Millions)
Ann. Cost of
Third-Party FR
Instruments ($
Millions)
CERCLA FR
Amount Insured
through Third-
Party Instruments
($2015 Millions)
Ann. Cost of
Third-Party FR
Instruments ($
Millions)
7% $7,064 N/A $7,064 $171 $4,944 $111
Notes:
1. Annualized costs represent the incremental cost of acquiring funds for compliance faced by the universe, amortized over the applicable FR period for
each facility. The annualized cost of third-party FR instruments reflects the cost in the first year following rule implementation. The annual cost may
decline in future years if the number of facilities in operation declines.
2. This exhibit presents costs discounted using a 7 percent social discount rate. Supplementary results discounted using a 3 percent social discount rate are
presented in Appendix E.
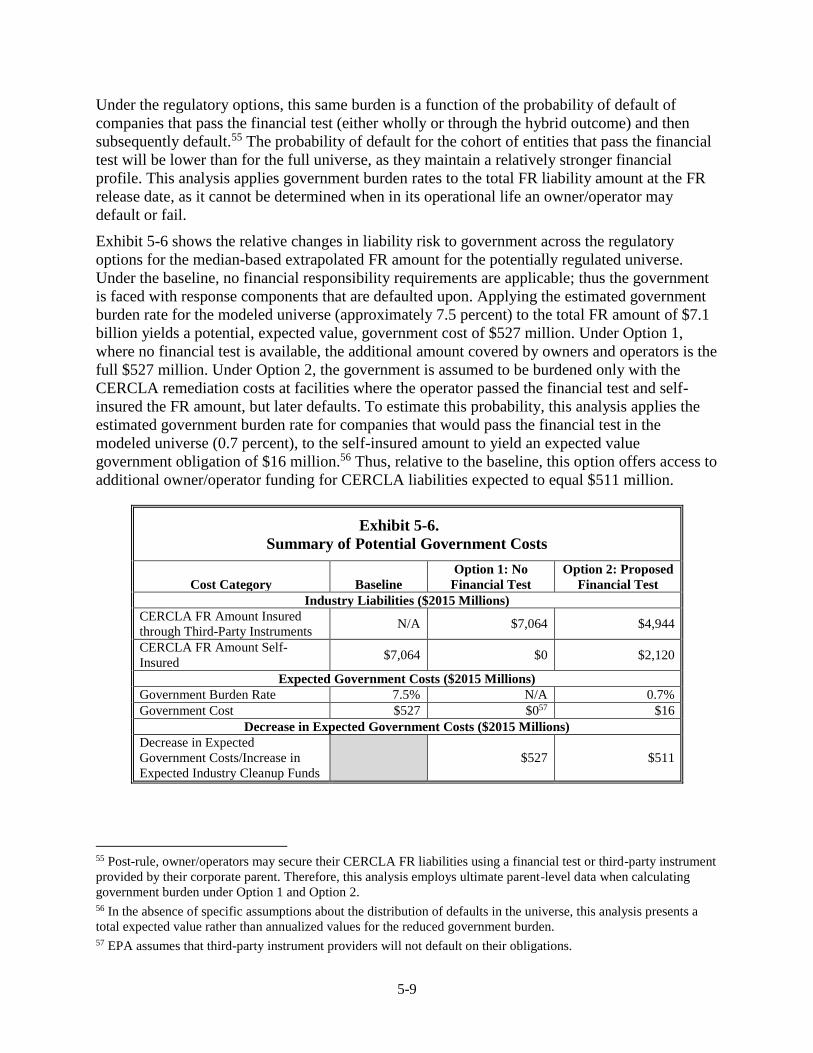
5-9
Under the regulatory options, this same burden is a function of the probability of default of
companies that pass the financial test (either wholly or through the hybrid outcome) and then
subsequently default.55 The probability of default for the cohort of entities that pass the financial
test will be lower than for the full universe, as they maintain a relatively stronger financial
profile. This analysis applies government burden rates to the total FR liability amount at the FR
release date, as it cannot be determined when in its operational life an owner/operator may
default or fail.
Exhibit 5-6 shows the relative changes in liability risk to government across the regulatory
options for the median-based extrapolated FR amount for the potentially regulated universe.
Under the baseline, no financial responsibility requirements are applicable; thus the government
is faced with response components that are defaulted upon. Applying the estimated government
burden rate for the modeled universe (approximately 7.5 percent) to the total FR amount of $7.1
billion yields a potential, expected value, government cost of $527 million. Under Option 1,
where no financial test is available, the additional amount covered by owners and operators is the
full $527 million. Under Option 2, the government is assumed to be burdened only with the
CERCLA remediation costs at facilities where the operator passed the financial test and self-
insured the FR amount, but later defaults. To estimate this probability, this analysis applies the
estimated government burden rate for companies that would pass the financial test in the
modeled universe (0.7 percent), to the self-insured amount to yield an expected value
government obligation of $16 million.56 Thus, relative to the baseline, this option offers access to
additional owner/operator funding for CERCLA liabilities expected to equal $511 million.
Exhibit 5-6.
Summary of Potential Government Costs
Cost Category Baseline
Option 1: No
Financial Test
Option 2: Proposed
Financial Test
Industry Liabilities ($2015 Millions)
CERCLA FR Amount Insured
through Third-Party Instruments N/A $7,064 $4,944
CERCLA FR Amount Self-
Insured $7,064 $0 $2,120
Expected Government Costs ($2015 Millions)
Government Burden Rate 7.5% N/A 0.7%
Government Cost $527 $057 $16
Decrease in Expected Government Costs ($2015 Millions)
Decrease in Expected
Government Costs/Increase in
Expected Industry Cleanup Funds
$527 $511
55 Post-rule, owner/operators may secure their CERCLA FR liabilities using a financial test or third-party instrument
provided by their corporate parent. Therefore, this analysis employs ultimate parent-level data when calculating
government burden under Option 1 and Option 2. 56 In the absence of specific assumptions about the distribution of defaults in the universe, this analysis presents a
total expected value rather than annualized values for the reduced government burden. 57 EPA assumes that third-party instrument providers will not default on their obligations.
5-10
5.4 Social Costs and Intra-Industry Transfers
As described in Chapter 3, this RIA estimates the social costs of the rule as the fees and
commissions paid to financial institutions to obtain financial instruments that provide assurance
for the funding of CERCLA financial responsibility amounts. These costs reflect the value of the
real resources needed to comply with the rule. In contrast, the net incremental costs of acquiring
capital to secure these instruments are treated as a transfer between the mining and financial
industries in this RIA. In the baseline, firms do not incur these fees or capital acquisition costs.
Exhibit 5-7 below summarizes the results of the analysis in accordance with the analytical
framework presented above. Under Option 1 (annualized cost of third-party instruments of $171
million), annualized transfers are estimated to be $127 million. Thus, the social costs are
estimated to total $44 million. Option 2 engenders lower social cost estimates, corresponding to
previously presented results. Under the lower bound total FR liability amounts, annualized social
costs range are estimated to be $30 million. These estimates of social costs do not include
administrative costs to industry, which are presented separately in Section 5.5.
5.5 Administrative Compliance Burden
This RIA also includes an estimate of administrative reporting and recordkeeping costs to
industry associated with the proposed rulemaking for the potentially regulated universe. These
costs consist of labor, O&M, and capital costs and include: reading the regulations, submitting
initial facility information to EPA and the public, calculating FR amounts, choosing an FR
instrument, acquiring and maintaining an FR instrument, recalculating FR amounts to reflect any
changes in facility operations, and any functions the rule requires of owners and operators upon
the transfer of a facility, owner or operator default, a CERCLA claim against the owner or
operator, and release from financial responsibility. The labor costs are estimated on an annual
basis, as of the first year of compliance.
Note that the analysis does not estimate the fees and other costs associated with establishing and
maintaining an FR instrument (collateral, credit fee, etc.), because those costs are reflected in the
FR instrument cost analysis of this RIA.58
Exhibit 5-8 presents the annualized administrative cost of the rule under the two options using a
7 percent social discount rate, annualized until FR release date.
58 The estimates presented here rely on the document: U.S. EPA. Estimating Costs for the Economic Benefits of
RCRA Noncompliance. September 1997. December 1997 Update.
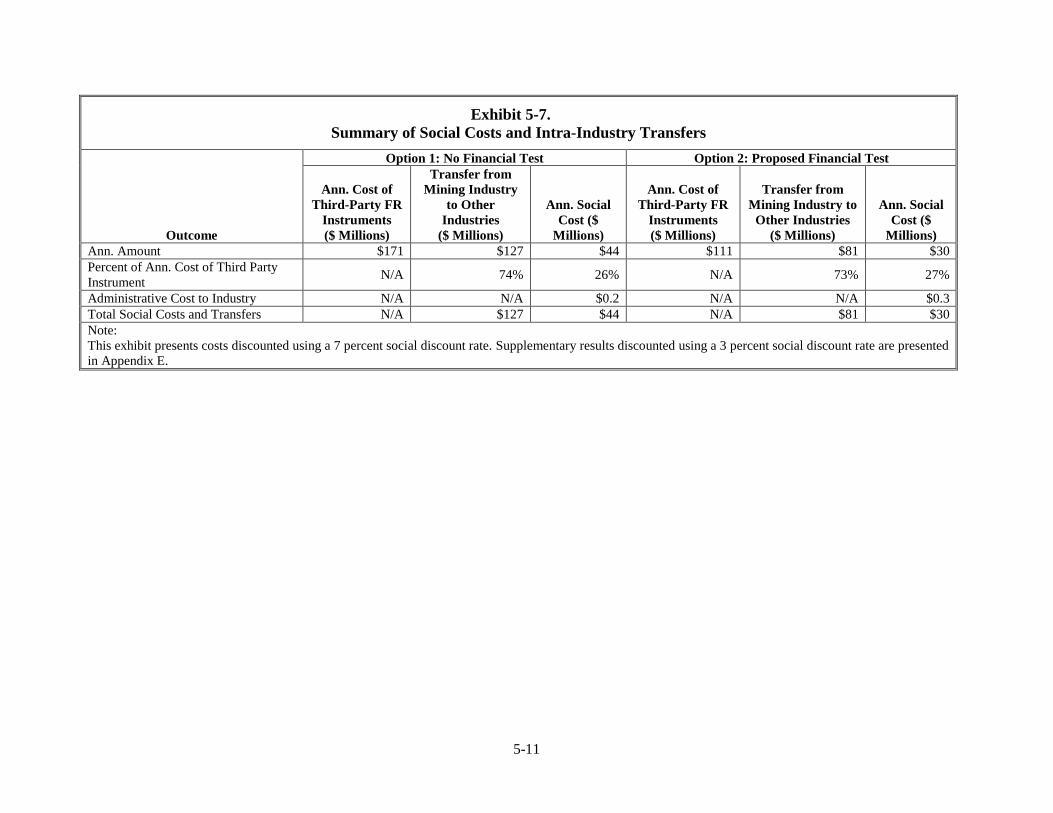
5-11
Exhibit 5-7.
Summary of Social Costs and Intra-Industry Transfers
Outcome
Option 1: No Financial Test Option 2: Proposed Financial Test
Ann. Cost of
Third-Party FR
Instruments
($ Millions)
Transfer from
Mining Industry
to Other
Industries
($ Millions)
Ann. Social
Cost ($
Millions)
Ann. Cost of
Third-Party FR
Instruments
($ Millions)
Transfer from
Mining Industry to
Other Industries
($ Millions)
Ann. Social
Cost ($
Millions)
Ann. Amount $171 $127 $44 $111 $81 $30
Percent of Ann. Cost of Third Party
Instrument N/A 74% 26% N/A 73% 27%
Administrative Cost to Industry N/A N/A $0.2 N/A N/A $0.3
Total Social Costs and Transfers N/A $127 $44 N/A $81 $30
Note:
This exhibit presents costs discounted using a 7 percent social discount rate. Supplementary results discounted using a 3 percent social discount rate are presented
in Appendix E.
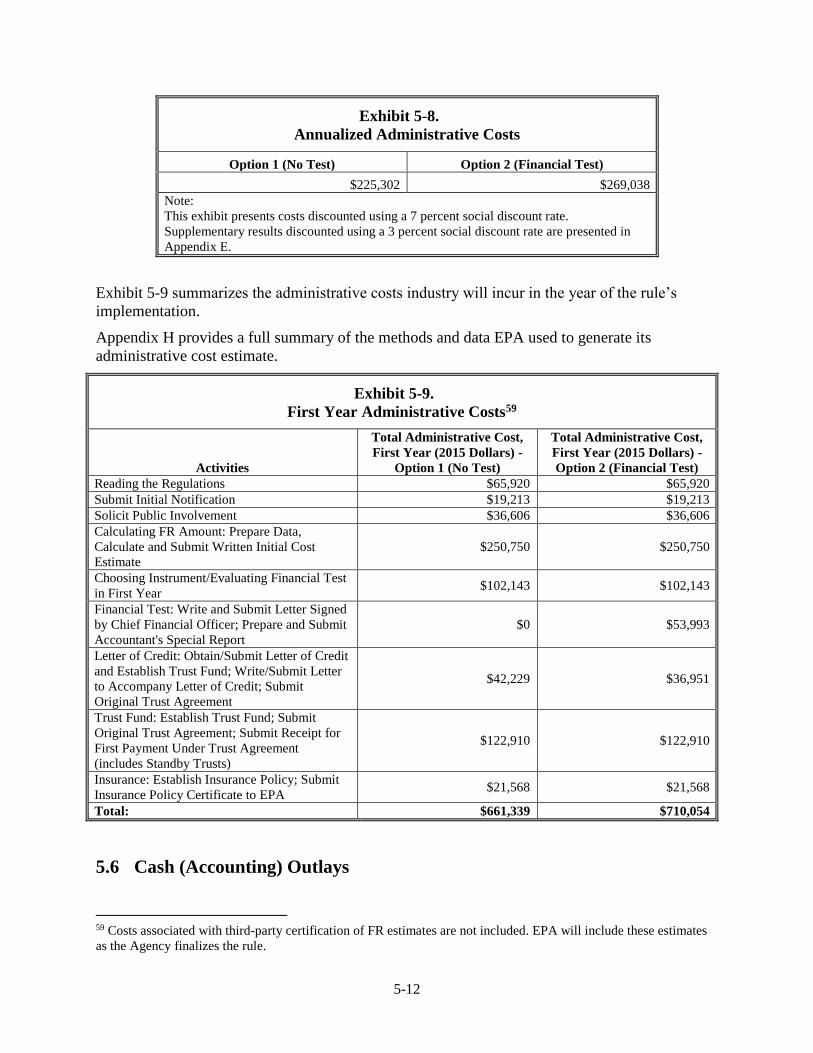
5-12
Exhibit 5-8.
Annualized Administrative Costs
Option 1 (No Test) Option 2 (Financial Test)
$225,302 $269,038
Note:
This exhibit presents costs discounted using a 7 percent social discount rate.
Supplementary results discounted using a 3 percent social discount rate are presented in
Appendix E.
Exhibit 5-9 summarizes the administrative costs industry will incur in the year of the rule’s
implementation.
Appendix H provides a full summary of the methods and data EPA used to generate its
administrative cost estimate.
Exhibit 5-9.
First Year Administrative Costs59
Activities
Total Administrative Cost,
First Year (2015 Dollars) -
Option 1 (No Test)
Total Administrative Cost,
First Year (2015 Dollars) -
Option 2 (Financial Test)
Reading the Regulations $65,920 $65,920
Submit Initial Notification $19,213 $19,213
Solicit Public Involvement $36,606 $36,606
Calculating FR Amount: Prepare Data,
Calculate and Submit Written Initial Cost
Estimate
$250,750 $250,750
Choosing Instrument/Evaluating Financial Test
in First Year $102,143 $102,143
Financial Test: Write and Submit Letter Signed
by Chief Financial Officer; Prepare and Submit
Accountant's Special Report
$0 $53,993
Letter of Credit: Obtain/Submit Letter of Credit
and Establish Trust Fund; Write/Submit Letter
to Accompany Letter of Credit; Submit
Original Trust Agreement
$42,229 $36,951
Trust Fund: Establish Trust Fund; Submit
Original Trust Agreement; Submit Receipt for
First Payment Under Trust Agreement
(includes Standby Trusts)
$122,910 $122,910
Insurance: Establish Insurance Policy; Submit
Insurance Policy Certificate to EPA $21,568 $21,568
Total: $661,339 $710,054
5.6 Cash (Accounting) Outlays
59 Costs associated with third-party certification of FR estimates are not included. EPA will include these estimates
as the Agency finalizes the rule.
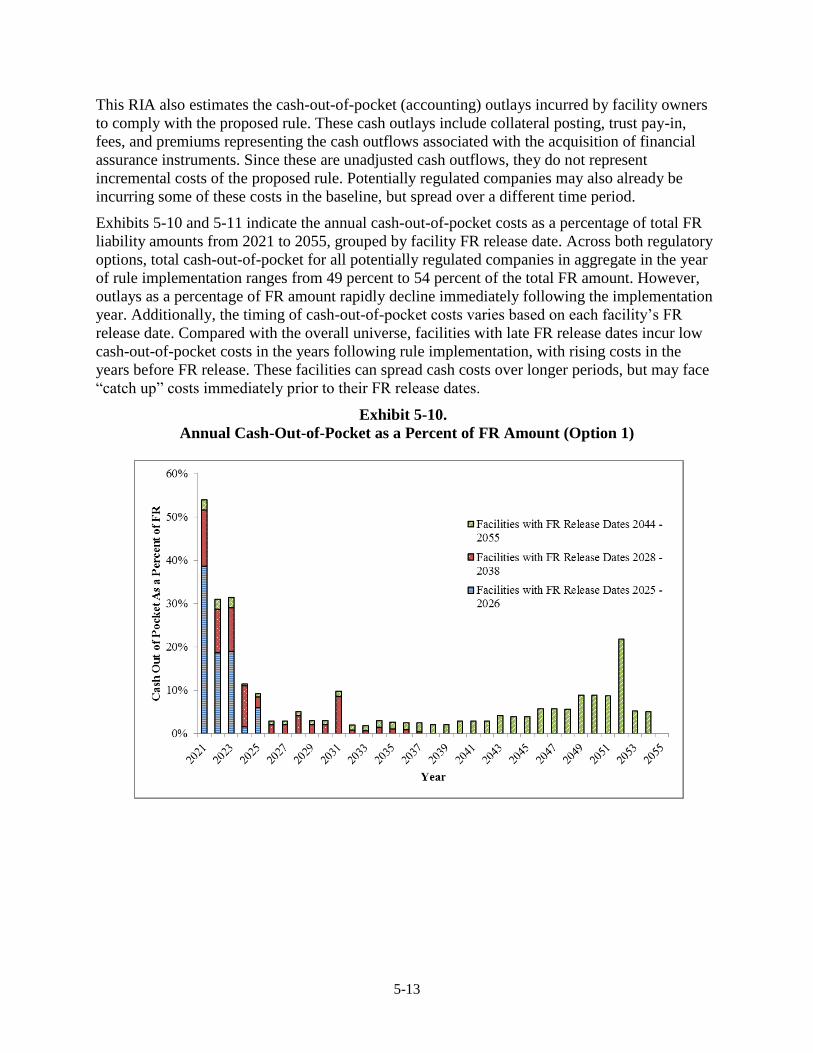
5-13
This RIA also estimates the cash-out-of-pocket (accounting) outlays incurred by facility owners
to comply with the proposed rule. These cash outlays include collateral posting, trust pay-in,
fees, and premiums representing the cash outflows associated with the acquisition of financial
assurance instruments. Since these are unadjusted cash outflows, they do not represent
incremental costs of the proposed rule. Potentially regulated companies may also already be
incurring some of these costs in the baseline, but spread over a different time period.
Exhibits 5-10 and 5-11 indicate the annual cash-out-of-pocket costs as a percentage of total FR
liability amounts from 2021 to 2055, grouped by facility FR release date. Across both regulatory
options, total cash-out-of-pocket for all potentially regulated companies in aggregate in the year
of rule implementation ranges from 49 percent to 54 percent of the total FR amount. However,
outlays as a percentage of FR amount rapidly decline immediately following the implementation
year. Additionally, the timing of cash-out-of-pocket costs varies based on each facility’s FR
release date. Compared with the overall universe, facilities with late FR release dates incur low
cash-out-of-pocket costs in the years following rule implementation, with rising costs in the
years before FR release. These facilities can spread cash costs over longer periods, but may face
“catch up” costs immediately prior to their FR release dates.
Exhibit 5-10.
Annual Cash-Out-of-Pocket as a Percent of FR Amount (Option 1)
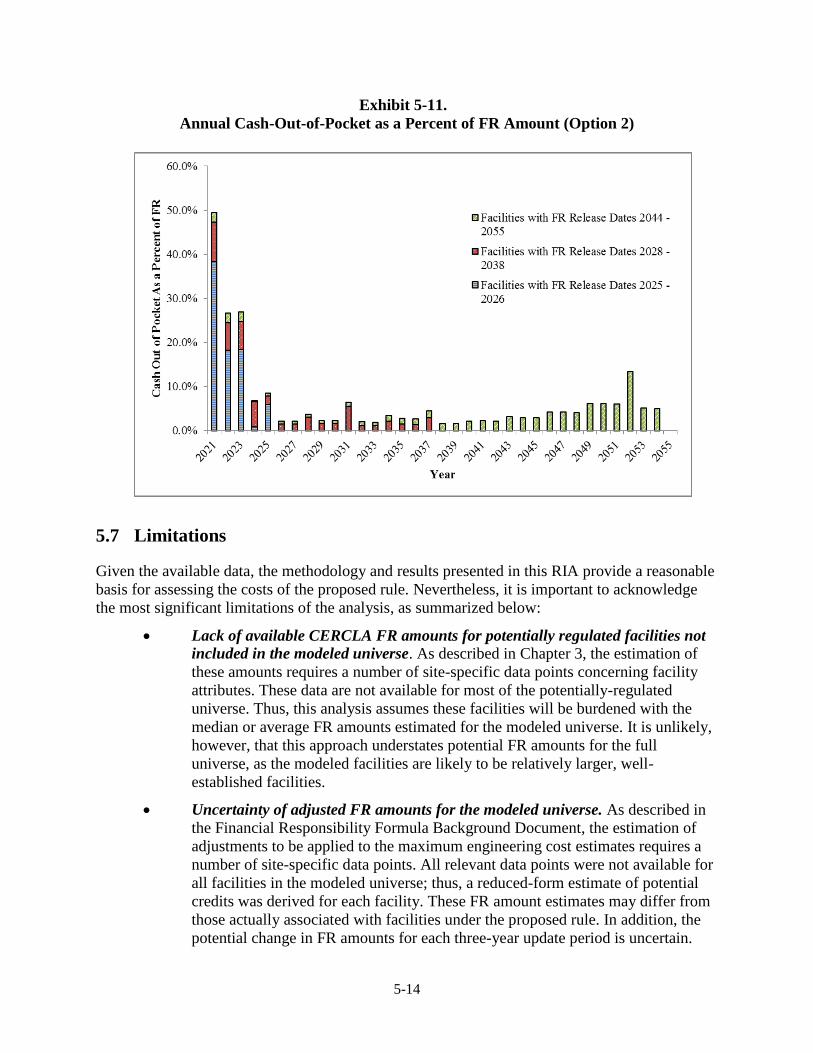
5-14
Exhibit 5-11.
Annual Cash-Out-of-Pocket as a Percent of FR Amount (Option 2)
5.7 Limitations
Given the available data, the methodology and results presented in this RIA provide a reasonable
basis for assessing the costs of the proposed rule. Nevertheless, it is important to acknowledge
the most significant limitations of the analysis, as summarized below:
Lack of available CERCLA FR amounts for potentially regulated facilities not
included in the modeled universe. As described in Chapter 3, the estimation of
these amounts requires a number of site-specific data points concerning facility
attributes. These data are not available for most of the potentially-regulated
universe. Thus, this analysis assumes these facilities will be burdened with the
median or average FR amounts estimated for the modeled universe. It is unlikely,
however, that this approach understates potential FR amounts for the full
universe, as the modeled facilities are likely to be relatively larger, well-
established facilities.
Uncertainty of adjusted FR amounts for the modeled universe. As described in
the Financial Responsibility Formula Background Document, the estimation of
adjustments to be applied to the maximum engineering cost estimates requires a
number of site-specific data points. All relevant data points were not available for
all facilities in the modeled universe; thus, a reduced-form estimate of potential
credits was derived for each facility. These FR amount estimates may differ from
those actually associated with facilities under the proposed rule. In addition, the
potential change in FR amounts for each three-year update period is uncertain.
5-15
Lack of financial and operating data for companies that are not publicly traded.
EPA was unable to obtain financial data for the private companies that might be
affected by the proposed rule. Therefore, this analysis assumes that the pricing
outcomes and default probabilities associated with the modeled universe are
generally consistent with those of the full universe. If the modeled firms are
generally larger and financially stronger than those in the full universe, the
analysis may: (1) overstate the percentage of firms that pass a financial test and
FR amounts that are self-insured (Option 2 only); (2) understate the potential
default rate, thus understating government costs; and (3) understate industry costs.
The analysis endeavors to control for such bias by estimating results using a
weighted average pricing approach.
Uncertainty of pricing outcomes for companies in the modeled universe. The
actual pricing of financial responsibility instruments is case-specific and
dependent on the individual characteristics of the project or facility being
underwritten, the financial wherewithal of the owner or operator, and the
estimated timing and amounts of costs likely to be due over the life of the project.
As a result, the actual price structure of a financial instrument for a facility’s
CERCLA liabilities may differ from that summarized in this RIA.
Static simulation of potentially regulated universe. The U.S. hardrock mining
sector operates within a volatile, global commodity industry. Companies within
the sector succeed and fail, and facilities open and close, on a regular basis. This
analysis largely captures how the sector may perform under the proposed rule,
given market, company, and facility conditions as of 2015. The estimated
annualized cost figures in this analysis remain applicable for all future years under
the assumption that industry conditions, including total industry size, remain
fairly constant. The economic and operating parameters of the industry may vary,
however, in future years.

6-1
Chapter 6.
Economic Impact Analysis
6.1 Introduction
The previous chapters discussed the derivation of CERCLA financial responsibility amounts for
the modeled universe of hardrock mining facilities and the development of the annualized cost of
obtaining the prescribed financial responsibility instruments for the associated universe of
owner/operator companies. In addition, those chapters addressed the extension of these modeled
universe-based analyses to the entire potentially regulated universe. This chapter builds on these
analyses to discuss the economic impacts that may be experienced by companies potentially
affected by the proposed rule. Specifically, this chapter first considers methods used to assess the
economic impacts and then develops provisional results. For this analysis, the modeled universe
is utilized, focusing on an assessment of total annual FR costs relative to total revenues and
operating cash flow of those modeled companies.
6.2 Industry Profile and Analytic Approach
Certain characteristics of the hardrock mining sector pose important considerations for the
financial assessment of the proposed rule’s impacts. For example:
The sector is predominately a commodity-based business, with limited product
differentiation;
The industry is global in nature, with ore deposits distributed across countries and
continents;
Commodity prices are volatile and sensitive to broader macroeconomic trends,
leading to boom and bust cycles;
Mining is a labor-intensive process; mines adjust their employment levels
consistent with the economic cycles; and
The economics of individual mines varies. Mine viability is determined and
affected by exploration, extraction, and processing costs, ore quality, transport
costs, and overall market economics (demand and supply of particular commodity
at any given point in time). Supplies of a particular commodity tend to rise and
fall relatively slowly, but demand can change quickly. This mismatch can cause
wide fluctuations in market prices and makes prediction of future market
conditions difficult.
These characteristics yield important assumptions and aspirational goals for assessing firm and
sector level impacts engendered by the proposed rule, including:60
60 Data limitations constrain EPA’s ability to fully incorporate each of these considerations into the analysis, but
they serve as a useful guide to making appropriate simplifying assumptions when necessary.
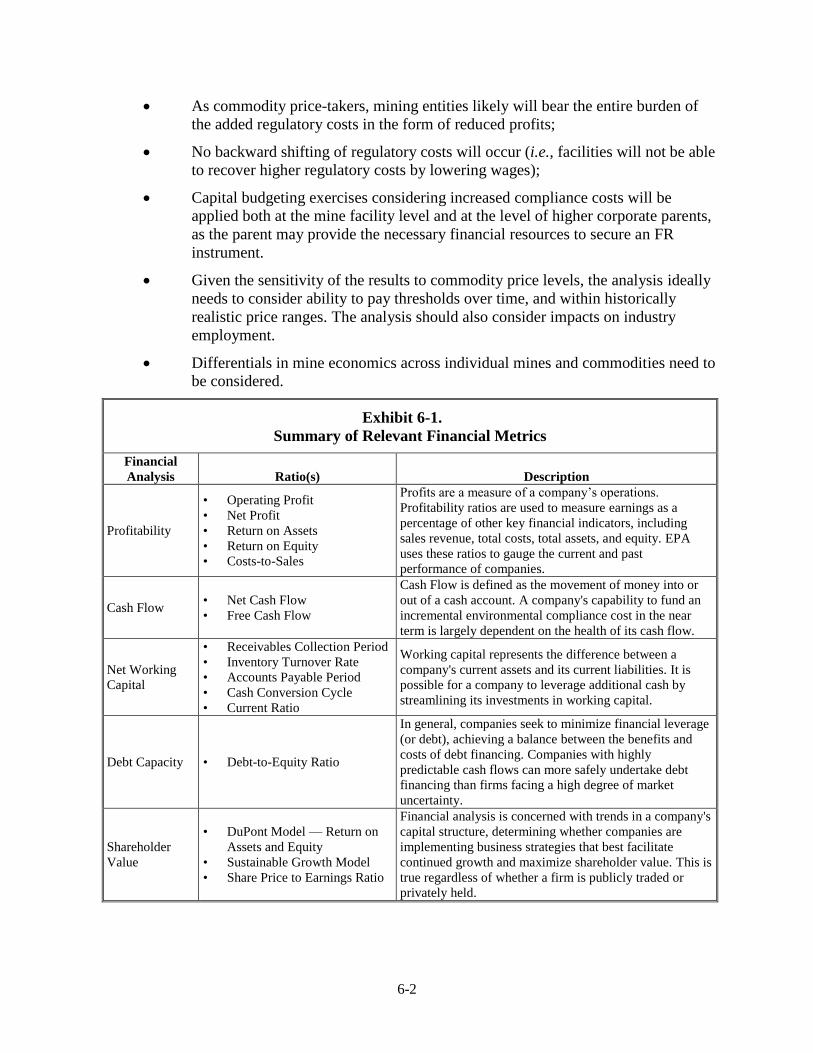
6-2
As commodity price-takers, mining entities likely will bear the entire burden of
the added regulatory costs in the form of reduced profits;
No backward shifting of regulatory costs will occur (i.e., facilities will not be able
to recover higher regulatory costs by lowering wages);
Capital budgeting exercises considering increased compliance costs will be
applied both at the mine facility level and at the level of higher corporate parents,
as the parent may provide the necessary financial resources to secure an FR
instrument.
Given the sensitivity of the results to commodity price levels, the analysis ideally
needs to consider ability to pay thresholds over time, and within historically
realistic price ranges. The analysis should also consider impacts on industry
employment.
Differentials in mine economics across individual mines and commodities need to
be considered.
Exhibit 6-1.
Summary of Relevant Financial Metrics
Financial
Analysis Ratio(s) Description
Profitability
• Operating Profit
• Net Profit
• Return on Assets
• Return on Equity
• Costs-to-Sales
Profits are a measure of a company’s operations.
Profitability ratios are used to measure earnings as a
percentage of other key financial indicators, including
sales revenue, total costs, total assets, and equity. EPA
uses these ratios to gauge the current and past
performance of companies.
Cash Flow • Net Cash Flow
• Free Cash Flow
Cash Flow is defined as the movement of money into or
out of a cash account. A company's capability to fund an
incremental environmental compliance cost in the near
term is largely dependent on the health of its cash flow.
Net Working
Capital
• Receivables Collection Period
• Inventory Turnover Rate
• Accounts Payable Period
• Cash Conversion Cycle
• Current Ratio
Working capital represents the difference between a
company's current assets and its current liabilities. It is
possible for a company to leverage additional cash by
streamlining its investments in working capital.
Debt Capacity • Debt-to-Equity Ratio
In general, companies seek to minimize financial leverage
(or debt), achieving a balance between the benefits and
costs of debt financing. Companies with highly
predictable cash flows can more safely undertake debt
financing than firms facing a high degree of market
uncertainty.
Shareholder
Value
• DuPont Model — Return on
Assets and Equity
• Sustainable Growth Model
• Share Price to Earnings Ratio
Financial analysis is concerned with trends in a company's
capital structure, determining whether companies are
implementing business strategies that best facilitate
continued growth and maximize shareholder value. This is
true regardless of whether a firm is publicly traded or
privately held.
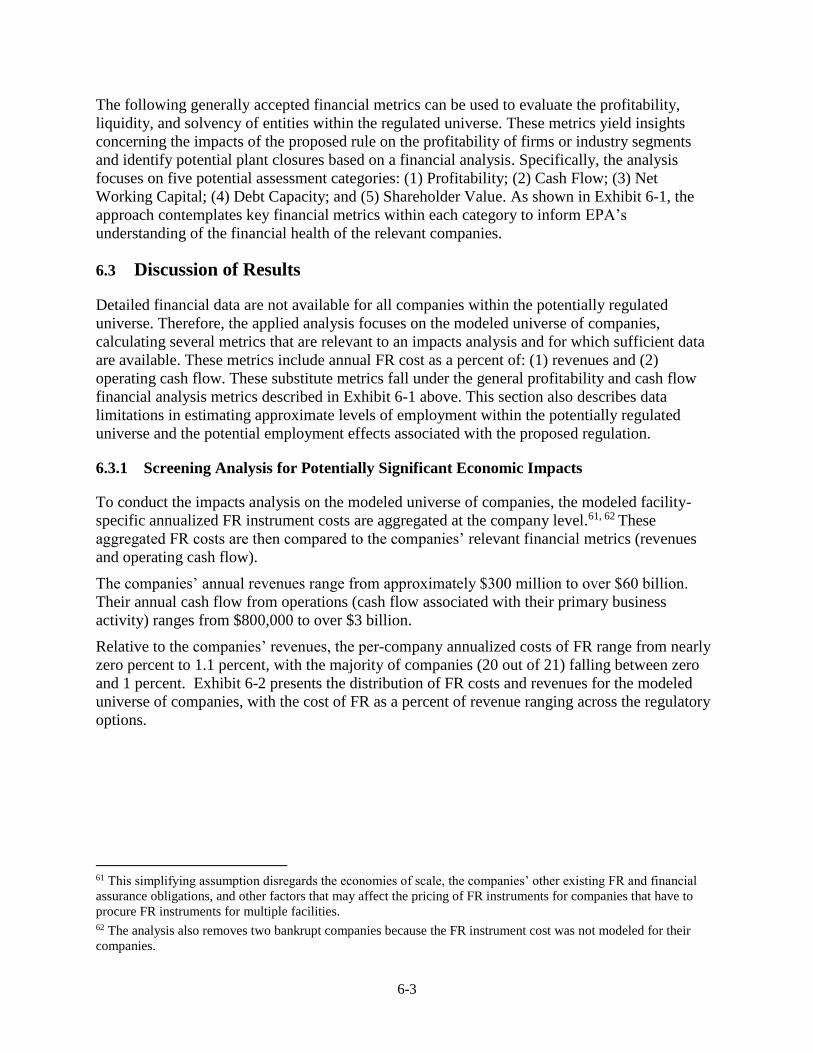
6-3
The following generally accepted financial metrics can be used to evaluate the profitability,
liquidity, and solvency of entities within the regulated universe. These metrics yield insights
concerning the impacts of the proposed rule on the profitability of firms or industry segments
and identify potential plant closures based on a financial analysis. Specifically, the analysis
focuses on five potential assessment categories: (1) Profitability; (2) Cash Flow; (3) Net
Working Capital; (4) Debt Capacity; and (5) Shareholder Value. As shown in Exhibit 6-1, the
approach contemplates key financial metrics within each category to inform EPA’s
understanding of the financial health of the relevant companies.
6.3 Discussion of Results
Detailed financial data are not available for all companies within the potentially regulated
universe. Therefore, the applied analysis focuses on the modeled universe of companies,
calculating several metrics that are relevant to an impacts analysis and for which sufficient data
are available. These metrics include annual FR cost as a percent of: (1) revenues and (2)
operating cash flow. These substitute metrics fall under the general profitability and cash flow
financial analysis metrics described in Exhibit 6-1 above. This section also describes data
limitations in estimating approximate levels of employment within the potentially regulated
universe and the potential employment effects associated with the proposed regulation.
6.3.1 Screening Analysis for Potentially Significant Economic Impacts
To conduct the impacts analysis on the modeled universe of companies, the modeled facility-
specific annualized FR instrument costs are aggregated at the company level.61, 62 These
aggregated FR costs are then compared to the companies’ relevant financial metrics (revenues
and operating cash flow).
The companies’ annual revenues range from approximately $300 million to over $60 billion.
Their annual cash flow from operations (cash flow associated with their primary business
activity) ranges from $800,000 to over $3 billion.
Relative to the companies’ revenues, the per-company annualized costs of FR range from nearly
zero percent to 1.1 percent, with the majority of companies (20 out of 21) falling between zero
and 1 percent. Exhibit 6-2 presents the distribution of FR costs and revenues for the modeled
universe of companies, with the cost of FR as a percent of revenue ranging across the regulatory
options.
61 This simplifying assumption disregards the economies of scale, the companies’ other existing FR and financial
assurance obligations, and other factors that may affect the pricing of FR instruments for companies that have to
procure FR instruments for multiple facilities. 62 The analysis also removes two bankrupt companies because the FR instrument cost was not modeled for their
companies.
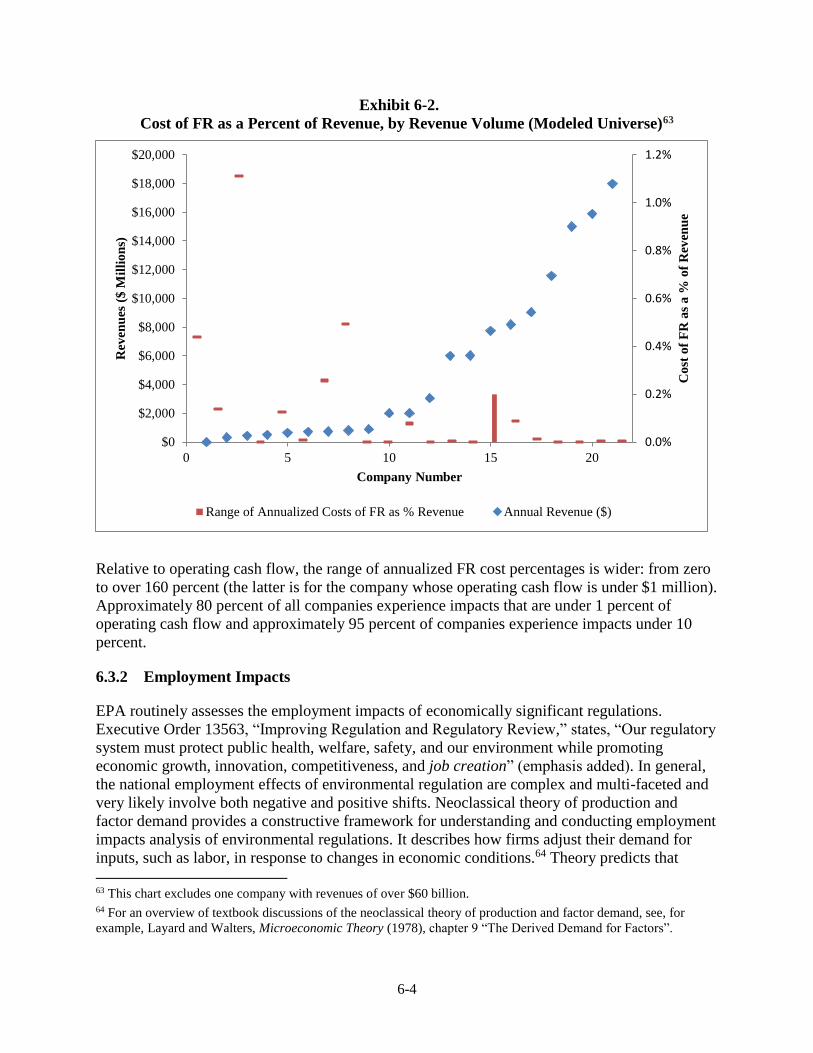
6-4
Exhibit 6-2.
Cost of FR as a Percent of Revenue, by Revenue Volume (Modeled Universe)63
Relative to operating cash flow, the range of annualized FR cost percentages is wider: from zero
to over 160 percent (the latter is for the company whose operating cash flow is under $1 million).
Approximately 80 percent of all companies experience impacts that are under 1 percent of
operating cash flow and approximately 95 percent of companies experience impacts under 10
percent.
6.3.2 Employment Impacts
EPA routinely assesses the employment impacts of economically significant regulations.
Executive Order 13563, “Improving Regulation and Regulatory Review,” states, “Our regulatory
system must protect public health, welfare, safety, and our environment while promoting
economic growth, innovation, competitiveness, and job creation” (emphasis added). In general,
the national employment effects of environmental regulation are complex and multi-faceted and
very likely involve both negative and positive shifts. Neoclassical theory of production and
factor demand provides a constructive framework for understanding and conducting employment
impacts analysis of environmental regulations. It describes how firms adjust their demand for
inputs, such as labor, in response to changes in economic conditions.64 Theory predicts that
63 This chart excludes one company with revenues of over $60 billion. 64 For an overview of textbook discussions of the neoclassical theory of production and factor demand, see, for
example, Layard and Walters, Microeconomic Theory (1978), chapter 9 “The Derived Demand for Factors”.
0.0%
0.2%
0.4%
0.6%
0.8%
1.0%
1.2%
$0
$2,000
$4,000
$6,000
$8,000
$10,000
$12,000
$14,000
$16,000
$18,000
$20,000
0 5 10 15 20
Co
st o
f F
R a
s a
% o
f R
even
ue
Rev
enu
es (
$ M
illi
on
s)
Company Number
Range of Annualized Costs of FR as % Revenue Annual Revenue ($)
6-5
regulated firms will respond to regulation by adjusting input demands and output. The theory
suggests the direction of the total impact of a regulation on the demand for labor in the regulated
sector is indeterminate.65
Exhibit 6-3.
Historical Employment in Mining Industries
Source: Economic Census (2007, 2012), County Business Patterns (interim years), U.S. Census Bureau
EPA did not have sufficient data to model and quantify the potential changes in mines’
employment levels as a result of the proposed regulation. Analysis provided by the U.S.
Geological Survey (USGS) suggests that “the primary metals industry and the nonmetallic
minerals products industry are fundamentally cyclical.” The industries are affected both by the
domestic business cycle and the global economic environment. Composite indices constructed by
USGS suggest that the industry experienced significantly decreased activity surrounding the
Great Recession. In 2014, the most recent year analyzed by USGS, industry growth rates were
positive.66
No information is available regarding employment at the specific facilities in the modeled
universe. However, the U.S. Census Bureau provides data on employment in NAICS 2122 Metal
Ore Mining and NAICS 2123 Nonmetallic Mineral Mining and Quarrying. While there is not a
one to one correspondence between the firm census counts in these industries and the regulated
65 For theoretic frameworks that conceptualize and incorporate the impacts of regulation, see Berman and Bui, 2001
or Deschenes, 2012, 2014. 66 See pages 4 and 7 in U.S. Geological Survey, Mineral Commodity Summaries 2015. The USGS generates
composite indexes for primary metals and separately for nonmetallic mineral products. Their indices are intended to
measure economic activity in these industries using production, employment, and shipments data.
-
20,000
40,000
60,000
80,000
100,000
120,000
2007 2008 2009 2010 2011 2012 2013 2014
To
tal
Em
plo
ym
ent
Year
NAICS 2122 (Metal Ore Mining) NAICS 2123 (Nonmetallic Mineral Mining and Quarrying)
6-6
universe (the full set of industries in the potentially regulated universe is described in Chapter 2),
we summarize information on employment in these industries. Exhibit 6-3 shows that in NAICS
2122, employment has increased roughly 20 percent from 2007 to 2014; in NAICS 2123,
employment has decreased roughly 20 percent.
Data are not available on the share of labor costs in the firms’ overall cost structure or the labor
intensity metrics of the modeled universe, making predictions of the changes in employment
levels associated with the proposed rulemaking difficult. Industry-level sources may provide
information about the average characteristics of the of these sectors; however, the potentially
regulated universe spans numerous sectors, including several sectors not directly related to
mining, and mining operations may only constitute a subsidiary or division. For example, several
facilities in the modeled universe are owned by diversified multinational conglomerates. As
suggested by economic theory, it is possible that increased compliance costs will cause
individual mines to adjust their employment levels to maintain overall profitability.
Conceptually, potential countervailing impacts on labor demand make the direction of change
unknown, though negative employment effects on the mining sector are possible. EPA also
anticipates potential positive employment effects as a result of the labor required to provide
third-party financial responsibility instruments to the regulated facilities and as a result of
increased borrowing due to the additional funds held by the financial sector. The magnitude and
net impact of these changes on employment is highly uncertain.
7-1
Chapter 7.
Benefits of Proposed CERCLA Financial
Responsibility Requirements
7.1 Introduction
As discussed in previous chapters, the proposed rule establishes financial responsibility
requirements for certain classes of hardrock mines and mineral processors under CERCLA
section 108(b). It requires mine owners and operators to demonstrate financial responsibility,
stipulates and describes the maintenance of financial responsibility instruments, and establishes
certain conditions under which owners and operators may self-insure to fulfill financial
responsibility requirements. It thereby provides an economic incentive for owners and operators
to employ sound practices that could decrease their future CERCLA liabilities. EPA envisions
that the rule will yield social welfare benefits, which are discussed below.
7.1.1 Methodological Approach
The primary purpose of the proposed rule is to ensure that hardrock mine and mineral processor
operators and owners have the funds necessary to address the CERCLA liabilities at their
facilities, should future response actions be required. A reduction in overall mining facility
CERCLA liabilities and an increase in the proportion of those liabilities borne by the private
sector through financial responsibility instruments would indicate the proposed rule’s efficacy.
The benefits of the proposed rule include a greater transparency in capital markets, fewer future
environmental liabilities related to mining sites, avoided impacts to impaired waters, and faster
cleanups.
None of the above benefits can be measured with sufficient accuracy to permit a quantitative
assessment. Existing literature does not directly address the relationship between financial
responsibility mechanisms and capital markets or environmental performance, either in the
hardrock mining industry or any industry. In addition, modern mining operations have long life
cycles and there is often a delay of many years between active operations and the creation of
environmental liabilities arising out of activities at the site67. As a result, no specific context,
data, or methodology can be used to quantify the benefits of the proposed rule. Instead, the
assessment uses literature on related topics, such as the effect of environmental disclosure on
financial markets, to discuss the qualitative benefits of the proposed rule.
7.1.2 Overview of Benefits
The proposed rule requiring financial responsibility for hardrock mining operations under
CERCLA section 108(b) will yield a range of benefits to society. These benefits include the
following:
67 The model makes a simplifying assumption that the facility operations will be released from their FR amount
when the facilities are no longer active. While this may not be the case in actuality, it was determined to be the most
reasonable estimate of FR release.
7-2
Capital market effects: Greater transparency and risk mitigation associated with
financial responsibility may reduce uncertainty and improve the functioning of
capital markets. A more stringent CERCLA financial responsibility regime may
force hardrock mining entities to more explicitly collateralize their potential
environmental obligations. This disclosure may provide clearer insight to
investors and capital markets concerning life cycle risks and returns of the sector.
Improvements in site environmental performance: The proposed regulation
forces regulated entities to internalize the expectation of environmental costs they
may impose in the future. The financial responsibility requirements may provide
an incentive for regulated entities to minimize future environmental obligations.
This may lead to environmental improvements at regulated sites and surrounding
areas. Similarly, by explicitly accounting for potential natural resource damages
in establishing the FR amount, the rule will help to ensure that natural resource
damages are assessed and lost ecosystem services more promptly and completely
restored.
For example, improvements in environmental performance as a result of the
proposed rule may reduce acid mine drainage and other discharges into
waterways caused by mining activities. Such reductions would benefit waterways
identified as impaired waters by the Clean Water Act (CWA) and waters
identified as wild and scenic rivers under the Wild and Scenic Rivers Act the
most.
Speed of site cleanups: Site cleanups may occur in a timelier manner under the
proposed rule. If properly structured, a financial responsibility program should
help to ensure that a responsible party is known and funds are adequate and
accessible, when needed. With more expeditious cleanups, human and ecosystem
exposure to harmful contaminants may decline.
EPA characterizes each of these categories of benefits in the sections that follow.
7.2 Capital Market Effects
The proposed financial assurance requirements for the hardrock mining sector may yield benefits
associated with increased efficiency in debt and equity markets. The establishment of such
requirements will increase transparency and reduce uncertainty with respect to the potential
environmental liabilities of regulated firms, as well as their ability to fund these liabilities. This
reduced uncertainty may be reflected in the market capitalization or cost of capital of firms
engaged in hardrock mining activities. Such changes represent a benefit to society, as they
facilitate a more efficient allocation of financial capital than under baseline conditions, thereby
increasing social welfare, and possibly expanding the productive capacity of the economy. EPA
notes that these changes in capital markets may include increases or decreases in the market
capitalization or cost of capital for regulated firms. Both effects may be indicative of benefits to
the U.S. economy, as changes in both directions may enable financial markets to operate with
greater efficiency.
This regulatory impact analysis ideally would quantify the capital market effects of the proposed
rule, but the current literature does not support a quantitative assessment. EPA identified no
7-3
studies in the literature that estimated the market capitalization or cost of capital effects
associated with financial responsibility or similar mechanisms for the hardrock mining sector or
any other industry. Nevertheless, EPA has identified a limited number of studies that quantify the
relationship between a firm’s market value and the uncertainty surrounding its environmental
liabilities. In addition, several literature sources examine the relationship between the disclosure
of environmental liabilities and firms’ market value (or the cost of capital). While not directly
transferable to the proposed rule, this literature may provide insights into the potential magnitude
of the proposed rule’s capital market effects because disclosure, like financial responsibility,
reduces uncertainty in capital markets.
EPA notes that the data and methods employed in this literature vary by study. Important
differences include geographic scope (i.e., U.S. versus non-U.S.), the industry(s) analyzed, the
time horizon of the analysis, the metrics of uncertainty and disclosure, and the metrics of market
valuation. EPA highlights many of these differences in the discussion below.
7.2.1 Liability Uncertainty and Market Valuation
The financial responsibility requirements included in the proposed rule will reduce the
uncertainty surrounding regulated firms’ environmental liabilities, enabling financial markets to
value these firms more accurately. A priori, it is not clear that such a change in uncertainty
would have an appreciable effect on firms’ market value, as the literature does not contain many
empirical studies that examine the uncertainty-valuation relationship. The two studies that EPA
identified, however, both show a statistically significant relationship between a firm’s
environmental liabilities and its market valuation.
Campbell et al. (1998)68 analyzed the relationship between uncertainty specific to a firm’s
Superfund liabilities and the market value of the firm’s common stock. Focusing on the
chemical, paper, and machinery industries in the United States from 1987 to 1993, the authors
found that the magnitude and significance of this relationship varies across industries, but the
overall conclusion was that environmental uncertainty negatively impacts the market’s
perception of a firm and thereby, decreases the firm’s market value. More specifically, the study
found that significant uncertainty surrounding a firm’s Superfund liabilities could decrease its
market value by more than $4 per share per Superfund site.69
Although it was not the main focus of their work, Barth and McNichols (1994)70 studied the
relationship between disclosures of estimated Superfund cleanup costs and investors’
assessments of firms’ unrecognized environmental liabilities. The study found that investors’
average assessment of firms’ unrecognized environmental liabilities is 28.6 percent of equity
(i.e., environmental liabilities are 28.6 percent of market value). Although this study does not
directly analyze the relationship between uncertainty and market valuation, the results
demonstrate that uncertainty can impact market value and by extension, the efficiency of
68 Campbell, Katherine, Stephan E. Sefcik and Naomi S. Soderstrom. “Site uncertainty, allocation uncertainty, and
superfund liability valuation.” Journal of Accounting and Public Policy 17: 331-366. 1998. 69 This was the average across the entire sample. For the chemical industry, the study found that the impact of
significant uncertainty could decrease a firm’s market value by more than $19 per share. 70 Barth, Mary E., and Maureen F. McNichols. “Estimation and Market Valuation of Environmental Liabilities
Relating to Superfund Sites.” Journal of Accounting Research 32: 177-209. 1994.
7-4
financial markets. In addition, the findings of the study suggest that inaccurate assessment of a
firm’s Superfund liabilities may lead markets to over- or under-value the firm.
The results of the Campbell et al. and Barth and McNichols studies imply that reductions in
uncertainty similar to those likely to result from the proposed rule affect the valuation of
regulated firms. These changes in valuation reflect investors’ expectations of future profitability,
which may lead investors to more efficiently allocate capital across the economy. To the extent
that capital is reallocated to investments yielding a higher return, this would increase the
productive capacity of the economy.71
7.2.2 Disclosure and Market Valuation
While the literature examining the relationship between market valuation and environmental
liability uncertainty includes only a minimal number of studies, several peer-reviewed papers
quantify the impact of disclosing these liabilities on a firm’s market valuation. This literature
may provide useful insights into the potential financial market benefits of the proposed rule
because disclosure, like financial responsibility, reduces uncertainty about a company’s ability to
meet its financial obligations.
Campbell et al. (2001)72 examines the effects of disclosing Superfund liabilities on a firm’s
market value for the U.S. chemical industry from 1987 to 1992. The paper focuses on disclosures
related to the cost of remediation and the allocation of the cleanup costs across potentially
responsible parties (PRPs). Consistent with the “efficient market hypothesis”73 the authors find
that financial disclosures related to Superfund liabilities provide the market with additional
information, thus reducing the uncertainty surrounding the value of a company and enabling a
more informed valuation of liabilities. In addition, when a firm’s site-specific uncertainty (i.e.,
uncertainty related to cleanup costs at the sites it owns) is high, the authors found a positive
correlation between financial disclosures related to Superfund liabilities and market valuation.74
That is, the disclosure of Superfund liabilities had a positive impact on firms’ market value
because of reduced uncertainty.
Blacconiere and Patten (1994)75 analyze the relationship between a firm’s environmental
disclosures and the decline in its share price after a major environmental event, such as a
chemical leak. They find that more extensive environmental disclosures somewhat mitigate the
negative share price impacts after a chemical leak. Their conclusion suggests that environmental
disclosures enable the market to value companies’ risks more accurately by reducing the
uncertainty surrounding the financial implications of the environmental event. These results
71 Solow, Robert M. "A Contribution to the Theory of Economic Growth." Quarterly Journal of Economics 70, no.
1: 65-94.1956. 72 Campbell, Katherine, Stephan E. Sefcik, and Naomi S. Soderstrom. “Disclosure of Private Information and
Reduction of Uncertainty: Environmental Liabilities in the Chemical Industry.” Review of Quantitative Finance and
Accounting 21: 349–378. 2001. 73 The efficient market hypothesis argues that the market value of a firm (i.e., stock price) reflects all available
information. 74 This relationship was statistically significant only when the amount of information disclosed was high. 75 Blacconiere, W.G., and D.M. Patten. “Environmental disclosures, regulatory costs and changes in share value.”
Journal of Accounting and Economics. 18: 357-377. 1994.
7-5
further suggest that increased disclosure helps financial markets react to such events more
efficiently.
Aerts et al. (2006)76 approaches the question differently by assessing the relationship between
corporate environmental disclosures and financial analysts’ earnings forecasts. The paper finds
that in general, increased environmental disclosures decrease the variation, or “dispersion”, of
analysts’ earnings forecasts for the specified company. This suggests that increased
environmental disclosure decreases uncertainty and enables financial analysts to value firms
more accurately, allowing investment capital to be allocated more efficiently.
Comier et al. (2009)77 examined the relationship between environmental disclosures and share
price volatility. The study focused on a sample of 137 non-financial firms from the Toronto
Stock Exchange, using data for 2004 and 2005. Based on the available disclosure information for
the 137 firms, the authors concluded that increased paper-based disclosure (i.e. disclosures
published in annual reports rather than on a company’s website) was correlated with a decrease
in share price volatility. This reduction in volatility suggests a decrease in market uncertainty,
enabling financial markets to operate more efficiently.
Other studies evaluate the effects of the type of disclosure on a company’s market valuation or
performance. Specifically, Cox and Douthett (2009) 78 analyze the relationship between
Generally Accepted Accounting Principles (GAAP) environmental disclosures in companies’
annual (10-K) reports and their profits by type of disclosure. The authors divide disclosures into
two categories, confirmatory and non-confirmatory. Confirmatory disclosures are designed to
confirm that the company’s profits have not been and will not be at the expense of the
environment, while non-confirmatory disclosures convey information without context and allow
the reader to draw their own conclusions. The paper finds that confirmatory disclosures result in
an increase in profits while non-confirmatory disclosures result in a reduction in profits.
Additionally, confirmatory and non-confirmatory GAAP disclosures both reduce market
valuation, though the reduction is less for confirmatory disclosures than for non-confirmatory
disclosure.
Moneva and Cuellar (2009)79 analyze the relationship between environmental reporting and
financial performance, based on a sample of publicly-traded Spanish companies for the period
1996 to 2004. This time frame captures a period of time with and without environmental
disclosure requirements. The paper first evaluates the presence of a market value impact
associated with financial versus non-financial environmental disclosures. The study concludes
that financial environmental disclosures impact a company’s market value, but non-financial
environmental disclosures do not. More specifically, according to the authors, investors perceive
non-financial disclosures as insignificant information. With respect to financial disclosures, the
study found that information pertaining to expenditures on environmental activities and
76 Aerts, Walter, Denis Cormier, and Michel Magnan. "Corporate environmental disclosure, financial markets and
the media: An international perspective." Ecological Economics 64.3 (2008): 643-659. 77 Cormier, Denis, Marie-Josee Ledoux and Michel Magnan, “The Informational Contribution of Social and
Environmental Disclosures for Investors.” 2009. 78 Cox, Carol A., and Edward B. Douthett, Jr. “Further Evidence on the Factors and Valuation Associated with the
Level of Environmental Liability Disclosures,” Academy of Accounting and Financial Studies Journal 13 (3): 2009. 79 Moneva, Jose M., and Beatriz Cuellar. “The Value Relevance of Financial and Non-Financial environmental
reporting.” Environmental and Resource Economics, 44 (3): 441-456. 2009
7-6
provisions for contingencies have a negative impact on a firm’s market valuation. The authors
explain that investors do not perceive environmental expenditures and contingencies as future
improvements but rather as expenses that result in lower future earnings. However, disclosures
including information on a firm’s R&D intensity have a positive effect on a firm’s market
valuation. In addition, the study examined the impact that the introduction of environmental
reporting regulations had on the market valuation significance of disclosures. The authors
explain that disclosures became more significant to market valuation after the introduction of
reporting regulations. Although the results of this study can be generalized only for firms in
Spain, the basic relationship is important to note for the purposes of evaluating the proposed rule.
The paper suggests that financial disclosures, especially after disclosure regulations were
enacted, became value relevant.
7.2.3 Impact of Disclosure on Cost of Capital
Similarly to the studies summarized above, several papers also analyze the effects of disclosures
on a firm’s cost of capital. Focusing on firms in five major U.S. industries (oil and gas, chemical,
food/beverage, pharmaceutical, and electric utilities) for the 2000-2005 period, Plumlee et al.
(2009) 80 find that the quality of voluntary environmental disclosure is positively related to the
cost of capital. In contrast, Clarkson et al. (2010) 81, analyzes the impact of voluntary
environmental disclosures (in standalone environmental reports, corporate social responsibility
reports, and corporate web sites) on the cost of capital and firm value. The study analyzes a
sample of firms across five major polluting industries (pulp and paper, chemicals, oil and gas,
metals and mining, and utilities) for the years 2003 and 2006. Across multiple model
specifications, Clarkson et al. (2010)82 find that voluntary environmental disclosures are not
associated with a firm’s cost of capital. Thus, unlike most of the other studies reviewed in this
section, this paper suggests that disclosure would not significantly affect the efficiency of
financial markets.
Botosan (1997) 83 estimates the relationship between voluntary environmental disclosures and the
cost of capital based on a disclosure index. Botosan’s disclosure index produces a cross-sectional
ranking of disclosure levels based on the amount of voluntary disclosure provided in annual
reports. The index focuses on five categories of disclosure from annual reports: background
information, historical results, non-financial statistics, projected information (e.g., forecasted
market share and cash flow), and management discussion and analysis. Botosan’s analysis also
accounts for firms’ analyst following as a measure of disclosure not reflected in annual reports.
This captures information disclosed to analysts that is not included in annual reports. Using this
approach, Botosan found a negative relationship between disclosures and the cost of capital for
80 Plumlee, M., D. Brown, and S. Marshall. “Voluntary environmental disclosure quality and firm value: the role of
venue and industry type.” Working Paper. University of Utah. 2009. 81 Clarkson, Peter M., Xiao Hua Fang, Yue Li, and Gordon Richardson. “The Relevance of Environmental
Disclosures for Investors and Other Stakeholder Groups: Which Audience are Firms Speaking to?” working paper.
2010. 82 Clarkson, Peter M., Xiao Hua Fang, Yue Li, and Gordon Richardson. “The Relevance of Environmental
Disclosures for Investors and Other Stakeholder Groups: Which Audience are Firms Speaking to?” working paper.
2010. 83 Botosan, C. “Disclosure level and the cost of equity capital.” The Accounting Review. 72: 323-349. 1997.
7-7
firms without a close analyst following but found no such relationship for firms that have a close
analyst following. Botosan concludes that this result reflects the fact that firms with a high
analyst following make information available to analysts that is not available in annual reports.
Therefore, the information made available to analysts preempts or negates any cost of capital
effect that may result from the annual report disclosures observed in the model.
Similar to Botosan, Richardson and Welker (2001)84 assess the impacts of both disclosure and a
firm’s analyst following on the cost of capital. The authors quantify disclosure using an index
that captures the completeness and level of information included in specific disclosures.
Examining the impact of both financial and social disclosures85 for Canadian firms between 1990
and 1992, the study found that an increase in the index score for financial disclosures reduces the
cost of capital, but only for firms with a low analyst following. This is consistent with the result
from Botosan (1997).86 In contrast, Richardson and Welker find that an increase in the index
score for social disclosures increases the cost of capital.
Dhaliwal et al. (2009)87 examines the relationship between the cost of capital and voluntary non-
financial social corporate disclosures (Corporate Social Responsibility “CSR”). The paper finds
that firms with CSR performance superior to their industry peers experience a negative
relationship between CSR disclosure and the cost of capital.88 However, there is no significant
relationship between CSR disclosure and the cost of capital for firms with lower CSR
performance.
7.2.4 Implications
The body of evidence from the studies described in this section suggests that the disclosure of
information related to environmental liabilities is likely to affect firms’ market value as well as
their cost of capital. Both of these effects help participants in financial markets allocate capital
resources more efficiently, expanding the productive capacity of the economy and, by extension,
potentially increasing economic output and income. These changes in financial markets and the
broader economy reflect the reduction in uncertainty associated with disclosure as well as the
information contained in disclosures. In the context of the proposed rule, EPA expects that the
CERCLA financial responsibility requirements will also reduce uncertainty and provide
information to markets regarding firms’ ability to cover their CERCLA liabilities.
84 Richardson, Alan J., and Michael Welker. “Social disclosure, financial disclosure and the cost of equity capital.”
Accounting, Organizations and Society 26: 597-616. 2001. 85 Financial disclosures include information pertaining to a firm’s financial performance. Social disclosures include
information pertaining to a firm’s social performance (i.e. dedication to environmental practices or donations to a
charity) 86 Botosan, C. “Disclosure level and the cost of equity capital.” The Accounting Review. 72: 323-349. 1997. 87 Dhaliwal, Dan, and Albert Tsang. “Voluntary Non-Financial Disclosure and the Cost of Equity Capital: The Case
of Corporate Social Responsibility Reporting.” 2009. 88 The paper uses a CSR strength ranking score that accounts for a company’s: community involvement, corporate
governance, diversity, employee relations, environment, human rights, and product.
7-8
7.3 Improvements in Environmental Performance
Financial assurance may provide incentives for owners and operators of hardrock mining
facilities to improve their environmental performance relative to baseline conditions. To the
extent that the costs of obtaining financial responsibility are linked to firms’ potential CERCLA
liabilities, firms will have an incentive to minimize these liabilities, by taking actions to reduce
the probability and magnitude of these future liabilities. In addition, when regulated entities rely
on a letter of credit, insurance policy, or other third-party instrument to meet financial
responsibility requirements, the issuer will have an incentive to require sound environmental
management as a condition for providing access to these instruments. Although improved
environmental performance may carry costs associated with purchasing equipment, improving
management practices, and other activities, EPA assumes that such costs will be rationally
incurred, such that the overall net benefit (benefit less cost) is positive.
The following sections review the available literature on the relationship between financial
responsibility regimes and environmental performance and discuss the benefits improved
environmental performance by hardrock mining facilities would provide to impaired and scenic
rivers.
7.3.1 Literature on Environmental Performance and Financial Responsibility
The magnitude of these benefits in the context of the proposed rule is contingent upon changes in
behavior among regulated entities to reduce the environmental risk associated with their
hardrock mining operations. The degree to which the proposed rule would result in such change
is uncertain, but the literature examining the relationship between environmental performance
and financial responsibility provides insights into the potential for such changes. Much of this
literature is theoretical in that it describes the conceptual foundations for this relationship; few
studies have attempted to quantify changes in environmental performance associated with
financial responsibility or similar mechanisms.
The limited empirical literature on this topic focuses on financial assurance in the context of
underground storage tank (UST) cleanup programs. In one empirical study, Yin (2005)89
examines UST facility releases under two assurance regimes: government assurance programs
without risk-based pricing mechanisms and private insurance with risk-based premiums.
Focusing on UST releases in Illinois, Indiana, and Michigan, Yin finds that the introduction of
risk-based premiums in Michigan mitigated moral hazard and encouraged risk reduction
behaviors among the insured. More specifically, Michigan’s transition to risk-based pricing
mechanisms helped to reduce the UST facility release rate and improve overall environmental
performance. In all, eliminating the state-level government assurance program and switching to
private insurance markets reduced the frequency of underground fuel tank leaks by
approximately 21 percent. Yin estimates that approximately 2,500 UST releases were avoided
from 1996 to 2003 because of the transition to private insurance.
89 Yin, David Hai-Tao (2005). “Risk-Based Pricing and Risk Prevention: Does the Private Insurance Market Help
Reduce UST Release Rates?”, working paper, November 15, 2005.
7-9
Yin et al. (2009)90 similarly find that UST facilities with private insurance are less likely to have
accidental fuel tank leaks than UST facilities participating in state assurance fund programs.
Using the same data set as Yin (2005), Yin et al. (2009) present empirical evidence indicating
that the reduction in Michigan’s release rate exceeded the reduction in adjacent states (with state
assurance programs) by 20 percent after Michigan required UST owners/operators to obtain
insurance in private markets, where premiums are based on risk. Overall, Yin et al. (2009)
estimate that this policy change prevented more than 3,000 fuel tank releases at UST facilities
over an eight-year period, representing approximately $400 million in avoided cleanup costs.91
Yin et al.(2009)92 note that these savings and the more rapid reduction in the release rate in
Michigan may reflect two changes in behavior among UST owners/operators. First, owners may
have made capital investments and improved maintenance practices to reduce the likelihood of a
tank system leak. Because tank insurance premiums are dependent on factors such as (1) tank
and piping material and coatings, (2) tank design (single- or double-walled), (3) whether tank
maintenance is performed by a third-party provider approved by the insurer93, and (4) the history
of prior leaks at the facility, tank owner/operators are, in effect, rewarded for improving their
environmental performance. The second change in behavior highlighted by Yin et al. (2009) is
that an owner may opt to close a leak-prone facility entirely, thus reducing releases from that
facility. This may occur at facilities where the risk of a leak and cost of insurance are both high.
Many of the behavioral dynamics highlighted in the Yin (2005) and Yin et al. (2009) studies
would apply directly to hardrock mining companies affected by the CERCLA financial assurance
requirements. Under current regulation, Superfund site remediation is often financed by
Superfund itself in cases where site owners are insolvent. This funding mechanism is similar to
state assurance programs for USTs in that it provides a more limited incentive for environmental
performance. The financial assurance requirements included in the proposed rule, however,
would (partially) shift the financing of remediation from Superfund as a collective financing
mechanism to individual site owners; thus causing these owners to further internalize the
negative externality they would have potentially imposed in the future. To comply with these
requirements, affected firms may obtain financial assurance in private markets, where banks,
insurers, and other financial institutions will price assurance instruments based on risk, much like
the insurance purchased by UST owners in Michigan. To minimize the cost of obtaining
90 Yin, Hai-tao, Kunreuther, Howard, and White, Mathew (2009). “Risk-Based Pricing and Risk-Reducing Effort:
Does the Private Insurance Market Reduce Environmental Accidents?” National Bureau of Economic Research.
June 2009. 91 The data indicate that on an average annual basis, Michigan’s total release rate fell from 6.51 to 2.56 per 100
facilities before-versus-after the policy change, a drop of 60.6 percent. By contrast, the total release rate in Illinois
was lower initially and declined by less: 5.23 to 2.82 per 100 facilities, a reduction of 46.2 percent. The ratio of
relative risk changes (60.6 / 46.2), known generally as the etiologic ratio, is 1.31. It indicates that Michigan’s
relative risk reduction exceeded Illinois’ by 31 percent. The relative risk reduction in Michigan exceeded Indiana’s
by a similar amount, 24 percent. 92 Yin, Hai-tao, Kunreuther, Howard, and White, Mathew (2009). “Risk-Based Pricing and Risk-Reducing Effort:
Does the Private Insurance Market Reduce Environmental Accidents?” National Bureau of Economic Research.
June 2009. 93 For example, the American Insurance Group’s Environmental Insurance unit provides premium discounts to tank
system owners who purchase compliance management and monitoring services from Tanknology-NDE
International, a firm that specializes in tank system engineering and monitoring equipment.
7-10
financial assurance, hardrock mining firms will have an incentive to implement measures that
would reduce risk, including measures that would improve environmental performance and
reduce the probability (and perhaps magnitude) of site contamination. For example, mines and
mineral processors could put various mechanisms in place to improve the treatment of
wastewater, promote better management of tailings and waste rock, encourage more efficient
metal recovery technologies, and minimize acid drainage (from either mines or from waste rock
and tailings disposal areas), thus reducing the environmental damage per unit of output (i.e.,
reducing the marginal negative externality).94 At the same time, just as Yin et al. (2009) note that
some UST facilities may close, by causing mines to further internalize the negative externality,
the proposed rule may lead to partial equilibrium effects, reducing the level of output from
hardrock mines and processors and the associated environmental damage.95
Similar to the arguments of Yin (2005) and Yin et al. (2009), Boyd and Kunreuther (1995)96
argue that market-based enforcement mechanisms promote UST safety though risk-based
premiums and the potential denial of coverage. They also note that financial responsibility
requirements (FRRs) are particularly desirable for the regulation of USTs. FRRs provide a direct
incentive for firms to upgrade tanks and mitigate existing pollution sources, as firms must bear
the costs of any future liabilities with their own resources or via private insurance coverage.
Other work by Boyd (1996, 2001)97 expands beyond underground storage tanks and argues that
there is a strong incentive for the provider of financial assurance to monitor environmental safety
in order to guard against moral hazard. That is, it is in the best interest of third parties providing
financial instruments to effectively monitor the environmental performance of the firm. This
monitoring may lead to improvements in the environmental performance of the assured firm.
Offering additional data indicating that financial responsibility may improve environmental
performance, Miller (1998)98 summarizes the results of a survey asking member companies of
the International Council on Metals and the Environment whether environmental surety
instruments promote environmental protection. Survey respondents indicated that assurance
instruments may have particular application for small, one-property operators and are effective
for enforcing environmental responsibility among these operators. Miller (2005) echoes this view
stating that smaller companies may not have the financial resources to reclaim sites if they are no
longer viable.
94 These particular issues were identified as areas of environmental concern in EPA’s National Hardrock Mining
Framework, September 1997. Available at: http://www.epa.gov/aml/policy/hardrock.pdf. 95 For a theoretical explanation please see Appendix A in US EPA’s “Guidelines for Preparing Economic Analyses”,
December 2010. Available at: https://yosemite.epa.gov/ee/epa/eerm.nsf/vwAN/EE-0568-50.pdf/$file/EE-0568-
50.pdf. 96 Boyd, James; Kunreuther, Howard. “Retrospective Liability and Future Risk: The Optimal Regulation of
Underground Storage Tanks.” Resources for the Future: Discussion Paper 96-02. October 1995. 97 Boyd, James. “Banking on “Green Money”: Are Environmental Financial Responsibility Rules Fulfilling their
Promise?” Resources for the Future: Discussion Paper 96-26. July 1996; and Boyd, James. “Financial Responsibility
for Environmental Obligations: Are Bonding and Assurance Rules Fulfilling Their Promise?” Resources for the
Futures: Discussion Paper 01-42. August 2001. 98 Miller, George C. “Use of financial surety for environmental purposes.” A study prepared for the International
Council on Metals and the Environment. October 1998.
7-11
On a broad conceptual level, Peck and Sinding (2009)99 assert that financial assurance
instruments are increasingly accepted by industry as perhaps the most effective manner with
which to ensure that environmental protection can be achieved and that public expectations can
be met in the mining sphere. The authors note that financial assurance protects against unfunded
reclamation needs and that posting financial assurance is a form of environmental commitment
by mine and processor company managers. The authors also argue that concurrent remediation of
environmental (and social) impacts during the life of facilities would be more efficient than post-
mining cleanup.
An extensive body of literature examines the incentives that bonding requirements provide for
improvements in environmental performance. Kysar (2010)100 asserts that the pricing of surety
bond financial instruments provides incentives for environmental improvements because surety
companies price bonding services, in part, based on the estimated likelihood and severity of harm
occurring. This creates a strong incentive for firms to reduce the uncertainty surrounding their
activities, either by investing in the advancement of scientific knowledge or switching to less
dangerous alternative activities. Costanza and Perrings (1990)101 make similar arguments. In
addition, Mathis and Baker (2002)102 note that requiring firms to obtain environmental assurance
bonds (EABs) may induce firms to develop new production technologies that are less
environmentally harmful and invest in improved monitoring techniques. The combined effects of
these improvements would increase the likelihood that firms would be refunded the full amount
of their bonds and would reduce the cost of future EABs. Offering a slightly different perspective
on these incentives, Shogren, et al. (1992)103 contend that environmental bonds force firms to
internalize social welfare costs that are not reflected in the prices they charge to consumers, as
doing so is necessary to ensure the recovery of their bonds. This incentivizes firms to provide a
socially optimal level of pollution control, given the cost of shirking. Similarly, Spaeter and
Tsakis (2005)104 present a conceptual model showing that re-estimated environmental bond
contracts (i.e., bonds where the underlying cost of remediation is adjusted based on site
inspections) create an incentive for firms to invest in pollution prevention to avoid upward
revisions to the underlying value of the bond.
99 Peck, Philip and Sinding, Knud. “Financial assurance and mine closure: Stakeholder expectations and effects on
operating decisions.” Resources Policy 34 (2009), 227-233. 100 Kysar, Douglous. “Ecologic: Nanotechnology, Environmental Assurance Bonding, and Symmetric Humility.” 28
UCLA J. Environmental. Law & Policy 201 2010. Content downloaded/printed from HeinOnline: 4/13/2011. 101 Costanza, R. and Perrings, C. 1990. “A flexible assurance bonding system for improved environmental
management.” Ecological Economics, 2:57-75. 102 Mathis, Mitchell L. and Baker, Pamela B. (2002) ‘Assurance bonds: A tool for managing environmental costs in
aquaculture’. Aquaculture Economics & management, 6:1, 1-17. 103 Shogren, J.F., Herriges, J.A. and Govinfasamy, R., 1993. “Limits to environmental bonds.” Ecological
Economics, 8:109-133. 104 Spaeter, Sandrine and Tsakiris, Panagiotis (2005). “Environmental Risks and Financial Guarantees Improving
Prevention in the Mining Industry, working paper, January 2005.
7-12
Kahn et al. (2001)105 describe a system combining flexible performance bonds with insurance.
Under Kahn et al.’s proposed system, mines would not forfeit the full amount of the bond if they
failed to meet the minimum or optimum standards set forth in the bond, but would instead be
penalized in increments. This structure would help avoid situations where a mine loses the
incentive to maintain environmental quality because it falls just short of optimal ecological
standards and forfeits the full value of the bond. Thus, this bond would provide an incentive for
sound environmental performance as long as the mine has the prospect of being refunded a
portion of the bonded amount. Despite this advantage over traditional environmental bonds,
Kahn et al. argue these flexible bonding instruments would not necessarily be sufficient for post-
closure monitoring, maintenance, and preventive action. To address this issue, the authors
recommend that insurance to cover post-closure costs be purchased prior to receiving the
performance bond. The insurer would then have an incentive to ensure that the mine is closed
with an adequate margin of environmental safety and would also have an incentive hire a third-
party for monitoring and other prevention activities.
Poulin and Jacques (2008)106 also propose a combined bond and insurance system for the mining
sector. Because of remediation cost overruns, bonding is not always sufficient to finance the
cleanup of mining sites. Requiring insurance to cover these potential cost overruns would
enhance incentives to reduce uncertain environmental risks via improved technology or
management, as doing so would reduce the premium charged to a mine.
Although the proposed rule would not require the use of environmental assurance bonds and the
other instruments outlined above, the incentives that these instruments provide for improved
environmental performance would apply to other forms of financial assurance that hardrock
mining firms may secure under the proposed rule. Any third-party provider of a financial
assurance instrument will price that instrument based on (1) the likelihood that the assured party
will exercise the assurance instrument and (2) the expected value of the funding required by the
assured party. Both of these factors are partially dependent on the environmental performance of
assured firms. Thus, in the context of the proposed rule, financial assurance provides an
incentive for hardrock mining firms to reduce the magnitude of their environmental liabilities.
Operational changes instituted in response to these incentives may reduce pollution from the
hardrock mining sector.
Improved environmental performance may also have an associated cost—owners and operators
of the potentially regulated facilities may experience increased operational costs to implement
the improvement. However, EPA is unable to quantify this cost given the available data.
7.3.2 Effect on Impaired Waters and Wild and Scenic Rivers
Hardrock mining and processing facilities may adversely affect the environment through
hazardous substance releases to land, air, and surface water. In particular, acid mine drainage
(AMD) can cause releases of heavy metals and acidic water to watersheds that support
communities of aquatic organisms. The harmful effects of the introduction of AMD into waters
105 Kahn, James R., Franceschi, Dina, Curi, Adolson, and Vale, Eduardo. “Economic and financial aspects of mine
closure.” Natural Resources Forum 25 (2001), 265-274. 106 Poulin, Richard and Jacques, Michel. “Mine reclamation bonding and environmental insurance.” International
Journal of Risk Assessment and Management, Vol 7, No. 5, 2007.
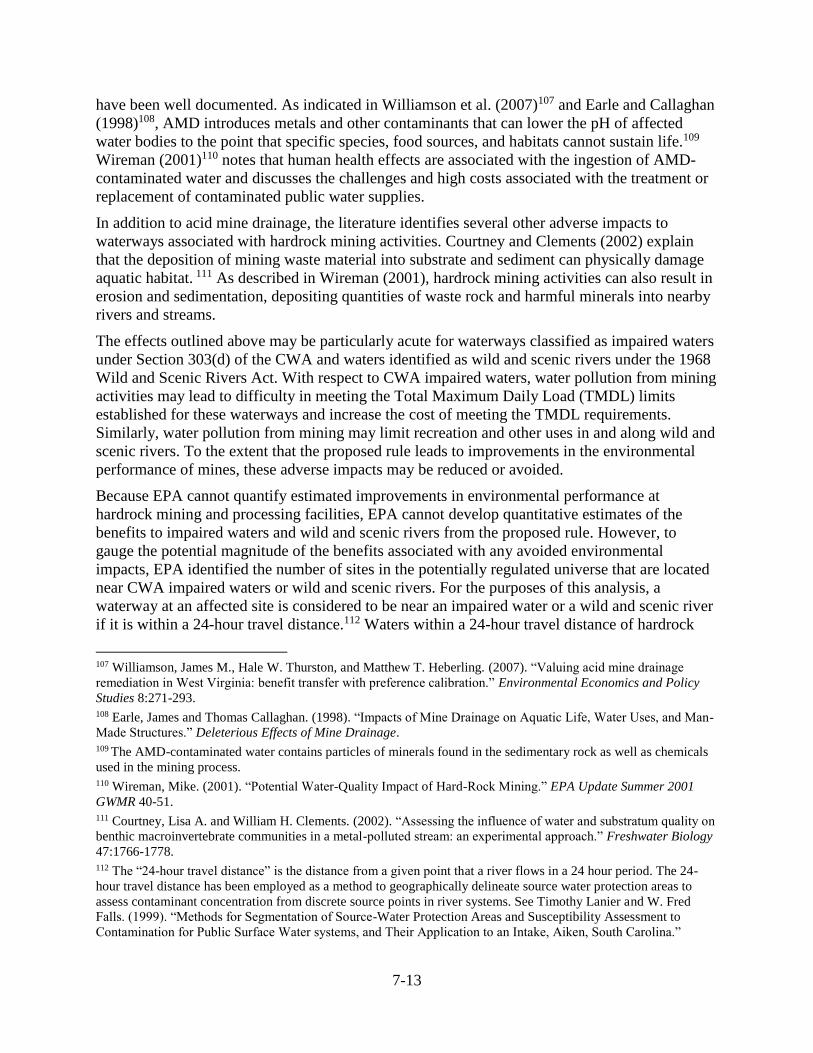
7-13
have been well documented. As indicated in Williamson et al. (2007)107 and Earle and Callaghan
(1998)108, AMD introduces metals and other contaminants that can lower the pH of affected
water bodies to the point that specific species, food sources, and habitats cannot sustain life.109
Wireman (2001)110 notes that human health effects are associated with the ingestion of AMD-
contaminated water and discusses the challenges and high costs associated with the treatment or
replacement of contaminated public water supplies.
In addition to acid mine drainage, the literature identifies several other adverse impacts to
waterways associated with hardrock mining activities. Courtney and Clements (2002) explain
that the deposition of mining waste material into substrate and sediment can physically damage
aquatic habitat. 111 As described in Wireman (2001), hardrock mining activities can also result in
erosion and sedimentation, depositing quantities of waste rock and harmful minerals into nearby
rivers and streams.
The effects outlined above may be particularly acute for waterways classified as impaired waters
under Section 303(d) of the CWA and waters identified as wild and scenic rivers under the 1968
Wild and Scenic Rivers Act. With respect to CWA impaired waters, water pollution from mining
activities may lead to difficulty in meeting the Total Maximum Daily Load (TMDL) limits
established for these waterways and increase the cost of meeting the TMDL requirements.
Similarly, water pollution from mining may limit recreation and other uses in and along wild and
scenic rivers. To the extent that the proposed rule leads to improvements in the environmental
performance of mines, these adverse impacts may be reduced or avoided.
Because EPA cannot quantify estimated improvements in environmental performance at
hardrock mining and processing facilities, EPA cannot develop quantitative estimates of the
benefits to impaired waters and wild and scenic rivers from the proposed rule. However, to
gauge the potential magnitude of the benefits associated with any avoided environmental
impacts, EPA identified the number of sites in the potentially regulated universe that are located
near CWA impaired waters or wild and scenic rivers. For the purposes of this analysis, a
waterway at an affected site is considered to be near an impaired water or a wild and scenic river
if it is within a 24-hour travel distance.112 Waters within a 24-hour travel distance of hardrock
107 Williamson, James M., Hale W. Thurston, and Matthew T. Heberling. (2007). “Valuing acid mine drainage
remediation in West Virginia: benefit transfer with preference calibration.” Environmental Economics and Policy
Studies 8:271-293. 108 Earle, James and Thomas Callaghan. (1998). “Impacts of Mine Drainage on Aquatic Life, Water Uses, and Man-
Made Structures.” Deleterious Effects of Mine Drainage. 109 The AMD-contaminated water contains particles of minerals found in the sedimentary rock as well as chemicals
used in the mining process. 110 Wireman, Mike. (2001). “Potential Water-Quality Impact of Hard-Rock Mining.” EPA Update Summer 2001
GWMR 40-51. 111 Courtney, Lisa A. and William H. Clements. (2002). “Assessing the influence of water and substratum quality on
benthic macroinvertebrate communities in a metal-polluted stream: an experimental approach.” Freshwater Biology
47:1766-1778. 112 The “24-hour travel distance” is the distance from a given point that a river flows in a 24 hour period. The 24-
hour travel distance has been employed as a method to geographically delineate source water protection areas to
assess contaminant concentration from discrete source points in river systems. See Timothy Lanier and W. Fred
Falls. (1999). “Methods for Segmentation of Source-Water Protection Areas and Susceptibility Assessment to
Contamination for Public Surface Water systems, and Their Application to an Intake, Aiken, South Carolina.”
7-14
mining and processing facilities were identified in ArcGIS using the National Hydrography
Dataset Plus, jointly developed by EPA and USGS.113
Of the 221 facilities in the potentially regulated universe, EPA identified the status of waterways
adjacent to 172 facilities. Out of these 172 facilities, 43 facilities, or approximately 25 percent,
are located near CWA section 303(d) impaired waters. Only one facility was located within a 24-
hour travel distance of a wild and scenic river. Assuming that the 172 facilities are representative
of the full included universe, the proposed rule is likely to yield greater benefits for CWA
impaired waters than wild and scenic rivers. Exhibit 7-1 presents a breakdown of the facilities
near CWA impaired waters by state. As the exhibit demonstrates, the majority of the 43 facilities
located near CWA impaired waters are concentrated in western states and particularly in
Arizona, Idaho, and Nevada.
Exhibit 7-1.
Facilities Within 24-Hour Travel Distance of CWA
Impaired Waters by State114
Proceedings of the 1999 Georgia Water Resources Conference. Ed. Kathryn J. Hatcher. EPA uses the 24-hour travel
distance as the boundary of impact analyses on affected ecological receptors in proximity to contaminant sources
and to determine assessment areas for analyses of surface water systems. See U.S. Environmental Protection Agency
(U.S. EPA). (2006). “How-To Manual: Update and Enhance Your Local Source Water Protection Assessments.”
Office of Water: EPA816-8-06-004. 113 U.S. EPA and the USGS. (2006). “National Hydrography Dataset Plus – NHDPlus.” 114 “Other States” include Utah, Missouri, Florida, New Mexico, Mississippi, Tennessee, Pennsylvania, and
Oklahoma. All of these states have one facility located near CWA impaired waters.
7-15
7.4 Speed of Site Cleanups
In cases where the owner or operator of a site is insolvent or otherwise unable to pay for site
remediation, the securing of cleanup funds through financial assurance may allow remediation to
begin more quickly than would otherwise be possible. If a site owner or operator defaults on its
Superfund obligations under the baseline, EPA typically assumes responsibility for cleanup. Due
to budget constraints, however, the Agency does not usually initiate remediation of the site
immediately upon taking on this responsibility. EPA instead places the site in a queue of
remediation projects ranked according to the risk they pose to human health and the
environment. A site may remain in this queue for an extended period of time. During this time,
contamination from the site may damage the local environment. Moreover, in some cases, the
spatial extent of contamination may spread, causing more damage and increasing the costs of the
eventual cleanup.
Under the financial responsibility requirements outlined in the proposed rule, the cleanup of sites
owned by companies in default could begin more rapidly than under the baseline. Because
funding for site remediation would be secured prior to a company’s insolvency, the initiation of
cleanup would not be delayed by EPA’s budget constraints. In addition, the expeditious initiation
of cleanups under this scenario would help avoid much of the environmental degradation that
would occur in the baseline between the time of default and the beginning of the eventual
cleanup effort.
The extent to which the proposed rule would hasten the initiation of site cleanups is uncertain. Ex
ante, it is not clear how quickly site cleanups would begin under the proposed financial
responsibility requirements. Although funds would be available, a responsible party or EPA
would still need to select a remedy for affected sites and hire an engineering firm to conduct the
remediation once the funds have been released from the instrument.
8-1
Chapter 8.
Equity Considerations and Other Impacts
8.1 Introduction
As required by applicable statutes and executive orders, this chapter summarizes EPA’s analyses
of equity considerations and other regulatory concerns associated with the proposed CERCLA
108(b) rule. This chapter assesses potential impacts with respect to the following issues:
Impacts on small business and governments: EPA’s regulatory flexibility
analysis considers the potential for regulatory costs to have a significant impact
on a substantial number of small entities (SISNOSE).
Environmental justice: EPA analyzes the characteristics of the populations
living in proximity to hard-rock mines and mineral processors to determine
potential environmental justice concerns of the CERCLA 108(b) rulemaking.
Executive Order 13211: Actions that Significantly Affect Energy Supply,
Distribution, or Use: EPA considers the potential for this regulation to affect the
supply, distribution, or use of energy, including changes in the price of fuel.
Children’s health impacts: EPA considers the potential for the proposed
CERCLA 108(b) regulation to have a significant or disproportionate impact on
the health of children.
Regulatory planning and review 12866: EPA must examine whether the
regulatory action is “significant” and therefore subject to review by the Office of
Management and Budget (OMB).
Unfunded mandates analysis: EPA describes prior consultation with
representatives of affected state, local, and tribal governments.
Federalism: EPA considers potential issues related to state sovereignty.
Tribal governments: EPA evaluates federal unfunded mandates that include
impacts on tribal governments and their communities.
8.2 Impacts on Small Business and Governments: Regulatory Flexibility
Analysis
The Regulatory Flexibility Act (RFA) as amended by the Small Business Regulatory
Enforcement Fairness Act of 1996 (SBREFA), 5 USC 601 et seq., generally requires EPA to
prepare a regulatory flexibility analysis of any regulation subject to notice and comment under
the Administrative Procedure Act or any other statute. For the Proposed Rule, this analysis takes
the form of an initial regulatory flexibility analysis (IRFA). This analysis must be completed
unless the agency certifies that the regulation will not have a significant economic impact on a
substantial number of small entities. If a regulation is found to have a significant impact on a
substantial number of small entities, further analysis must be performed to determine what can
be done to lessen the impact. Small entities include small businesses, small organizations, and
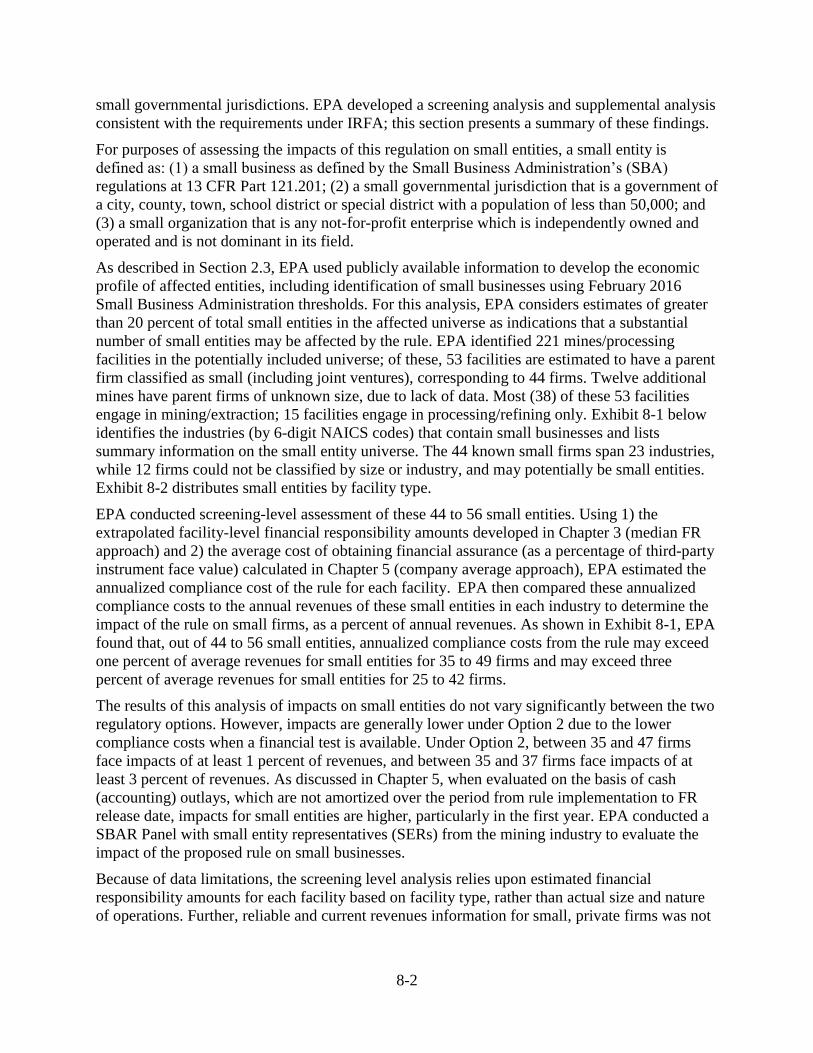
8-2
small governmental jurisdictions. EPA developed a screening analysis and supplemental analysis
consistent with the requirements under IRFA; this section presents a summary of these findings.
For purposes of assessing the impacts of this regulation on small entities, a small entity is
defined as: (1) a small business as defined by the Small Business Administration’s (SBA)
regulations at 13 CFR Part 121.201; (2) a small governmental jurisdiction that is a government of
a city, county, town, school district or special district with a population of less than 50,000; and
(3) a small organization that is any not-for-profit enterprise which is independently owned and
operated and is not dominant in its field.
As described in Section 2.3, EPA used publicly available information to develop the economic
profile of affected entities, including identification of small businesses using February 2016
Small Business Administration thresholds. For this analysis, EPA considers estimates of greater
than 20 percent of total small entities in the affected universe as indications that a substantial
number of small entities may be affected by the rule. EPA identified 221 mines/processing
facilities in the potentially included universe; of these, 53 facilities are estimated to have a parent
firm classified as small (including joint ventures), corresponding to 44 firms. Twelve additional
mines have parent firms of unknown size, due to lack of data. Most (38) of these 53 facilities
engage in mining/extraction; 15 facilities engage in processing/refining only. Exhibit 8-1 below
identifies the industries (by 6-digit NAICS codes) that contain small businesses and lists
summary information on the small entity universe. The 44 known small firms span 23 industries,
while 12 firms could not be classified by size or industry, and may potentially be small entities.
Exhibit 8-2 distributes small entities by facility type.
EPA conducted screening-level assessment of these 44 to 56 small entities. Using 1) the
extrapolated facility-level financial responsibility amounts developed in Chapter 3 (median FR
approach) and 2) the average cost of obtaining financial assurance (as a percentage of third-party
instrument face value) calculated in Chapter 5 (company average approach), EPA estimated the
annualized compliance cost of the rule for each facility. EPA then compared these annualized
compliance costs to the annual revenues of these small entities in each industry to determine the
impact of the rule on small firms, as a percent of annual revenues. As shown in Exhibit 8-1, EPA
found that, out of 44 to 56 small entities, annualized compliance costs from the rule may exceed
one percent of average revenues for small entities for 35 to 49 firms and may exceed three
percent of average revenues for small entities for 25 to 42 firms.
The results of this analysis of impacts on small entities do not vary significantly between the two
regulatory options. However, impacts are generally lower under Option 2 due to the lower
compliance costs when a financial test is available. Under Option 2, between 35 and 47 firms
face impacts of at least 1 percent of revenues, and between 35 and 37 firms face impacts of at
least 3 percent of revenues. As discussed in Chapter 5, when evaluated on the basis of cash
(accounting) outlays, which are not amortized over the period from rule implementation to FR
release date, impacts for small entities are higher, particularly in the first year. EPA conducted a
SBAR Panel with small entity representatives (SERs) from the mining industry to evaluate the
impact of the proposed rule on small businesses.
Because of data limitations, the screening level analysis relies upon estimated financial
responsibility amounts for each facility based on facility type, rather than actual size and nature
of operations. Further, reliable and current revenues information for small, private firms was not

8-3
readily available. As a result, these results are not suggestive of impacts for any specific
company or entity.
8-4
Exhibit 8-1.
Summary of Small Business Statistics (Company Revenues)
NAICS
Code Industry
SBA Small Business Size
Standard (As of
February 2016)
Number of
Small
Firms
Average
Annual
Revenues of
Small
Firms
($Millions)
Average
Number of
Employees
of Small
Firms
Number of Small
Firms Facing
Annual
Compliance Costs
>1% (Median)*
Number of Small
Firms Facing
Annual
Compliance Costs
>3% (Median)*
Revenues
($Millions) Employees
211111 Crude Petroleum and Natural Gas Extraction 1250 1 $61 194 1 0-1
212210 Iron Ore Mining 750 1 $100 475 1 0-1
212221 Gold Ore Mining 1500 10 $96 261 6-7 5-6
212234 Copper Ore and Nickel Ore Mining 1500 5 $22 80 5 4
212291 Uranium-Radium-Vanadium Ore Mining 250 2 $15 48 1 0-1
212392 Phosphate Rock Mining 1000 1 <$1 6 1 1
212393 Other Chemical and Fertilizer Mineral Mining 500 1 <$1 3 1 1
212399 All Other Nonmetallic Mineral Mining 500 3 $329 173 2 2
213114 Support Activities for Metal Mining 20.5 2 <$1 7 2 2
213115
Support Activities for Nonmetallic Minerals
(except Fuels) 7.5 1 <$1 2 1 1
236115
New Single-family Housing Construction (Except
For-Sale Builders) 36.5 1 $8 10 1 0
238910 Site Preparation Contractors 15 2 $2 100 2 1
325180 Other Basic Inorganic Chemical Manufacturing 1000 2 $168 295 0-1 0
325312 Phosphatic Fertilizer Manufacturing 750 1 $47 315 1 0-1
327992
Ground or Treated Mineral and Earth
Manufacturing 500 2 $32 111 2 1
331313
Alumina Refining and Primary Aluminum
Production 1000 1 $2 550 1 1
331410
Nonferrous Metal (except Aluminum) Smelting and
Refining 1000 1 $13 83 1 0
331491
Nonferrous Metal (except Copper and Aluminum)
Rolling, Drawing and Extruding 750 1 $34 500 1 1
423520
Coal and Other Mineral and Ore Merchant
Wholesalers 100 1 $15 54 0 0
522390 Other Activities Related to Credit Intermediation 20.5 1 <$1 1 1 1
551112 Offices of Other Holding Companies 20.5 2 <$1 2 2 2
561499 All Other Business Support Services 15 1 <$1 1 1 1
561990 All Other Support Services 11 1 <$1 2 1 1
Unknown Unknown
Up to 12
additional
firms Unknown Unknown
Up to 12 additional
firms
Up to 12
additional firms
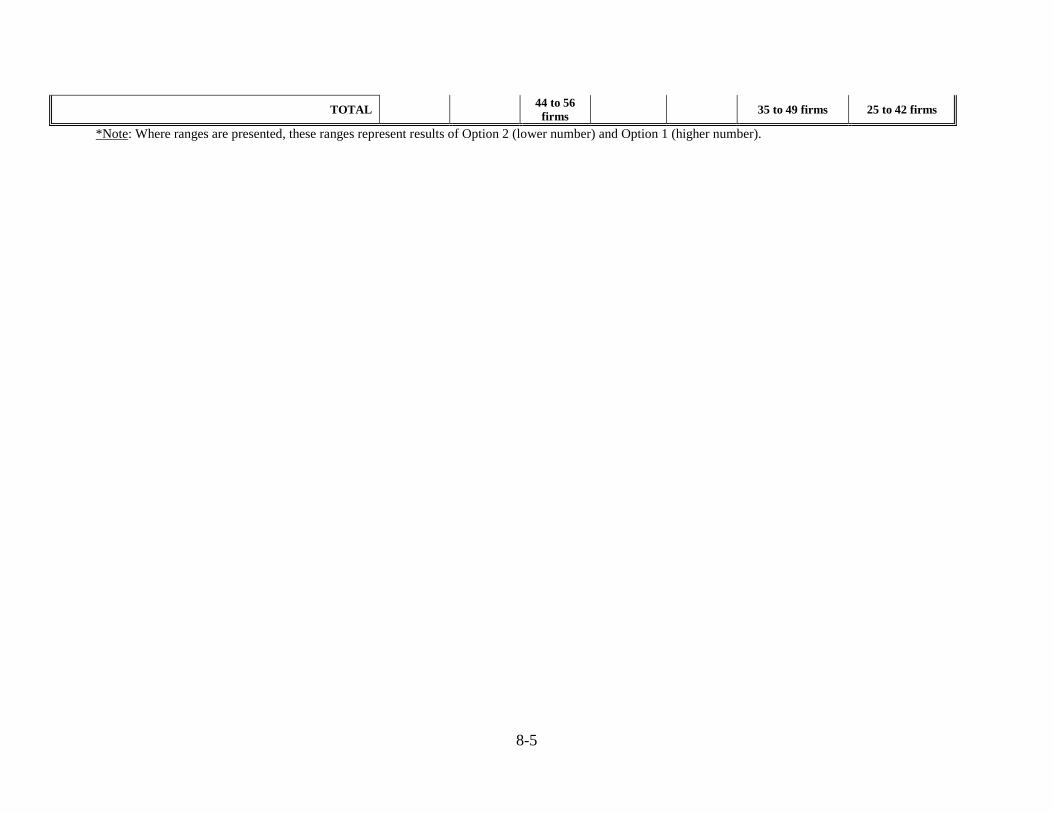
8-5
TOTAL 44 to 56
firms 35 to 49 firms 25 to 42 firms
*Note: Where ranges are presented, these ranges represent results of Option 2 (lower number) and Option 1 (higher number).
8-6
Exhibit 8-2.
Distribution of Small Entities by Facility Type
Facility Type
Facilities Owned by
Small Companies
Facilities Owned by
Unknown Companies
Brine Extraction/Processing 0 0
In-situ Recovery 5 0
Processor/Refiner 14 4
Surface Mine 16 4
Surface Mine/Processing 3 0
Underground Mine 14 4
Primary Smelter 1 0
TOTAL 53 12
8.3 Environmental Justice
Executive Order 12898, Federal Actions to Address Environmental Justice in Minority
Populations and Low-Income Populations, requires EPA to conduct an environmental justice
analysis as part of the CERCLA 108(b) hardrock mining and primary processing regulatory
impact analysis.115 Specifically, the executive order requires EPA to identify and address any
disproportionately high and adverse human health or environmental impacts of the CERCLA
108(b) rulemaking on minority or low-income populations.
This analysis considers the spatial distribution of low-income and minority groups to determine
whether these groups are more or less represented in the populations in proximity to hardrock
mining and mineral processing sites. Groups within the specified distance radii from the mining
site are expected to benefit from the environmental performance improvement and other benefits
of the rule. If the population within a specified radii distance has a larger proportion of minority
or low-income families than the state or national average, it may indicate that the proposed rule
may benefit communities that have been historically exposed to a disproportionate share of
environmental impacts and thus contribute to redressing existing EJ concerns.
EPA’s preliminary screening analysis indicates that, overall, the populations surrounding
hardrock mining and processing facilities have minority concentrations and poverty rates that are
generally similar to state and national averages. However, EPA identified a number of census
block groups in close proximity to hardrock mining and primary processing facilities within the
potentially regulated universe with potential environmental justice concerns. These concerns
include poverty levels and percent of minority population (particularly Hispanic or Latino origin
and American Indian/Alaska Native) higher than respective state or national averages.
EPA identified and analyzed the demographic characteristics of populations in close proximity to
the mines and processors that constitute the 108(b) universe. The analysis relies on geographic
information on the locations of currently operating facilities, and demographic data from the U.S.
Census Bureau’s 2014 five-year American Community Survey (ACS). The universe reviewed in
115 59 FR 7629, Feb. 16, 1994.
8-7
this RIA contains 221 potentially regulated facilities. The locations of these facilities were
identified primarily through the Mines Data Set available from the MSHA.116, 117
To evaluate the demographic characteristics of populations in close proximity to the hardrock
mines and primary processors that make up the potentially regulated universe, EPA identified the
census block groups located partially or wholly within one mile, five mile, 15 mile, and 25 mile
radii of hardrock mining and primary processing facilities. Block groups are the smallest
statistical areas for which the U.S. Census Bureau publishes ACS demographic data. Most block
groups (nearly 90 percent) contain between 600 and 3,000 people, though some block groups
contain no population, and more than 35,000 people live in the largest block group. Geographic
information on the boundaries of each block group was accessed through a U.S. Census Bureau
GIS dataset.118
The block groups identified in the western United States cover a much larger area than the block
groups identified in the eastern United States. However, due to higher population densities, a
significantly larger number of block groups and people are located within close proximity to the
mining facilities in the eastern United States.
The number of block groups identified varied considerably among each of the four distance
criteria. Of the 220,333 block groups in the United States:
634 block groups fall partially or wholly within a one mile radius of a potentially
regulated facility.
4,203 block groups fall partially or wholly within a five mile radius of a
potentially regulated facility.
17,905 block groups fall partially or wholly within a 15 mile radius of a
potentially regulated facility.
33,401 block groups fall partially or wholly within a 25 mile radius of a
potentially regulated facility.
The demographic characteristics of the people living within these block groups were identified
and compared to national averages, as shown in Exhibit 8-3. Specifically, EPA examined the
number and percentage of people in these block groups living in poverty, as defined by the 2014
five-year ACS, and the percentage of people in these block groups that belong to minority
groups.
Approximately 775,000 people live in block groups that are partially or wholly located within
one mile of facilities in the 108(b) universe. Approximately 157,000 of these people, or 21
percent, have incomes below the poverty thresholds defined by the ACS based on household
116 MSHA. “Mines Data Set.” Accessed at: http://www.msha.gov/OpenGovernmentData/OGIMSHA.asp 117 The Mines Data Set contained geographic coordinates for 155 facilities. EPA’s FRS database included
geographic information on 12 additional facilities that did not have MSHA IDs. Geographic coordinates for 16 of
the remaining facilities were identified through targeted research on Google Earth, company websites, and any
descriptive geographic information available in the MSHA Mines Data Set. 118 U.S. Census Bureau. (2014). TIGER/Line Geodatabase, Census Block Groups National File.” Accessed at:
https://www.census.gov/geo/maps-data/data/tiger-data.html
8-8
characteristics.119 When block groups up to 25 miles away from a potentially regulated facility
are included, 16 percent of the population has incomes below the ACS poverty threshold.
Nationally, approximately 16 percent of the population lives below the ACS poverty threshold, a
similar percentage to that observed in the block groups with relative proximity to mining
facilities.
Of the population living partially or wholly within one mile of a hardrock mining or processing
facility, approximately 260,000 people, or 34 percent, belong to a minority group. When block
groups up to 25 miles away from a potentially regulated facility are included, 36 percent of the
population belongs to a minority group. In the United States overall, approximately 37 percent of
people belong to a minority group. Exhibit 8-3 lists the number and percentage of people in the
four sets of block groups that belong to minority groups and that have incomes below the poverty
threshold.
Exhibit 8-3.
Baseline Demographics for Census Block Groups
Geographic Area Minority Population Population Living in Poverty
Census block groups within 1 mile of a
potentially regulated facility
262,113 157,418
(34%) (21%)
Census block groups within 5 miles of a
potentially regulated facility
2,067,411 1,041,095
(40%) (20%)
Census block groups within 15 miles of a
potentially regulated facility
9,099,941 4,105,852
(37%) (17%)
Census block groups within 25 miles of a
potentially regulated facility
17,014,669 7,469,769
(36%) (16%)
National Average (37%) (16%)
Exhibit 8-4 provides further detail on the percentage of people belonging to various minority
groups in the block groups in close proximity to mining facilities. The proportion of the
population in close proximity to potentially regulated facilities belonging to a minority group
was lower than the national average across all minority groups except for “Black or African
American alone,” across all distance criteria, and “American Indian and Alaska Native alone,”
among block groups within one mile and five miles of a potentially regulated facility. Depending
on the distance criterion used, between 14 percent and 22 percent of people in close proximity to
hardrock mining and processing facilities identify as Black or African American alone,
compared to 13 percent nationwide. Two percent of people living in block groups within one
mile of a potentially regulated facility identify as American Indian and Alaska Native alone,
compared to one percent nationwide. The proportion of people that identify as American Indian
and Alaska Native alone is also slightly higher than the national proportion in block groups
119 The ACS defines a set of poverty thresholds that vary based on family size, number of children, and age of
householder. More information on ACS poverty thresholds is available at:
https://www.census.gov/hhes/www/poverty/data/#acs
Minority population is defined as the portion of the population not included in the category “White alone, not
Hispanic or Latino.”
8-9
within five miles of a potentially regulated facility. Exhibit 8-5 summarizes the number and
percent of block groups that exceed the national average for each distance criterion.
Exhibit 8-4.
Baseline Minority Group Demographics for Census Block Groups
Geographic Area
Black or
African
American
alone
American
Indian and
Alaska
Native alone
Asian
alone
Native
Hawaiian and
Other Pacific
Islander
alone
Hispanic
or Latino
origin
Census Block Groups within 1 mile
of a potentially regulated facility
110,180 13,844 16,065 593 109,163
(14%) (2%) (2%) (0%) (14%)
Census Block Groups within 5 miles
of a potentially regulated facility
1,127,215 43,190 124,636 4,459 688,898
(22%) (0.8%) (2%) (0%) (13%)
Census Block Groups within 15 miles
of a potentially regulated facility
4,299,347 167,382 734,155 30,843 3,471,932
(18%) (0.7%) (3%) (0%) (14%)
Census Block Groups within 25 miles
of a potentially regulated facility
6,611,197 340,893 1,850,306 66,188 7,348,690
(14%) (0.7%) (4%) (0%) (15%)
National Average (13%) (0.8%) (5%) (0%) (17%)
Exhibit 8-5.
Number and Percentage of Census Block Groups Exceeding National Minority and
Poverty Percentages
Geographic Area Minority Criterion Poverty Criterion
Census block groups within 1 mile of a potentially
regulated facility
230 356
(36%) (56%)
Census block groups within 5 miles of a potentially
regulated facility
1,946 2,319
(46%) (55%)
Census block groups within 15 miles of a potentially
regulated facility
7,506 8,428
(42%) (47%)
Census block groups within 25 miles of a potentially
regulated facility
12,886 14,247
(39%) (43%)
This analysis also compared the concentrations of minority groups and people living in poverty
in individual block groups to state averages. Because hardrock mining and mineral processing
are highly regional industries within the United States, state populations offer more regional
comparison groups. The block groups identified through this analysis represent communities
with potential environmental justice concerns. Exhibit 8-6 below summarizes the number and
percent of block groups that exceed state-wide averages for all four sets of distance criteria.
Depending on the distance criterion used, between 50 and 59 percent of census block groups
within close proximity to a regulated facility contain higher concentrations of minority groups
than the state average. Similarly, between 42 and 56 percent of census block groups within close
proximity to a regulated facility contain higher concentrations of people living in poverty than
the state average. Appendix G provides additional tables and figures, including a state-by-state
8-10
analysis of block groups that exceed state-wide minority percentages and poverty benchmarks,
and an analysis of the census block groups exceeding national benchmarks.
Exhibit 8-6.
Number and Percentage of Census Block Groups Exceeding State-wide
Minority and Poverty Percentages
Geographic Area Minority Criterion Poverty Criterion
Census block groups within one mile radius of a potentially
regulated facility
318 358
(50%) (56%)
Census block groups within five mile radius of a potentially
regulated facility
2,495 2,295
(59%) (55%)
Census block groups within 15 mile radius of a potentially
regulated facility
10,213 8,293
(57%) (46%)
Census block groups within 25 mile radius of a potentially
regulated facility
17,919 14,004
(54%) (42%)
Overall, EPA’s analysis indicates that the populations living in proximity to hardrock mining
sites contain concentrations of minority groups and people living in poverty that are generally
similar to state and national averages. However, EPA did identify a number of communities with
potential environmental justice concerns, including census block groups with concentrations of
minority groups and people living in poverty in excess of state and national averages. These
communities are likely to share in any of the benefits that may result from promulgation of the
proposed rule.
8.4 Executive Order 13211: Actions that Significantly Affect Energy Supply,
Distribution, or Use
Executive Order 13211, Actions Concerning Regulations That Affect Energy Supply,
Distribution, or Use (May 18, 2001), addresses the need for regulators to consider the potential
energy impacts of the proposed CERCLA 108(b) rule and resulting actions. Under Executive
Order 13211, agencies are required to prepare a Statement of Energy Effects when a regulatory
action may have significant adverse effects on energy supply, distribution, or use, including
impacts on price and foreign supplies. Additionally, the requirements obligate agencies to
consider reasonable alternatives to regulatory actions with adverse effects and the impacts that
such alternatives might have on energy supply, distribution, or use.
This proposed rule would establish financial responsibility requirements under CERCLA
designed to assure that owners and operators of facilities provide funds to address CERCLA
liabilities at their sites, and to create incentives for sound practices that will minimize the
likelihood of a need for a future CERCLA response. The financial responsibility requirements
would extend to all CERCLA liabilities at the site.
The Proposed Rule is not expected to impact energy production, distribution, or consumption.
This rule may be subject to Executive Order 13211 since it is considered an economically
significant action under EO 12866. Since the changes in energy production and consumption
under the rule are likely to be minimal, the rule is not expected to have a significant adverse
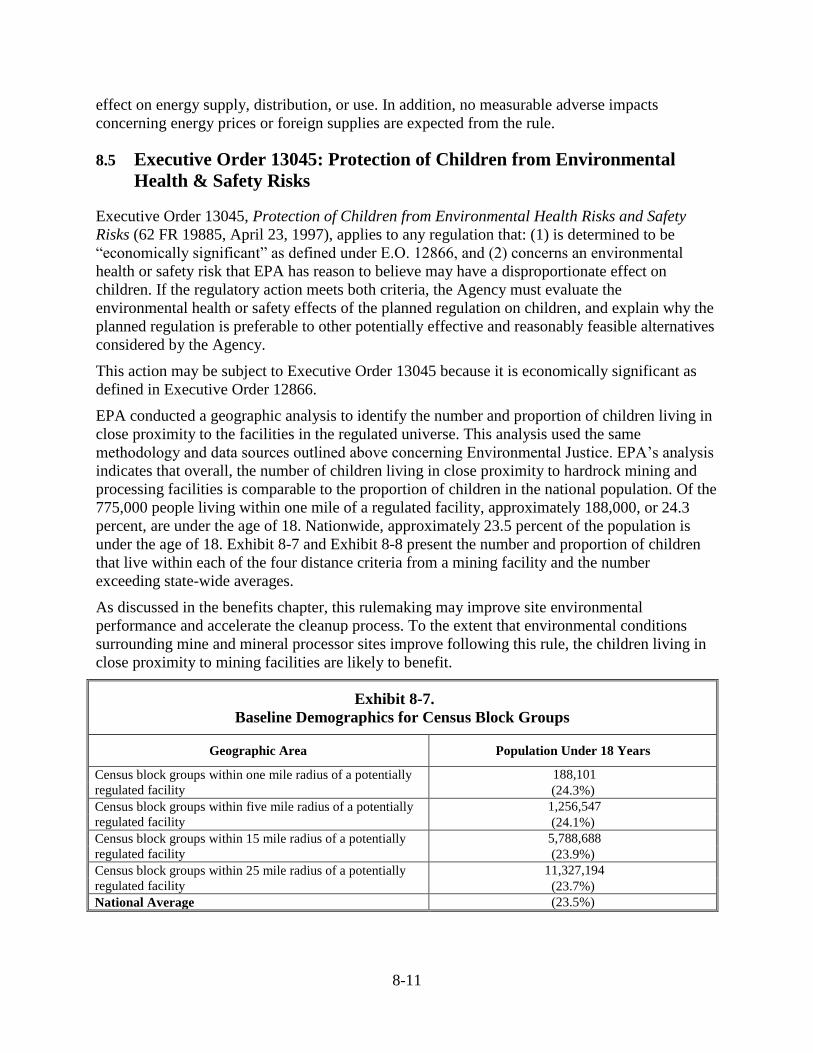
8-11
effect on energy supply, distribution, or use. In addition, no measurable adverse impacts
concerning energy prices or foreign supplies are expected from the rule.
8.5 Executive Order 13045: Protection of Children from Environmental
Health & Safety Risks
Executive Order 13045, Protection of Children from Environmental Health Risks and Safety
Risks (62 FR 19885, April 23, 1997), applies to any regulation that: (1) is determined to be
“economically significant” as defined under E.O. 12866, and (2) concerns an environmental
health or safety risk that EPA has reason to believe may have a disproportionate effect on
children. If the regulatory action meets both criteria, the Agency must evaluate the
environmental health or safety effects of the planned regulation on children, and explain why the
planned regulation is preferable to other potentially effective and reasonably feasible alternatives
considered by the Agency.
This action may be subject to Executive Order 13045 because it is economically significant as
defined in Executive Order 12866.
EPA conducted a geographic analysis to identify the number and proportion of children living in
close proximity to the facilities in the regulated universe. This analysis used the same
methodology and data sources outlined above concerning Environmental Justice. EPA’s analysis
indicates that overall, the number of children living in close proximity to hardrock mining and
processing facilities is comparable to the proportion of children in the national population. Of the
775,000 people living within one mile of a regulated facility, approximately 188,000, or 24.3
percent, are under the age of 18. Nationwide, approximately 23.5 percent of the population is
under the age of 18. Exhibit 8-7 and Exhibit 8-8 present the number and proportion of children
that live within each of the four distance criteria from a mining facility and the number
exceeding state-wide averages.
As discussed in the benefits chapter, this rulemaking may improve site environmental
performance and accelerate the cleanup process. To the extent that environmental conditions
surrounding mine and mineral processor sites improve following this rule, the children living in
close proximity to mining facilities are likely to benefit.
Exhibit 8-7.
Baseline Demographics for Census Block Groups
Geographic Area Population Under 18 Years
Census block groups within one mile radius of a potentially
regulated facility
188,101
(24.3%)
Census block groups within five mile radius of a potentially
regulated facility
1,256,547
(24.1%)
Census block groups within 15 mile radius of a potentially
regulated facility
5,788,688
(23.9%)
Census block groups within 25 mile radius of a potentially
regulated facility
11,327,194
(23.7%)
National Average (23.5%)
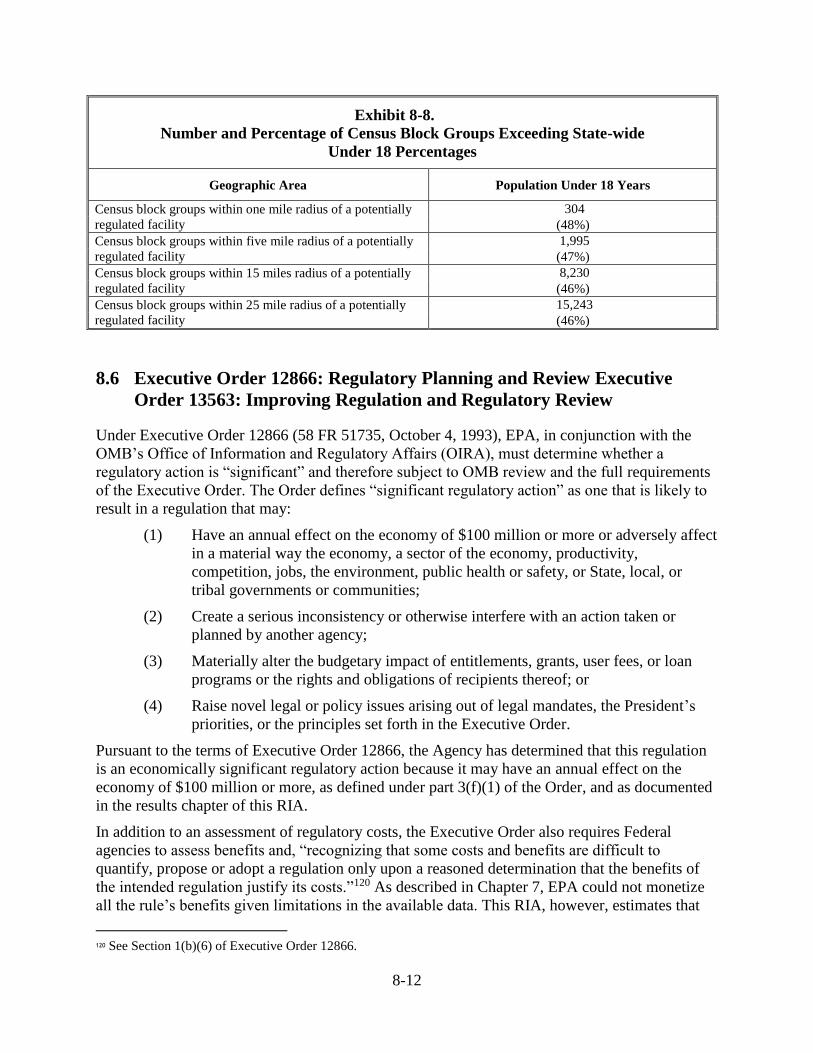
8-12
Exhibit 8-8.
Number and Percentage of Census Block Groups Exceeding State-wide
Under 18 Percentages
Geographic Area Population Under 18 Years
Census block groups within one mile radius of a potentially
regulated facility
304
(48%)
Census block groups within five mile radius of a potentially
regulated facility
1,995
(47%)
Census block groups within 15 miles radius of a potentially
regulated facility
8,230
(46%)
Census block groups within 25 mile radius of a potentially
regulated facility
15,243
(46%)
8.6 Executive Order 12866: Regulatory Planning and Review Executive
Order 13563: Improving Regulation and Regulatory Review
Under Executive Order 12866 (58 FR 51735, October 4, 1993), EPA, in conjunction with the
OMB’s Office of Information and Regulatory Affairs (OIRA), must determine whether a
regulatory action is “significant” and therefore subject to OMB review and the full requirements
of the Executive Order. The Order defines “significant regulatory action” as one that is likely to
result in a regulation that may:
(1) Have an annual effect on the economy of $100 million or more or adversely affect
in a material way the economy, a sector of the economy, productivity,
competition, jobs, the environment, public health or safety, or State, local, or
tribal governments or communities;
(2) Create a serious inconsistency or otherwise interfere with an action taken or
planned by another agency;
(3) Materially alter the budgetary impact of entitlements, grants, user fees, or loan
programs or the rights and obligations of recipients thereof; or
(4) Raise novel legal or policy issues arising out of legal mandates, the President’s
priorities, or the principles set forth in the Executive Order.
Pursuant to the terms of Executive Order 12866, the Agency has determined that this regulation
is an economically significant regulatory action because it may have an annual effect on the
economy of $100 million or more, as defined under part 3(f)(1) of the Order, and as documented
in the results chapter of this RIA.
In addition to an assessment of regulatory costs, the Executive Order also requires Federal
agencies to assess benefits and, “recognizing that some costs and benefits are difficult to
quantify, propose or adopt a regulation only upon a reasoned determination that the benefits of
the intended regulation justify its costs.”120 As described in Chapter 7, EPA could not monetize
all the rule’s benefits given limitations in the available data. This RIA, however, estimates that
120 See Section 1(b)(6) of Executive Order 12866.
8-13
the proposed rule would lead to reduced cost to government of $511 million to $527 million over
34 years (the period of analysis) as a result of increased industry access to funds for CERCLA
cleanup and NRD costs and reduced government costs, as described in Chapter 5. The proposed
rule would also lead to other benefits, including greater transparency in capital markets,
improvements in site environmental performance, improvements to impaired waters and wild
and scenic rivers, and faster site cleanups.
8.7 Unfunded Mandates Reform Act
The Unfunded Mandates Reform Act (UMRA), promulgated in 1995, requires all federal
agencies to provide a statement to support the need to issue any regulation containing an
unfunded federal mandate, and describe prior consultation with representatives of affected state,
local, and tribal governments.
The final CERCLA 108(b) rule is subject to the requirements of sections 202 and 205 of UMRA.
In general, a regulation is subject to the requirements of these sections if it contains “Federal
mandates” that may result in the expenditure by State, local, and tribal governments, in the
aggregate, or by the private sector, of $100 million or more in any one year. As discussed in
Chapter 5, under median-based extrapolation and company average pricing, EPA estimates that
the regulation will have aggregate annual compliance costs of $171 million under Option 1 and
$111 million under Option 2 (not including administrative reporting costs). Thus, this rule is
subject to the following requirements of these sections. This RIA addresses these requirements.
An identification of the provision of Federal law under which the regulation is
being promulgated.
A qualitative and quantitative assessment of the anticipated costs and benefits of
the Federal mandate;
o Costs and benefits to State, local, and tribal governments and the private
sector
o Effect on health, safety, and the natural environment
o Analysis of extent to which such costs may be paid with Federal financial
assistance (or otherwise paid for by the Federal government)
o Analysis of the extent to which there are available Federal resources to
carry out this mandate
Estimates of future compliance costs with the mandate.
Estimates of disproportionate budgetary effects on any type of government or
segment of the private sector.
Estimates of the effect on the national economy (if relevant and possible).
8.8 Executive Order 13132: Federalism
Executive Order 13132, Federalism (64 FR 43255, August 10, 1999), requires EPA to develop
an accountable process to ensure “meaningful and timely input by state and local officials in the
development of regulatory policies that have federalism implications.” “Policies that have
federalism implications” is defined in the Executive Order to include regulations that have
8-14
“substantial direct effects on the states, on the relationship between the national government and
the states, or on the distribution of power and responsibilities among the various levels of
government.” EPA typically considers a policy to have federalism implications if it results in the
expenditure by State and/or local governments in the aggregate of $25 million or more in any
one year.
Under Executive Order 13132, EPA may not issue a regulation that has federalism implications,
that imposes substantial direct compliance costs, and that is not required by statute, unless the
Federal government provides the funds necessary to pay the direct compliance costs incurred by
State and local governments, or EPA consults with State and local officials early in the process
of developing the regulation.
This rule is not expected to have federalism implications. EPA does not anticipate that the
proposed rule will have substantial direct effects on the States, on the relationship between the
national government and the States, or on the distribution of power and responsibilities among
the various levels of government, as specified in the Order. The rule would establish financial
responsibility requirements under CERCLA designed to assure that owners and operators of
facilities provide funds to address CERCLA liabilities at their sites, without affecting the
relationships between Federal and State governments. Thus, Executive Order 13132 does not
apply to this rule. Nevertheless, EPA welcomes comment from State and local officials in
response to this proposed rulemaking.
8.9 Executive Order 13175: Consultation and Coordination with Indian
Tribal Governments
Executive Order 13175, Consultation and Coordination With Indian Tribal Governments (65 FR
67249, November 9, 2000), requires EPA to develop an accountable process to ensure
“meaningful and timely input by tribal officials in the development of regulatory policies that
have tribal implications.”
To assess the impact on Tribal Governments, EPA identified tribal lands and associated tribes
that overlap with the “included” universe of currently operating facilities potentially subject to
the CERCLA 108(b) rulemaking. The analysis relies on geographic information on the locations
of both tribal lands and currently operating facilities; ArcGIS was used to identify any facilities
that overlap tribal lands.
Tribal lands were identified through a GIS dataset available from the U.S. Census Bureau.121 The
Census Bureau dataset includes the following legal and statistical entities:
Federally recognized American Indian reservations and off-reservation trust land
areas;122
121 U.S. Census Bureau. (2014). “TIGER/Line Shapefile, 2014, Series Information File for the Current American
Indian/Alaska Native/Native Hawaiian Areas National (AIANNH) National Shapefile.” Accessed at:
https://catalog.data.gov/dataset/tiger-line-shapefile-2014-series-information-file-for-the-current-american-indian-ala 122 The Census Bureau defines off-reservation trust land as “areas for which the United States holds title in trust for
the benefit of a tribe (tribal trust land) or for an individual American Indian (individual trust land). Trust lands can
be alienated or encumbered only by the owner with the approval of the Secretary of the Interior or his/her authorized
representative. Trust lands may be located on or off a reservation; however, the Census Bureau tabulates data only
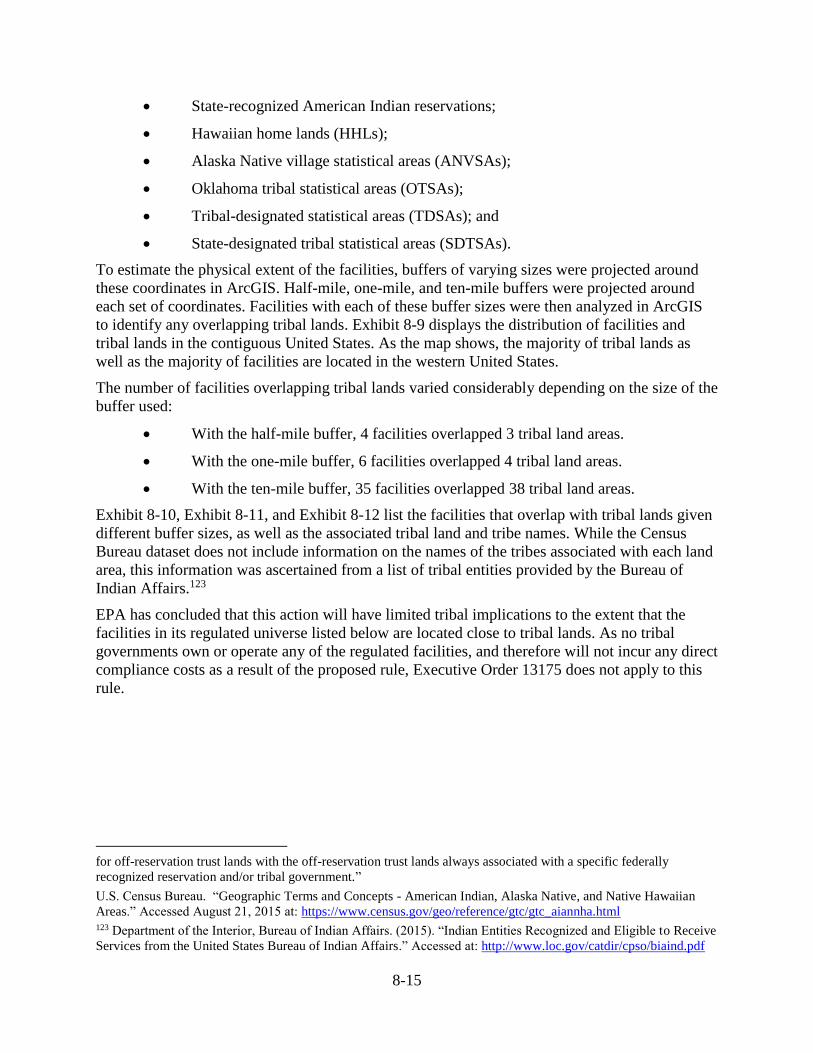
8-15
State-recognized American Indian reservations;
Hawaiian home lands (HHLs);
Alaska Native village statistical areas (ANVSAs);
Oklahoma tribal statistical areas (OTSAs);
Tribal-designated statistical areas (TDSAs); and
State-designated tribal statistical areas (SDTSAs).
To estimate the physical extent of the facilities, buffers of varying sizes were projected around
these coordinates in ArcGIS. Half-mile, one-mile, and ten-mile buffers were projected around
each set of coordinates. Facilities with each of these buffer sizes were then analyzed in ArcGIS
to identify any overlapping tribal lands. Exhibit 8-9 displays the distribution of facilities and
tribal lands in the contiguous United States. As the map shows, the majority of tribal lands as
well as the majority of facilities are located in the western United States.
The number of facilities overlapping tribal lands varied considerably depending on the size of the
buffer used:
With the half-mile buffer, 4 facilities overlapped 3 tribal land areas.
With the one-mile buffer, 6 facilities overlapped 4 tribal land areas.
With the ten-mile buffer, 35 facilities overlapped 38 tribal land areas.
Exhibit 8-10, Exhibit 8-11, and Exhibit 8-12 list the facilities that overlap with tribal lands given
different buffer sizes, as well as the associated tribal land and tribe names. While the Census
Bureau dataset does not include information on the names of the tribes associated with each land
area, this information was ascertained from a list of tribal entities provided by the Bureau of
Indian Affairs.123
EPA has concluded that this action will have limited tribal implications to the extent that the
facilities in its regulated universe listed below are located close to tribal lands. As no tribal
governments own or operate any of the regulated facilities, and therefore will not incur any direct
compliance costs as a result of the proposed rule, Executive Order 13175 does not apply to this
rule.
for off-reservation trust lands with the off-reservation trust lands always associated with a specific federally
recognized reservation and/or tribal government.”
U.S. Census Bureau. “Geographic Terms and Concepts - American Indian, Alaska Native, and Native Hawaiian
Areas.” Accessed August 21, 2015 at: https://www.census.gov/geo/reference/gtc/gtc_aiannha.html 123 Department of the Interior, Bureau of Indian Affairs. (2015). “Indian Entities Recognized and Eligible to Receive
Services from the United States Bureau of Indian Affairs.” Accessed at: http://www.loc.gov/catdir/cpso/biaind.pdf
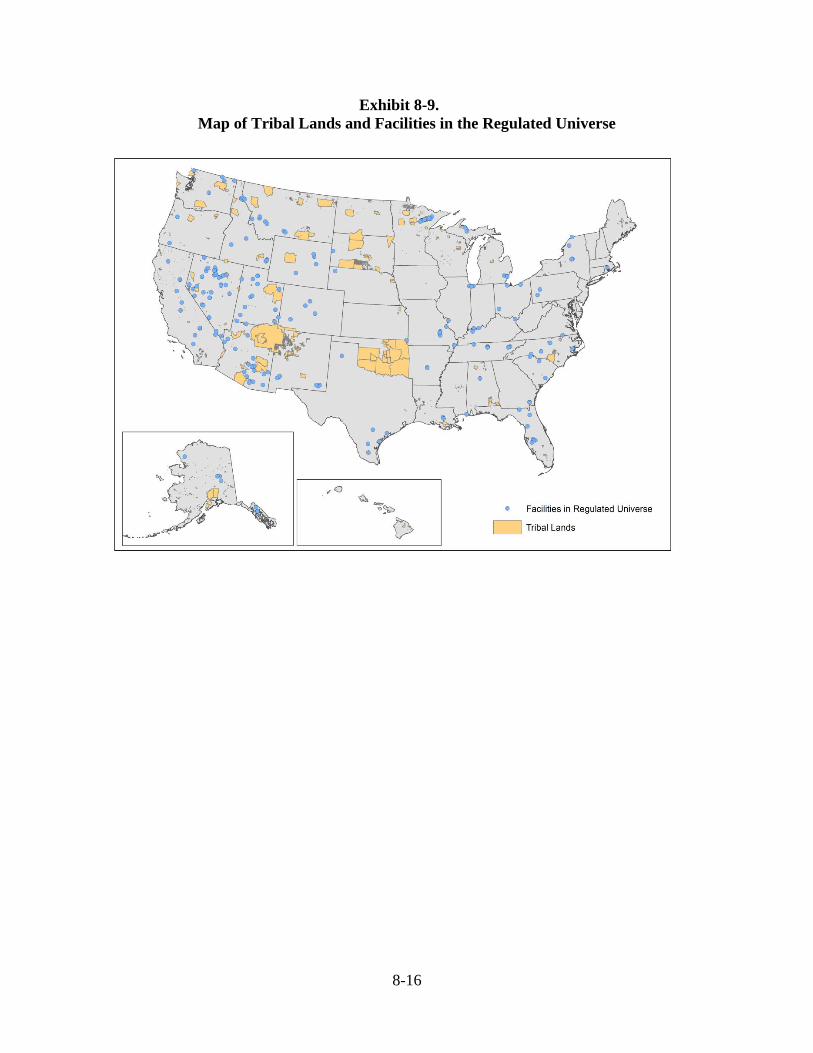
8-16
Exhibit 8-9.
Map of Tribal Lands and Facilities in the Regulated Universe
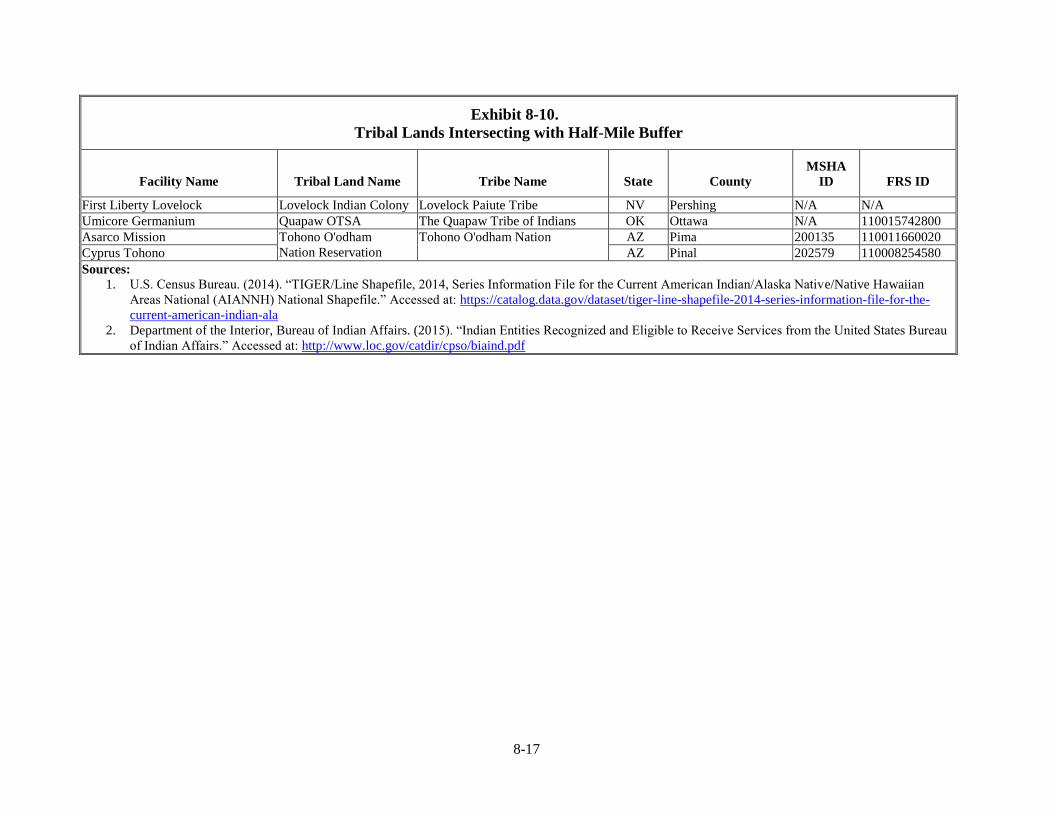
8-17
Exhibit 8-10.
Tribal Lands Intersecting with Half-Mile Buffer
Facility Name Tribal Land Name Tribe Name State County
MSHA
ID FRS ID
First Liberty Lovelock Lovelock Indian Colony Lovelock Paiute Tribe NV Pershing N/A N/A
Umicore Germanium Quapaw OTSA The Quapaw Tribe of Indians OK Ottawa N/A 110015742800
Asarco Mission Tohono O'odham
Nation Reservation
Tohono O'odham Nation AZ Pima 200135 110011660020
Cyprus Tohono AZ Pinal 202579 110008254580
Sources:
1. U.S. Census Bureau. (2014). “TIGER/Line Shapefile, 2014, Series Information File for the Current American Indian/Alaska Native/Native Hawaiian
Areas National (AIANNH) National Shapefile.” Accessed at: https://catalog.data.gov/dataset/tiger-line-shapefile-2014-series-information-file-for-the-
current-american-indian-ala
2. Department of the Interior, Bureau of Indian Affairs. (2015). “Indian Entities Recognized and Eligible to Receive Services from the United States Bureau
of Indian Affairs.” Accessed at: http://www.loc.gov/catdir/cpso/biaind.pdf
8-18
Exhibit 8-11.
Tribal Lands Intersecting with One-Mile Buffer
Facility Name Tribal Land Name Tribe Name State County
MSHA
ID FRS ID
Veris Gold Saval 4- Jerritt Canyon Elko Colony Te-Moak Tribe of Western
Shoshone Indians of Nevada - Elko
Band
NV Elko
2602742 110043970400
Coeur Rochester Lovelock Indian
Colony
Lovelock Paiute Tribe NV Pershing 2601941 110000472890
First Liberty Lovelock NV Pershing N/A N/A
Umicore Germanium Quapaw OTSA The Quapaw Tribe of Indians OK Ottawa N/A 110015742800
Asarco Mission Tohono O'odham
Nation Reservation
Tohono O'odham Nation AZ Pima 200135 110011660020
Cyprus Tohono AZ Pinal 202579 110008254580
Sources:
1. U.S. Census Bureau. (2014). “TIGER/Line Shapefile, 2014, Series Information File for the Current American Indian/Alaska Native/Native Hawaiian
Areas National (AIANNH) National Shapefile.” Accessed at: https://catalog.data.gov/dataset/tiger-line-shapefile-2014-series-information-file-for-the-
current-american-indian-ala
2. Department of the Interior, Bureau of Indian Affairs. (2015). “Indian Entities Recognized and Eligible to Receive Services from the United States
Bureau of Indian Affairs.” Accessed at: http://www.loc.gov/catdir/cpso/biaind.pdf
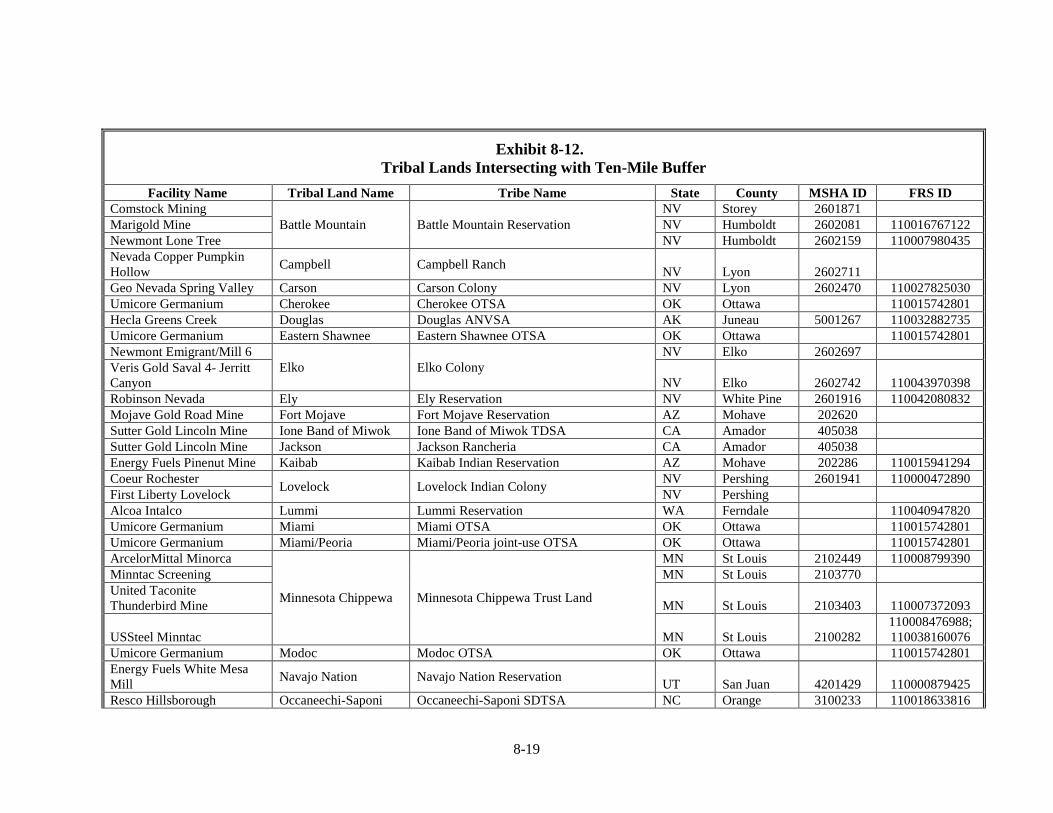
8-19
Exhibit 8-12.
Tribal Lands Intersecting with Ten-Mile Buffer
Facility Name Tribal Land Name Tribe Name State County MSHA ID FRS ID
Comstock Mining
Battle Mountain Battle Mountain Reservation
NV Storey 2601871
Marigold Mine NV Humboldt 2602081 110016767122
Newmont Lone Tree NV Humboldt 2602159 110007980435
Nevada Copper Pumpkin
Hollow Campbell Campbell Ranch
NV Lyon 2602711
Geo Nevada Spring Valley Carson Carson Colony NV Lyon 2602470 110027825030
Umicore Germanium Cherokee Cherokee OTSA OK Ottawa 110015742801
Hecla Greens Creek Douglas Douglas ANVSA AK Juneau 5001267 110032882735
Umicore Germanium Eastern Shawnee Eastern Shawnee OTSA OK Ottawa 110015742801
Newmont Emigrant/Mill 6
Elko Elko Colony
NV Elko 2602697
Veris Gold Saval 4- Jerritt
Canyon NV Elko 2602742 110043970398
Robinson Nevada Ely Ely Reservation NV White Pine 2601916 110042080832
Mojave Gold Road Mine Fort Mojave Fort Mojave Reservation AZ Mohave 202620
Sutter Gold Lincoln Mine Ione Band of Miwok Ione Band of Miwok TDSA CA Amador 405038
Sutter Gold Lincoln Mine Jackson Jackson Rancheria CA Amador 405038
Energy Fuels Pinenut Mine Kaibab Kaibab Indian Reservation AZ Mohave 202286 110015941294
Coeur Rochester Lovelock Lovelock Indian Colony
NV Pershing 2601941 110000472890
First Liberty Lovelock NV Pershing
Alcoa Intalco Lummi Lummi Reservation WA Ferndale 110040947820
Umicore Germanium Miami Miami OTSA OK Ottawa 110015742801
Umicore Germanium Miami/Peoria Miami/Peoria joint-use OTSA OK Ottawa 110015742801
ArcelorMittal Minorca
Minnesota Chippewa Minnesota Chippewa Trust Land
MN St Louis 2102449 110008799390
Minntac Screening MN St Louis 2103770
United Taconite
Thunderbird Mine MN St Louis 2103403 110007372093
USSteel Minntac MN St Louis 2100282
110008476988;
110038160076
Umicore Germanium Modoc Modoc OTSA OK Ottawa 110015742801
Energy Fuels White Mesa
Mill Navajo Nation Navajo Nation Reservation
UT San Juan 4201429 110000879425
Resco Hillsborough Occaneechi-Saponi Occaneechi-Saponi SDTSA NC Orange 3100233 110018633816
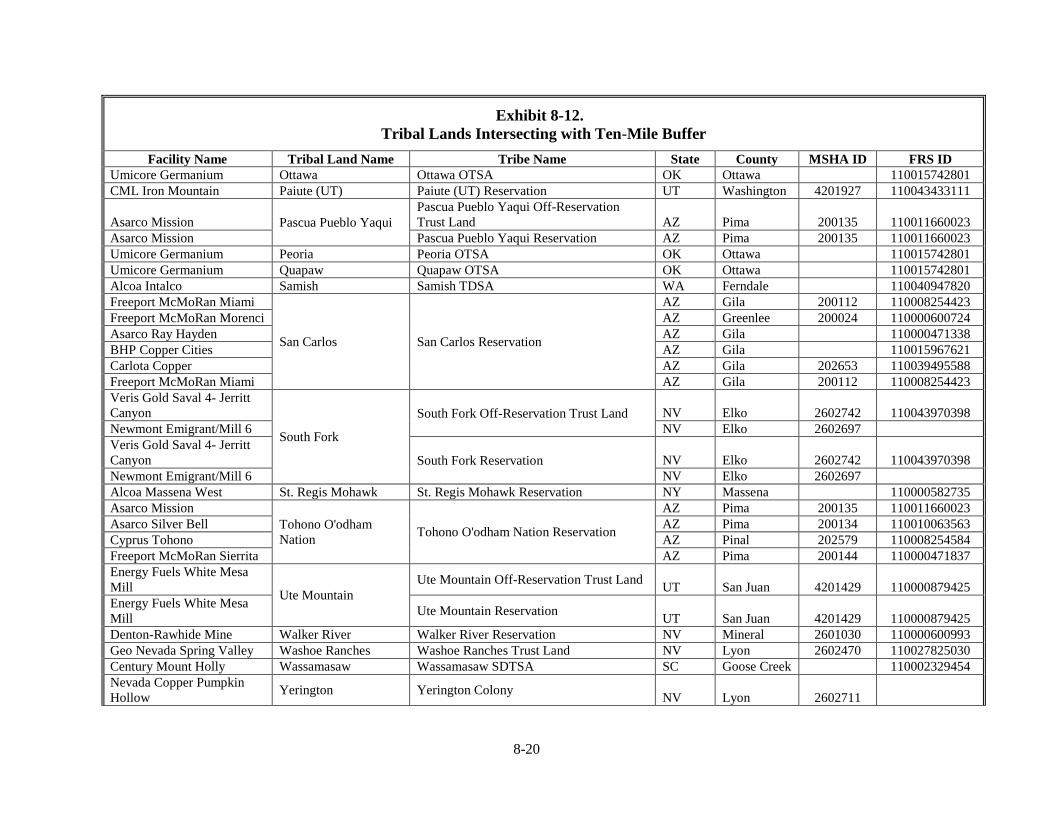
8-20
Exhibit 8-12.
Tribal Lands Intersecting with Ten-Mile Buffer
Facility Name Tribal Land Name Tribe Name State County MSHA ID FRS ID
Umicore Germanium Ottawa Ottawa OTSA OK Ottawa 110015742801
CML Iron Mountain Paiute (UT) Paiute (UT) Reservation UT Washington 4201927 110043433111
Asarco Mission Pascua Pueblo Yaqui
Pascua Pueblo Yaqui Off-Reservation
Trust Land AZ Pima 200135 110011660023
Asarco Mission Pascua Pueblo Yaqui Reservation AZ Pima 200135 110011660023
Umicore Germanium Peoria Peoria OTSA OK Ottawa 110015742801
Umicore Germanium Quapaw Quapaw OTSA OK Ottawa 110015742801
Alcoa Intalco Samish Samish TDSA WA Ferndale 110040947820
Freeport McMoRan Miami
San Carlos San Carlos Reservation
AZ Gila 200112 110008254423
Freeport McMoRan Morenci AZ Greenlee 200024 110000600724
Asarco Ray Hayden AZ Gila 110000471338
BHP Copper Cities AZ Gila 110015967621
Carlota Copper AZ Gila 202653 110039495588
Freeport McMoRan Miami AZ Gila 200112 110008254423
Veris Gold Saval 4- Jerritt
Canyon
South Fork
South Fork Off-Reservation Trust Land NV Elko 2602742 110043970398
Newmont Emigrant/Mill 6 NV Elko 2602697
Veris Gold Saval 4- Jerritt
Canyon South Fork Reservation NV Elko 2602742 110043970398
Newmont Emigrant/Mill 6 NV Elko 2602697
Alcoa Massena West St. Regis Mohawk St. Regis Mohawk Reservation NY Massena 110000582735
Asarco Mission
Tohono O'odham
Nation Tohono O'odham Nation Reservation
AZ Pima 200135 110011660023
Asarco Silver Bell AZ Pima 200134 110010063563
Cyprus Tohono AZ Pinal 202579 110008254584
Freeport McMoRan Sierrita AZ Pima 200144 110000471837
Energy Fuels White Mesa
Mill Ute Mountain
Ute Mountain Off-Reservation Trust Land UT San Juan 4201429 110000879425
Energy Fuels White Mesa
Mill Ute Mountain Reservation
UT San Juan 4201429 110000879425
Denton-Rawhide Mine Walker River Walker River Reservation NV Mineral 2601030 110000600993
Geo Nevada Spring Valley Washoe Ranches Washoe Ranches Trust Land NV Lyon 2602470 110027825030
Century Mount Holly Wassamasaw Wassamasaw SDTSA SC Goose Creek 110002329454
Nevada Copper Pumpkin
Hollow Yerington Yerington Colony
NV Lyon 2602711
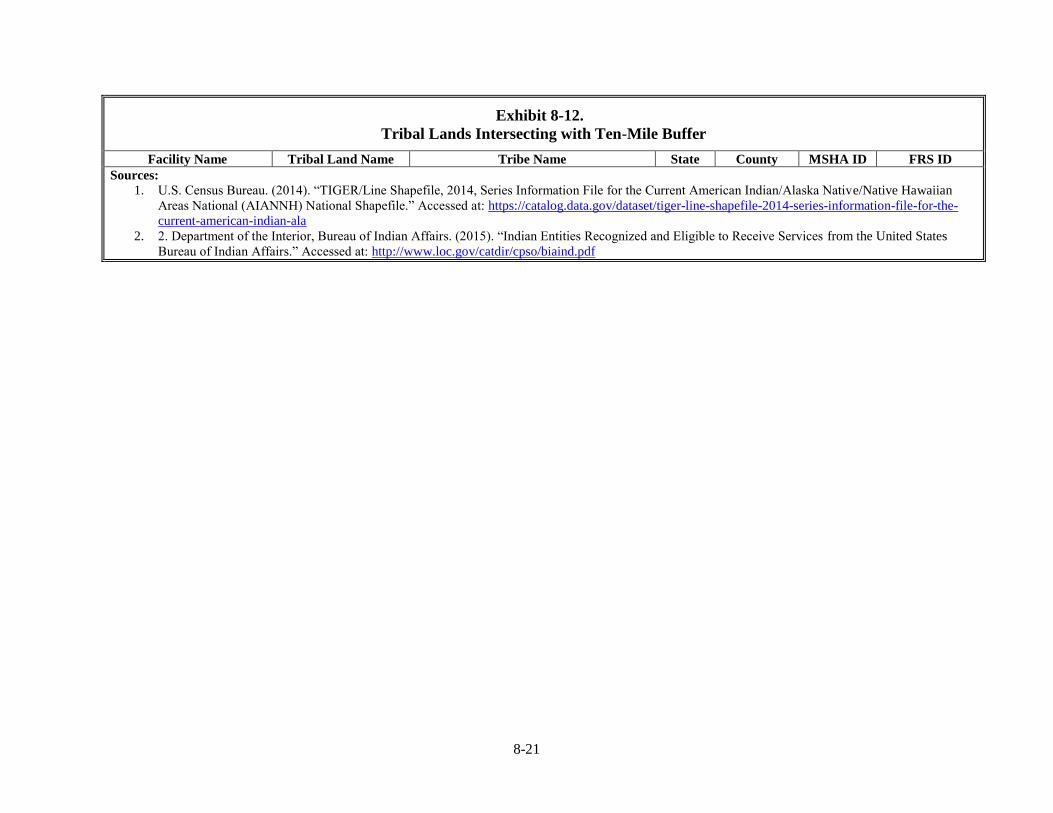
8-21
Exhibit 8-12.
Tribal Lands Intersecting with Ten-Mile Buffer
Facility Name Tribal Land Name Tribe Name State County MSHA ID FRS ID
Sources: 1. U.S. Census Bureau. (2014). “TIGER/Line Shapefile, 2014, Series Information File for the Current American Indian/Alaska Native/Native Hawaiian
Areas National (AIANNH) National Shapefile.” Accessed at: https://catalog.data.gov/dataset/tiger-line-shapefile-2014-series-information-file-for-the-
current-american-indian-ala
2. 2. Department of the Interior, Bureau of Indian Affairs. (2015). “Indian Entities Recognized and Eligible to Receive Services from the United States
Bureau of Indian Affairs.” Accessed at: http://www.loc.gov/catdir/cpso/biaind.pdf

Appendices
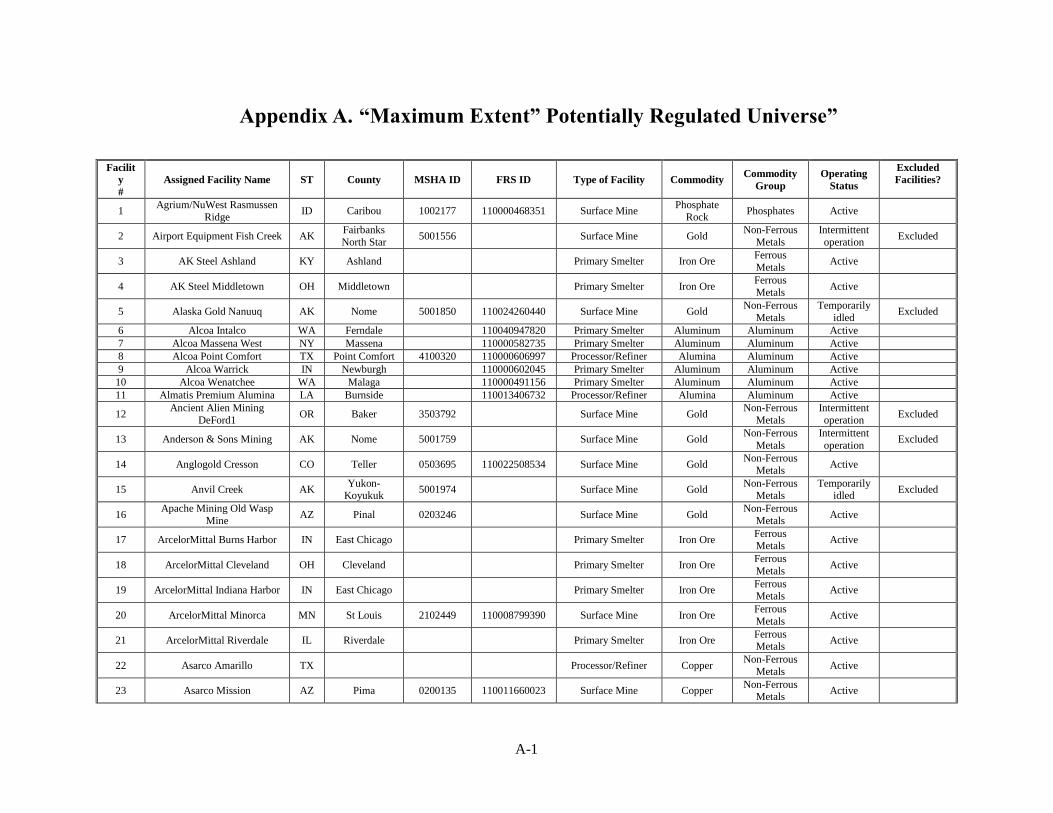
A-1
Appendix A. “Maximum Extent” Potentially Regulated Universe”
Facilit
y
#
Assigned Facility Name ST County MSHA ID FRS ID Type of Facility Commodity Commodity
Group
Operating
Status
Excluded
Facilities?
1 Agrium/NuWest Rasmussen
Ridge ID Caribou 1002177 110000468351 Surface Mine
Phosphate
Rock Phosphates Active
2 Airport Equipment Fish Creek AK Fairbanks
North Star 5001556 Surface Mine Gold
Non-Ferrous
Metals
Intermittent
operation Excluded
3 AK Steel Ashland KY Ashland Primary Smelter Iron Ore Ferrous
Metals Active
4 AK Steel Middletown OH Middletown Primary Smelter Iron Ore Ferrous
Metals Active
5 Alaska Gold Nanuuq AK Nome 5001850 110024260440 Surface Mine Gold Non-Ferrous
Metals
Temporarily
idled Excluded
6 Alcoa Intalco WA Ferndale 110040947820 Primary Smelter Aluminum Aluminum Active
7 Alcoa Massena West NY Massena 110000582735 Primary Smelter Aluminum Aluminum Active
8 Alcoa Point Comfort TX Point Comfort 4100320 110000606997 Processor/Refiner Alumina Aluminum Active
9 Alcoa Warrick IN Newburgh 110000602045 Primary Smelter Aluminum Aluminum Active
10 Alcoa Wenatchee WA Malaga 110000491156 Primary Smelter Aluminum Aluminum Active
11 Almatis Premium Alumina LA Burnside 110013406732 Processor/Refiner Alumina Aluminum Active
12 Ancient Alien Mining
DeFord1 OR Baker 3503792 Surface Mine Gold
Non-Ferrous
Metals
Intermittent
operation Excluded
13 Anderson & Sons Mining AK Nome 5001759 Surface Mine Gold Non-Ferrous
Metals
Intermittent
operation Excluded
14 Anglogold Cresson CO Teller 0503695 110022508534 Surface Mine Gold Non-Ferrous
Metals Active
15 Anvil Creek AK Yukon-
Koyukuk 5001974 Surface Mine Gold
Non-Ferrous Metals
Temporarily idled
Excluded
16 Apache Mining Old Wasp
Mine AZ Pinal 0203246 Surface Mine Gold
Non-Ferrous
Metals Active
17 ArcelorMittal Burns Harbor IN East Chicago Primary Smelter Iron Ore Ferrous Metals
Active
18 ArcelorMittal Cleveland OH Cleveland Primary Smelter Iron Ore Ferrous
Metals Active
19 ArcelorMittal Indiana Harbor IN East Chicago Primary Smelter Iron Ore Ferrous Metals
Active
20 ArcelorMittal Minorca MN St Louis 2102449 110008799390 Surface Mine Iron Ore Ferrous
Metals Active
21 ArcelorMittal Riverdale IL Riverdale Primary Smelter Iron Ore Ferrous Metals
Active
22 Asarco Amarillo TX Processor/Refiner Copper Non-Ferrous
Metals Active
23 Asarco Mission AZ Pima 0200135 110011660023 Surface Mine Copper Non-Ferrous
Metals Active
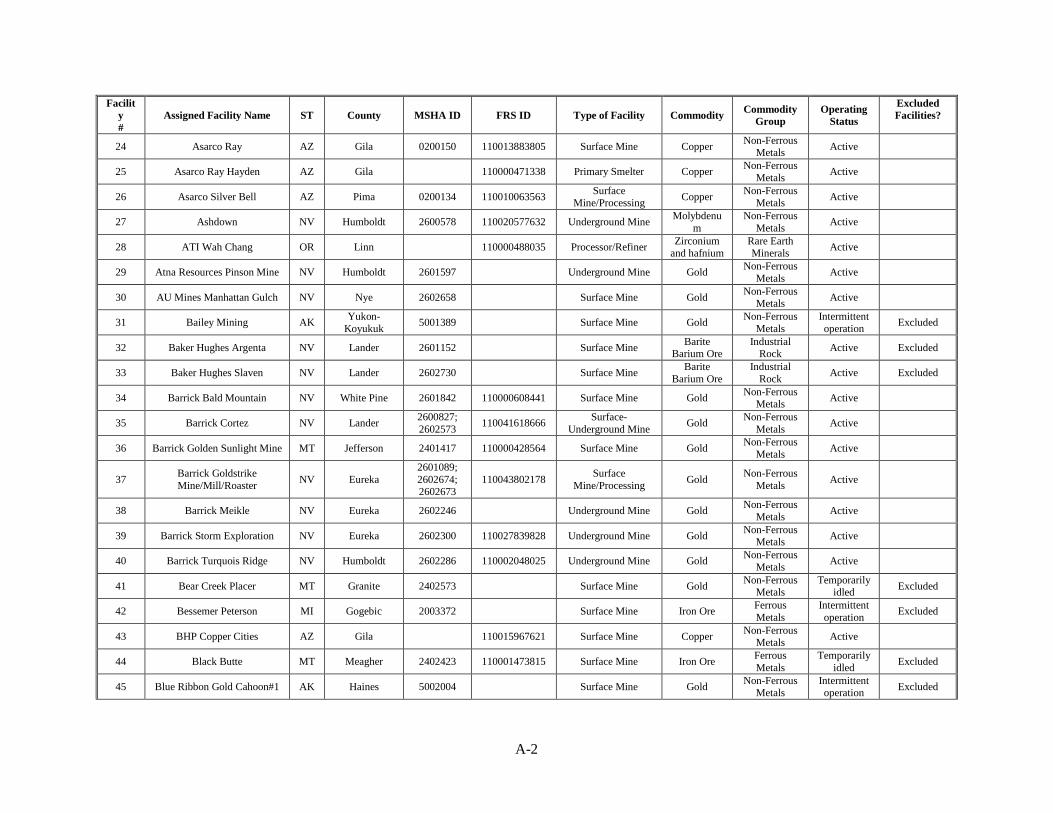
A-2
Facilit
y
#
Assigned Facility Name ST County MSHA ID FRS ID Type of Facility Commodity Commodity
Group
Operating
Status
Excluded
Facilities?
24 Asarco Ray AZ Gila 0200150 110013883805 Surface Mine Copper Non-Ferrous
Metals Active
25 Asarco Ray Hayden AZ Gila 110000471338 Primary Smelter Copper Non-Ferrous
Metals Active
26 Asarco Silver Bell AZ Pima 0200134 110010063563 Surface
Mine/Processing Copper
Non-Ferrous Metals
Active
27 Ashdown NV Humboldt 2600578 110020577632 Underground Mine Molybdenu
m
Non-Ferrous
Metals Active
28 ATI Wah Chang OR Linn 110000488035 Processor/Refiner Zirconium
and hafnium Rare Earth Minerals
Active
29 Atna Resources Pinson Mine NV Humboldt 2601597 Underground Mine Gold Non-Ferrous
Metals Active
30 AU Mines Manhattan Gulch NV Nye 2602658 Surface Mine Gold Non-Ferrous
Metals Active
31 Bailey Mining AK Yukon-
Koyukuk 5001389 Surface Mine Gold
Non-Ferrous
Metals
Intermittent
operation Excluded
32 Baker Hughes Argenta NV Lander 2601152 Surface Mine Barite
Barium Ore Industrial
Rock Active Excluded
33 Baker Hughes Slaven NV Lander 2602730 Surface Mine Barite
Barium Ore
Industrial
Rock Active Excluded
34 Barrick Bald Mountain NV White Pine 2601842 110000608441 Surface Mine Gold Non-Ferrous
Metals Active
35 Barrick Cortez NV Lander 2600827;
2602573 110041618666
Surface-
Underground Mine Gold
Non-Ferrous
Metals Active
36 Barrick Golden Sunlight Mine MT Jefferson 2401417 110000428564 Surface Mine Gold Non-Ferrous
Metals Active
37 Barrick Goldstrike
Mine/Mill/Roaster NV Eureka
2601089;
2602674; 2602673
110043802178 Surface
Mine/Processing Gold
Non-Ferrous
Metals Active
38 Barrick Meikle NV Eureka 2602246 Underground Mine Gold Non-Ferrous
Metals Active
39 Barrick Storm Exploration NV Eureka 2602300 110027839828 Underground Mine Gold Non-Ferrous
Metals Active
40 Barrick Turquois Ridge NV Humboldt 2602286 110002048025 Underground Mine Gold Non-Ferrous
Metals Active
41 Bear Creek Placer MT Granite 2402573 Surface Mine Gold Non-Ferrous
Metals Temporarily
idled Excluded
42 Bessemer Peterson MI Gogebic 2003372 Surface Mine Iron Ore Ferrous
Metals
Intermittent
operation Excluded
43 BHP Copper Cities AZ Gila 110015967621 Surface Mine Copper Non-Ferrous
Metals Active
44 Black Butte MT Meagher 2402423 110001473815 Surface Mine Iron Ore Ferrous
Metals
Temporarily
idled Excluded
45 Blue Ribbon Gold Cahoon#1 AK Haines 5002004 Surface Mine Gold Non-Ferrous
Metals Intermittent operation
Excluded
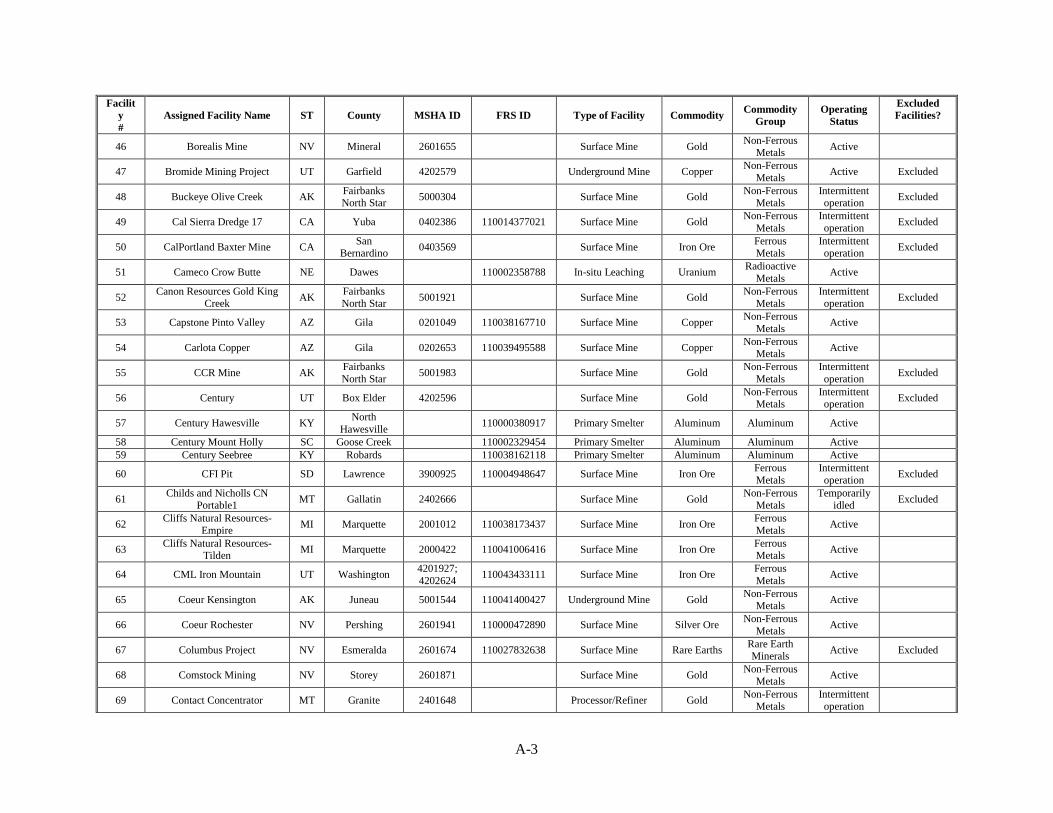
A-3
Facilit
y
#
Assigned Facility Name ST County MSHA ID FRS ID Type of Facility Commodity Commodity
Group
Operating
Status
Excluded
Facilities?
46 Borealis Mine NV Mineral 2601655 Surface Mine Gold Non-Ferrous
Metals Active
47 Bromide Mining Project UT Garfield 4202579 Underground Mine Copper Non-Ferrous
Metals Active Excluded
48 Buckeye Olive Creek AK Fairbanks North Star
5000304 Surface Mine Gold Non-Ferrous
Metals Intermittent operation
Excluded
49 Cal Sierra Dredge 17 CA Yuba 0402386 110014377021 Surface Mine Gold Non-Ferrous
Metals
Intermittent
operation Excluded
50 CalPortland Baxter Mine CA San
Bernardino 0403569 Surface Mine Iron Ore
Ferrous Metals
Intermittent operation
Excluded
51 Cameco Crow Butte NE Dawes 110002358788 In-situ Leaching Uranium Radioactive
Metals Active
52 Canon Resources Gold King
Creek AK
Fairbanks North Star
5001921 Surface Mine Gold Non-Ferrous
Metals Intermittent operation
Excluded
53 Capstone Pinto Valley AZ Gila 0201049 110038167710 Surface Mine Copper Non-Ferrous
Metals Active
54 Carlota Copper AZ Gila 0202653 110039495588 Surface Mine Copper Non-Ferrous
Metals Active
55 CCR Mine AK Fairbanks
North Star 5001983 Surface Mine Gold
Non-Ferrous
Metals
Intermittent
operation Excluded
56 Century UT Box Elder 4202596 Surface Mine Gold Non-Ferrous
Metals Intermittent operation
Excluded
57 Century Hawesville KY North
Hawesville 110000380917 Primary Smelter Aluminum Aluminum Active
58 Century Mount Holly SC Goose Creek 110002329454 Primary Smelter Aluminum Aluminum Active
59 Century Seebree KY Robards 110038162118 Primary Smelter Aluminum Aluminum Active
60 CFI Pit SD Lawrence 3900925 110004948647 Surface Mine Iron Ore Ferrous
Metals
Intermittent
operation Excluded
61 Childs and Nicholls CN
Portable1 MT Gallatin 2402666 Surface Mine Gold
Non-Ferrous Metals
Temporarily idled
Excluded
62 Cliffs Natural Resources-
Empire MI Marquette 2001012 110038173437 Surface Mine Iron Ore
Ferrous
Metals Active
63 Cliffs Natural Resources-
Tilden MI Marquette 2000422 110041006416 Surface Mine Iron Ore
Ferrous Metals
Active
64 CML Iron Mountain UT Washington 4201927;
4202624 110043433111 Surface Mine Iron Ore
Ferrous
Metals Active
65 Coeur Kensington AK Juneau 5001544 110041400427 Underground Mine Gold Non-Ferrous
Metals Active
66 Coeur Rochester NV Pershing 2601941 110000472890 Surface Mine Silver Ore Non-Ferrous
Metals Active
67 Columbus Project NV Esmeralda 2601674 110027832638 Surface Mine Rare Earths Rare Earth Minerals
Active Excluded
68 Comstock Mining NV Storey 2601871 Surface Mine Gold Non-Ferrous
Metals Active
69 Contact Concentrator MT Granite 2401648 Processor/Refiner Gold Non-Ferrous
Metals Intermittent operation
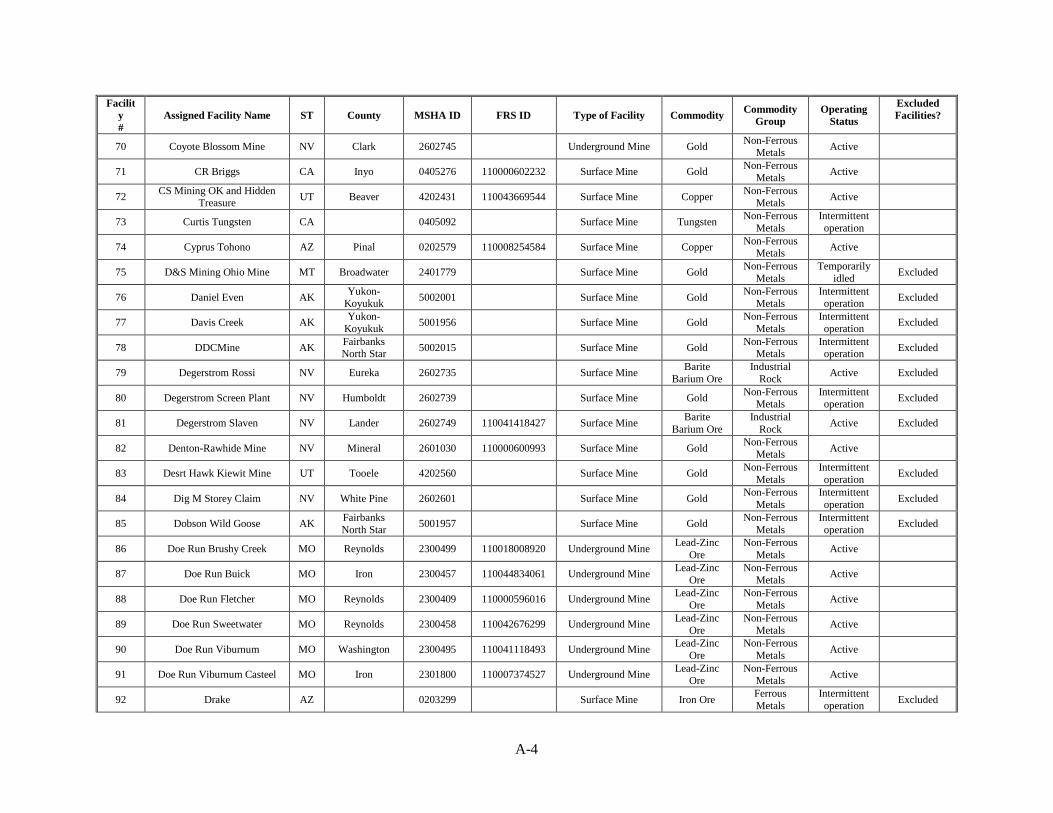
A-4
Facilit
y
#
Assigned Facility Name ST County MSHA ID FRS ID Type of Facility Commodity Commodity
Group
Operating
Status
Excluded
Facilities?
70 Coyote Blossom Mine NV Clark 2602745 Underground Mine Gold Non-Ferrous
Metals Active
71 CR Briggs CA Inyo 0405276 110000602232 Surface Mine Gold Non-Ferrous
Metals Active
72 CS Mining OK and Hidden
Treasure UT Beaver 4202431 110043669544 Surface Mine Copper
Non-Ferrous Metals
Active
73 Curtis Tungsten CA 0405092 Surface Mine Tungsten Non-Ferrous
Metals
Intermittent
operation
74 Cyprus Tohono AZ Pinal 0202579 110008254584 Surface Mine Copper Non-Ferrous
Metals Active
75 D&S Mining Ohio Mine MT Broadwater 2401779 Surface Mine Gold Non-Ferrous
Metals
Temporarily
idled Excluded
76 Daniel Even AK Yukon-
Koyukuk 5002001 Surface Mine Gold
Non-Ferrous Metals
Intermittent operation
Excluded
77 Davis Creek AK Yukon-
Koyukuk 5001956 Surface Mine Gold
Non-Ferrous
Metals
Intermittent
operation Excluded
78 DDCMine AK Fairbanks North Star
5002015 Surface Mine Gold Non-Ferrous
Metals Intermittent operation
Excluded
79 Degerstrom Rossi NV Eureka 2602735 Surface Mine Barite
Barium Ore
Industrial
Rock Active Excluded
80 Degerstrom Screen Plant NV Humboldt 2602739 Surface Mine Gold Non-Ferrous
Metals Intermittent operation
Excluded
81 Degerstrom Slaven NV Lander 2602749 110041418427 Surface Mine Barite
Barium Ore
Industrial
Rock Active Excluded
82 Denton-Rawhide Mine NV Mineral 2601030 110000600993 Surface Mine Gold Non-Ferrous
Metals Active
83 Desrt Hawk Kiewit Mine UT Tooele 4202560 Surface Mine Gold Non-Ferrous
Metals
Intermittent
operation Excluded
84 Dig M Storey Claim NV White Pine 2602601 Surface Mine Gold Non-Ferrous
Metals
Intermittent
operation Excluded
85 Dobson Wild Goose AK Fairbanks
North Star 5001957 Surface Mine Gold
Non-Ferrous
Metals
Intermittent
operation Excluded
86 Doe Run Brushy Creek MO Reynolds 2300499 110018008920 Underground Mine Lead-Zinc
Ore
Non-Ferrous
Metals Active
87 Doe Run Buick MO Iron 2300457 110044834061 Underground Mine Lead-Zinc
Ore
Non-Ferrous
Metals Active
88 Doe Run Fletcher MO Reynolds 2300409 110000596016 Underground Mine Lead-Zinc
Ore
Non-Ferrous
Metals Active
89 Doe Run Sweetwater MO Reynolds 2300458 110042676299 Underground Mine Lead-Zinc
Ore
Non-Ferrous
Metals Active
90 Doe Run Viburnum MO Washington 2300495 110041118493 Underground Mine Lead-Zinc
Ore
Non-Ferrous
Metals Active
91 Doe Run Viburnum Casteel MO Iron 2301800 110007374527 Underground Mine Lead-Zinc
Ore
Non-Ferrous
Metals Active
92 Drake AZ 0203299 Surface Mine Iron Ore Ferrous
Metals
Intermittent
operation Excluded
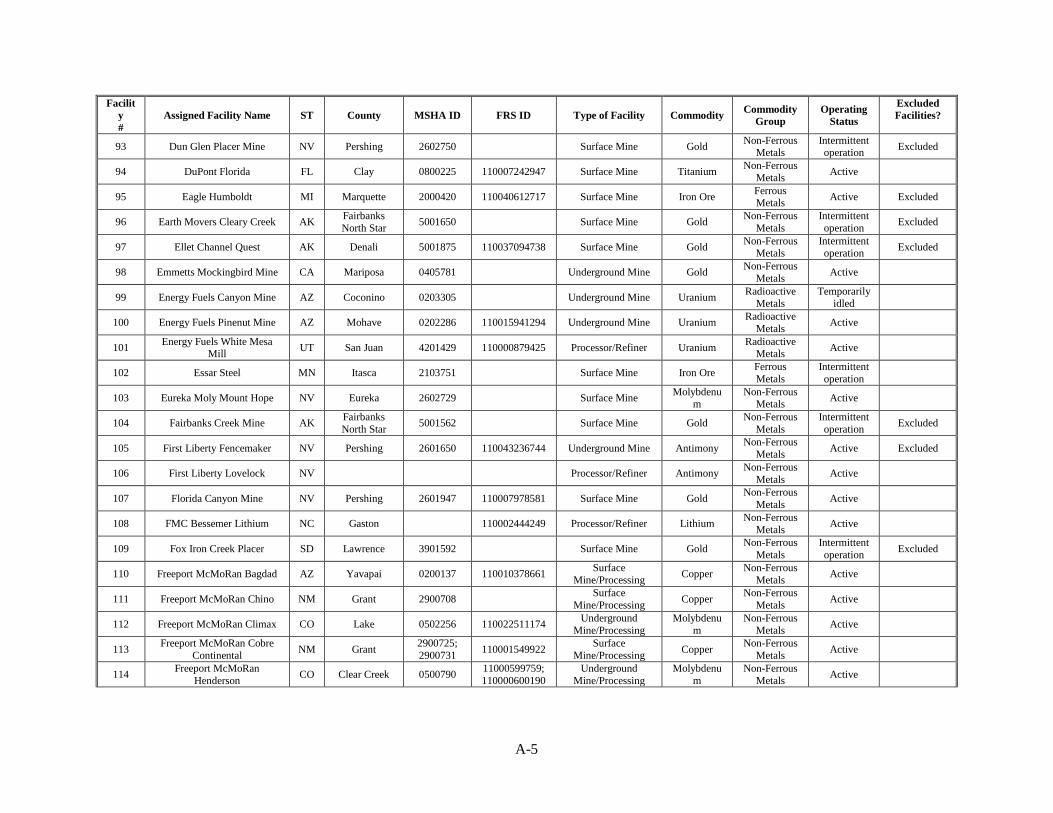
A-5
Facilit
y
#
Assigned Facility Name ST County MSHA ID FRS ID Type of Facility Commodity Commodity
Group
Operating
Status
Excluded
Facilities?
93 Dun Glen Placer Mine NV Pershing 2602750 Surface Mine Gold Non-Ferrous
Metals Intermittent operation
Excluded
94 DuPont Florida FL Clay 0800225 110007242947 Surface Mine Titanium Non-Ferrous
Metals Active
95 Eagle Humboldt MI Marquette 2000420 110040612717 Surface Mine Iron Ore Ferrous Metals
Active Excluded
96 Earth Movers Cleary Creek AK Fairbanks
North Star 5001650 Surface Mine Gold
Non-Ferrous
Metals
Intermittent
operation Excluded
97 Ellet Channel Quest AK Denali 5001875 110037094738 Surface Mine Gold Non-Ferrous
Metals Intermittent operation
Excluded
98 Emmetts Mockingbird Mine CA Mariposa 0405781 Underground Mine Gold Non-Ferrous
Metals Active
99 Energy Fuels Canyon Mine AZ Coconino 0203305 Underground Mine Uranium Radioactive
Metals Temporarily
idled
100 Energy Fuels Pinenut Mine AZ Mohave 0202286 110015941294 Underground Mine Uranium Radioactive
Metals Active
101 Energy Fuels White Mesa
Mill UT San Juan 4201429 110000879425 Processor/Refiner Uranium
Radioactive Metals
Active
102 Essar Steel MN Itasca 2103751 Surface Mine Iron Ore Ferrous
Metals
Intermittent
operation
103 Eureka Moly Mount Hope NV Eureka 2602729 Surface Mine Molybdenu
m Non-Ferrous
Metals Active
104 Fairbanks Creek Mine AK Fairbanks
North Star 5001562 Surface Mine Gold
Non-Ferrous
Metals
Intermittent
operation Excluded
105 First Liberty Fencemaker NV Pershing 2601650 110043236744 Underground Mine Antimony Non-Ferrous
Metals Active Excluded
106 First Liberty Lovelock NV Processor/Refiner Antimony Non-Ferrous
Metals Active
107 Florida Canyon Mine NV Pershing 2601947 110007978581 Surface Mine Gold Non-Ferrous
Metals Active
108 FMC Bessemer Lithium NC Gaston 110002444249 Processor/Refiner Lithium Non-Ferrous
Metals Active
109 Fox Iron Creek Placer SD Lawrence 3901592 Surface Mine Gold Non-Ferrous
Metals
Intermittent
operation Excluded
110 Freeport McMoRan Bagdad AZ Yavapai 0200137 110010378661 Surface
Mine/Processing Copper
Non-Ferrous
Metals Active
111 Freeport McMoRan Chino NM Grant 2900708 Surface
Mine/Processing Copper
Non-Ferrous
Metals Active
112 Freeport McMoRan Climax CO Lake 0502256 110022511174 Underground
Mine/Processing
Molybdenu
m
Non-Ferrous
Metals Active
113 Freeport McMoRan Cobre
Continental NM Grant
2900725;
2900731 110001549922
Surface
Mine/Processing Copper
Non-Ferrous
Metals Active
114 Freeport McMoRan
Henderson CO Clear Creek 0500790
11000599759;
110000600190
Underground
Mine/Processing
Molybdenu
m
Non-Ferrous
Metals Active
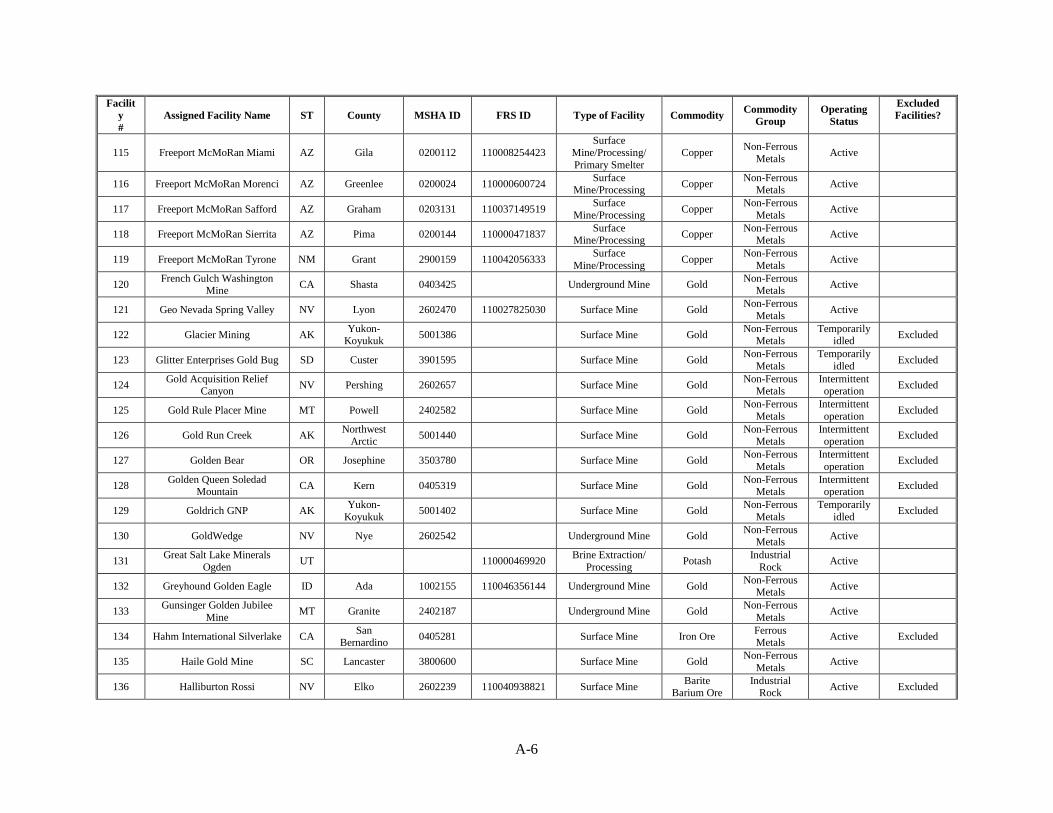
A-6
Facilit
y
#
Assigned Facility Name ST County MSHA ID FRS ID Type of Facility Commodity Commodity
Group
Operating
Status
Excluded
Facilities?
115 Freeport McMoRan Miami AZ Gila 0200112 110008254423 Surface
Mine/Processing/
Primary Smelter
Copper Non-Ferrous
Metals Active
116 Freeport McMoRan Morenci AZ Greenlee 0200024 110000600724 Surface
Mine/Processing Copper
Non-Ferrous Metals
Active
117 Freeport McMoRan Safford AZ Graham 0203131 110037149519 Surface
Mine/Processing Copper
Non-Ferrous
Metals Active
118 Freeport McMoRan Sierrita AZ Pima 0200144 110000471837 Surface
Mine/Processing Copper
Non-Ferrous Metals
Active
119 Freeport McMoRan Tyrone NM Grant 2900159 110042056333 Surface
Mine/Processing Copper
Non-Ferrous
Metals Active
120 French Gulch Washington
Mine CA Shasta 0403425 Underground Mine Gold
Non-Ferrous Metals
Active
121 Geo Nevada Spring Valley NV Lyon 2602470 110027825030 Surface Mine Gold Non-Ferrous
Metals Active
122 Glacier Mining AK Yukon-
Koyukuk 5001386 Surface Mine Gold
Non-Ferrous Metals
Temporarily idled
Excluded
123 Glitter Enterprises Gold Bug SD Custer 3901595 Surface Mine Gold Non-Ferrous
Metals
Temporarily
idled Excluded
124 Gold Acquisition Relief
Canyon NV Pershing 2602657 Surface Mine Gold
Non-Ferrous Metals
Intermittent operation
Excluded
125 Gold Rule Placer Mine MT Powell 2402582 Surface Mine Gold Non-Ferrous
Metals
Intermittent
operation Excluded
126 Gold Run Creek AK Northwest
Arctic 5001440 Surface Mine Gold
Non-Ferrous
Metals
Intermittent
operation Excluded
127 Golden Bear OR Josephine 3503780 Surface Mine Gold Non-Ferrous
Metals
Intermittent
operation Excluded
128 Golden Queen Soledad
Mountain CA Kern 0405319 Surface Mine Gold
Non-Ferrous Metals
Intermittent operation
Excluded
129 Goldrich GNP AK Yukon-
Koyukuk 5001402 Surface Mine Gold
Non-Ferrous
Metals
Temporarily
idled Excluded
130 GoldWedge NV Nye 2602542 Underground Mine Gold Non-Ferrous
Metals Active
131 Great Salt Lake Minerals
Ogden UT 110000469920
Brine Extraction/
Processing Potash
Industrial
Rock Active
132 Greyhound Golden Eagle ID Ada 1002155 110046356144 Underground Mine Gold Non-Ferrous
Metals Active
133 Gunsinger Golden Jubilee
Mine MT Granite 2402187 Underground Mine Gold
Non-Ferrous
Metals Active
134 Hahm International Silverlake CA San
Bernardino 0405281 Surface Mine Iron Ore
Ferrous Metals
Active Excluded
135 Haile Gold Mine SC Lancaster 3800600 Surface Mine Gold Non-Ferrous
Metals Active
136 Halliburton Rossi NV Elko 2602239 110040938821 Surface Mine Barite
Barium Ore Industrial
Rock Active Excluded
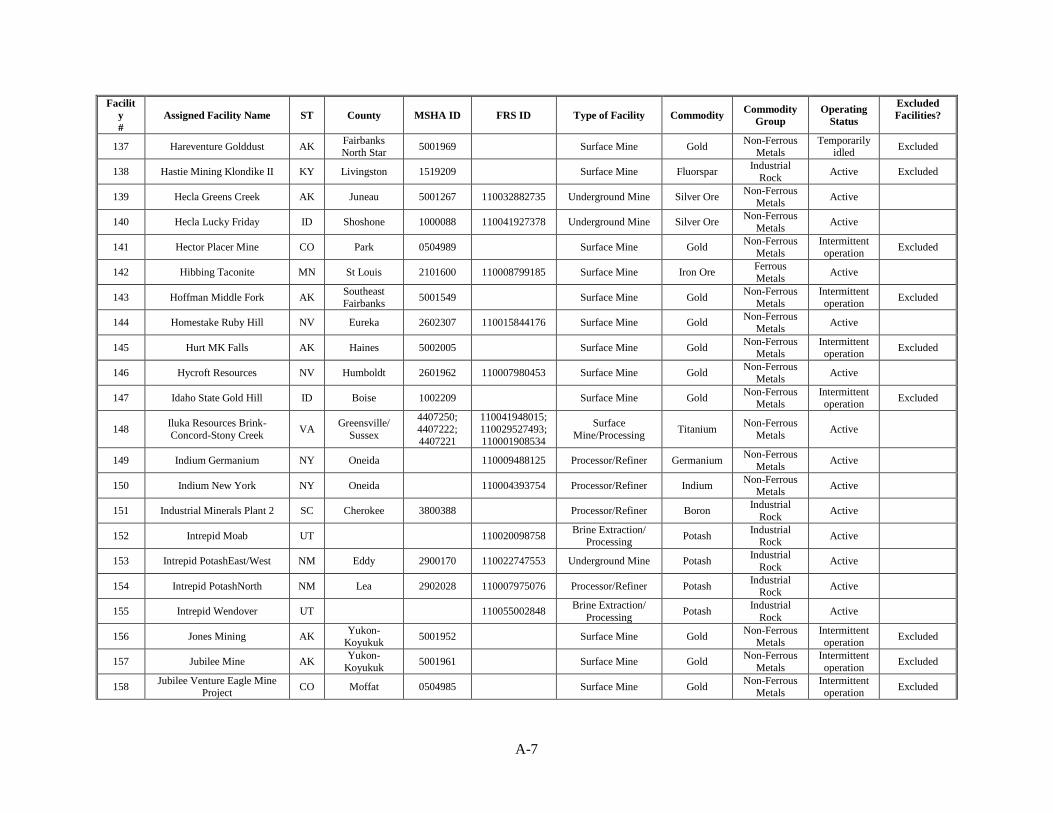
A-7
Facilit
y
#
Assigned Facility Name ST County MSHA ID FRS ID Type of Facility Commodity Commodity
Group
Operating
Status
Excluded
Facilities?
137 Hareventure Golddust AK Fairbanks North Star
5001969 Surface Mine Gold Non-Ferrous
Metals Temporarily
idled Excluded
138 Hastie Mining Klondike II KY Livingston 1519209 Surface Mine Fluorspar Industrial
Rock Active Excluded
139 Hecla Greens Creek AK Juneau 5001267 110032882735 Underground Mine Silver Ore Non-Ferrous
Metals Active
140 Hecla Lucky Friday ID Shoshone 1000088 110041927378 Underground Mine Silver Ore Non-Ferrous
Metals Active
141 Hector Placer Mine CO Park 0504989 Surface Mine Gold Non-Ferrous
Metals Intermittent operation
Excluded
142 Hibbing Taconite MN St Louis 2101600 110008799185 Surface Mine Iron Ore Ferrous
Metals Active
143 Hoffman Middle Fork AK Southeast Fairbanks
5001549 Surface Mine Gold Non-Ferrous
Metals Intermittent operation
Excluded
144 Homestake Ruby Hill NV Eureka 2602307 110015844176 Surface Mine Gold Non-Ferrous
Metals Active
145 Hurt MK Falls AK Haines 5002005 Surface Mine Gold Non-Ferrous
Metals Intermittent operation
Excluded
146 Hycroft Resources NV Humboldt 2601962 110007980453 Surface Mine Gold Non-Ferrous
Metals Active
147 Idaho State Gold Hill ID Boise 1002209 Surface Mine Gold Non-Ferrous
Metals Intermittent operation
Excluded
148 Iluka Resources Brink-
Concord-Stony Creek VA
Greensville/
Sussex
4407250;
4407222;
4407221
110041948015;
110029527493;
110001908534
Surface
Mine/Processing Titanium
Non-Ferrous
Metals Active
149 Indium Germanium NY Oneida 110009488125 Processor/Refiner Germanium Non-Ferrous
Metals Active
150 Indium New York NY Oneida 110004393754 Processor/Refiner Indium Non-Ferrous
Metals Active
151 Industrial Minerals Plant 2 SC Cherokee 3800388 Processor/Refiner Boron Industrial
Rock Active
152 Intrepid Moab UT 110020098758 Brine Extraction/
Processing Potash
Industrial Rock
Active
153 Intrepid PotashEast/West NM Eddy 2900170 110022747553 Underground Mine Potash Industrial
Rock Active
154 Intrepid PotashNorth NM Lea 2902028 110007975076 Processor/Refiner Potash Industrial
Rock Active
155 Intrepid Wendover UT 110055002848 Brine Extraction/
Processing Potash
Industrial
Rock Active
156 Jones Mining AK Yukon-
Koyukuk 5001952 Surface Mine Gold
Non-Ferrous Metals
Intermittent operation
Excluded
157 Jubilee Mine AK Yukon-
Koyukuk 5001961 Surface Mine Gold
Non-Ferrous
Metals
Intermittent
operation Excluded
158 Jubilee Venture Eagle Mine
Project CO Moffat 0504985 Surface Mine Gold
Non-Ferrous Metals
Intermittent operation
Excluded
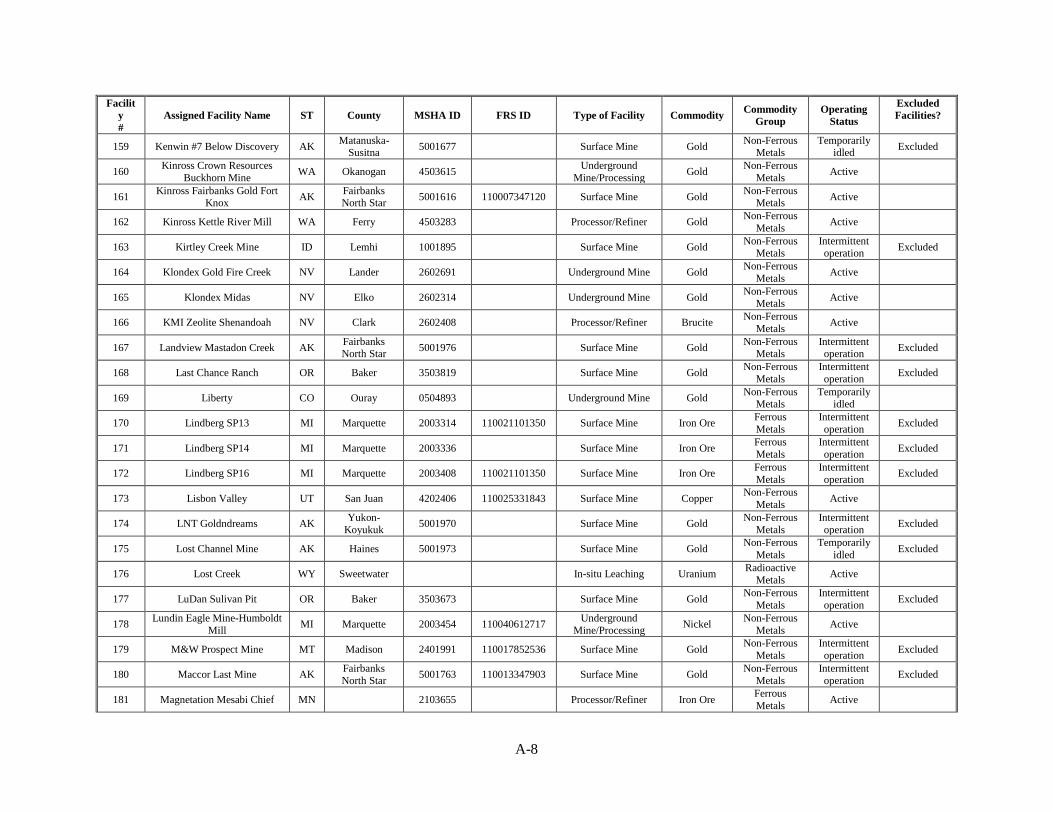
A-8
Facilit
y
#
Assigned Facility Name ST County MSHA ID FRS ID Type of Facility Commodity Commodity
Group
Operating
Status
Excluded
Facilities?
159 Kenwin #7 Below Discovery AK Matanuska-
Susitna 5001677 Surface Mine Gold
Non-Ferrous Metals
Temporarily idled
Excluded
160 Kinross Crown Resources
Buckhorn Mine WA Okanogan 4503615
Underground
Mine/Processing Gold
Non-Ferrous
Metals Active
161 Kinross Fairbanks Gold Fort
Knox AK
Fairbanks North Star
5001616 110007347120 Surface Mine Gold Non-Ferrous
Metals Active
162 Kinross Kettle River Mill WA Ferry 4503283 Processor/Refiner Gold Non-Ferrous
Metals Active
163 Kirtley Creek Mine ID Lemhi 1001895 Surface Mine Gold Non-Ferrous
Metals Intermittent operation
Excluded
164 Klondex Gold Fire Creek NV Lander 2602691 Underground Mine Gold Non-Ferrous
Metals Active
165 Klondex Midas NV Elko 2602314 Underground Mine Gold Non-Ferrous
Metals Active
166 KMI Zeolite Shenandoah NV Clark 2602408 Processor/Refiner Brucite Non-Ferrous
Metals Active
167 Landview Mastadon Creek AK Fairbanks North Star
5001976 Surface Mine Gold Non-Ferrous
Metals Intermittent operation
Excluded
168 Last Chance Ranch OR Baker 3503819 Surface Mine Gold Non-Ferrous
Metals
Intermittent
operation Excluded
169 Liberty CO Ouray 0504893 Underground Mine Gold Non-Ferrous
Metals Temporarily
idled
170 Lindberg SP13 MI Marquette 2003314 110021101350 Surface Mine Iron Ore Ferrous
Metals
Intermittent
operation Excluded
171 Lindberg SP14 MI Marquette 2003336 Surface Mine Iron Ore Ferrous
Metals
Intermittent
operation Excluded
172 Lindberg SP16 MI Marquette 2003408 110021101350 Surface Mine Iron Ore Ferrous
Metals
Intermittent
operation Excluded
173 Lisbon Valley UT San Juan 4202406 110025331843 Surface Mine Copper Non-Ferrous
Metals Active
174 LNT Goldndreams AK Yukon-
Koyukuk 5001970 Surface Mine Gold
Non-Ferrous
Metals
Intermittent
operation Excluded
175 Lost Channel Mine AK Haines 5001973 Surface Mine Gold Non-Ferrous
Metals
Temporarily
idled Excluded
176 Lost Creek WY Sweetwater In-situ Leaching Uranium Radioactive
Metals Active
177 LuDan Sulivan Pit OR Baker 3503673 Surface Mine Gold Non-Ferrous
Metals
Intermittent
operation Excluded
178 Lundin Eagle Mine-Humboldt
Mill MI Marquette 2003454 110040612717
Underground
Mine/Processing Nickel
Non-Ferrous
Metals Active
179 M&W Prospect Mine MT Madison 2401991 110017852536 Surface Mine Gold Non-Ferrous
Metals
Intermittent
operation Excluded
180 Maccor Last Mine AK Fairbanks
North Star 5001763 110013347903 Surface Mine Gold
Non-Ferrous
Metals
Intermittent
operation Excluded
181 Magnetation Mesabi Chief MN 2103655 Processor/Refiner Iron Ore Ferrous
Metals Active
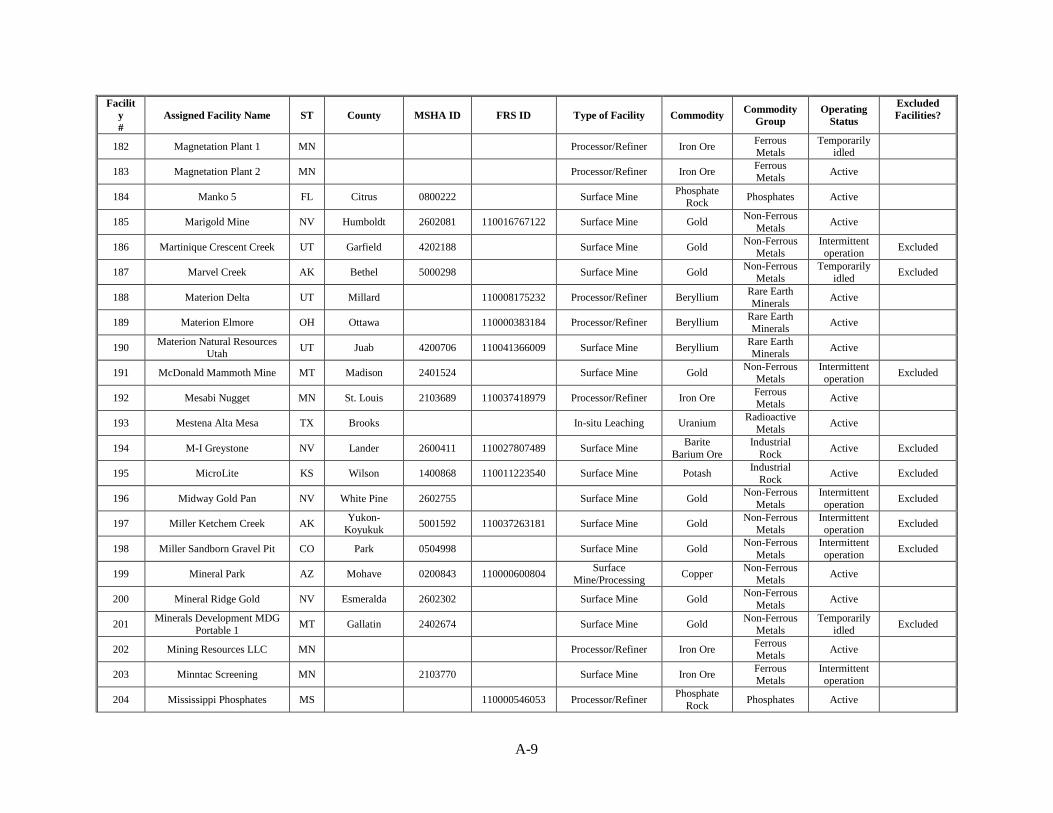
A-9
Facilit
y
#
Assigned Facility Name ST County MSHA ID FRS ID Type of Facility Commodity Commodity
Group
Operating
Status
Excluded
Facilities?
182 Magnetation Plant 1 MN Processor/Refiner Iron Ore Ferrous Metals
Temporarily idled
183 Magnetation Plant 2 MN Processor/Refiner Iron Ore Ferrous
Metals Active
184 Manko 5 FL Citrus 0800222 Surface Mine Phosphate
Rock Phosphates Active
185 Marigold Mine NV Humboldt 2602081 110016767122 Surface Mine Gold Non-Ferrous
Metals Active
186 Martinique Crescent Creek UT Garfield 4202188 Surface Mine Gold Non-Ferrous
Metals Intermittent operation
Excluded
187 Marvel Creek AK Bethel 5000298 Surface Mine Gold Non-Ferrous
Metals
Temporarily
idled Excluded
188 Materion Delta UT Millard 110008175232 Processor/Refiner Beryllium Rare Earth Minerals
Active
189 Materion Elmore OH Ottawa 110000383184 Processor/Refiner Beryllium Rare Earth
Minerals Active
190 Materion Natural Resources
Utah UT Juab 4200706 110041366009 Surface Mine Beryllium
Rare Earth Minerals
Active
191 McDonald Mammoth Mine MT Madison 2401524 Surface Mine Gold Non-Ferrous
Metals
Intermittent
operation Excluded
192 Mesabi Nugget MN St. Louis 2103689 110037418979 Processor/Refiner Iron Ore Ferrous Metals
Active
193 Mestena Alta Mesa TX Brooks In-situ Leaching Uranium Radioactive
Metals Active
194 M-I Greystone NV Lander 2600411 110027807489 Surface Mine Barite
Barium Ore
Industrial
Rock Active Excluded
195 MicroLite KS Wilson 1400868 110011223540 Surface Mine Potash Industrial
Rock Active Excluded
196 Midway Gold Pan NV White Pine 2602755 Surface Mine Gold Non-Ferrous
Metals
Intermittent
operation Excluded
197 Miller Ketchem Creek AK Yukon-
Koyukuk 5001592 110037263181 Surface Mine Gold
Non-Ferrous
Metals
Intermittent
operation Excluded
198 Miller Sandborn Gravel Pit CO Park 0504998 Surface Mine Gold Non-Ferrous
Metals
Intermittent
operation Excluded
199 Mineral Park AZ Mohave 0200843 110000600804 Surface
Mine/Processing Copper
Non-Ferrous
Metals Active
200 Mineral Ridge Gold NV Esmeralda 2602302 Surface Mine Gold Non-Ferrous
Metals Active
201 Minerals Development MDG
Portable 1 MT Gallatin 2402674 Surface Mine Gold
Non-Ferrous
Metals
Temporarily
idled Excluded
202 Mining Resources LLC MN Processor/Refiner Iron Ore Ferrous
Metals Active
203 Minntac Screening MN 2103770 Surface Mine Iron Ore Ferrous
Metals
Intermittent
operation
204 Mississippi Phosphates MS 110000546053 Processor/Refiner Phosphate
Rock Phosphates Active
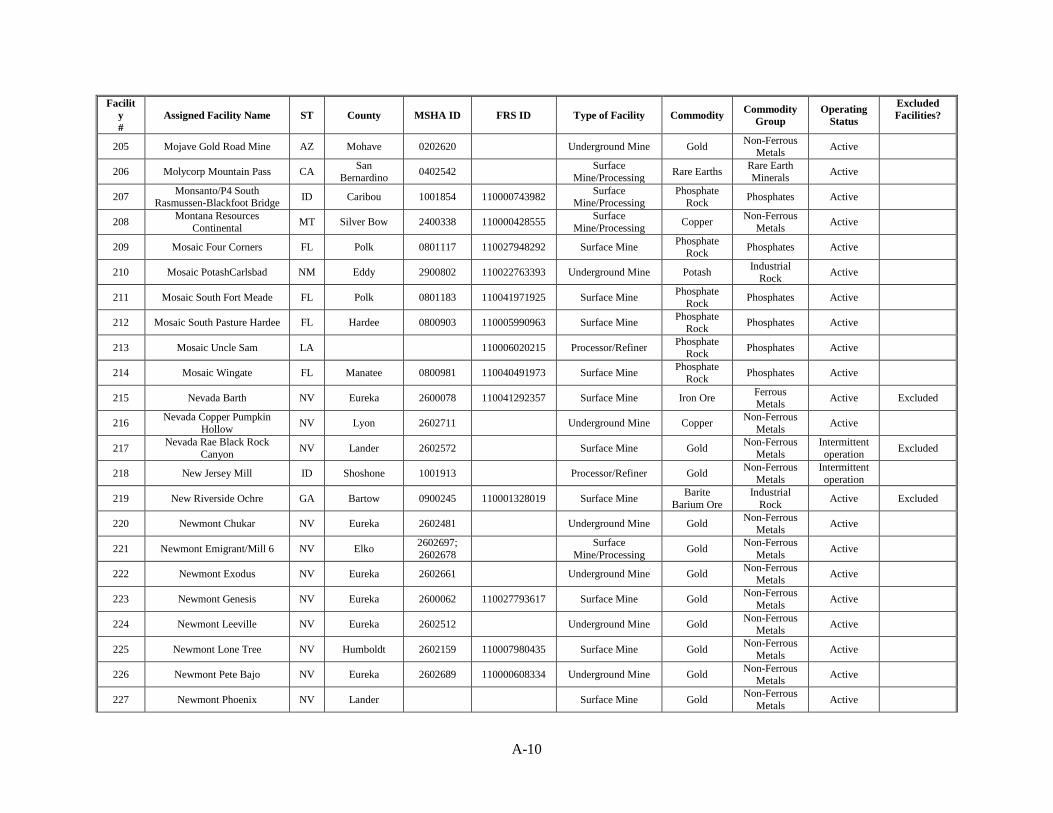
A-10
Facilit
y
#
Assigned Facility Name ST County MSHA ID FRS ID Type of Facility Commodity Commodity
Group
Operating
Status
Excluded
Facilities?
205 Mojave Gold Road Mine AZ Mohave 0202620 Underground Mine Gold Non-Ferrous
Metals Active
206 Molycorp Mountain Pass CA San
Bernardino 0402542
Surface
Mine/Processing Rare Earths
Rare Earth
Minerals Active
207 Monsanto/P4 South
Rasmussen-Blackfoot Bridge ID Caribou 1001854 110000743982
Surface Mine/Processing
Phosphate Rock
Phosphates Active
208 Montana Resources
Continental MT Silver Bow 2400338 110000428555
Surface
Mine/Processing Copper
Non-Ferrous
Metals Active
209 Mosaic Four Corners FL Polk 0801117 110027948292 Surface Mine Phosphate
Rock Phosphates Active
210 Mosaic PotashCarlsbad NM Eddy 2900802 110022763393 Underground Mine Potash Industrial
Rock Active
211 Mosaic South Fort Meade FL Polk 0801183 110041971925 Surface Mine Phosphate
Rock Phosphates Active
212 Mosaic South Pasture Hardee FL Hardee 0800903 110005990963 Surface Mine Phosphate
Rock Phosphates Active
213 Mosaic Uncle Sam LA 110006020215 Processor/Refiner Phosphate
Rock Phosphates Active
214 Mosaic Wingate FL Manatee 0800981 110040491973 Surface Mine Phosphate
Rock Phosphates Active
215 Nevada Barth NV Eureka 2600078 110041292357 Surface Mine Iron Ore Ferrous Metals
Active Excluded
216 Nevada Copper Pumpkin
Hollow NV Lyon 2602711 Underground Mine Copper
Non-Ferrous
Metals Active
217 Nevada Rae Black Rock
Canyon NV Lander 2602572 Surface Mine Gold
Non-Ferrous
Metals
Intermittent
operation Excluded
218 New Jersey Mill ID Shoshone 1001913 Processor/Refiner Gold Non-Ferrous
Metals
Intermittent
operation
219 New Riverside Ochre GA Bartow 0900245 110001328019 Surface Mine Barite
Barium Ore
Industrial
Rock Active Excluded
220 Newmont Chukar NV Eureka 2602481 Underground Mine Gold Non-Ferrous
Metals Active
221 Newmont Emigrant/Mill 6 NV Elko 2602697;
2602678
Surface
Mine/Processing Gold
Non-Ferrous
Metals Active
222 Newmont Exodus NV Eureka 2602661 Underground Mine Gold Non-Ferrous
Metals Active
223 Newmont Genesis NV Eureka 2600062 110027793617 Surface Mine Gold Non-Ferrous
Metals Active
224 Newmont Leeville NV Eureka 2602512 Underground Mine Gold Non-Ferrous
Metals Active
225 Newmont Lone Tree NV Humboldt 2602159 110007980435 Surface Mine Gold Non-Ferrous
Metals Active
226 Newmont Pete Bajo NV Eureka 2602689 110000608334 Underground Mine Gold Non-Ferrous
Metals Active
227 Newmont Phoenix NV Lander Surface Mine Gold Non-Ferrous
Metals Active
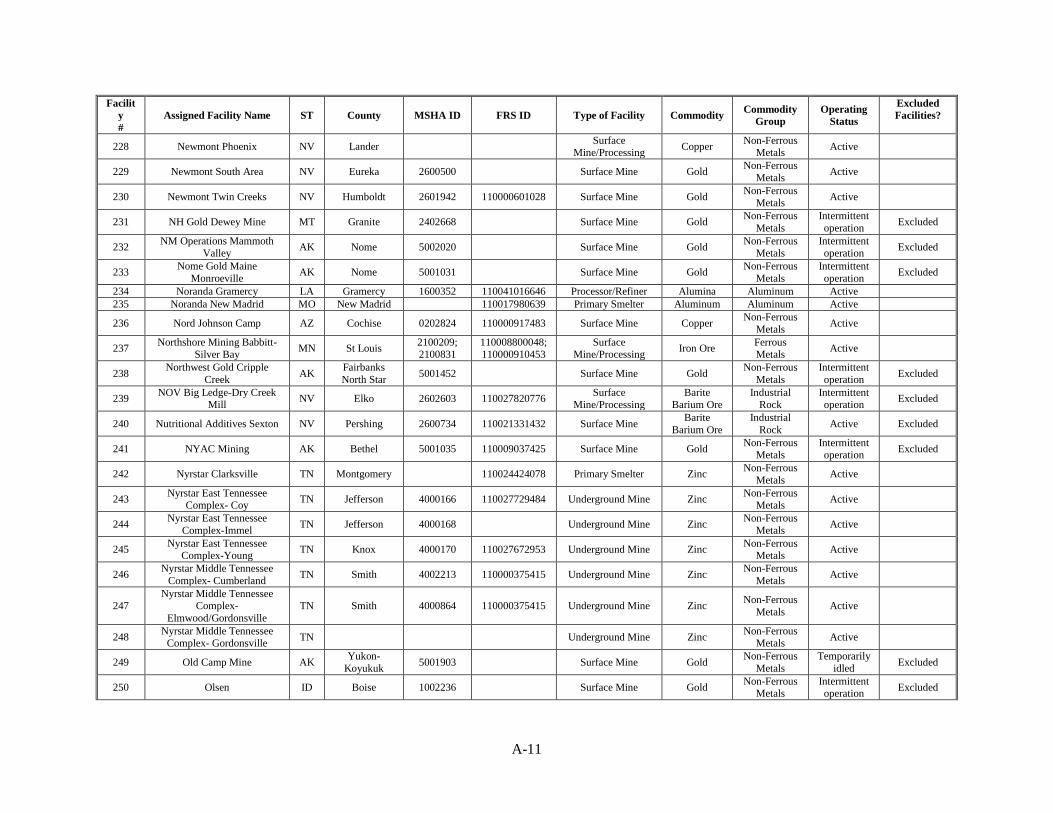
A-11
Facilit
y
#
Assigned Facility Name ST County MSHA ID FRS ID Type of Facility Commodity Commodity
Group
Operating
Status
Excluded
Facilities?
228 Newmont Phoenix NV Lander Surface
Mine/Processing Copper
Non-Ferrous Metals
Active
229 Newmont South Area NV Eureka 2600500 Surface Mine Gold Non-Ferrous
Metals Active
230 Newmont Twin Creeks NV Humboldt 2601942 110000601028 Surface Mine Gold Non-Ferrous
Metals Active
231 NH Gold Dewey Mine MT Granite 2402668 Surface Mine Gold Non-Ferrous
Metals
Intermittent
operation Excluded
232 NM Operations Mammoth
Valley AK Nome 5002020 Surface Mine Gold
Non-Ferrous Metals
Intermittent operation
Excluded
233 Nome Gold Maine
Monroeville AK Nome 5001031 Surface Mine Gold
Non-Ferrous
Metals
Intermittent
operation Excluded
234 Noranda Gramercy LA Gramercy 1600352 110041016646 Processor/Refiner Alumina Aluminum Active
235 Noranda New Madrid MO New Madrid 110017980639 Primary Smelter Aluminum Aluminum Active
236 Nord Johnson Camp AZ Cochise 0202824 110000917483 Surface Mine Copper Non-Ferrous
Metals Active
237 Northshore Mining Babbitt-
Silver Bay MN St Louis
2100209; 2100831
110008800048; 110000910453
Surface Mine/Processing
Iron Ore Ferrous Metals
Active
238 Northwest Gold Cripple
Creek AK
Fairbanks
North Star 5001452 Surface Mine Gold
Non-Ferrous
Metals
Intermittent
operation Excluded
239 NOV Big Ledge-Dry Creek
Mill NV Elko 2602603 110027820776
Surface Mine/Processing
Barite Barium Ore
Industrial Rock
Intermittent operation
Excluded
240 Nutritional Additives Sexton NV Pershing 2600734 110021331432 Surface Mine Barite
Barium Ore
Industrial
Rock Active Excluded
241 NYAC Mining AK Bethel 5001035 110009037425 Surface Mine Gold Non-Ferrous
Metals Intermittent operation
Excluded
242 Nyrstar Clarksville TN Montgomery 110024424078 Primary Smelter Zinc Non-Ferrous
Metals Active
243 Nyrstar East Tennessee
Complex- Coy TN Jefferson 4000166 110027729484 Underground Mine Zinc
Non-Ferrous Metals
Active
244 Nyrstar East Tennessee
Complex-Immel TN Jefferson 4000168 Underground Mine Zinc
Non-Ferrous
Metals Active
245 Nyrstar East Tennessee
Complex-Young TN Knox 4000170 110027672953 Underground Mine Zinc
Non-Ferrous Metals
Active
246 Nyrstar Middle Tennessee
Complex- Cumberland TN Smith 4002213 110000375415 Underground Mine Zinc
Non-Ferrous
Metals Active
247 Nyrstar Middle Tennessee
Complex-
Elmwood/Gordonsville
TN Smith 4000864 110000375415 Underground Mine Zinc Non-Ferrous
Metals Active
248 Nyrstar Middle Tennessee
Complex- Gordonsville TN Underground Mine Zinc
Non-Ferrous Metals
Active
249 Old Camp Mine AK Yukon-
Koyukuk 5001903 Surface Mine Gold
Non-Ferrous
Metals
Temporarily
idled Excluded
250 Olsen ID Boise 1002236 Surface Mine Gold Non-Ferrous
Metals Intermittent operation
Excluded
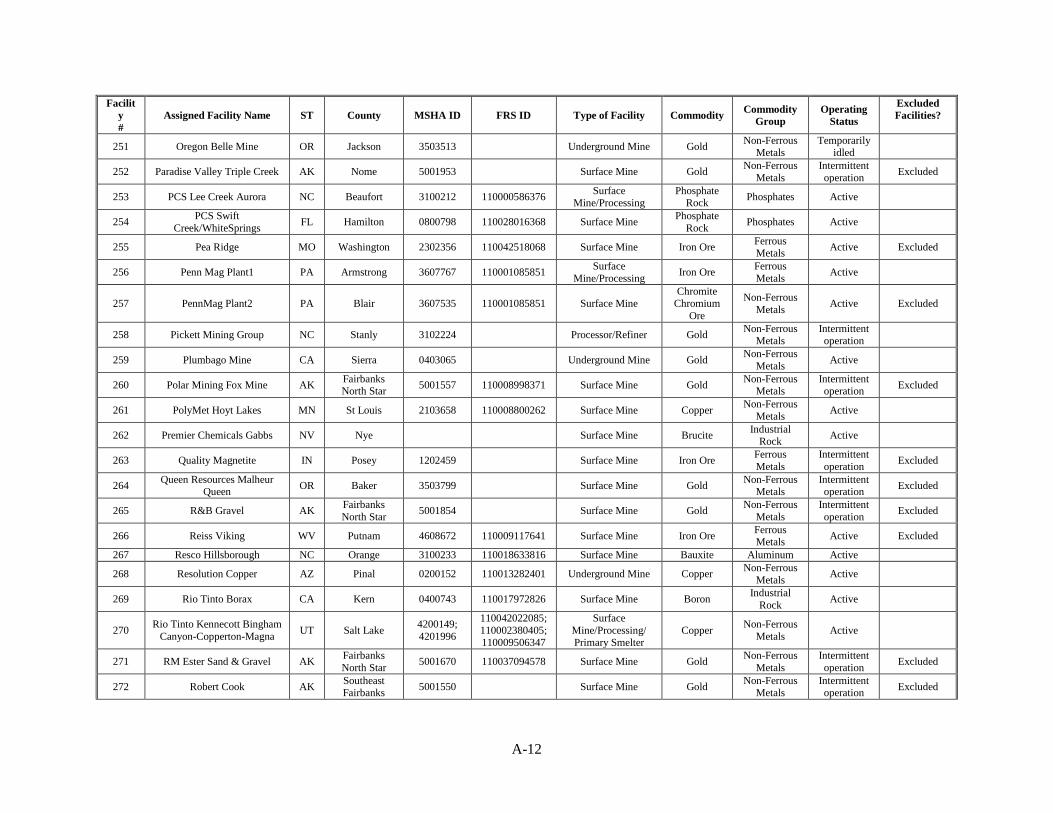
A-12
Facilit
y
#
Assigned Facility Name ST County MSHA ID FRS ID Type of Facility Commodity Commodity
Group
Operating
Status
Excluded
Facilities?
251 Oregon Belle Mine OR Jackson 3503513 Underground Mine Gold Non-Ferrous
Metals Temporarily
idled
252 Paradise Valley Triple Creek AK Nome 5001953 Surface Mine Gold Non-Ferrous
Metals
Intermittent
operation Excluded
253 PCS Lee Creek Aurora NC Beaufort 3100212 110000586376 Surface
Mine/Processing Phosphate
Rock Phosphates Active
254 PCS Swift
Creek/WhiteSprings FL Hamilton 0800798 110028016368 Surface Mine
Phosphate
Rock Phosphates Active
255 Pea Ridge MO Washington 2302356 110042518068 Surface Mine Iron Ore Ferrous Metals
Active Excluded
256 Penn Mag Plant1 PA Armstrong 3607767 110001085851 Surface
Mine/Processing Iron Ore
Ferrous
Metals Active
257 PennMag Plant2 PA Blair 3607535 110001085851 Surface Mine Chromite
Chromium
Ore
Non-Ferrous
Metals Active Excluded
258 Pickett Mining Group NC Stanly 3102224 Processor/Refiner Gold Non-Ferrous
Metals Intermittent operation
259 Plumbago Mine CA Sierra 0403065 Underground Mine Gold Non-Ferrous
Metals Active
260 Polar Mining Fox Mine AK Fairbanks North Star
5001557 110008998371 Surface Mine Gold Non-Ferrous
Metals Intermittent operation
Excluded
261 PolyMet Hoyt Lakes MN St Louis 2103658 110008800262 Surface Mine Copper Non-Ferrous
Metals Active
262 Premier Chemicals Gabbs NV Nye Surface Mine Brucite Industrial
Rock Active
263 Quality Magnetite IN Posey 1202459 Surface Mine Iron Ore Ferrous
Metals
Intermittent
operation Excluded
264 Queen Resources Malheur
Queen OR Baker 3503799 Surface Mine Gold
Non-Ferrous Metals
Intermittent operation
Excluded
265 R&B Gravel AK Fairbanks
North Star 5001854 Surface Mine Gold
Non-Ferrous
Metals
Intermittent
operation Excluded
266 Reiss Viking WV Putnam 4608672 110009117641 Surface Mine Iron Ore Ferrous Metals
Active Excluded
267 Resco Hillsborough NC Orange 3100233 110018633816 Surface Mine Bauxite Aluminum Active
268 Resolution Copper AZ Pinal 0200152 110013282401 Underground Mine Copper Non-Ferrous
Metals Active
269 Rio Tinto Borax CA Kern 0400743 110017972826 Surface Mine Boron Industrial
Rock Active
270 Rio Tinto Kennecott Bingham
Canyon-Copperton-Magna UT Salt Lake
4200149;
4201996
110042022085;
110002380405; 110009506347
Surface
Mine/Processing/ Primary Smelter
Copper Non-Ferrous
Metals Active
271 RM Ester Sand & Gravel AK Fairbanks
North Star 5001670 110037094578 Surface Mine Gold
Non-Ferrous
Metals
Intermittent
operation Excluded
272 Robert Cook AK Southeast Fairbanks
5001550 Surface Mine Gold Non-Ferrous
Metals Intermittent operation
Excluded
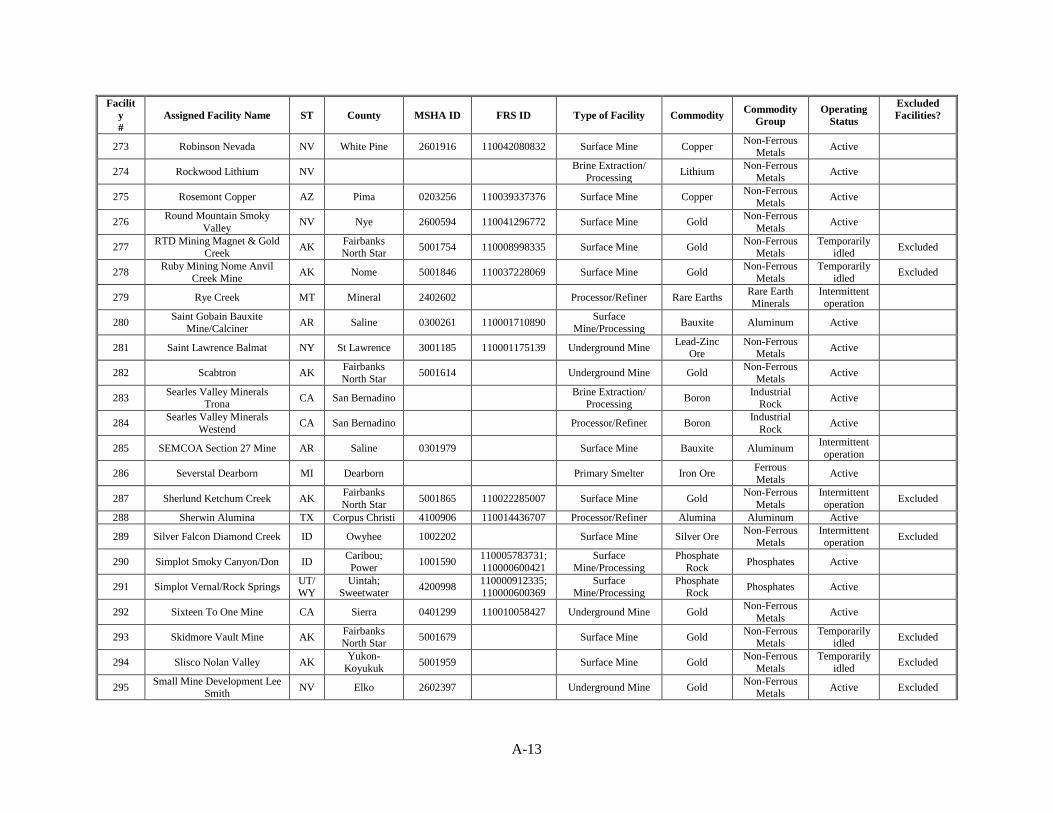
A-13
Facilit
y
#
Assigned Facility Name ST County MSHA ID FRS ID Type of Facility Commodity Commodity
Group
Operating
Status
Excluded
Facilities?
273 Robinson Nevada NV White Pine 2601916 110042080832 Surface Mine Copper Non-Ferrous
Metals Active
274 Rockwood Lithium NV Brine Extraction/
Processing Lithium
Non-Ferrous
Metals Active
275 Rosemont Copper AZ Pima 0203256 110039337376 Surface Mine Copper Non-Ferrous
Metals Active
276 Round Mountain Smoky
Valley NV Nye 2600594 110041296772 Surface Mine Gold
Non-Ferrous
Metals Active
277 RTD Mining Magnet & Gold
Creek AK
Fairbanks North Star
5001754 110008998335 Surface Mine Gold Non-Ferrous
Metals Temporarily
idled Excluded
278 Ruby Mining Nome Anvil
Creek Mine AK Nome 5001846 110037228069 Surface Mine Gold
Non-Ferrous
Metals
Temporarily
idled Excluded
279 Rye Creek MT Mineral 2402602 Processor/Refiner Rare Earths Rare Earth Minerals
Intermittent operation
280 Saint Gobain Bauxite
Mine/Calciner AR Saline 0300261 110001710890
Surface
Mine/Processing Bauxite Aluminum Active
281 Saint Lawrence Balmat NY St Lawrence 3001185 110001175139 Underground Mine Lead-Zinc
Ore Non-Ferrous
Metals Active
282 Scabtron AK Fairbanks
North Star 5001614 Underground Mine Gold
Non-Ferrous
Metals Active
283 Searles Valley Minerals
Trona CA San Bernadino
Brine Extraction/ Processing
Boron Industrial
Rock Active
284 Searles Valley Minerals
Westend CA San Bernadino Processor/Refiner Boron
Industrial
Rock Active
285 SEMCOA Section 27 Mine AR Saline 0301979 Surface Mine Bauxite Aluminum Intermittent
operation
286 Severstal Dearborn MI Dearborn Primary Smelter Iron Ore Ferrous
Metals Active
287 Sherlund Ketchum Creek AK Fairbanks
North Star 5001865 110022285007 Surface Mine Gold
Non-Ferrous
Metals
Intermittent
operation Excluded
288 Sherwin Alumina TX Corpus Christi 4100906 110014436707 Processor/Refiner Alumina Aluminum Active
289 Silver Falcon Diamond Creek ID Owyhee 1002202 Surface Mine Silver Ore Non-Ferrous
Metals Intermittent operation
Excluded
290 Simplot Smoky Canyon/Don ID Caribou;
Power 1001590
110005783731;
110000600421
Surface
Mine/Processing
Phosphate
Rock Phosphates Active
291 Simplot Vernal/Rock Springs UT/ WY
Uintah; Sweetwater
4200998 110000912335; 110000600369
Surface Mine/Processing
Phosphate Rock
Phosphates Active
292 Sixteen To One Mine CA Sierra 0401299 110010058427 Underground Mine Gold Non-Ferrous
Metals Active
293 Skidmore Vault Mine AK Fairbanks North Star
5001679 Surface Mine Gold Non-Ferrous
Metals Temporarily
idled Excluded
294 Slisco Nolan Valley AK Yukon-
Koyukuk 5001959 Surface Mine Gold
Non-Ferrous
Metals
Temporarily
idled Excluded
295 Small Mine Development Lee
Smith NV Elko 2602397 Underground Mine Gold
Non-Ferrous Metals
Active Excluded
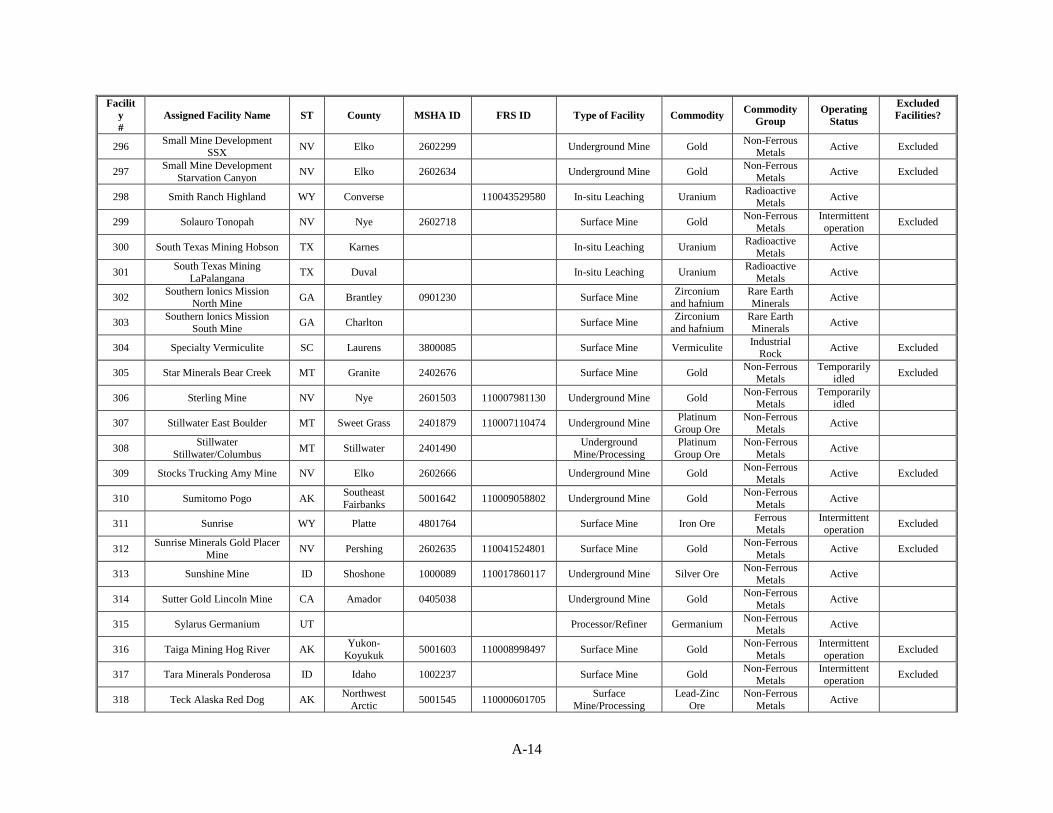
A-14
Facilit
y
#
Assigned Facility Name ST County MSHA ID FRS ID Type of Facility Commodity Commodity
Group
Operating
Status
Excluded
Facilities?
296 Small Mine Development
SSX NV Elko 2602299 Underground Mine Gold
Non-Ferrous Metals
Active Excluded
297 Small Mine Development
Starvation Canyon NV Elko 2602634 Underground Mine Gold
Non-Ferrous
Metals Active Excluded
298 Smith Ranch Highland WY Converse 110043529580 In-situ Leaching Uranium Radioactive
Metals Active
299 Solauro Tonopah NV Nye 2602718 Surface Mine Gold Non-Ferrous
Metals
Intermittent
operation Excluded
300 South Texas Mining Hobson TX Karnes In-situ Leaching Uranium Radioactive
Metals Active
301 South Texas Mining
LaPalangana TX Duval In-situ Leaching Uranium
Radioactive
Metals Active
302 Southern Ionics Mission
North Mine GA Brantley 0901230 Surface Mine
Zirconium and hafnium
Rare Earth Minerals
Active
303 Southern Ionics Mission
South Mine GA Charlton Surface Mine
Zirconium
and hafnium
Rare Earth
Minerals Active
304 Specialty Vermiculite SC Laurens 3800085 Surface Mine Vermiculite Industrial
Rock Active Excluded
305 Star Minerals Bear Creek MT Granite 2402676 Surface Mine Gold Non-Ferrous
Metals
Temporarily
idled Excluded
306 Sterling Mine NV Nye 2601503 110007981130 Underground Mine Gold Non-Ferrous
Metals Temporarily
idled
307 Stillwater East Boulder MT Sweet Grass 2401879 110007110474 Underground Mine Platinum
Group Ore
Non-Ferrous
Metals Active
308 Stillwater
Stillwater/Columbus MT Stillwater 2401490
Underground
Mine/Processing
Platinum
Group Ore
Non-Ferrous
Metals Active
309 Stocks Trucking Amy Mine NV Elko 2602666 Underground Mine Gold Non-Ferrous
Metals Active Excluded
310 Sumitomo Pogo AK Southeast
Fairbanks 5001642 110009058802 Underground Mine Gold
Non-Ferrous
Metals Active
311 Sunrise WY Platte 4801764 Surface Mine Iron Ore Ferrous
Metals
Intermittent
operation Excluded
312 Sunrise Minerals Gold Placer
Mine NV Pershing 2602635 110041524801 Surface Mine Gold
Non-Ferrous
Metals Active Excluded
313 Sunshine Mine ID Shoshone 1000089 110017860117 Underground Mine Silver Ore Non-Ferrous
Metals Active
314 Sutter Gold Lincoln Mine CA Amador 0405038 Underground Mine Gold Non-Ferrous
Metals Active
315 Sylarus Germanium UT Processor/Refiner Germanium Non-Ferrous
Metals Active
316 Taiga Mining Hog River AK Yukon-
Koyukuk 5001603 110008998497 Surface Mine Gold
Non-Ferrous
Metals
Intermittent
operation Excluded
317 Tara Minerals Ponderosa ID Idaho 1002237 Surface Mine Gold Non-Ferrous
Metals
Intermittent
operation Excluded
318 Teck Alaska Red Dog AK Northwest
Arctic 5001545 110000601705
Surface
Mine/Processing
Lead-Zinc
Ore
Non-Ferrous
Metals Active
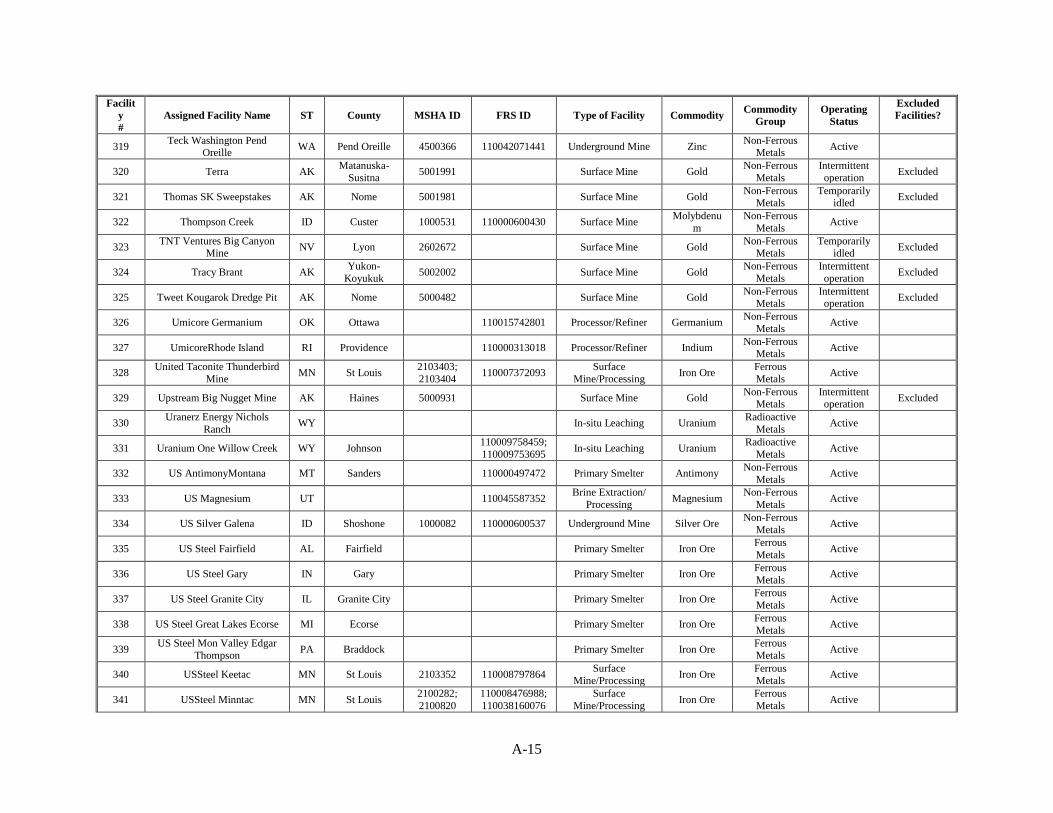
A-15
Facilit
y
#
Assigned Facility Name ST County MSHA ID FRS ID Type of Facility Commodity Commodity
Group
Operating
Status
Excluded
Facilities?
319 Teck Washington Pend
Oreille WA Pend Oreille 4500366 110042071441 Underground Mine Zinc
Non-Ferrous Metals
Active
320 Terra AK Matanuska-
Susitna 5001991 Surface Mine Gold
Non-Ferrous
Metals
Intermittent
operation Excluded
321 Thomas SK Sweepstakes AK Nome 5001981 Surface Mine Gold Non-Ferrous
Metals Temporarily
idled Excluded
322 Thompson Creek ID Custer 1000531 110000600430 Surface Mine Molybdenu
m
Non-Ferrous
Metals Active
323 TNT Ventures Big Canyon
Mine NV Lyon 2602672 Surface Mine Gold
Non-Ferrous Metals
Temporarily idled
Excluded
324 Tracy Brant AK Yukon-
Koyukuk 5002002 Surface Mine Gold
Non-Ferrous
Metals
Intermittent
operation Excluded
325 Tweet Kougarok Dredge Pit AK Nome 5000482 Surface Mine Gold Non-Ferrous
Metals Intermittent operation
Excluded
326 Umicore Germanium OK Ottawa 110015742801 Processor/Refiner Germanium Non-Ferrous
Metals Active
327 UmicoreRhode Island RI Providence 110000313018 Processor/Refiner Indium Non-Ferrous
Metals Active
328 United Taconite Thunderbird
Mine MN St Louis
2103403;
2103404 110007372093
Surface
Mine/Processing Iron Ore
Ferrous
Metals Active
329 Upstream Big Nugget Mine AK Haines 5000931 Surface Mine Gold Non-Ferrous
Metals Intermittent operation
Excluded
330 Uranerz Energy Nichols
Ranch WY In-situ Leaching Uranium
Radioactive
Metals Active
331 Uranium One Willow Creek WY Johnson 110009758459;
110009753695 In-situ Leaching Uranium
Radioactive
Metals Active
332 US AntimonyMontana MT Sanders 110000497472 Primary Smelter Antimony Non-Ferrous
Metals Active
333 US Magnesium UT 110045587352 Brine Extraction/
Processing Magnesium
Non-Ferrous
Metals Active
334 US Silver Galena ID Shoshone 1000082 110000600537 Underground Mine Silver Ore Non-Ferrous
Metals Active
335 US Steel Fairfield AL Fairfield Primary Smelter Iron Ore Ferrous
Metals Active
336 US Steel Gary IN Gary Primary Smelter Iron Ore Ferrous
Metals Active
337 US Steel Granite City IL Granite City Primary Smelter Iron Ore Ferrous
Metals Active
338 US Steel Great Lakes Ecorse MI Ecorse Primary Smelter Iron Ore Ferrous
Metals Active
339 US Steel Mon Valley Edgar
Thompson PA Braddock Primary Smelter Iron Ore
Ferrous
Metals Active
340 USSteel Keetac MN St Louis 2103352 110008797864 Surface
Mine/Processing Iron Ore
Ferrous
Metals Active
341 USSteel Minntac MN St Louis 2100282;
2100820
110008476988;
110038160076
Surface
Mine/Processing Iron Ore
Ferrous
Metals Active
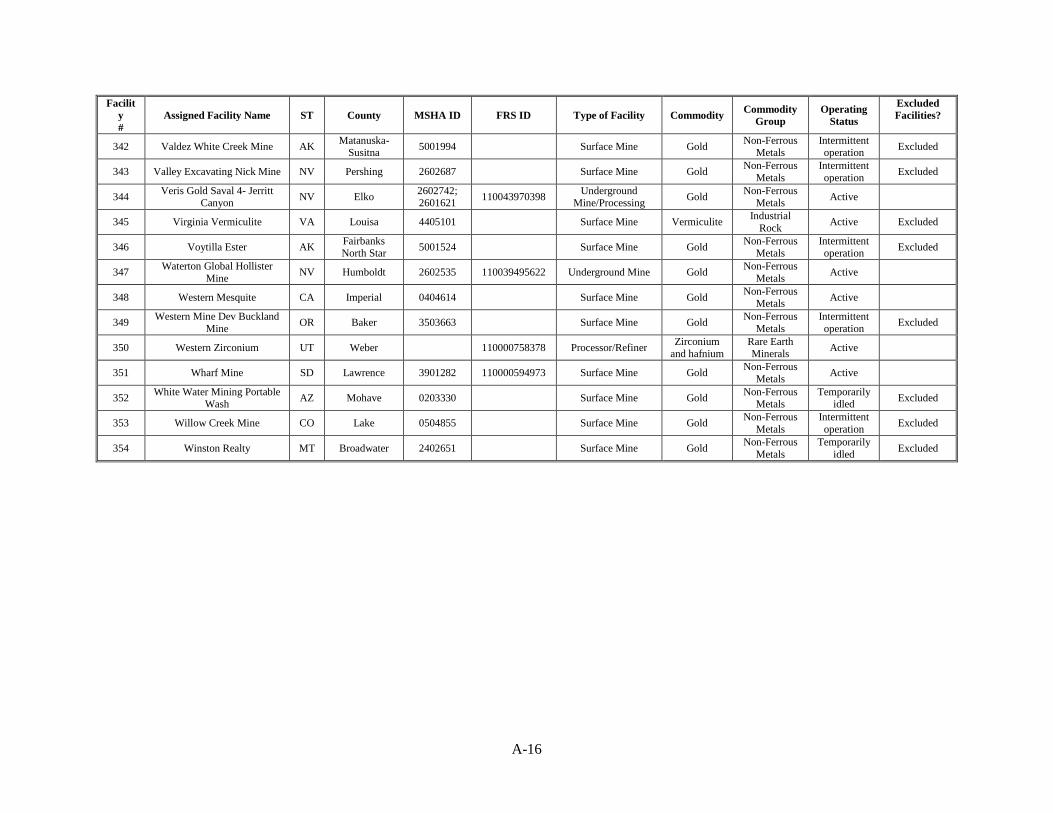
A-16
Facilit
y
#
Assigned Facility Name ST County MSHA ID FRS ID Type of Facility Commodity Commodity
Group
Operating
Status
Excluded
Facilities?
342 Valdez White Creek Mine AK Matanuska-
Susitna 5001994 Surface Mine Gold
Non-Ferrous Metals
Intermittent operation
Excluded
343 Valley Excavating Nick Mine NV Pershing 2602687 Surface Mine Gold Non-Ferrous
Metals
Intermittent
operation Excluded
344 Veris Gold Saval 4- Jerritt
Canyon NV Elko
2602742; 2601621
110043970398 Underground
Mine/Processing Gold
Non-Ferrous Metals
Active
345 Virginia Vermiculite VA Louisa 4405101 Surface Mine Vermiculite Industrial
Rock Active Excluded
346 Voytilla Ester AK Fairbanks North Star
5001524 Surface Mine Gold Non-Ferrous
Metals Intermittent operation
Excluded
347 Waterton Global Hollister
Mine NV Humboldt 2602535 110039495622 Underground Mine Gold
Non-Ferrous
Metals Active
348 Western Mesquite CA Imperial 0404614 Surface Mine Gold Non-Ferrous
Metals Active
349 Western Mine Dev Buckland
Mine OR Baker 3503663 Surface Mine Gold
Non-Ferrous
Metals
Intermittent
operation Excluded
350 Western Zirconium UT Weber 110000758378 Processor/Refiner Zirconium
and hafnium Rare Earth Minerals
Active
351 Wharf Mine SD Lawrence 3901282 110000594973 Surface Mine Gold Non-Ferrous
Metals Active
352 White Water Mining Portable
Wash AZ Mohave 0203330 Surface Mine Gold
Non-Ferrous Metals
Temporarily idled
Excluded
353 Willow Creek Mine CO Lake 0504855 Surface Mine Gold Non-Ferrous
Metals
Intermittent
operation Excluded
354 Winston Realty MT Broadwater 2402651 Surface Mine Gold Non-Ferrous
Metals
Temporarily
idled Excluded
B-1
Appendix B. Technical Background on the Development of the
Maximum Financial Responsibility and Reduction Formulas
This appendix describes the development of the formulas used to calculate the financial
responsibility amount and applicable reductions under the performance standard reduction
regime for the modeled universe. It then presents the results of the financial responsibility and
reductions formulas on a cost by cost basis for each facility in the modeled universe.
B.1. Financial Responsibility Formula
To estimate the maximum financial responsibility obligation for the sample of 49 currently
operating facilities, EPA first analyzed the transactional and consequential payment experience
of Superfund. EPA was ultimately unable to categorize the transactional payments expended by
Superfund into consequential activities. In the absence of useable transactional data, EPA
developed and applied the cost formula described in the Financial Responsibility Formula
Background Document based on activities that reflected the payment experience of the fund.124
This section provide summary of the cost formula, and the estimation maximum financial
responsibility amount for 49 facilities in the modeled universe.
Summary of Cost Formula
EPA developed the nationally applicable cost formula to calculate financial responsibility (FR)
for hardrock mining facilities (HRMFs). The formula accounts all CERCLA Section 107
liabilities, which include the natural resource damages (NRD), health assessment (HA)
component, and response components. The formula is an Excel based spreadsheet that
automatically calculates site-based FR based on facility-specific and environmental data.
The cost formula was developed using data from a sample of currently operating facilities with
available data. The criteria for the sample selection were the following: (1) collect data for a set
of facilities with the highest quality cost information available and (2) select a set of facilities
representative of the range of states and commodities that comprise the full universe. To ensure
high quality cost data, the formula uses data for facilities with reclamation and closure plans and
similar documents generated in the past ten years providing engineering cost estimates for
closure and post-closure tasks. To ensure geographic representativeness, the formula uses data
for eight states that, together, contain over 60 percent of the universe: Nevada, Alaska, Arizona,
Montana, Utah, California, Idaho, and Minnesota. Where available, the model relies upon
publicly available data collected from state government websites and personnel at state agencies.
To select the sample, the model uses a set of facilities that matched the distribution of facilities in
the full universe in terms of geography and commodities produced for which high quality
engineering cost estimates were available. For example, engineering cost data were available for
more facilities in Nevada than any other state; however, to ensure the overall representativeness
of the sample, the model includes more facilities located in other states and omits some facilities
in Nevada so that one state was not over-represented in the sample.
124 U.S. Environmental Protection Agency, “CERCLA 108(b) Financial Responsibility Formula for Hardrock
Mining Facilities Background Document,” Office of Land and Emergency Management (September 2016).
B-2
Ultimately, EPA collected data from cost estimates generated by a sample of 63 currently
operating facilities. EPA found that the sample did not provide sufficient data on water
treatments costs, and supplemented the sample with water treatment cost data from an additional
three historical CERCLA sites.125
To estimate the response component for the sample of facilities, the engineering cost formula
relies on a series of regression analyses that relate specific types of response component
categories (e.g., capital costs to complete source control for an open pit, annual O&M costs for
water treatment) to various facility-specific characteristics (e.g., disturbed acres of open pit, total
facility-wide acreage). The engineering estimates from the reclamation and closure plans
described above are the dependent variables. The same plans include information on feature-
specific and facility-specific acreages, which are among the independent (or explanatory)
variables considered in the regression analysis. To further explain variation in the estimated
response components of facilities in the sample, the model uses additional facility-specific
independent variables. Specifically, EPA collected data, where available, from facility-specific
reports typically submitted to state or federal regulatory agencies.126 The most common data
sources used were environmental impact statements. EPA also gathered information on
operations, such as the presence of source controls for various facility features aligned with each
cost category, and environmental data, such as the net precipitation and distance to surface water
at each facility.
Exhibit B-1 reports the specific types of response component categories estimated and the
explanatory variables used in the regression analyses. Note that the regression model for each
category of the response component shown in the left-hand column of the exhibit is based upon a
unique combination of explanatory variables from the right-hand column. In addition, in
developing the regression model for each response component category listed in Exhibit B-1,
explanatory variables not shown in the exhibit were also considered. Due to data limitations,
regression formulas were not developed for two response component categories. Instead, the
financial responsibility formula uses an average cost for each.
EPA did not know which of the explanatory variables it collected would be most significant in
deriving costs for the task and feature-based response component at each facility. To develop a
maximum financial responsibility formula for the sample and the regulated universe, EPA
needed to further determine how exactly the explanatory variables contributed to the estimated
response component in the sample of currently operating facilities. Ultimately, EPA conducted a
bidirectional stepwise regression analysis of each cost category.127 Exhibit B-2 presents the
125 For a complete description of the selection of the cost estimate sample, see Chapter 4 of U.S. Environmental
Protection Agency, “CERCLA 108(b) Financial Responsibility Formula for Hardrock Mining Facilities Background
Document” Office of Land and Emergency Management (September 2016). 126 EPA generated the source base for the sample given the available and relevant documents for each facility from a
suite of federal and state government agency produced or required facility evaluation documents. Those documents
included environmental impact statements, environmental assessments, reclamation and closure plans, and national
pollutant discharge elimination system permits, among others. EPA then developed a hierarchy to govern data
collection protocol from those documents. For a full description of explanatory variable data collection see U.S.
Environmental Protection Agency, “CERCLA 108(b) Financial Responsibility Formula for Hardrock Mining
Facilities Background Document” Office of Land and Emergency Management (September 2016). 127 Bidirectional stepwise regression is a hybrid of two other step-wise regression approaches: forward selection and
backward elimination. Forward selection starts with no independent variables then adds the variable (if any) that
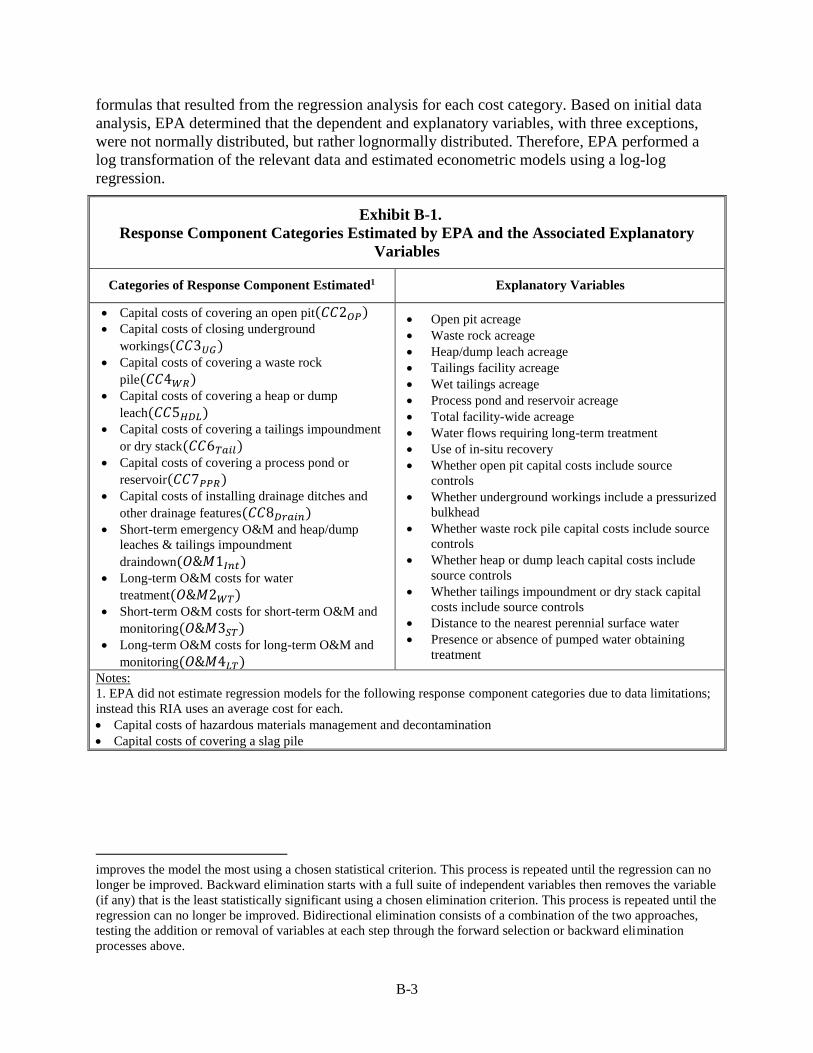
B-3
formulas that resulted from the regression analysis for each cost category. Based on initial data
analysis, EPA determined that the dependent and explanatory variables, with three exceptions,
were not normally distributed, but rather lognormally distributed. Therefore, EPA performed a
log transformation of the relevant data and estimated econometric models using a log-log
regression.
Exhibit B-1.
Response Component Categories Estimated by EPA and the Associated Explanatory
Variables
Categories of Response Component Estimated1 Explanatory Variables
Capital costs of covering an open pit(𝐶𝐶2𝑂𝑃)
Capital costs of closing underground
workings(𝐶𝐶3𝑈𝐺)
Capital costs of covering a waste rock
pile(𝐶𝐶4𝑊𝑅)
Capital costs of covering a heap or dump
leach(𝐶𝐶5𝐻𝐷𝐿)
Capital costs of covering a tailings impoundment
or dry stack(𝐶𝐶6𝑇𝑎𝑖𝑙)
Capital costs of covering a process pond or
reservoir(𝐶𝐶7𝑃𝑃𝑅)
Capital costs of installing drainage ditches and
other drainage features(𝐶𝐶8𝐷𝑟𝑎𝑖𝑛)
Short-term emergency O&M and heap/dump
leaches & tailings impoundment
draindown(𝑂&𝑀1𝐼𝑛𝑡)
Long-term O&M costs for water
treatment(𝑂&𝑀2𝑊𝑇)
Short-term O&M costs for short-term O&M and
monitoring(𝑂&𝑀3𝑆𝑇)
Long-term O&M costs for long-term O&M and
monitoring(𝑂&𝑀4𝐿𝑇)
Open pit acreage
Waste rock acreage
Heap/dump leach acreage
Tailings facility acreage
Wet tailings acreage
Process pond and reservoir acreage
Total facility-wide acreage
Water flows requiring long-term treatment
Use of in-situ recovery
Whether open pit capital costs include source
controls
Whether underground workings include a pressurized
bulkhead
Whether waste rock pile capital costs include source
controls
Whether heap or dump leach capital costs include
source controls
Whether tailings impoundment or dry stack capital
costs include source controls
Distance to the nearest perennial surface water
Presence or absence of pumped water obtaining
treatment
Notes:
1. EPA did not estimate regression models for the following response component categories due to data limitations;
instead this RIA uses an average cost for each.
Capital costs of hazardous materials management and decontamination
Capital costs of covering a slag pile
improves the model the most using a chosen statistical criterion. This process is repeated until the regression can no
longer be improved. Backward elimination starts with a full suite of independent variables then removes the variable
(if any) that is the least statistically significant using a chosen elimination criterion. This process is repeated until the
regression can no longer be improved. Bidirectional elimination consists of a combination of the two approaches,
testing the addition or removal of variables at each step through the forward selection or backward elimination
processes above.

B-4
Exhibit B-2.
Stepwise Regression Results
Log(cost) Fitted Regression
𝐶𝐶2𝑂𝑃 2.88 + 1.08 × 𝑎𝑐𝑟𝑒𝑠𝑂𝑃 + 1.36 × 𝑆𝐶𝑂𝑃
𝐶𝐶4𝑊𝑅 4.45 + 0.75 × 𝑎𝑐𝑟𝑒𝑠𝑊𝑅 + 0.73 × 𝑆𝐶𝑊𝑅
𝐶𝐶5𝐻𝐷𝐿 3.87 + 1.01 × 𝑎𝑐𝑟𝑒𝑠𝐻𝐷𝐿 + 0.70 × 𝑆𝐶𝐻𝐷𝐿
𝐶𝐶6𝑇𝑎𝑖𝑙 4.73 + 0.68 × 𝑎𝑐𝑟𝑒𝑠𝑇𝐹 + 0.59 × 𝑆𝐶𝑇𝐹
𝐶𝐶7𝑃𝑃𝑅 4.29 + 1.03 × 𝑎𝑐𝑟𝑒𝑠𝑃𝑃
𝐶𝐶3𝑈𝐺 4.96 + 1.35 × 𝑃𝐺𝑈𝐺
𝐶𝐶8𝐷𝑟𝑎𝑖𝑛 3.42 + 0.57 × 𝑎𝑐𝑟𝑒𝑠𝑇𝑜𝑡𝑎𝑙+1
𝐶𝐶1𝐻𝑊 Fixed cost per facility of $2,600,000
𝐶9𝑆𝑙𝑎𝑔 Fixed cost per acre of $64,000
𝑂&𝑀3𝑆𝑇 4.01 + 0.38 × 𝑎𝑐𝑟𝑒𝑠𝑇𝑜𝑡𝑎𝑙+1
𝑂&𝑀4𝐿𝑇 3.12 + 0.58 × 𝑎𝑐𝑟𝑒𝑠𝑇𝑜𝑡𝑎𝑙+1
𝑂&𝑀1𝐼𝑛𝑡 6.04 + 0.01 × 𝑁𝑃 + 0.34 × 𝑎𝑐𝑟𝑒𝑠𝐻𝐷𝐿+1 + 0.10 × 𝑤𝑒𝑡𝑎𝑐𝑟𝑒𝑠𝑇𝐹+1
𝑂&𝑀2𝑊𝑇 2.16 + 1.10 × 𝐺𝑃𝑀 + 1.06 × 𝑇𝑟𝑒𝑎𝑡 + 0.70 × 𝐴𝑙𝑘
Because EPA estimated formulas using a log-log transformation, the results of the regression
analysis reflect a known prediction bias inherent to the performance of linear regressions on
variables that have undergone logarithmic transformation. EPA corrected for this bias through
the application of an adjustment factor, or “smearing factor,” to the retransformed regression
results.128 The O&M formulas described above were estimated using annualized data. Therefore,
EPA converted the annualized interim and short-term O&M costs into a single net present value
(NPV) cost, assuming a ten-year payment period. The annualized long-term O&M and water
treatment costs were also converted into a single NPV figure, assuming the payments would
continue in perpetuity.
EPA’s assessment of NRD and health assessment components followed a simpler approach than
the Agency’s analysis of response components. For NRD, EPA estimated that such damages are
13.4 percent of the response components estimated for each facility. As described in Chapter 5 of
the Financial Responsibility Formula Background document, this figure reflects EPA’s
assessment of historical NRD settlements and historical response costs at hardrock mining and
processing facilities. For the health assessment component, EPA assumes a fixed financial
responsibility amount of $550,000 per facility based upon health assessment information
128 Duan, N. 1983. Smearing estimate: A nonparametric retransformation method. Journal of the American
Statistical Association. 78: 605-610.
B-5
released by the Agency for Toxic Substances and Disease Registry. Chapter 3 of the Financial
Responsibility Formula Background Document includes additional information on these costs.
The financial responsibility amounts were estimated using cost data normalized to national
values. Therefore, the financial responsibility formula is multiplied by the most current state cost
adjustment factors developed by the U.S. Army Corps of Engineers (2015) to derive a state-
specific cost. Appendix N of the Financial Responsibility Formula Background Document
includes a list of these state-specific factors. In addition, the direct engineering costs do not
include overhead and oversight costs related to mobilization and demobilization, engineering
design and redesign, contingency, contractor profit and overhead, contractor liability insurance,
payment and performance bonds, and direct EPA (or other government agency) contract
administration and contract management. EPA adjusts the estimated response component and
NRD component by the relevant state factors and indirect cost multipliers to derive the total FR
obligation.129
Data Inputs /Processing Data
To calculate the maximum financial responsibilities amounts, EPA relied on the data collected
for the development of cost estimation formula. As part of this effort, EPA collected data that
influence the CERCLA response component from states closure and reclamation documents,
Environmental Impact Statement (EIS) and other publically available sources. The collected data
include site-specific data (e.g., facility features, acreage), environmental and climate data
(precipitation, evaporation and distance to surface water). Exhibits B-3 and B-4 present the
collected data that were the inputs for the financial responsibility formula. Comprehensive lists
of all data sources are available in Appendices B through J of the Financial Responsibility
Formula Background Document.130
Estimation of Total Financial Responsivity Amount
EPA first identified the 49 facilities from the sample of 63 that are in the regulated universe.131
EPA used those 49 facilities as the “modeled universe” to which EPA applied the cost estimation
model. Using the relevant formulas for each response component category shown in Exhibit B-2
with the inputs located in Exhibits B-3 and B-4, EPA then developed a total cost estimate that
represents each facility’s potential CERCLA liabilities. These FR amounts are reported on a
cost-by-cost basis in Exhibit B-7.
To develop estimates of CERCLA liabilities that reflect the benefits of controls already in place
at individual facilities, EPA developed a series of cost reduction credits that may be applied to
the response amounts.
B.2. Reductions
Performance Standard Reductions
Many facilities have developed reclamation and closure plans that include CERCLA response-
like tasks or practices that reduce the risk of hazardous releases under existing state, federal,
tribal, and local regulatory regimes. In some cases, facilities have also backed the
129 These adjustments are not applied to the health assessment component. 130 U.S. Environmental Protection Agency, “CERCLA 108(b) Financial Responsibility Formula for Hardrock
Mining Facilities Background Document” Office of Land and Emergency Management (September 2016). 131 For the identification of the regulated universe, see Chapter 2 of this RIA.
B-6
implementation of those tasks through financial assurance. Under the proposed rule, facilities
will receive a 100 percent reduction for applicable cost components if they: 1) demonstrate that
they have planned and acquired sufficient financial assurance for tasks that would create post-
closure conditions that meet EPA’s performance standards; and 2) demonstrate that those future
controls are enforceable against them through federal, state, tribal, or local agencies.
All cost components of the maximum financial responsibility estimate are eligible for this
reduction: capital costs (open pits, underground mines, waste rock, heap and dump leach, tailings
facilities, process ponds, slag piles, hazardous waste, and surface drainage), short-term O&M,
interim O&M, long-term O&M, and water treatment.
To assess the impact of these reductions on the modeled universe, EPA determined which
facilities had reclamation and closure plans that described future engineering controls that met
the above performance standards. If a cost estimate accompanied the proposed control, EPA
gave a full reduction to the relevant cost component. Exhibits B-5 and B-6 summarize the
performance standard reductions for each component at each facility in the modeled universe.
Exhibit B-8 presents the response amounts after the application of the performance standard
reductions.
B.3. Calculation of Final Reduced Financial Responsibility Amounts
EPA then adjusted the reduced financial assurance amounts for each facility by assessing the
NRD and health assessment components, and applying federal and state-specific indirect cost
multipliers.
Exhibit B-9 presents the reduced, adjusted, final financial responsibility total for each facility in
the modeled universe.
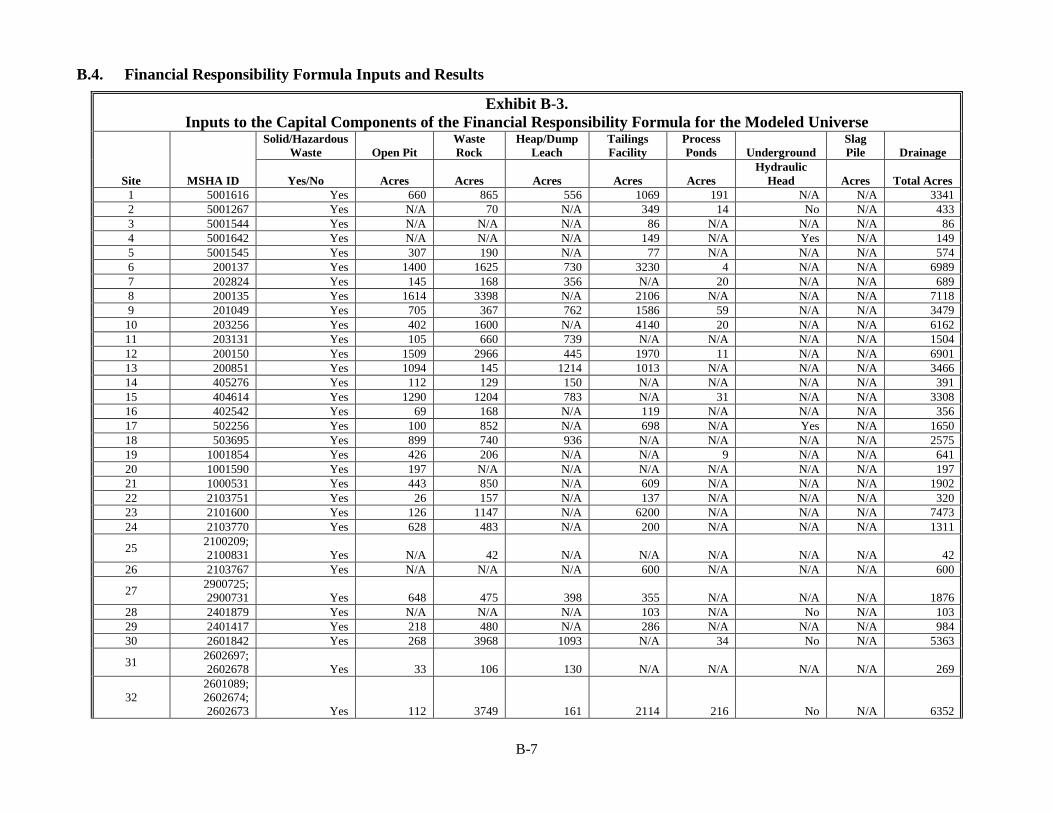
B-7
B.4. Financial Responsibility Formula Inputs and Results
Exhibit B-3.
Inputs to the Capital Components of the Financial Responsibility Formula for the Modeled Universe
Site MSHA ID
Solid/Hazardous
Waste Open Pit
Waste
Rock
Heap/Dump
Leach
Tailings
Facility
Process
Ponds Underground
Slag
Pile Drainage
Yes/No Acres Acres Acres Acres Acres
Hydraulic
Head Acres Total Acres
1 5001616 Yes 660 865 556 1069 191 N/A N/A 3341
2 5001267 Yes N/A 70 N/A 349 14 No N/A 433
3 5001544 Yes N/A N/A N/A 86 N/A N/A N/A 86
4 5001642 Yes N/A N/A N/A 149 N/A Yes N/A 149
5 5001545 Yes 307 190 N/A 77 N/A N/A N/A 574
6 200137 Yes 1400 1625 730 3230 4 N/A N/A 6989
7 202824 Yes 145 168 356 N/A 20 N/A N/A 689
8 200135 Yes 1614 3398 N/A 2106 N/A N/A N/A 7118
9 201049 Yes 705 367 762 1586 59 N/A N/A 3479
10 203256 Yes 402 1600 N/A 4140 20 N/A N/A 6162
11 203131 Yes 105 660 739 N/A N/A N/A N/A 1504
12 200150 Yes 1509 2966 445 1970 11 N/A N/A 6901
13 200851 Yes 1094 145 1214 1013 N/A N/A N/A 3466
14 405276 Yes 112 129 150 N/A N/A N/A N/A 391
15 404614 Yes 1290 1204 783 N/A 31 N/A N/A 3308
16 402542 Yes 69 168 N/A 119 N/A N/A N/A 356
17 502256 Yes 100 852 N/A 698 N/A Yes N/A 1650
18 503695 Yes 899 740 936 N/A N/A N/A N/A 2575
19 1001854 Yes 426 206 N/A N/A 9 N/A N/A 641
20 1001590 Yes 197 N/A N/A N/A N/A N/A N/A 197
21 1000531 Yes 443 850 N/A 609 N/A N/A N/A 1902
22 2103751 Yes 26 157 N/A 137 N/A N/A N/A 320
23 2101600 Yes 126 1147 N/A 6200 N/A N/A N/A 7473
24 2103770 Yes 628 483 N/A 200 N/A N/A N/A 1311
25 2100209;
2100831 Yes N/A 42 N/A N/A N/A N/A N/A 42
26 2103767 Yes N/A N/A N/A 600 N/A N/A N/A 600
27 2900725;
2900731 Yes 648 475 398 355 N/A N/A N/A 1876
28 2401879 Yes N/A N/A N/A 103 N/A No N/A 103
29 2401417 Yes 218 480 N/A 286 N/A N/A N/A 984
30 2601842 Yes 268 3968 1093 N/A 34 No N/A 5363
31 2602697;
2602678 Yes 33 106 130 N/A N/A N/A N/A 269
32
2601089;
2602674;
2602673 Yes 112 3749 161 2114 216 No N/A 6352
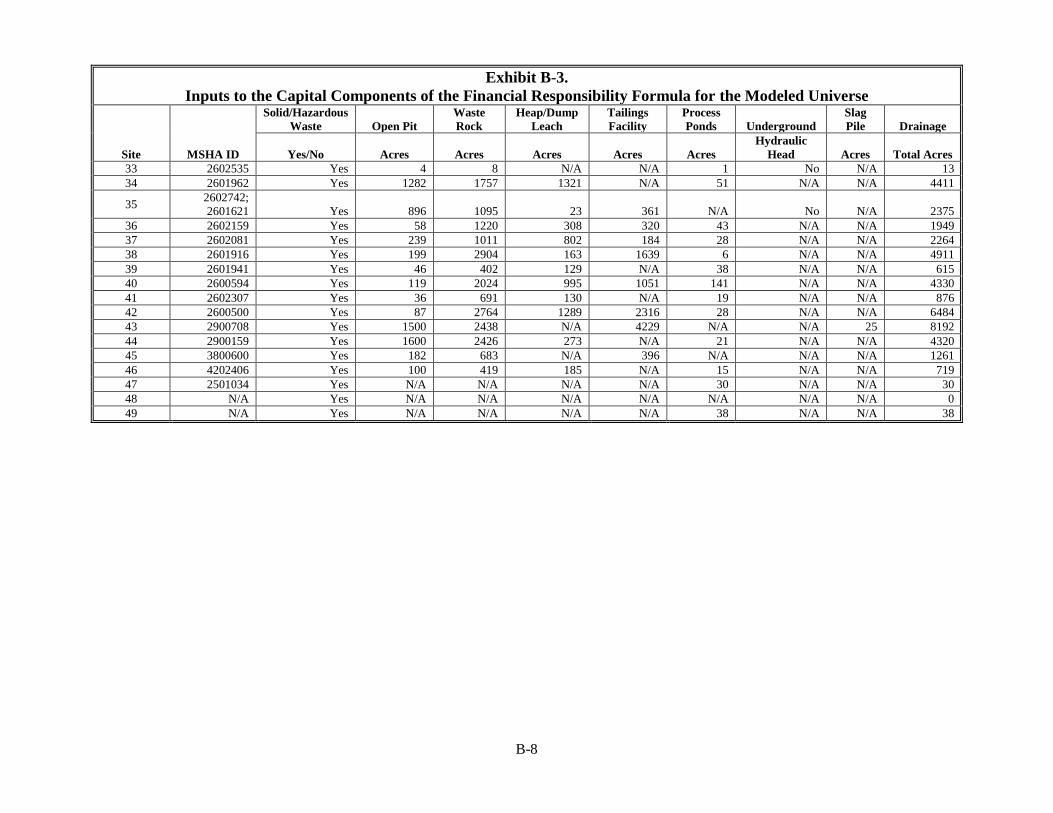
B-8
Exhibit B-3.
Inputs to the Capital Components of the Financial Responsibility Formula for the Modeled Universe
Site MSHA ID
Solid/Hazardous
Waste Open Pit
Waste
Rock
Heap/Dump
Leach
Tailings
Facility
Process
Ponds Underground
Slag
Pile Drainage
Yes/No Acres Acres Acres Acres Acres
Hydraulic
Head Acres Total Acres
33 2602535 Yes 4 8 N/A N/A 1 No N/A 13
34 2601962 Yes 1282 1757 1321 N/A 51 N/A N/A 4411
35 2602742;
2601621 Yes 896 1095 23 361 N/A No N/A 2375
36 2602159 Yes 58 1220 308 320 43 N/A N/A 1949
37 2602081 Yes 239 1011 802 184 28 N/A N/A 2264
38 2601916 Yes 199 2904 163 1639 6 N/A N/A 4911
39 2601941 Yes 46 402 129 N/A 38 N/A N/A 615
40 2600594 Yes 119 2024 995 1051 141 N/A N/A 4330
41 2602307 Yes 36 691 130 N/A 19 N/A N/A 876
42 2600500 Yes 87 2764 1289 2316 28 N/A N/A 6484
43 2900708 Yes 1500 2438 N/A 4229 N/A N/A 25 8192
44 2900159 Yes 1600 2426 273 N/A 21 N/A N/A 4320
45 3800600 Yes 182 683 N/A 396 N/A N/A N/A 1261
46 4202406 Yes 100 419 185 N/A 15 N/A N/A 719
47 2501034 Yes N/A N/A N/A N/A 30 N/A N/A 30
48 N/A Yes N/A N/A N/A N/A N/A N/A N/A 0
49 N/A Yes N/A N/A N/A N/A 38 N/A N/A 38
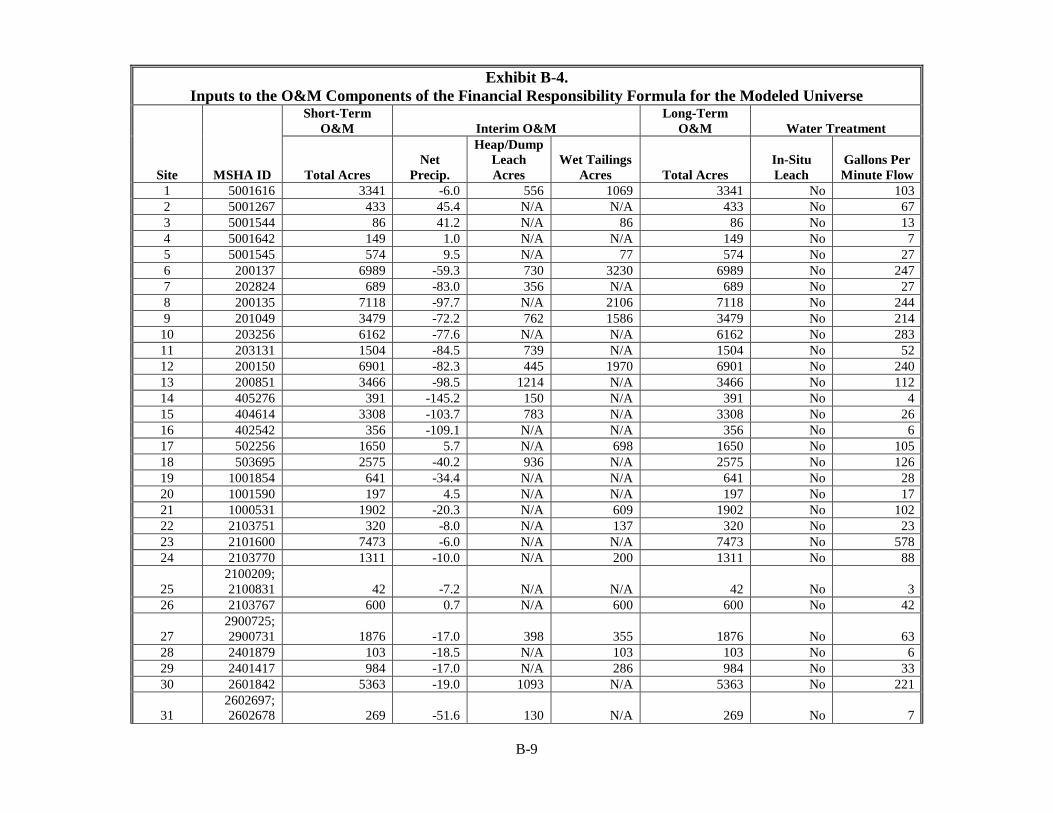
B-9
Exhibit B-4.
Inputs to the O&M Components of the Financial Responsibility Formula for the Modeled Universe
Site MSHA ID
Short-Term
O&M Interim O&M
Long-Term
O&M Water Treatment
Total Acres
Net
Precip.
Heap/Dump
Leach
Acres
Wet Tailings
Acres Total Acres
In-Situ
Leach
Gallons Per
Minute Flow
1 5001616 3341 -6.0 556 1069 3341 No 103
2 5001267 433 45.4 N/A N/A 433 No 67
3 5001544 86 41.2 N/A 86 86 No 13
4 5001642 149 1.0 N/A N/A 149 No 7
5 5001545 574 9.5 N/A 77 574 No 27
6 200137 6989 -59.3 730 3230 6989 No 247
7 202824 689 -83.0 356 N/A 689 No 27
8 200135 7118 -97.7 N/A 2106 7118 No 244
9 201049 3479 -72.2 762 1586 3479 No 214
10 203256 6162 -77.6 N/A N/A 6162 No 283
11 203131 1504 -84.5 739 N/A 1504 No 52
12 200150 6901 -82.3 445 1970 6901 No 240
13 200851 3466 -98.5 1214 N/A 3466 No 112
14 405276 391 -145.2 150 N/A 391 No 4
15 404614 3308 -103.7 783 N/A 3308 No 26
16 402542 356 -109.1 N/A N/A 356 No 6
17 502256 1650 5.7 N/A 698 1650 No 105
18 503695 2575 -40.2 936 N/A 2575 No 126
19 1001854 641 -34.4 N/A N/A 641 No 28
20 1001590 197 4.5 N/A N/A 197 No 17
21 1000531 1902 -20.3 N/A 609 1902 No 102
22 2103751 320 -8.0 N/A 137 320 No 23
23 2101600 7473 -6.0 N/A N/A 7473 No 578
24 2103770 1311 -10.0 N/A 200 1311 No 88
25
2100209;
2100831 42 -7.2 N/A N/A 42 No 3
26 2103767 600 0.7 N/A 600 600 No 42
27
2900725;
2900731 1876 -17.0 398 355 1876 No 63
28 2401879 103 -18.5 N/A 103 103 No 6
29 2401417 984 -17.0 N/A 286 984 No 33
30 2601842 5363 -19.0 1093 N/A 5363 No 221
31
2602697;
2602678 269 -51.6 130 N/A 269 No 7
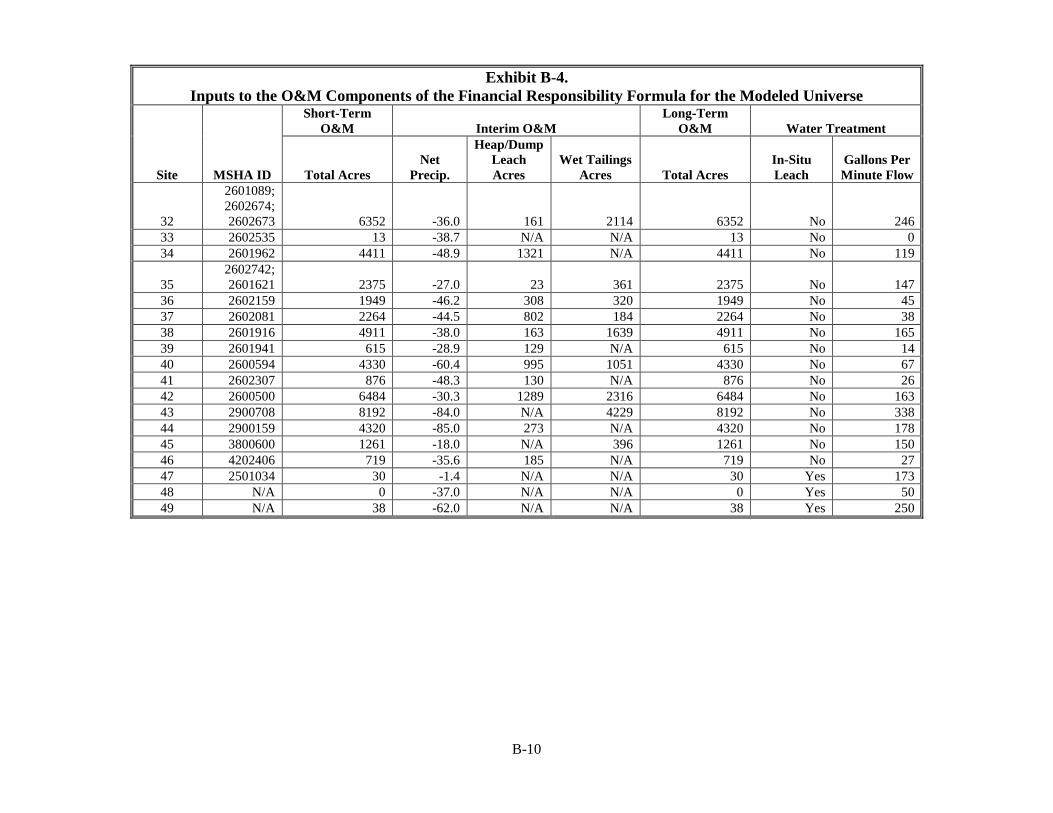
B-10
Exhibit B-4.
Inputs to the O&M Components of the Financial Responsibility Formula for the Modeled Universe
Site MSHA ID
Short-Term
O&M Interim O&M
Long-Term
O&M Water Treatment
Total Acres
Net
Precip.
Heap/Dump
Leach
Acres
Wet Tailings
Acres Total Acres
In-Situ
Leach
Gallons Per
Minute Flow
32
2601089;
2602674;
2602673 6352 -36.0 161 2114 6352 No 246
33 2602535 13 -38.7 N/A N/A 13 No 0
34 2601962 4411 -48.9 1321 N/A 4411 No 119
35
2602742;
2601621 2375 -27.0 23 361 2375 No 147
36 2602159 1949 -46.2 308 320 1949 No 45
37 2602081 2264 -44.5 802 184 2264 No 38
38 2601916 4911 -38.0 163 1639 4911 No 165
39 2601941 615 -28.9 129 N/A 615 No 14
40 2600594 4330 -60.4 995 1051 4330 No 67
41 2602307 876 -48.3 130 N/A 876 No 26
42 2600500 6484 -30.3 1289 2316 6484 No 163
43 2900708 8192 -84.0 N/A 4229 8192 No 338
44 2900159 4320 -85.0 273 N/A 4320 No 178
45 3800600 1261 -18.0 N/A 396 1261 No 150
46 4202406 719 -35.6 185 N/A 719 No 27
47 2501034 30 -1.4 N/A N/A 30 Yes 173
48 N/A 0 -37.0 N/A N/A 0 Yes 50
49 N/A 38 -62.0 N/A N/A 38 Yes 250
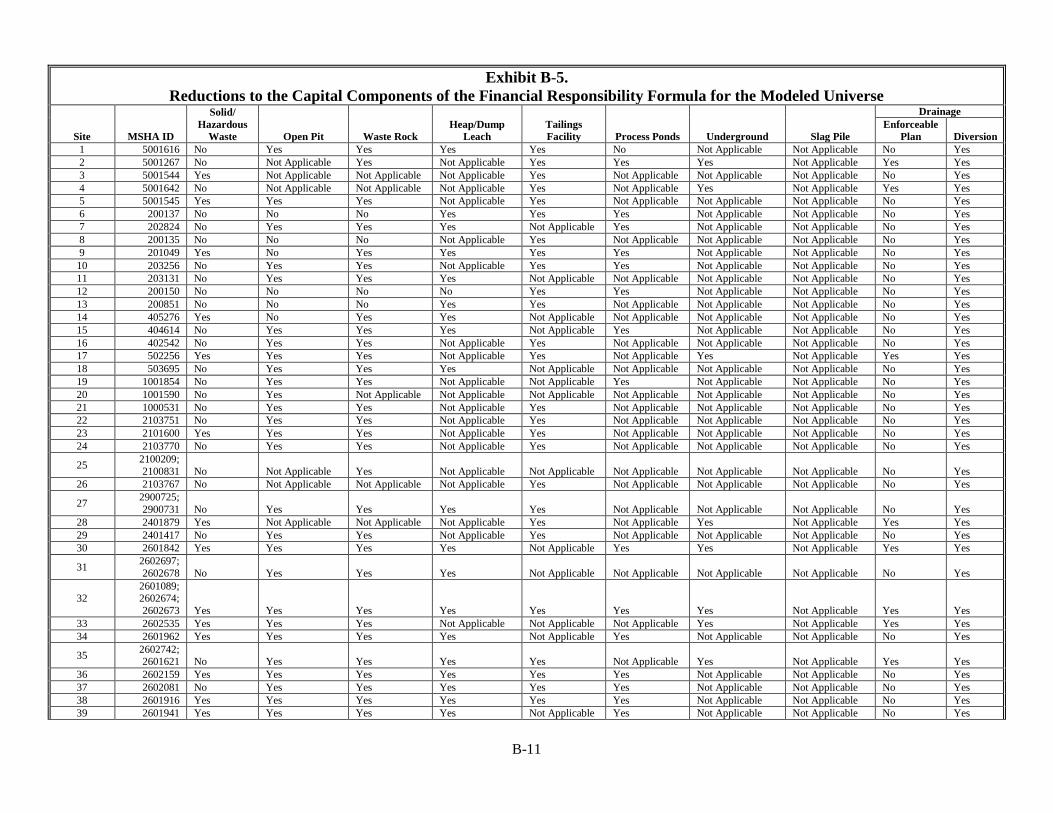
B-11
Exhibit B-5.
Reductions to the Capital Components of the Financial Responsibility Formula for the Modeled Universe
Site MSHA ID
Solid/
Hazardous
Waste Open Pit Waste Rock
Heap/Dump
Leach
Tailings
Facility Process Ponds Underground Slag Pile
Drainage
Enforceable
Plan Diversion
1 5001616 No Yes Yes Yes Yes No Not Applicable Not Applicable No Yes
2 5001267 No Not Applicable Yes Not Applicable Yes Yes Yes Not Applicable Yes Yes
3 5001544 Yes Not Applicable Not Applicable Not Applicable Yes Not Applicable Not Applicable Not Applicable No Yes
4 5001642 No Not Applicable Not Applicable Not Applicable Yes Not Applicable Yes Not Applicable Yes Yes
5 5001545 Yes Yes Yes Not Applicable Yes Not Applicable Not Applicable Not Applicable No Yes
6 200137 No No No Yes Yes Yes Not Applicable Not Applicable No Yes
7 202824 No Yes Yes Yes Not Applicable Yes Not Applicable Not Applicable No Yes
8 200135 No No No Not Applicable Yes Not Applicable Not Applicable Not Applicable No Yes
9 201049 Yes No Yes Yes Yes Yes Not Applicable Not Applicable No Yes
10 203256 No Yes Yes Not Applicable Yes Yes Not Applicable Not Applicable No Yes
11 203131 No Yes Yes Yes Not Applicable Not Applicable Not Applicable Not Applicable No Yes
12 200150 No No No No Yes Yes Not Applicable Not Applicable No Yes
13 200851 No No No Yes Yes Not Applicable Not Applicable Not Applicable No Yes
14 405276 Yes No Yes Yes Not Applicable Not Applicable Not Applicable Not Applicable No Yes
15 404614 No Yes Yes Yes Not Applicable Yes Not Applicable Not Applicable No Yes
16 402542 No Yes Yes Not Applicable Yes Not Applicable Not Applicable Not Applicable No Yes
17 502256 Yes Yes Yes Not Applicable Yes Not Applicable Yes Not Applicable Yes Yes
18 503695 No Yes Yes Yes Not Applicable Not Applicable Not Applicable Not Applicable No Yes
19 1001854 No Yes Yes Not Applicable Not Applicable Yes Not Applicable Not Applicable No Yes
20 1001590 No Yes Not Applicable Not Applicable Not Applicable Not Applicable Not Applicable Not Applicable No Yes
21 1000531 No Yes Yes Not Applicable Yes Not Applicable Not Applicable Not Applicable No Yes
22 2103751 No Yes Yes Not Applicable Yes Not Applicable Not Applicable Not Applicable No Yes
23 2101600 Yes Yes Yes Not Applicable Yes Not Applicable Not Applicable Not Applicable No Yes
24 2103770 No Yes Yes Not Applicable Yes Not Applicable Not Applicable Not Applicable No Yes
25 2100209;
2100831 No Not Applicable Yes Not Applicable Not Applicable Not Applicable Not Applicable Not Applicable No Yes
26 2103767 No Not Applicable Not Applicable Not Applicable Yes Not Applicable Not Applicable Not Applicable No Yes
27 2900725;
2900731 No Yes Yes Yes Yes Not Applicable Not Applicable Not Applicable No Yes
28 2401879 Yes Not Applicable Not Applicable Not Applicable Yes Not Applicable Yes Not Applicable Yes Yes
29 2401417 No Yes Yes Not Applicable Yes Not Applicable Not Applicable Not Applicable No Yes
30 2601842 Yes Yes Yes Yes Not Applicable Yes Yes Not Applicable Yes Yes
31 2602697;
2602678 No Yes Yes Yes Not Applicable Not Applicable Not Applicable Not Applicable No Yes
32 2601089; 2602674;
2602673 Yes Yes Yes Yes Yes Yes Yes Not Applicable Yes Yes
33 2602535 Yes Yes Yes Not Applicable Not Applicable Not Applicable Yes Not Applicable Yes Yes
34 2601962 Yes Yes Yes Yes Not Applicable Yes Not Applicable Not Applicable No Yes
35 2602742; 2601621 No Yes Yes Yes Yes Not Applicable Yes Not Applicable Yes Yes
36 2602159 Yes Yes Yes Yes Yes Yes Not Applicable Not Applicable No Yes
37 2602081 No Yes Yes Yes Yes Yes Not Applicable Not Applicable No Yes
38 2601916 Yes Yes Yes Yes Yes Yes Not Applicable Not Applicable No Yes
39 2601941 Yes Yes Yes Yes Not Applicable Yes Not Applicable Not Applicable No Yes
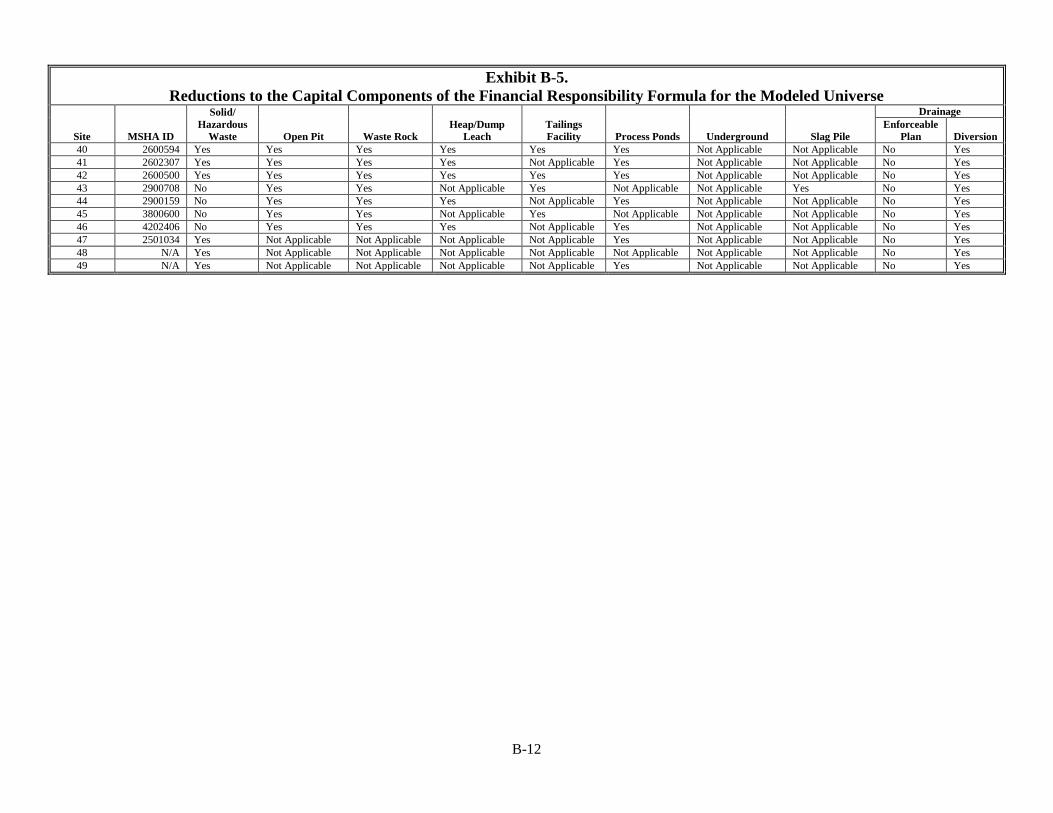
B-12
Exhibit B-5.
Reductions to the Capital Components of the Financial Responsibility Formula for the Modeled Universe
Site MSHA ID
Solid/
Hazardous
Waste Open Pit Waste Rock
Heap/Dump
Leach
Tailings
Facility Process Ponds Underground Slag Pile
Drainage
Enforceable
Plan Diversion
40 2600594 Yes Yes Yes Yes Yes Yes Not Applicable Not Applicable No Yes
41 2602307 Yes Yes Yes Yes Not Applicable Yes Not Applicable Not Applicable No Yes
42 2600500 Yes Yes Yes Yes Yes Yes Not Applicable Not Applicable No Yes
43 2900708 No Yes Yes Not Applicable Yes Not Applicable Not Applicable Yes No Yes
44 2900159 No Yes Yes Yes Not Applicable Yes Not Applicable Not Applicable No Yes
45 3800600 No Yes Yes Not Applicable Yes Not Applicable Not Applicable Not Applicable No Yes
46 4202406 No Yes Yes Yes Not Applicable Yes Not Applicable Not Applicable No Yes
47 2501034 Yes Not Applicable Not Applicable Not Applicable Not Applicable Yes Not Applicable Not Applicable No Yes
48 N/A Yes Not Applicable Not Applicable Not Applicable Not Applicable Not Applicable Not Applicable Not Applicable No Yes
49 N/A Yes Not Applicable Not Applicable Not Applicable Not Applicable Yes Not Applicable Not Applicable No Yes
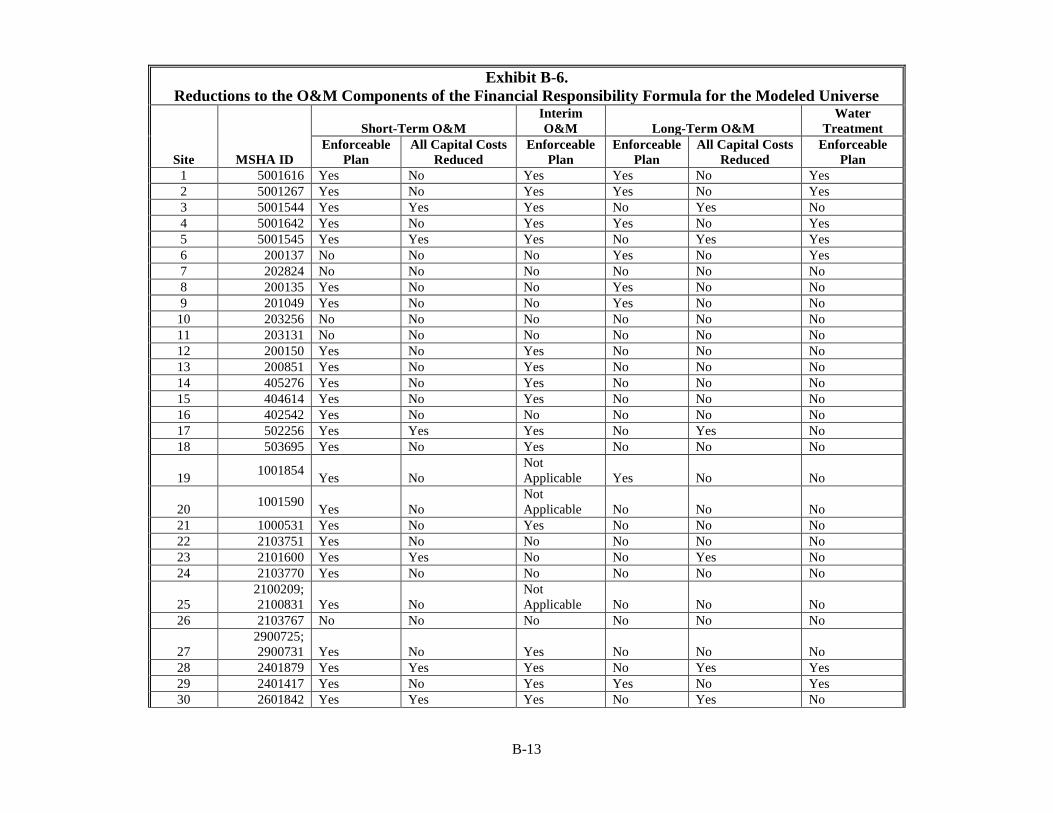
B-13
Exhibit B-6.
Reductions to the O&M Components of the Financial Responsibility Formula for the Modeled Universe
Site MSHA ID
Short-Term O&M
Interim
O&M Long-Term O&M
Water
Treatment
Enforceable
Plan
All Capital Costs
Reduced
Enforceable
Plan
Enforceable
Plan
All Capital Costs
Reduced
Enforceable
Plan
1 5001616 Yes No Yes Yes No Yes
2 5001267 Yes No Yes Yes No Yes
3 5001544 Yes Yes Yes No Yes No
4 5001642 Yes No Yes Yes No Yes
5 5001545 Yes Yes Yes No Yes Yes
6 200137 No No No Yes No Yes
7 202824 No No No No No No
8 200135 Yes No No Yes No No
9 201049 Yes No No Yes No No
10 203256 No No No No No No
11 203131 No No No No No No
12 200150 Yes No Yes No No No
13 200851 Yes No Yes No No No
14 405276 Yes No Yes No No No
15 404614 Yes No Yes No No No
16 402542 Yes No No No No No
17 502256 Yes Yes Yes No Yes No
18 503695 Yes No Yes No No No
19 1001854
Yes No
Not
Applicable Yes No No
20 1001590
Yes No
Not
Applicable No No No
21 1000531 Yes No Yes No No No
22 2103751 Yes No No No No No
23 2101600 Yes Yes No No Yes No
24 2103770 Yes No No No No No
25
2100209;
2100831 Yes No
Not
Applicable No No No
26 2103767 No No No No No No
27
2900725;
2900731 Yes No Yes No No No
28 2401879 Yes Yes Yes No Yes Yes
29 2401417 Yes No Yes Yes No Yes
30 2601842 Yes Yes Yes No Yes No
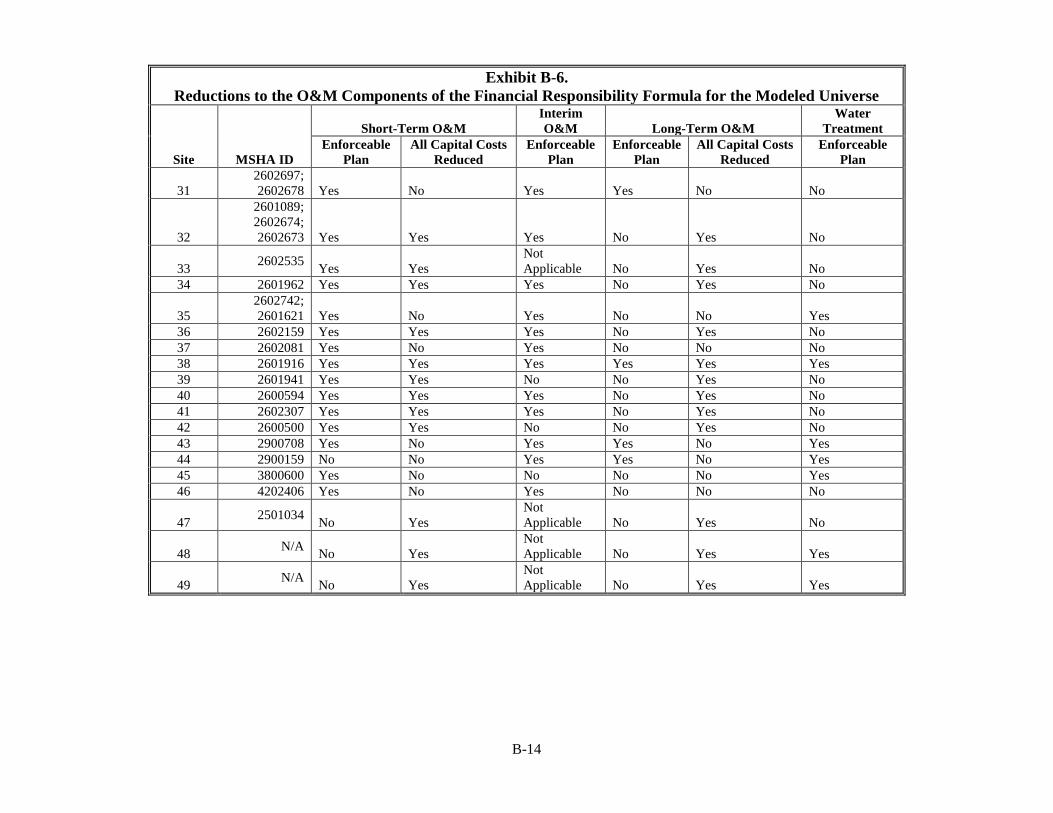
B-14
Exhibit B-6.
Reductions to the O&M Components of the Financial Responsibility Formula for the Modeled Universe
Site MSHA ID
Short-Term O&M
Interim
O&M Long-Term O&M
Water
Treatment
Enforceable
Plan
All Capital Costs
Reduced
Enforceable
Plan
Enforceable
Plan
All Capital Costs
Reduced
Enforceable
Plan
31
2602697;
2602678 Yes No Yes Yes No No
32
2601089;
2602674;
2602673 Yes Yes Yes No Yes No
33 2602535
Yes Yes
Not
Applicable No Yes No
34 2601962 Yes Yes Yes No Yes No
35
2602742;
2601621 Yes No Yes No No Yes
36 2602159 Yes Yes Yes No Yes No
37 2602081 Yes No Yes No No No
38 2601916 Yes Yes Yes Yes Yes Yes
39 2601941 Yes Yes No No Yes No
40 2600594 Yes Yes Yes No Yes No
41 2602307 Yes Yes Yes No Yes No
42 2600500 Yes Yes No No Yes No
43 2900708 Yes No Yes Yes No Yes
44 2900159 No No Yes Yes No Yes
45 3800600 Yes No No No No Yes
46 4202406 Yes No Yes No No No
47 2501034
No Yes
Not
Applicable No Yes No
48 N/A
No Yes
Not
Applicable No Yes Yes
49 N/A
No Yes
Not
Applicable No Yes Yes
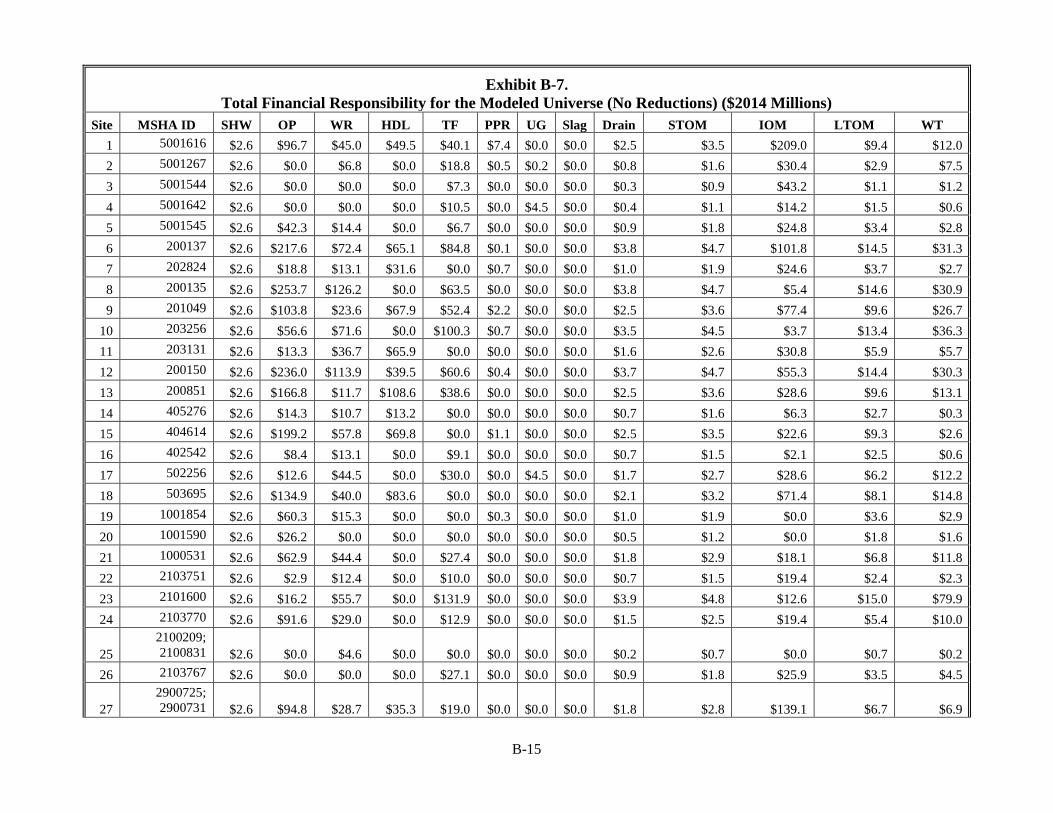
B-15
Exhibit B-7.
Total Financial Responsibility for the Modeled Universe (No Reductions) ($2014 Millions)
Site MSHA ID SHW OP WR HDL TF PPR UG Slag Drain STOM IOM LTOM WT
1 5001616 $2.6 $96.7 $45.0 $49.5 $40.1 $7.4 $0.0 $0.0 $2.5 $3.5 $209.0 $9.4 $12.0
2 5001267 $2.6 $0.0 $6.8 $0.0 $18.8 $0.5 $0.2 $0.0 $0.8 $1.6 $30.4 $2.9 $7.5
3 5001544 $2.6 $0.0 $0.0 $0.0 $7.3 $0.0 $0.0 $0.0 $0.3 $0.9 $43.2 $1.1 $1.2
4 5001642 $2.6 $0.0 $0.0 $0.0 $10.5 $0.0 $4.5 $0.0 $0.4 $1.1 $14.2 $1.5 $0.6
5 5001545 $2.6 $42.3 $14.4 $0.0 $6.7 $0.0 $0.0 $0.0 $0.9 $1.8 $24.8 $3.4 $2.8
6 200137 $2.6 $217.6 $72.4 $65.1 $84.8 $0.1 $0.0 $0.0 $3.8 $4.7 $101.8 $14.5 $31.3
7 202824 $2.6 $18.8 $13.1 $31.6 $0.0 $0.7 $0.0 $0.0 $1.0 $1.9 $24.6 $3.7 $2.7
8 200135 $2.6 $253.7 $126.2 $0.0 $63.5 $0.0 $0.0 $0.0 $3.8 $4.7 $5.4 $14.6 $30.9
9 201049 $2.6 $103.8 $23.6 $67.9 $52.4 $2.2 $0.0 $0.0 $2.5 $3.6 $77.4 $9.6 $26.7
10 203256 $2.6 $56.6 $71.6 $0.0 $100.3 $0.7 $0.0 $0.0 $3.5 $4.5 $3.7 $13.4 $36.3
11 203131 $2.6 $13.3 $36.7 $65.9 $0.0 $0.0 $0.0 $0.0 $1.6 $2.6 $30.8 $5.9 $5.7
12 200150 $2.6 $236.0 $113.9 $39.5 $60.6 $0.4 $0.0 $0.0 $3.7 $4.7 $55.3 $14.4 $30.3
13 200851 $2.6 $166.8 $11.7 $108.6 $38.6 $0.0 $0.0 $0.0 $2.5 $3.6 $28.6 $9.6 $13.1
14 405276 $2.6 $14.3 $10.7 $13.2 $0.0 $0.0 $0.0 $0.0 $0.7 $1.6 $6.3 $2.7 $0.3
15 404614 $2.6 $199.2 $57.8 $69.8 $0.0 $1.1 $0.0 $0.0 $2.5 $3.5 $22.6 $9.3 $2.6
16 402542 $2.6 $8.4 $13.1 $0.0 $9.1 $0.0 $0.0 $0.0 $0.7 $1.5 $2.1 $2.5 $0.6
17 502256 $2.6 $12.6 $44.5 $0.0 $30.0 $0.0 $4.5 $0.0 $1.7 $2.7 $28.6 $6.2 $12.2
18 503695 $2.6 $134.9 $40.0 $83.6 $0.0 $0.0 $0.0 $0.0 $2.1 $3.2 $71.4 $8.1 $14.8
19 1001854 $2.6 $60.3 $15.3 $0.0 $0.0 $0.3 $0.0 $0.0 $1.0 $1.9 $0.0 $3.6 $2.9
20 1001590 $2.6 $26.2 $0.0 $0.0 $0.0 $0.0 $0.0 $0.0 $0.5 $1.2 $0.0 $1.8 $1.6
21 1000531 $2.6 $62.9 $44.4 $0.0 $27.4 $0.0 $0.0 $0.0 $1.8 $2.9 $18.1 $6.8 $11.8
22 2103751 $2.6 $2.9 $12.4 $0.0 $10.0 $0.0 $0.0 $0.0 $0.7 $1.5 $19.4 $2.4 $2.3
23 2101600 $2.6 $16.2 $55.7 $0.0 $131.9 $0.0 $0.0 $0.0 $3.9 $4.8 $12.6 $15.0 $79.9
24 2103770 $2.6 $91.6 $29.0 $0.0 $12.9 $0.0 $0.0 $0.0 $1.5 $2.5 $19.4 $5.4 $10.0
25
2100209;
2100831 $2.6 $0.0 $4.6 $0.0 $0.0 $0.0 $0.0 $0.0 $0.2 $0.7 $0.0 $0.7 $0.2
26 2103767 $2.6 $0.0 $0.0 $0.0 $27.1 $0.0 $0.0 $0.0 $0.9 $1.8 $25.9 $3.5 $4.5
27
2900725;
2900731 $2.6 $94.8 $28.7 $35.3 $19.0 $0.0 $0.0 $0.0 $1.8 $2.8 $139.1 $6.7 $6.9

B-16
Exhibit B-7.
Total Financial Responsibility for the Modeled Universe (No Reductions) ($2014 Millions)
Site MSHA ID SHW OP WR HDL TF PPR UG Slag Drain STOM IOM LTOM WT
28 2401879 $2.6 $0.0 $0.0 $0.0 $8.2 $0.0 $0.2 $0.0 $0.3 $0.9 $15.7 $1.2 $0.5
29 2401417 $2.6 $29.2 $28.9 $0.0 $16.4 $0.0 $0.0 $0.0 $1.2 $2.2 $17.8 $4.6 $3.4
30 2601842 $2.6 $36.5 $141.9 $97.7 $0.0 $1.2 $0.2 $0.0 $3.2 $4.2 $108.4 $12.4 $27.7
31
2602697;
2602678 $2.6 $3.8 $9.3 $11.4 $0.0 $0.0 $0.0 $0.0 $0.6 $1.4 $30.0 $2.2 $0.6
32
2601089;
2602674;
2602673 $2.6 $14.3 $135.9 $14.2 $63.6 $8.4 $0.2 $0.0 $3.6 $4.5 $87.5 $13.7 $31.1
33 2602535 $2.6 $0.4 $1.3 $0.0 $0.0 $0.0 $0.2 $0.0 $0.1 $0.4 $0.0 $0.4 $0.0
34 2601962 $2.6 $197.9 $76.8 $118.2 $0.0 $1.9 $0.0 $0.0 $2.9 $3.9 $69.1 $11.1 $14.1
35
2602742;
2601621 $2.6 $134.4 $53.8 $2.0 $19.2 $0.0 $0.2 $0.0 $2.0 $3.1 $45.1 $7.7 $17.7
36 2602159 $2.6 $7.0 $58.3 $27.3 $17.7 $1.6 $0.0 $0.0 $1.8 $2.9 $76.5 $6.9 $4.7
37 2602081 $2.6 $32.3 $50.6 $71.5 $12.2 $1.0 $0.0 $0.0 $2.0 $3.1 $103.3 $7.5 $4.0
38 2601916 $2.6 $26.5 $112.1 $14.4 $53.5 $0.2 $0.0 $0.0 $3.1 $4.1 $82.8 $11.8 $20.0
39 2601941 $2.6 $5.5 $25.3 $11.4 $0.0 $1.4 $0.0 $0.0 $1.0 $1.9 $44.3 $3.5 $1.3
40 2600594 $2.6 $15.2 $85.4 $88.9 $39.6 $5.4 $0.0 $0.0 $2.9 $3.9 $99.8 $10.9 $7.4
41 2602307 $2.6 $4.2 $38.0 $11.4 $0.0 $0.7 $0.0 $0.0 $1.2 $2.1 $31.8 $4.3 $2.7
42 2600500 $2.6 $10.8 $108.0 $115.3 $67.7 $1.0 $0.0 $0.0 $3.6 $4.6 $197.2 $13.8 $19.8
43 2900708 $2.6 $234.5 $98.3 $0.0 $101.8 $0.0 $0.0 $1.6 $4.1 $5.0 $7.3 $15.9 $44.2
44 2900159 $2.6 $251.4 $97.9 $24.2 $0.0 $0.8 $0.0 $0.0 $2.9 $3.9 $21.8 $10.9 $21.8
45 3800600 $2.6 $24.1 $37.7 $0.0 $20.4 $0.0 $0.0 $0.0 $1.4 $2.4 $18.0 $5.3 $18.0
46 4202406 $2.6 $12.6 $26.1 $16.3 $0.0 $0.5 $0.0 $0.0 $1.0 $2.0 $44.6 $3.8 $2.7
47 2501034 $2.6 $0.0 $0.0 $0.0 $0.0 $1.1 $0.0 $0.0 $0.2 $0.6 $0.0 $0.6 $104.6
48 N/A $2.6 $0.0 $0.0 $0.0 $0.0 $0.0 $0.0 $0.0 $0.0 $0.2 $0.0 $0.1 $26.7
49 N/A $2.6 $0.0 $0.0 $0.0 $0.0 $0.1 $0.0 $0.0 $0.1 $0.3 $0.0 $0.2 $157.1
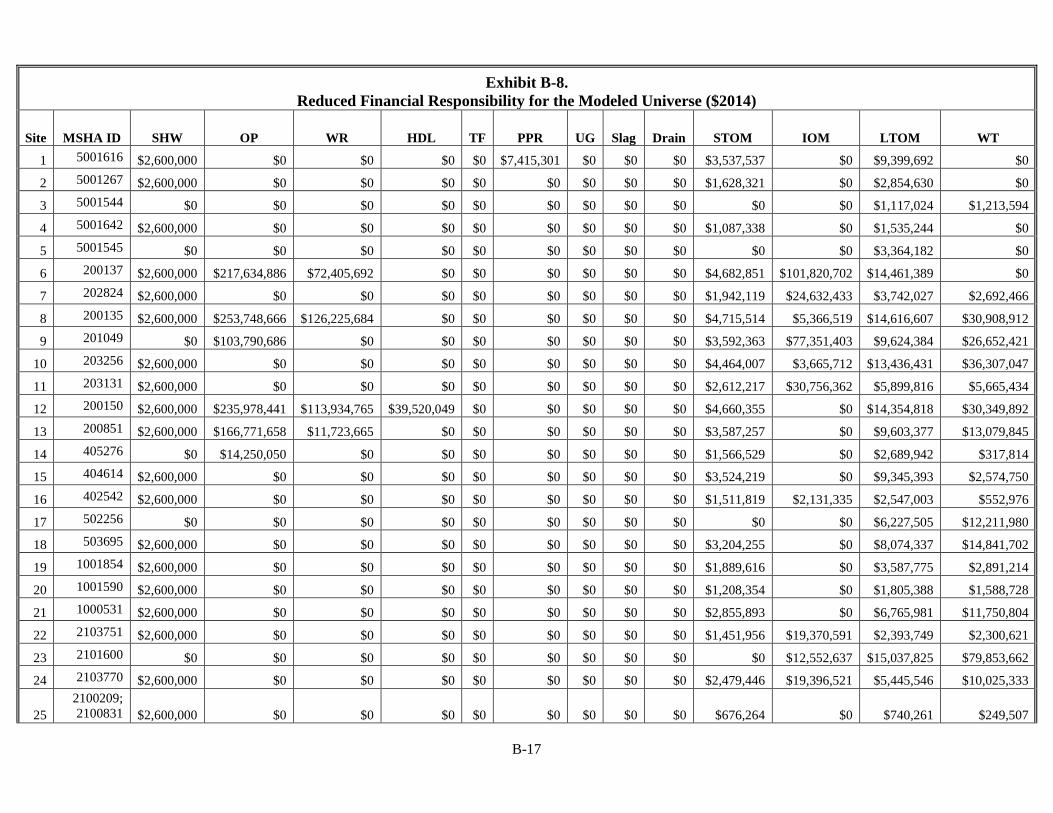
B-17
Exhibit B-8.
Reduced Financial Responsibility for the Modeled Universe ($2014)
Site MSHA ID SHW OP WR HDL TF PPR UG Slag Drain STOM IOM LTOM WT
1 5001616 $2,600,000 $0 $0 $0 $0 $7,415,301 $0 $0 $0 $3,537,537 $0 $9,399,692 $0
2 5001267 $2,600,000 $0 $0 $0 $0 $0 $0 $0 $0 $1,628,321 $0 $2,854,630 $0
3 5001544 $0 $0 $0 $0 $0 $0 $0 $0 $0 $0 $0 $1,117,024 $1,213,594
4 5001642 $2,600,000 $0 $0 $0 $0 $0 $0 $0 $0 $1,087,338 $0 $1,535,244 $0
5 5001545 $0 $0 $0 $0 $0 $0 $0 $0 $0 $0 $0 $3,364,182 $0
6 200137 $2,600,000 $217,634,886 $72,405,692 $0 $0 $0 $0 $0 $0 $4,682,851 $101,820,702 $14,461,389 $0
7 202824 $2,600,000 $0 $0 $0 $0 $0 $0 $0 $0 $1,942,119 $24,632,433 $3,742,027 $2,692,466
8 200135 $2,600,000 $253,748,666 $126,225,684 $0 $0 $0 $0 $0 $0 $4,715,514 $5,366,519 $14,616,607 $30,908,912
9 201049 $0 $103,790,686 $0 $0 $0 $0 $0 $0 $0 $3,592,363 $77,351,403 $9,624,384 $26,652,421
10 203256 $2,600,000 $0 $0 $0 $0 $0 $0 $0 $0 $4,464,007 $3,665,712 $13,436,431 $36,307,047
11 203131 $2,600,000 $0 $0 $0 $0 $0 $0 $0 $0 $2,612,217 $30,756,362 $5,899,816 $5,665,434
12 200150 $2,600,000 $235,978,441 $113,934,765 $39,520,049 $0 $0 $0 $0 $0 $4,660,355 $0 $14,354,818 $30,349,892
13 200851 $2,600,000 $166,771,658 $11,723,665 $0 $0 $0 $0 $0 $0 $3,587,257 $0 $9,603,377 $13,079,845
14 405276 $0 $14,250,050 $0 $0 $0 $0 $0 $0 $0 $1,566,529 $0 $2,689,942 $317,814
15 404614 $2,600,000 $0 $0 $0 $0 $0 $0 $0 $0 $3,524,219 $0 $9,345,393 $2,574,750
16 402542 $2,600,000 $0 $0 $0 $0 $0 $0 $0 $0 $1,511,819 $2,131,335 $2,547,003 $552,976
17 502256 $0 $0 $0 $0 $0 $0 $0 $0 $0 $0 $0 $6,227,505 $12,211,980
18 503695 $2,600,000 $0 $0 $0 $0 $0 $0 $0 $0 $3,204,255 $0 $8,074,337 $14,841,702
19 1001854 $2,600,000 $0 $0 $0 $0 $0 $0 $0 $0 $1,889,616 $0 $3,587,775 $2,891,214
20 1001590 $2,600,000 $0 $0 $0 $0 $0 $0 $0 $0 $1,208,354 $0 $1,805,388 $1,588,728
21 1000531 $2,600,000 $0 $0 $0 $0 $0 $0 $0 $0 $2,855,893 $0 $6,765,981 $11,750,804
22 2103751 $2,600,000 $0 $0 $0 $0 $0 $0 $0 $0 $1,451,956 $19,370,591 $2,393,749 $2,300,621
23 2101600 $0 $0 $0 $0 $0 $0 $0 $0 $0 $0 $12,552,637 $15,037,825 $79,853,662
24 2103770 $2,600,000 $0 $0 $0 $0 $0 $0 $0 $0 $2,479,446 $19,396,521 $5,445,546 $10,025,333
25
2100209;
2100831 $2,600,000 $0 $0 $0 $0 $0 $0 $0 $0 $676,264 $0 $740,261 $249,507
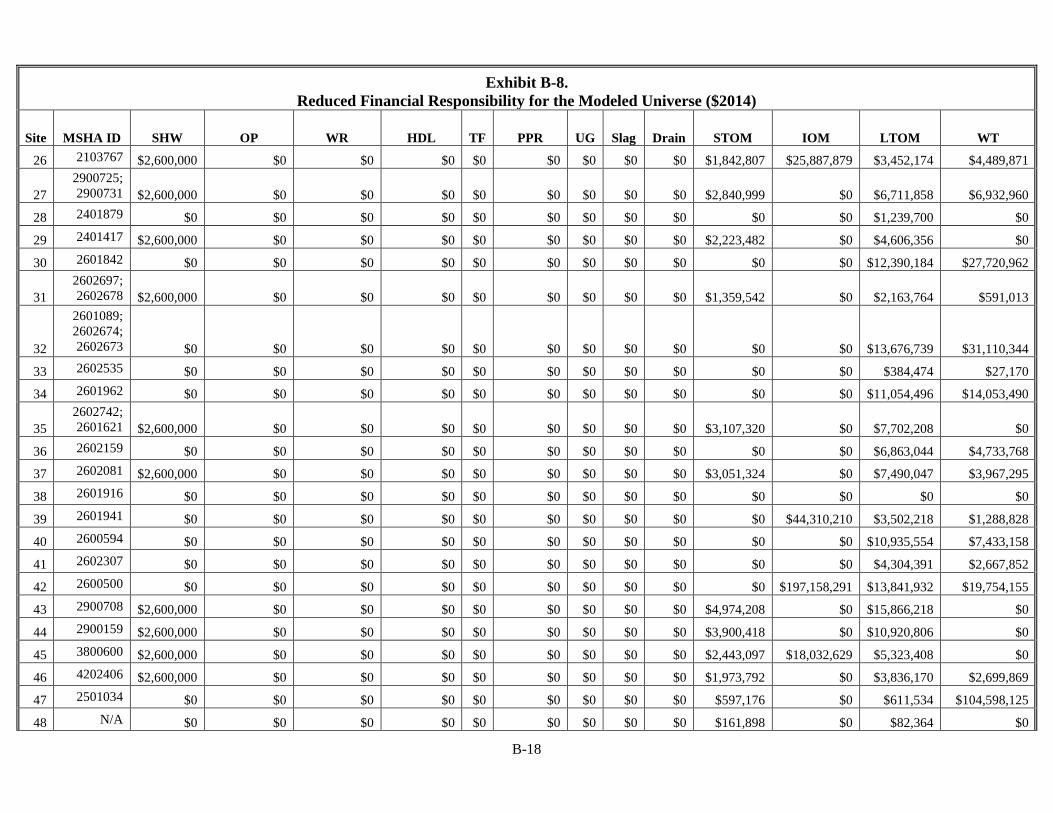
B-18
Exhibit B-8.
Reduced Financial Responsibility for the Modeled Universe ($2014)
Site MSHA ID SHW OP WR HDL TF PPR UG Slag Drain STOM IOM LTOM WT
26 2103767 $2,600,000 $0 $0 $0 $0 $0 $0 $0 $0 $1,842,807 $25,887,879 $3,452,174 $4,489,871
27
2900725;
2900731 $2,600,000 $0 $0 $0 $0 $0 $0 $0 $0 $2,840,999 $0 $6,711,858 $6,932,960
28 2401879 $0 $0 $0 $0 $0 $0 $0 $0 $0 $0 $0 $1,239,700 $0
29 2401417 $2,600,000 $0 $0 $0 $0 $0 $0 $0 $0 $2,223,482 $0 $4,606,356 $0
30 2601842 $0 $0 $0 $0 $0 $0 $0 $0 $0 $0 $0 $12,390,184 $27,720,962
31
2602697;
2602678 $2,600,000 $0 $0 $0 $0 $0 $0 $0 $0 $1,359,542 $0 $2,163,764 $591,013
32
2601089;
2602674;
2602673 $0 $0 $0 $0 $0 $0 $0 $0 $0 $0 $0 $13,676,739 $31,110,344
33 2602535 $0 $0 $0 $0 $0 $0 $0 $0 $0 $0 $0 $384,474 $27,170
34 2601962 $0 $0 $0 $0 $0 $0 $0 $0 $0 $0 $0 $11,054,496 $14,053,490
35
2602742;
2601621 $2,600,000 $0 $0 $0 $0 $0 $0 $0 $0 $3,107,320 $0 $7,702,208 $0
36 2602159 $0 $0 $0 $0 $0 $0 $0 $0 $0 $0 $0 $6,863,044 $4,733,768
37 2602081 $2,600,000 $0 $0 $0 $0 $0 $0 $0 $0 $3,051,324 $0 $7,490,047 $3,967,295
38 2601916 $0 $0 $0 $0 $0 $0 $0 $0 $0 $0 $0 $0 $0
39 2601941 $0 $0 $0 $0 $0 $0 $0 $0 $0 $0 $44,310,210 $3,502,218 $1,288,828
40 2600594 $0 $0 $0 $0 $0 $0 $0 $0 $0 $0 $0 $10,935,554 $7,433,158
41 2602307 $0 $0 $0 $0 $0 $0 $0 $0 $0 $0 $0 $4,304,391 $2,667,852
42 2600500 $0 $0 $0 $0 $0 $0 $0 $0 $0 $0 $197,158,291 $13,841,932 $19,754,155
43 2900708 $2,600,000 $0 $0 $0 $0 $0 $0 $0 $0 $4,974,208 $0 $15,866,218 $0
44 2900159 $2,600,000 $0 $0 $0 $0 $0 $0 $0 $0 $3,900,418 $0 $10,920,806 $0
45 3800600 $2,600,000 $0 $0 $0 $0 $0 $0 $0 $0 $2,443,097 $18,032,629 $5,323,408 $0
46 4202406 $2,600,000 $0 $0 $0 $0 $0 $0 $0 $0 $1,973,792 $0 $3,836,170 $2,699,869
47 2501034 $0 $0 $0 $0 $0 $0 $0 $0 $0 $597,176 $0 $611,534 $104,598,125
48 N/A $0 $0 $0 $0 $0 $0 $0 $0 $0 $161,898 $0 $82,364 $0
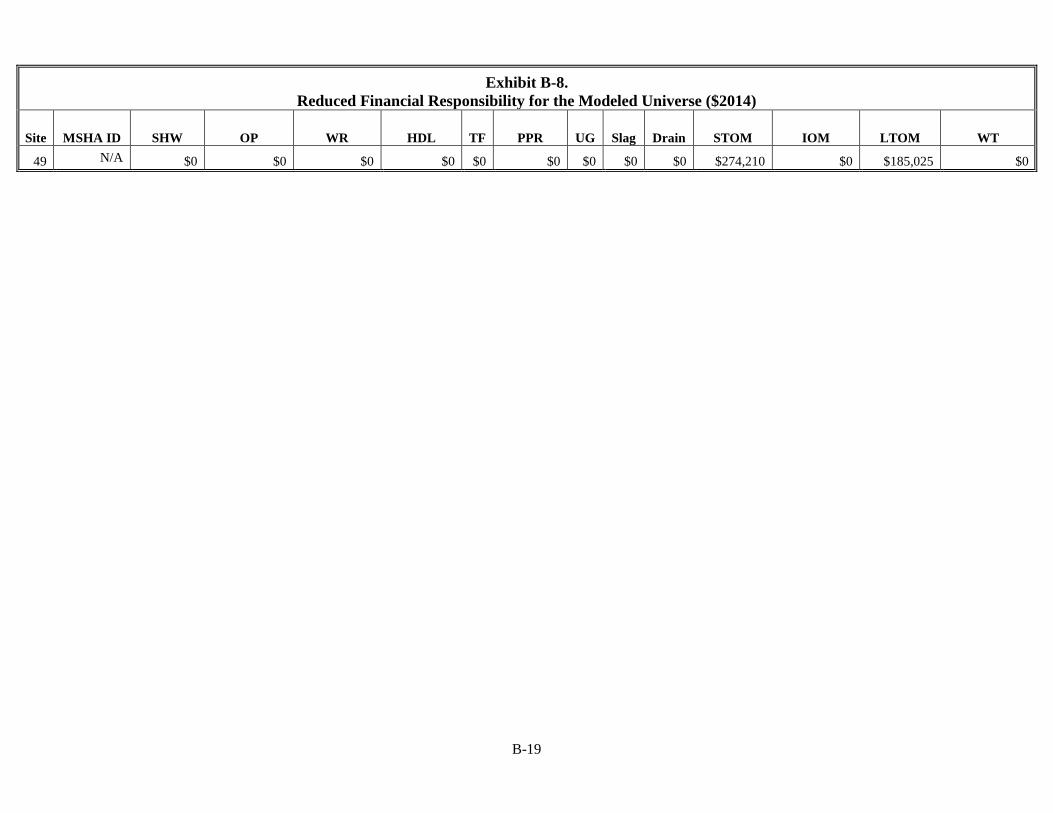
B-19
Exhibit B-8.
Reduced Financial Responsibility for the Modeled Universe ($2014)
Site MSHA ID SHW OP WR HDL TF PPR UG Slag Drain STOM IOM LTOM WT
49 N/A $0 $0 $0 $0 $0 $0 $0 $0 $0 $274,210 $0 $185,025 $0
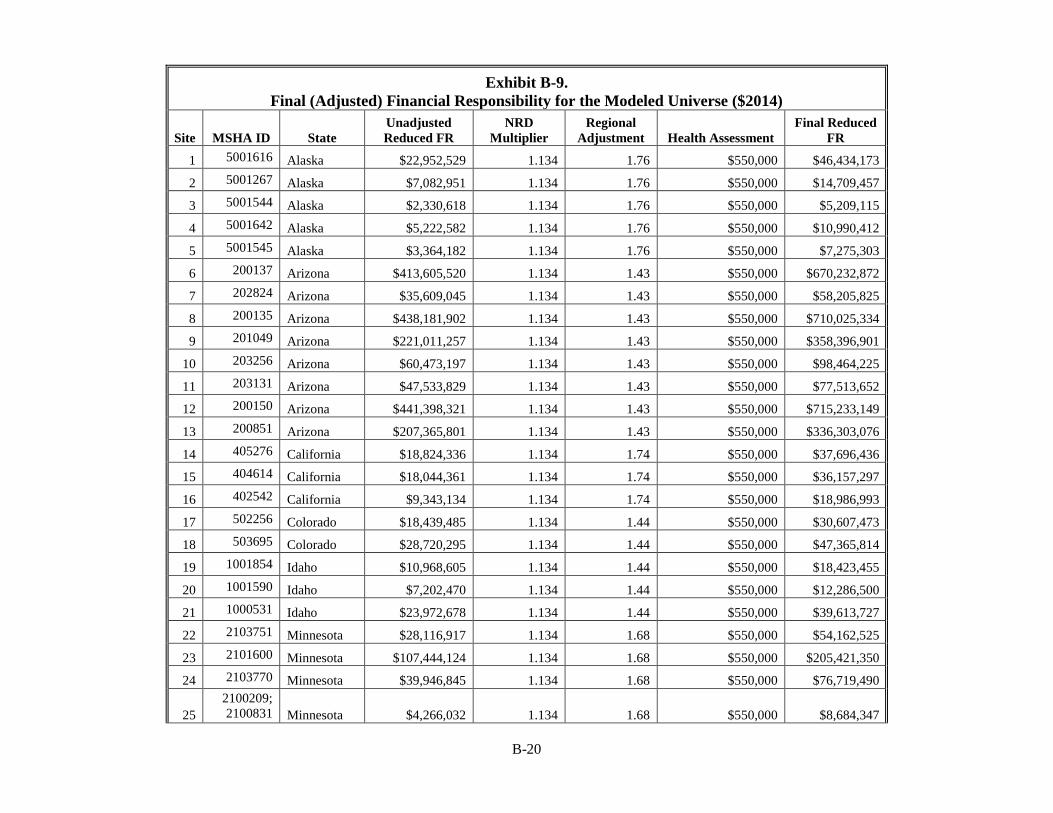
B-20
Exhibit B-9.
Final (Adjusted) Financial Responsibility for the Modeled Universe ($2014)
Site MSHA ID State
Unadjusted
Reduced FR
NRD
Multiplier
Regional
Adjustment Health Assessment
Final Reduced
FR
1 5001616 Alaska $22,952,529 1.134 1.76 $550,000 $46,434,173
2 5001267 Alaska $7,082,951 1.134 1.76 $550,000 $14,709,457
3 5001544 Alaska $2,330,618 1.134 1.76 $550,000 $5,209,115
4 5001642 Alaska $5,222,582 1.134 1.76 $550,000 $10,990,412
5 5001545 Alaska $3,364,182 1.134 1.76 $550,000 $7,275,303
6 200137 Arizona $413,605,520 1.134 1.43 $550,000 $670,232,872
7 202824 Arizona $35,609,045 1.134 1.43 $550,000 $58,205,825
8 200135 Arizona $438,181,902 1.134 1.43 $550,000 $710,025,334
9 201049 Arizona $221,011,257 1.134 1.43 $550,000 $358,396,901
10 203256 Arizona $60,473,197 1.134 1.43 $550,000 $98,464,225
11 203131 Arizona $47,533,829 1.134 1.43 $550,000 $77,513,652
12 200150 Arizona $441,398,321 1.134 1.43 $550,000 $715,233,149
13 200851 Arizona $207,365,801 1.134 1.43 $550,000 $336,303,076
14 405276 California $18,824,336 1.134 1.74 $550,000 $37,696,436
15 404614 California $18,044,361 1.134 1.74 $550,000 $36,157,297
16 402542 California $9,343,134 1.134 1.74 $550,000 $18,986,993
17 502256 Colorado $18,439,485 1.134 1.44 $550,000 $30,607,473
18 503695 Colorado $28,720,295 1.134 1.44 $550,000 $47,365,814
19 1001854 Idaho $10,968,605 1.134 1.44 $550,000 $18,423,455
20 1001590 Idaho $7,202,470 1.134 1.44 $550,000 $12,286,500
21 1000531 Idaho $23,972,678 1.134 1.44 $550,000 $39,613,727
22 2103751 Minnesota $28,116,917 1.134 1.68 $550,000 $54,162,525
23 2101600 Minnesota $107,444,124 1.134 1.68 $550,000 $205,421,350
24 2103770 Minnesota $39,946,845 1.134 1.68 $550,000 $76,719,490
25
2100209;
2100831 Minnesota $4,266,032 1.134 1.68 $550,000 $8,684,347
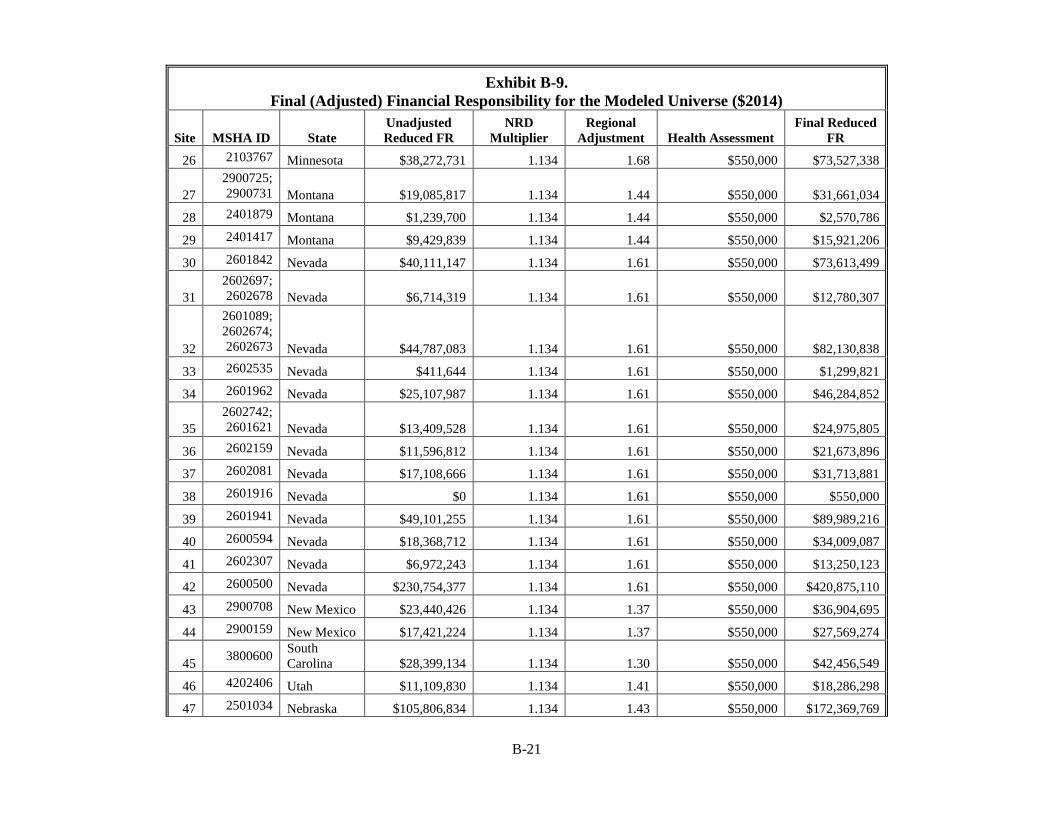
B-21
Exhibit B-9.
Final (Adjusted) Financial Responsibility for the Modeled Universe ($2014)
Site MSHA ID State
Unadjusted
Reduced FR
NRD
Multiplier
Regional
Adjustment Health Assessment
Final Reduced
FR
26 2103767 Minnesota $38,272,731 1.134 1.68 $550,000 $73,527,338
27
2900725;
2900731 Montana $19,085,817 1.134 1.44 $550,000 $31,661,034
28 2401879 Montana $1,239,700 1.134 1.44 $550,000 $2,570,786
29 2401417 Montana $9,429,839 1.134 1.44 $550,000 $15,921,206
30 2601842 Nevada $40,111,147 1.134 1.61 $550,000 $73,613,499
31
2602697;
2602678 Nevada $6,714,319 1.134 1.61 $550,000 $12,780,307
32
2601089;
2602674;
2602673 Nevada $44,787,083 1.134 1.61 $550,000 $82,130,838
33 2602535 Nevada $411,644 1.134 1.61 $550,000 $1,299,821
34 2601962 Nevada $25,107,987 1.134 1.61 $550,000 $46,284,852
35
2602742;
2601621 Nevada $13,409,528 1.134 1.61 $550,000 $24,975,805
36 2602159 Nevada $11,596,812 1.134 1.61 $550,000 $21,673,896
37 2602081 Nevada $17,108,666 1.134 1.61 $550,000 $31,713,881
38 2601916 Nevada $0 1.134 1.61 $550,000 $550,000
39 2601941 Nevada $49,101,255 1.134 1.61 $550,000 $89,989,216
40 2600594 Nevada $18,368,712 1.134 1.61 $550,000 $34,009,087
41 2602307 Nevada $6,972,243 1.134 1.61 $550,000 $13,250,123
42 2600500 Nevada $230,754,377 1.134 1.61 $550,000 $420,875,110
43 2900708 New Mexico $23,440,426 1.134 1.37 $550,000 $36,904,695
44 2900159 New Mexico $17,421,224 1.134 1.37 $550,000 $27,569,274
45 3800600
South
Carolina $28,399,134 1.134 1.30 $550,000 $42,456,549
46 4202406 Utah $11,109,830 1.134 1.41 $550,000 $18,286,298
47 2501034 Nebraska $105,806,834 1.134 1.43 $550,000 $172,369,769
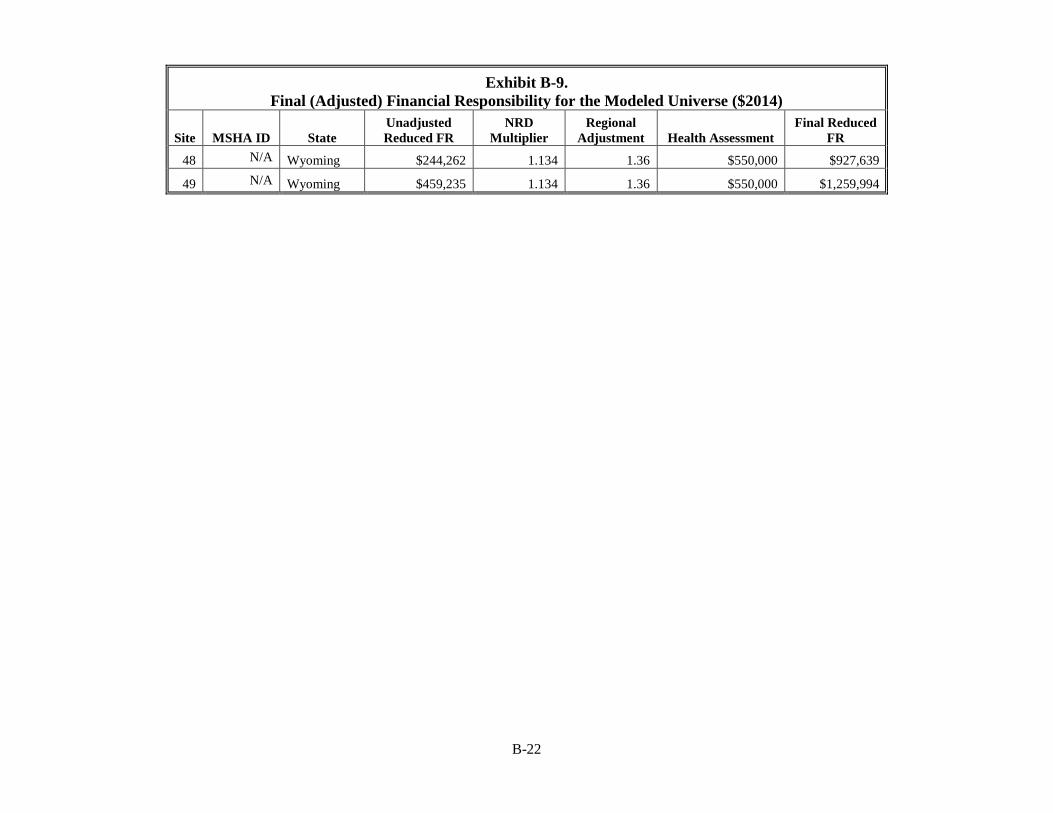
B-22
Exhibit B-9.
Final (Adjusted) Financial Responsibility for the Modeled Universe ($2014)
Site MSHA ID State
Unadjusted
Reduced FR
NRD
Multiplier
Regional
Adjustment Health Assessment
Final Reduced
FR
48 N/A Wyoming $244,262 1.134 1.36 $550,000 $927,639
49 N/A Wyoming $459,235 1.134 1.36 $550,000 $1,259,994
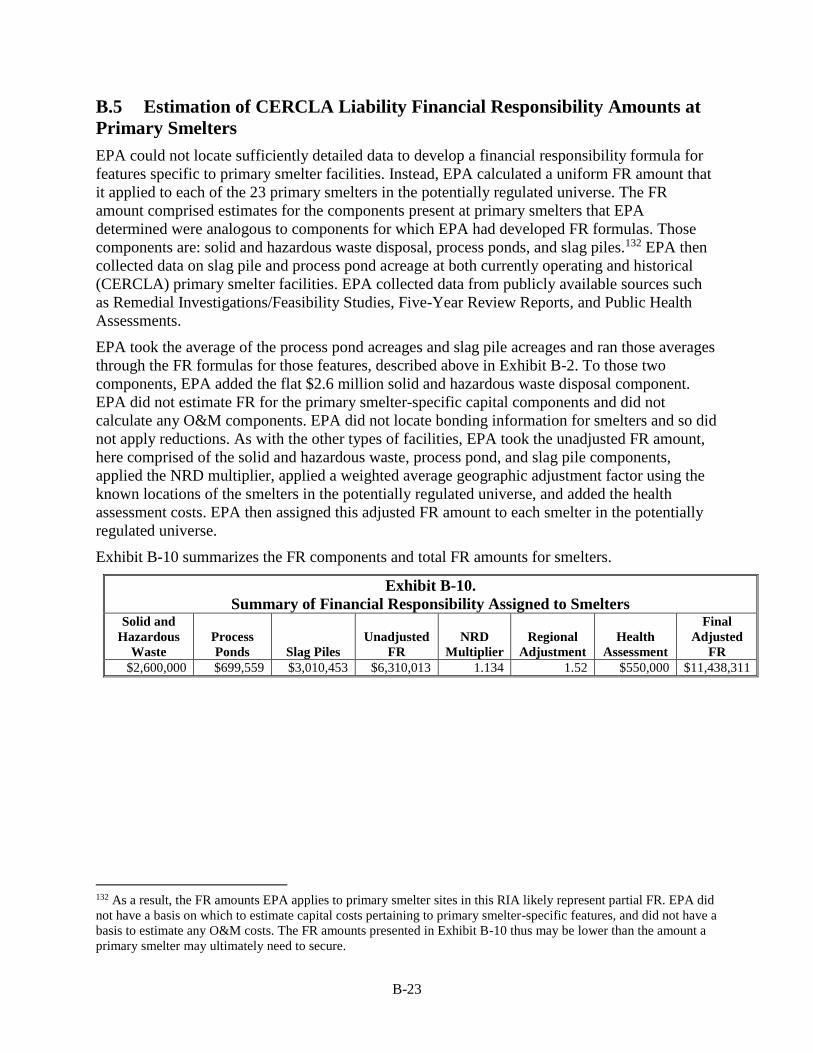
B-23
B.5 Estimation of CERCLA Liability Financial Responsibility Amounts at
Primary Smelters
EPA could not locate sufficiently detailed data to develop a financial responsibility formula for
features specific to primary smelter facilities. Instead, EPA calculated a uniform FR amount that
it applied to each of the 23 primary smelters in the potentially regulated universe. The FR
amount comprised estimates for the components present at primary smelters that EPA
determined were analogous to components for which EPA had developed FR formulas. Those
components are: solid and hazardous waste disposal, process ponds, and slag piles.132 EPA then
collected data on slag pile and process pond acreage at both currently operating and historical
(CERCLA) primary smelter facilities. EPA collected data from publicly available sources such
as Remedial Investigations/Feasibility Studies, Five-Year Review Reports, and Public Health
Assessments.
EPA took the average of the process pond acreages and slag pile acreages and ran those averages
through the FR formulas for those features, described above in Exhibit B-2. To those two
components, EPA added the flat $2.6 million solid and hazardous waste disposal component.
EPA did not estimate FR for the primary smelter-specific capital components and did not
calculate any O&M components. EPA did not locate bonding information for smelters and so did
not apply reductions. As with the other types of facilities, EPA took the unadjusted FR amount,
here comprised of the solid and hazardous waste, process pond, and slag pile components,
applied the NRD multiplier, applied a weighted average geographic adjustment factor using the
known locations of the smelters in the potentially regulated universe, and added the health
assessment costs. EPA then assigned this adjusted FR amount to each smelter in the potentially
regulated universe.
Exhibit B-10 summarizes the FR components and total FR amounts for smelters.
Exhibit B-10.
Summary of Financial Responsibility Assigned to Smelters Solid and
Hazardous
Waste
Process
Ponds Slag Piles
Unadjusted
FR
NRD
Multiplier
Regional
Adjustment
Health
Assessment
Final
Adjusted
FR
$2,600,000 $699,559 $3,010,453 $6,310,013 1.134 1.52 $550,000 $11,438,311
132 As a result, the FR amounts EPA applies to primary smelter sites in this RIA likely represent partial FR. EPA did
not have a basis on which to estimate capital costs pertaining to primary smelter-specific features, and did not have a
basis to estimate any O&M costs. The FR amounts presented in Exhibit B-10 thus may be lower than the amount a
primary smelter may ultimately need to secure.
C-1
Appendix C. Acreage Scaling
EPA used the acreages that the facilities in the modeled universe provided in their cost estimate
documents as a variable in the generation of response component estimates. Those acreages
reflected the amount of disturbed acres the facilities expected to exist at closure. However, the
rule requires facilities to provide cost estimates based on the conditions as they exist at the time
of the estimate. Disturbed acreage increases over the course of a facility’s operating life; as such
a facility may have a lower financial responsibility amount at a given point before closure than at
closure. To estimate the growth of disturbed acreage and the effect reduced acreages relative to
closure date would have on financial responsibility requirements over the course of operations,
EPA reviewed available operational documents, such as environmental impact statements (EIS)
and reclamation and closure plans, for facilities in the modeled universe that tracked acreage
expansion. Comprehensive lists of all data sources are available in Appendices B through J of the
Financial Responsibility Formula Background Document.133 Based on this review, EPA
generated scaling rules to model the expansion of features found to experience acreage growth.
EPA then applied the results of that scaling to the cost estimate formula.134
To analyze the potential increase in disturbed acreage over the facility life of various facilities,
EPA collected data for a sample of 40 facilities from engineering cost estimate and financial
assurance documents, as well as reclamation and closure plans, environmental impact statements,
and aquifer protection permits. Generally, facility operators report the number of disturbed acres
they expect to reclaim for each feature at the facility at closure. Sometimes, facility operators
also report the number of disturbed acres for each feature as of the estimate date in addition to
the anticipated closure date. Where available, EPA collected data on disturbed acres as of the
year of the estimate and the expected/planned disturbed acres at closure for the following five
features: open pits, waste rock disposal facilities, heap/dump leaches, tailings facilities, and
process ponds. EPA also attempted to collect similar data on site-wide acreage.
The data collection process generally yielded two data points per facility (a snapshot of disturbed
acreage at the time of the estimate and a projected disturbed acreage at facility closure) for each
feature. Some facilities had multiple snapshots of disturbed acreage due to multiple estimates or
year-by-year projections of feature expansion. Acreage data were available for at least two points
in time for the following facility features: open pits (18 facilities); waste rock disposals (18
facilities); heap/dump leaches (13 facilities); and tailings impoundments (13 facilities). There
were insufficient data to analyze changes in disturbed acreage for process ponds. Moreover, the
data indicated that process ponds do not experience expansion that would significantly affect the
cost of environmental liabilities over the course of the facility life. There were also insufficient
data to analyze changes in site-wide acreage, even though there were sometimes data for
individual facility features.135
133 U.S. Environmental Protection Agency, “CERCLA 108(b) Financial Responsibility Formula for Hardrock
Mining Facilities Background Document” Office of Land and Emergency Management (September 2016). 134 EPA assumes patterns of past expansion are indicative of future expansion for the modeled universe. 135 Site-wide acreage is a driving variable in the drainage, short-term O&M, and long-term O&M cost formulas in
the Cost Estimate Model. For these formulas, site-wide acreage is calculated as the sum of all of the feature
C-2
To account for differences in facility size, the growth (or expansion) rate for each feature is
calculated as the percentage difference between current disturbed acreage at the time of the
estimate and the expected disturbed acreage at closure divided by the amount of time between
the two estimates expressed as a percentage of the facility’s life. For example, the estimated
growth rate for an open pit between 47 percent of its expected disturbed acreage at closure at 17
percent of the facility’s life and 100 percent of its expected disturbed acreage at 100 percent of
the facility’s life is 0.64. This implies that for each one percent increase in the facility’s life, the
open pit will expand an additional 0.64 percent of its expected disturbed acreage at closure.
Thus, the size of the open pit will increase by 53 percent of its size at closure over the last 83
percent of the facility’s life. Note that for some facilities certain facility features were completed
much earlier in their life cycles (e.g., 100 percent of the predicted closure acreage at 40 percent
of the facility’s life) and had little to no growth during the time frame analyzed, while other
facilities had features that were relatively undeveloped in the time period analyzed and
anticipated scaling up rapidly before closure.
EPA calculated the acreage expansion rate for each facility (i.e., the slope of the snapshot of
disturbed acreage at a given estimate to the expected disturbed acreage at closure). Then, EPA
calculated the average of those facility-specific expansion rates. The average of the facility-
specific expansion rates captures the relationship between the data points collected for each
facility, rather than treating each observed acreage at a given point in a facility’s operating life as
independent. Therefore, facilities for which more than one data point was collected are not over-
represented in the average.
A limitation to the average growth rate approach is that the linear model it creates does not
capture that many facilities had completed the expansion of a feature before the end of their
operations. By the same token, anecdotal evidence from the few sites with more than two data
points suggested that facilities experience a rapid acreage expansion in the first years of facility
life, followed by a decreased growth rate during the remaining facility life. Ultimately, EPA
lacked sufficient data to generate a nonlinear model.
The scatter plots and formulas that resulted from EPA’s analysis, and that EPA applied to the
financial responsibility estimates, are reported below in Exhibits C-1 through C-4.
acreages. Therefore, scaling the acreages for relevant features will also scale the acreage used in the drainage and
O&M formulas.
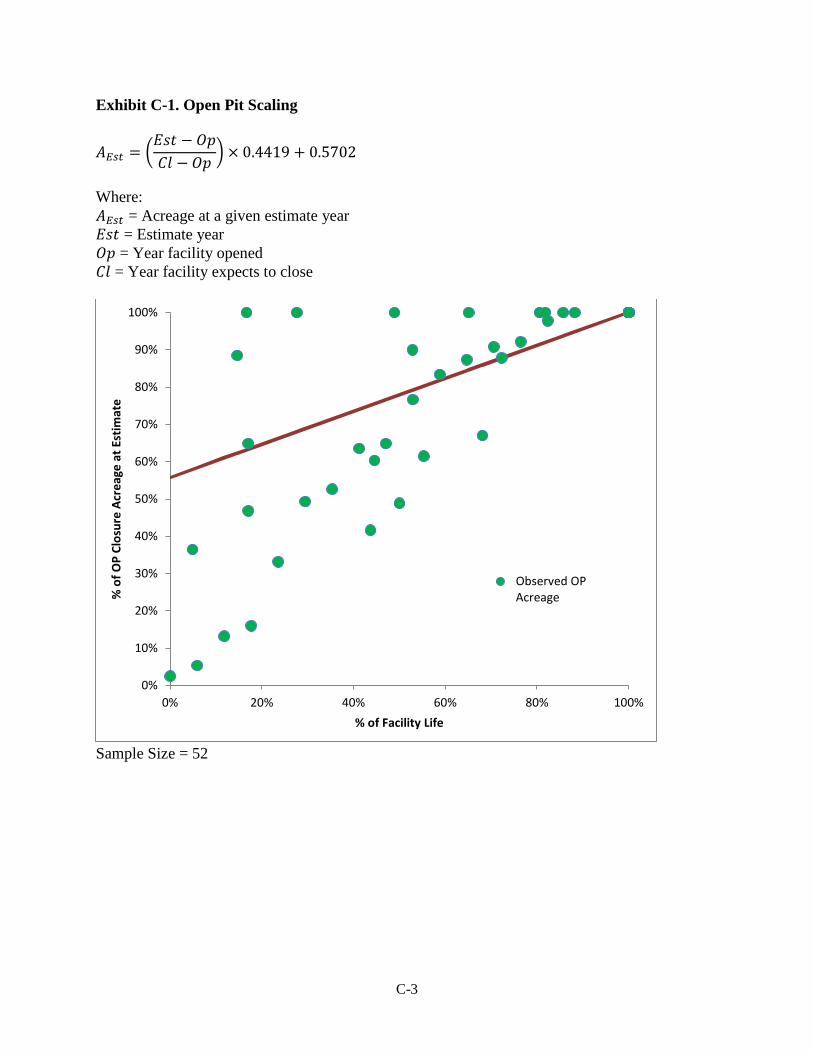
C-3
Exhibit C-1. Open Pit Scaling
𝐴𝐸𝑠𝑡 = (𝐸𝑠𝑡 − 𝑂𝑝
𝐶𝑙 − 𝑂𝑝) × 0.4419 + 0.5702
Where:
𝐴𝐸𝑠𝑡 = Acreage at a given estimate year
𝐸𝑠𝑡 = Estimate year
𝑂𝑝 = Year facility opened
𝐶𝑙 = Year facility expects to close
Sample Size = 52
0%
10%
20%
30%
40%
50%
60%
70%
80%
90%
100%
0% 20% 40% 60% 80% 100%
% o
f O
P C
losu
re A
cre
age
at
Esti
mat
e
% of Facility Life
Observed OPAcreage
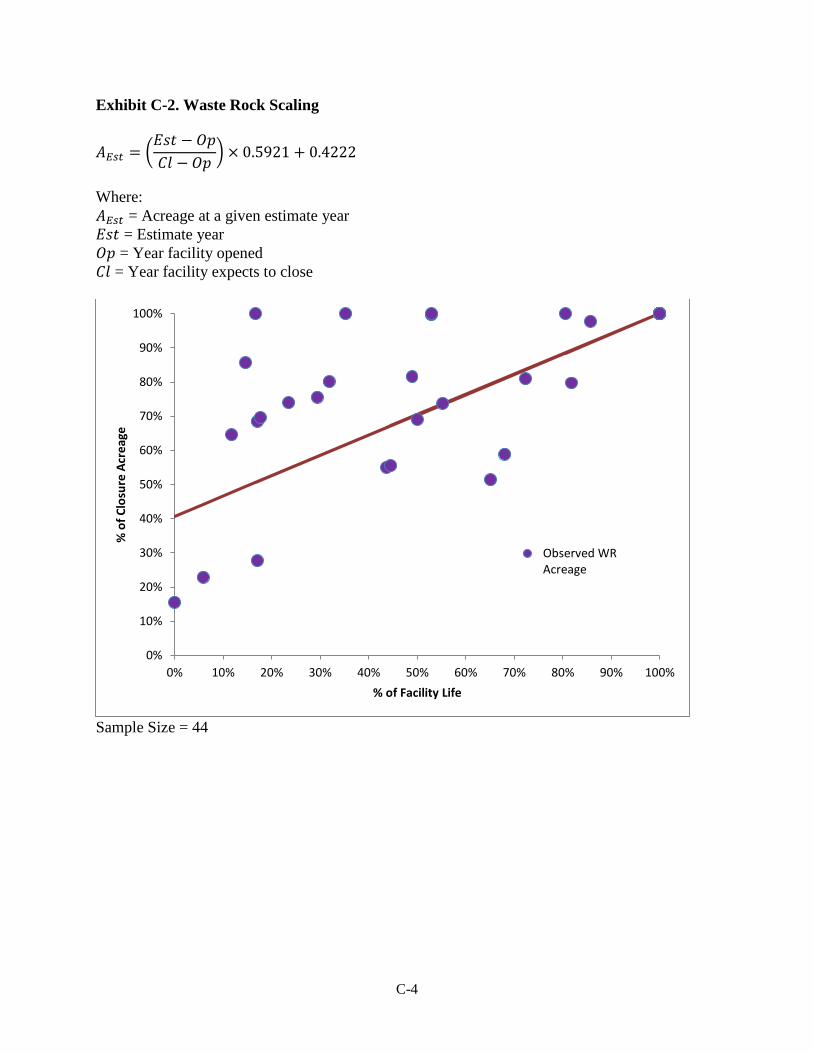
C-4
Exhibit C-2. Waste Rock Scaling
𝐴𝐸𝑠𝑡 = (𝐸𝑠𝑡 − 𝑂𝑝
𝐶𝑙 − 𝑂𝑝) × 0.5921 + 0.4222
Where:
𝐴𝐸𝑠𝑡 = Acreage at a given estimate year
𝐸𝑠𝑡 = Estimate year
𝑂𝑝 = Year facility opened
𝐶𝑙 = Year facility expects to close
Sample Size = 44
0%
10%
20%
30%
40%
50%
60%
70%
80%
90%
100%
0% 10% 20% 30% 40% 50% 60% 70% 80% 90% 100%
% o
f C
losu
re A
cre
age
% of Facility Life
Observed WRAcreage
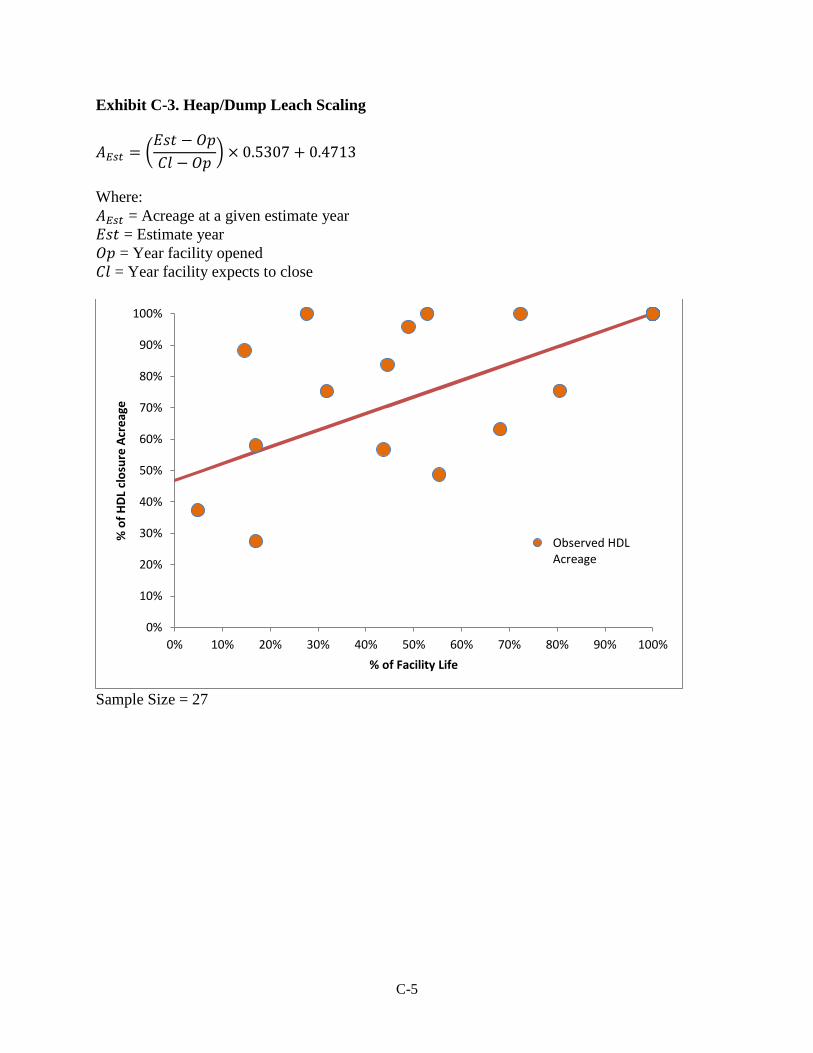
C-5
Exhibit C-3. Heap/Dump Leach Scaling
𝐴𝐸𝑠𝑡 = (𝐸𝑠𝑡 − 𝑂𝑝
𝐶𝑙 − 𝑂𝑝) × 0.5307 + 0.4713
Where:
𝐴𝐸𝑠𝑡 = Acreage at a given estimate year
𝐸𝑠𝑡 = Estimate year
𝑂𝑝 = Year facility opened
𝐶𝑙 = Year facility expects to close
Sample Size = 27
0%
10%
20%
30%
40%
50%
60%
70%
80%
90%
100%
0% 10% 20% 30% 40% 50% 60% 70% 80% 90% 100%
% o
f H
DL
clo
sure
Acr
eag
e
% of Facility Life
Observed HDLAcreage
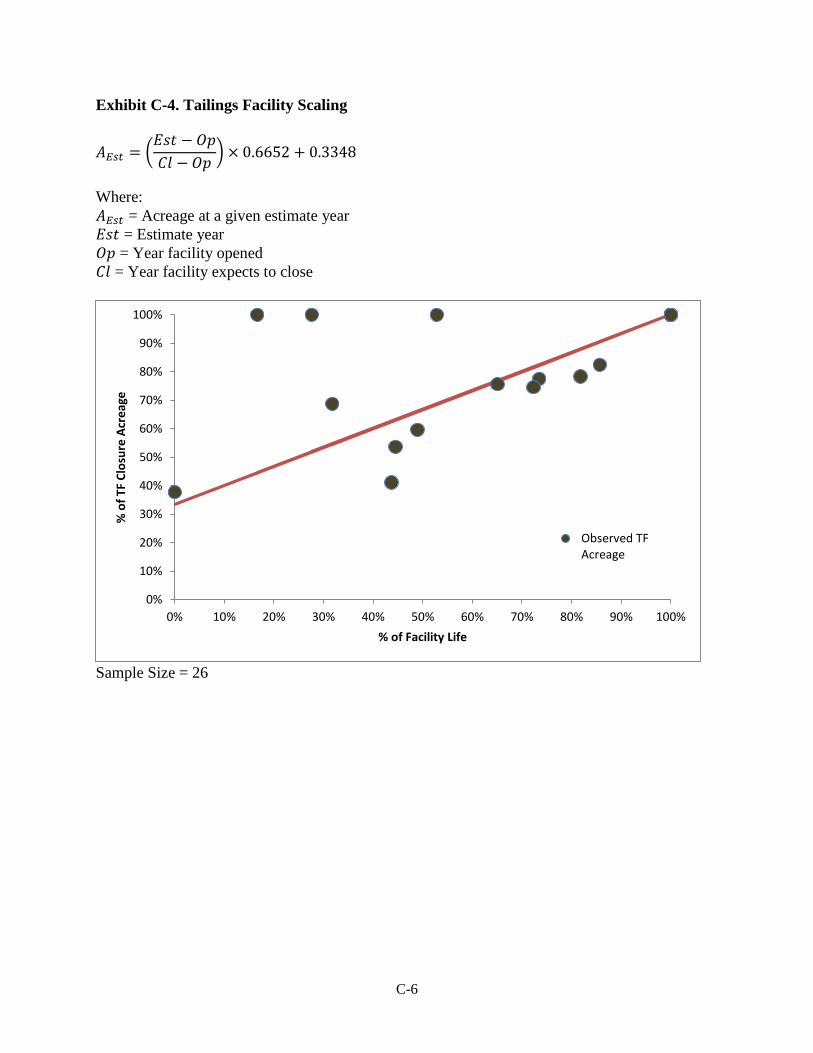
C-6
Exhibit C-4. Tailings Facility Scaling
𝐴𝐸𝑠𝑡 = (𝐸𝑠𝑡 − 𝑂𝑝
𝐶𝑙 − 𝑂𝑝) × 0.6652 + 0.3348
Where:
𝐴𝐸𝑠𝑡 = Acreage at a given estimate year
𝐸𝑠𝑡 = Estimate year
𝑂𝑝 = Year facility opened
𝐶𝑙 = Year facility expects to close
Sample Size = 26
0%
10%
20%
30%
40%
50%
60%
70%
80%
90%
100%
0% 10% 20% 30% 40% 50% 60% 70% 80% 90% 100%
% o
f TF
Clo
sure
Acr
eag
e
% of Facility Life
Observed TFAcreage
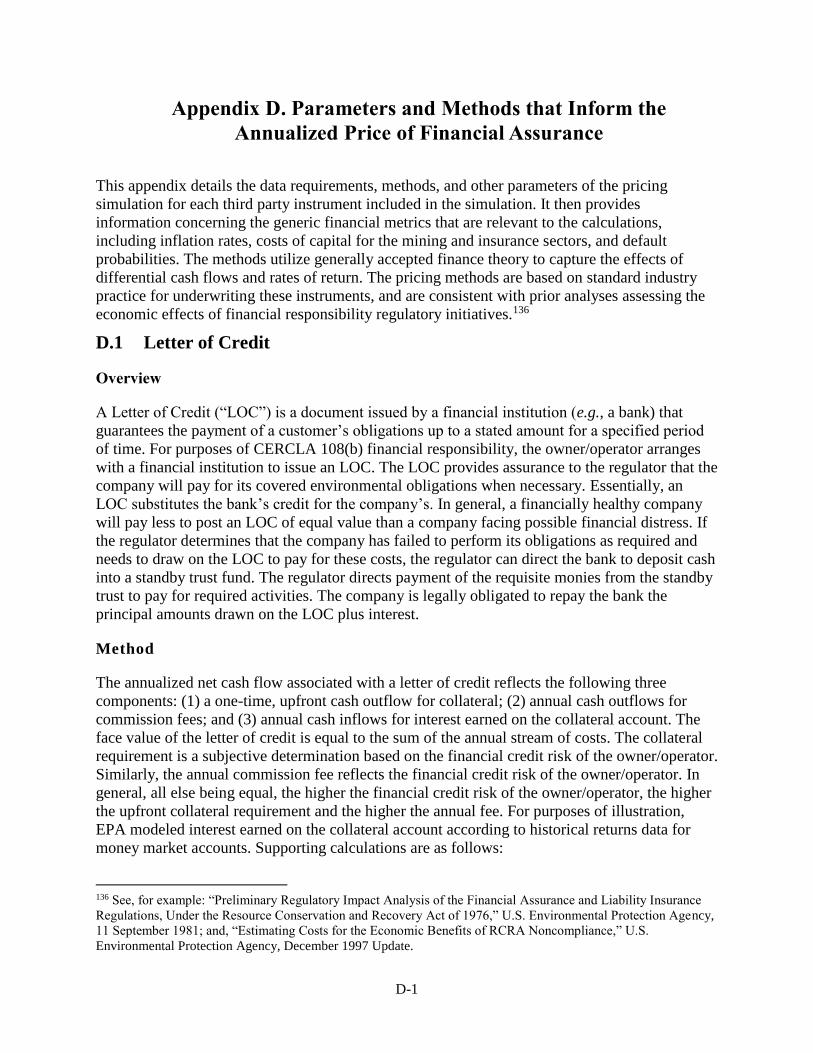
D-1
Appendix D. Parameters and Methods that Inform the
Annualized Price of Financial Assurance
This appendix details the data requirements, methods, and other parameters of the pricing
simulation for each third party instrument included in the simulation. It then provides
information concerning the generic financial metrics that are relevant to the calculations,
including inflation rates, costs of capital for the mining and insurance sectors, and default
probabilities. The methods utilize generally accepted finance theory to capture the effects of
differential cash flows and rates of return. The pricing methods are based on standard industry
practice for underwriting these instruments, and are consistent with prior analyses assessing the
economic effects of financial responsibility regulatory initiatives.136
D.1 Letter of Credit
Overview
A Letter of Credit (“LOC”) is a document issued by a financial institution (e.g., a bank) that
guarantees the payment of a customer’s obligations up to a stated amount for a specified period
of time. For purposes of CERCLA 108(b) financial responsibility, the owner/operator arranges
with a financial institution to issue an LOC. The LOC provides assurance to the regulator that the
company will pay for its covered environmental obligations when necessary. Essentially, an
LOC substitutes the bank’s credit for the company’s. In general, a financially healthy company
will pay less to post an LOC of equal value than a company facing possible financial distress. If
the regulator determines that the company has failed to perform its obligations as required and
needs to draw on the LOC to pay for these costs, the regulator can direct the bank to deposit cash
into a standby trust fund. The regulator directs payment of the requisite monies from the standby
trust to pay for required activities. The company is legally obligated to repay the bank the
principal amounts drawn on the LOC plus interest.
Method
The annualized net cash flow associated with a letter of credit reflects the following three
components: (1) a one-time, upfront cash outflow for collateral; (2) annual cash outflows for
commission fees; and (3) annual cash inflows for interest earned on the collateral account. The
face value of the letter of credit is equal to the sum of the annual stream of costs. The collateral
requirement is a subjective determination based on the financial credit risk of the owner/operator.
Similarly, the annual commission fee reflects the financial credit risk of the owner/operator. In
general, all else being equal, the higher the financial credit risk of the owner/operator, the higher
the upfront collateral requirement and the higher the annual fee. For purposes of illustration,
EPA modeled interest earned on the collateral account according to historical returns data for
money market accounts. Supporting calculations are as follows:
136 See, for example: “Preliminary Regulatory Impact Analysis of the Financial Assurance and Liability Insurance
Regulations, Under the Resource Conservation and Recovery Act of 1976,” U.S. Environmental Protection Agency,
11 September 1981; and, “Estimating Costs for the Economic Benefits of RCRA Noncompliance,” U.S.
Environmental Protection Agency, December 1997 Update.
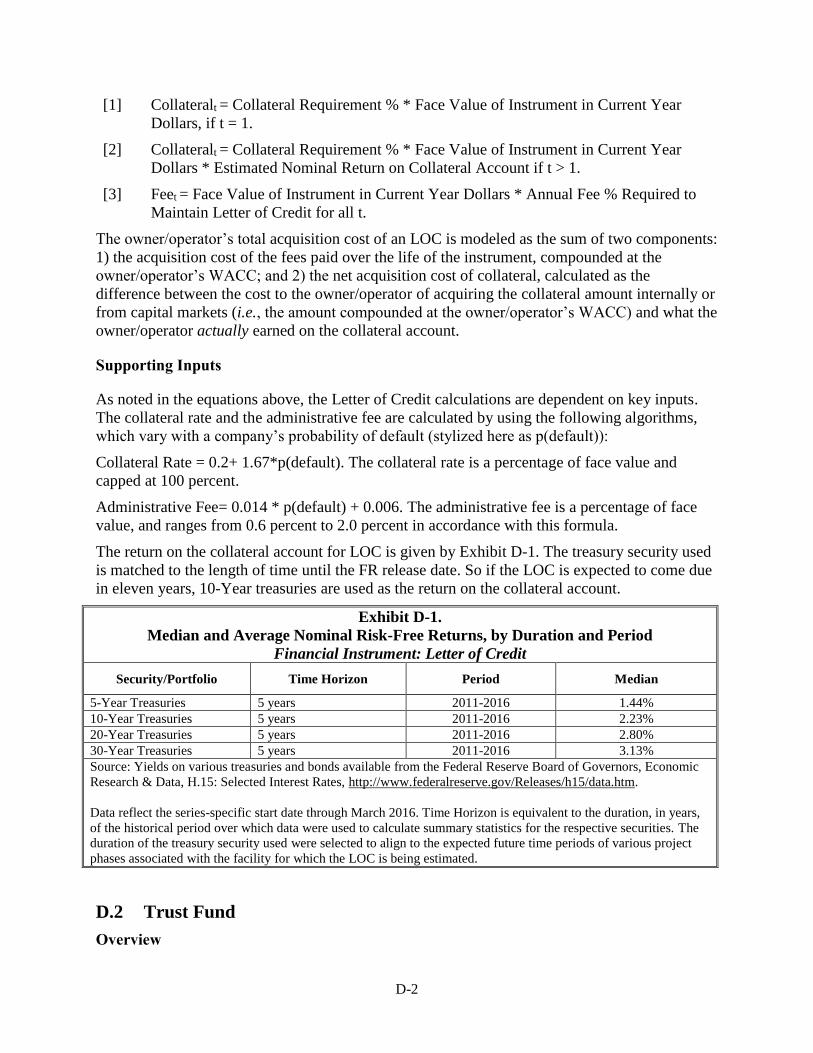
D-2
[1] Collateralt = Collateral Requirement % * Face Value of Instrument in Current Year
Dollars, if t = 1.
[2] Collateralt = Collateral Requirement % * Face Value of Instrument in Current Year
Dollars * Estimated Nominal Return on Collateral Account if t > 1.
[3] Feet = Face Value of Instrument in Current Year Dollars * Annual Fee % Required to
Maintain Letter of Credit for all t.
The owner/operator’s total acquisition cost of an LOC is modeled as the sum of two components:
1) the acquisition cost of the fees paid over the life of the instrument, compounded at the
owner/operator’s WACC; and 2) the net acquisition cost of collateral, calculated as the
difference between the cost to the owner/operator of acquiring the collateral amount internally or
from capital markets (i.e., the amount compounded at the owner/operator’s WACC) and what the
owner/operator actually earned on the collateral account.
Supporting Inputs
As noted in the equations above, the Letter of Credit calculations are dependent on key inputs.
The collateral rate and the administrative fee are calculated by using the following algorithms,
which vary with a company’s probability of default (stylized here as p(default)):
Collateral Rate = 0.2+ 1.67*p(default). The collateral rate is a percentage of face value and
capped at 100 percent.
Administrative Fee= 0.014 * p(default) + 0.006. The administrative fee is a percentage of face
value, and ranges from 0.6 percent to 2.0 percent in accordance with this formula.
The return on the collateral account for LOC is given by Exhibit D-1. The treasury security used
is matched to the length of time until the FR release date. So if the LOC is expected to come due
in eleven years, 10-Year treasuries are used as the return on the collateral account.
Exhibit D-1.
Median and Average Nominal Risk-Free Returns, by Duration and Period
Financial Instrument: Letter of Credit
Security/Portfolio Time Horizon Period Median
5-Year Treasuries 5 years 2011-2016 1.44%
10-Year Treasuries 5 years 2011-2016 2.23%
20-Year Treasuries 5 years 2011-2016 2.80%
30-Year Treasuries 5 years 2011-2016 3.13%
Source: Yields on various treasuries and bonds available from the Federal Reserve Board of Governors, Economic
Research & Data, H.15: Selected Interest Rates, http://www.federalreserve.gov/Releases/h15/data.htm.
Data reflect the series-specific start date through March 2016. Time Horizon is equivalent to the duration, in years,
of the historical period over which data were used to calculate summary statistics for the respective securities. The
duration of the treasury security used were selected to align to the expected future time periods of various project
phases associated with the facility for which the LOC is being estimated.
D.2 Trust Fund
Overview
D-3
A trust fund is an agreement between three parties. One party (the grantor) transfers assets to a
trust that a second party (the trustee) holds and administers for the benefit of a third party (the
beneficiary). For purposes of financial assurance, the owner/operator (“the company”) is the
grantor. It transfers funds to a financial institution, which acts as trustee. The regulator is the
beneficiary. The funds are held in trust for the purpose of paying expenses related to stated
environmental obligations – in this case, the FR amounts. Depending on the situation, the
regulator may allow the company to deposit funds in phases. The schedule and size of payments
depend on: 1) the value of the trust fund at the time; 2) the current cost estimates subject to
financial responsibility; and 3) the period of time over which payments are to be made. A trust
fund may be used in combination with other financial responsibility mechanisms. If the company
does not perform its stated obligations, the regulator may direct the trustee to release funds to
another party that is authorized to conduct the activity.
Method
The annualized net cash flow associated with a trust fund or an escrow account reflects two
components: (1) the upfront cash outflow to fund the trust or escrow account, with a pay-in
period of one or multiple years, and (2) periodic investments (as necessary) to true-up the value
of the trust or escrow account if it does not generate sufficient interest to remain solvent over the
life of the project. The initial estimated cash outflows impute the timing and amounts of costs, as
well as the expected annual return on the trust or escrow account. For illustrative purposes, the
initial trust or escrow account investment is equal to the present value of the stream of future
costs, wherein the discount rate reflects the expected return on the trust or escrow account
adjusted for inflation (if applicable), fees, and taxes. The subjective credit risk of the
owner/operator informs the pay-in period over which the trust or escrow account is funded. All
else being equal, owner/operators with poor financial credit risk tend to be subject to shorter pay-
in periods when compared to their less financially risky counterparts.
Interest earned on the trust or escrow account reflects the expected return on the portfolio of
securities in which fund assets are invested. EPA assumes that the owner/operator is reimbursed
for costs in the year in which the costs are incurred, and set this year to the FR release date. In
other words, the calculation assumes that the trust funding, plus returns on these funds up to the
end of facility life, equal the FR amount as of that time.137 Supporting calculations are as
follows:
[1] Present Value of Cost Stream = Annual Costt/(1+Fee Adjusted Real Return)^t + Annual
Costt+1/(1+Fee Adjusted Real Return)^t+1 +…+ Annual Costt+n/(1+Fee Adjusted Real
Return)^t+n for all t
[2] Annual Investment in Trustt = Financial Responsibility Amount ∗Return on Trust
(1+Return on Trust)Number of Years to Pay−In−1 if t ≤number
of years in pay-in period, 0 otherwise.
[3] Interestt =[ Beginning Year Trust Balancet + Annual Investment in Trustt ]*Rate of
Return for all t
137 In practice, to the extent interest earned on the trust account after adjustments for inflation does not exceed the
taxes, fees, and reimbursement costs in a given year, the owner/operator will be subject to a cash outflow to true-up
the value of its financial responsibility instrument.
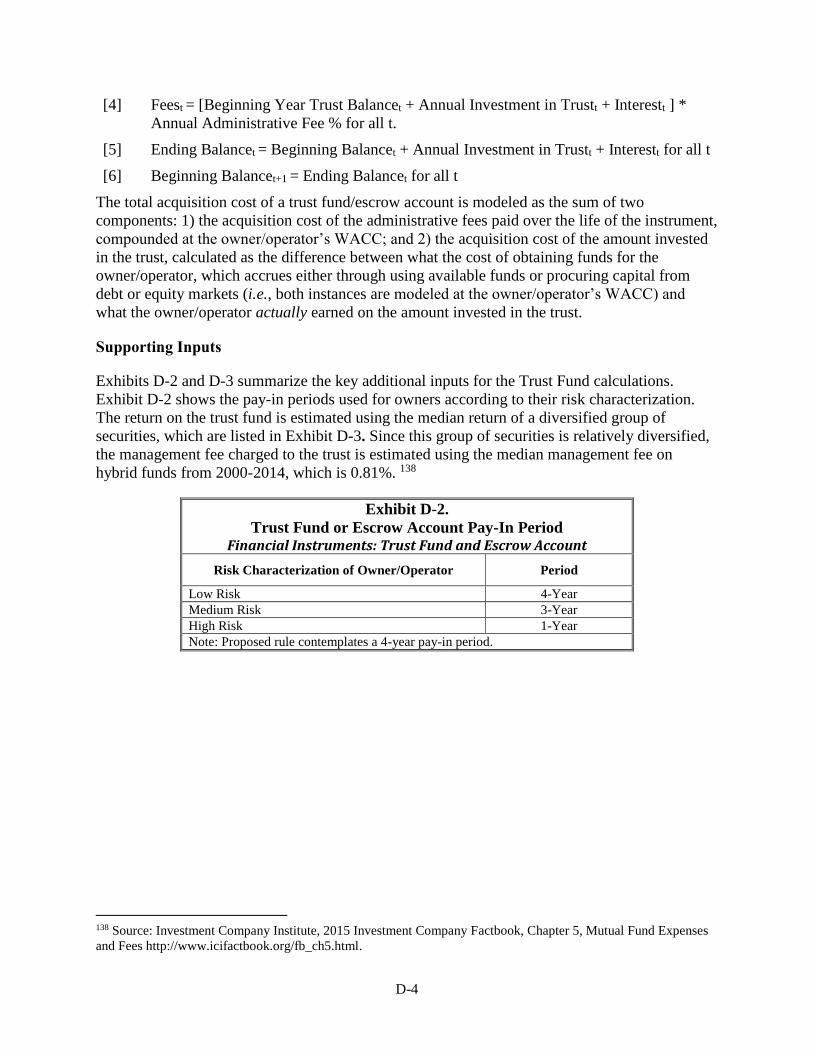
D-4
[4] Feest = [Beginning Year Trust Balancet + Annual Investment in Trustt + Interestt ] *
Annual Administrative Fee % for all t.
[5] Ending Balancet = Beginning Balancet + Annual Investment in Trustt + Interestt for all t
[6] Beginning Balancet+1 = Ending Balancet for all t
The total acquisition cost of a trust fund/escrow account is modeled as the sum of two
components: 1) the acquisition cost of the administrative fees paid over the life of the instrument,
compounded at the owner/operator’s WACC; and 2) the acquisition cost of the amount invested
in the trust, calculated as the difference between what the cost of obtaining funds for the
owner/operator, which accrues either through using available funds or procuring capital from
debt or equity markets (i.e., both instances are modeled at the owner/operator’s WACC) and
what the owner/operator actually earned on the amount invested in the trust.
Supporting Inputs
Exhibits D-2 and D-3 summarize the key additional inputs for the Trust Fund calculations.
Exhibit D-2 shows the pay-in periods used for owners according to their risk characterization.
The return on the trust fund is estimated using the median return of a diversified group of
securities, which are listed in Exhibit D-3. Since this group of securities is relatively diversified,
the management fee charged to the trust is estimated using the median management fee on
hybrid funds from 2000-2014, which is 0.81%. 138
Exhibit D-2.
Trust Fund or Escrow Account Pay-In Period Financial Instruments: Trust Fund and Escrow Account
Risk Characterization of Owner/Operator Period
Low Risk 4-Year
Medium Risk 3-Year
High Risk 1-Year
Note: Proposed rule contemplates a 4-year pay-in period.
138 Source: Investment Company Institute, 2015 Investment Company Factbook, Chapter 5, Mutual Fund Expenses
and Fees http://www.icifactbook.org/fb_ch5.html.
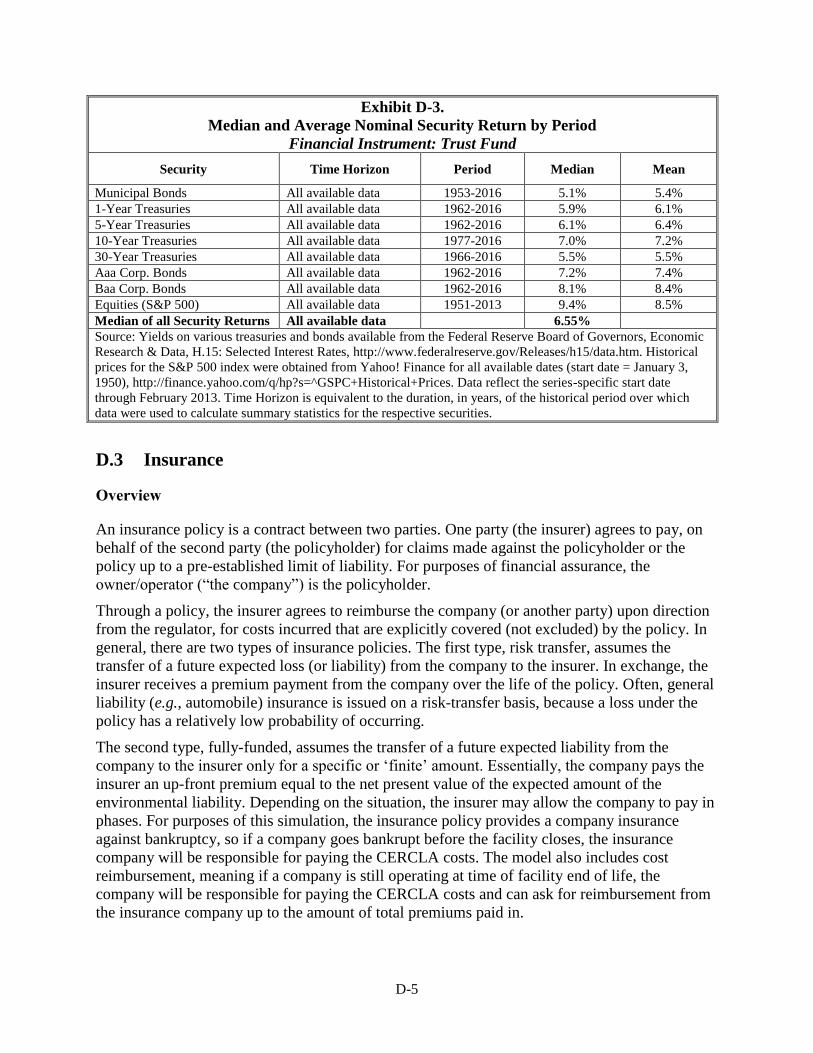
D-5
Exhibit D-3.
Median and Average Nominal Security Return by Period
Financial Instrument: Trust Fund
Security Time Horizon Period Median Mean
Municipal Bonds All available data 1953-2016 5.1% 5.4%
1-Year Treasuries All available data 1962-2016 5.9% 6.1%
5-Year Treasuries All available data 1962-2016 6.1% 6.4%
10-Year Treasuries All available data 1977-2016 7.0% 7.2%
30-Year Treasuries All available data 1966-2016 5.5% 5.5%
Aaa Corp. Bonds All available data 1962-2016 7.2% 7.4%
Baa Corp. Bonds All available data 1962-2016 8.1% 8.4%
Equities (S&P 500) All available data 1951-2013 9.4% 8.5%
Median of all Security Returns All available data 6.55%
Source: Yields on various treasuries and bonds available from the Federal Reserve Board of Governors, Economic
Research & Data, H.15: Selected Interest Rates, http://www.federalreserve.gov/Releases/h15/data.htm. Historical
prices for the S&P 500 index were obtained from Yahoo! Finance for all available dates (start date = January 3,
1950), http://finance.yahoo.com/q/hp?s=^GSPC+Historical+Prices. Data reflect the series-specific start date
through February 2013. Time Horizon is equivalent to the duration, in years, of the historical period over which
data were used to calculate summary statistics for the respective securities.
D.3 Insurance
Overview
An insurance policy is a contract between two parties. One party (the insurer) agrees to pay, on
behalf of the second party (the policyholder) for claims made against the policyholder or the
policy up to a pre-established limit of liability. For purposes of financial assurance, the
owner/operator (“the company”) is the policyholder.
Through a policy, the insurer agrees to reimburse the company (or another party) upon direction
from the regulator, for costs incurred that are explicitly covered (not excluded) by the policy. In
general, there are two types of insurance policies. The first type, risk transfer, assumes the
transfer of a future expected loss (or liability) from the company to the insurer. In exchange, the
insurer receives a premium payment from the company over the life of the policy. Often, general
liability (e.g., automobile) insurance is issued on a risk-transfer basis, because a loss under the
policy has a relatively low probability of occurring.
The second type, fully-funded, assumes the transfer of a future expected liability from the
company to the insurer only for a specific or ‘finite’ amount. Essentially, the company pays the
insurer an up-front premium equal to the net present value of the expected amount of the
environmental liability. Depending on the situation, the insurer may allow the company to pay in
phases. For purposes of this simulation, the insurance policy provides a company insurance
against bankruptcy, so if a company goes bankrupt before the facility closes, the insurance
company will be responsible for paying the CERCLA costs. The model also includes cost
reimbursement, meaning if a company is still operating at time of facility end of life, the
company will be responsible for paying the CERCLA costs and can ask for reimbursement from
the insurance company up to the amount of total premiums paid in.
D-6
EPA models this second type of insurance product in the pricing simulation. Risk transfer
policies are no longer widely used for environmental liabilities. Many insurers underwriting
environmental obligations do so using only finite (or fully-funded) policies. These policies tend
to more closely resemble trust funds than conventional general liability insurance policies,
limiting the liability (or risk exposure) of the insurer.
Method
The face value of an insurance policy (i.e., the policy’s limit of liability) is equal to the estimate
of financial responsibility derived from engineering costs. The insurer must receive premium
payments in an amount sufficient to ensure that, assuming the insurer reinvests the funds in its
own operations at its WACC (as a proxy for the insurer’s internal hurdle rate), sufficient funds
are available to cover the complete sum of obligations at the time of facility end of life. In other
words, the insurer will require premium payments such that, when the payment streams are
compounded at the insurer’s WACC, the total accumulated dollars equal the face value of the
policy in the year of closure.
The insurer assesses the relative risk of the owner/operator in order to determine the period over
which the premium must be paid. Lower-risk owner/operators (as measured by the
owner/operator’s probability of default) may have the option of paying annual premiums over
the life of the policy, while riskier entities may need to pay the entirety of the premium amount
over one or several years in the beginning of the policy’s life. All else equal, owner/operators
with questionable financial health tend to be subject to higher premium payments over shorter
time horizons, i.e., pay-in periods. Supporting calculations are as follows:
[1] Present Value of Cost Stream = Total Costc /(1+Insurer WACC)^c-p where c is the facility
end of life year and p is the last year of the pay-in period
[2] Premium Paymentt = Financial Responsibility Amount∗Insurer WACC
(1+Insurer WACC)Number of Years to Pay−In−1
The acquisition cost of insurance to owner/operators consists of the premium payments made by
the owner/operator, compounded at the owner/operator’s WACC. The cost equation assumes that
the insurance policies in question feature cost reimbursement up to the total amount of premium
paid by the company, such that the owner/operator is reimbursed fully for the premium payments
made. Therefore, the total acquisition cost of insurance is the foregone value of the premium
payments, compounded at the owner/operator’s WACC, less the premiums actually paid to the
insurer.
Supporting Inputs
The insurer’s cost of capital is estimated using the median WACC for SIC Code 63, Insurance
Carriers, from the Ibbotson Cost of Capital Yearbook 2013, which is 8.85 percent.
Exhibit D-4 shows the pay-in periods used for owners according to their risk characterization.
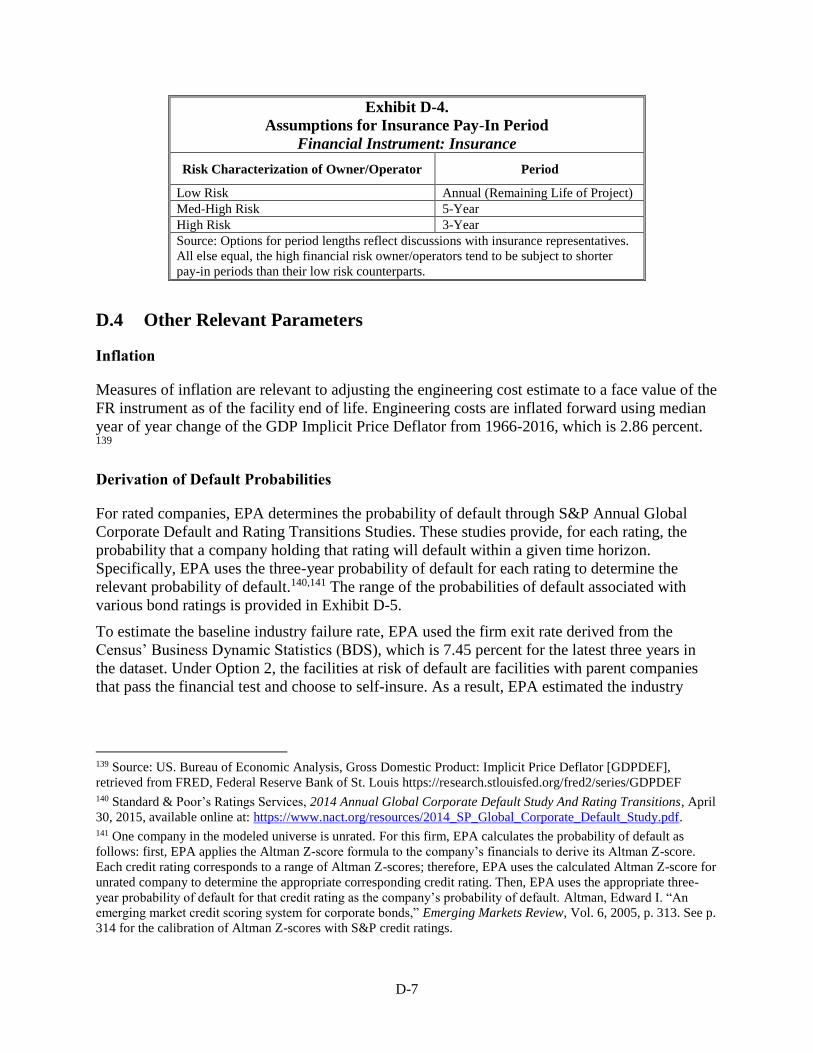
D-7
Exhibit D-4.
Assumptions for Insurance Pay-In Period
Financial Instrument: Insurance
Risk Characterization of Owner/Operator Period
Low Risk Annual (Remaining Life of Project)
Med-High Risk 5-Year
High Risk 3-Year
Source: Options for period lengths reflect discussions with insurance representatives.
All else equal, the high financial risk owner/operators tend to be subject to shorter
pay-in periods than their low risk counterparts.
D.4 Other Relevant Parameters
Inflation
Measures of inflation are relevant to adjusting the engineering cost estimate to a face value of the
FR instrument as of the facility end of life. Engineering costs are inflated forward using median
year of year change of the GDP Implicit Price Deflator from 1966-2016, which is 2.86 percent. 139
Derivation of Default Probabilities
For rated companies, EPA determines the probability of default through S&P Annual Global
Corporate Default and Rating Transitions Studies. These studies provide, for each rating, the
probability that a company holding that rating will default within a given time horizon.
Specifically, EPA uses the three-year probability of default for each rating to determine the
relevant probability of default.140,141 The range of the probabilities of default associated with
various bond ratings is provided in Exhibit D-5.
To estimate the baseline industry failure rate, EPA used the firm exit rate derived from the
Census’ Business Dynamic Statistics (BDS), which is 7.45 percent for the latest three years in
the dataset. Under Option 2, the facilities at risk of default are facilities with parent companies
that pass the financial test and choose to self-insure. As a result, EPA estimated the industry
139 Source: US. Bureau of Economic Analysis, Gross Domestic Product: Implicit Price Deflator [GDPDEF],
retrieved from FRED, Federal Reserve Bank of St. Louis https://research.stlouisfed.org/fred2/series/GDPDEF 140 Standard & Poor’s Ratings Services, 2014 Annual Global Corporate Default Study And Rating Transitions, April
30, 2015, available online at: https://www.nact.org/resources/2014_SP_Global_Corporate_Default_Study.pdf. 141 One company in the modeled universe is unrated. For this firm, EPA calculates the probability of default as
follows: first, EPA applies the Altman Z-score formula to the company’s financials to derive its Altman Z-score.
Each credit rating corresponds to a range of Altman Z-scores; therefore, EPA uses the calculated Altman Z-score for
unrated company to determine the appropriate corresponding credit rating. Then, EPA uses the appropriate three-
year probability of default for that credit rating as the company’s probability of default. Altman, Edward I. “An
emerging market credit scoring system for corporate bonds,” Emerging Markets Review, Vol. 6, 2005, p. 313. See p.
314 for the calibration of Altman Z-scores with S&P credit ratings.
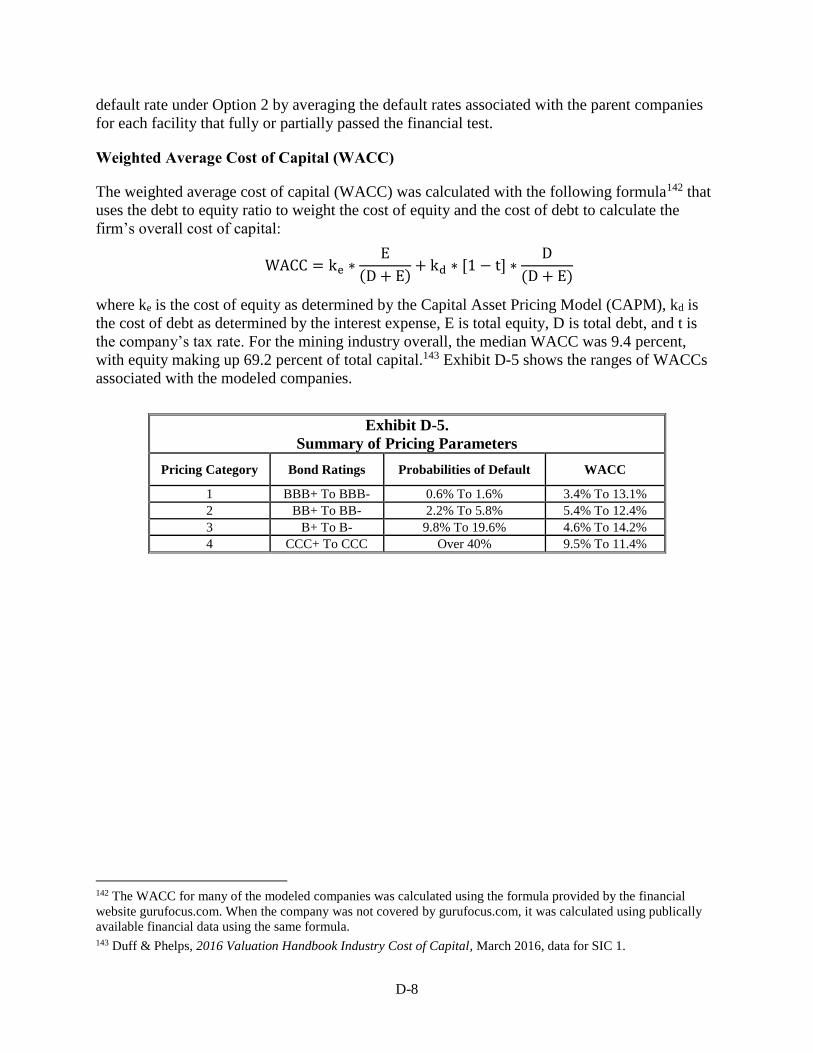
D-8
default rate under Option 2 by averaging the default rates associated with the parent companies
for each facility that fully or partially passed the financial test.
Weighted Average Cost of Capital (WACC)
The weighted average cost of capital (WACC) was calculated with the following formula142 that
uses the debt to equity ratio to weight the cost of equity and the cost of debt to calculate the
firm’s overall cost of capital:
WACC = ke ∗E
(D + E)+ kd ∗ [1 − t] ∗
D
(D + E)
where ke is the cost of equity as determined by the Capital Asset Pricing Model (CAPM), kd is
the cost of debt as determined by the interest expense, E is total equity, D is total debt, and t is
the company’s tax rate. For the mining industry overall, the median WACC was 9.4 percent,
with equity making up 69.2 percent of total capital.143 Exhibit D-5 shows the ranges of WACCs
associated with the modeled companies.
Exhibit D-5.
Summary of Pricing Parameters
Pricing Category Bond Ratings Probabilities of Default WACC
1 BBB+ To BBB- 0.6% To 1.6% 3.4% To 13.1%
2 BB+ To BB- 2.2% To 5.8% 5.4% To 12.4%
3 B+ To B- 9.8% To 19.6% 4.6% To 14.2%
4 CCC+ To CCC Over 40% 9.5% To 11.4%
142 The WACC for many of the modeled companies was calculated using the formula provided by the financial
website gurufocus.com. When the company was not covered by gurufocus.com, it was calculated using publically
available financial data using the same formula. 143 Duff & Phelps, 2016 Valuation Handbook Industry Cost of Capital, March 2016, data for SIC 1.
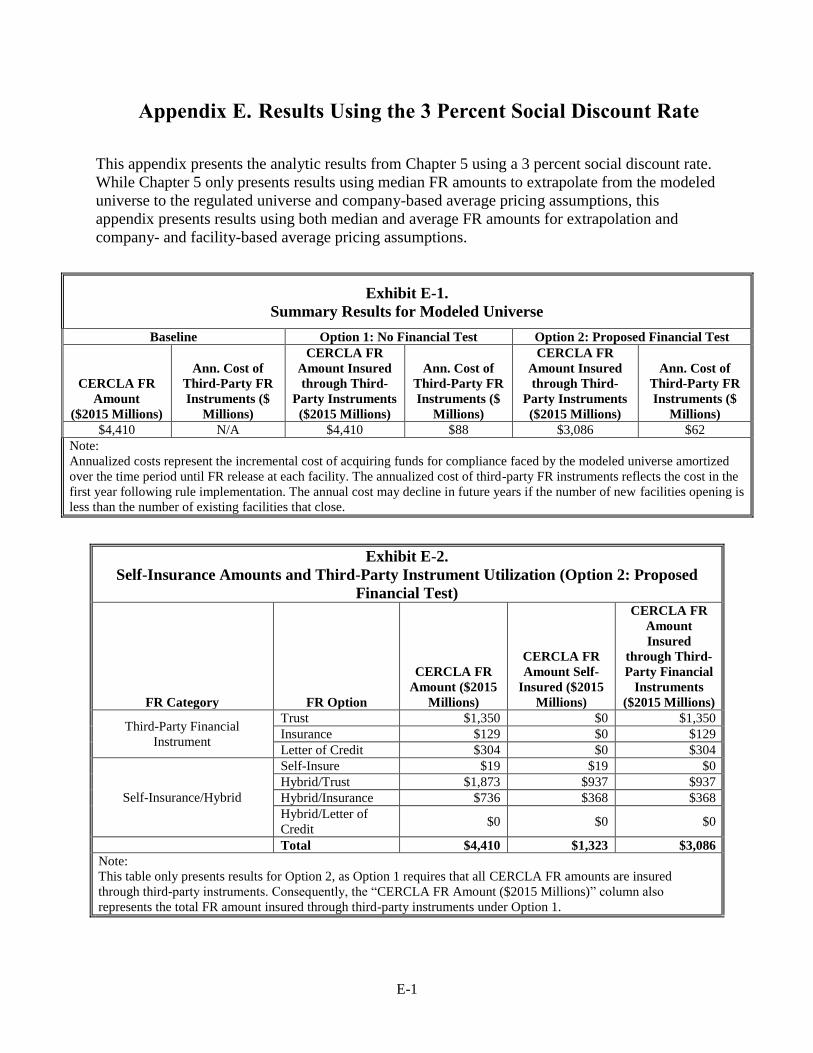
E-1
Appendix E. Results Using the 3 Percent Social Discount Rate
This appendix presents the analytic results from Chapter 5 using a 3 percent social discount rate.
While Chapter 5 only presents results using median FR amounts to extrapolate from the modeled
universe to the regulated universe and company-based average pricing assumptions, this
appendix presents results using both median and average FR amounts for extrapolation and
company- and facility-based average pricing assumptions.
Exhibit E-1.
Summary Results for Modeled Universe
Baseline Option 1: No Financial Test Option 2: Proposed Financial Test
CERCLA FR
Amount
($2015 Millions)
Ann. Cost of
Third-Party FR
Instruments ($
Millions)
CERCLA FR
Amount Insured
through Third-
Party Instruments
($2015 Millions)
Ann. Cost of
Third-Party FR
Instruments ($
Millions)
CERCLA FR
Amount Insured
through Third-
Party Instruments
($2015 Millions)
Ann. Cost of
Third-Party FR
Instruments ($
Millions)
$4,410 N/A $4,410 $88 $3,086 $62
Note:
Annualized costs represent the incremental cost of acquiring funds for compliance faced by the modeled universe amortized
over the time period until FR release at each facility. The annualized cost of third-party FR instruments reflects the cost in the
first year following rule implementation. The annual cost may decline in future years if the number of new facilities opening is
less than the number of existing facilities that close.
Exhibit E-2.
Self-Insurance Amounts and Third-Party Instrument Utilization (Option 2: Proposed
Financial Test)
FR Category FR Option
CERCLA FR
Amount ($2015
Millions)
CERCLA FR
Amount Self-
Insured ($2015
Millions)
CERCLA FR
Amount
Insured
through Third-
Party Financial
Instruments
($2015 Millions)
Third-Party Financial
Instrument
Trust $1,350 $0 $1,350
Insurance $129 $0 $129
Letter of Credit $304 $0 $304
Self-Insurance/Hybrid
Self-Insure $19 $19 $0
Hybrid/Trust $1,873 $937 $937
Hybrid/Insurance $736 $368 $368
Hybrid/Letter of
Credit $0 $0 $0
Total $4,410 $1,323 $3,086
Note:
This table only presents results for Option 2, as Option 1 requires that all CERCLA FR amounts are insured
through third-party instruments. Consequently, the “CERCLA FR Amount ($2015 Millions)” column also
represents the total FR amount insured through third-party instruments under Option 1.
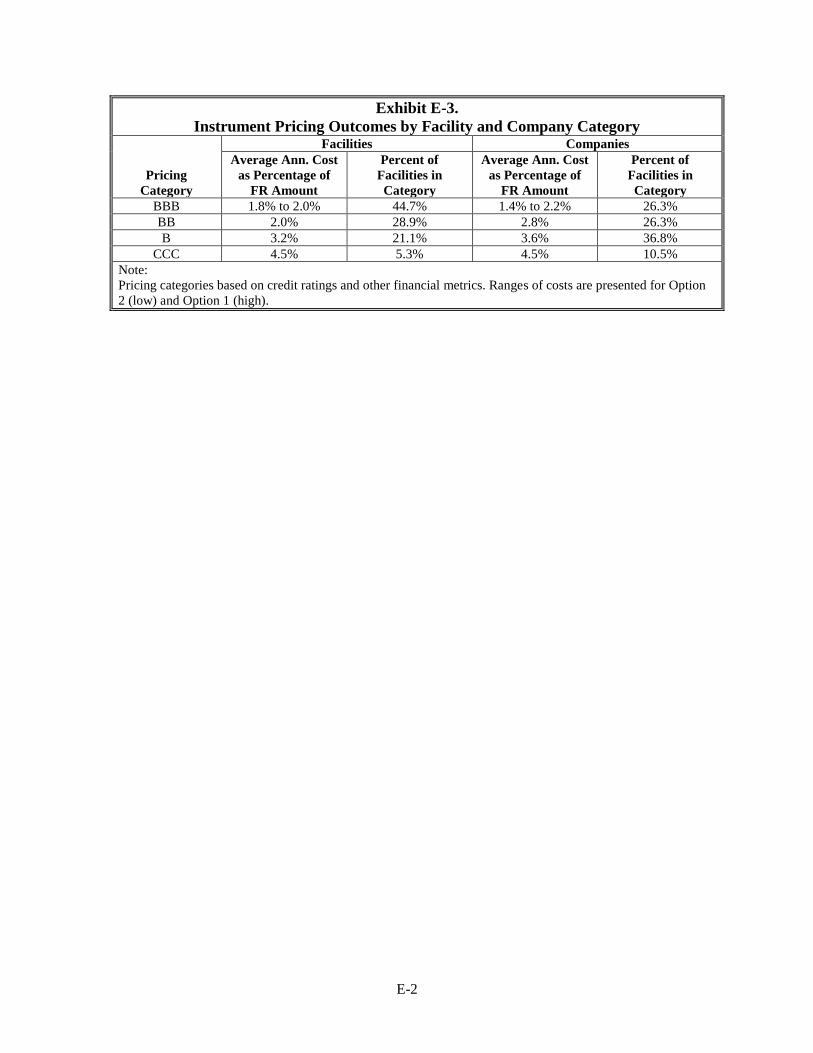
E-2
Exhibit E-3.
Instrument Pricing Outcomes by Facility and Company Category
Pricing
Category
Facilities Companies
Average Ann. Cost
as Percentage of
FR Amount
Percent of
Facilities in
Category
Average Ann. Cost
as Percentage of
FR Amount
Percent of
Facilities in
Category
BBB 1.8% to 2.0% 44.7% 1.4% to 2.2% 26.3%
BB 2.0% 28.9% 2.8% 26.3%
B 3.2% 21.1% 3.6% 36.8%
CCC 4.5% 5.3% 4.5% 10.5%
Note:
Pricing categories based on credit ratings and other financial metrics. Ranges of costs are presented for Option
2 (low) and Option 1 (high).
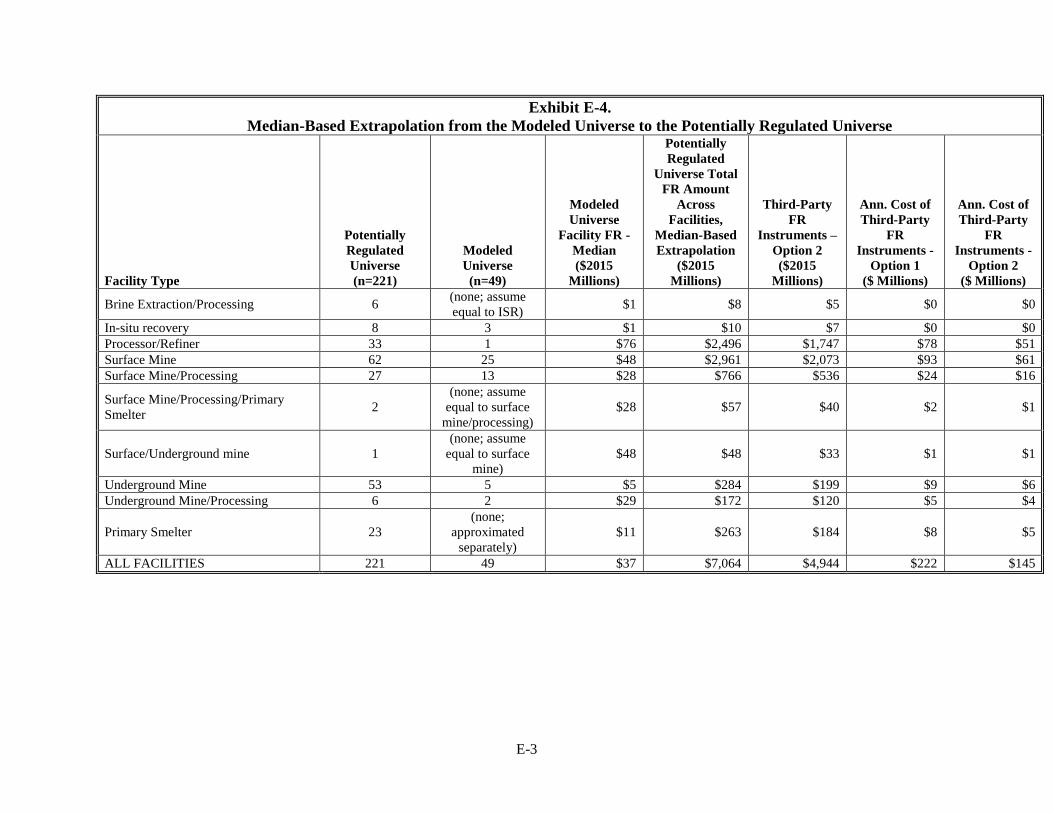
E-3
Exhibit E-4.
Median-Based Extrapolation from the Modeled Universe to the Potentially Regulated Universe
Facility Type
Potentially
Regulated
Universe
(n=221)
Modeled
Universe
(n=49)
Modeled
Universe
Facility FR -
Median
($2015
Millions)
Potentially
Regulated
Universe Total
FR Amount
Across
Facilities,
Median-Based
Extrapolation
($2015
Millions)
Third-Party
FR
Instruments –
Option 2
($2015
Millions)
Ann. Cost of
Third-Party
FR
Instruments -
Option 1
($ Millions)
Ann. Cost of
Third-Party
FR
Instruments -
Option 2
($ Millions)
Brine Extraction/Processing 6 (none; assume
equal to ISR) $1 $8 $5 $0 $0
In-situ recovery 8 3 $1 $10 $7 $0 $0
Processor/Refiner 33 1 $76 $2,496 $1,747 $78 $51
Surface Mine 62 25 $48 $2,961 $2,073 $93 $61
Surface Mine/Processing 27 13 $28 $766 $536 $24 $16
Surface Mine/Processing/Primary
Smelter 2
(none; assume
equal to surface
mine/processing)
$28 $57 $40 $2 $1
Surface/Underground mine 1
(none; assume
equal to surface
mine)
$48 $48 $33 $1 $1
Underground Mine 53 5 $5 $284 $199 $9 $6
Underground Mine/Processing 6 2 $29 $172 $120 $5 $4
Primary Smelter 23
(none;
approximated
separately)
$11 $263 $184 $8 $5
ALL FACILITIES 221 49 $37 $7,064 $4,944 $222 $145
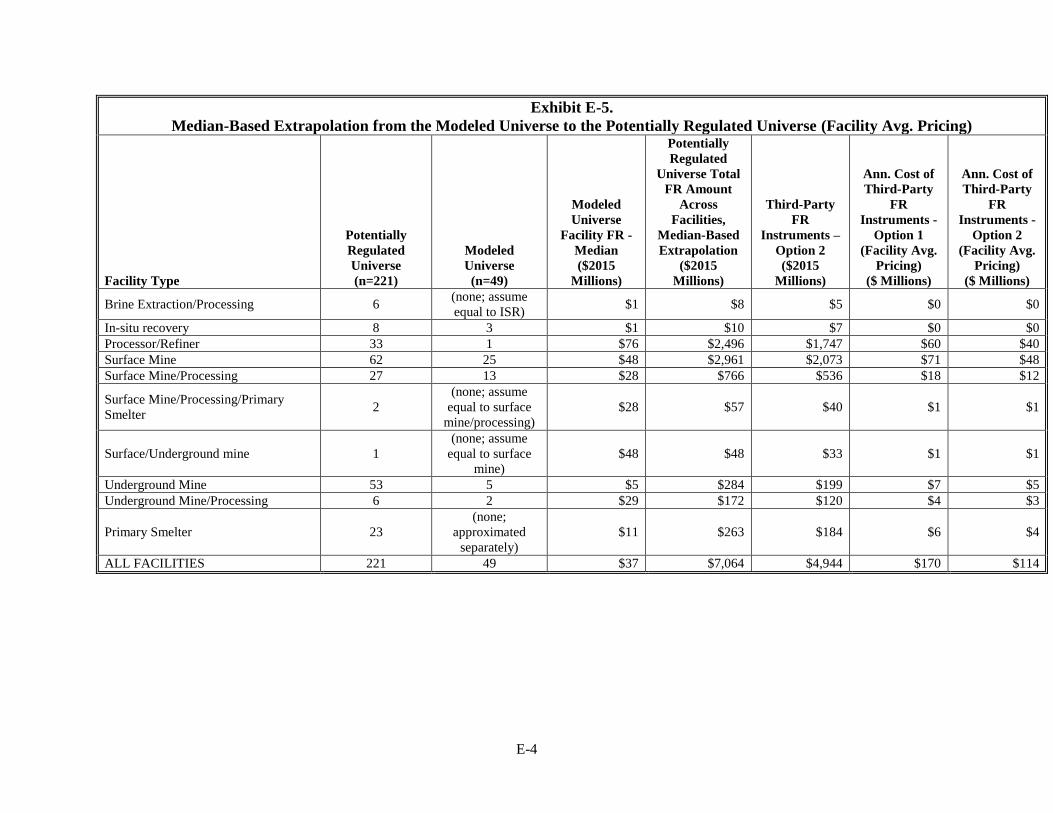
E-4
Exhibit E-5.
Median-Based Extrapolation from the Modeled Universe to the Potentially Regulated Universe (Facility Avg. Pricing)
Facility Type
Potentially
Regulated
Universe
(n=221)
Modeled
Universe
(n=49)
Modeled
Universe
Facility FR -
Median
($2015
Millions)
Potentially
Regulated
Universe Total
FR Amount
Across
Facilities,
Median-Based
Extrapolation
($2015
Millions)
Third-Party
FR
Instruments –
Option 2
($2015
Millions)
Ann. Cost of
Third-Party
FR
Instruments -
Option 1
(Facility Avg.
Pricing)
($ Millions)
Ann. Cost of
Third-Party
FR
Instruments -
Option 2
(Facility Avg.
Pricing)
($ Millions)
Brine Extraction/Processing 6 (none; assume
equal to ISR) $1 $8 $5 $0 $0
In-situ recovery 8 3 $1 $10 $7 $0 $0
Processor/Refiner 33 1 $76 $2,496 $1,747 $60 $40
Surface Mine 62 25 $48 $2,961 $2,073 $71 $48
Surface Mine/Processing 27 13 $28 $766 $536 $18 $12
Surface Mine/Processing/Primary
Smelter 2
(none; assume
equal to surface
mine/processing)
$28 $57 $40 $1 $1
Surface/Underground mine 1
(none; assume
equal to surface
mine)
$48 $48 $33 $1 $1
Underground Mine 53 5 $5 $284 $199 $7 $5
Underground Mine/Processing 6 2 $29 $172 $120 $4 $3
Primary Smelter 23
(none;
approximated
separately)
$11 $263 $184 $6 $4
ALL FACILITIES 221 49 $37 $7,064 $4,944 $170 $114
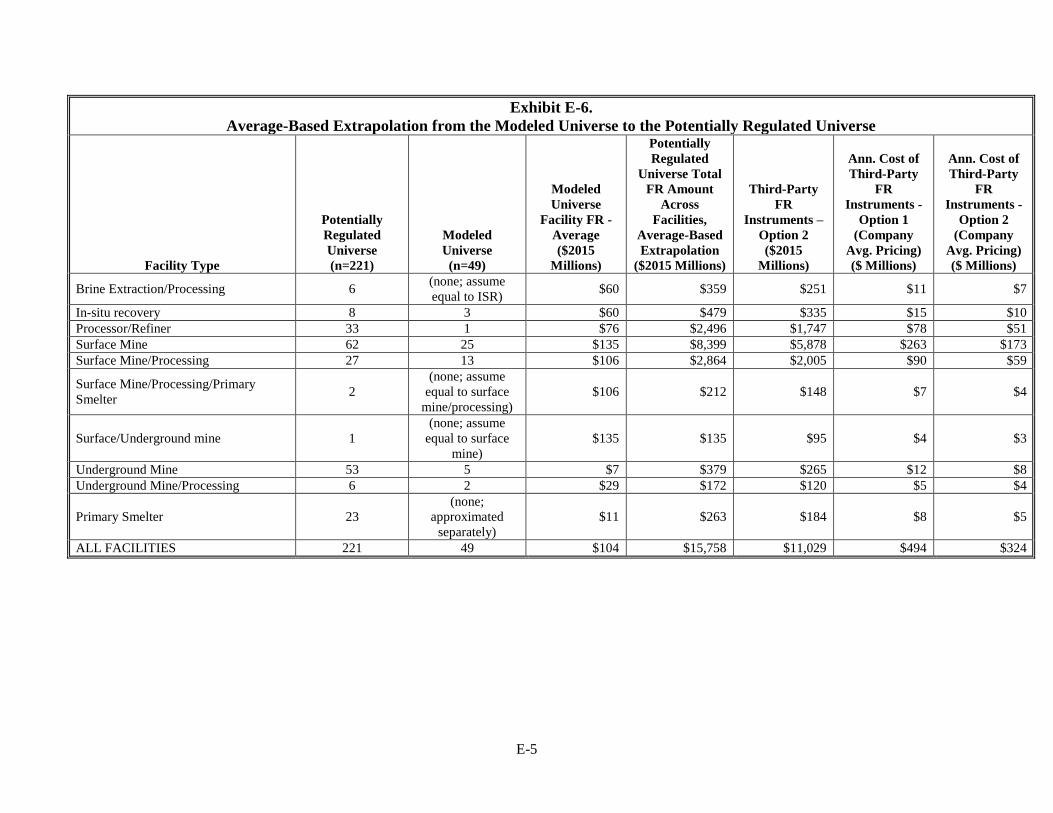
E-5
Exhibit E-6.
Average-Based Extrapolation from the Modeled Universe to the Potentially Regulated Universe
Facility Type
Potentially
Regulated
Universe
(n=221)
Modeled
Universe
(n=49)
Modeled
Universe
Facility FR -
Average
($2015
Millions)
Potentially
Regulated
Universe Total
FR Amount
Across
Facilities,
Average-Based
Extrapolation
($2015 Millions)
Third-Party
FR
Instruments –
Option 2
($2015
Millions)
Ann. Cost of
Third-Party
FR
Instruments -
Option 1
(Company
Avg. Pricing)
($ Millions)
Ann. Cost of
Third-Party
FR
Instruments -
Option 2
(Company
Avg. Pricing)
($ Millions)
Brine Extraction/Processing 6 (none; assume
equal to ISR) $60 $359 $251 $11 $7
In-situ recovery 8 3 $60 $479 $335 $15 $10
Processor/Refiner 33 1 $76 $2,496 $1,747 $78 $51
Surface Mine 62 25 $135 $8,399 $5,878 $263 $173
Surface Mine/Processing 27 13 $106 $2,864 $2,005 $90 $59
Surface Mine/Processing/Primary
Smelter 2
(none; assume
equal to surface
mine/processing)
$106 $212 $148 $7 $4
Surface/Underground mine 1
(none; assume
equal to surface
mine)
$135 $135 $95 $4 $3
Underground Mine 53 5 $7 $379 $265 $12 $8
Underground Mine/Processing 6 2 $29 $172 $120 $5 $4
Primary Smelter 23
(none;
approximated
separately)
$11 $263 $184 $8 $5
ALL FACILITIES 221 49 $104 $15,758 $11,029 $494 $324
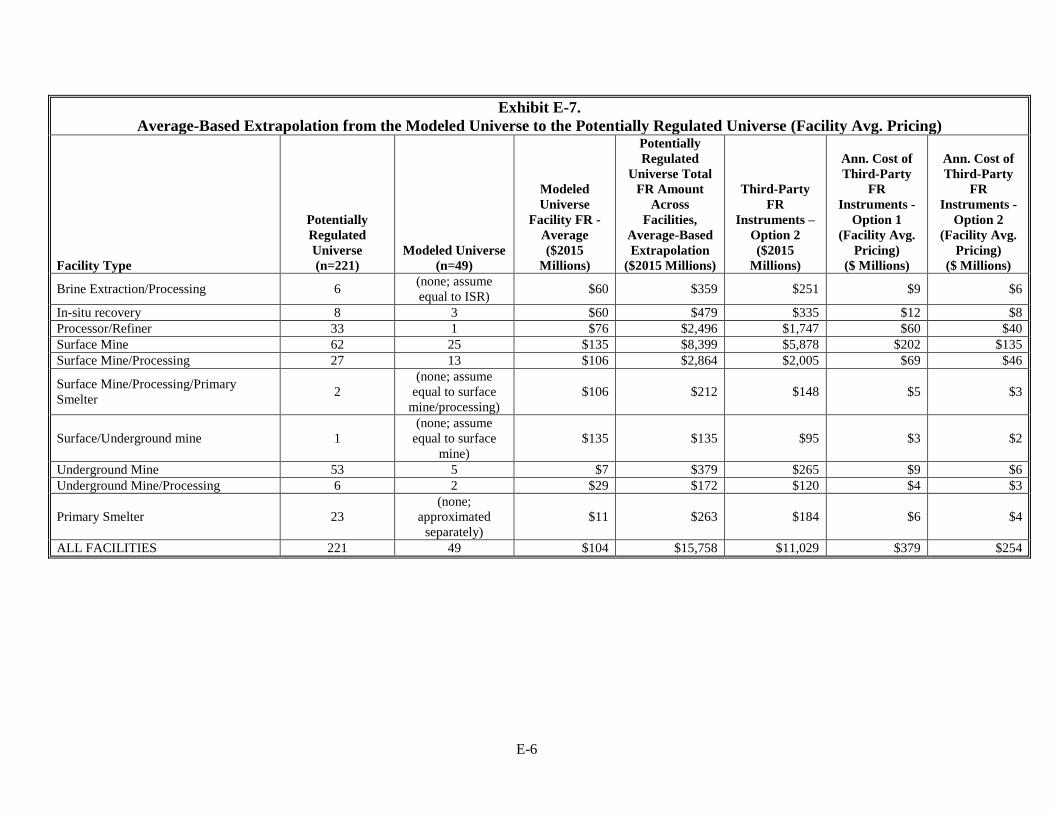
E-6
Exhibit E-7.
Average-Based Extrapolation from the Modeled Universe to the Potentially Regulated Universe (Facility Avg. Pricing)
Facility Type
Potentially
Regulated
Universe
(n=221)
Modeled Universe
(n=49)
Modeled
Universe
Facility FR -
Average
($2015
Millions)
Potentially
Regulated
Universe Total
FR Amount
Across
Facilities,
Average-Based
Extrapolation
($2015 Millions)
Third-Party
FR
Instruments –
Option 2
($2015
Millions)
Ann. Cost of
Third-Party
FR
Instruments -
Option 1
(Facility Avg.
Pricing)
($ Millions)
Ann. Cost of
Third-Party
FR
Instruments -
Option 2
(Facility Avg.
Pricing)
($ Millions)
Brine Extraction/Processing 6 (none; assume
equal to ISR) $60 $359 $251 $9 $6
In-situ recovery 8 3 $60 $479 $335 $12 $8
Processor/Refiner 33 1 $76 $2,496 $1,747 $60 $40
Surface Mine 62 25 $135 $8,399 $5,878 $202 $135
Surface Mine/Processing 27 13 $106 $2,864 $2,005 $69 $46
Surface Mine/Processing/Primary
Smelter 2
(none; assume
equal to surface
mine/processing)
$106 $212 $148 $5 $3
Surface/Underground mine 1
(none; assume
equal to surface
mine)
$135 $135 $95 $3 $2
Underground Mine 53 5 $7 $379 $265 $9 $6
Underground Mine/Processing 6 2 $29 $172 $120 $4 $3
Primary Smelter 23
(none;
approximated
separately)
$11 $263 $184 $6 $4
ALL FACILITIES 221 49 $104 $15,758 $11,029 $379 $254
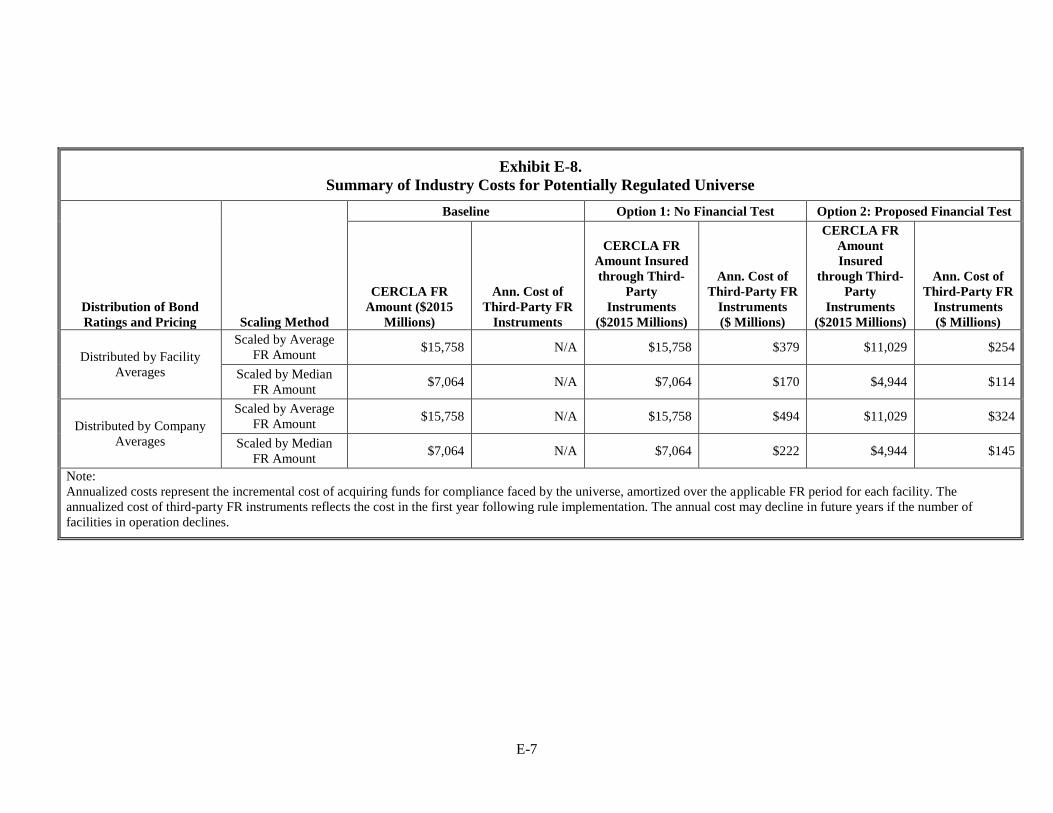
E-7
Exhibit E-8.
Summary of Industry Costs for Potentially Regulated Universe
Distribution of Bond
Ratings and Pricing Scaling Method
Baseline Option 1: No Financial Test Option 2: Proposed Financial Test
CERCLA FR
Amount ($2015
Millions)
Ann. Cost of
Third-Party FR
Instruments
CERCLA FR
Amount Insured
through Third-
Party
Instruments
($2015 Millions)
Ann. Cost of
Third-Party FR
Instruments
($ Millions)
CERCLA FR
Amount
Insured
through Third-
Party
Instruments
($2015 Millions)
Ann. Cost of
Third-Party FR
Instruments
($ Millions)
Distributed by Facility
Averages
Scaled by Average
FR Amount $15,758 N/A $15,758 $379 $11,029 $254
Scaled by Median
FR Amount $7,064 N/A $7,064 $170 $4,944 $114
Distributed by Company
Averages
Scaled by Average
FR Amount $15,758 N/A $15,758 $494 $11,029 $324
Scaled by Median
FR Amount $7,064 N/A $7,064 $222 $4,944 $145
Note:
Annualized costs represent the incremental cost of acquiring funds for compliance faced by the universe, amortized over the applicable FR period for each facility. The
annualized cost of third-party FR instruments reflects the cost in the first year following rule implementation. The annual cost may decline in future years if the number of
facilities in operation declines.
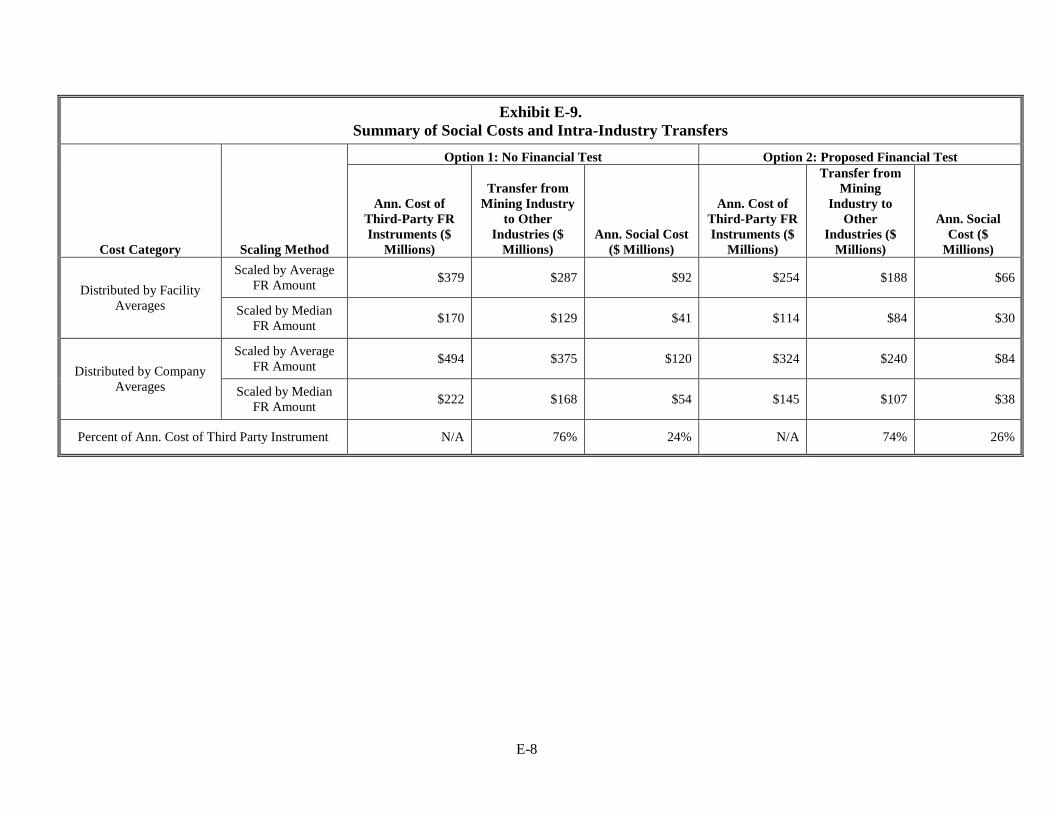
E-8
Exhibit E-9.
Summary of Social Costs and Intra-Industry Transfers
Cost Category Scaling Method
Option 1: No Financial Test Option 2: Proposed Financial Test
Ann. Cost of
Third-Party FR
Instruments ($
Millions)
Transfer from
Mining Industry
to Other
Industries ($
Millions)
Ann. Social Cost
($ Millions)
Ann. Cost of
Third-Party FR
Instruments ($
Millions)
Transfer from
Mining
Industry to
Other
Industries ($
Millions)
Ann. Social
Cost ($
Millions)
Distributed by Facility
Averages
Scaled by Average
FR Amount $379 $287 $92 $254 $188 $66
Scaled by Median
FR Amount $170 $129 $41 $114 $84 $30
Distributed by Company
Averages
Scaled by Average
FR Amount $494 $375 $120 $324 $240 $84
Scaled by Median
FR Amount $222 $168 $54 $145 $107 $38
Percent of Ann. Cost of Third Party Instrument N/A 76% 24% N/A 74% 26%

E-9
Exhibit E-10.
Annualized Administrative Costs
Option 1 (No Test) Option 2 (Financial Test)
$259,425 $289,155
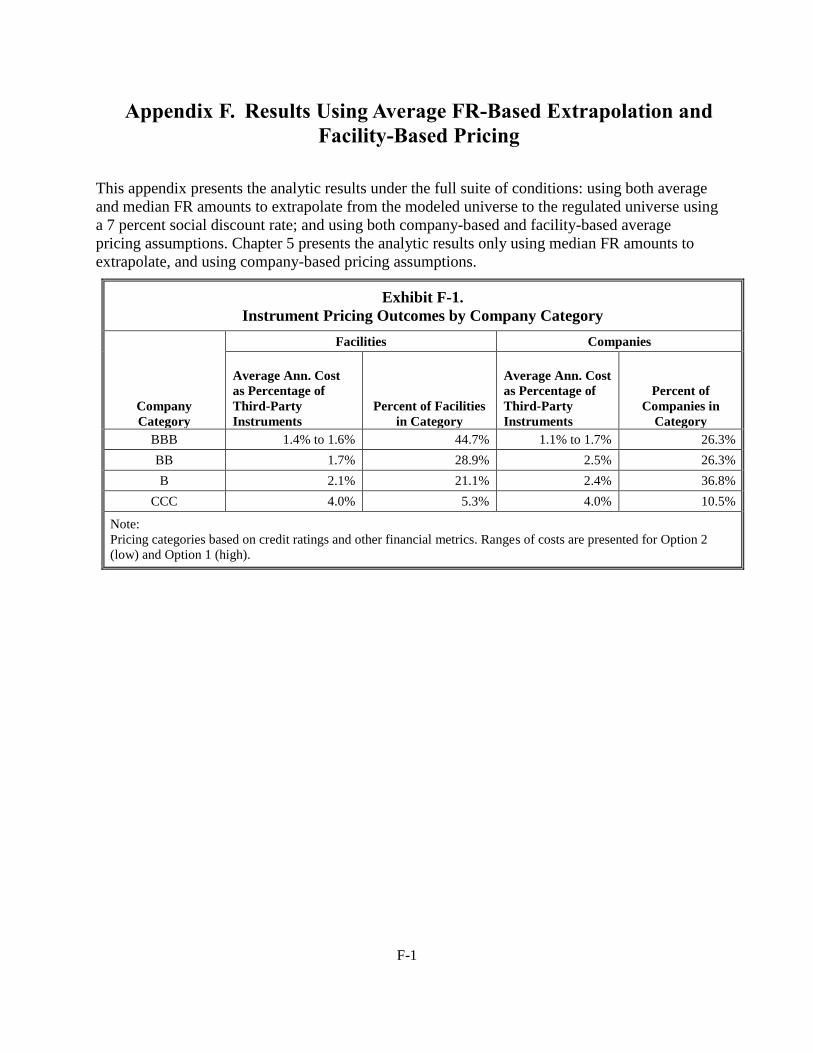
F-1
Appendix F. Results Using Average FR-Based Extrapolation and
Facility-Based Pricing
This appendix presents the analytic results under the full suite of conditions: using both average
and median FR amounts to extrapolate from the modeled universe to the regulated universe using
a 7 percent social discount rate; and using both company-based and facility-based average
pricing assumptions. Chapter 5 presents the analytic results only using median FR amounts to
extrapolate, and using company-based pricing assumptions.
Exhibit F-1.
Instrument Pricing Outcomes by Company Category
Company
Category
Facilities Companies
Average Ann. Cost
as Percentage of
Third-Party
Instruments
Percent of Facilities
in Category
Average Ann. Cost
as Percentage of
Third-Party
Instruments
Percent of
Companies in
Category
BBB 1.4% to 1.6% 44.7% 1.1% to 1.7% 26.3%
BB 1.7% 28.9% 2.5% 26.3%
B 2.1% 21.1% 2.4% 36.8%
CCC 4.0% 5.3% 4.0% 10.5%
Note:
Pricing categories based on credit ratings and other financial metrics. Ranges of costs are presented for Option 2
(low) and Option 1 (high).
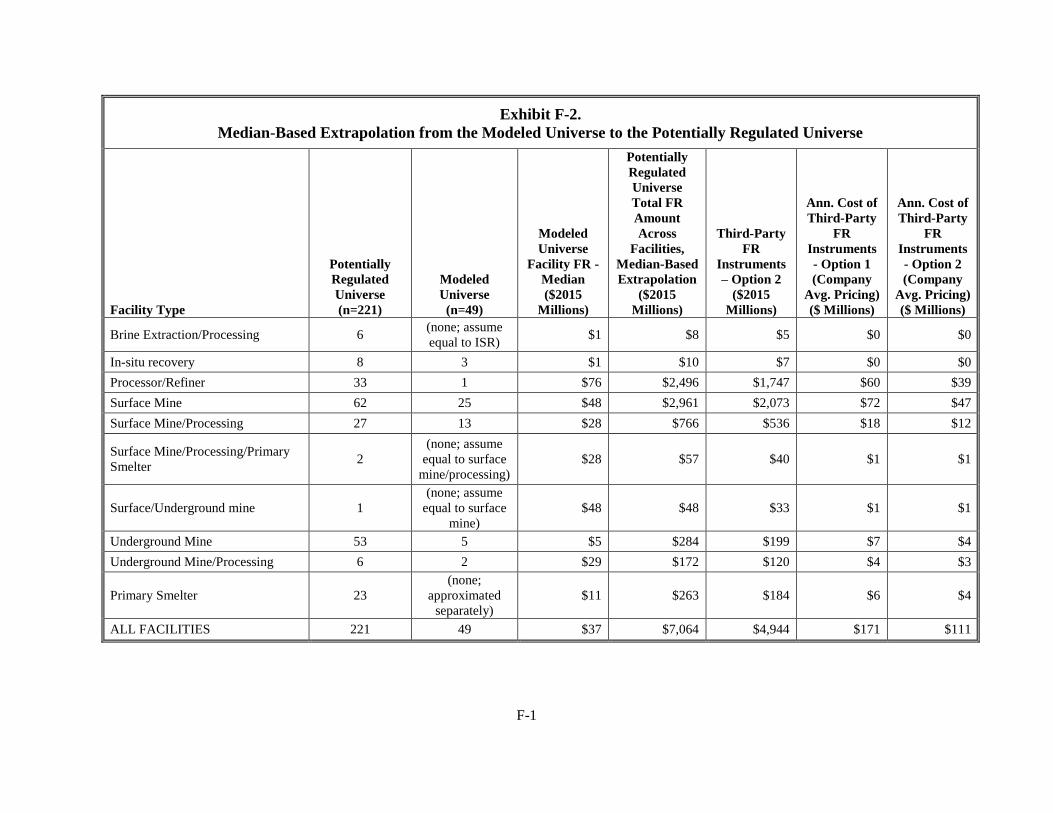
F-1
Exhibit F-2.
Median-Based Extrapolation from the Modeled Universe to the Potentially Regulated Universe
Facility Type
Potentially
Regulated
Universe
(n=221)
Modeled
Universe
(n=49)
Modeled
Universe
Facility FR -
Median
($2015
Millions)
Potentially
Regulated
Universe
Total FR
Amount
Across
Facilities,
Median-Based
Extrapolation
($2015
Millions)
Third-Party
FR
Instruments
– Option 2
($2015
Millions)
Ann. Cost of
Third-Party
FR
Instruments
- Option 1
(Company
Avg. Pricing)
($ Millions)
Ann. Cost of
Third-Party
FR
Instruments
- Option 2
(Company
Avg. Pricing)
($ Millions)
Brine Extraction/Processing 6 (none; assume
equal to ISR) $1 $8 $5 $0 $0
In-situ recovery 8 3 $1 $10 $7 $0 $0
Processor/Refiner 33 1 $76 $2,496 $1,747 $60 $39
Surface Mine 62 25 $48 $2,961 $2,073 $72 $47
Surface Mine/Processing 27 13 $28 $766 $536 $18 $12
Surface Mine/Processing/Primary
Smelter 2
(none; assume
equal to surface
mine/processing)
$28 $57 $40 $1 $1
Surface/Underground mine 1
(none; assume
equal to surface
mine)
$48 $48 $33 $1 $1
Underground Mine 53 5 $5 $284 $199 $7 $4
Underground Mine/Processing 6 2 $29 $172 $120 $4 $3
Primary Smelter 23
(none;
approximated
separately)
$11 $263 $184 $6 $4
ALL FACILITIES 221 49 $37 $7,064 $4,944 $171 $111

F-2
Exhibit F-3.
Median-Based Extrapolation from the Modeled Universe to the Potentially Regulated Universe
Facility Type
Potentially
Regulated
Universe
(n=221)
Modeled
Universe
(n=49)
Modeled
Universe
Facility FR -
Median
($2015
Millions)
Potentially
Regulated
Universe
Total FR
Amount
Across
Facilities,
Median-
Based
Extrapolation
($2015
Millions)
Third-Party
FR
Instruments
– Option 2
($2015
Millions)
Ann. Cost of
Third-Party
FR
Instruments
- Option 1
(Facility
Avg.
Pricing)
($ Millions)
Ann. Cost of
Third-Party
FR
Instruments
- Option 2
(Facility
Avg.
Pricing)
($ Millions)
Brine Extraction/Processing 6 (none; assume
equal to ISR) $1 $8 $5 $0 $0
In-situ recovery 8 3 $1 $10 $7 $0 $0
Processor/Refiner 33 1 $76 $2,496 $1,747 $46 $31
Surface Mine 62 25 $48 $2,961 $2,073 $55 $37
Surface Mine/Processing 27 13 $28 $766 $536 $14 $9
Surface Mine/Processing/Primary
Smelter 2
(none; assume
equal to surface
mine/processing)
$28 $57 $40 $1 $1
Surface/Underground mine 1
(none; assume
equal to surface
mine)
$48 $48 $33 $1 $1
Underground Mine 53 5 $5 $284 $199 $5 $4
Underground Mine/Processing 6 2 $29 $172 $120 $3 $2
Primary Smelter 23
(none;
approximated
separately)
$11 $263 $184 $5 $3
ALL FACILITIES 221 49 $37 $7,064 $4,944 $131 $88
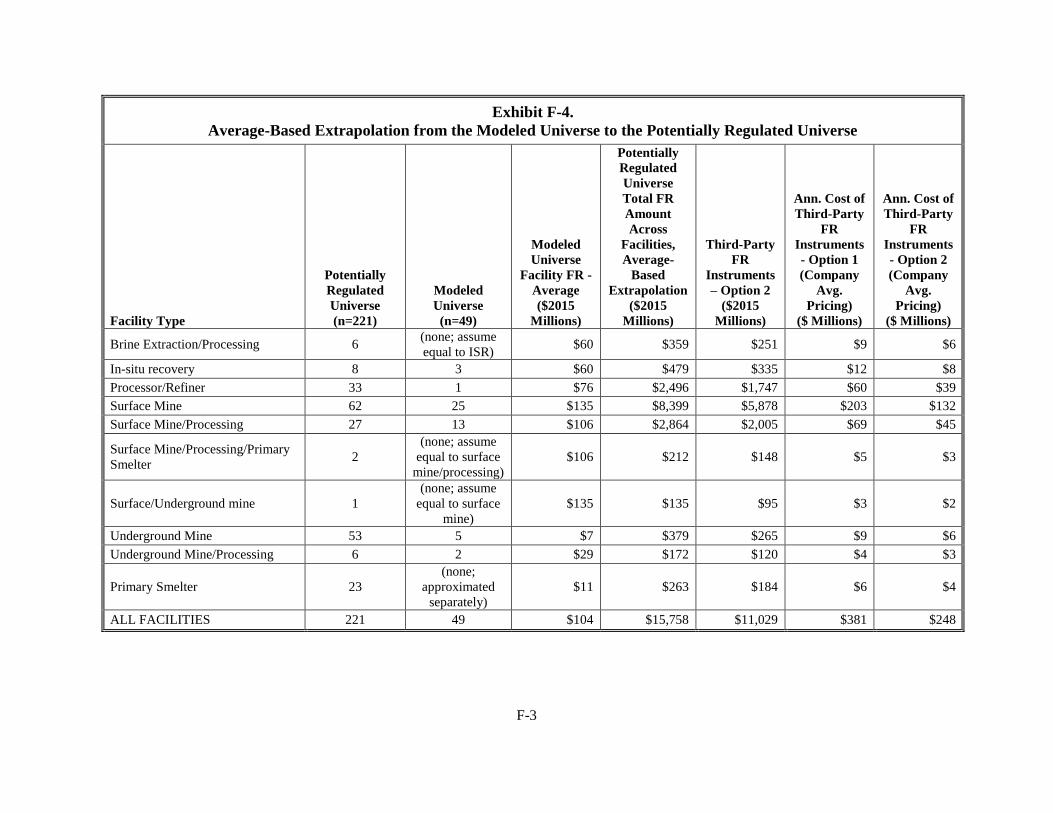
F-3
Exhibit F-4.
Average-Based Extrapolation from the Modeled Universe to the Potentially Regulated Universe
Facility Type
Potentially
Regulated
Universe
(n=221)
Modeled
Universe
(n=49)
Modeled
Universe
Facility FR -
Average
($2015
Millions)
Potentially
Regulated
Universe
Total FR
Amount
Across
Facilities,
Average-
Based
Extrapolation
($2015
Millions)
Third-Party
FR
Instruments
– Option 2
($2015
Millions)
Ann. Cost of
Third-Party
FR
Instruments
- Option 1
(Company
Avg.
Pricing)
($ Millions)
Ann. Cost of
Third-Party
FR
Instruments
- Option 2
(Company
Avg.
Pricing)
($ Millions)
Brine Extraction/Processing 6 (none; assume
equal to ISR) $60 $359 $251 $9 $6
In-situ recovery 8 3 $60 $479 $335 $12 $8
Processor/Refiner 33 1 $76 $2,496 $1,747 $60 $39
Surface Mine 62 25 $135 $8,399 $5,878 $203 $132
Surface Mine/Processing 27 13 $106 $2,864 $2,005 $69 $45
Surface Mine/Processing/Primary
Smelter 2
(none; assume
equal to surface
mine/processing)
$106 $212 $148 $5 $3
Surface/Underground mine 1
(none; assume
equal to surface
mine)
$135 $135 $95 $3 $2
Underground Mine 53 5 $7 $379 $265 $9 $6
Underground Mine/Processing 6 2 $29 $172 $120 $4 $3
Primary Smelter 23
(none;
approximated
separately)
$11 $263 $184 $6 $4
ALL FACILITIES 221 49 $104 $15,758 $11,029 $381 $248
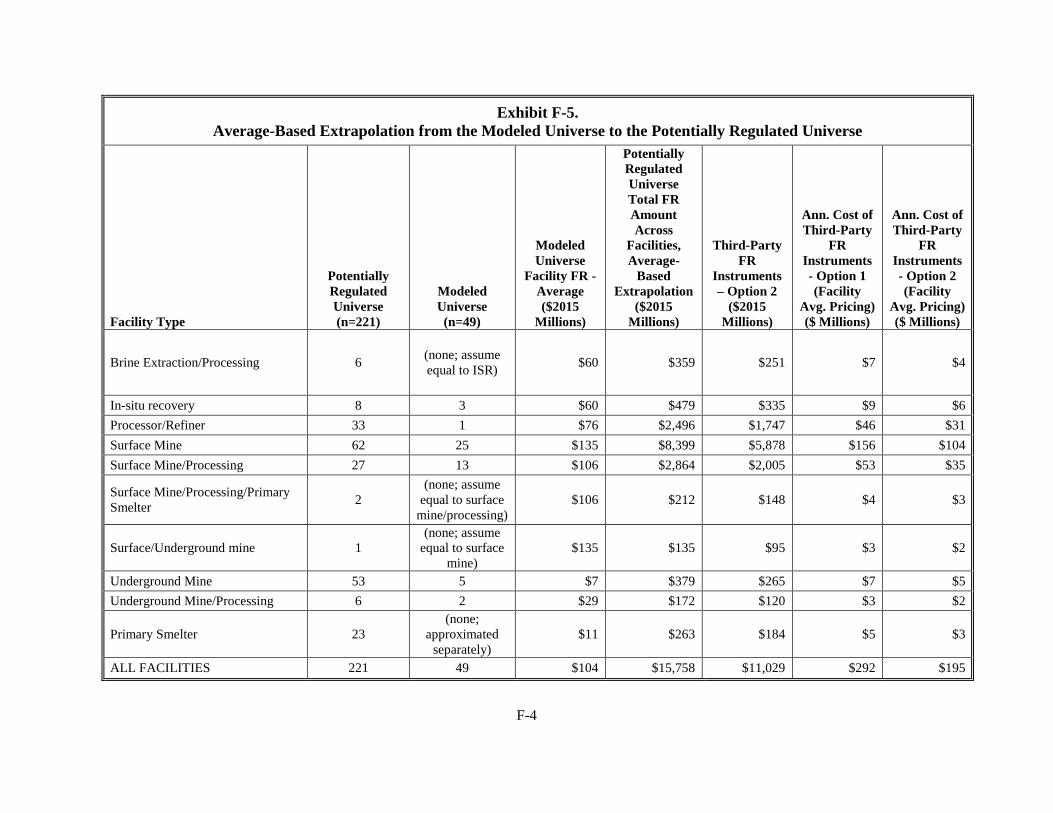
F-4
Exhibit F-5.
Average-Based Extrapolation from the Modeled Universe to the Potentially Regulated Universe
Facility Type
Potentially
Regulated
Universe
(n=221)
Modeled
Universe
(n=49)
Modeled
Universe
Facility FR -
Average
($2015
Millions)
Potentially
Regulated
Universe
Total FR
Amount
Across
Facilities,
Average-
Based
Extrapolation
($2015
Millions)
Third-Party
FR
Instruments
– Option 2
($2015
Millions)
Ann. Cost of
Third-Party
FR
Instruments
- Option 1
(Facility
Avg. Pricing)
($ Millions)
Ann. Cost of
Third-Party
FR
Instruments
- Option 2
(Facility
Avg. Pricing)
($ Millions)
Brine Extraction/Processing 6 (none; assume
equal to ISR) $60 $359 $251 $7 $4
In-situ recovery 8 3 $60 $479 $335 $9 $6
Processor/Refiner 33 1 $76 $2,496 $1,747 $46 $31
Surface Mine 62 25 $135 $8,399 $5,878 $156 $104
Surface Mine/Processing 27 13 $106 $2,864 $2,005 $53 $35
Surface Mine/Processing/Primary
Smelter 2
(none; assume
equal to surface
mine/processing)
$106 $212 $148 $4 $3
Surface/Underground mine 1
(none; assume
equal to surface
mine)
$135 $135 $95 $3 $2
Underground Mine 53 5 $7 $379 $265 $7 $5
Underground Mine/Processing 6 2 $29 $172 $120 $3 $2
Primary Smelter 23
(none;
approximated
separately)
$11 $263 $184 $5 $3
ALL FACILITIES 221 49 $104 $15,758 $11,029 $292 $195
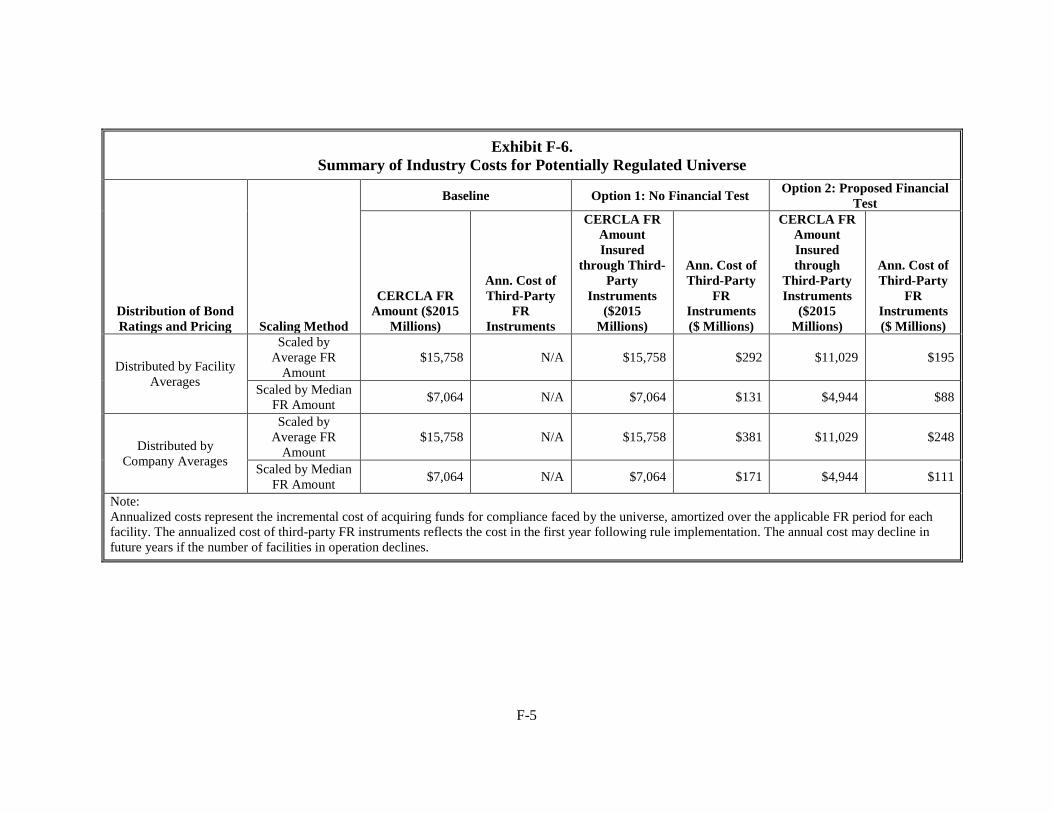
F-5
Exhibit F-6.
Summary of Industry Costs for Potentially Regulated Universe
Distribution of Bond
Ratings and Pricing Scaling Method
Baseline Option 1: No Financial Test Option 2: Proposed Financial
Test
CERCLA FR
Amount ($2015
Millions)
Ann. Cost of
Third-Party
FR
Instruments
CERCLA FR
Amount
Insured
through Third-
Party
Instruments
($2015
Millions)
Ann. Cost of
Third-Party
FR
Instruments
($ Millions)
CERCLA FR
Amount
Insured
through
Third-Party
Instruments
($2015
Millions)
Ann. Cost of
Third-Party
FR
Instruments
($ Millions)
Distributed by Facility
Averages
Scaled by
Average FR
Amount
$15,758 N/A $15,758 $292 $11,029 $195
Scaled by Median
FR Amount $7,064 N/A $7,064 $131 $4,944 $88
Distributed by
Company Averages
Scaled by
Average FR
Amount
$15,758 N/A $15,758 $381 $11,029 $248
Scaled by Median
FR Amount $7,064 N/A $7,064 $171 $4,944 $111
Note:
Annualized costs represent the incremental cost of acquiring funds for compliance faced by the universe, amortized over the applicable FR period for each
facility. The annualized cost of third-party FR instruments reflects the cost in the first year following rule implementation. The annual cost may decline in
future years if the number of facilities in operation declines.
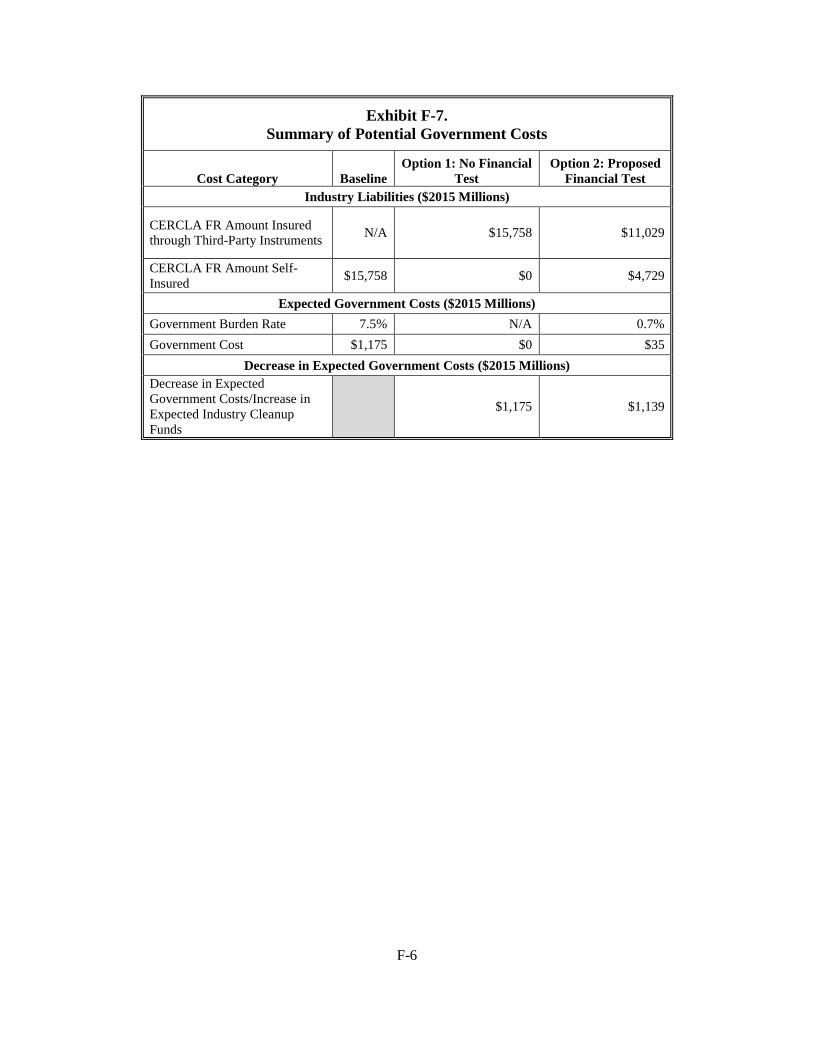
F-6
Exhibit F-7.
Summary of Potential Government Costs
Cost Category Baseline
Option 1: No Financial
Test
Option 2: Proposed
Financial Test
Industry Liabilities ($2015 Millions)
CERCLA FR Amount Insured
through Third-Party Instruments N/A $15,758 $11,029
CERCLA FR Amount Self-
Insured $15,758 $0 $4,729
Expected Government Costs ($2015 Millions)
Government Burden Rate 7.5% N/A 0.7%
Government Cost $1,175 $0 $35
Decrease in Expected Government Costs ($2015 Millions)
Decrease in Expected
Government Costs/Increase in
Expected Industry Cleanup
Funds
$1,175 $1,139
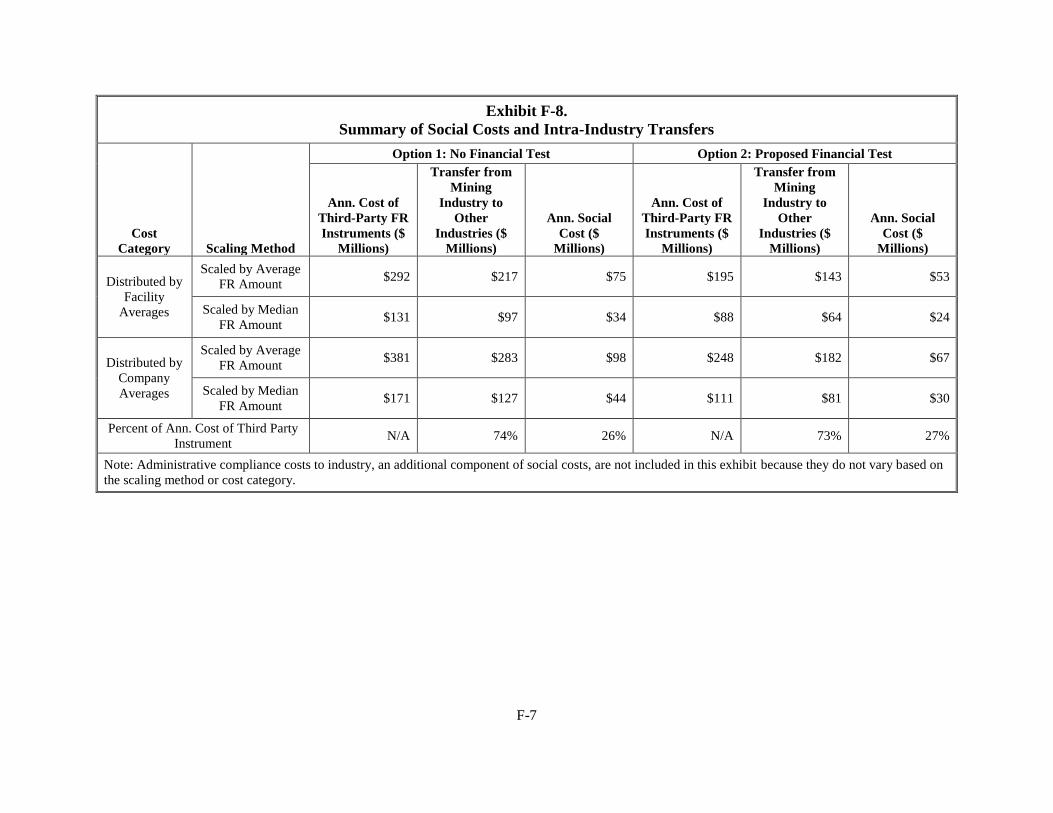
F-7
Exhibit F-8.
Summary of Social Costs and Intra-Industry Transfers
Cost
Category Scaling Method
Option 1: No Financial Test Option 2: Proposed Financial Test
Ann. Cost of
Third-Party FR
Instruments ($
Millions)
Transfer from
Mining
Industry to
Other
Industries ($
Millions)
Ann. Social
Cost ($
Millions)
Ann. Cost of
Third-Party FR
Instruments ($
Millions)
Transfer from
Mining
Industry to
Other
Industries ($
Millions)
Ann. Social
Cost ($
Millions)
Distributed by
Facility
Averages
Scaled by Average
FR Amount $292 $217 $75 $195 $143 $53
Scaled by Median
FR Amount $131 $97 $34 $88 $64 $24
Distributed by
Company
Averages
Scaled by Average
FR Amount $381 $283 $98 $248 $182 $67
Scaled by Median
FR Amount $171 $127 $44 $111 $81 $30
Percent of Ann. Cost of Third Party
Instrument N/A 74% 26% N/A 73% 27%
Note: Administrative compliance costs to industry, an additional component of social costs, are not included in this exhibit because they do not vary based on
the scaling method or cost category.
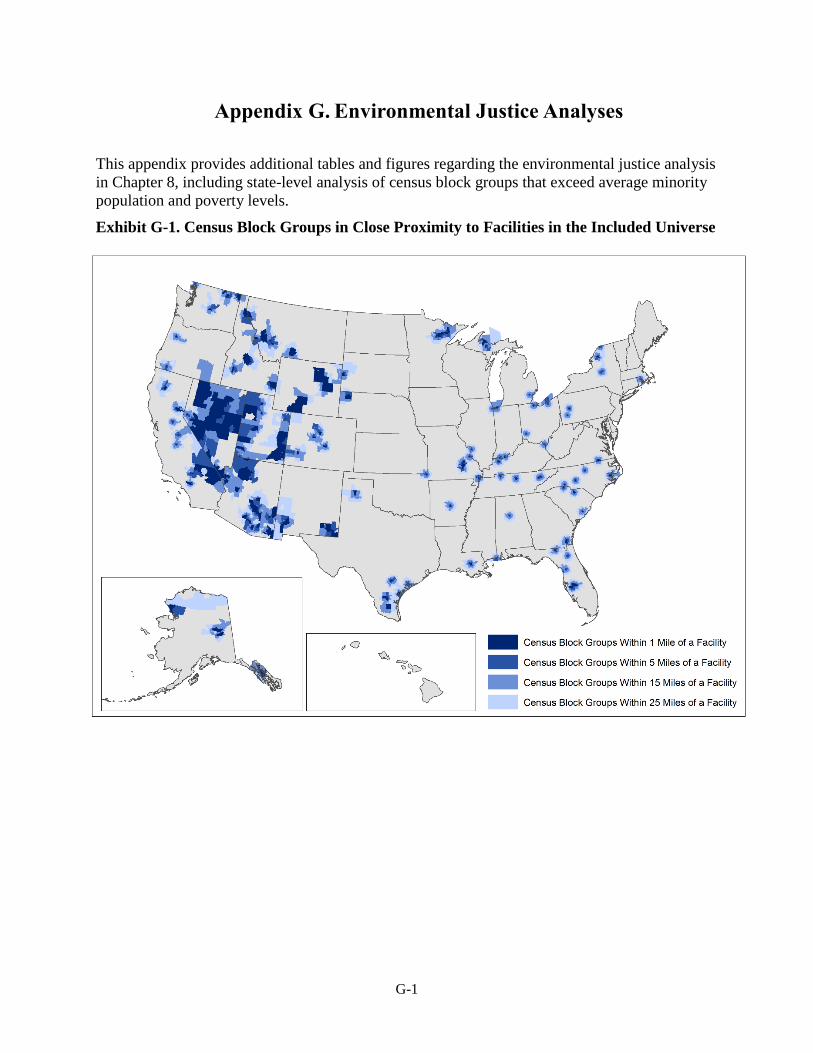
G-1
Appendix G. Environmental Justice Analyses
This appendix provides additional tables and figures regarding the environmental justice analysis
in Chapter 8, including state-level analysis of census block groups that exceed average minority
population and poverty levels.
Exhibit G-1. Census Block Groups in Close Proximity to Facilities in the Included Universe
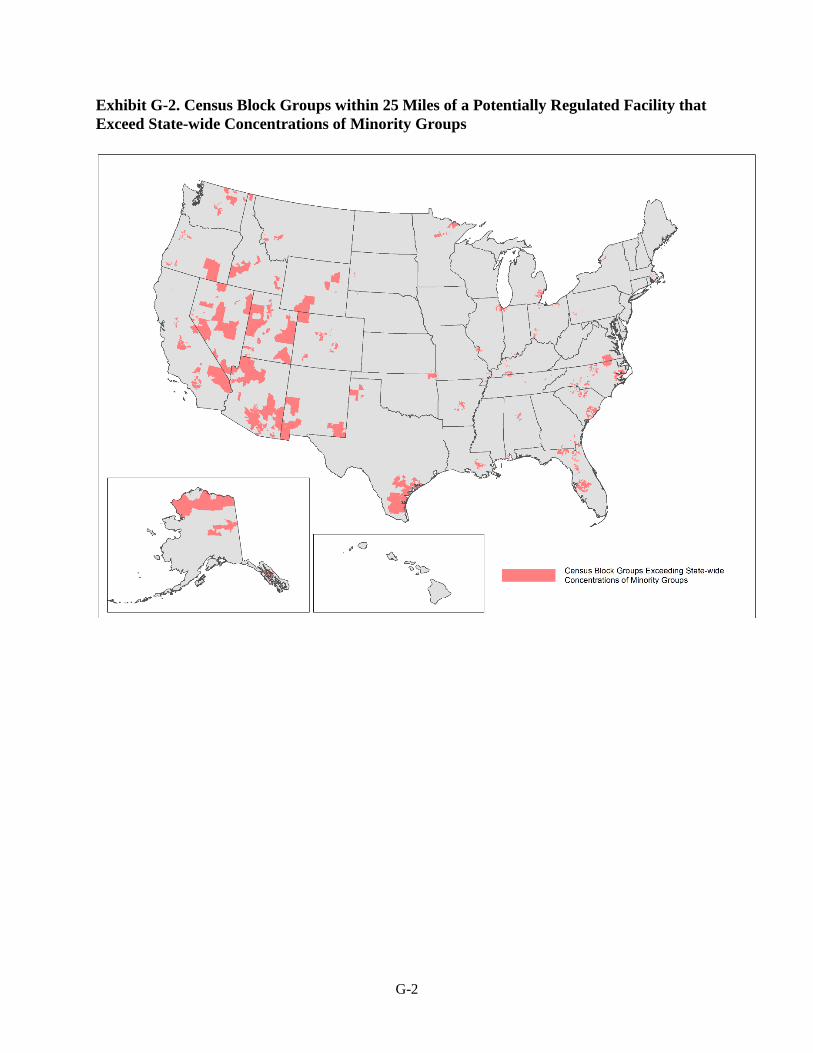
G-2
Exhibit G-2. Census Block Groups within 25 Miles of a Potentially Regulated Facility that
Exceed State-wide Concentrations of Minority Groups
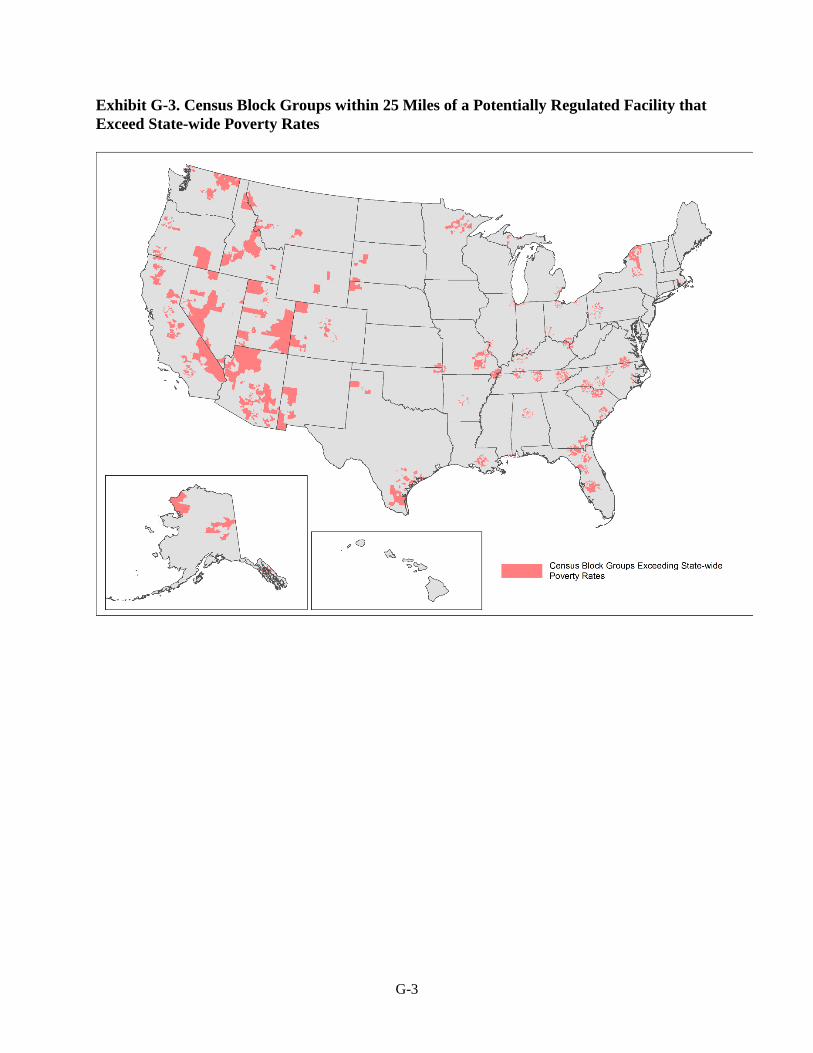
G-3
Exhibit G-3. Census Block Groups within 25 Miles of a Potentially Regulated Facility that
Exceed State-wide Poverty Rates
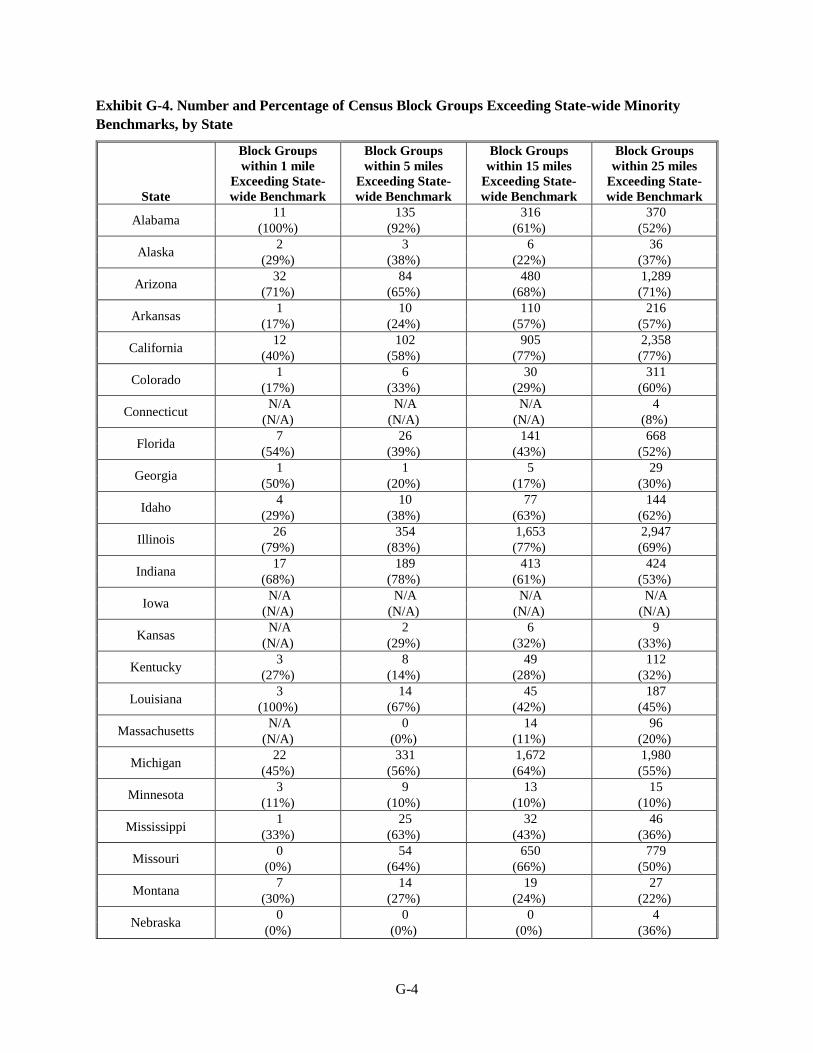
G-4
Exhibit G-4. Number and Percentage of Census Block Groups Exceeding State-wide Minority
Benchmarks, by State
State
Block Groups
within 1 mile
Exceeding State-
wide Benchmark
Block Groups
within 5 miles
Exceeding State-
wide Benchmark
Block Groups
within 15 miles
Exceeding State-
wide Benchmark
Block Groups
within 25 miles
Exceeding State-
wide Benchmark
Alabama 11 135 316 370
(100%) (92%) (61%) (52%)
Alaska 2 3 6 36
(29%) (38%) (22%) (37%)
Arizona 32 84 480 1,289
(71%) (65%) (68%) (71%)
Arkansas 1 10 110 216
(17%) (24%) (57%) (57%)
California 12 102 905 2,358
(40%) (58%) (77%) (77%)
Colorado 1 6 30 311
(17%) (33%) (29%) (60%)
Connecticut N/A N/A N/A 4
(N/A) (N/A) (N/A) (8%)
Florida 7 26 141 668
(54%) (39%) (43%) (52%)
Georgia 1 1 5 29
(50%) (20%) (17%) (30%)
Idaho 4 10 77 144
(29%) (38%) (63%) (62%)
Illinois 26 354 1,653 2,947
(79%) (83%) (77%) (69%)
Indiana 17 189 413 424
(68%) (78%) (61%) (53%)
Iowa N/A N/A N/A N/A
(N/A) (N/A) (N/A) (N/A)
Kansas N/A 2 6 9
(N/A) (29%) (32%) (33%)
Kentucky 3 8 49 112
(27%) (14%) (28%) (32%)
Louisiana 3 14 45 187
(100%) (67%) (42%) (45%)
Massachusetts N/A 0 14 96
(N/A) (0%) (11%) (20%)
Michigan 22 331 1,672 1,980
(45%) (56%) (64%) (55%)
Minnesota 3 9 13 15
(11%) (10%) (10%) (10%)
Mississippi 1 25 32 46
(33%) (63%) (43%) (36%)
Missouri 0 54 650 779
(0%) (64%) (66%) (50%)
Montana 7 14 19 27
(30%) (27%) (24%) (22%)
Nebraska 0 0 0 4
(0%) (0%) (0%) (36%)

G-5
State
Block Groups
within 1 mile
Exceeding State-
wide Benchmark
Block Groups
within 5 miles
Exceeding State-
wide Benchmark
Block Groups
within 15 miles
Exceeding State-
wide Benchmark
Block Groups
within 25 miles
Exceeding State-
wide Benchmark
Nevada 20 31 64 253
(42%) (40%) (31%) (48%)
New Mexico 5 17 52 54
(83%) (89%) (84%) (81%)
New York 15 33 39 48
(37%) (23%) (13%) (11%)
North Carolina 5 30 297 703
(28%) (33%) (44%) (48%)
Ohio 19 391 972 1,784
(51%) (71%) (52%) (47%)
Oklahoma 2 7 25 30
(100%) (88%) (86%) (70%)
Oregon 3 23 116 252
(43%) (47%) (42%) (49%)
Pennsylvania 15 165 424 471
(65%) (53%) (34%) (27%)
Rhode Island 49 251 313 330
(94%) (70%) (47%) (44%)
South Carolina 1 23 167 313
(17%) (35%) (51%) (45%)
South Dakota 0 0 2 4
(0%) (0%) (9%) (10%)
Tennessee 2 34 116 151
(9%) (33%) (29%) (19%)
Texas 7 46 319 531
(78%) (82%) (79%) (79%)
Utah 16 55 546 767
(55%) (58%) (67%) (61%)
Virginia 2 3 19 36
(100%) (100%) (76%) (75%)
Washington 2 7 70 91
(25%) (26%) (40%) (36%)
West Virginia N/A N/A 32 39
(N/A) (N/A) (51%) (36%)
Wisconsin N/A N/A N/A N/A
(N/A) (N/A) (N/A) (N/A)
Wyoming 2 2 4 11
(50%) (50%) (36%) (39%)
Note: “N/A” indicates that no block groups were identified in a state for a given distance criterion. “0” indicates
that block groups were identified in a state for a given distance criterion, though none of the block groups
exceeded the state-wide benchmark.
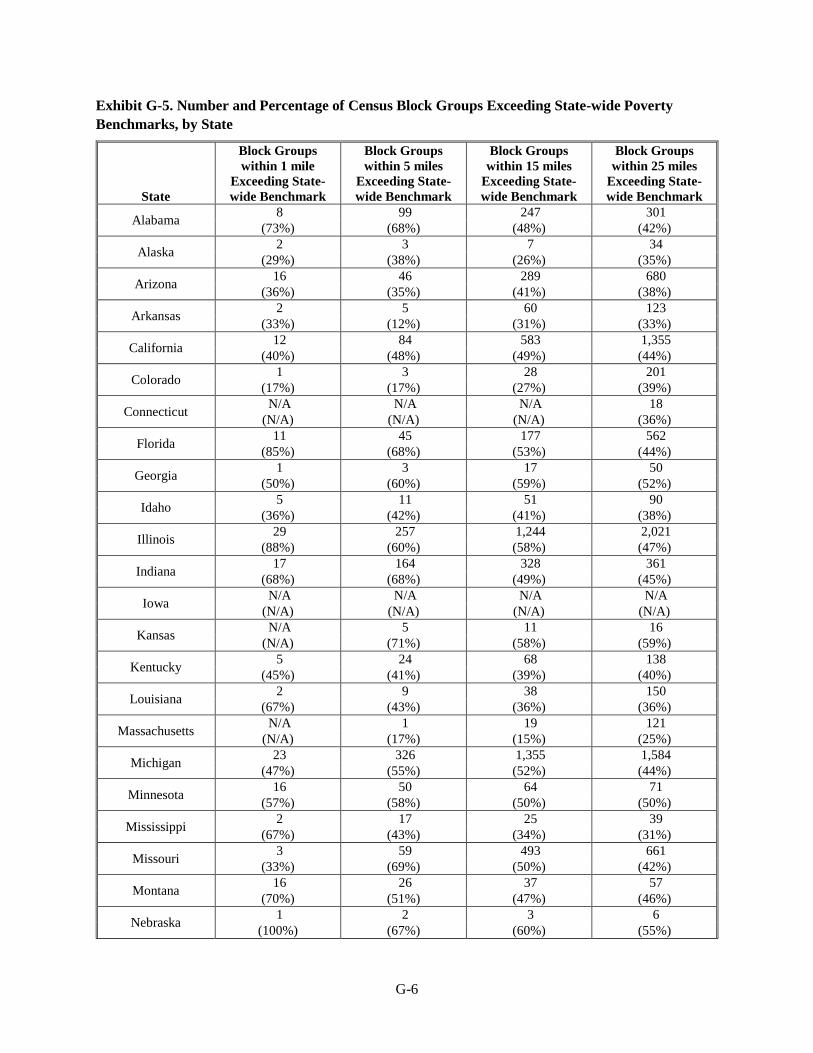
G-6
Exhibit G-5. Number and Percentage of Census Block Groups Exceeding State-wide Poverty
Benchmarks, by State
State
Block Groups
within 1 mile
Exceeding State-
wide Benchmark
Block Groups
within 5 miles
Exceeding State-
wide Benchmark
Block Groups
within 15 miles
Exceeding State-
wide Benchmark
Block Groups
within 25 miles
Exceeding State-
wide Benchmark
Alabama 8 99 247 301
(73%) (68%) (48%) (42%)
Alaska 2 3 7 34
(29%) (38%) (26%) (35%)
Arizona 16 46 289 680
(36%) (35%) (41%) (38%)
Arkansas 2 5 60 123
(33%) (12%) (31%) (33%)
California 12 84 583 1,355
(40%) (48%) (49%) (44%)
Colorado 1 3 28 201
(17%) (17%) (27%) (39%)
Connecticut N/A N/A N/A 18
(N/A) (N/A) (N/A) (36%)
Florida 11 45 177 562
(85%) (68%) (53%) (44%)
Georgia 1 3 17 50
(50%) (60%) (59%) (52%)
Idaho 5 11 51 90
(36%) (42%) (41%) (38%)
Illinois 29 257 1,244 2,021
(88%) (60%) (58%) (47%)
Indiana 17 164 328 361
(68%) (68%) (49%) (45%)
Iowa N/A N/A N/A N/A
(N/A) (N/A) (N/A) (N/A)
Kansas N/A 5 11 16
(N/A) (71%) (58%) (59%)
Kentucky 5 24 68 138
(45%) (41%) (39%) (40%)
Louisiana 2 9 38 150
(67%) (43%) (36%) (36%)
Massachusetts N/A 1 19 121
(N/A) (17%) (15%) (25%)
Michigan 23 326 1,355 1,584
(47%) (55%) (52%) (44%)
Minnesota 16 50 64 71
(57%) (58%) (50%) (50%)
Mississippi 2 17 25 39
(67%) (43%) (34%) (31%)
Missouri 3 59 493 661
(33%) (69%) (50%) (42%)
Montana 16 26 37 57
(70%) (51%) (47%) (46%)
Nebraska 1 2 3 6
(100%) (67%) (60%) (55%)
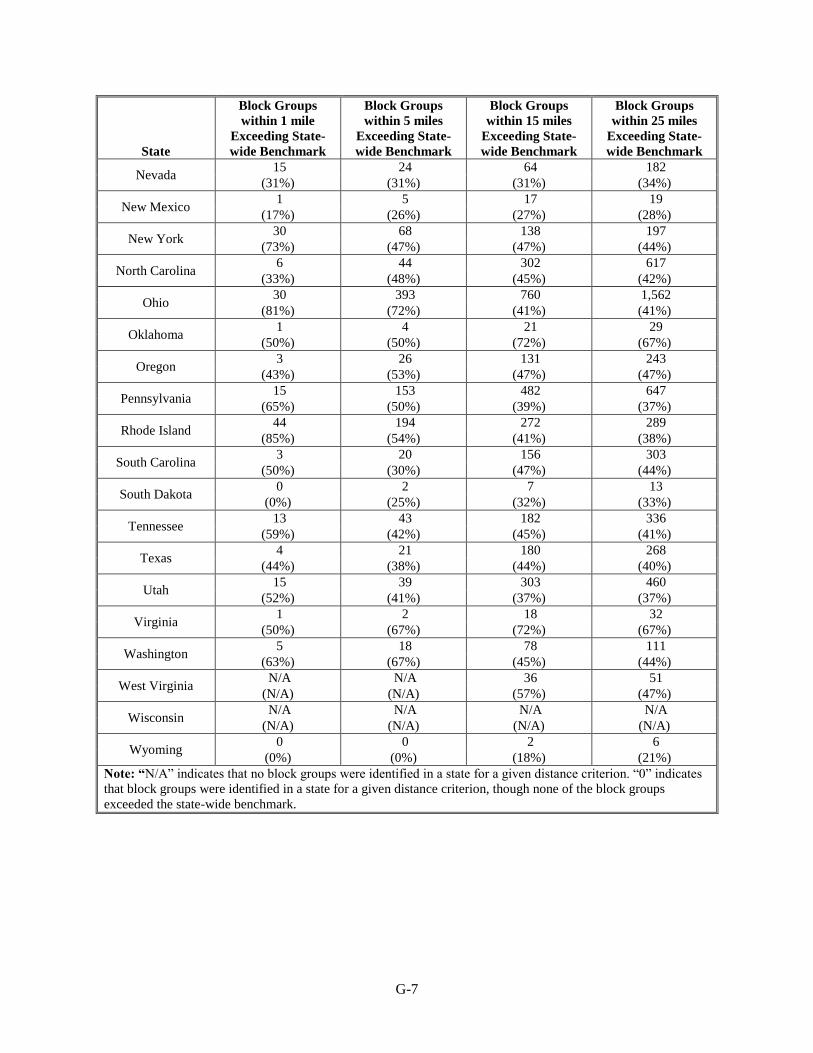
G-7
State
Block Groups
within 1 mile
Exceeding State-
wide Benchmark
Block Groups
within 5 miles
Exceeding State-
wide Benchmark
Block Groups
within 15 miles
Exceeding State-
wide Benchmark
Block Groups
within 25 miles
Exceeding State-
wide Benchmark
Nevada 15 24 64 182
(31%) (31%) (31%) (34%)
New Mexico 1 5 17 19
(17%) (26%) (27%) (28%)
New York 30 68 138 197
(73%) (47%) (47%) (44%)
North Carolina 6 44 302 617
(33%) (48%) (45%) (42%)
Ohio 30 393 760 1,562
(81%) (72%) (41%) (41%)
Oklahoma 1 4 21 29
(50%) (50%) (72%) (67%)
Oregon 3 26 131 243
(43%) (53%) (47%) (47%)
Pennsylvania 15 153 482 647
(65%) (50%) (39%) (37%)
Rhode Island 44 194 272 289
(85%) (54%) (41%) (38%)
South Carolina 3 20 156 303
(50%) (30%) (47%) (44%)
South Dakota 0 2 7 13
(0%) (25%) (32%) (33%)
Tennessee 13 43 182 336
(59%) (42%) (45%) (41%)
Texas 4 21 180 268
(44%) (38%) (44%) (40%)
Utah 15 39 303 460
(52%) (41%) (37%) (37%)
Virginia 1 2 18 32
(50%) (67%) (72%) (67%)
Washington 5 18 78 111
(63%) (67%) (45%) (44%)
West Virginia N/A N/A 36 51
(N/A) (N/A) (57%) (47%)
Wisconsin N/A N/A N/A N/A
(N/A) (N/A) (N/A) (N/A)
Wyoming 0 0 2 6
(0%) (0%) (18%) (21%)
Note: “N/A” indicates that no block groups were identified in a state for a given distance criterion. “0” indicates
that block groups were identified in a state for a given distance criterion, though none of the block groups
exceeded the state-wide benchmark.
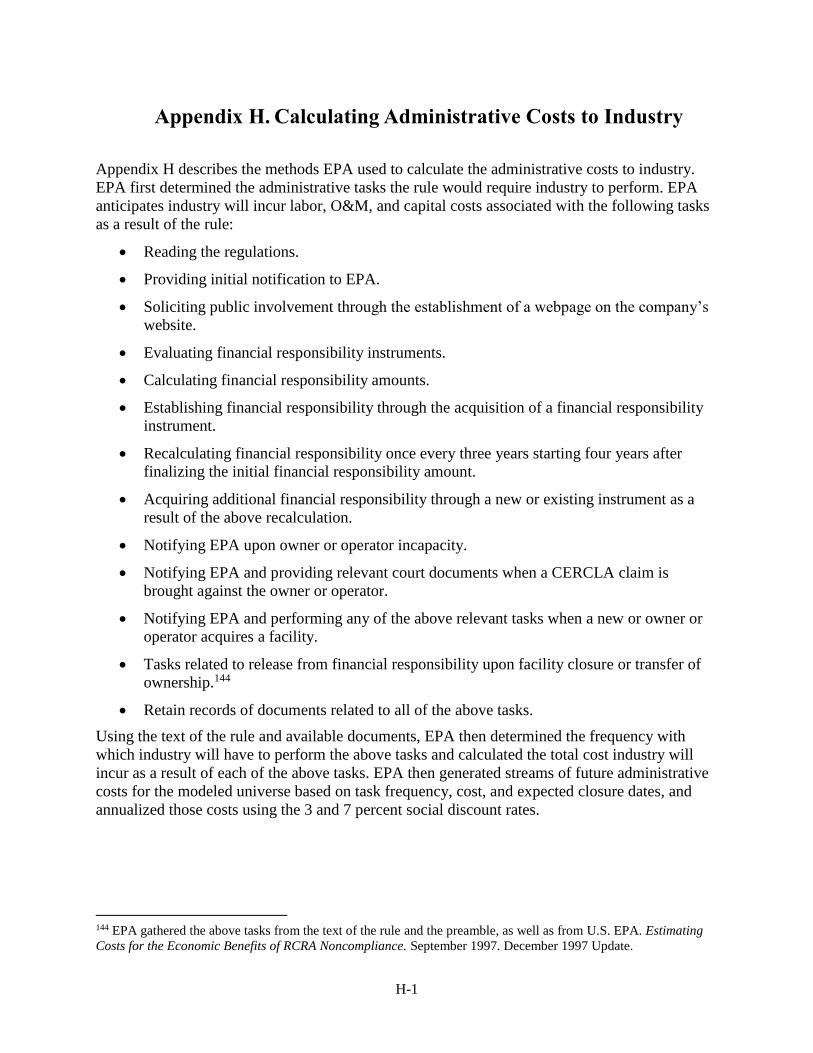
H-1
Appendix H. Calculating Administrative Costs to Industry
Appendix H describes the methods EPA used to calculate the administrative costs to industry.
EPA first determined the administrative tasks the rule would require industry to perform. EPA
anticipates industry will incur labor, O&M, and capital costs associated with the following tasks
as a result of the rule:
Reading the regulations.
Providing initial notification to EPA.
Soliciting public involvement through the establishment of a webpage on the company’s
website.
Evaluating financial responsibility instruments.
Calculating financial responsibility amounts.
Establishing financial responsibility through the acquisition of a financial responsibility
instrument.
Recalculating financial responsibility once every three years starting four years after
finalizing the initial financial responsibility amount.
Acquiring additional financial responsibility through a new or existing instrument as a
result of the above recalculation.
Notifying EPA upon owner or operator incapacity.
Notifying EPA and providing relevant court documents when a CERCLA claim is
brought against the owner or operator.
Notifying EPA and performing any of the above relevant tasks when a new or owner or
operator acquires a facility.
Tasks related to release from financial responsibility upon facility closure or transfer of
ownership.144
Retain records of documents related to all of the above tasks.
Using the text of the rule and available documents, EPA then determined the frequency with
which industry will have to perform the above tasks and calculated the total cost industry will
incur as a result of each of the above tasks. EPA then generated streams of future administrative
costs for the modeled universe based on task frequency, cost, and expected closure dates, and
annualized those costs using the 3 and 7 percent social discount rates.
144 EPA gathered the above tasks from the text of the rule and the preamble, as well as from U.S. EPA. Estimating
Costs for the Economic Benefits of RCRA Noncompliance. September 1997. December 1997 Update.
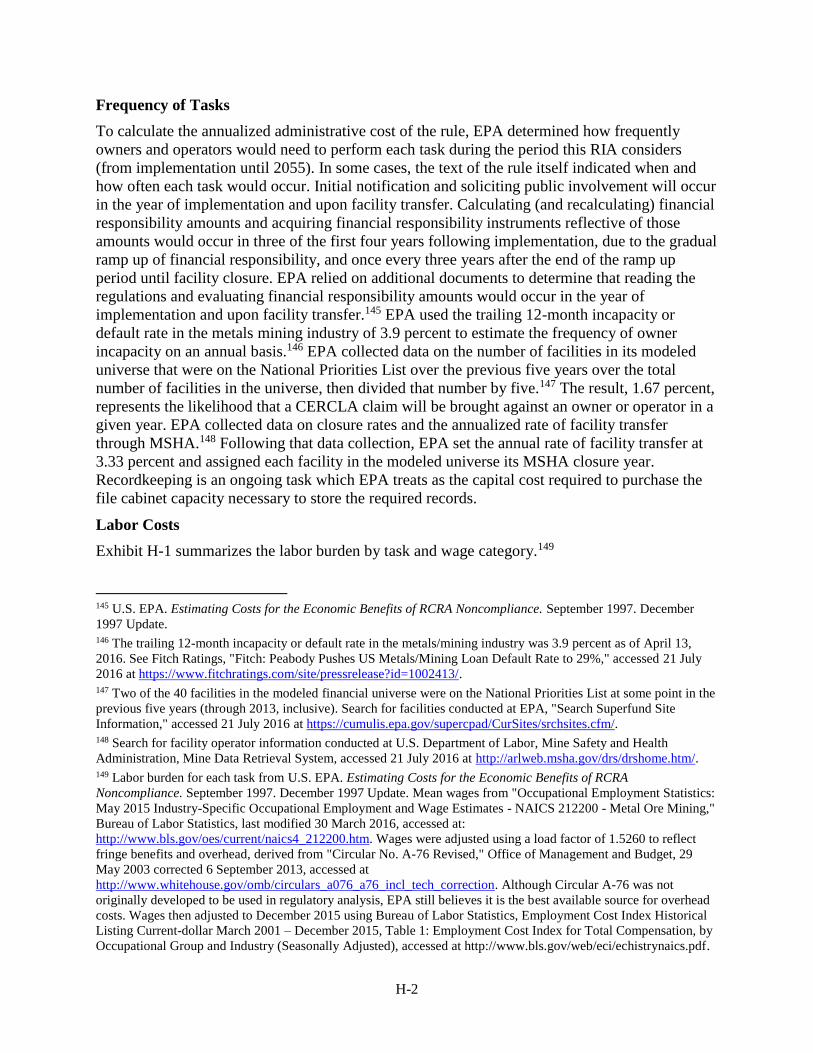
H-2
Frequency of Tasks
To calculate the annualized administrative cost of the rule, EPA determined how frequently
owners and operators would need to perform each task during the period this RIA considers
(from implementation until 2055). In some cases, the text of the rule itself indicated when and
how often each task would occur. Initial notification and soliciting public involvement will occur
in the year of implementation and upon facility transfer. Calculating (and recalculating) financial
responsibility amounts and acquiring financial responsibility instruments reflective of those
amounts would occur in three of the first four years following implementation, due to the gradual
ramp up of financial responsibility, and once every three years after the end of the ramp up
period until facility closure. EPA relied on additional documents to determine that reading the
regulations and evaluating financial responsibility amounts would occur in the year of
implementation and upon facility transfer.145 EPA used the trailing 12-month incapacity or
default rate in the metals mining industry of 3.9 percent to estimate the frequency of owner
incapacity on an annual basis.146 EPA collected data on the number of facilities in its modeled
universe that were on the National Priorities List over the previous five years over the total
number of facilities in the universe, then divided that number by five.147 The result, 1.67 percent,
represents the likelihood that a CERCLA claim will be brought against an owner or operator in a
given year. EPA collected data on closure rates and the annualized rate of facility transfer
through MSHA.148 Following that data collection, EPA set the annual rate of facility transfer at
3.33 percent and assigned each facility in the modeled universe its MSHA closure year.
Recordkeeping is an ongoing task which EPA treats as the capital cost required to purchase the
file cabinet capacity necessary to store the required records.
Labor Costs
Exhibit H-1 summarizes the labor burden by task and wage category.149
145 U.S. EPA. Estimating Costs for the Economic Benefits of RCRA Noncompliance. September 1997. December
1997 Update. 146 The trailing 12-month incapacity or default rate in the metals/mining industry was 3.9 percent as of April 13,
2016. See Fitch Ratings, "Fitch: Peabody Pushes US Metals/Mining Loan Default Rate to 29%," accessed 21 July
2016 at https://www.fitchratings.com/site/pressrelease?id=1002413/. 147 Two of the 40 facilities in the modeled financial universe were on the National Priorities List at some point in the
previous five years (through 2013, inclusive). Search for facilities conducted at EPA, "Search Superfund Site
Information," accessed 21 July 2016 at https://cumulis.epa.gov/supercpad/CurSites/srchsites.cfm/. 148 Search for facility operator information conducted at U.S. Department of Labor, Mine Safety and Health
Administration, Mine Data Retrieval System, accessed 21 July 2016 at http://arlweb.msha.gov/drs/drshome.htm/. 149 Labor burden for each task from U.S. EPA. Estimating Costs for the Economic Benefits of RCRA
Noncompliance. September 1997. December 1997 Update. Mean wages from "Occupational Employment Statistics:
May 2015 Industry-Specific Occupational Employment and Wage Estimates - NAICS 212200 - Metal Ore Mining,"
Bureau of Labor Statistics, last modified 30 March 2016, accessed at:
http://www.bls.gov/oes/current/naics4_212200.htm. Wages were adjusted using a load factor of 1.5260 to reflect
fringe benefits and overhead, derived from "Circular No. A-76 Revised," Office of Management and Budget, 29
May 2003 corrected 6 September 2013, accessed at
http://www.whitehouse.gov/omb/circulars_a076_a76_incl_tech_correction. Although Circular A-76 was not
originally developed to be used in regulatory analysis, EPA still believes it is the best available source for overhead
costs. Wages then adjusted to December 2015 using Bureau of Labor Statistics, Employment Cost Index Historical
Listing Current-dollar March 2001 – December 2015, Table 1: Employment Cost Index for Total Compensation, by
Occupational Group and Industry (Seasonally Adjusted), accessed at http://www.bls.gov/web/eci/echistrynaics.pdf.
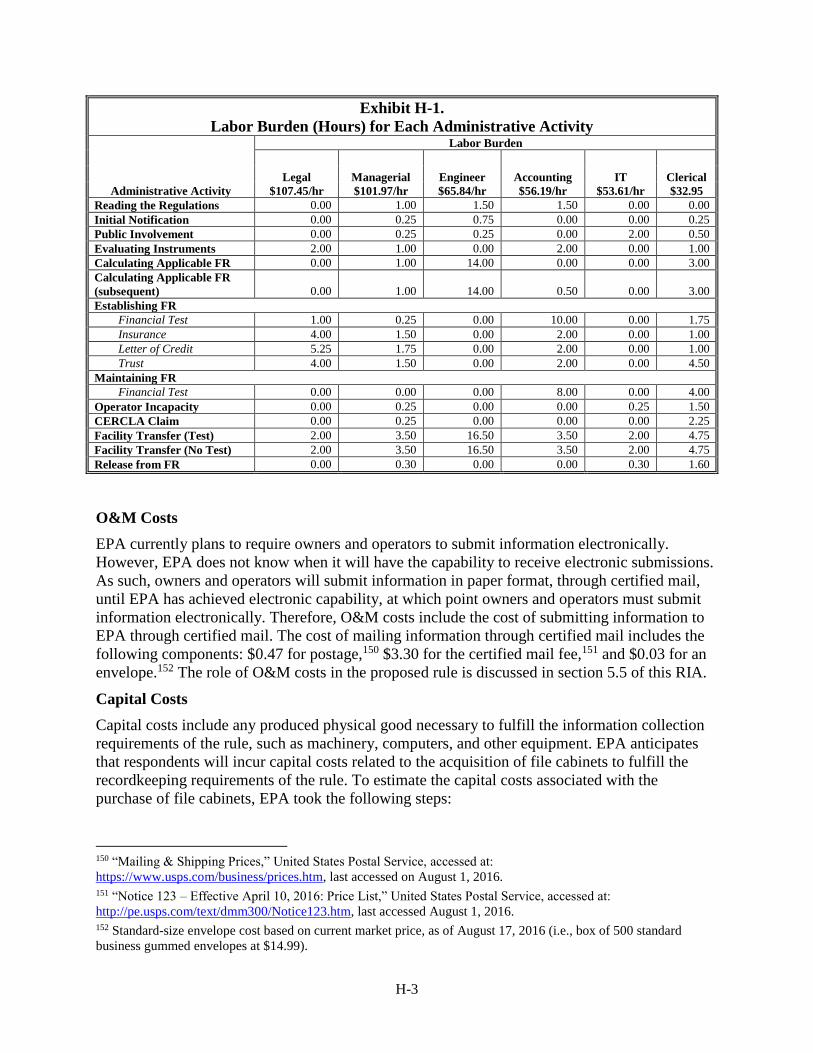
H-3
Exhibit H-1.
Labor Burden (Hours) for Each Administrative Activity
Administrative Activity
Labor Burden
Legal
$107.45/hr
Managerial
$101.97/hr
Engineer
$65.84/hr
Accounting
$56.19/hr
IT
$53.61/hr
Clerical
$32.95
Reading the Regulations 0.00 1.00 1.50 1.50 0.00 0.00
Initial Notification 0.00 0.25 0.75 0.00 0.00 0.25
Public Involvement 0.00 0.25 0.25 0.00 2.00 0.50
Evaluating Instruments 2.00 1.00 0.00 2.00 0.00 1.00
Calculating Applicable FR 0.00 1.00 14.00 0.00 0.00 3.00
Calculating Applicable FR
(subsequent) 0.00 1.00 14.00 0.50 0.00 3.00
Establishing FR
Financial Test 1.00 0.25 0.00 10.00 0.00 1.75
Insurance 4.00 1.50 0.00 2.00 0.00 1.00
Letter of Credit 5.25 1.75 0.00 2.00 0.00 1.00
Trust 4.00 1.50 0.00 2.00 0.00 4.50
Maintaining FR
Financial Test 0.00 0.00 0.00 8.00 0.00 4.00
Operator Incapacity 0.00 0.25 0.00 0.00 0.25 1.50
CERCLA Claim 0.00 0.25 0.00 0.00 0.00 2.25
Facility Transfer (Test) 2.00 3.50 16.50 3.50 2.00 4.75
Facility Transfer (No Test) 2.00 3.50 16.50 3.50 2.00 4.75
Release from FR 0.00 0.30 0.00 0.00 0.30 1.60
O&M Costs
EPA currently plans to require owners and operators to submit information electronically.
However, EPA does not know when it will have the capability to receive electronic submissions.
As such, owners and operators will submit information in paper format, through certified mail,
until EPA has achieved electronic capability, at which point owners and operators must submit
information electronically. Therefore, O&M costs include the cost of submitting information to
EPA through certified mail. The cost of mailing information through certified mail includes the
following components: $0.47 for postage,150 $3.30 for the certified mail fee,151 and $0.03 for an
envelope.152 The role of O&M costs in the proposed rule is discussed in section 5.5 of this RIA.
Capital Costs
Capital costs include any produced physical good necessary to fulfill the information collection
requirements of the rule, such as machinery, computers, and other equipment. EPA anticipates
that respondents will incur capital costs related to the acquisition of file cabinets to fulfill the
recordkeeping requirements of the rule. To estimate the capital costs associated with the
purchase of file cabinets, EPA took the following steps:
150 “Mailing & Shipping Prices,” United States Postal Service, accessed at:
https://www.usps.com/business/prices.htm, last accessed on August 1, 2016. 151 “Notice 123 – Effective April 10, 2016: Price List,” United States Postal Service, accessed at:
http://pe.usps.com/text/dmm300/Notice123.htm, last accessed August 1, 2016. 152 Standard-size envelope cost based on current market price, as of August 17, 2016 (i.e., box of 500 standard
business gummed envelopes at $14.99).
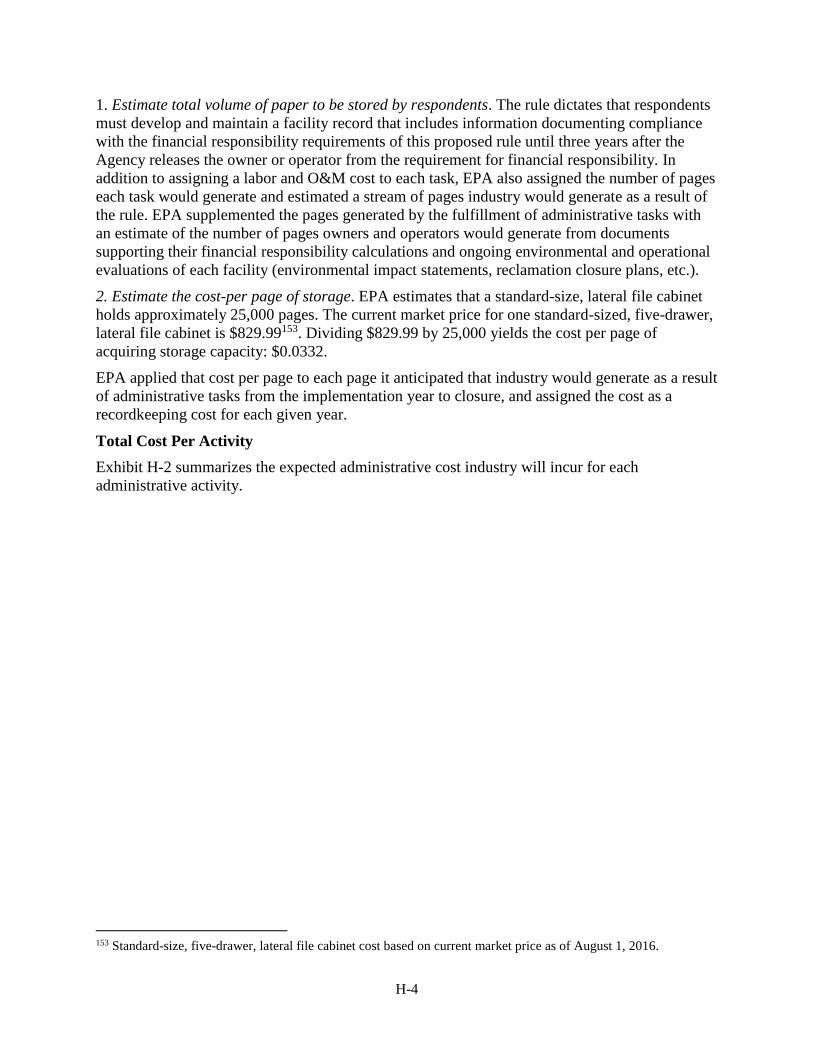
H-4
1. Estimate total volume of paper to be stored by respondents. The rule dictates that respondents
must develop and maintain a facility record that includes information documenting compliance
with the financial responsibility requirements of this proposed rule until three years after the
Agency releases the owner or operator from the requirement for financial responsibility. In
addition to assigning a labor and O&M cost to each task, EPA also assigned the number of pages
each task would generate and estimated a stream of pages industry would generate as a result of
the rule. EPA supplemented the pages generated by the fulfillment of administrative tasks with
an estimate of the number of pages owners and operators would generate from documents
supporting their financial responsibility calculations and ongoing environmental and operational
evaluations of each facility (environmental impact statements, reclamation closure plans, etc.).
2. Estimate the cost-per page of storage. EPA estimates that a standard-size, lateral file cabinet
holds approximately 25,000 pages. The current market price for one standard-sized, five-drawer,
lateral file cabinet is $829.99153. Dividing $829.99 by 25,000 yields the cost per page of
acquiring storage capacity: $0.0332.
EPA applied that cost per page to each page it anticipated that industry would generate as a result
of administrative tasks from the implementation year to closure, and assigned the cost as a
recordkeeping cost for each given year.
Total Cost Per Activity
Exhibit H-2 summarizes the expected administrative cost industry will incur for each
administrative activity.
153 Standard-size, five-drawer, lateral file cabinet cost based on current market price as of August 1, 2016.
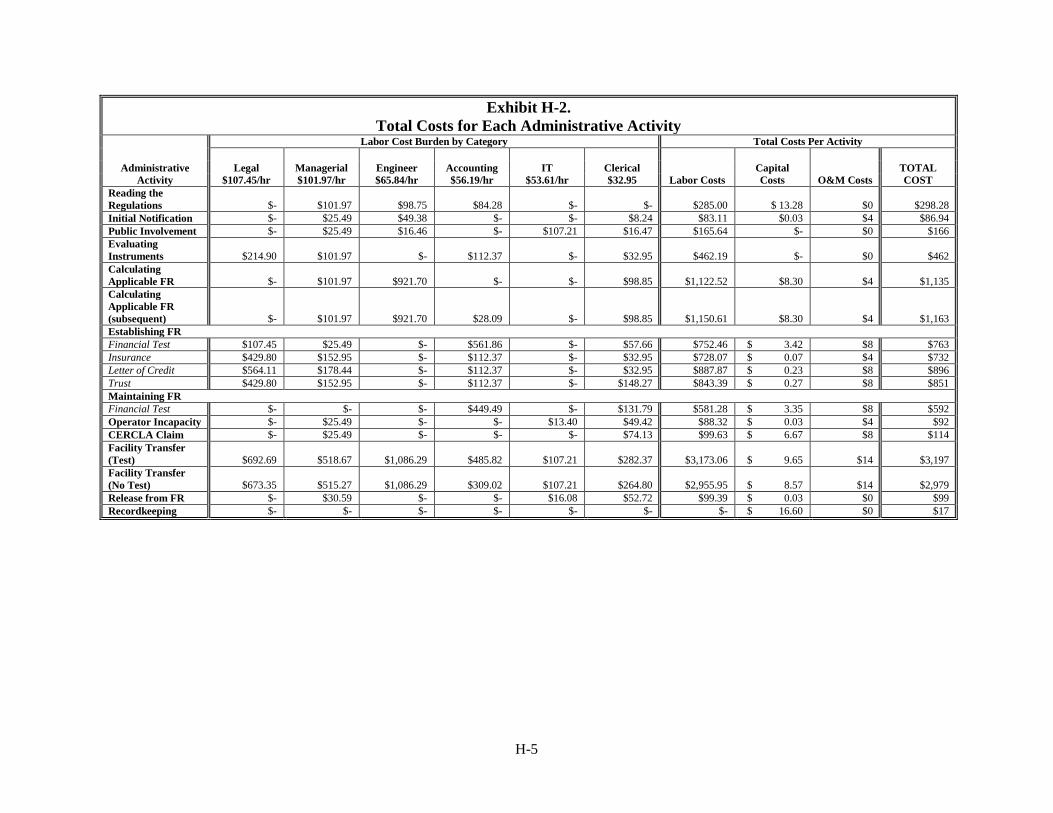
H-5
Exhibit H-2.
Total Costs for Each Administrative Activity
Administrative
Activity
Labor Cost Burden by Category Total Costs Per Activity
Legal
$107.45/hr
Managerial
$101.97/hr
Engineer
$65.84/hr
Accounting
$56.19/hr
IT
$53.61/hr
Clerical
$32.95 Labor Costs
Capital
Costs O&M Costs
TOTAL
COST
Reading the
Regulations $- $101.97 $98.75 $84.28 $- $- $285.00 $ 13.28 $0 $298.28
Initial Notification $- $25.49 $49.38 $- $- $8.24 $83.11 $0.03 $4 $86.94
Public Involvement $- $25.49 $16.46 $- $107.21 $16.47 $165.64 $- $0 $166
Evaluating
Instruments $214.90 $101.97 $- $112.37 $- $32.95 $462.19 $- $0 $462
Calculating
Applicable FR $- $101.97 $921.70 $- $- $98.85 $1,122.52 $8.30 $4 $1,135
Calculating
Applicable FR
(subsequent) $- $101.97 $921.70 $28.09 $- $98.85 $1,150.61 $8.30 $4 $1,163
Establishing FR
Financial Test $107.45 $25.49 $- $561.86 $- $57.66 $752.46 $ 3.42 $8 $763
Insurance $429.80 $152.95 $- $112.37 $- $32.95 $728.07 $ 0.07 $4 $732
Letter of Credit $564.11 $178.44 $- $112.37 $- $32.95 $887.87 $ 0.23 $8 $896
Trust $429.80 $152.95 $- $112.37 $- $148.27 $843.39 $ 0.27 $8 $851
Maintaining FR
Financial Test $- $- $- $449.49 $- $131.79 $581.28 $ 3.35 $8 $592
Operator Incapacity $- $25.49 $- $- $13.40 $49.42 $88.32 $ 0.03 $4 $92
CERCLA Claim $- $25.49 $- $- $- $74.13 $99.63 $ 6.67 $8 $114
Facility Transfer
(Test) $692.69 $518.67 $1,086.29 $485.82 $107.21 $282.37 $3,173.06 $ 9.65 $14 $3,197
Facility Transfer
(No Test) $673.35 $515.27 $1,086.29 $309.02 $107.21 $264.80 $2,955.95 $ 8.57 $14 $2,979
Release from FR $- $30.59 $- $- $16.08 $52.72 $99.39 $ 0.03 $0 $99
Recordkeeping $- $- $- $- $- $- $- $ 16.60 $0 $17
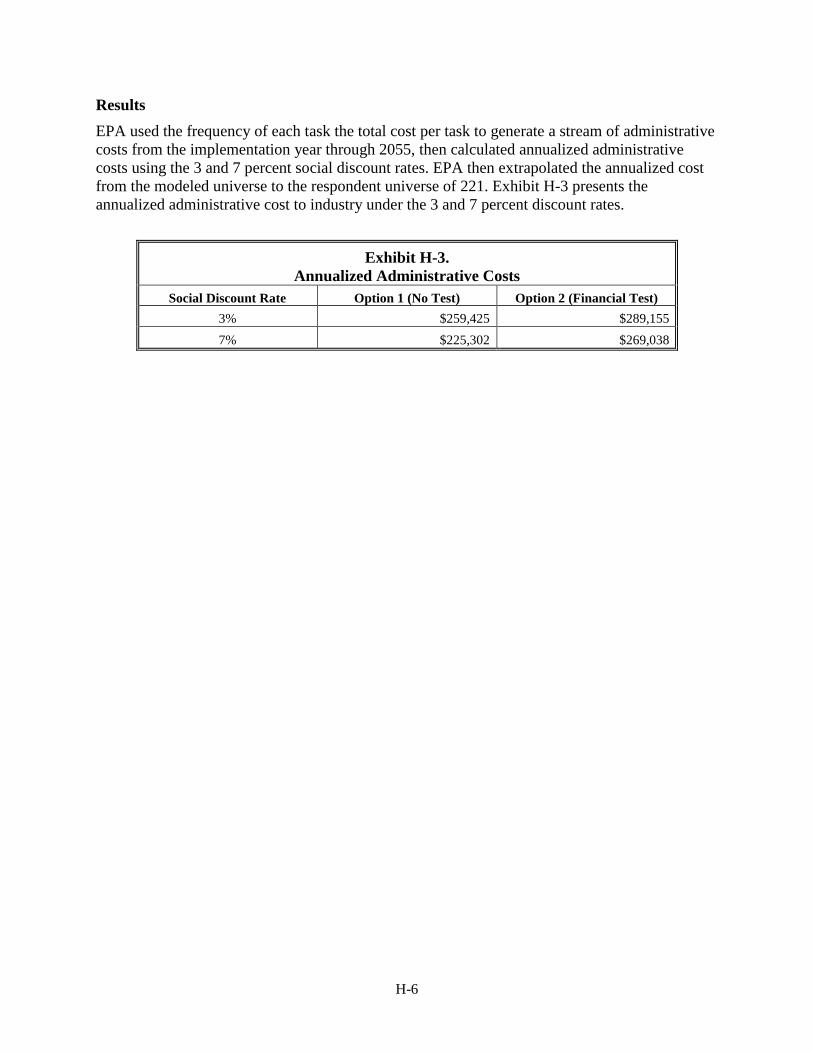
H-6
Results
EPA used the frequency of each task the total cost per task to generate a stream of administrative
costs from the implementation year through 2055, then calculated annualized administrative
costs using the 3 and 7 percent social discount rates. EPA then extrapolated the annualized cost
from the modeled universe to the respondent universe of 221. Exhibit H-3 presents the
annualized administrative cost to industry under the 3 and 7 percent discount rates.
Exhibit H-3.
Annualized Administrative Costs
Social Discount Rate Option 1 (No Test) Option 2 (Financial Test)
3% $259,425 $289,155
7% $225,302 $269,038