Regulatory Financial Statements 2019
142
Regulatory Financial Statements 2019
Transcript of Regulatory Financial Statements 2019

Regulatory Financial Statements 2019
Document user guideBT Regulatory Financial Statements 2019
Welcome to the BT Regulatory Financial Statements 2018 . In this interactive pdf you can do many things to help you easily access the information that you want, whether that’s printing, searching for a specific item or going directly to another page, section or
website. These are explained below.
Document controlsUse the document controls located at the side of the page to help you navigate through this report.
Search Print Go to Back/forward Fast link to previous contents one page page viewed
Links within this documentThroughout this report there are links to pages, other sections and web addresses for additional information. To quickly go to the start of a section you can use the tabs near the top of the page. You can also go straight to the start of the document by clicking the name of the report in the top left corner.
Page links
Reference to other pages within the report
Web links
Reference to further reading online
Front cover linkRegulatory Financial Statements 2019
ExampleFor further discussion of these items see pages •• and •• to ••. A reconciliation of adjusted EBITDA to group operating profit (loss) by line of business, and for the group, is provided in the table at the foot of pages •• to ••.

Ofcom Statement on BT’s Regulatory Financial Statements 2019
Introduction
BT’s reporting obligations arise out of market reviews conducted by Ofcom and SMP conditions and directions related to regulatory reporting1. Under these SMP conditions BT is required to publish with the audited regulatory financial statements (RFS) any written statement made by Ofcom and provided to BT commenting on the data in, the notes to or any presentation of any or all of the RFS, the reconciliation report and/or the Accounting Methodology Documents.
We believe it is helpful to users of the RFS to draw attention to several important aspects of BT’s 2018/19 RFS.
Publication requirements
It is important that BT retains responsibility for its RFS and can respond to changes in circumstances when deciding how best to prepare them. Since June 2014, BT has been required to notify Ofcom and publish any changes that it intends to make to its allocation methodologies in advance in a report (the Change Control Notification). For each proposed change, the Change Control Notification should include a description of the change, the reason for making it and an estimate (based on the prior year RFS) of its impact on the financial results. When, in Ofcom’s opinion, any proposed change does not comply with any SMP condition or the Regulatory Accounting Principles, it can direct BT not to make that change.
BT is also required to publish an audited reconciliation report (the Reconciliation Report) as part of the RFS, setting out the reasons for and impact of the methodology changes it actually made and the effect of correcting any material errors identified in the year. The actual changes should be similar to those included in the Change Control Notification, subject to the outcome of discussions with Ofcom.
Changes to regulatory accounting methodologies
Appendix 3 sets out the methodology changes BT has made in 2018/19 and shows the impact of these changes on the published 2017/18 RFS. Following our review of the Change Control Notification we have not directed BT to withdraw any of its proposed changes, although this does not represent an endorsement of them.
1 Some reporting also arises from the Commitments given by BT and Openreach which were notified to Ofcom under section 89C of the Communications Act 2003.
Next Steps
It is important that BT’s regulatory reporting obligations remain relevant and appropriate and its RFS will evolve as our regulation develops. For example, this year readers will notice that Section 5, the Summary of Market Performance, has a greater focus on Openreach, consistent with the Directions issued in our March 2019 Regulatory Reporting Statement.2
The 2019/20 RFS will show further changes as a result of decisions we made in our July 2019 regulatory reporting statement. Notably, the 2019/20 RFS will report costs and revenues for the new Physical Infrastructure market and interexchange dark fibre services in the Business Connectivity market.
We expect to consult on BT’s regulatory reporting requirements as part of the forthcoming Fixed Telecoms Market Review . We would encourage all our stakeholders to participate in these reviews as our decisions on these determine BT’s future reporting obligations.
2 https://www.ofcom.org.uk/consultations-and-statements/category-1/bt-regulatory-financial-reporting

Contents
Page 1
Regulatory Financial Statements
Section 1 Introduction to the Regulatory Financial Statements.............................................2
Section 2 Basis of Preparation .............................................................................................10
Section 3 Statement of Responsibility .................................................................................14
Section 4 Audit Report ........................................................................................................16
Section 5 Summary of Market Performance ........................................................................21
Section 6 Review of Wholesale Local Access Markets ..........................................................43
Section 7 Review of Business Connectivity Markets .............................................................62
Section 8 Review of Narrowband Markets ...........................................................................89
Section 9 Review of Wholesale Broadband Access Markets ...............................................101
Appendix 1 Network Activity Statements ..........................................................................108
Appendix 2 Time Related Charges and Special Fault Investigation Costs ............................115
Appendix 3 Reconciliation Report – Impact of Methodology Changes and Errors ..............118
Glossary and Footnotes List ...............................................................................................133
Additional Information ......................................................................................................138
Section 1 – Introduction to the Regulatory Financial Statements
Page 2
Section 1Introduction to the Regulatory Financial Statements

Rest of BT
Wholesale LocalAccess
(WLAMR)
Narrowband(NMR)
WLA
Call Origination
Call Termination
Technical Areas
WBA Market A
Market Review (MR)Wholesale Broadband
Access (WBAMR)
WFAEL
ISDN2
ISDN30
Business Connectivity(BCMR)
Low BandwidthTISBO
CISBO Rest of UK
CISBO CombinedGeographic
Reporting Financial Performance
We are required to report the Financial Performance of all SMP markets to which cost accounting and/or accounting separation obligations apply:
• At market review level encompassing individual SMP markets; and• At an individual SMP market level.
Page 3
Section 1 – Introduction to the Regulatory Financial Statements
1.1 Regulatory Financial Reporting Obligations
The form and content of the Regulatory Financial Statements (RFS) are based on the reporting obligations set by Ofcom. We refer to these obligations as the Final Statements (see Section 2.1.4 Final Statements set out by Ofcom).
Openreach
We are required by Section 20.6 of the Commitments to disclose the financial results of Openreach separately and to reconcile the financial results to the Openreach segmental information shown in BT Group plc’s Annual Report. We have included this information in Section 5 of these Regulatory Financial Statements.
BT Customer Facing Units and Markets with Significant Market Power (SMP)
In the 2019 RFS, we are required to report on the following SMP markets (in the UK excluding the Hull area, modified where stated below):

Section 1 – Introduction to the Regulatory Financial Statements
Page 4
BT SMP Markets
Wholesale Local Access Markets Narrowband Markets Business Connectivity MarketsCopper and fibre fixed lines connecting
end-users to access nodes in BT exchanges. Communication providers
(CPs) use these lines to provide telephone and broadband internet
services (including superfast broadband) to residential and business
consumers.
Provision of products and services that underpin the delivery of fixed line telephone calls. Different wholesale charges are raised to CPs depending on how
much of the call is carried on our network
Cover the provision of leased lines and dedicated circuits providing transmission
capacity between fixed locations.
WLA (Wholesale Local Access)Copper lines and fibre lines used by CPs to connect end-users to their voice or broadband nodes located in BT exchanges.
WFAEL (Wholesale Fixed Analogue Exchange Lines)Copper lines connected to a line card in a BT telephony switch. Used by CPs to provide end-users with voice services. Is a prerequisite for WLA SMPF services.
Call Termination (Wholesale Fixed Geographic Call Termination)The wholesale charges for calls to BT fixed lines. These charges are for carrying the call to a BT terminating line from the nearest point in the network at which other CPs could interconnect.
Low Bandwidth CISBO (Contemporary Interface Symmetric Broadband Origination) Rest of UKThis market is for services sold outside of the London Periphery, Central London, Hull and the CBDs of Birmingham, Bristol, Glasgow, Leeds and Manchester.
Wholesale Broadband Access Markets
Access and backhaul services that allow CPs to provide their end-user
customers with broadband over fixed lines.
ISDN2 (Wholesale ISDN2 exchange line services)Two 64 Kbps channels provided over a single copper line, connected to a line card in a BT telephony switch. Used by CPs to provide business customers with voice and data services.
Call Origination (Wholesale call Origination on Fixed Narrowband Network)The wholesale calls originating on our network between the originating fixed line to the first point in the network at which other CPs can interconnect.
Low Bandwidth CISBO Combined GeographicLeased lines provided using modern technology more suitable for the transmission of IP data.This market is for services sold in the London Periphery zone and CBDs of Bristol and Manchester.
WBA (Market A) (Wholesale Broadband Access Market A)Market A covers exchange areas where BT and no more than one other CP are currently, or forecast to be, present.
ISDN30 (Wholesale business ISDN30 exchange line services)Similar functionality to ISDN2 but provides up to 30 x 64 Kbps channels over a single circuit that can be provided over copper, fibre or radio.
Technical Areas (DLE Interconnect Circuits)Provision of the physical infrastructure that allows a CP to interconnect with our network. This enables calls to travel between the two networks.
Low Bandwidth TISBO (Traditional Interface Symmetric Broadband Origination)Low bandwidth leased lines (up to 8 Mbps) provided using legacy technology. End-users are gradually migrating to more modern technologies but currently still value certain characteristics of these traditional lines.

MarketDefinition
MarketPower
Analysis
SMPRemedies*
Consultations
ConcludeSMP
Remedies
Appeal
MarketDefinition
PowerAnalysis
Market
Consultations
SMPRemedies*
alysis
SMP
l i
udeSMP
Remedies
ConcluS
Appeal
Remedies
l
Ofcom identifies and defines each relevant market in terms of its products and geographic scope.
Ofcom assesses whether BT or any other CP has a position of SMP in any of these relevant markets.
Ofcom consult on market definition, SMP designation and proposed regulatory remedies on BT or any other CP to address competition concerns that arise from identification of SMP.
BT and other stakeholders submit responses on the proposed remedies. This process typically runs for up to 12 weeks.
Ofcom publishes its conclusions and imposes SMP remedies for the next three year market review period.
BT and other interested parties then have two months to appeal Ofcom’s decision.
Market Regulatory Period (BT’s Financial Year)
2017/18 2018/19 2019/20 2020/21 2021/22 2022/23
NBM
RFT
MR
Lacunai
Lacunai
Lacunai
Lacunai
WFAEL and ISDNsii
Calls and Technical Areas
PIMRiii,iv
WLAMRii
BCMRii
WBAMR iii
Regulatory Period Beginning/Ending
i Interim period between expired price controls and implementation of new price controlsii Ofcom intends to merge markets into a Fixed Telecoms Market and assess competition
across all access services in a new combined Fixed Telecoms Market Review (FTMR) from2021
iii Market will be reviewed as part of the FTMRiv New Market from 2019/20: Physical Infrastructure Market Review (PIMR)
*Examples of SMP remedies are below:
AccountingSeparation and Cost
AccountingObligation to Supply
No UndueDiscrimination
Cost OrientationFair and Reasonable
Terms, Conditionsand Charges
Charge ControlPrices at CPI/RPI-X%
Page 5
Section 1 – Introduction to the Regulatory Financial Statements
1.2 Regulatory Market Review Cycle
Ofcom reviews some communications markets periodically, in accordance with the EU Common Regulatory Framework, which is implemented in the UK by the Communications Act 2003 as amended. The process involves three analytical stages: Market Definition, Market Power Analysis and SMP Remedies. This is followed by consultations with stakeholders, after which Ofcom will conclude and potentially impose SMP remedies for the next period. Prior to the expiry of the market review where the remedies are in place, the market review cycle will start again.
Section 1 – Introduction to the Regulatory Financial Statements
Page 6
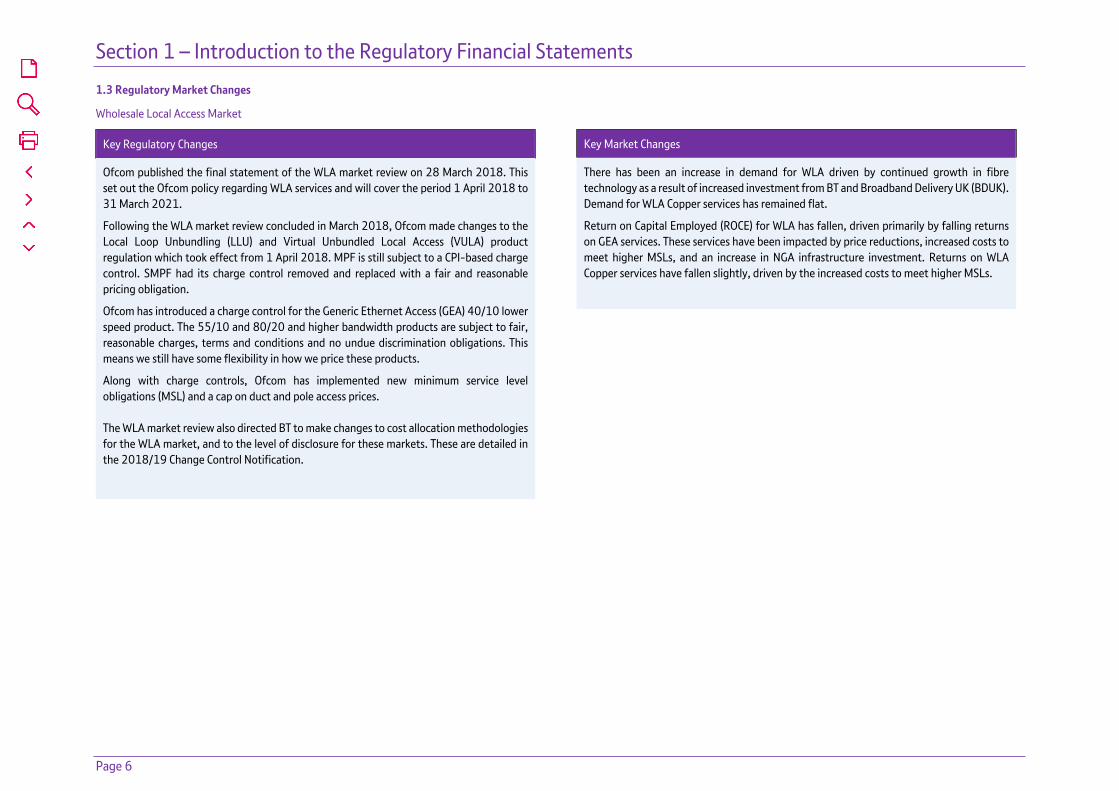
1.3 Regulatory Market Changes
Wholesale Local Access Market
Key Regulatory Changes
Ofcom published the final statement of the WLA market review on 28 March 2018. This set out the Ofcom policy regarding WLA services and will cover the period 1 April 2018 to 31 March 2021.
Following the WLA market review concluded in March 2018, Ofcom made changes to the Local Loop Unbundling (LLU) and Virtual Unbundled Local Access (VULA) product regulation which took effect from 1 April 2018. MPF is still subject to a CPI-based charge control. SMPF had its charge control removed and replaced with a fair and reasonable pricing obligation.
Ofcom has introduced a charge control for the Generic Ethernet Access (GEA) 40/10 lower speed product. The 55/10 and 80/20 and higher bandwidth products are subject to fair, reasonable charges, terms and conditions and no undue discrimination obligations. This means we still have some flexibility in how we price these products.
Along with charge controls, Ofcom has implemented new minimum service level obligations (MSL) and a cap on duct and pole access prices.
The WLA market review also directed BT to make changes to cost allocation methodologies for the WLA market, and to the level of disclosure for these markets. These are detailed in the 2018/19 Change Control Notification.
Key Market Changes
There has been an increase in demand for WLA driven by continued growth in fibre technology as a result of increased investment from BT and Broadband Delivery UK (BDUK). Demand for WLA Copper services has remained flat.
Return on Capital Employed (ROCE) for WLA has fallen, driven primarily by falling returns on GEA services. These services have been impacted by price reductions, increased costs to meet higher MSLs, and an increase in NGA infrastructure investment. Returns on WLA Copper services have fallen slightly, driven by the increased costs to meet higher MSLs.
Section 1 – Introduction to the Regulatory Financial Statements
Page 7
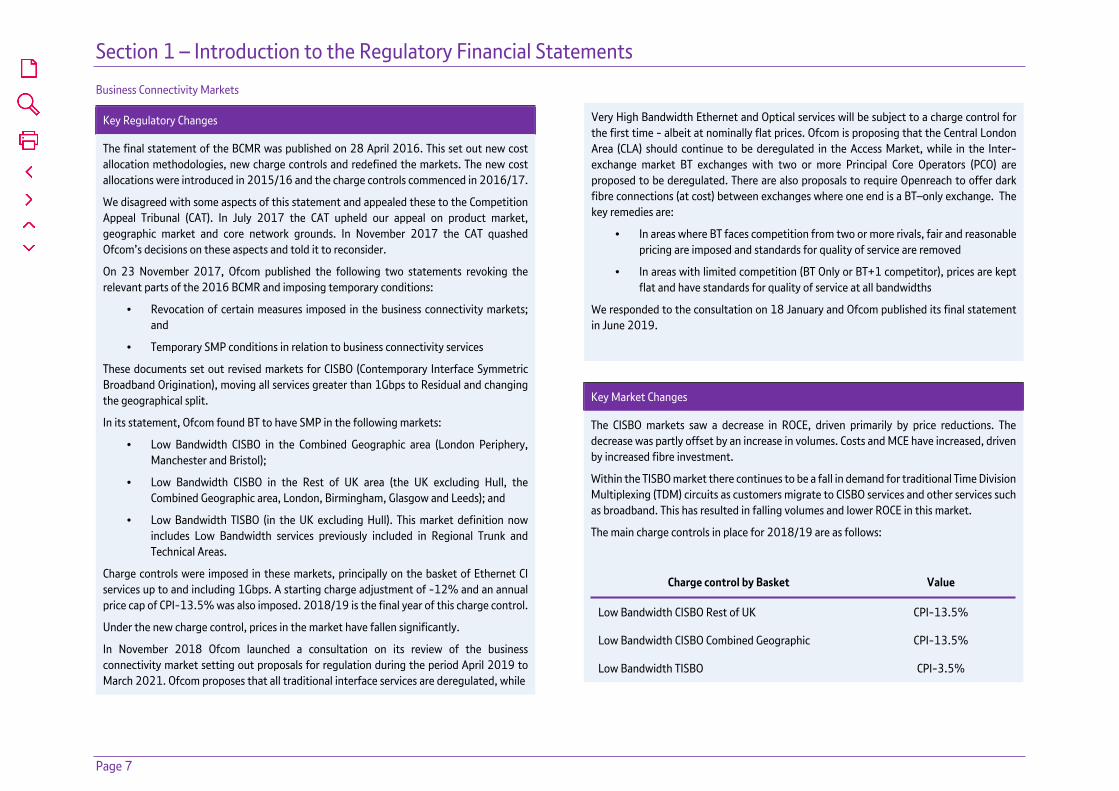
Business Connectivity Markets
Key Regulatory Changes
The final statement of the BCMR was published on 28 April 2016. This set out new cost allocation methodologies, new charge controls and redefined the markets. The new cost allocations were introduced in 2015/16 and the charge controls commenced in 2016/17.
We disagreed with some aspects of this statement and appealed these to the Competition Appeal Tribunal (CAT). In July 2017 the CAT upheld our appeal on product market, geographic market and core network grounds. In November 2017 the CAT quashed Ofcom’s decisions on these aspects and told it to reconsider.
On 23 November 2017, Ofcom published the following two statements revoking the relevant parts of the 2016 BCMR and imposing temporary conditions:
• Revocation of certain measures imposed in the business connectivity markets; and
• Temporary SMP conditions in relation to business connectivity services
These documents set out revised markets for CISBO (Contemporary Interface Symmetric Broadband Origination), moving all services greater than 1Gbps to Residual and changing the geographical split.
In its statement, Ofcom found BT to have SMP in the following markets:
• Low Bandwidth CISBO in the Combined Geographic area (London Periphery, Manchester and Bristol);
• Low Bandwidth CISBO in the Rest of UK area (the UK excluding Hull, the Combined Geographic area, London, Birmingham, Glasgow and Leeds); and
• Low Bandwidth TISBO (in the UK excluding Hull). This market definition now includes Low Bandwidth services previously included in Regional Trunk and Technical Areas.
Charge controls were imposed in these markets, principally on the basket of Ethernet CI services up to and including 1Gbps. A starting charge adjustment of -12% and an annual price cap of CPI-13.5% was also imposed. 2018/19 is the final year of this charge control.
Under the new charge control, prices in the market have fallen significantly.
In November 2018 Ofcom launched a consultation on its review of the business connectivity market setting out proposals for regulation during the period April 2019 to March 2021. Ofcom proposes that all traditional interface services are deregulated, while
Very High Bandwidth Ethernet and Optical services will be subject to a charge control for the first time - albeit at nominally flat prices. Ofcom is proposing that the Central London Area (CLA) should continue to be deregulated in the Access Market, while in the Inter-exchange market BT exchanges with two or more Principal Core Operators (PCO) are proposed to be deregulated. There are also proposals to require Openreach to offer dark fibre connections (at cost) between exchanges where one end is a BT–only exchange. The key remedies are:
• In areas where BT faces competition from two or more rivals, fair and reasonable pricing are imposed and standards for quality of service are removed
• In areas with limited competition (BT Only or BT+1 competitor), prices are kept flat and have standards for quality of service at all bandwidths
We responded to the consultation on 18 January and Ofcom published its final statement in June 2019.
Key Market Changes
The CISBO markets saw a decrease in ROCE, driven primarily by price reductions. The decrease was partly offset by an increase in volumes. Costs and MCE have increased, driven by increased fibre investment.
Within the TISBO market there continues to be a fall in demand for traditional Time Division Multiplexing (TDM) circuits as customers migrate to CISBO services and other services such as broadband. This has resulted in falling volumes and lower ROCE in this market.
The main charge controls in place for 2018/19 are as follows:
Charge control by Basket Value
Low Bandwidth CISBO Rest of UK CPI-13.5%
Low Bandwidth CISBO Combined Geographic CPI-13.5%
Low Bandwidth TISBO CPI-3.5%
Section 1 – Introduction to the Regulatory Financial Statements
Page 8
Narrowband Markets
Key Regulatory Changes
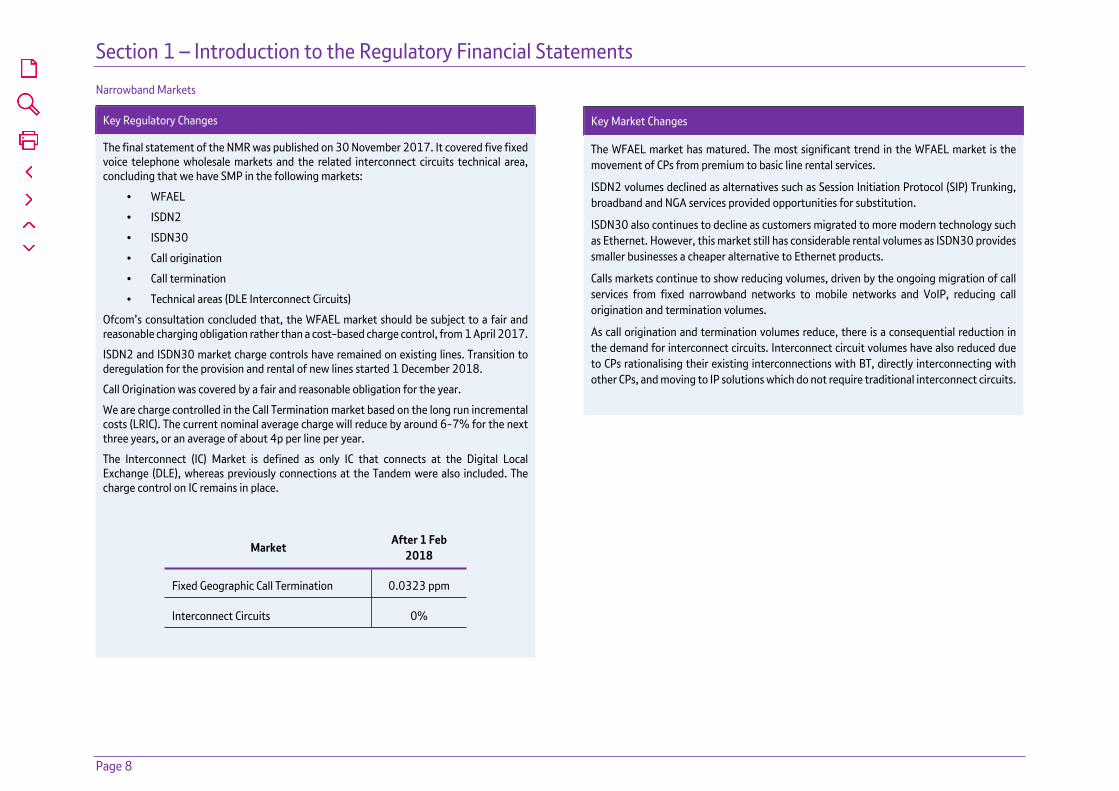
The final statement of the NMR was published on 30 November 2017. It covered five fixed voice telephone wholesale markets and the related interconnect circuits technical area, concluding that we have SMP in the following markets:
• WFAEL
• ISDN2
• ISDN30
• Call origination
• Call termination
• Technical areas (DLE Interconnect Circuits)
Ofcom’s consultation concluded that, the WFAEL market should be subject to a fair and reasonable charging obligation rather than a cost-based charge control, from 1 April 2017.
ISDN2 and ISDN30 market charge controls have remained on existing lines. Transition to deregulation for the provision and rental of new lines started 1 December 2018.
Call Origination was covered by a fair and reasonable obligation for the year.
We are charge controlled in the Call Termination market based on the long run incremental costs (LRIC). The current nominal average charge will reduce by around 6-7% for the next three years, or an average of about 4p per line per year.
The Interconnect (IC) Market is defined as only IC that connects at the Digital Local Exchange (DLE), whereas previously connections at the Tandem were also included. The charge control on IC remains in place.
MarketAfter 1 Feb
2018
Fixed Geographic Call Termination 0.0323 ppm
Interconnect Circuits 0%
Key Market Changes
The WFAEL market has matured. The most significant trend in the WFAEL market is the movement of CPs from premium to basic line rental services.
ISDN2 volumes declined as alternatives such as Session Initiation Protocol (SIP) Trunking, broadband and NGA services provided opportunities for substitution.
ISDN30 also continues to decline as customers migrated to more modern technology such as Ethernet. However, this market still has considerable rental volumes as ISDN30 provides smaller businesses a cheaper alternative to Ethernet products.
Calls markets continue to show reducing volumes, driven by the ongoing migration of call services from fixed narrowband networks to mobile networks and VoIP, reducing call origination and termination volumes.
As call origination and termination volumes reduce, there is a consequential reduction in the demand for interconnect circuits. Interconnect circuit volumes have also reduced due to CPs rationalising their existing interconnections with BT, directly interconnecting with other CPs, and moving to IP solutions which do not require traditional interconnect circuits.
Section 1 – Introduction to the Regulatory Financial Statements
Page 9
Wholesale Broadband Access Markets
Key Regulatory Changes
Ofcom published the Wholesale Broadband Access Market Review on 31 July 2018. The key headlines were the reduction of the size of WBA Market A (where BT has SMP) to 0.9% of premises. Market B exchanges are defined as those with three or more CPs present (including BT), and Market A exchanges are defined as those with two or less CPs present (including BT). The charge control in place for Market A has been removed and replaced with a fair and reasonable requirement on terms, conditions and charges.
Key Market Changes
The composition of WBA customers in regulated areas is changing as CPs withdraw from BT’s IPstream products. There has, however, been growth in fibre broadband and correspondingly good growth in WBA fibre products. These products have remained competitive in the marketplace due to the increased roll-out of infrastructure, which has allowed us to offer higher speeds on our WBA fibre products.
Sales of Wholesale Broadband Connect (WBC) fibre and copper products are growing, while IPstream service volumes are declining, as end users are moving away from the legacy broadband network (20CN) to the 21CN platform. Overall, the WBC revenue growth outweighs the IPstream revenue decline, due to an increase in bandwidth consumption per end user.
Section 2 – Basis of Preparation
Page 10
Section 2Basis of Preparation
Section 2 – Basis of Preparation
Page 11
2.1 Basis of Preparation2.1.1 Regulatory Accounting Framework
The ultimate holding company of British Telecommunications plc (‘the Company’) is BT Group plc. The terms ‘the Group’, ‘the Company’, ‘BT’, ‘we’, ‘us’ or ‘our’ refer collectively to BT Group plc and its subsidiary undertakings. The group financial statements consolidate the financial statements of BT Group plc and its subsidiaries, and include its share of the results of associates and joint ventures using the equity method of accounting.
BT Group plc’s Annual Report details the basis of preparation and explains the accounting policies adopted by the Group. BT’s Annual Report 2019, on which the independent external auditors issued an unqualified report, did not contain a statement under Section 498(2) or 498(3) of the Companies Act 2006 and has been delivered to the Registrar of Companies.
The Company has, by agreement with BT Group plc, prepared the RFS in accordance with the Regulatory Accounting Principles (RAP) (as described in Section 2.1.2 below) and Accounting Methodology Document (AMD) (as described in Section 2.1.3 below), by disaggregating balances recorded in the general ledgers and other accounting records of the Group.
The RAP and AMD set out the framework under which the RFS are prepared.
2.1.2 Regulatory Accounting Principles
The RAP are the principles we apply or use in the preparation of the RFS. For example we must attribute revenues, costs, assets and liabilities in accordance with the activities which cause the revenues to be earned, or costs to be incurred, or assets to be acquired, or liabilities to be incurred respectively.
Ofcom set out its conclusions in the Regulatory Financial Reporting Final Statement it issued on 20 May 2014 that, in preparing the RFS, BT shall comply with the RAP, including the requirement for consistency with regulatory decisions.
This requirement is reiterated in the RAP amended by Ofcom’s SMP conditions imposed following market reviews, most recently, SMP condition 7.8 set out in Annex 1 of the 2018 WBA Statement.
2.1.3 Documentation and Application of the Regulatory Accounting Framework
In adhering to the RAP, we prepare and annually update our methodology documentation, the AMD. This document covers:
• Attribution Methods - we explain how we attribute revenue, transfer charges, costs, assets and liabilities to activities.
• Transfer Charge System Methodology - we explain our approach to transfer charges within our regulatory costing system (CostPerform).
• No Undue Discrimination - we demonstrate an equivalent treatment for internal and external CPs. For each reported market, we disclose the average price of services sold to external CPs and the average price sold to internal CPs. Where a reported market is required to buy input services from an upstream reported market, the cost is shown as an Equivalence of Input (EOI) charge.
• Accounting Policies - the way we apply the requirements of the Companies Act 2006, Article 4 of the International Accounting Standards (IAS) Regulation, and our accounting policies, in line with the RAP. The AMD details the accounting policies adopted in preparing the underlying financial information.
• Long Run Incremental Cost (LRIC) Methodology - the long run incremental cost principles, procedures and processes form the framework we use to calculate long run incremental costs and standalone costs.
• Current Cost Accounting (CCA) - we prepare the RFS under the Financial Capital Maintenance (FCM) convention in accordance with the principles set out in the handbook “Accounting for the Effects of Changing Prices”, published in 1986 by the Accounting Standards Committee. Under the FCM convention, we include changes in asset values in the RFS income statement as unrealised holding gains or losses. The CCA section also includes the Regulatory Asset Valuation (RAV) where Ofcom has directed an alternative methodology for valuing parts of the local access network.
• Usage Factors - we use usage factors in our costing methodology to reflect the different usage of network components by services.
In addition to the AMD, we also publish a Wholesale Catalogue, which separately identifies and describes services which are internally, externally, or both internally and externally supplied, and those which are used in the course of supplying other wholesale services.
The product and geographic markets defined by Ofcom’s Final Statements do not correspond to how the Group is organised for management and accounting purposes. The RFS are therefore produced by overlaying the requirements of the regulatory reporting framework on the management and accounting structure of the Group.
We reconcile the RFS to BT’s statutory accounts (in Section 5 of this report) and we explain any differences.

Section 2 – Basis of Preparation
Page 12
For the purposes of the RFS, we calculate Fully Allocated Cost (FAC) for our network components including a Return on Mean Capital Employed (MCE) attributed to that component.Due to the complex nature of the RFS, figures in this report are individually rounded to the nearest relevant unit (e.g. £m or £0.1m). For values of less than £50,000 these round to a 0, and where there is no value this is shown as “-”. Totals and sub-totals are calculated based on these rounded figures and percentages are based on unrounded figures. Where required by the Final Statements, rounding differences are shown on each individual schedule. Where rounding differences are not shown minor summation inconsistencies may arise between schedules.
2.1.4 Final Statements set out by Ofcom:
Below are the Final Statements setting out the legal directions relevant to the RFS for the year ended 31 March 2019:
• Regulatory Financial Reporting Final Statement 20 March 2019
• Wholesale Broadband Access Market Review Statement 31 July 2018
• Wholesale Local Access Market Review Statement 28 March 2018
• Narrowband Market Review Statement 30 November 2017
• Business Connectivity Market Review 2016 Revocation of certain measures imposed in the business connectivity markets 23 November 2017
• Business Connectivity Markets Temporary SMP conditions in relation to business connectivity services 23 November 2017
• Business Connectivity Market Review Statement 28 April 2016
2.1.5 Changes to BT’s Financial Reporting Obligations
Implementation of the Regulatory Financial Reporting Final Statement (RFR 2019) – See Change Control Notification 2019 (the “CCN 2019”) reference 3.01
This review directed changes to schedules presented in the RFS and the removal of others. Section 5 of this RFS includes the Performance Summary by Market; Attribution of Wholesale Current Costs and BT Group Reconciliation.
Information included in the 2018 RFS Section 6 - Openreach Information has been combined to be included in Section 5.
To ensure compliance with the financial reporting obligations of the Commitments, Openreach information has been incorporated in the schedules which detail Attribution of Wholesale Current Costs and the Performance Summary by Market.
Implementation of the WBAMR 2018 - See CCN 2019 reference 3.02
This market review has revised geographic boundaries classifying exchanges as WBA Market A or B, to reflect where we have SMP. These are the exchanges and proportion of UK premises, without accounting for “committed” planned LLU and Fibre roll out, in Market A will represent 0.9% of the overall market. The Point of Handover adjustment, that relates to cabinets held in Market B associated with a ‘child’ exchange located in Market A, will no longer be required as the majority of exchanges will now be in Market B. There have also been a number of presentational changes to our reporting including:
• Market summary: we have only reported services that have both total revenue in excess of £5m and EOI costs of £1m. The remaining services will be aggregated into 'Other WBA (Market A)'.
• Calculation of FAC summary: will no longer be disclosed.
• EOI summary: Will only report inputs that have total revenue in excess of £1m. The remaining EOI inputs will be aggregated into a new service ‘EOI Other'.
Implementation of the NMR 2017 - See CCN 2019 reference 3.03
Ofcom's Narrowband Market Review, dated 20 November 2017 directed changes to ISDN2 and ISDN30, requiring the revised renaming of several services.
The impact of the market restructures are shown in Appendix 3.1.3.
Implementation of the WLAMR 2018 - See CCN 2019 reference 3.04
Ofcom's WLA Market Review, dated 28 March 2018, directs changes in our reporting at the service level. We will present service level information for GEA 40/10 services previously included in Other WLA. SMPF services will no longer be reported and will be included in Other WLA.
The impact of the market restructures are shown in Appendix 3.1.3.
2.1.6 Comparability of Current and Prior Year Results
The 2018/19 results are prepared in accordance with the AMD issued on 31 July 2019. The restated comparatives for the year ended 31 March 2018 reflect methodology changes listed in the CCN 2019 as summarised in section 3.1.4 of Appendix 3, and all known errors above

Section 2 – Basis of Preparation
Page 13
Ofcom’s defined materiality threshold as described in section 3.1.5 of Appendix 3. The impact of these changes is shown in Appendix 3.1.4 on pages 126-131.
IFRS 15 ‘Revenue from Contracts with Customers’
IFRS 15 sets out the requirements for recognising revenue and costs from contracts with customers. The Annual Report details the adoption of IFRS 15, we have chosen to adopt on a modified retrospective basis. This means the new standard has only been applied to contracts in progress but not completed at 1 April 2018 and prior year comparatives have not been restated.
The impact of IFRS 15 in the RFS is due to changes in the way we account for connections revenue. Previously, the group recognised connections revenue upon performance of the connection activity. Under IFRS 15, connections revenue is deferred and recognised on a straight-line basis over the associated line/circuit contractual period. This means that revenue and costs are recognised later. The largest impact is seen in our Business Connectivity and Wholesale Local Access markets.
2.1.7 Adoption of the Commitments
In 2018 we fulfilled the Commitments we gave to Ofcom following its Digital Communications Review. Ofcom was broadly satisfied with our progress, including the incorporation of Openreach Ltd as a wholly owned subsidiary of BT plc, with its own board and greater strategic independence, and completing the TUPE transfer into the new Openreach Ltd of 31,000 employees from BT plc. Our next priority is to fulfil our commitment to make information sharing between BT and Openreach more transparent.
In June and November 2018 Ofcom published reports on progress towards delivering a more independent Openreach, in which it updated on its view of steps taken towards implementing the legal separation of Openreach Limited from BT Group. In the most recent report, Ofcom stated that it remained “broadly satisfied with progress” and that “significant progress has been made and the Commitments have now been fully implemented in BT and Openreach.” Ofcom has published a full compliance report in June 2019 covering the period April 2018 to March 2019.

Section 3 – Statement of Responsibility
Page 14
Section 3Statement of Responsibility

Section 3 – Statement of Responsibility
Page 15
3.1 Statement of ResponsibilityBritish Telecommunications plc (the “Company”) is required to prepare the RFS in accordance with the Final Statements as described in Section 2.1.4 ‘Final Statements set out by Ofcom’.
The RFS include comparative information for the year ended 31 March 2018 originally published on 31 July 2018 (the “2018 RFS”). The 2018 RFS were subsequently subject to certain restatements and re-presentations detailed in section 2.1.6. The Reconciliation Report (Appendix 3) provides additional detail on the impact of these methodology changes and errors identified subsequent to publishing the 2018 RFS.
The directors confirm to the best of their knowledge that the RFS for the year ended 31 March 2019 have been prepared in accordance with the requirements of the Final Statements, the Accounting Methodology Document (“AMD”) and Wholesale Catalogue issued on 31 July 2019 and in accordance with the RAP.
The directors confirm to the best of their knowledge that the comparative information for the year ended 31 March 2018 included in the RFS have been prepared in accordance with the requirements of the Final Statements and the AMD issued on 31 July 2018 subject to certain restatements and re-presentations as detailed in Appendix 3.1.1 and 3.1.3.
The directors are responsible for the maintenance and integrity of the corporate and financial information included on the Company’s website. Legislation in the United Kingdom governing the preparation and dissemination of financial statements may differ from legislation in other jurisdictions.
Openreach
The Company is also required in accordance with the Commitments to separately report the financial results of Openreach within the RFS as explained in Section 1.1.
The Commitments require the Company to report the financial results of Openreach, including the following:
• Openreach financial information such as headline revenue, operating costs disaggregated by major cost category, depreciation, revenues broken down into the broad product groups that Openreach Business Unit provides and further split between internal and external sales, and separately identified payments to other parts of BT for products that form inputs to Openreach Business Unit products (eg electronics); and
• Reconciliation of Openreach’s revenue, operating profit and return or profit before tax (and other such items as agreed between the Company and Ofcom) with financial information about Openreach shown in BT’s Annual Report.
The Openreach Financial Statements can be found in Section 5 and include comparative information for the year ended 31 March 2018. These comparatives were subject to certain restatements and representations detailed in Appendix 3.1.1 and 3.1.3.
The form, content and basis of preparation of the financial results of Openreach follow those used in the preparation of the RFS as described above, except where differences are agreed with Ofcom.
The directors confirm to the best of their knowledge that the Openreach Financial Statements for the year ended 31 March 2019, have been prepared in accordance with the AMD and Wholesale Catalogue issued on 31 July 2019, and comply with the requirements of the Commitments issued on 1 October 2018.
The directors confirm to the best of their knowledge that the comparative information for the Openreach Financial Statements for the year ended 31 March 2018 included in the RFS, have been prepared in accordance with the requirements of the Final Statements and the AMD issued on 31 July 2018, subject to certain restatements and re-presentations as detailed in Appendix 3.1.1 and 3.1.3, and comply with the requirements of the Commitments issued on 1 October 2018.
Approved by the Board of Directors and signed on its behalf by:
Simon Lowth
Director, British Telecommunications plc
31 July 2019
Section 4 – Audit Report
Page 16
Section 4Audit Report
Section 4 – Audit Report
Page 17
4.1 Report of Independent Auditors
Independent auditors’ report to the directors of British Telecommunications plc and Ofcom issued in accordance with the Final Statements as set out below
Opinions
We have audited the non-statutory financial statements of the Company (for the year ended 31 March 2019) which are set out on pages 1 to 139 of the attached report titled Regulatory Financial Statements (the “Regulatory Financial Statements”) as specified in Ofcom’s Final Statements (the “Final Statements”) as described in paragraph 2.1.4 above. These Regulatory Financial Statements are prepared in accordance with the Accounting Methodology Document (“AMD”) and the Wholesale Catalogue (“WC”).
We have audited the information in respect of the Market Financial Statements, Openreach (the “Openreach Information”) and the impact of methodology changes and errors (the “Reconciliation Report”), which we refer to as the 2019 Financial Statements, contained within the Regulatory Financial Statements 2019.
The Market Financial Statements comprise the following statements for the year ended 31 March 2019 for the Markets listed on page 4:
a) the Summary of Market Performance on pages 21 to 42; and
b) the related notes comprising the Basis of Preparation on pages 10 to 13, the individual market summaries and individual market calculations of Fully Allocated Cost based on component costs and usage factors on pages 43 to 107, and Appendix 1 on pages 108 to 114.
The Market Financial Statements include the statements of financial performance for each of the following market groups for the year ended 31 March 2019 shown within the Performance Summary by Market on page 22:
• Wholesale Local Access;
• Business Connectivity Markets;
• Narrowband Markets; and
• Wholesale Broadband Access (Market A).
The Market Financial Statements also include the statements of financial performance for each market for the year ended 31 March 2019 shown within the Performance Summary by Market on page 22, including those listed below on which we express an opinion (the “PPIA Markets”):
• Wholesale local access services (“WLA”);
• Low Bandwidth Contemporary Interface Symmetric Broadband Origination – Rest of UK (“Low Bandwidth CISBO Rest of UK”);
• Low Bandwidth Traditional Interface Symmetric Broadband Origination (“Low Bandwidth TISBO”);
• Wholesale fixed analogue exchange line services (“WFAEL”);
• Wholesale ISDN30 exchange line services (“ISDN30”);
• Fixed Call Origination;
• Fixed Geographic Call Termination; and
• Wholesale Broadband Access (Market A) (“WBA – Market A”).
For the avoidance of doubt, we do not express audit opinions in respect of the statements of financial performance for Low Bandwidth CISBO Combined Geographic, Wholesale ISDN 2 Exchange Line Services (“ISDN 2”) or Technical areas (DLE Interconnect Circuits) for the year ended 31 March 2019 shown within the Performance Summary by Market on page 22.
The Openreach Information comprises information relating to income, MCE and reconciliation statements for Openreach for the year ended 31 March 2019, separately reported in the Summary of Market Performance on pages 21 to 42:
The Regulatory Financial Statements for the year ended 31 March 2019 are prepared by British Telecommunications plc (the “Company”) to comply with the Final Statements, and in accordance with the Company’s Accounting Methodology Documents and the Wholesale Catalogue dated 31 July 2019 and in respect of the Openreach information in accordance with the Commitments agreed between the Company and Ofcom dated 1st October 2018 (the “Commitments”).
The 2019 Financial Statements include comparative information for the year ended 31 March 2018 first published on 31 July 2018 which has been restated and re-presented by the Company to comply with the Final Statements, and in accordance with the Company’s Accounting Methodology Documents and the Wholesale Catalogue dated 31 July 2018 as amended, where applicable, in accordance with “Comparability of current and prior year results” on pages 12 and 13. This comparative information includes the restated Performance Summary by Market on page 23 (the “Restated Market Financial Statements”).

Section 4 – Audit Report
Page 18
The Reconciliation Report in Appendix 3 shows the impact of methodology changes and errors on revenues, costs and MCE.
Nb. As set out on page 11, BT follows Ofcom’s Regulatory Accounting Principles (“RAP”), by preparing and annually updating its methodology documentation, the AMD. Ofcom is notified about any changes to the AMD annually, as part of the Network Change Control Notification (NCCN) process, the documentation of which we review.
In our opinion:
a) the Financial Statements as a whole, each of the Financial Statements and the Market Summary Statements for each of the PPIA Markets for the year ended 31 March 2019 have been properly prepared in all material respects in accordance with the procedures defined in the Accounting Methodology Documents and the Wholesale Catalogue dated 31 July 2019 and comply with the disclosure requirements of the Final Statements;
b) the Openreach Information for the year ended 31 March 2019 has been properly prepared in all material respects in accordance with the procedures defined in the Accounting Methodology Documents and the Wholesale Catalogue dated 31 July 2019 and complies with the disclosure requirements of the Commitments and the Final Statements;
c) the Restated Financial Statements as a whole have been properly prepared in all material respects in accordance with the procedures defined in the Accounting Methodology Documents and the Wholesale Catalogue dated 31 July 2018 as amended, where applicable, in accordance with “Comparability of current and prior year results” on pages 12 and 13 and comply with the disclosure requirements of the Final Statements.
d) for the 2019 Reconciliation Report, all Material Changes were included in the Change Control Notification, the description of each of the Material Changes provided by BT in the Change Control Notification is accurate, BT included each and every Material Change in the reconciliation report and correctly calculated the impact of all changes presented in the Regulatory Financial Statements, the description of each of the Material Errors provided by BT in the reconciliation report is accurate; and
e) the Corrected Previous Year Figures set out in the reconciliation report are properly prepared in accordance with the Accounting Methodology Documents for the
previous Financial Year had these Accounting Methodology Documents not included these Material Errors,
f) the 2018 Error Correction schedule as a whole has been properly prepared in accordance with the Accounting Methodology Document and the Wholesale Catalogue dated 31 July 2018 including correction of the identified errors described in Appendix 3 to the Regulatory Financial Statements on page 132 (the “2018 Basis of Preparation”).
Basis for opinion
We conducted our audit in accordance with International Standards on Auditing (UK) (“ISAs (UK)”), including ISA (UK) 800, and applicable law. Our responsibilities under ISAs (UK) are further described in the Auditors’ responsibilities for the audit of the Financial Statements section of our report. We believe that the audit evidence we have obtained is sufficient and appropriate to provide a basis for our opinion.
KPMG LLP audited the Statutory Financial Statements of BT Group plc (the “Statutory Financial Statements”), which includes British Telecommunications plc, for the year ended 31 March 2019 on which it expressed an unmodified audit opinion, and PWC LLP audited the Statutory Financial Statements for the year ended 31 March 2018 on which it expressed an unmodified audit opinion. These audit reports on the Statutory Financial Statements describe the scope of their audits of those Statutory Financial Statements. In conducting our subsequent audit of the 2019 Financial Statements, and in providing the opinions above, we have not performed any additional tests of the transactions and balances which are recorded in the general ledgers and other accounting records beyond those already performed for the purpose of the audits of the Statutory Financial Statements.
Independence
We remained independent of BT Group plc and its subsidiaries (“the Group”) in accordance with the ethical requirements that are relevant to our audit of the 2019 Financial Statements in the UK, which includes the FRC’s Ethical Standard, as applicable to listed public interest entities, and we have fulfilled our other ethical responsibilities in accordance with these requirements.
Emphasis of matter – Basis of preparation
In forming our opinions on the 2019 Financial Statements, which are not modified, we draw attention to the fact that the Regulatory Accounts have been prepared in accordance with a special purpose framework for the Directors and Ofcom for the specific purpose as described

Section 4 – Audit Report
Page 19
in the ‘Use of this report’ paragraph below. The nature, form and content of the Regulatory Financial Statements are determined by Ofcom. It is not appropriate for us to assess whether the nature of the information being reported upon is suitable for Ofcom’s purposes.
The Regulatory Financial Statements are separate from the statutory financial statements of BT Group and have not been prepared on the basis of IFRS or UK GAAP, and therefore do not necessarily represent a true and fair view of the financial position of the company.
Conclusions relating to going concern
We have nothing to report in respect of the following matters in relation to which ISAs (UK) require us to report to you when:
a) the directors’ use of the going concern basis of accounting in the preparation of the 2019 Financial Statements is not appropriate; or
b) the directors have not disclosed in the 2019 Financial Statements any identified material uncertainties that may cast significant doubt about the Group’s ability to continue to adopt the going concern basis of accounting for a period of at least twelve months from 9 May 2019, the date when the Statutory Financial Statements for the year ended 31 March 2019 were authorised for issue.
Because not all future events or conditions can be predicted, this statement is not a guarantee as to the Group’s ability to continue as a going concern.
Reporting on other information
The other information comprises all of the information in the Regulatory Financial Statements 2019 other than the 2019 Financial Statements and our auditors’ report thereon.
The directors are responsible for the other information. Our opinion on the 2019 Financial Statements does not cover the other information and, accordingly, we do not express an audit opinion or any form of assurance thereon.
In connection with our audit of the 2019 Financial Statements, our responsibility is to read the other information and, in doing so, consider whether the other information is materially inconsistent with the 2019 Financial Statements or our knowledge obtained in the audit, or otherwise appears to be materially misstated. If we identify an apparent material inconsistency or material misstatement, we are required to perform procedures to conclude whether there is a material misstatement of the 2019 Financial Statements or a material misstatement of the other information. If, based on the work we have performed, we conclude that there is a
material misstatement of this other information, we are required to report that fact. We have nothing to report based on these responsibilities.
Responsibilities for the financial statements and the audit
Responsibilities of the directors for the financial statements
As explained more fully in the Directors’ Statement of Responsibility set out on page 15, the directors are responsible for the preparation of the Regulatory Financial Statements under the current cost convention in accordance with:
a) Ofcom’s Final Statements, as set out in Section 2 of this document; and
b) the Company’s Accounting Methodology Documents and the Wholesale Catalogue dated 31 July 2019.
The Directors are also responsible for the preparation of the Openreach Information under the current cost convention in accordance with:
• the Commitments;
• the Final Statements; and
• the Company’s Accounting Methodology Documents and the Wholesale Catalogue dated 31 July 2019.
The directors are also responsible for the preparation of the Reconciliation Report under the current cost convention in accordance with:
• the Final Statements;
• in respect of information for the year ended 31 March 2019, the 2019 Basis of Preparation; and
• in respect of information for the year ended 31 March 2018, the 2018 Basis of Preparation.
As explained in the “Basis of Preparation” on pages 10 to 13 the Company has, by agreement with BT Group plc, its ultimate parent company, prepared the 2019 Financial Statements by disaggregating balances recorded in the general ledgers and other accounting records of the Group maintained in accordance with the Companies Act 2006 and used, in accordance with that Act, for the preparation of the Statutory Financial Statements for the years ended 31 March 2019 and 31 March 2018.
The Directors are also responsible for determining that the basis of preparation is acceptable in the circumstances and also for such internal control as they determine is necessary to enable

Section 4 – Audit Report
Page 20
the preparation of 2019 Financial Statements that are free from material misstatement, whether due to fraud or error.
In preparing the 2019 Financial Statements, the directors are responsible for assessing the Group’s ability to continue as a going concern, disclosing as applicable matters related to going concern, and using the going concern basis of accounting unless the directors either intend to liquidate the Group or to cease operations, or have no realistic regard the directors’ assessment was made for the purposes of the preparation of the Statutory Financial Statements approved on 9 May 2019 and, therefore, covers a period of at least, but not limited to, twelve month period from that date.
Auditors’ responsibilities for the audit of the financial statements
Our objectives are to obtain reasonable assurance about whether:
a) the Market Financial Statements as a whole, each of the Market Group Statements, the statements of financial performance for each of the PPIA Markets and the Openreach Information are properly prepared in all material respects in accordance with the procedures defined in the Accounting Methodology Documents and Wholesale Catalogue dated 31 July 2019 and comply with the disclosure requirements of the Final Statements and in respect of the Openreach Information, the Commitments.
b) the restated Market Financial Statements as a whole for the year ended 31 March 2018 are properly prepared in all material respects in accordance with the procedures defined in the Accounting Methodology Documents and Wholesale Catalogue dated 31 July 2018 subject to the changes described in “Comparability of current and prior year results” on pages 12 and 13, and comply with the disclosure requirements of the Final Statements.
c) the 2019 Methodology Change Schedule as a whole is properly prepared in accordance with the 2019 Basis of Preparation and complies with the disclosure requirements of the Final Statements; and
d) the 2018 Error Correction schedule as a whole is properly prepared in accordance with the 2018 Basis of Preparation and complies with the disclosure requirements of the Final Statements.
Reasonable assurance is a high level of assurance, but is not a guarantee that an audit conducted in accordance with ISAs (UK) will always detect a material misstatement when it exists. Misstatements can arise from fraud or error and are considered material if, individually
or in the aggregate, they could reasonably be expected to influence the economic decisions of users taken on the basis of these 2019 Financial Statements. In this regard, we have used a quantitative materiality threshold of 2 - 3% of the total revenues or costs of each PPIA Market and Market Group for the purposes of planning and performing our audit.
We also report our opinion as to whether, in the course of conducting our audit, we have become aware of any material changes in costing methodologies used in the preparation of the 2019 Financial Statements compared with the costing methodologies applied in the preparation of the 2018 Financial Statements which were not included in the description of methodology changes published by the Company in the Change Control Notification. Further we read each of the papers approved by the Company’s Accounting Separation Improvement Group (“ASIG”) in the period 1 August 2018 to 31 July 2019 and report any methodology changes expected by management to have a material impact on the 2019 Financial Statements which were approved by the ASIG for use in the preparation of the 2019 Financial Statements for the year ended 31 March 2019 but not included in the description of methodology changes published by the Company in the Change Control Notification.
Use of this report
This report, including the opinion, has been prepared for and only for the directors and for Ofcom for the purposes of meeting the Company’s obligations under the Final Statements in accordance with our engagement letter with the Company and Ofcom dated 12 March 2018 and for no other purpose. We do not, in giving this opinion, accept or assume responsibility for any other purpose or to any other person to whom this report is shown or into whose hands it may come, including without limitation under any contractual obligations of the Company, save where expressly agreed by our prior consent in writing.
The engagement partner on the audit resulting in this independent auditors’ report is Antony Cates.
KPMG LLP
Chartered Accountants
London
31 July 2019
Section 5 – Summary of Market Performance
Page 21
Section 5Summary of Market Performance

Section 5 – Summary of Market Performance
Page 22
Performance Summary by Market or Technical Area For the year ended 31 March 2019
Section Internal
Revenue ExternalRevenue
Total Revenue
Operating Costs Depreciation
Holding (gain)/loss
Supp. Dep.
Other CCA Adjs. Roundings
Total CCA Operating
Costs Return
Mean Capital
Employed Return on
MCE £m £m £m £m £m £m £m £m £m £m £m £m %
Openreach WLA 6.1 858 1,495 2,353 1,186 546 (120 ) 93 (2 ) - 1,703 650 6,077 10.7 %
Business Connectivity Markets
Low Bandwidth CISBO Rest of UK 7.1 291 208 499 227 200 (35 ) 39 (1 ) - 430 69 1,980 3.5 %Low Bandwidth CISBO Combined Geographic 7.2 15 13 28 9 8 (1 ) 1 0 - 17 11 63 16.8 %
Narrowband Markets
WFAEL 8.1 1,243 371 1,614 717 407 (107 ) 112 4 - 1,133 481 4,518 10.6 %ISDN2 8.2 32 47 79 27 12 (3 ) 3 1 - 40 39 125 31.8 %ISDN30 8.3 60 76 136 52 22 (3 ) 3 0 1 75 61 195 31.1 %
Total Openreach SMP Markets 2,499 2,210 4,709 2,218 1,195 (269 ) 251 2 1 3,398 1,311 12,958 10.1 %
Openreach Residual 260 106 366 63 120 (17 ) 23 (1 ) - 188 178 801 22.3 %Total Openreach 2,759 2,316 5,075 2,281 1,315 (286 ) 274 1 1 3,586 1,489 13,759 10.8 % Rest of BT Business Connectivity Markets
Low Bandwidth TISBO 7.3 74 48 122 69 30 (3 ) 4 (0 ) - 100 22 217 10.3 % Narrowband Markets
Fixed Call Origination 108 30 138 70 18 (2 ) 2 1 - 89 49 147 33.6 %Fixed Geographic Call Termination 8.4 3 6 9 66 19 (2 ) 2 1 - 86 (77 ) 143 (54.0 )%Technical Areas (DLE Interconnect Circuits) 8.5 - 6 6 3 1 (0 ) 0 0 - 4 2 6 22.0 %
WBA (Market A) 9.1 99 3 102 37 16 (2 ) 3 (0 ) - 54 48 131 37.0 % Total Rest of BT SMP Markets 284 93 377 245 84 (9 ) 11 2 - 333 44 644 6.9 %
Rest of BT Residual 1,922 21,018 22,940 19,126 2,126 (12 ) 18 (1 ) - 21,257 1,683 20,692 8.1 %Total Rest of BT 2,206 21,111 23,317 19,371 2,210 (21 ) 29 1 - 21,590 1,727 21,336 8.1 %
Eliminations (4,966 ) - (4,966 ) (5,026 ) (45 ) 11 (15 ) 1 - (5,074 ) 108 (503 ) - Roundings 1 1 2 - 1 1 (1 ) - (1 ) - 2 1 -
Total Markets - 23,428 23,428 16,626 3,481 (295 ) 287 3 - 20,102 3,326 34,593 9.6 %
Total SMP Markets 2,783 2,303 5,086 2,463 1,279 (278 ) 262 4 1 3,731 1,355 13,602 10.0 %
Section 5 – Summary of Market Performance
Page 23
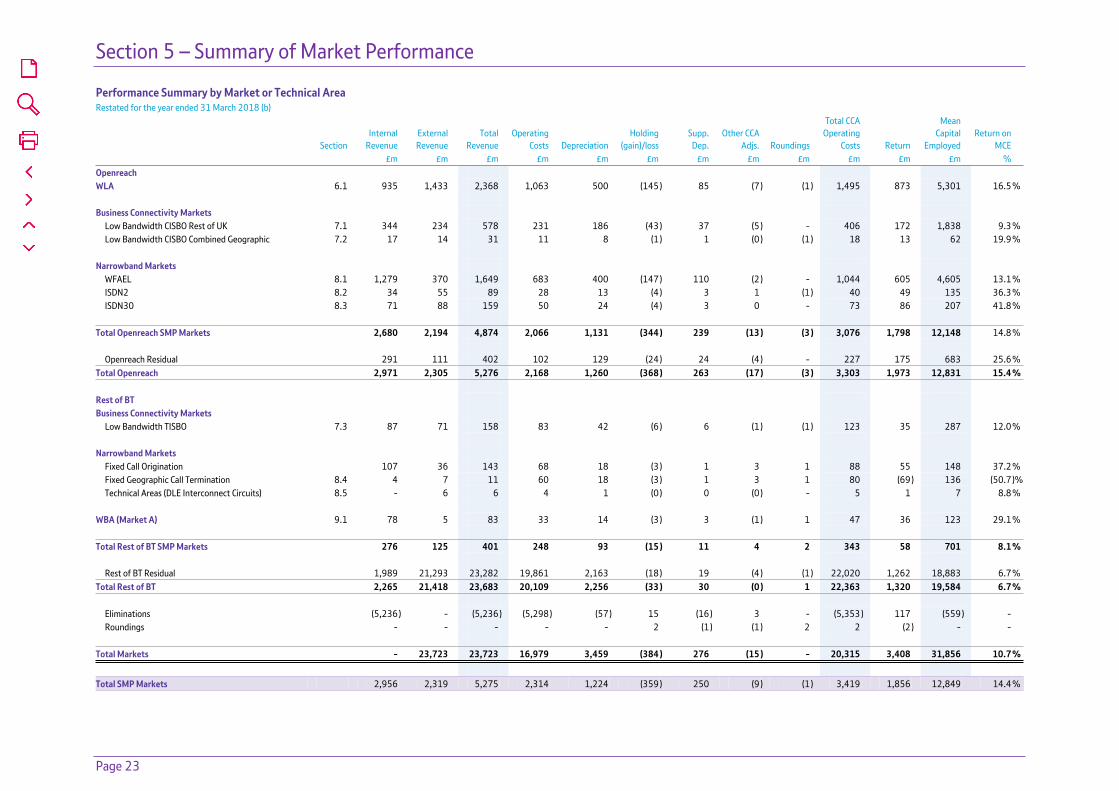
Performance Summary by Market or Technical Area Restated for the year ended 31 March 2018 (b)
Section Internal
Revenue ExternalRevenue
Total Revenue
Operating Costs Depreciation
Holding (gain)/loss
Supp. Dep.
Other CCA Adjs. Roundings
Total CCA Operating
Costs Return
Mean Capital
Employed Return on
MCE £m £m £m £m £m £m £m £m £m £m £m £m %
Openreach WLA 6.1 935 1,433 2,368 1,063 500 (145 ) 85 (7 ) (1 ) 1,495 873 5,301 16.5 %
Business Connectivity Markets
Low Bandwidth CISBO Rest of UK 7.1 344 234 578 231 186 (43 ) 37 (5 ) - 406 172 1,838 9.3 %Low Bandwidth CISBO Combined Geographic 7.2 17 14 31 11 8 (1 ) 1 (0 ) (1 ) 18 13 62 19.9 %
Narrowband Markets
WFAEL 8.1 1,279 370 1,649 683 400 (147 ) 110 (2 ) - 1,044 605 4,605 13.1 %ISDN2 8.2 34 55 89 28 13 (4 ) 3 1 (1 ) 40 49 135 36.3 %ISDN30 8.3 71 88 159 50 24 (4 ) 3 0 - 73 86 207 41.8 %
Total Openreach SMP Markets 2,680 2,194 4,874 2,066 1,131 (344 ) 239 (13 ) (3 ) 3,076 1,798 12,148 14.8 %
Openreach Residual 291 111 402 102 129 (24 ) 24 (4 ) - 227 175 683 25.6 %Total Openreach 2,971 2,305 5,276 2,168 1,260 (368 ) 263 (17 ) (3 ) 3,303 1,973 12,831 15.4 % Rest of BT Business Connectivity Markets
Low Bandwidth TISBO 7.3 87 71 158 83 42 (6 ) 6 (1 ) (1 ) 123 35 287 12.0 % Narrowband Markets
Fixed Call Origination 107 36 143 68 18 (3 ) 1 3 1 88 55 148 37.2 %Fixed Geographic Call Termination 8.4 4 7 11 60 18 (3 ) 1 3 1 80 (69 ) 136 (50.7 )%Technical Areas (DLE Interconnect Circuits) 8.5 - 6 6 4 1 (0 ) 0 (0 ) - 5 1 7 8.8 %
WBA (Market A) 9.1 78 5 83 33 14 (3 ) 3 (1 ) 1 47 36 123 29.1 % Total Rest of BT SMP Markets 276 125 401 248 93 (15 ) 11 4 2 343 58 701 8.1 %
Rest of BT Residual 1,989 21,293 23,282 19,861 2,163 (18 ) 19 (4 ) (1 ) 22,020 1,262 18,883 6.7 %Total Rest of BT 2,265 21,418 23,683 20,109 2,256 (33 ) 30 (0 ) 1 22,363 1,320 19,584 6.7 %
Eliminations (5,236 ) - (5,236 ) (5,298 ) (57 ) 15 (16 ) 3 - (5,353 ) 117 (559 ) - Roundings - - - - - 2 (1 ) (1 ) 2 2 (2 ) - -
Total Markets - 23,723 23,723 16,979 3,459 (384 ) 276 (15 ) - 20,315 3,408 31,856 10.7 %
Total SMP Markets 2,956 2,319 5,275 2,314 1,224 (359 ) 250 (9 ) (1 ) 3,419 1,856 12,849 14.4 %

Section 5 – Summary of Market Performance
Page 24
5.2 Wholesale Sector CostsWe outline below a brief description of the sectors reported in the Attribution of Wholesale Current Cost Statement and the key drivers of these sectors. Further details of these sectors can be found in the AMD.
EOI Input Prices
Where Openreach provides services under an EOI obligation, these are provided on an equivalent basis to all customers. This means that BT provides, in respect of a particular product or service, the same product or service to all CPs (including BT) on the same timescales, terms and conditions (including price and service levels) by means of the same systems and processes.
Provision and Maintenance
Provision and Maintenance includes engineering pay and non-pay costs relating to network provisions, installation and maintenance of the network. The largest of these costs relates to distribution side copper maintenance which is apportioned to services on the basis of the number of lines, relative fault rates and service levels.
Network Support
Network Support contains costs of the activities necessary to support the running of BT’s network including time booked by engineers to non-operational activities. Most of these costs are apportioned using previously allocated engineers’ pay.

Section 5 – Summary of Market Performance
Page 25
General Support
General Support includes planning, development, supplies, transport, computing, customer service, personnel and administration, and other general support costs. The key drivers for the apportionment of General Support include activity surveys and previously allocated pay costs.
General Management
General Management includes operator services, costs of general management activities and other general expenses. The key drivers are pay costs and asset values.
Accommodation
Accommodation includes building rents, business rates, facilities management and utility bills. Accommodation costs are mainly apportioned based on the use of floor space and power consumption.
Other Costs
This includes other costs including finance and billing costs and bad debts other costs includes payments to other UK CPs, which are allocated to Rest of BT Residual.
Depreciation
Depreciation is analysed between land and buildings, access, switch, duct and transmission and other (including network power, computers and amortisation of software). The key drivers are engineering models and direct mapping of BT classes of work to network components and then onto the appropriate service based on usage factors and service volumes.

Section 5 – Summary of Market Performance
Page 26
Attribution of Wholesale Current Costs For the year ended 31 March 2019
EOI Input Prices Provision/
Maintenance Network Support General Support General
Management Accommodation Other Costs Total Operating
Costs £m £m £m £m £m £m £m £m
Openreach WLA - 372 185 215 262 128 24 1,186
Business Connectivity Markets
Low Bandwidth CISBO Rest of UK - 14 50 46 88 20 9 227 Low Bandwidth CISBO Combined Geographic - 1 1 2 4 1 0 9
Narrowband Markets
WFAEL - 188 109 138 163 91 28 717 ISDN2 - 5 3 3 5 9 2 27 ISDN30 - 11 5 7 10 15 4 52
Total Openreach SMP Markets - 591 353 411 532 264 67 2,218
Openreach Residual - 72 20 30 23 28 (110 ) 63 Total Openreach - 663 373 441 555 292 (43 ) 2,281 Rest of BT Business Connectivity Markets
Low Bandwidth TISBO - 13 5 6 12 27 6 69 Narrowband Markets
Fixed Call Origination - 6 2 3 14 38 7 70 Fixed Geographic Call Termination - 6 2 3 8 39 8 66 Technical Areas (DLE Interconnect Circuits) - 1 0 0 0 1 1 3
WBA (Market A) 14 3 2 2 4 10 2 37
Total Rest of BT SMP Markets 14 29 11 14 38 115 24 245
Rest of BT Residual 985 5 1 3,399 11,752 761 2,223 19,126 Total Rest of BT 999 34 12 3,413 11,790 876 2,247 19,371
Eliminations (5,026 )Roundings -
Total Markets - 680 380 3,846 12,332 1,157 (1,769 ) 16,626
Total SMP Markets 14 620 364 425 570 379 91 2,463

Section 5 – Summary of Market Performance
Page 27
Land and BuildingsDuct, Access Copper
and Access FibreSwitch and
Transmission Other Related Total DepreciationTotal HCA Operating
Costs Holding (gain)/loss Supp. Dep. Other CCA Adjs. RoundingsTotal CCA Operating
Costs£m £m £m £m £m £m £m £m £m £m £m
22 420 7 97 546 1,732 (120) 93 (2) - 1,703
3 109 67 21 200 427 (35) 39 (1) - 4300 3 3 2 8 17 (1) 1 0 - 17
11 348 12 36 407 1,124 (107) 112 4 - 1,1331 8 1 2 12 39 (3) 3 1 - 402 12 6 2 22 74 (3) 3 0 1 75
39 900 96 160 1,195 3,413 (269) 251 2 1 3,398
5 40 57 18 120 183 (17) 23 (1) - 188
44 940 153 178 1,315 3,596 (286) 274 1 1 3,586
4 12 10 4 30 99 (3) 4 (0) - 100
6 1 7 4 18 88 (2) 2 1 - 896 1 7 5 19 85 (2) 2 1 - 860 0 0 1 1 4 (0) 0 0 - 4
2 2 7 5 16 53 (2) 3 (0) - 54
18 16 31 19 84 329 (9) 11 2 - 333
71 18 488 1,549 2,126 21,252 (12) 18 (1) - 21,25789 34 519 1,568 2,210 21,581 (21) 29 1 - 21,590
(45) (5,071) (5,074) 1 1 -
131 953 661 1,736 3,481 20,107 (295) 287 3 - 20,102
57 916 127 179 1,279 3,742 (278) 262 4 1 3,731

Section 5 – Summary of Market Performance
Page 28
Attribution of Wholesale Current Costs Restated for the year ended 31 March 2018 (b)
EOI Input Prices Provision/
Maintenance Network Support General Support General
Management Accommodation Other Costs Total Operating
Costs £m £m £m £m £m £m £m £m
Openreach WLA - 337 150 217 233 108 18 1,063
Business Connectivity Markets
Low Bandwidth CISBO Rest of UK - 10 42 71 84 18 6 231 Low Bandwidth CISBO Combined Geographic - 0 1 4 4 1 1 11
Narrowband Markets
WFAEL - 188 99 136 148 87 25 683 ISDN2 - 5 3 4 5 9 2 28 ISDN30 - 11 5 7 10 15 2 50
Total Openreach SMP Markets - 551 300 439 484 238 54 2,066
Openreach Residual - 91 18 35 40 27 (109 ) 102 Total Openreach - 642 318 474 524 265 (55 ) 2,168 Rest of BT Business Connectivity Markets
Low Bandwidth TISBO - 17 6 7 14 32 7 83 Narrowband Markets
Fixed Call Origination - 6 2 3 12 37 8 68 Fixed Geographic Call Termination - 6 2 3 7 36 6 60 Technical Areas (DLE Interconnect Circuits) - 1 0 0 0 2 1 4
WBA (Market A) 12 3 1 1 4 10 2 33 Total Rest of BT SMP Markets 12 33 11 14 37 117 24 248
Rest of BT Residual 1,065 (657 ) 15 3,452 12,797 747 2,442 19,861
Total Rest of BT 1,077 (624 ) 26 3,466 12,834 864 2,466 20,109 Eliminations (5,298 )Roundings -
Total Markets - (1 ) 340 3,931 13,344 1,116 (1,751 ) 16,979
Total SMP Markets 12 584 311 453 521 355 78 2,314

Section 5 – Summary of Market Performance
Page 29
Land and BuildingsDuct, Access Copper
and Access FibreSwitch and
Transmission Other Related Total DepreciationTotal HCA Operating
Costs Holding (gain)/loss Supp. Dep. Other CCA Adjs. RoundingsTotal CCA Operating
Costs£m £m £m £m £m £m £m £m £m £m £m
29 380 9 82 500 1,563 (145) 85 (7) (1) 1,495
3 98 68 17 186 417 (43) 37 (5) - 4060 3 3 2 8 19 (1) 1 (0) (1) 18
11 340 15 34 400 1,083 (147) 110 (2) - 1,0441 8 1 3 13 41 (4) 3 1 (1) 402 12 6 4 24 74 (4) 3 0 - 73
46 841 102 142 1,131 3,197 (344) 239 (13) (3) 3,076
5 45 58 21 129 231 (24) 24 (4) - 227
51 886 160 163 1,260 3,428 (368) 263 (17) (3) 3,303
5 18 13 6 42 125 (6) 6 (1) (1) 123
6 1 8 3 18 86 (3) 1 3 1 886 1 8 3 18 78 (3) 1 3 1 800 0 1 0 1 5 (0) 0 (0) - 5
2 2 7 3 14 47 (3) 3 (1) 1 47
19 22 37 15 93 341 (15) 11 4 2 343
86 18 523 1,536 2,163 22,024 (18) 19 (4) (1) 22,020
105 40 560 1,551 2,256 22,365 (33) 30 (0) 1 22,363 (57) (5,355) (5,353) - - 2
154 898 707 1,700 3,459 20,438 (384) 276 (15) - 20,315
65 863 139 157 1,224 3,538 (359) 250 (9) (1) 3,419
Section 5 – Summary of Market Performance
Page 30
5.3 Wholesale Current Cost Mean Capital Employed
We outline below a brief description of the non-current assets sectors and working capital reported in the Attribution of Wholesale Current Cost Mean Capital Employed Statement and the key drivers of the sector. Further details of these sectors can be found in the AMD.
Land and BuildingsThis sector contains the asset values that are booked to BT Classes of Work (CoW) for land and buildings, including freehold, long leases and short leases. The sector includes corporate offices and network buildings owned by BT. Asset values are mainly apportioned based on the use of floor space.
Access - CopperThis sector contains the asset values for access copper (all the copper cables in the access network and all other necessary equipment required to carry signals between the user and the exchange). The key driver is direct mapping of CoW to network components and then onto the appropriate service based on usage factors and actual service volumes.
Access - FibreThis sector contains the asset values for access fibre. The key driver is the mapping of CoW to network components and then onto the appropriate service based on usage factors and actual service volumes.
DuctThis sector contains the asset values for duct. Duct is a pipe, tube or conduit through which underground cables are passed. The key driver is a duct model that allocates CoW to network cable components and then onto the appropriate service based on usage factors and actual service volumes.
SwitchThis sector contains the asset values for switching equipment. This equipment is located in BT exchanges. The key drivers are engineering models that allocate CoW to network components and then onto the appropriate service based on usage factors and actual service volumes.

Section 5 – Summary of Market Performance
Page 31
TransmissionThis sector contains the asset values for transmission. Transmission includes core transmission Synchronous Digital Hierarchy (SDH), Plesiochronous Digital Hierarchy (PDH), cables and repeaters. The core transmission is used to link exchanges. The key drivers are engineering inventories and models that allocate CoW to network components and then onto the appropriate service based on usage factors and service volumes.
OtherThis sector contains the asset values for a range of assets used by BT businesses including categories such as Software, Motor Transport and 21CN. The key drivers are surveys, engineering models and direct mapping of CoW to network components and then onto the appropriate service based on usage factors and actual service volumes.
Government Grants This sector includes receipt of government grant funding in relation to eligible capex spend that has been incurred and relates to; grant funded assets, received from a local or regional authority or from a devolved government body such as: Broadband Delivery UK (BDUK) grant funding received from the Department of Culture Media and Sport; and European Regional Development Fund (ERDF) grants. Allocation to FTTP and FTTC is based on capex.
Working CapitalWorking capital includes internal receivables and payables, external receivables and payables. Receivables and payables include an approximation of the internal “notional” receivables and payables that would be incurred if trades between BT’s business units were undertaken with a third party and at arm’s length. They are based upon the average trading terms of the Group’s external trade. Other working capital is attributed based on previously allocated costs and capex.

Section 5 – Summary of Market Performance
Page 32
Attribution of Wholesale Current Cost Mean Capital Employed For the year ended 31 March 2019
Land & Buildings Access - Copper Access - Fibre Duct Switch Transmission Other Less Government
Grants Total Non-
current Assets £m £m £m £m £m £m £m £m £m
Openreach WLA 218 1,846 1,973 2,231 17 13 308 (582 ) 6,024
Business Connectivity Markets
Low Bandwidth CISBO Rest of UK 27 0 930 693 - 260 66 - 1,976 Low Bandwidth CISBO Combined Geographic 1 0 31 16 - 12 3 - 63
Narrowband Markets
WFAEL 106 2,269 0 1,915 27 1 133 - 4,451 ISDN2 15 51 0 43 4 0 8 - 121 ISDN30 24 6 96 39 2 8 13 - 188
Total Openreach SMP Markets 391 4,172 3,030 4,937 50 294 531 (582 ) 12,823
Openreach Residual 54 52 183 518 0 202 57 - 1,066 Total Openreach 445 4,224 3,213 5,455 50 496 588 (582 ) 13,889 Rest of BT Business Connectivity Markets
Low Bandwidth TISBO 45 2 50 67 0 26 20 - 210 Narrowband Markets
Fixed Call Origination 61 0 0 32 11 11 23 - 138 Fixed Geographic Call Termination 63 0 0 33 11 12 24 - 143 Technical Areas (DLE Interconnect Circuits) 2 0 0 2 0 1 1 - 6
WBA (Market A) 22 0 0 58 - 21 24 - 125 Total Rest of BT SMP Markets 193 2 50 192 22 71 92 - 622
Rest of BT Residual 659 22 7 265 859 859 17,518 - 20,189
Total Rest of BT 852 24 57 457 881 930 17,610 - 20,811 Eliminations (505 )Roundings 3
Total Markets 1,270 4,236 3,214 5,588 932 1,371 18,169 (582 ) 34,198
Total SMP Markets 584 4,174 3,080 5,129 72 365 623 (582 ) 13,445

Section 5 – Summary of Market Performance
Page 33
Internal Current Assets External Current Assets Total Current AssetsInternal Current
LiabilitiesExternal Current
Liabilities Total Current LiabilitiesTotal Assets less
Current LiabilitiesProvisions for liabilities
and charges RoundingsTotal Mean Capital
Employed£m £m £m £m £m £m £m £m £m £m
155 470 625 - (536) (536) 6,113 (35) (1) 6,077
33 110 143 - (129) (129) 1,990 (10) - 1,9802 4 6 - (6) (6) 63 (0) - 63
106 227 333 - (244) (244) 4,540 (23) 1 4,5185 8 13 - (8) (8) 126 (1) - 1259 16 25 - (16) (16) 197 (2) - 195
310 835 1,145 - (939) (939) 13,029 (71) - 12,958
24 79 103 - (242) (242) 927 (127) 1 801
334 914 1,248 - (1,181) (1,181) 13,956 (198) 1 13,759
8 19 27 - (18) (18) 219 (3) 1 217
9 16 25 - (14) (14) 149 (2) - 1471 16 17 - (14) (14) 146 (2) (1) 1430 1 1 - (1) (1) 6 (0) - 6
7 8 15 (1) (7) (8) 132 (1) - 131
25 60 85 (1) (54) (55) 652 (8) - 644
(359) 8,198 7,839 1 (7,023) (7,022) 21,006 (314) - 20,692(334) 8,258 7,924 - (7,077) (7,077) 21,658 (322) - 21,336
(21) 20 (506) (503) (1) 1 3 1
- 9,150 9,150 - (8,237) (8,237) 35,111 (517) (1) 34,593
335 895 1,230 (1) (993) (994) 13,681 (79) - 13,602
Section 5 – Summary of Market Performance
Page 34
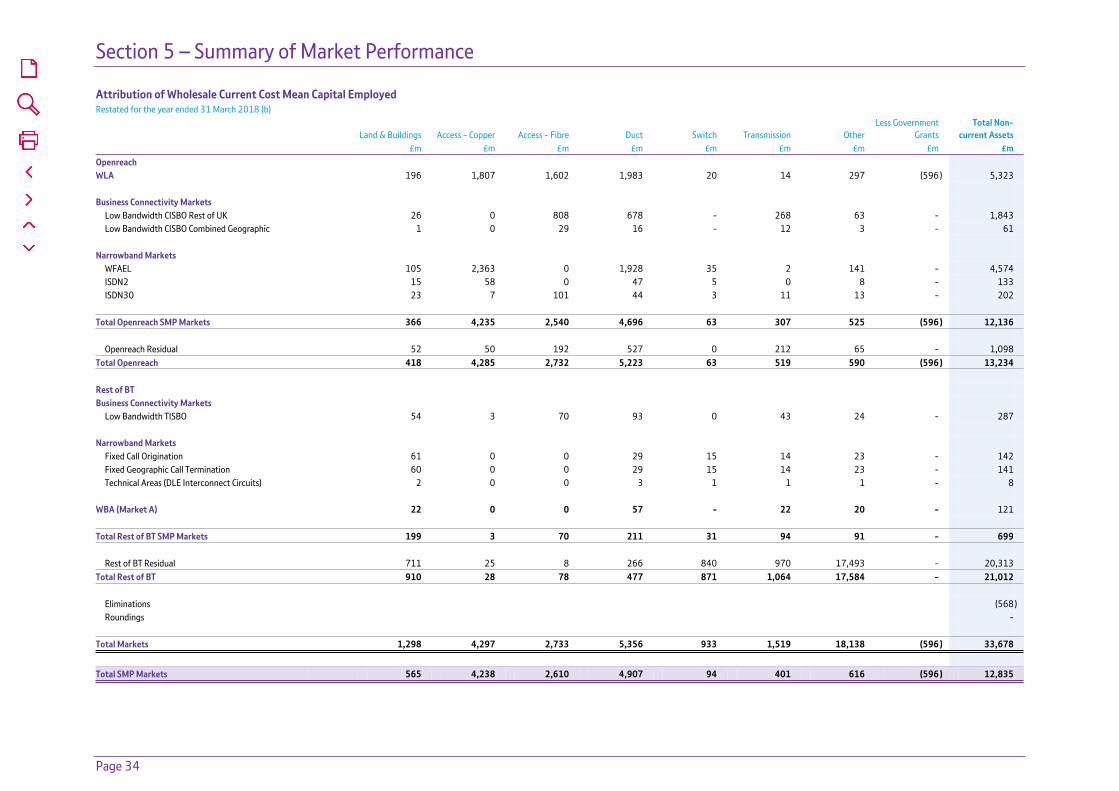
Attribution of Wholesale Current Cost Mean Capital Employed Restated for the year ended 31 March 2018 (b)
Land & Buildings Access - Copper Access - Fibre Duct Switch Transmission Other Less Government
Grants Total Non-
current Assets £m £m £m £m £m £m £m £m £m
Openreach WLA 196 1,807 1,602 1,983 20 14 297 (596 ) 5,323
Business Connectivity Markets
Low Bandwidth CISBO Rest of UK 26 0 808 678 - 268 63 - 1,843 Low Bandwidth CISBO Combined Geographic 1 0 29 16 - 12 3 - 61
Narrowband Markets
WFAEL 105 2,363 0 1,928 35 2 141 - 4,574 ISDN2 15 58 0 47 5 0 8 - 133 ISDN30 23 7 101 44 3 11 13 - 202
Total Openreach SMP Markets 366 4,235 2,540 4,696 63 307 525 (596 ) 12,136
Openreach Residual 52 50 192 527 0 212 65 - 1,098 Total Openreach 418 4,285 2,732 5,223 63 519 590 (596 ) 13,234 Rest of BT Business Connectivity Markets
Low Bandwidth TISBO 54 3 70 93 0 43 24 - 287 Narrowband Markets
Fixed Call Origination 61 0 0 29 15 14 23 - 142 Fixed Geographic Call Termination 60 0 0 29 15 14 23 - 141 Technical Areas (DLE Interconnect Circuits) 2 0 0 3 1 1 1 - 8
WBA (Market A) 22 0 0 57 - 22 20 - 121 Total Rest of BT SMP Markets 199 3 70 211 31 94 91 - 699
Rest of BT Residual 711 25 8 266 840 970 17,493 - 20,313
Total Rest of BT 910 28 78 477 871 1,064 17,584 - 21,012 Eliminations (568 )Roundings -
Total Markets 1,298 4,297 2,733 5,356 933 1,519 18,138 (596 ) 33,678
Total SMP Markets 565 4,238 2,610 4,907 94 401 616 (596 ) 12,835

Section 5 – Summary of Market Performance
Page 35
Internal Current Assets External Current Assets Total Current AssetsInternal Current
LiabilitiesExternal Current
Liabilities Total Current LiabilitiesTotal Assets less
Current LiabilitiesProvisions for liabilities
and charges RoundingsTotal Mean Capital
Employed£m £m £m £m £m £m £m £m £m £m
156 329 485 - (471) (471) 5,337 (34) (2) 5,301
38 53 91 - (86) (86) 1,848 (10) - 1,8382 2 4 - (4) (4) 61 (0) 1 62
108 137 245 - (191) (191) 4,628 (23) - 4,6056 5 11 - (8) (8) 136 (1) - 135
10 9 19 - (14) (14) 207 (2) 2 207
320 535 855 - (774) (774) 12,217 (70) 1 12,148
26 56 82 - (205) (205) 975 (292) - 683346 591 937 - (979) (979) 13,192 (362) 1 12,831
10 13 23 - (21) (21) 289 (3) 1 287
9 9 18 - (13) (13) 147 (2) 3 1481 9 10 - (12) (12) 139 (1) (2) 1360 1 1 - (1) (1) 8 (0) (1) 7
5 4 9 (1) (6) (7) 123 (1) 1 123
25 36 61 (1) (53) (54) 706 (7) 2 701
(373) 6,611 6,238 1 (7,542) (7,541) 19,010 (127) - 18,883(348) 6,647 6,299 - (7,595) (7,595) 19,716 (134) 2 19,584
(13) 19 (562) (559) 1 2 3 -
- 7,224 7,224 - (8,553) (8,553) 32,349 (494) 1 31,856
345 571 916 (1) (827) (828) 12,923 (77) 3 12,849

Section 5 – Summary of Market Performance
Page 36
5.4 Openreach InformationOpenreach Statements
In accordance with Section 20.5 and 20.6 of the Commitments, the RFS must separately present the financial results of Openreach and include a reconciliation of Openreach’s revenue, operating profit (and other items agreed between us and Ofcom) with Openreach’s financial information as shown in BT Group plc’s Annual Report.
The form, content and basis of preparation of the financial results of Openreach follow, to the fullest extent possible, those used in the preparation of the RFS. The reconciliation of this statement to the Openreach segmental financial information as shown in BT Group plc’s Annual Report is shown in the Income Statement below.
Reconciling Differences
The reconciling differences between the Openreach regulatory statement and the Openreach segmental financial information reported in BT Group plc’s Annual Report fall into the following main categories:
(a) Specific items
The group’s income statement and segmental analysis separately identifies trading results on an adjusted basis, being before specific items. Presentation of the group’s results in this way is relevant to understanding the group’s financial performance as specific items are those that, in management’s judgement, need to be disclosed by virtue of their size, nature or incidence. Examples of charges or credits that may be ‘specific items’ include acquisitions and disposals of businesses and investments, retrospective regulatory matters, historical insurance or litigation claims, business restructuring programmes, asset impairment charges and property rationalisation programmes.
(b) Rental charge to Openreach for use of assets owned by Technology
Within the Openreach segmental financial information reported in BT Group plc’s Annual Report, the results include a charge for an appropriate return on capital where assets are owned by Technology (e.g. for line cards, electronics and network features) but are used by Openreach. The Openreach regulatory statements do not include this charge, as the basis for attribution of costs and assets to products in the regulatory accounts is actual costs and assets.
(c) Results relating to Northern Ireland’s operations
The RFS have been prepared in accordance with the Final Statements imposed on BT where Ofcom has defined certain markets in which BT is deemed to have SMP in the UK. This definition includes BT’s Northern Ireland operations. The Openreach segmental financial information reported in BT Group plc’s Annual Report excludes BT’s operations in Northern Ireland. Accordingly, the results of the access network element of BT’s Northern Ireland operations form part of the reconciliation.
(d) Other trading differences
The Openreach segmental financial information reported in BT Group plc's Annual Report reflects the internal charges between BT's business units rather than the allocation of actual costs and capital employed as shown in the RFS. The other trading differences reflect the total of these differences across the year.
(e) Installations costs treated as operating expenses
As directed by Ofcom's WLA Market Review statement (28 March 2018), we make an adjustment in the RFS (relative to IFRS and BT’s accounting policies) to treat installation and planning costs related to GEA Customer Site installation, Tie Cables, GEA Cable Links, Abortive Visits and Co-mingling services as operating expenditure in the RFS in line with connection revenues received (rather than capital expenditure), and the opening capital employed associated with these activities is also removed.
(f) Basis of preparation under CCA
The consolidated financial statements of BT Group plc have been prepared in accordance with the Companies Act 2006, Article 4 of the IAS Regulation and International Accounting Standards (IAS) and International Financial Reporting Standards (IFRS) and related interpretations, as adopted by the European Union. The consolidated financial statements also comply with IFRS as issued by the International Accounting Standards Board (the IASB).
The consolidated financial statements of BT Group plc are prepared on the historical cost basis, except for certain financial and equity instruments that have been measured at fair value.
BT’s RFS have been prepared on a CCA basis, in accordance with the annually updated AMD. As such, a reconciliation entry has been made to include the aggregated CCA adjustments within the Openreach regulatory statement.
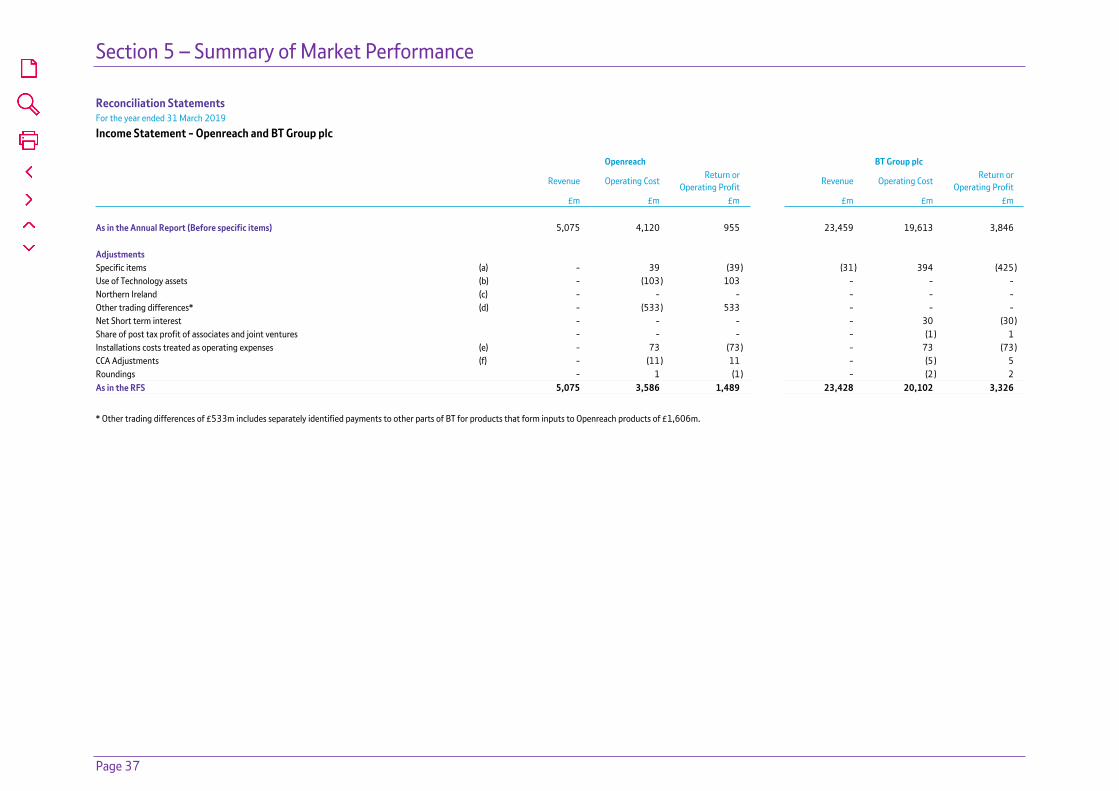
Section 5 – Summary of Market Performance
Page 37
Reconciliation Statements For the year ended 31 March 2019
Income Statement - Openreach and BT Group plc Openreach BT Group plc
Revenue Operating Cost Return or
Operating Profit Revenue Operating Cost
Return or Operating Profit
£m £m £m £m £m £m As in the Annual Report (Before specific items) 5,075 4,120 955 23,459 19,613 3,846 Adjustments Specific items (a) - 39 (39 ) (31 ) 394 (425 )Use of Technology assets (b) - (103 ) 103 - - - Northern Ireland (c) - - - - - - Other trading differences* (d) - (533 ) 533 - - - Net Short term interest - - - - 30 (30 )Share of post tax profit of associates and joint ventures - - - - (1 ) 1 Installations costs treated as operating expenses (e) - 73 (73 ) - 73 (73 )CCA Adjustments (f) - (11 ) 11 - (5 ) 5 Roundings - 1 (1 ) - (2 ) 2 As in the RFS 5,075 3,586 1,489 23,428 20,102 3,326
* Other trading differences of £533m includes separately identified payments to other parts of BT for products that form inputs to Openreach products of £1,606m.
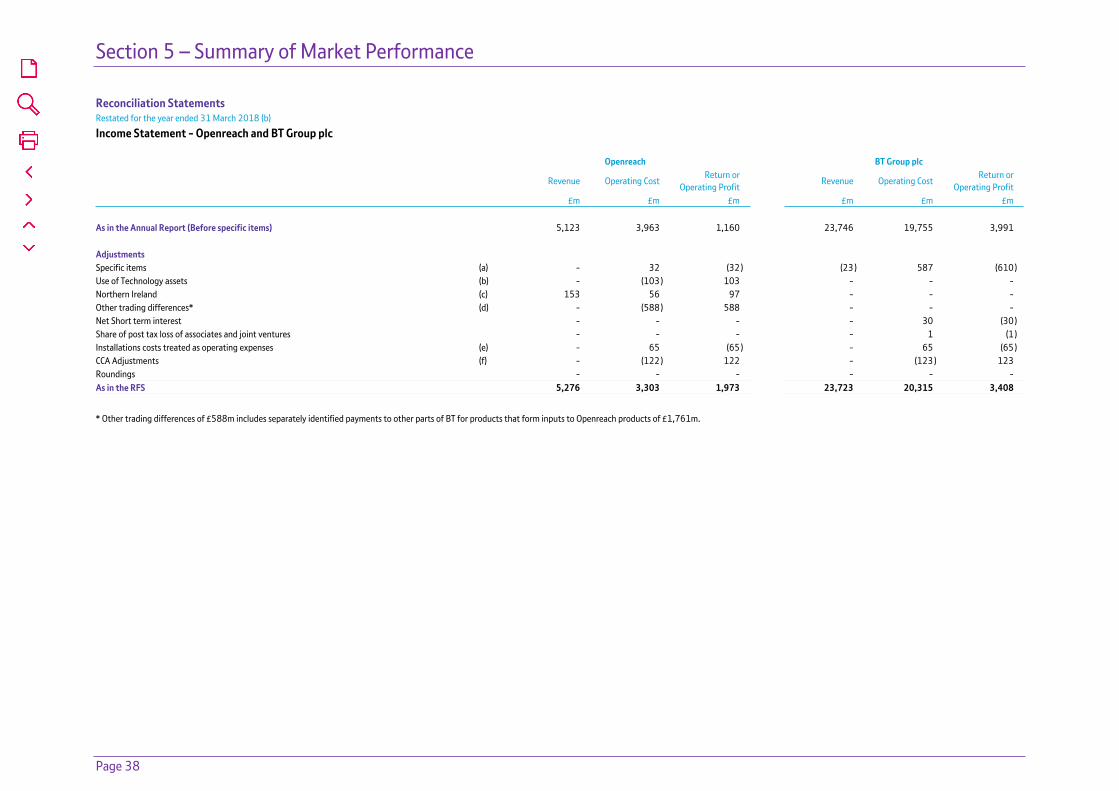
Section 5 – Summary of Market Performance
Page 38
Reconciliation Statements Restated for the year ended 31 March 2018 (b)
Income Statement - Openreach and BT Group plc Openreach BT Group plc
Revenue Operating Cost Return or
Operating Profit Revenue Operating Cost
Return or Operating Profit
£m £m £m £m £m £m As in the Annual Report (Before specific items) 5,123 3,963 1,160 23,746 19,755 3,991 Adjustments Specific items (a) - 32 (32 ) (23 ) 587 (610 )Use of Technology assets (b) - (103 ) 103 - - - Northern Ireland (c) 153 56 97 - - - Other trading differences* (d) - (588 ) 588 - - - Net Short term interest - - - - 30 (30 )Share of post tax loss of associates and joint ventures - - - - 1 (1 )Installations costs treated as operating expenses (e) - 65 (65 ) - 65 (65 )CCA Adjustments (f) - (122 ) 122 - (123 ) 123 Roundings - - - - - - As in the RFS 5,276 3,303 1,973 23,723 20,315 3,408
* Other trading differences of £588m includes separately identified payments to other parts of BT for products that form inputs to Openreach products of £1,761m.

Section 5 – Summary of Market Performance
Page 39
Reconciliation Statements 2019 and 2018 As at 31 March 2019 2018 2019 2018
Mean Capital Employed - BT Group plc £m £m £m £m Total assets less current liabilities as in the Annual Report 36,685 32,574 Openreach Wholesale Local Access 6,077 5,301 Adjustments Business Connectivity Markets 2,043 1,900 Corporate taxes (95 ) 6 Narrowband Markets 4,838 4,947 Deferred taxes (1,347 ) (1,243 ) Total Openreach SMP 12,958 12,148 Derivative financial instruments (1,544 ) (1,459 ) Loans due within one year 1,390 1,726 Rest of BT Provisions (582 ) (452 ) Business Connectivity Markets 217 287 Installations costs treated as operating expenses (507 ) (433 ) Narrowband Markets 296 291 Closing HCA capital employed at 31 March 34,000 30,719 WBA (Market A) 131 123 Total Rest of BT SMP 644 701 CCA Adjustments 2,235 2,230 Roundings 1 1 Openreach Residual 801 683 Closing CCA capital employed at 31 March 36,236 32,950 Rest of BT Residual 20,692 18,883 Opening CCA capital employed at 1 April 32,950 30,762 Eliminations (503) (559)Total CCA mean capital employed in the RFS 34,593 31,856 Roundings 1 - Total CCA mean capital employed in the RFS 34,593 31,856
Section 5 – Summary of Market Performance
Page 40
5.5 Adjusted Performance SummaryOfcom’s “Directions in relation to BT’s regulatory financial reporting” 20 March 2019 Annex 1 directs BT to prepare the “Adjusted Financial Performance at a market review level” statement in order to show the impact on the Regulatory Financial Statements for each Financial Year:
• Calculating an average of the Property Rationalisation Costs incurred in the three prior Financial Years and attributing that average to the BCMR and WLA markets in accordance with the RAP
• Calculating an average of the Restructuring Costs incurred in the three prior Financial Years and attributing that average to the BCMR and WLA markets in accordance with the RAP
• BT shall calculate the net proceeds in scrap value that BT will recoup when it moves to an FTTx only network. BT should discount its calculation using its WACC
• BT shall set and maintain the NRC: GRC ratio at 50% and adjust the asset lives to equate to the accounting book lives to calculate the OCM depreciation for the following network components:
a) MPF line testing systems
b) Local Loop Unbundling systems development;
c) Wholesale Access specific;
d) Local exchanges general frames equipment;
e) Local exchanges general frames maintenance;
f) Analogue line test equipment;
g) Analogue line cards;
h) Co-mingling power and vent; and
i) Combi Card and MSAN Access – Voice
The purpose of this schedule is to publish BT’s estimate of the impact of Ofcom’s regulatory decisions taken in the WLA, WBA and Business Connectivity market reviews that were not required to be included within the RFS.

Section 5 – Summary of Market Performance
Page 41
Adjusted Financial Performance at a market review levelFor the year ended 31 March 2019 As reported Estimated impacts Revised return
Revenue HCA CostsCCA
Adjustments Roundings
CCA Operating
Costs Return MCEReturn on
MCE Revenue
CCA Operating
Costs Return MCE Revised Return
RevisedMCE
Revised Return on
MCE £m £m £m £m £m £m £m % £m £m £m £m £m £m Δ%Wholesale Local Access Markets 2,353 1,732 (29) - 1,703 650 6,077 10.7% - 25 (25) 228 625 6,305 9.9%Business Connectivity Markets 649 543 4 - 547 102 2,260 4.5% - 0 - - 102 2,260 4.5%Narrowband Markets 1,982 1,414 12 1 1,427 555 5,134 10.8% - - - - 555 5,134 10.8%Wholesale Broadband Markets 102 53 1 - 54 48 131 37.0% - - - - 48 131 37.0%Total SMP Markets 5,086 3,742 (12) 1 3,731 1,355 13,602 10.0 % - 25 (25) 228 1,330 13,830 9.6 % Estimated impacts
Revenue
CCA Operating
Costs Return MCE £m £m £m £m Adjusted NRC for WLA components - 42 (42) 228 Property Rationalisation - 2 (2) - Restructuring Costs - (3) 3 - Residual Copper - (16) 16 -
- 25 (25) 228
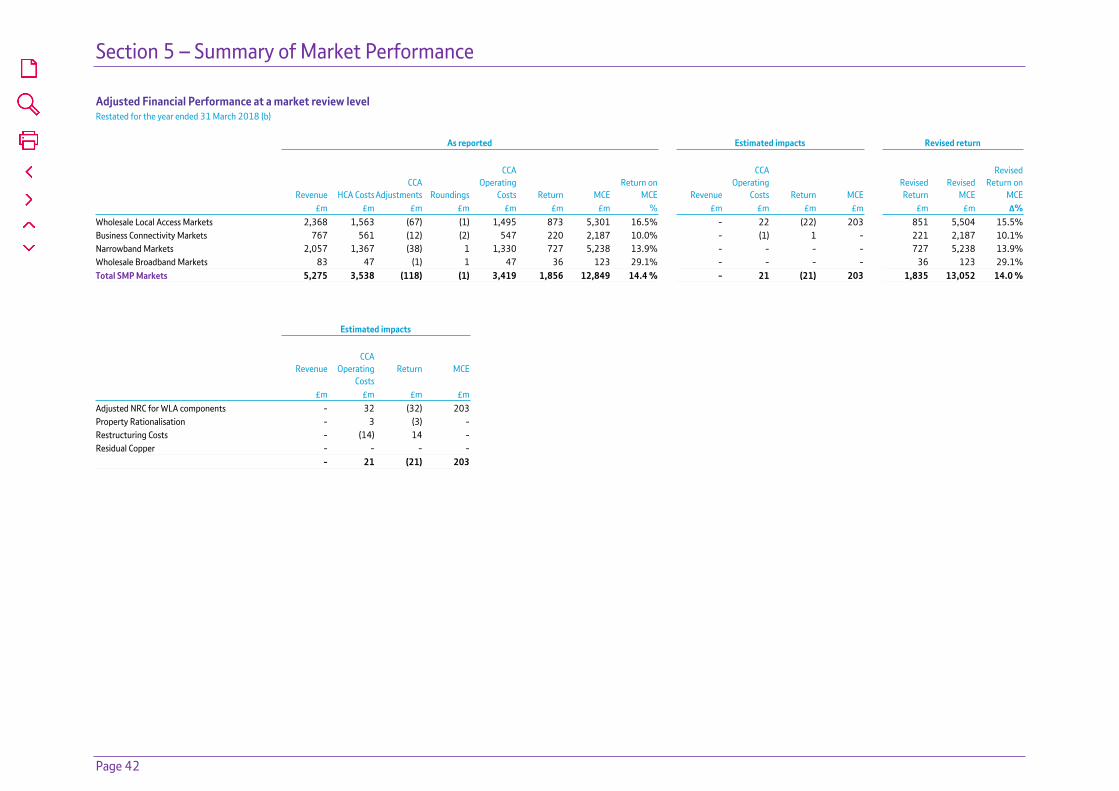
Section 5 – Summary of Market Performance
Page 42
Adjusted Financial Performance at a market review levelRestated for the year ended 31 March 2018 (b) As reported Estimated impacts Revised return
Revenue HCA CostsCCA
Adjustments Roundings
CCA Operating
Costs Return MCEReturn on
MCE Revenue
CCA Operating
Costs Return MCE Revised Return
RevisedMCE
Revised Return on
MCE £m £m £m £m £m £m £m % £m £m £m £m £m £m Δ%Wholesale Local Access Markets 2,368 1,563 (67) (1) 1,495 873 5,301 16.5% - 22 (22) 203 851 5,504 15.5%Business Connectivity Markets 767 561 (12) (2) 547 220 2,187 10.0% - (1) 1 - 221 2,187 10.1%Narrowband Markets 2,057 1,367 (38) 1 1,330 727 5,238 13.9% - - - - 727 5,238 13.9%Wholesale Broadband Markets 83 47 (1) 1 47 36 123 29.1% - - - - 36 123 29.1%Total SMP Markets 5,275 3,538 (118) (1) 3,419 1,856 12,849 14.4 % - 21 (21) 203 1,835 13,052 14.0 % Estimated impacts
Revenue
CCA Operating
CostsReturn MCE
£m £m £m £m Adjusted NRC for WLA components - 32 (32) 203 Property Rationalisation - 3 (3) - Restructuring Costs - (14) 14 - Residual Copper - - - -
- 21 (21) 203
Section 6 – Review of Wholesale Local Access Markets
Page 43
Section 6Review of Wholesale Local Access Markets
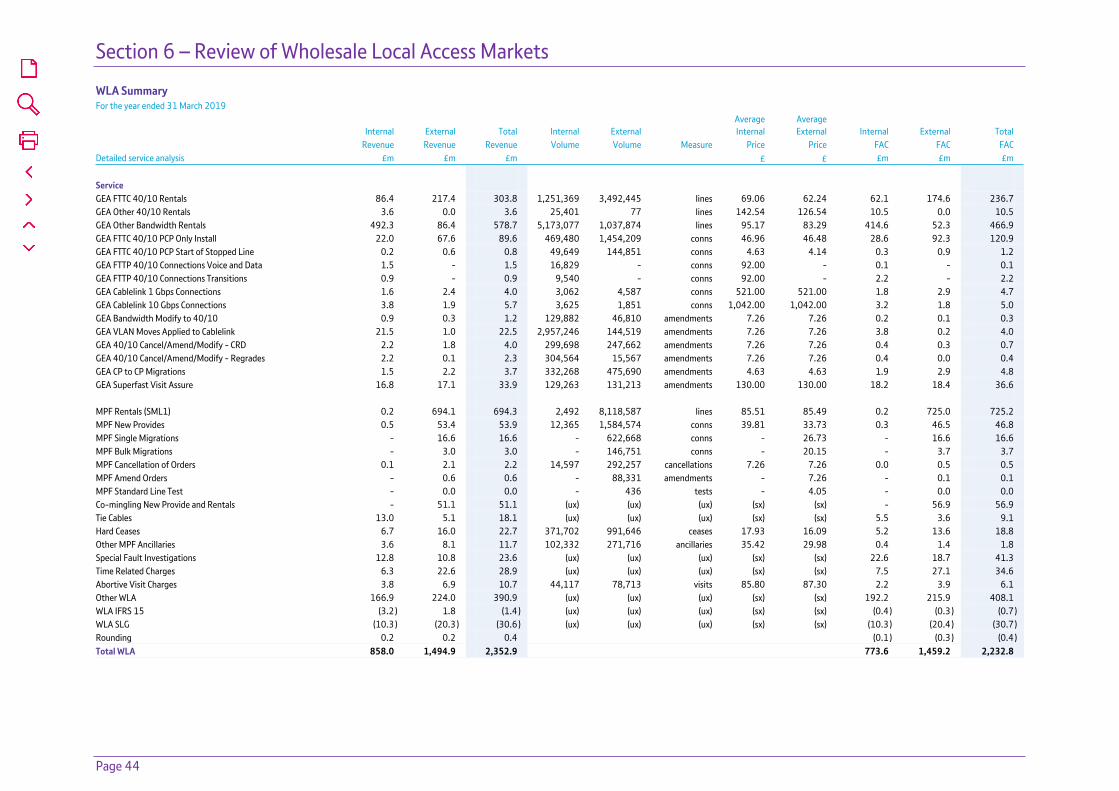
Section 6 – Review of Wholesale Local Access Markets
Page 44
WLA Summary For the year ended 31 March 2019
Internal External Total Internal External Average Internal
Average External Internal External Total
Revenue Revenue Revenue Volume Volume Measure Price Price FAC FAC FAC Detailed service analysis £m £m £m £ £ £m £m £m Service GEA FTTC 40/10 Rentals 86.4 217.4 303.8 1,251,369 3,492,445 lines 69.06 62.24 62.1 174.6 236.7 GEA Other 40/10 Rentals 3.6 0.0 3.6 25,401 77 lines 142.54 126.54 10.5 0.0 10.5 GEA Other Bandwidth Rentals 492.3 86.4 578.7 5,173,077 1,037,874 lines 95.17 83.29 414.6 52.3 466.9 GEA FTTC 40/10 PCP Only Install 22.0 67.6 89.6 469,480 1,454,209 conns 46.96 46.48 28.6 92.3 120.9 GEA FTTC 40/10 PCP Start of Stopped Line 0.2 0.6 0.8 49,649 144,851 conns 4.63 4.14 0.3 0.9 1.2 GEA FTTP 40/10 Connections Voice and Data 1.5 - 1.5 16,829 - conns 92.00 - 0.1 - 0.1 GEA FTTP 40/10 Connections Transitions 0.9 - 0.9 9,540 - conns 92.00 - 2.2 - 2.2 GEA Cablelink 1 Gbps Connections 1.6 2.4 4.0 3,062 4,587 conns 521.00 521.00 1.8 2.9 4.7 GEA Cablelink 10 Gbps Connections 3.8 1.9 5.7 3,625 1,851 conns 1,042.00 1,042.00 3.2 1.8 5.0 GEA Bandwidth Modify to 40/10 0.9 0.3 1.2 129,882 46,810 amendments 7.26 7.26 0.2 0.1 0.3 GEA VLAN Moves Applied to Cablelink 21.5 1.0 22.5 2,957,246 144,519 amendments 7.26 7.26 3.8 0.2 4.0 GEA 40/10 Cancel/Amend/Modify - CRD 2.2 1.8 4.0 299,698 247,662 amendments 7.26 7.26 0.4 0.3 0.7 GEA 40/10 Cancel/Amend/Modify - Regrades 2.2 0.1 2.3 304,564 15,567 amendments 7.26 7.26 0.4 0.0 0.4 GEA CP to CP Migrations 1.5 2.2 3.7 332,268 475,690 amendments 4.63 4.63 1.9 2.9 4.8 GEA Superfast Visit Assure 16.8 17.1 33.9 129,263 131,213 amendments 130.00 130.00 18.2 18.4 36.6 MPF Rentals (SML1) 0.2 694.1 694.3 2,492 8,118,587 lines 85.51 85.49 0.2 725.0 725.2 MPF New Provides 0.5 53.4 53.9 12,365 1,584,574 conns 39.81 33.73 0.3 46.5 46.8 MPF Single Migrations - 16.6 16.6 - 622,668 conns - 26.73 - 16.6 16.6 MPF Bulk Migrations - 3.0 3.0 - 146,751 conns - 20.15 - 3.7 3.7 MPF Cancellation of Orders 0.1 2.1 2.2 14,597 292,257 cancellations 7.26 7.26 0.0 0.5 0.5 MPF Amend Orders - 0.6 0.6 - 88,331 amendments - 7.26 - 0.1 0.1 MPF Standard Line Test - 0.0 0.0 - 436 tests - 4.05 - 0.0 0.0 Co-mingling New Provide and Rentals - 51.1 51.1 (ux) (ux) (ux) (sx) (sx) - 56.9 56.9 Tie Cables 13.0 5.1 18.1 (ux) (ux) (ux) (sx) (sx) 5.5 3.6 9.1 Hard Ceases 6.7 16.0 22.7 371,702 991,646 ceases 17.93 16.09 5.2 13.6 18.8 Other MPF Ancillaries 3.6 8.1 11.7 102,332 271,716 ancillaries 35.42 29.98 0.4 1.4 1.8 Special Fault Investigations 12.8 10.8 23.6 (ux) (ux) (ux) (sx) (sx) 22.6 18.7 41.3 Time Related Charges 6.3 22.6 28.9 (ux) (ux) (ux) (sx) (sx) 7.5 27.1 34.6 Abortive Visit Charges 3.8 6.9 10.7 44,117 78,713 visits 85.80 87.30 2.2 3.9 6.1 Other WLA 166.9 224.0 390.9 (ux) (ux) (ux) (sx) (sx) 192.2 215.9 408.1 WLA IFRS 15 (3.2 ) 1.8 (1.4 ) (ux) (ux) (ux) (sx) (sx) (0.4 ) (0.3 ) (0.7 )WLA SLG (10.3 ) (20.3 ) (30.6 ) (ux) (ux) (ux) (sx) (sx) (10.3 ) (20.4 ) (30.7 )Rounding 0.2 0.2 0.4 (0.1 ) (0.3 ) (0.4 )Total WLA 858.0 1,494.9 2,352.9 773.6 1,459.2 2,232.8

Section 6 – Review of Wholesale Local Access Markets
Page 45
WLA calculation of FAC based on component costs and usage factorsFor the year ended 31 March 2019
Aver
age
cost
per
uni
t (fr
om A
ppen
dix 1
.1)
GEA
FTTC
40/
10 R
enta
ls
GEA
Othe
r 40/
10 R
enta
ls
GEA
Othe
r Ban
dwid
th R
enta
ls
GEA
FTTC
40/
10 P
CP O
nly
Inst
all
GEA
FTTC
40/
10 P
CP S
tart
of S
topp
ed L
ine
GEA
FTTP
40/
10 C
onne
ctio
ns V
oice
and
Da
ta
GEA
FTTP
40/
10 C
onne
ctio
ns T
rans
ition
s
GEA
Cabl
elin
k 1
Gbps
Con
nect
ions
Internal External Internal External Internal External Internal External Internal External Internal External Internal External Internal ExternalFully Allocated Cost (£ or %) £ £ £ £ £ £ £ £ £ £ £ £ £ £ £ £ Components Unit (a) GEA Cable Links £/conn 846.98 - - - - - - - - - - - - - - 568.85 568.85GEA FTTC Distribution Fibre Spine £/rental 7.42 7.42 7.42 - - 7.01 7.42 - - - - - - - - - -GEA FTTP Distribution Fibre Spine £/rental 375.87 - - 258.35 79.15 20.72 0.01 - - - - - - - - - -GEA FTTC Access Fibre Spine £/rental 1.45 1.45 1.45 - - 1.37 1.45 - - - - - - - - - -GEA FTTP Access Fibre Spine £/rental 36.63 - - 25.18 7.71 2.02 0.00 - - - - - - - - - -GEA FTTC Electronics £/rental 1.01 1.01 1.01 - - 0.96 1.01 - - - - - - - - - -GEA FTTP Electronics £/rental 39.51 - - 27.16 8.32 2.18 0.00 - - - - - - - - - -GEA FTTC Customer Site Electronics % £160m - - - - - - 44.81 44.81 - - - - - - - -GEA FTTP Customer Site Installation % £16m - - - - - - - - - - - - 108.63 - - -GEA FTTC Provisions % £30m - - - - - - 8.42 8.42 - - - - - - - -GEA FTTP Provisions % £8m - - - - - - - - - - - - 53.55 - - -GEA FTTP Repairs % £1m - - 2.41 0.74 0.19 0.00 - - - - - - - - - -GEA FTTC Repairs % £16m 1.54 1.54 - - 1.45 1.54 - - - - - - - - - -GEA DSLAM & Cabinets % £95m 8.90 8.90 - - 8.41 8.90 - - - - - - - - - -NGA Visit Assure % £35m - - - - - - - - - - - - - - - -NGA E side Copper cable £/line 8.48 8.48 8.48 - - 8.01 8.48 - - - - - - - - - -Routing & Records £/line 3.02 - - - - - - 3.02 3.02 3.02 3.02 3.02 - 3.02 - - -FTTC Funded Fibre Rollout Spend % £204m 19.10 19.10 - - 18.05 19.10 - - - - - - - - - -FTTP Funded Fibre Rollout Spend % £47m - - 106.27 32.56 8.52 0.00 - - - - - - - - - -FTTC Fibre Rollout Funding % £(83)m (7.82) (7.82) - - (7.39) (7.82) - - - - - - - - - -FTTP Fibre Rollout Funding % £(24)m - - (55.25) (16.93) (4.43) (0.00) - - - - - - - - - -FTTC Development % £18m 1.20 1.20 - - 1.13 1.20 1.20 1.20 1.20 1.20 - - - - - -FTTP Development % £26m - - 40.48 12.40 3.25 0.00 - - - - - - 58.89 - - -Co-mingling power & vent £/hostel 281.49 - - - - - - - - - - - - - - - -Co-mingling rentals £/hostel 35.20 - - - - - - - - - - - - - - - -Co-mingling set up £/room 1,354.74 - - - - - - - - - - - - - - - -WLA tie cables £/cable 11.50 - - - - - - - - - - - - - - - -MDF Hardware jumpering £/line 16.13 - - - - - - - - - - - - - - - -Sub Total 41.28 41.28 404.60 123.95 71.45 41.29 57.45 57.45 4.22 4.22 3.02 - 224.09 - 568.85 568.85

Section 6 – Review of Wholesale Local Access Markets
Page 46
WLA calculation of FAC based on component costs and usage factors (continued)For the year ended 31 March 2019
Aver
age
cost
per
uni
t (fr
om A
ppen
dix 1
.1)
GEA
FTTC
40/
10 R
enta
ls
GEA
Othe
r 40/
10 R
enta
ls
GEA
Othe
r Ban
dwid
th R
enta
ls
GEA
FTTC
40/
10 P
CP O
nly
Inst
all
GEA
FTTC
40/
10 P
CP S
tart
of S
topp
ed L
ine
GEA
FTTP
40/
10 C
onne
ctio
ns V
oice
and
Da
ta
GEA
FTTP
40/
10 C
onne
ctio
ns T
rans
ition
s
GEA
Cabl
elin
k 1
Gbps
Con
nect
ions
Internal External Internal External Internal External Internal External Internal External Internal External Internal External Internal ExternalFully Allocated Cost (£ or %) £ £ £ £ £ £ £ £ £ £ £ £ £ £ £ £ Components Unit (a) MPF line testing systems £/line 2.12 - - - - - - - - - - - - - - - -Cumulo Rates Non NGA - Openreach % £135m - - - - - - - - - - - - - - - -Cumulo Rates NGA % £72m 6.57 6.57 5.02 1.54 6.57 6.57 - - - - - - - - - -E side copper current £/line 4.01 - - - - - - - - - - - - - - - -E side copper capital £/line 7.05 - - - - - - - - - - - - - - - -D side copper current £/line 11.00 - - - - - - - - - - - - - - - -D side copper capital £/line 36.11 - - - - - - - - - - - - - - - -Analogue line drop maintenance £/line 2.22 - - - - - - - - - - - - - - - -Dropwire capital & analogue NTE £/line 17.41 - - - - - - - - - - - - - - - -Analogue line test equipment £/line 0.12 - - - - - - - - - - - - - - - -Local exchanges general frames maintenance £/line 1.27 - - - - - - - - - - - - - - - -Local exchanges general frames equipment £/line 1.12 - - - - - - - - - - - - - - - -Abortive Visits £/trans 50.19 - - - - - - - - - - - - - - - -Local Loop Unbundling systems development % £1m - - - - - - - - - - - - - - - -OR Service Centre - Assurance GEA % £20m 1.00 1.00 1.00 1.00 1.00 1.00 - - - - - - - - - -OR Service Centre - Assurance WLA % £10m - - - - - - - - - - - - - - - -OR Service Centre - Provision GEA % £22m - - - - - - 1.23 1.23 1.23 1.23 1.23 - 1.23 - 1.23 1.23OR Service Centre - Provision WLA % £10m - - - - - - - - - - - - - - - -Openreach time related charges % £74m - - - - - - - - - - - - - - - -Openreach sales product management % £15m 0.01 0.01 0.02 0.02 0.01 0.01 0.01 0.01 0.00 0.00 0.01 - 0.01 - 0.08 0.08Special Fault Investigation % £41m - - - - - - - - - - - - - - - -Ofcom Administration Fee - Openreach % £4m 0.06 0.05 0.12 0.11 0.08 0.07 0.04 0.04 0.00 0.00 0.08 - 0.08 - 0.45 0.45SLG WLA Internal % £10m 0.31 - 0.47 - 0.42 - 1.85 - 0.18 - 3.62 - 3.62 - 20.47 -SLG WLA External % £22m - 0.67 - 0.36 - 0.90 - 4.48 - 0.40 - - - - - 50.15Revenue Receivables % £40m 0.42 0.38 0.87 0.77 0.58 0.51 0.25 0.25 0.02 0.02 0.49 - 0.49 - 2.77 2.77Rounding 0.01 0.02 0.01 0.01 0.03 0.02 (0.01) (0.01) 0.01 0.01 0.01 - 0.01 - 0.01 0.01Fully Allocated Cost (£ or %) 49.66 49.98 412.11 127.76 80.14 50.37 60.82 63.45 5.66 5.88 8.46 - 229.53 - 593.86 623.54
Volume (units) 1,251,369 3,492,445 25,401 77 5,173,077 1,037,874 469,480 1,454,209 49,649 144,851 16,829 - 9,540 - 3,062 4,587Fully Allocated Cost (£m) 62.1 174.6 10.5 0.0 414.6 52.3 28.6 92.3 0.3 0.9 0.1 - 2.2 - 1.8 2.9
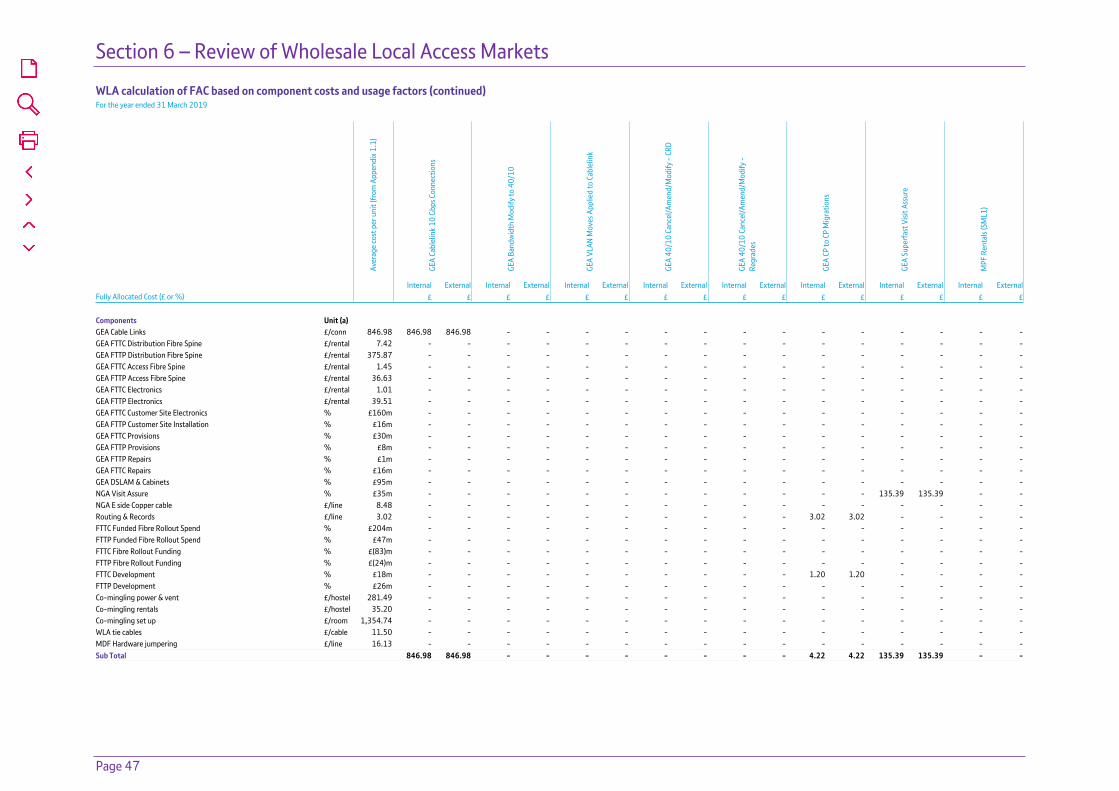
Section 6 – Review of Wholesale Local Access Markets
Page 47
WLA calculation of FAC based on component costs and usage factors (continued)For the year ended 31 March 2019
Aver
age
cost
per
uni
t (fr
om A
ppen
dix 1
.1)
GEA
Cabl
elin
k 10
Gbp
s Con
nect
ions
GEA
Band
wid
th M
odify
to 4
0/10
GEA
VLAN
Mov
es A
pplie
d to
Cab
lelin
k
GEA
40/1
0 Ca
ncel
/Am
end/
Mod
ify -
CRD
GEA
40/1
0 Ca
ncel
/Am
end/
Mod
ify -
Regr
ades
GEA
CP to
CP
Mig
ratio
ns
GEA
Supe
rfas
t Visi
t Ass
ure
MPF
Ren
tals
(SM
L1)
Internal External Internal External Internal External Internal External Internal External Internal External Internal External Internal ExternalFully Allocated Cost (£ or %) £ £ £ £ £ £ £ £ £ £ £ £ £ £ £ £ Components Unit (a) GEA Cable Links £/conn 846.98 846.98 846.98 - - - - - - - - - - - - - -GEA FTTC Distribution Fibre Spine £/rental 7.42 - - - - - - - - - - - - - - - -GEA FTTP Distribution Fibre Spine £/rental 375.87 - - - - - - - - - - - - - - - -GEA FTTC Access Fibre Spine £/rental 1.45 - - - - - - - - - - - - - - - -GEA FTTP Access Fibre Spine £/rental 36.63 - - - - - - - - - - - - - - - -GEA FTTC Electronics £/rental 1.01 - - - - - - - - - - - - - - - -GEA FTTP Electronics £/rental 39.51 - - - - - - - - - - - - - - - -GEA FTTC Customer Site Electronics % £160m - - - - - - - - - - - - - - - -GEA FTTP Customer Site Installation % £16m - - - - - - - - - - - - - - - -GEA FTTC Provisions % £30m - - - - - - - - - - - - - - - -GEA FTTP Provisions % £8m - - - - - - - - - - - - - - - -GEA FTTP Repairs % £1m - - - - - - - - - - - - - - - -GEA FTTC Repairs % £16m - - - - - - - - - - - - - - - -GEA DSLAM & Cabinets % £95m - - - - - - - - - - - - - - - -NGA Visit Assure % £35m - - - - - - - - - - - - 135.39 135.39 - -NGA E side Copper cable £/line 8.48 - - - - - - - - - - - - - - - -Routing & Records £/line 3.02 - - - - - - - - - - 3.02 3.02 - - - -FTTC Funded Fibre Rollout Spend % £204m - - - - - - - - - - - - - - - -FTTP Funded Fibre Rollout Spend % £47m - - - - - - - - - - - - - - - -FTTC Fibre Rollout Funding % £(83)m - - - - - - - - - - - - - - - -FTTP Fibre Rollout Funding % £(24)m - - - - - - - - - - - - - - - -FTTC Development % £18m - - - - - - - - - - 1.20 1.20 - - - -FTTP Development % £26m - - - - - - - - - - - - - - - -Co-mingling power & vent £/hostel 281.49 - - - - - - - - - - - - - - - -Co-mingling rentals £/hostel 35.20 - - - - - - - - - - - - - - - -Co-mingling set up £/room 1,354.74 - - - - - - - - - - - - - - - -WLA tie cables £/cable 11.50 - - - - - - - - - - - - - - - -MDF Hardware jumpering £/line 16.13 - - - - - - - - - - - - - - - -Sub Total 846.98 846.98 - - - - - - - - 4.22 4.22 135.39 135.39 - -

Section 6 – Review of Wholesale Local Access Markets
Page 48
WLA calculation of FAC based on component costs and usage factors (continued)For the year ended 31 March 2019
Aver
age
cost
per
uni
t (fr
om A
ppen
dix 1
.1)
GEA
Cabl
elin
k 10
Gbp
s Con
nect
ions
GEA
Band
wid
th M
odify
to 4
0/10
GEA
VLAN
Mov
es A
pplie
d to
Cab
lelin
k
GEA
40/1
0 Ca
ncel
/Am
end/
Mod
ify -
CRD
GEA
40/1
0 Ca
ncel
/Am
end/
Mod
ify -
Regr
ades
GEA
CP to
CP
Mig
ratio
ns
GEA
Supe
rfas
t Visi
t Ass
ure
MPF
Ren
tals
(SM
L1)
Internal External Internal External Internal External Internal External Internal External Internal External Internal External Internal ExternalFully Allocated Cost (£ or %) £ £ £ £ £ £ £ £ £ £ £ £ £ £ £ £ Components Unit (a) MPF line testing systems £/line 2.12 - - - - - - - - - - - - - - 2.12 2.12Cumulo Rates Non NGA - Openreach % £135m - - - - - - - - - - - - - - 3.86 3.86Cumulo Rates NGA % £72m - - - - - - - - - - - - - - - -E side copper current £/line 4.01 - - - - - - - - - - - - - - 4.01 4.01E side copper capital £/line 7.05 - - - - - - - - - - - - - - 7.05 7.05D side copper current £/line 11.00 - - - - - - - - - - - - - - 11.00 11.00D side copper capital £/line 36.11 - - - - - - - - - - - - - - 36.11 36.11Analogue line drop maintenance £/line 2.22 - - - - - - - - - - - - - - 2.22 2.22Dropwire capital & analogue NTE £/line 17.41 - - - - - - - - - - - - - - 17.41 17.41Analogue line test equipment £/line 0.12 - - - - - - - - - - - - - - 0.12 0.12Local exchanges general frames maintenance £/line 1.27 - - - - - - - - - - - - - - 1.27 1.27Local exchanges general frames equipment £/line 1.12 - - - - - - - - - - - - - - 2.23 2.23Abortive Visits £/trans 50.19 - - - - - - - - - - - - - - - -Local Loop Unbundling systems development % £1m - - - - - - - - - - - - - - 0.04 0.04OR Service Centre - Assurance GEA % £20m - - - - - - - - - - - - - - - -OR Service Centre - Assurance WLA % £10m - - - - - - - - - - - - - - 0.88 0.88OR Service Centre - Provision GEA % £22m 1.23 1.23 1.23 1.23 1.23 1.23 1.23 1.23 1.23 1.23 1.23 1.23 - - - -OR Service Centre - Provision WLA % £10m - - - - - - - - - - - - - - - -Openreach time related charges % £74m - - - - - - - - - - - - - - - -Openreach sales product management % £15m 0.15 0.15 0.00 0.00 0.00 0.00 0.00 0.00 0.00 0.00 0.16 0.16 4.40 4.41 0.03 0.03Special Fault Investigation % £41m - - - - - - - - - - - - - - - -Ofcom Administration Fee - Openreach % £4m 0.91 0.91 0.01 0.01 0.01 0.01 0.01 0.01 0.01 0.01 0.00 0.00 0.11 0.11 0.07 0.07SLG WLA Internal % £10m 41.02 - - - - - - - - - 0.18 - - - 0.38 0.38SLG WLA External % £22m - 100.39 - - - - - - - - - 0.45 - - - -Revenue Receivables % £40m 5.55 5.55 0.04 0.04 0.04 0.04 0.04 0.04 0.04 0.04 0.02 0.02 0.69 0.69 0.52 0.52Rounding - - - - - - - - - - 0.01 - 0.01 - (0.02) (0.02)Fully Allocated Cost (£ or %) 895.84 955.21 1.28 1.28 1.28 1.28 1.28 1.28 1.28 1.28 5.82 6.08 140.60 140.60 89.30 89.30
Volume (units) 3,625 1,851 129,882 46,810 2,957,246 144,519 299,698 247,662 304,564 15,567 332,268 475,690 129,263 131,213 2,492 8,118,587Fully Allocated Cost (£m) 3.2 1.8 0.2 0.1 3.8 0.2 0.4 0.3 0.4 0.0 1.9 2.9 18.2 18.4 0.2 725.0

Section 6 – Review of Wholesale Local Access Markets
Page 49
WLA calculation of FAC based on component costs and usage factors (continued)For the year ended 31 March 2019
Aver
age
cost
per
uni
t (fr
om A
ppen
dix 1
.1)
MPF
New
Pro
vide
s
MPF
Sin
gle
Mig
ratio
ns
MPF
Bul
k M
igra
tions
MPF
Can
cella
tion
of O
rder
s
MPF
Am
end
Orde
rs
MPF
Sta
ndar
d Li
ne T
est
Co-m
ingl
ing
New
Pro
vide
and
Ren
tals
Tie
Cabl
es
Internal External Internal External Internal External Internal External Internal External Internal External Internal External Internal ExternalFully Allocated Cost (£ or %) £ £ £ £ £ £ £ £ £ £ £ £ % % % % Components Unit (a) GEA Cable Links £/conn 846.98 - - - - - - - - - - - - - - - -GEA FTTC Distribution Fibre Spine £/rental 7.42 - - - - - - - - - - - - - - - -GEA FTTP Distribution Fibre Spine £/rental 375.87 - - - - - - - - - - - - - - - -GEA FTTC Access Fibre Spine £/rental 1.45 - - - - - - - - - - - - - - - -GEA FTTP Access Fibre Spine £/rental 36.63 - - - - - - - - - - - - - - - -GEA FTTC Electronics £/rental 1.01 - - - - - - - - - - - - - - - -GEA FTTP Electronics £/rental 39.51 - - - - - - - - - - - - - - - -GEA FTTC Customer Site Electronics % £160m - - - - - - - - - - - - - - - -GEA FTTP Customer Site Installation % £16m - - - - - - - - - - - - - - - -GEA FTTC Provisions % £30m - - - - - - - - - - - - - - - -GEA FTTP Provisions % £8m - - - - - - - - - - - - - - - -GEA FTTP Repairs % £1m - - - - - - - - - - - - - - - -GEA FTTC Repairs % £16m - - - - - - - - - - - - - - - -GEA DSLAM & Cabinets % £95m - - - - - - - - - - - - - - - -NGA Visit Assure % £35m - - - - - - - - - - - - - - - -NGA E side Copper cable £/line 8.48 - - - - - - - - - - - - - - - -Routing & Records £/line 3.02 3.02 3.02 - - - - - - - - - - - - - -FTTC Funded Fibre Rollout Spend % £204m - - - - - - - - - - - - - - - -FTTP Funded Fibre Rollout Spend % £47m - - - - - - - - - - - - - - - -FTTC Fibre Rollout Funding % £(83)m - - - - - - - - - - - - - - - -FTTP Fibre Rollout Funding % £(24)m - - - - - - - - - - - - - - - -FTTC Development % £18m - - - - - - - - - - - - - - - -FTTP Development % £26m - - - - - - - - - - - - - - - -Co-mingling power & vent £/hostel 281.49 - - - - - - - - - - - - - 28.3% - -Co-mingling rentals £/hostel 35.20 - - - - - - - - - - - - - 33.8% - -Co-mingling set up £/room 1,354.74 - - - - - - - - - - - - - 35.0% - -WLA tie cables £/cable 11.50 - - - - - - - - - - - - - - 81.9% 78.2%MDF Hardware jumpering £/line 16.13 21.25 21.25 - 22.30 - 21.50 - - - - - - - - - -Sub Total 24.27 24.27 - 22.30 - 21.50 - - - - - - - 97.1% 81.9% 78.2%
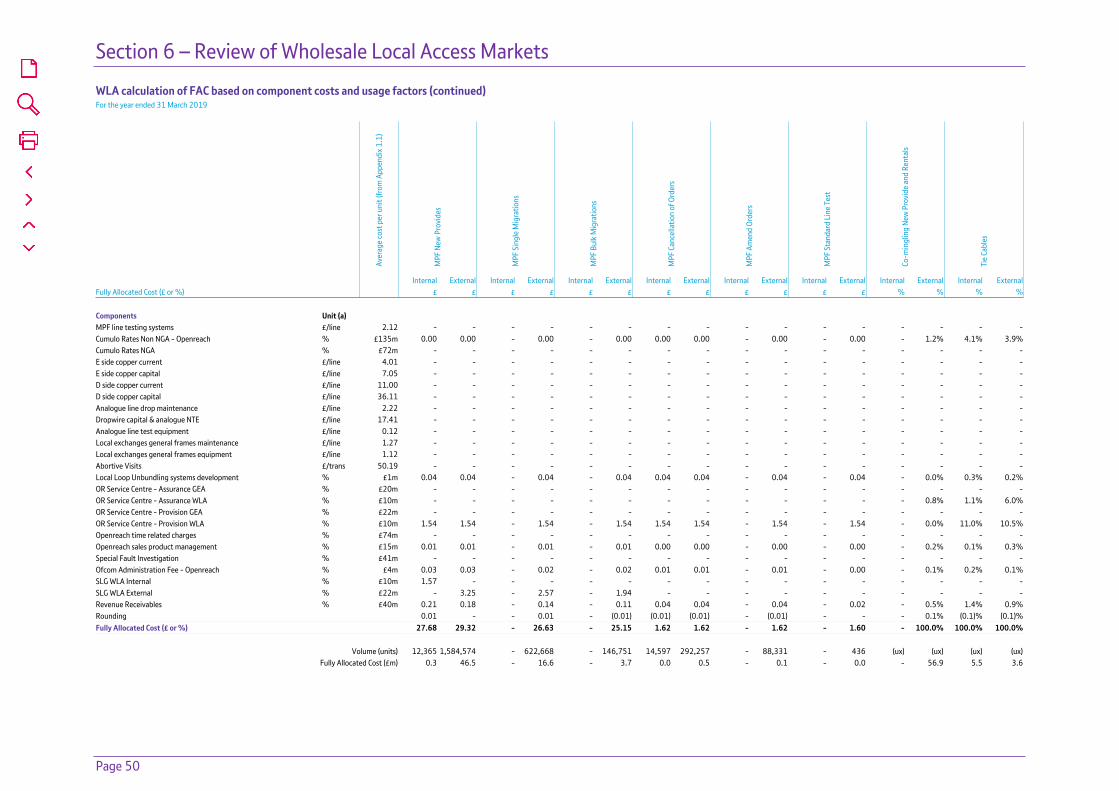
Section 6 – Review of Wholesale Local Access Markets
Page 50
WLA calculation of FAC based on component costs and usage factors (continued)For the year ended 31 March 2019
Aver
age
cost
per
uni
t (fr
om A
ppen
dix 1
.1)
MPF
New
Pro
vide
s
MPF
Sin
gle
Mig
ratio
ns
MPF
Bul
k M
igra
tions
MPF
Can
cella
tion
of O
rder
s
MPF
Am
end
Orde
rs
MPF
Sta
ndar
d Li
ne T
est
Co-m
ingl
ing
New
Pro
vide
and
Ren
tals
Tie
Cabl
es
Internal External Internal External Internal External Internal External Internal External Internal External Internal External Internal ExternalFully Allocated Cost (£ or %) £ £ £ £ £ £ £ £ £ £ £ £ % % % % Components Unit (a) MPF line testing systems £/line 2.12 - - - - - - - - - - - - - - - -Cumulo Rates Non NGA - Openreach % £135m 0.00 0.00 - 0.00 - 0.00 0.00 0.00 - 0.00 - 0.00 - 1.2% 4.1% 3.9%Cumulo Rates NGA % £72m - - - - - - - - - - - - - - - -E side copper current £/line 4.01 - - - - - - - - - - - - - - - -E side copper capital £/line 7.05 - - - - - - - - - - - - - - - -D side copper current £/line 11.00 - - - - - - - - - - - - - - - -D side copper capital £/line 36.11 - - - - - - - - - - - - - - - -Analogue line drop maintenance £/line 2.22 - - - - - - - - - - - - - - - -Dropwire capital & analogue NTE £/line 17.41 - - - - - - - - - - - - - - - -Analogue line test equipment £/line 0.12 - - - - - - - - - - - - - - - -Local exchanges general frames maintenance £/line 1.27 - - - - - - - - - - - - - - - -Local exchanges general frames equipment £/line 1.12 - - - - - - - - - - - - - - - -Abortive Visits £/trans 50.19 - - - - - - - - - - - - - - - -Local Loop Unbundling systems development % £1m 0.04 0.04 - 0.04 - 0.04 0.04 0.04 - 0.04 - 0.04 - 0.0% 0.3% 0.2%OR Service Centre - Assurance GEA % £20m - - - - - - - - - - - - - - - -OR Service Centre - Assurance WLA % £10m - - - - - - - - - - - - - 0.8% 1.1% 6.0%OR Service Centre - Provision GEA % £22m - - - - - - - - - - - - - - - -OR Service Centre - Provision WLA % £10m 1.54 1.54 - 1.54 - 1.54 1.54 1.54 - 1.54 - 1.54 - 0.0% 11.0% 10.5%Openreach time related charges % £74m - - - - - - - - - - - - - - - -Openreach sales product management % £15m 0.01 0.01 - 0.01 - 0.01 0.00 0.00 - 0.00 - 0.00 - 0.2% 0.1% 0.3%Special Fault Investigation % £41m - - - - - - - - - - - - - - - -Ofcom Administration Fee - Openreach % £4m 0.03 0.03 - 0.02 - 0.02 0.01 0.01 - 0.01 - 0.00 - 0.1% 0.2% 0.1%SLG WLA Internal % £10m 1.57 - - - - - - - - - - - - - - -SLG WLA External % £22m - 3.25 - 2.57 - 1.94 - - - - - - - - - -Revenue Receivables % £40m 0.21 0.18 - 0.14 - 0.11 0.04 0.04 - 0.04 - 0.02 - 0.5% 1.4% 0.9%Rounding 0.01 - - 0.01 - (0.01) (0.01) (0.01) - (0.01) - - - 0.1% (0.1)% (0.1)%Fully Allocated Cost (£ or %) 27.68 29.32 - 26.63 - 25.15 1.62 1.62 - 1.62 - 1.60 - 100.0% 100.0% 100.0%
Volume (units) 12,365 1,584,574 - 622,668 - 146,751 14,597 292,257 - 88,331 - 436 (ux) (ux) (ux) (ux)Fully Allocated Cost (£m) 0.3 46.5 - 16.6 - 3.7 0.0 0.5 - 0.1 - 0.0 - 56.9 5.5 3.6
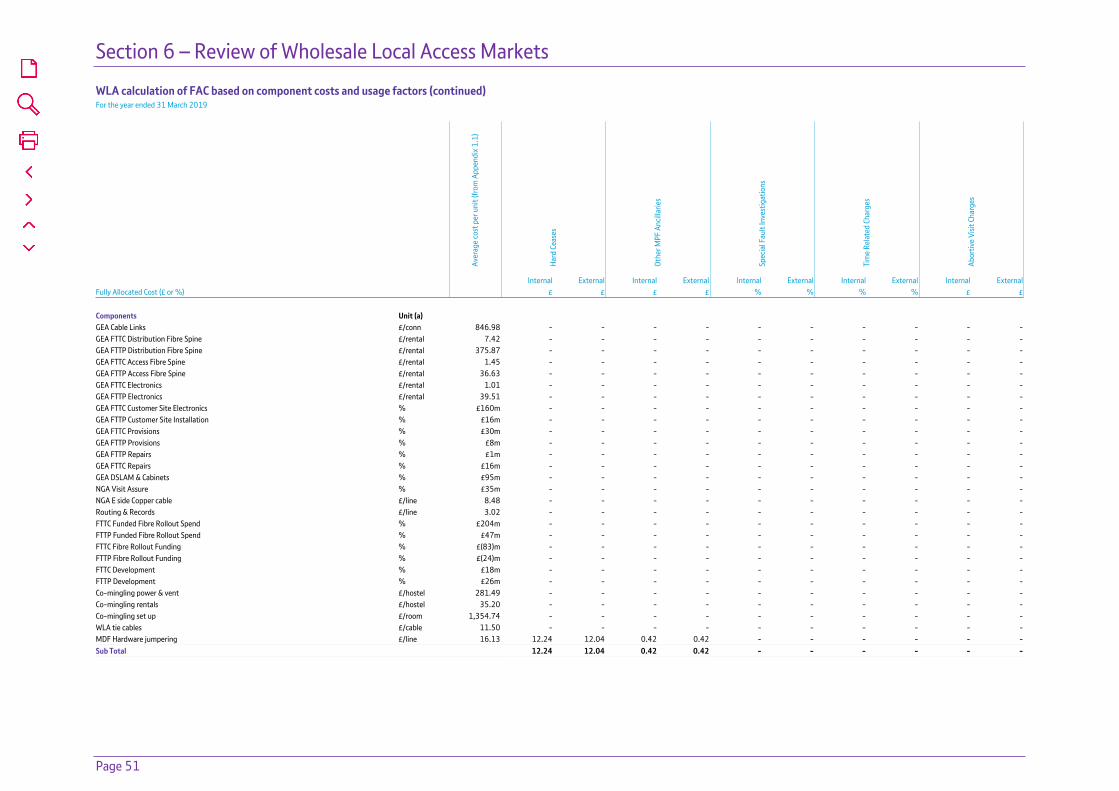
Section 6 – Review of Wholesale Local Access Markets
Page 51
WLA calculation of FAC based on component costs and usage factors (continued)For the year ended 31 March 2019
Aver
age
cost
per
uni
t (fr
om A
ppen
dix 1
.1)
Hard
Cea
ses
Othe
r MPF
Anc
illar
ies
Spec
ial F
ault
Inve
stig
atio
ns
Tim
e Re
late
d Ch
arge
s
Abor
tive
Visit
Cha
rges
Internal External Internal External Internal External Internal External Internal ExternalFully Allocated Cost (£ or %) £ £ £ £ % % % % £ £ Components Unit (a) GEA Cable Links £/conn 846.98 - - - - - - - - - -GEA FTTC Distribution Fibre Spine £/rental 7.42 - - - - - - - - - -GEA FTTP Distribution Fibre Spine £/rental 375.87 - - - - - - - - - -GEA FTTC Access Fibre Spine £/rental 1.45 - - - - - - - - - -GEA FTTP Access Fibre Spine £/rental 36.63 - - - - - - - - - -GEA FTTC Electronics £/rental 1.01 - - - - - - - - - -GEA FTTP Electronics £/rental 39.51 - - - - - - - - - -GEA FTTC Customer Site Electronics % £160m - - - - - - - - - -GEA FTTP Customer Site Installation % £16m - - - - - - - - - -GEA FTTC Provisions % £30m - - - - - - - - - -GEA FTTP Provisions % £8m - - - - - - - - - -GEA FTTP Repairs % £1m - - - - - - - - - -GEA FTTC Repairs % £16m - - - - - - - - - -GEA DSLAM & Cabinets % £95m - - - - - - - - - -NGA Visit Assure % £35m - - - - - - - - - -NGA E side Copper cable £/line 8.48 - - - - - - - - - -Routing & Records £/line 3.02 - - - - - - - - - -FTTC Funded Fibre Rollout Spend % £204m - - - - - - - - - -FTTP Funded Fibre Rollout Spend % £47m - - - - - - - - - -FTTC Fibre Rollout Funding % £(83)m - - - - - - - - - -FTTP Fibre Rollout Funding % £(24)m - - - - - - - - - -FTTC Development % £18m - - - - - - - - - -FTTP Development % £26m - - - - - - - - - -Co-mingling power & vent £/hostel 281.49 - - - - - - - - - -Co-mingling rentals £/hostel 35.20 - - - - - - - - - -Co-mingling set up £/room 1,354.74 - - - - - - - - - -WLA tie cables £/cable 11.50 - - - - - - - - - -MDF Hardware jumpering £/line 16.13 12.24 12.04 0.42 0.42 - - - - - -Sub Total 12.24 12.04 0.42 0.42 - - - - - -

Section 6 – Review of Wholesale Local Access Markets
Page 52
WLA calculation of FAC based on component costs and usage factors (continued)For the year ended 31 March 2019
Aver
age
cost
per
uni
t (fr
om A
ppen
dix 1
.1)
Hard
Cea
ses
Othe
r MPF
Anc
illar
ies
Spec
ial F
ault
Inve
stig
atio
ns
Tim
e Re
late
d Ch
arge
s
Abor
tive
Visit
Cha
rges
Internal External Internal External Internal External Internal External Internal ExternalFully Allocated Cost (£ or %) £ £ £ £ % % % % £ £ Components Unit (a) MPF line testing systems £/line 2.12 - - - - - - - - - -Cumulo Rates Non NGA - Openreach % £135m 0.00 0.00 0.00 0.00 0.0% 0.0% 0.0% 0.0% - -Cumulo Rates NGA % £72m - - - - - - - - - -E side copper current £/line 4.01 - - - - - - - - - -E side copper capital £/line 7.05 - - - - - - - - - -D side copper current £/line 11.00 - - - - - - - - - -D side copper capital £/line 36.11 - - - - - - - - - -Analogue line drop maintenance £/line 2.22 - - - - - - - - - -Dropwire capital & analogue NTE £/line 17.41 - - - - - - - - - -Analogue line test equipment £/line 0.12 - - - - - - - - - -Local exchanges general frames maintenance £/line 1.27 - - - - - - - - - -Local exchanges general frames equipment £/line 1.12 - - - - - - - - - -Abortive Visits £/trans 50.19 - - - - - - - - 48.43 48.43Local Loop Unbundling systems development % £1m 0.04 0.04 0.04 0.04 - - - - - -OR Service Centre - Assurance GEA % £20m - - - - - - - - - -OR Service Centre - Assurance WLA % £10m - - - - - - - - - -OR Service Centre - Provision GEA % £22m - - - - - - - - - -OR Service Centre - Provision WLA % £10m 1.54 1.54 1.54 1.54 - - - - - -Openreach time related charges % £74m - - - - - - 99.3% 99.3% - -Openreach sales product management % £15m 0.05 0.04 0.01 0.01 0.1% 0.1% 0.2% 0.2% 0.19 0.19Special Fault Investigation % £41m - - - - 99.5% 99.5% - - - -Ofcom Administration Fee - Openreach % £4m 0.02 0.01 0.03 0.03 0.0% 0.1% 0.1% 0.1% 0.07 0.08SLG WLA Internal % £10m - - 1.39 - - - - - - -SLG WLA External % £22m - - - 2.89 - - - - - -Revenue Receivables % £40m 0.10 0.09 0.19 0.16 0.3% 0.3% 0.4% 0.4% 0.46 0.46Rounding (0.02) - - (0.01) 0.1% - - - (0.01) -Fully Allocated Cost (£ or %) 13.97 13.76 3.62 5.08 100.0% 100.0% 100.0% 100.0% 49.14 49.16
Volume (units) 371,702 991,646 102,332 271,716 (ux) (ux) (ux) (ux) 44,117 78,713Fully Allocated Cost (£m) 5.2 13.6 0.4 1.4 22.6 18.7 7.5 27.1 2.2 3.9
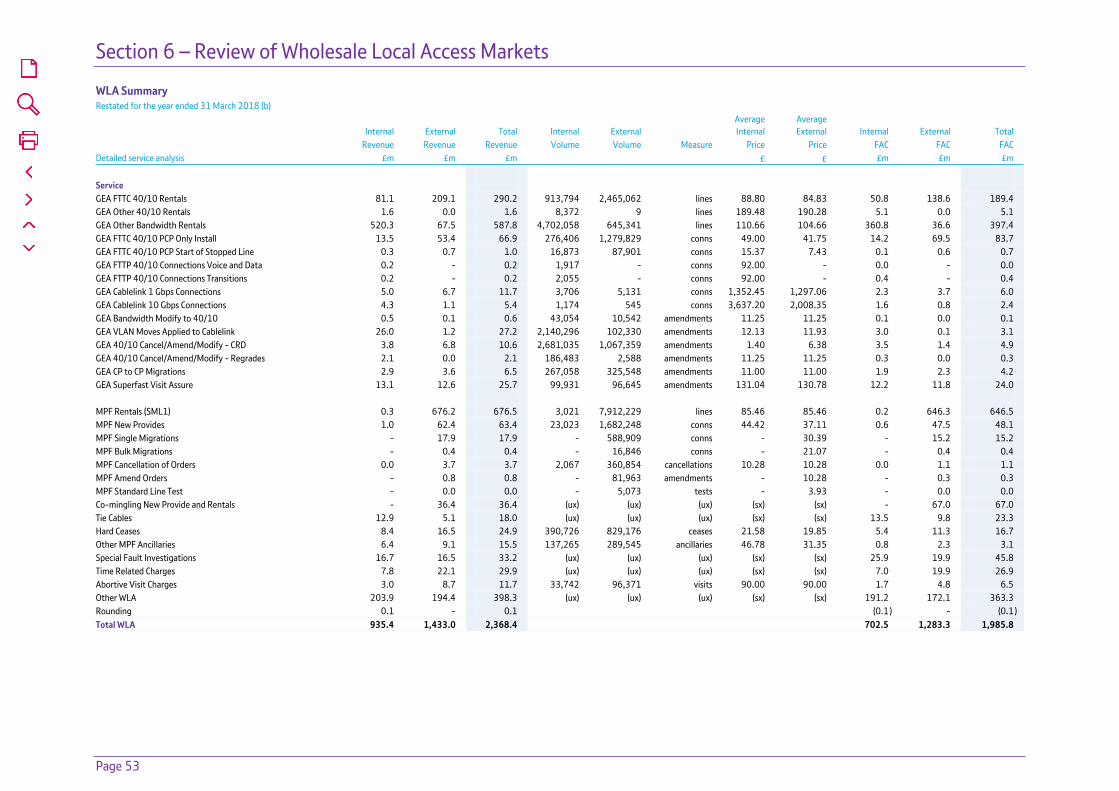
Section 6 – Review of Wholesale Local Access Markets
Page 53
WLA Summary Restated for the year ended 31 March 2018 (b)
Internal External Total Internal External Average Internal
Average External Internal External Total
Revenue Revenue Revenue Volume Volume Measure Price Price FAC FAC FAC Detailed service analysis £m £m £m £ £ £m £m £m Service GEA FTTC 40/10 Rentals 81.1 209.1 290.2 913,794 2,465,062 lines 88.80 84.83 50.8 138.6 189.4 GEA Other 40/10 Rentals 1.6 0.0 1.6 8,372 9 lines 189.48 190.28 5.1 0.0 5.1 GEA Other Bandwidth Rentals 520.3 67.5 587.8 4,702,058 645,341 lines 110.66 104.66 360.8 36.6 397.4 GEA FTTC 40/10 PCP Only Install 13.5 53.4 66.9 276,406 1,279,829 conns 49.00 41.75 14.2 69.5 83.7 GEA FTTC 40/10 PCP Start of Stopped Line 0.3 0.7 1.0 16,873 87,901 conns 15.37 7.43 0.1 0.6 0.7 GEA FTTP 40/10 Connections Voice and Data 0.2 - 0.2 1,917 - conns 92.00 - 0.0 - 0.0 GEA FTTP 40/10 Connections Transitions 0.2 - 0.2 2,055 - conns 92.00 - 0.4 - 0.4 GEA Cablelink 1 Gbps Connections 5.0 6.7 11.7 3,706 5,131 conns 1,352.45 1,297.06 2.3 3.7 6.0 GEA Cablelink 10 Gbps Connections 4.3 1.1 5.4 1,174 545 conns 3,637.20 2,008.35 1.6 0.8 2.4 GEA Bandwidth Modify to 40/10 0.5 0.1 0.6 43,054 10,542 amendments 11.25 11.25 0.1 0.0 0.1 GEA VLAN Moves Applied to Cablelink 26.0 1.2 27.2 2,140,296 102,330 amendments 12.13 11.93 3.0 0.1 3.1 GEA 40/10 Cancel/Amend/Modify - CRD 3.8 6.8 10.6 2,681,035 1,067,359 amendments 1.40 6.38 3.5 1.4 4.9 GEA 40/10 Cancel/Amend/Modify - Regrades 2.1 0.0 2.1 186,483 2,588 amendments 11.25 11.25 0.3 0.0 0.3 GEA CP to CP Migrations 2.9 3.6 6.5 267,058 325,548 amendments 11.00 11.00 1.9 2.3 4.2 GEA Superfast Visit Assure 13.1 12.6 25.7 99,931 96,645 amendments 131.04 130.78 12.2 11.8 24.0 MPF Rentals (SML1) 0.3 676.2 676.5 3,021 7,912,229 lines 85.46 85.46 0.2 646.3 646.5 MPF New Provides 1.0 62.4 63.4 23,023 1,682,248 conns 44.42 37.11 0.6 47.5 48.1 MPF Single Migrations - 17.9 17.9 - 588,909 conns - 30.39 - 15.2 15.2 MPF Bulk Migrations - 0.4 0.4 - 16,846 conns - 21.07 - 0.4 0.4 MPF Cancellation of Orders 0.0 3.7 3.7 2,067 360,854 cancellations 10.28 10.28 0.0 1.1 1.1 MPF Amend Orders - 0.8 0.8 - 81,963 amendments - 10.28 - 0.3 0.3 MPF Standard Line Test - 0.0 0.0 - 5,073 tests - 3.93 - 0.0 0.0 Co-mingling New Provide and Rentals - 36.4 36.4 (ux) (ux) (ux) (sx) (sx) - 67.0 67.0 Tie Cables 12.9 5.1 18.0 (ux) (ux) (ux) (sx) (sx) 13.5 9.8 23.3 Hard Ceases 8.4 16.5 24.9 390,726 829,176 ceases 21.58 19.85 5.4 11.3 16.7 Other MPF Ancillaries 6.4 9.1 15.5 137,265 289,545 ancillaries 46.78 31.35 0.8 2.3 3.1 Special Fault Investigations 16.7 16.5 33.2 (ux) (ux) (ux) (sx) (sx) 25.9 19.9 45.8 Time Related Charges 7.8 22.1 29.9 (ux) (ux) (ux) (sx) (sx) 7.0 19.9 26.9 Abortive Visit Charges 3.0 8.7 11.7 33,742 96,371 visits 90.00 90.00 1.7 4.8 6.5 Other WLA 203.9 194.4 398.3 (ux) (ux) (ux) (sx) (sx) 191.2 172.1 363.3 Rounding 0.1 - 0.1 (0.1 ) - (0.1 )Total WLA 935.4 1,433.0 2,368.4 702.5 1,283.3 1,985.8
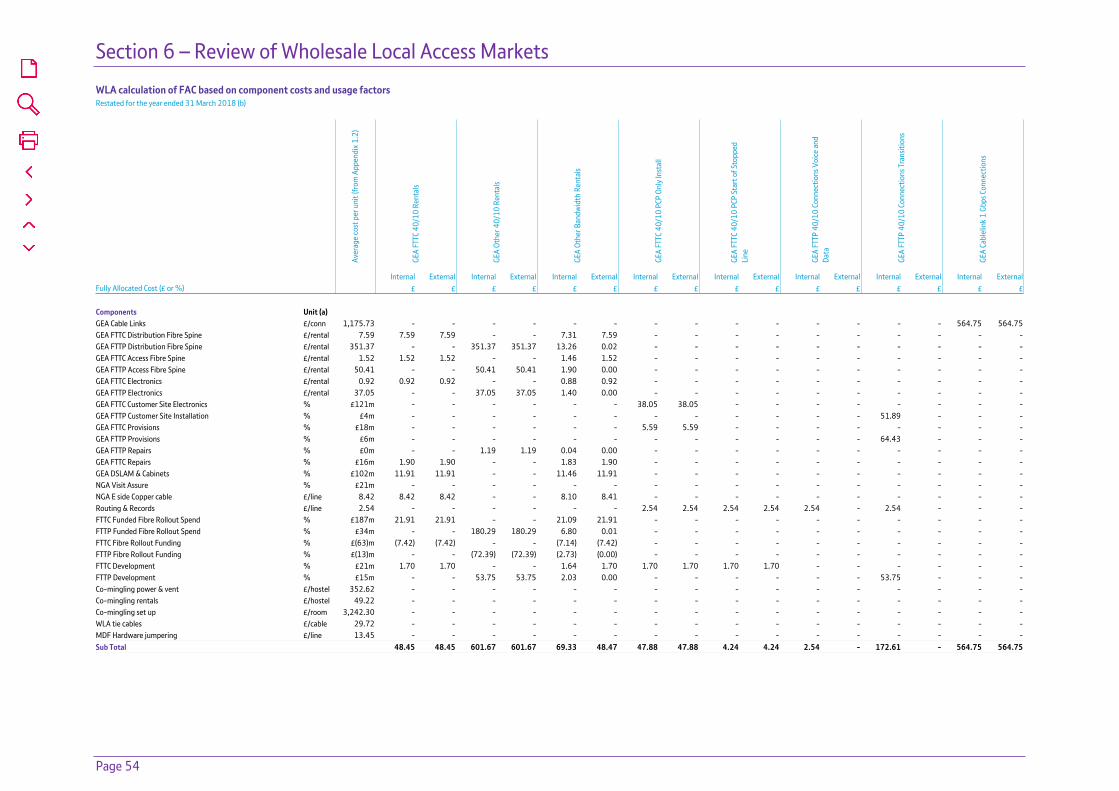
Section 6 – Review of Wholesale Local Access Markets
Page 54
WLA calculation of FAC based on component costs and usage factorsRestated for the year ended 31 March 2018 (b)
Aver
age
cost
per
uni
t (fr
om A
ppen
dix 1
.2)
GEA
FTTC
40/
10 R
enta
ls
GEA
Othe
r 40/
10 R
enta
ls
GEA
Othe
r Ban
dwid
th R
enta
ls
GEA
FTTC
40/
10 P
CP O
nly
Inst
all
GEA
FTTC
40/
10 P
CP S
tart
of S
topp
ed
Line
GEA
FTTP
40/
10 C
onne
ctio
ns V
oice
and
Da
ta
GEA
FTTP
40/
10 C
onne
ctio
ns T
rans
ition
s
GEA
Cabl
elin
k 1
Gbps
Con
nect
ions
Internal External Internal External Internal External Internal External Internal External Internal External Internal External Internal ExternalFully Allocated Cost (£ or %) £ £ £ £ £ £ £ £ £ £ £ £ £ £ £ £ Components Unit (a) GEA Cable Links £/conn 1,175.73 - - - - - - - - - - - - - - 564.75 564.75GEA FTTC Distribution Fibre Spine £/rental 7.59 7.59 7.59 - - 7.31 7.59 - - - - - - - - - -GEA FTTP Distribution Fibre Spine £/rental 351.37 - - 351.37 351.37 13.26 0.02 - - - - - - - - - -GEA FTTC Access Fibre Spine £/rental 1.52 1.52 1.52 - - 1.46 1.52 - - - - - - - - - -GEA FTTP Access Fibre Spine £/rental 50.41 - - 50.41 50.41 1.90 0.00 - - - - - - - - - -GEA FTTC Electronics £/rental 0.92 0.92 0.92 - - 0.88 0.92 - - - - - - - - - -GEA FTTP Electronics £/rental 37.05 - - 37.05 37.05 1.40 0.00 - - - - - - - - - -GEA FTTC Customer Site Electronics % £121m - - - - - - 38.05 38.05 - - - - - - - -GEA FTTP Customer Site Installation % £4m - - - - - - - - - - - - 51.89 - - -GEA FTTC Provisions % £18m - - - - - - 5.59 5.59 - - - - - - - -GEA FTTP Provisions % £6m - - - - - - - - - - - - 64.43 - - -GEA FTTP Repairs % £0m - - 1.19 1.19 0.04 0.00 - - - - - - - - - -GEA FTTC Repairs % £16m 1.90 1.90 - - 1.83 1.90 - - - - - - - - - -GEA DSLAM & Cabinets % £102m 11.91 11.91 - - 11.46 11.91 - - - - - - - - - -NGA Visit Assure % £21m - - - - - - - - - - - - - - - -NGA E side Copper cable £/line 8.42 8.42 8.42 - - 8.10 8.41 - - - - - - - - - -Routing & Records £/line 2.54 - - - - - - 2.54 2.54 2.54 2.54 2.54 - 2.54 - - -FTTC Funded Fibre Rollout Spend % £187m 21.91 21.91 - - 21.09 21.91 - - - - - - - - - -FTTP Funded Fibre Rollout Spend % £34m - - 180.29 180.29 6.80 0.01 - - - - - - - - - -FTTC Fibre Rollout Funding % £(63)m (7.42) (7.42) - - (7.14) (7.42) - - - - - - - - - -FTTP Fibre Rollout Funding % £(13)m - - (72.39) (72.39) (2.73) (0.00) - - - - - - - - - -FTTC Development % £21m 1.70 1.70 - - 1.64 1.70 1.70 1.70 1.70 1.70 - - - - - -FTTP Development % £15m - - 53.75 53.75 2.03 0.00 - - - - - - 53.75 - - -Co-mingling power & vent £/hostel 352.62 - - - - - - - - - - - - - - - -Co-mingling rentals £/hostel 49.22 - - - - - - - - - - - - - - - -Co-mingling set up £/room 3,242.30 - - - - - - - - - - - - - - - -WLA tie cables £/cable 29.72 - - - - - - - - - - - - - - - -MDF Hardware jumpering £/line 13.45 - - - - - - - - - - - - - - - -Sub Total 48.45 48.45 601.67 601.67 69.33 48.47 47.88 47.88 4.24 4.24 2.54 - 172.61 - 564.75 564.75
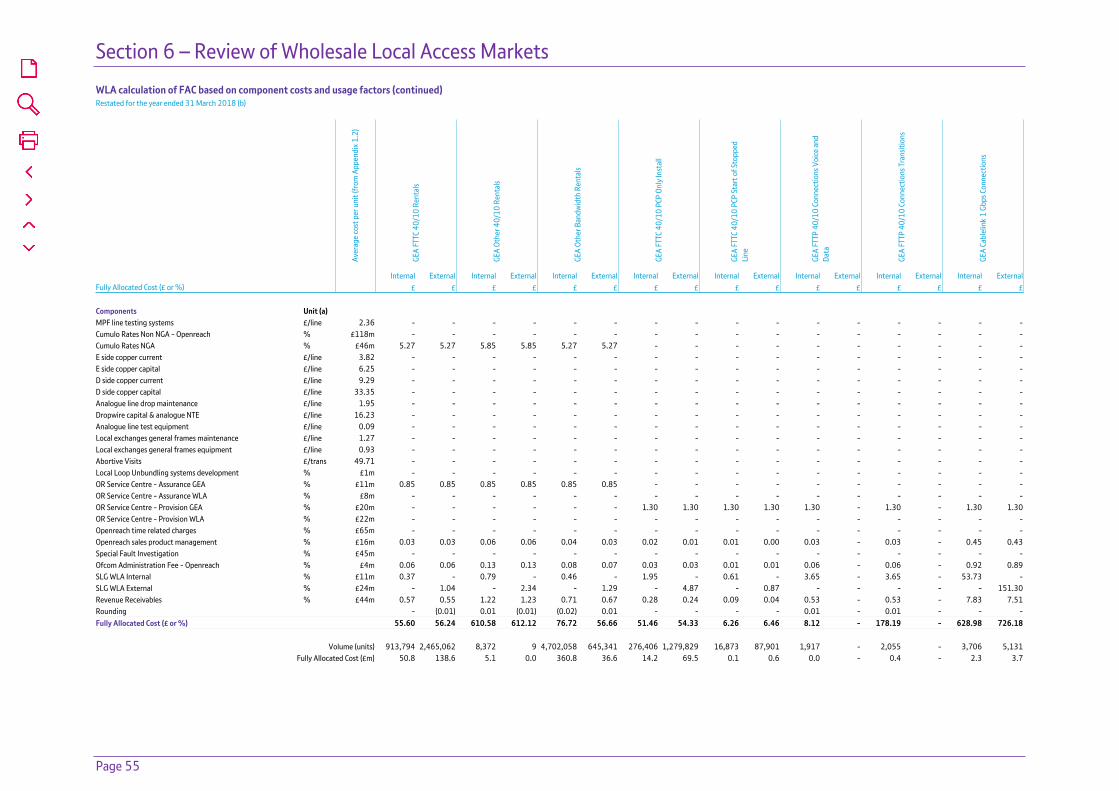
Section 6 – Review of Wholesale Local Access Markets
Page 55
WLA calculation of FAC based on component costs and usage factors (continued)Restated for the year ended 31 March 2018 (b)
Aver
age
cost
per
uni
t (fr
om A
ppen
dix 1
.2)
GEA
FTTC
40/
10 R
enta
ls
GEA
Othe
r 40/
10 R
enta
ls
GEA
Othe
r Ban
dwid
th R
enta
ls
GEA
FTTC
40/
10 P
CP O
nly
Inst
all
GEA
FTTC
40/
10 P
CP S
tart
of S
topp
ed
Line
GEA
FTTP
40/
10 C
onne
ctio
ns V
oice
and
Da
ta
GEA
FTTP
40/
10 C
onne
ctio
ns T
rans
ition
s
GEA
Cabl
elin
k 1
Gbps
Con
nect
ions
Internal External Internal External Internal External Internal External Internal External Internal External Internal External Internal ExternalFully Allocated Cost (£ or %) £ £ £ £ £ £ £ £ £ £ £ £ £ £ £ £ Components Unit (a) MPF line testing systems £/line 2.36 - - - - - - - - - - - - - - - -Cumulo Rates Non NGA - Openreach % £118m - - - - - - - - - - - - - - - -Cumulo Rates NGA % £46m 5.27 5.27 5.85 5.85 5.27 5.27 - - - - - - - - - -E side copper current £/line 3.82 - - - - - - - - - - - - - - - -E side copper capital £/line 6.25 - - - - - - - - - - - - - - - -D side copper current £/line 9.29 - - - - - - - - - - - - - - - -D side copper capital £/line 33.35 - - - - - - - - - - - - - - - -Analogue line drop maintenance £/line 1.95 - - - - - - - - - - - - - - - -Dropwire capital & analogue NTE £/line 16.23 - - - - - - - - - - - - - - - -Analogue line test equipment £/line 0.09 - - - - - - - - - - - - - - - -Local exchanges general frames maintenance £/line 1.27 - - - - - - - - - - - - - - - -Local exchanges general frames equipment £/line 0.93 - - - - - - - - - - - - - - - -Abortive Visits £/trans 49.71 - - - - - - - - - - - - - - - -Local Loop Unbundling systems development % £1m - - - - - - - - - - - - - - - -OR Service Centre - Assurance GEA % £11m 0.85 0.85 0.85 0.85 0.85 0.85 - - - - - - - - - -OR Service Centre - Assurance WLA % £8m - - - - - - - - - - - - - - - -OR Service Centre - Provision GEA % £20m - - - - - - 1.30 1.30 1.30 1.30 1.30 - 1.30 - 1.30 1.30OR Service Centre - Provision WLA % £22m - - - - - - - - - - - - - - - -Openreach time related charges % £65m - - - - - - - - - - - - - - - -Openreach sales product management % £16m 0.03 0.03 0.06 0.06 0.04 0.03 0.02 0.01 0.01 0.00 0.03 - 0.03 - 0.45 0.43Special Fault Investigation % £45m - - - - - - - - - - - - - - - -Ofcom Administration Fee - Openreach % £4m 0.06 0.06 0.13 0.13 0.08 0.07 0.03 0.03 0.01 0.01 0.06 - 0.06 - 0.92 0.89SLG WLA Internal % £11m 0.37 - 0.79 - 0.46 - 1.95 - 0.61 - 3.65 - 3.65 - 53.73 -SLG WLA External % £24m - 1.04 - 2.34 - 1.29 - 4.87 - 0.87 - - - - - 151.30Revenue Receivables % £44m 0.57 0.55 1.22 1.23 0.71 0.67 0.28 0.24 0.09 0.04 0.53 - 0.53 - 7.83 7.51Rounding - (0.01) 0.01 (0.01) (0.02) 0.01 - - - - 0.01 - 0.01 - - -Fully Allocated Cost (£ or %) 55.60 56.24 610.58 612.12 76.72 56.66 51.46 54.33 6.26 6.46 8.12 - 178.19 - 628.98 726.18
Volume (units) 913,794 2,465,062 8,372 9 4,702,058 645,341 276,406 1,279,829 16,873 87,901 1,917 - 2,055 - 3,706 5,131Fully Allocated Cost (£m) 50.8 138.6 5.1 0.0 360.8 36.6 14.2 69.5 0.1 0.6 0.0 - 0.4 - 2.3 3.7
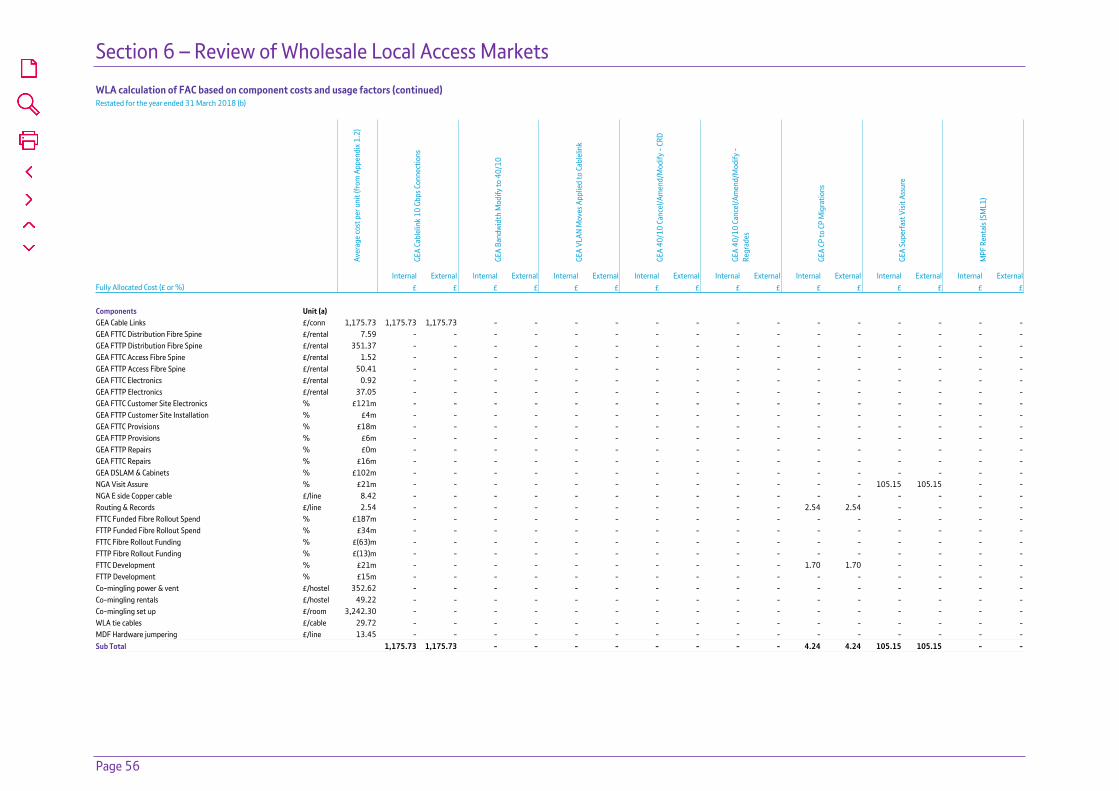
Section 6 – Review of Wholesale Local Access Markets
Page 56
WLA calculation of FAC based on component costs and usage factors (continued)Restated for the year ended 31 March 2018 (b)
Aver
age
cost
per
uni
t (fr
om A
ppen
dix 1
.2)
GEA
Cabl
elin
k 10
Gbp
s Con
nect
ions
GEA
Band
wid
th M
odify
to 4
0/10
GEA
VLAN
Mov
es A
pplie
d to
Cab
lelin
k
GEA
40/1
0 Ca
ncel
/Am
end/
Mod
ify -
CRD
GEA
40/1
0 Ca
ncel
/Am
end/
Mod
ify -
Regr
ades
GEA
CP to
CP
Mig
ratio
ns
GEA
Supe
rfas
t Visi
t Ass
ure
MPF
Ren
tals
(SM
L1)
Internal External Internal External Internal External Internal External Internal External Internal External Internal External Internal ExternalFully Allocated Cost (£ or %) £ £ £ £ £ £ £ £ £ £ £ £ £ £ £ £ Components Unit (a) GEA Cable Links £/conn 1,175.73 1,175.73 1,175.73 - - - - - - - - - - - - - -GEA FTTC Distribution Fibre Spine £/rental 7.59 - - - - - - - - - - - - - - - -GEA FTTP Distribution Fibre Spine £/rental 351.37 - - - - - - - - - - - - - - - -GEA FTTC Access Fibre Spine £/rental 1.52 - - - - - - - - - - - - - - - -GEA FTTP Access Fibre Spine £/rental 50.41 - - - - - - - - - - - - - - - -GEA FTTC Electronics £/rental 0.92 - - - - - - - - - - - - - - - -GEA FTTP Electronics £/rental 37.05 - - - - - - - - - - - - - - - -GEA FTTC Customer Site Electronics % £121m - - - - - - - - - - - - - - - -GEA FTTP Customer Site Installation % £4m - - - - - - - - - - - - - - - -GEA FTTC Provisions % £18m - - - - - - - - - - - - - - - -GEA FTTP Provisions % £6m - - - - - - - - - - - - - - - -GEA FTTP Repairs % £0m - - - - - - - - - - - - - - - -GEA FTTC Repairs % £16m - - - - - - - - - - - - - - - -GEA DSLAM & Cabinets % £102m - - - - - - - - - - - - - - - -NGA Visit Assure % £21m - - - - - - - - - - - - 105.15 105.15 - -NGA E side Copper cable £/line 8.42 - - - - - - - - - - - - - - - -Routing & Records £/line 2.54 - - - - - - - - - - 2.54 2.54 - - - -FTTC Funded Fibre Rollout Spend % £187m - - - - - - - - - - - - - - - -FTTP Funded Fibre Rollout Spend % £34m - - - - - - - - - - - - - - - -FTTC Fibre Rollout Funding % £(63)m - - - - - - - - - - - - - - - -FTTP Fibre Rollout Funding % £(13)m - - - - - - - - - - - - - - - -FTTC Development % £21m - - - - - - - - - - 1.70 1.70 - - - -FTTP Development % £15m - - - - - - - - - - - - - - - -Co-mingling power & vent £/hostel 352.62 - - - - - - - - - - - - - - - -Co-mingling rentals £/hostel 49.22 - - - - - - - - - - - - - - - -Co-mingling set up £/room 3,242.30 - - - - - - - - - - - - - - - -WLA tie cables £/cable 29.72 - - - - - - - - - - - - - - - -MDF Hardware jumpering £/line 13.45 - - - - - - - - - - - - - - - -Sub Total 1,175.73 1,175.73 - - - - - - - - 4.24 4.24 105.15 105.15 - -
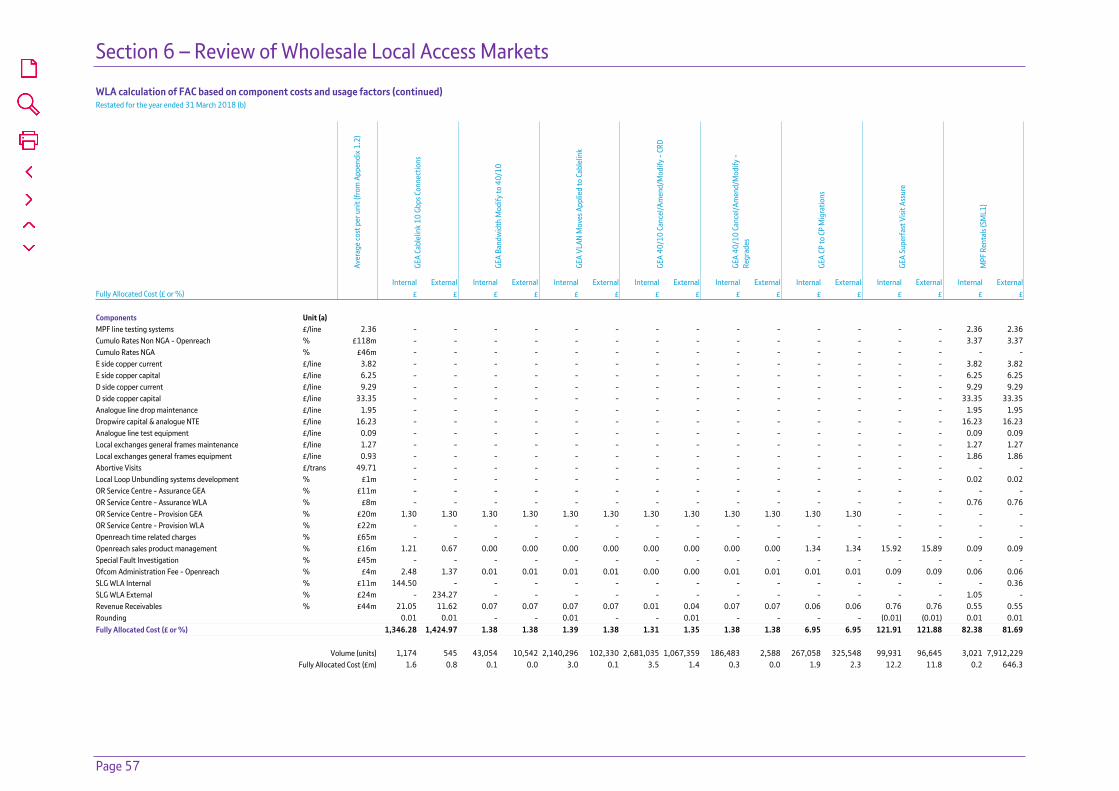
Section 6 – Review of Wholesale Local Access Markets
Page 57
WLA calculation of FAC based on component costs and usage factors (continued)Restated for the year ended 31 March 2018 (b)
Aver
age
cost
per
uni
t (fr
om A
ppen
dix 1
.2)
GEA
Cabl
elin
k 10
Gbp
s Con
nect
ions
GEA
Band
wid
th M
odify
to 4
0/10
GEA
VLAN
Mov
es A
pplie
d to
Cab
lelin
k
GEA
40/1
0 Ca
ncel
/Am
end/
Mod
ify -
CRD
GEA
40/1
0 Ca
ncel
/Am
end/
Mod
ify -
Regr
ades
GEA
CP to
CP
Mig
ratio
ns
GEA
Supe
rfas
t Visi
t Ass
ure
MPF
Ren
tals
(SM
L1)
Internal External Internal External Internal External Internal External Internal External Internal External Internal External Internal ExternalFully Allocated Cost (£ or %) £ £ £ £ £ £ £ £ £ £ £ £ £ £ £ £ Components Unit (a) MPF line testing systems £/line 2.36 - - - - - - - - - - - - - - 2.36 2.36Cumulo Rates Non NGA - Openreach % £118m - - - - - - - - - - - - - - 3.37 3.37Cumulo Rates NGA % £46m - - - - - - - - - - - - - - - -E side copper current £/line 3.82 - - - - - - - - - - - - - - 3.82 3.82E side copper capital £/line 6.25 - - - - - - - - - - - - - - 6.25 6.25D side copper current £/line 9.29 - - - - - - - - - - - - - - 9.29 9.29D side copper capital £/line 33.35 - - - - - - - - - - - - - - 33.35 33.35Analogue line drop maintenance £/line 1.95 - - - - - - - - - - - - - - 1.95 1.95Dropwire capital & analogue NTE £/line 16.23 - - - - - - - - - - - - - - 16.23 16.23Analogue line test equipment £/line 0.09 - - - - - - - - - - - - - - 0.09 0.09Local exchanges general frames maintenance £/line 1.27 - - - - - - - - - - - - - - 1.27 1.27Local exchanges general frames equipment £/line 0.93 - - - - - - - - - - - - - - 1.86 1.86Abortive Visits £/trans 49.71 - - - - - - - - - - - - - - - -Local Loop Unbundling systems development % £1m - - - - - - - - - - - - - - 0.02 0.02OR Service Centre - Assurance GEA % £11m - - - - - - - - - - - - - - - -OR Service Centre - Assurance WLA % £8m - - - - - - - - - - - - - - 0.76 0.76OR Service Centre - Provision GEA % £20m 1.30 1.30 1.30 1.30 1.30 1.30 1.30 1.30 1.30 1.30 1.30 1.30 - - - -OR Service Centre - Provision WLA % £22m - - - - - - - - - - - - - - - -Openreach time related charges % £65m - - - - - - - - - - - - - - - -Openreach sales product management % £16m 1.21 0.67 0.00 0.00 0.00 0.00 0.00 0.00 0.00 0.00 1.34 1.34 15.92 15.89 0.09 0.09Special Fault Investigation % £45m - - - - - - - - - - - - - - - -Ofcom Administration Fee - Openreach % £4m 2.48 1.37 0.01 0.01 0.01 0.01 0.00 0.00 0.01 0.01 0.01 0.01 0.09 0.09 0.06 0.06SLG WLA Internal % £11m 144.50 - - - - - - - - - - - - - - 0.36SLG WLA External % £24m - 234.27 - - - - - - - - - - - - 1.05 -Revenue Receivables % £44m 21.05 11.62 0.07 0.07 0.07 0.07 0.01 0.04 0.07 0.07 0.06 0.06 0.76 0.76 0.55 0.55Rounding 0.01 0.01 - - 0.01 - - 0.01 - - - - (0.01) (0.01) 0.01 0.01Fully Allocated Cost (£ or %) 1,346.28 1,424.97 1.38 1.38 1.39 1.38 1.31 1.35 1.38 1.38 6.95 6.95 121.91 121.88 82.38 81.69
Volume (units) 1,174 545 43,054 10,542 2,140,296 102,330 2,681,035 1,067,359 186,483 2,588 267,058 325,548 99,931 96,645 3,021 7,912,229Fully Allocated Cost (£m) 1.6 0.8 0.1 0.0 3.0 0.1 3.5 1.4 0.3 0.0 1.9 2.3 12.2 11.8 0.2 646.3
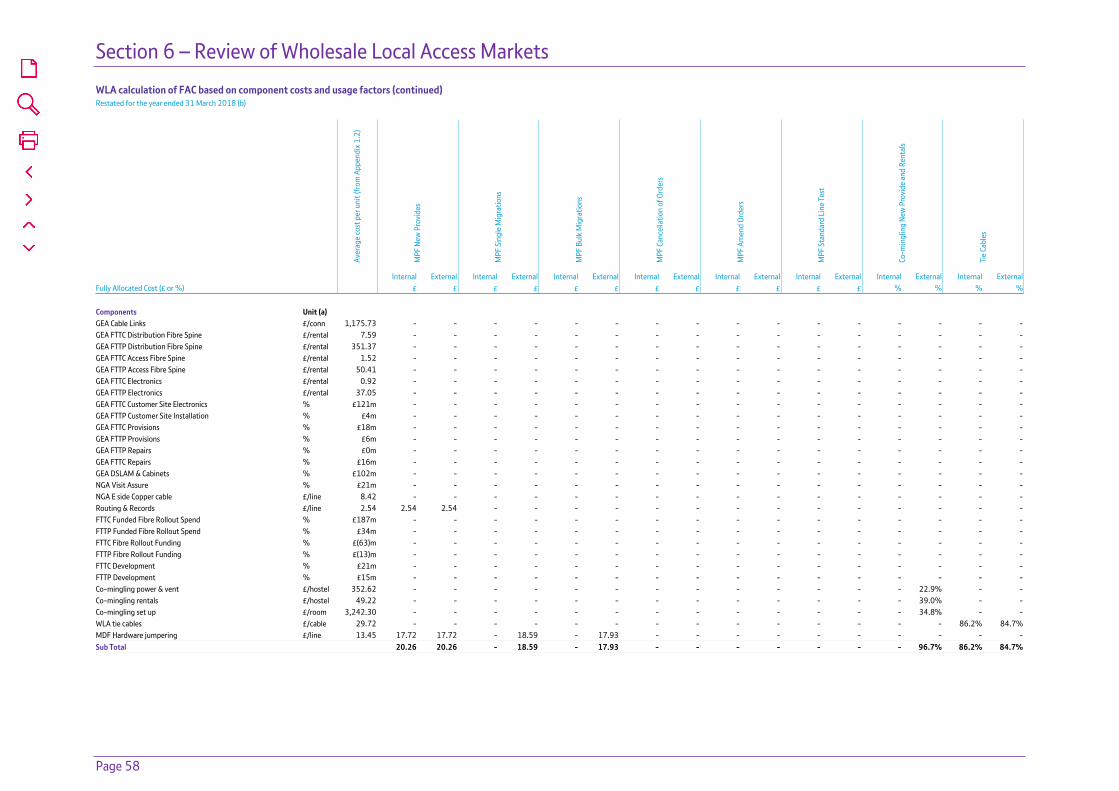
Section 6 – Review of Wholesale Local Access Markets
Page 58
WLA calculation of FAC based on component costs and usage factors (continued)Restated for the year ended 31 March 2018 (b)
Aver
age
cost
per
uni
t (fr
om A
ppen
dix 1
.2)
MPF
New
Pro
vide
s
MPF
Sin
gle
Mig
ratio
ns
MPF
Bul
k M
igra
tions
MPF
Can
cella
tion
of O
rder
s
MPF
Am
end
Orde
rs
MPF
Sta
ndar
d Li
ne T
est
Co-m
ingl
ing
New
Pro
vide
and
Ren
tals
Tie
Cabl
es
Internal External Internal External Internal External Internal External Internal External Internal External Internal External Internal ExternalFully Allocated Cost (£ or %) £ £ £ £ £ £ £ £ £ £ £ £ % % % % Components Unit (a) GEA Cable Links £/conn 1,175.73 - - - - - - - - - - - - - - - -GEA FTTC Distribution Fibre Spine £/rental 7.59 - - - - - - - - - - - - - - - -GEA FTTP Distribution Fibre Spine £/rental 351.37 - - - - - - - - - - - - - - - -GEA FTTC Access Fibre Spine £/rental 1.52 - - - - - - - - - - - - - - - -GEA FTTP Access Fibre Spine £/rental 50.41 - - - - - - - - - - - - - - - -GEA FTTC Electronics £/rental 0.92 - - - - - - - - - - - - - - - -GEA FTTP Electronics £/rental 37.05 - - - - - - - - - - - - - - - -GEA FTTC Customer Site Electronics % £121m - - - - - - - - - - - - - - - -GEA FTTP Customer Site Installation % £4m - - - - - - - - - - - - - - - -GEA FTTC Provisions % £18m - - - - - - - - - - - - - - - -GEA FTTP Provisions % £6m - - - - - - - - - - - - - - - -GEA FTTP Repairs % £0m - - - - - - - - - - - - - - - -GEA FTTC Repairs % £16m - - - - - - - - - - - - - - - -GEA DSLAM & Cabinets % £102m - - - - - - - - - - - - - - - -NGA Visit Assure % £21m - - - - - - - - - - - - - - - -NGA E side Copper cable £/line 8.42 - - - - - - - - - - - - - - - -Routing & Records £/line 2.54 2.54 2.54 - - - - - - - - - - - - - -FTTC Funded Fibre Rollout Spend % £187m - - - - - - - - - - - - - - - -FTTP Funded Fibre Rollout Spend % £34m - - - - - - - - - - - - - - - -FTTC Fibre Rollout Funding % £(63)m - - - - - - - - - - - - - - - -FTTP Fibre Rollout Funding % £(13)m - - - - - - - - - - - - - - - -FTTC Development % £21m - - - - - - - - - - - - - - - -FTTP Development % £15m - - - - - - - - - - - - - - - -Co-mingling power & vent £/hostel 352.62 - - - - - - - - - - - - - 22.9% - -Co-mingling rentals £/hostel 49.22 - - - - - - - - - - - - - 39.0% - -Co-mingling set up £/room 3,242.30 - - - - - - - - - - - - - 34.8% - -WLA tie cables £/cable 29.72 - - - - - - - - - - - - - - 86.2% 84.7%MDF Hardware jumpering £/line 13.45 17.72 17.72 - 18.59 - 17.93 - - - - - - - - - -Sub Total 20.26 20.26 - 18.59 - 17.93 - - - - - - - 96.7% 86.2% 84.7%

Section 6 – Review of Wholesale Local Access Markets
Page 59
WLA calculation of FAC based on component costs and usage factors (continued)Restated for the year ended 31 March 2018 (b)
Aver
age
cost
per
uni
t (fr
om A
ppen
dix 1
.2)
MPF
New
Pro
vide
s
MPF
Sin
gle
Mig
ratio
ns
MPF
Bul
k M
igra
tions
MPF
Can
cella
tion
of O
rder
s
MPF
Am
end
Orde
rs
MPF
Sta
ndar
d Li
ne T
est
Co-m
ingl
ing
New
Pro
vide
and
Ren
tals
Tie
Cabl
es
Internal External Internal External Internal External Internal External Internal External Internal External Internal External Internal ExternalFully Allocated Cost (£ or %) £ £ £ £ £ £ £ £ £ £ £ £ % % % % Components Unit (a) MPF line testing systems £/line 2.36 - - - - - - - - - - - - - - - -Cumulo Rates Non NGA - Openreach % £118m 0.00 0.00 - 0.00 - 0.00 0.00 0.00 - 0.00 - 0.00 - 1.9% 2.9% 2.9%Cumulo Rates NGA % £46m - - - - - - - - - - - - - - - -E side copper current £/line 3.82 - - - - - - - - - - - - - - - -E side copper capital £/line 6.25 - - - - - - - - - - - - - - - -D side copper current £/line 9.29 - - - - - - - - - - - - - - - -D side copper capital £/line 33.35 - - - - - - - - - - - - - - - -Analogue line drop maintenance £/line 1.95 - - - - - - - - - - - - - - - -Dropwire capital & analogue NTE £/line 16.23 - - - - - - - - - - - - - - - -Analogue line test equipment £/line 0.09 - - - - - - - - - - - - - - - -Local exchanges general frames maintenance £/line 1.27 - - - - - - - - - - - - - - - -Local exchanges general frames equipment £/line 0.93 - - - - - - - - - - - - - - - -Abortive Visits £/trans 49.71 - - - - - - - - - - - - - - - -Local Loop Unbundling systems development % £1m 0.02 0.02 - 0.02 - 0.02 0.02 0.02 - 0.02 - 0.02 - 0.0% 0.1% 0.1%OR Service Centre - Assurance GEA % £11m - - - - - - - - - - - - - - - -OR Service Centre - Assurance WLA % £8m - - - - - - - - - - - - - 0.6% 0.4% 2.2%OR Service Centre - Provision GEA % £20m - - - - - - - - - - - - - - - -OR Service Centre - Provision WLA % £22m 3.34 3.34 - 3.34 - 3.34 3.34 3.34 - 3.34 - 3.34 - 0.0% 9.7% 9.5%Openreach time related charges % £65m - - - - - - - - - - - - - - - -Openreach sales product management % £16m 0.05 0.04 - 0.03 - 0.02 0.00 0.00 - 0.00 - 0.00 - 0.3% 0.1% 0.3%Special Fault Investigation % £45m - - - - - - - - - - - - - - - -Ofcom Administration Fee - Openreach % £4m 0.03 0.03 - 0.02 - 0.01 0.01 0.01 - 0.01 - 0.00 - 0.0% 0.1% 0.0%SLG WLA Internal % £11m 1.76 - - - - - - - - - - - - - - -SLG WLA External % £24m - 4.33 - 3.54 - 2.46 - - - - - - - - - -Revenue Receivables % £44m 0.26 0.21 - 0.18 - 0.12 0.06 0.06 - 0.06 - 0.02 - 0.3% 0.6% 0.3%Rounding 0.01 0.01 - 0.02 - 0.01 0.01 0.01 - 0.01 - 0.01 - 0.2% (0.1)% -Fully Allocated Cost (£ or %) 25.73 28.24 - 25.74 - 23.91 3.44 3.44 - 3.44 - 3.39 - 100.0% 100.0% 100.0%
Volume (units) 23,023 1,682,248 - 588,909 - 16,846 2,067 360,854 - 81,963 - 5,073 (ux) (ux) (ux) (ux)Fully Allocated Cost (£m) 0.6 47.5 - 15.2 - 0.4 0.0 1.1 - 0.3 - 0.0 - 67.0 13.5 9.8

Section 6 – Review of Wholesale Local Access Markets
Page 60
WLA calculation of FAC based on component costs and usage factors (continued)Restated for the year ended 31 March 2018 (b)
Aver
age
cost
per
uni
t (fr
om A
ppen
dix 1
.2)
Hard
Cea
ses
Othe
r MPF
Anc
illar
ies
Spec
ial F
ault
Inve
stig
atio
ns
Tim
e Re
late
d Ch
arge
s
Abor
tive
Visit
Cha
rges
Internal External Internal External Internal External Internal External Internal ExternalFully Allocated Cost (£ or %) £ £ £ £ % % % % £ £ Components Unit (a) GEA Cable Links £/conn 1,175.73 - - - - - - - - - -GEA FTTC Distribution Fibre Spine £/rental 7.59 - - - - - - - - - -GEA FTTP Distribution Fibre Spine £/rental 351.37 - - - - - - - - - -GEA FTTC Access Fibre Spine £/rental 1.52 - - - - - - - - - -GEA FTTP Access Fibre Spine £/rental 50.41 - - - - - - - - - -GEA FTTC Electronics £/rental 0.92 - - - - - - - - - -GEA FTTP Electronics £/rental 37.05 - - - - - - - - - -GEA FTTC Customer Site Electronics % £121m - - - - - - - - - -GEA FTTP Customer Site Installation % £4m - - - - - - - - - -GEA FTTC Provisions % £18m - - - - - - - - - -GEA FTTP Provisions % £6m - - - - - - - - - -GEA FTTP Repairs % £0m - - - - - - - - - -GEA FTTC Repairs % £16m - - - - - - - - - -GEA DSLAM & Cabinets % £102m - - - - - - - - - -NGA Visit Assure % £21m - - - - - - - - - -NGA E side Copper cable £/line 8.42 - - - - - - - - - -Routing & Records £/line 2.54 - - - - - - - - - -FTTC Funded Fibre Rollout Spend % £187m - - - - - - - - - -FTTP Funded Fibre Rollout Spend % £34m - - - - - - - - - -FTTC Fibre Rollout Funding % £(63)m - - - - - - - - - -FTTP Fibre Rollout Funding % £(13)m - - - - - - - - - -FTTC Development % £21m - - - - - - - - - -FTTP Development % £15m - - - - - - - - - -Co-mingling power & vent £/hostel 352.62 - - - - - - - - - -Co-mingling rentals £/hostel 49.22 - - - - - - - - - -Co-mingling set up £/room 3,242.30 - - - - - - - - - -WLA tie cables £/cable 29.72 - - - - - - - - - -MDF Hardware jumpering £/line 13.45 10.11 10.04 0.56 0.56 - - - - - -Sub Total 10.11 10.04 0.56 0.56 - - - - - -

Section 6 – Review of Wholesale Local Access Markets
Page 61
WLA calculation of FAC based on component costs and usage factors (continued)Restated for the year ended 31 March 2018 (b)
Aver
age
cost
per
uni
t (fr
om A
ppen
dix 1
.2)
Hard
Cea
ses
Othe
r MPF
Anc
illar
ies
Spec
ial F
ault
Inve
stig
atio
ns
Tim
e Re
late
d Ch
arge
s
Abor
tive
Visit
Cha
rges
Internal External Internal External Internal External Internal External Internal ExternalFully Allocated Cost (£ or %) £ £ £ £ % % % % £ £ Components Unit (a) MPF line testing systems £/line 2.36 - - - - - - - - - -Cumulo Rates Non NGA - Openreach % £118m 0.00 0.00 0.00 0.00 0.0% 0.0% 0.0% 0.0% - -Cumulo Rates NGA % £46m - - - - - - - - - -E side copper current £/line 3.82 - - - - - - - - - -E side copper capital £/line 6.25 - - - - - - - - - -D side copper current £/line 9.29 - - - - - - - - - -D side copper capital £/line 33.35 - - - - - - - - - -Analogue line drop maintenance £/line 1.95 - - - - - - - - - -Dropwire capital & analogue NTE £/line 16.23 - - - - - - - - - -Analogue line test equipment £/line 0.09 - - - - - - - - - -Local exchanges general frames maintenance £/line 1.27 - - - - - - - - - -Local exchanges general frames equipment £/line 0.93 - - - - - - - - - -Abortive Visits £/trans 49.71 - - - - - - - - 48.65 48.65Local Loop Unbundling systems development % £1m 0.02 0.02 0.02 0.02 - - - - - -OR Service Centre - Assurance GEA % £11m - - - - - - - - - -OR Service Centre - Assurance WLA % £8m - - - - - - - - - -OR Service Centre - Provision GEA % £20m - - - - - - - - - -OR Service Centre - Provision WLA % £22m 3.34 3.34 3.34 3.34 - - - - - -Openreach time related charges % £65m - - - - - - 98.8% 98.8% - -Openreach sales product management % £16m 0.15 0.14 0.05 0.03 0.3% 0.4% 0.5% 0.5% 0.41 0.41Special Fault Investigation % £45m - - - - 99.3% 99.1% - - - -Ofcom Administration Fee - Openreach % £4m 0.01 0.01 0.03 0.02 0.0% 0.1% 0.1% 0.1% 0.06 0.06SLG WLA Internal % £11m - - 1.86 - - - - - - -SLG WLA External % £24m - - - 3.66 - - - - - -Revenue Receivables % £44m 0.12 0.11 0.27 0.18 0.4% 0.5% 0.6% 0.6% 0.52 0.52Rounding 0.02 0.02 0.01 0.01 - (0.1)% - - - -Fully Allocated Cost (£ or %) 13.77 13.68 6.14 7.82 100.0% 100.0% 100.0% 100.0% 49.64 49.64
Volume (units) 390,726 829,176 137,265 289,545 (ux) (ux) (ux) (ux) 33,742 96,371Fully Allocated Cost (£m) 5.4 11.3 0.8 2.3 25.9 19.9 7.0 19.9 1.7 4.8

Section 7 – Review of Business Connectivity Markets
Page 62
Section 7Review of Business Connectivity Markets
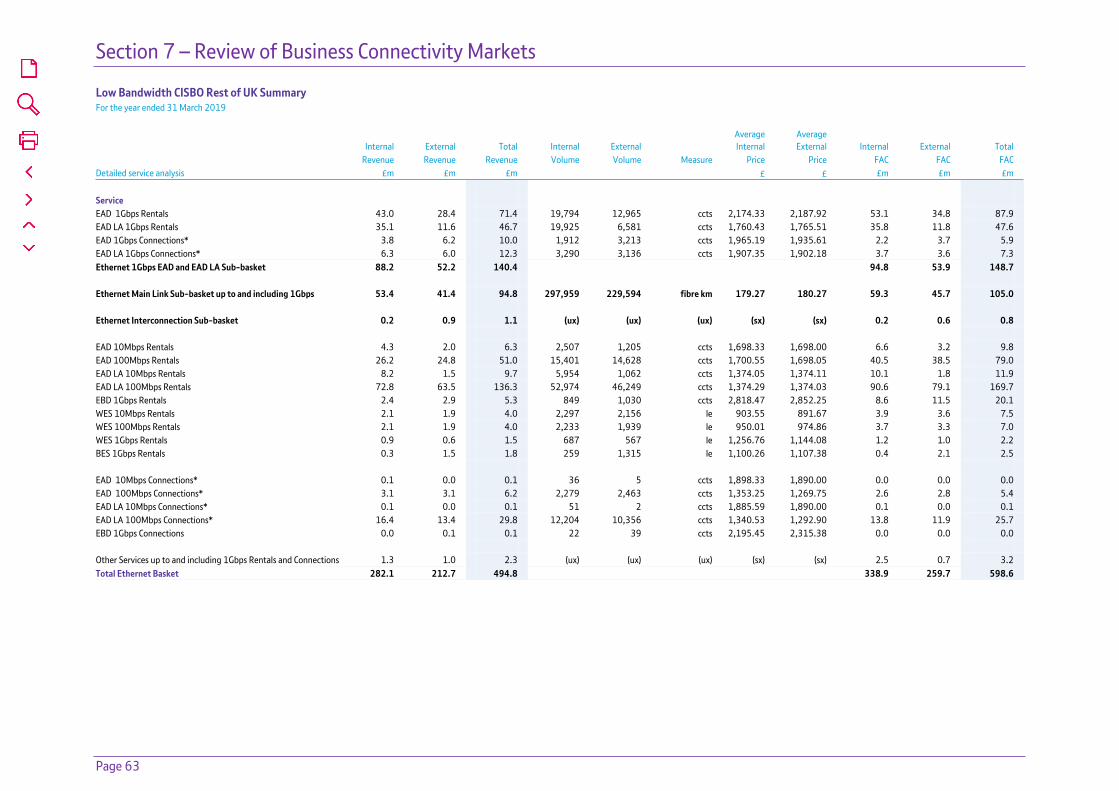
Section 7 – Review of Business Connectivity Markets
Page 63
Low Bandwidth CISBO Rest of UK Summary For the year ended 31 March 2019
Internal External Total Internal External Average Internal
Average External Internal External Total
Revenue Revenue Revenue Volume Volume Measure Price Price FAC FAC FAC Detailed service analysis £m £m £m £ £ £m £m £m Service EAD 1Gbps Rentals 43.0 28.4 71.4 19,794 12,965 ccts 2,174.33 2,187.92 53.1 34.8 87.9 EAD LA 1Gbps Rentals 35.1 11.6 46.7 19,925 6,581 ccts 1,760.43 1,765.51 35.8 11.8 47.6 EAD 1Gbps Connections* 3.8 6.2 10.0 1,912 3,213 ccts 1,965.19 1,935.61 2.2 3.7 5.9 EAD LA 1Gbps Connections* 6.3 6.0 12.3 3,290 3,136 ccts 1,907.35 1,902.18 3.7 3.6 7.3 Ethernet 1Gbps EAD and EAD LA Sub-basket 88.2 52.2 140.4 94.8 53.9 148.7 Ethernet Main Link Sub-basket up to and including 1Gbps 53.4 41.4 94.8 297,959 229,594 fibre km 179.27 180.27 59.3 45.7 105.0 Ethernet Interconnection Sub-basket 0.2 0.9 1.1 (ux) (ux) (ux) (sx) (sx) 0.2 0.6 0.8 EAD 10Mbps Rentals 4.3 2.0 6.3 2,507 1,205 ccts 1,698.33 1,698.00 6.6 3.2 9.8 EAD 100Mbps Rentals 26.2 24.8 51.0 15,401 14,628 ccts 1,700.55 1,698.05 40.5 38.5 79.0 EAD LA 10Mbps Rentals 8.2 1.5 9.7 5,954 1,062 ccts 1,374.05 1,374.11 10.1 1.8 11.9 EAD LA 100Mbps Rentals 72.8 63.5 136.3 52,974 46,249 ccts 1,374.29 1,374.03 90.6 79.1 169.7 EBD 1Gbps Rentals 2.4 2.9 5.3 849 1,030 ccts 2,818.47 2,852.25 8.6 11.5 20.1 WES 10Mbps Rentals 2.1 1.9 4.0 2,297 2,156 le 903.55 891.67 3.9 3.6 7.5 WES 100Mbps Rentals 2.1 1.9 4.0 2,233 1,939 le 950.01 974.86 3.7 3.3 7.0 WES 1Gbps Rentals 0.9 0.6 1.5 687 567 le 1,256.76 1,144.08 1.2 1.0 2.2 BES 1Gbps Rentals 0.3 1.5 1.8 259 1,315 le 1,100.26 1,107.38 0.4 2.1 2.5 EAD 10Mbps Connections* 0.1 0.0 0.1 36 5 ccts 1,898.33 1,890.00 0.0 0.0 0.0 EAD 100Mbps Connections* 3.1 3.1 6.2 2,279 2,463 ccts 1,353.25 1,269.75 2.6 2.8 5.4 EAD LA 10Mbps Connections* 0.1 0.0 0.1 51 2 ccts 1,885.59 1,890.00 0.1 0.0 0.1 EAD LA 100Mbps Connections* 16.4 13.4 29.8 12,204 10,356 ccts 1,340.53 1,292.90 13.8 11.9 25.7 EBD 1Gbps Connections 0.0 0.1 0.1 22 39 ccts 2,195.45 2,315.38 0.0 0.0 0.0 Other Services up to and including 1Gbps Rentals and Connections 1.3 1.0 2.3 (ux) (ux) (ux) (sx) (sx) 2.5 0.7 3.2 Total Ethernet Basket 282.1 212.7 494.8 338.9 259.7 598.6

Section 7 – Review of Business Connectivity Markets
Page 64
Low Bandwidth CISBO Rest of UK Summary (continued) For the year ended 31 March 2019
Internal External Total Internal External Average Internal
Average External Internal External Total
Revenue Revenue Revenue Volume Volume Measure Price Price FAC FAC FAC Detailed service analysis £m £m £m £ £ £m £m £m Exempt Ancillary Services 6.4 3.0 9.4 (ux) (ux) (ux) (sx) (sx) 3.8 1.2 5.0 Ethernet Time Related Charges (TRC) 2.1 0.3 2.4 (ux) (ux) (ux) (sx) (sx) 4.0 0.5 4.5 Excess Construction Charges (ECC) 10.5 8.0 18.5 (ux) (ux) (ux) (sx) (sx) 20.8 14.2 35.0 CISBO RoUK IFRS 15 (1.1 ) (7.4 ) (8.5 ) (ux) (ux) (ux) (sx) (sx) (0.7 ) (1.4 ) (2.1 )CISBO RoUK SLG (8.8 ) (8.4 ) (17.2 ) (ux) (ux) (ux) (sx) (sx) (8.8 ) (8.5 ) (17.3 ) Rounding (0.2 ) 0.1 (0.1 ) (0.1 ) - (0.1 )Total Lower Bandwidth CISBO Services Rest of UK 291.0 208.3 499.3 357.9 265.7 623.6 Notes *EAD Connection Services includes Excess Construction Charge fixed fee revenue of £26.8m with matched costs of £22.5m and £11.5m of attributed indirect costs Excess Construction Charge revenue of £18.5m has matched costs of £15.5m and £8.3m of attributed indirect costs Time Related Charge revenue of £2.4m has matched costs of £2m and £1.1m of attributed indirect costs EAD 100 Mbps - Includes internal discounted revenue of £1.2m on 814 connections and external discounted revenue of £1.4m on 974 connections EAD LA 100 Mbps - Includes internal discounted revenue of £7.4m on 5,226 connections and external discounted revenue of £7.2m on 5,053 connections There were no discounted revenues or volumes for EAD 1 Gbps and EAD LA 1 Gbps services
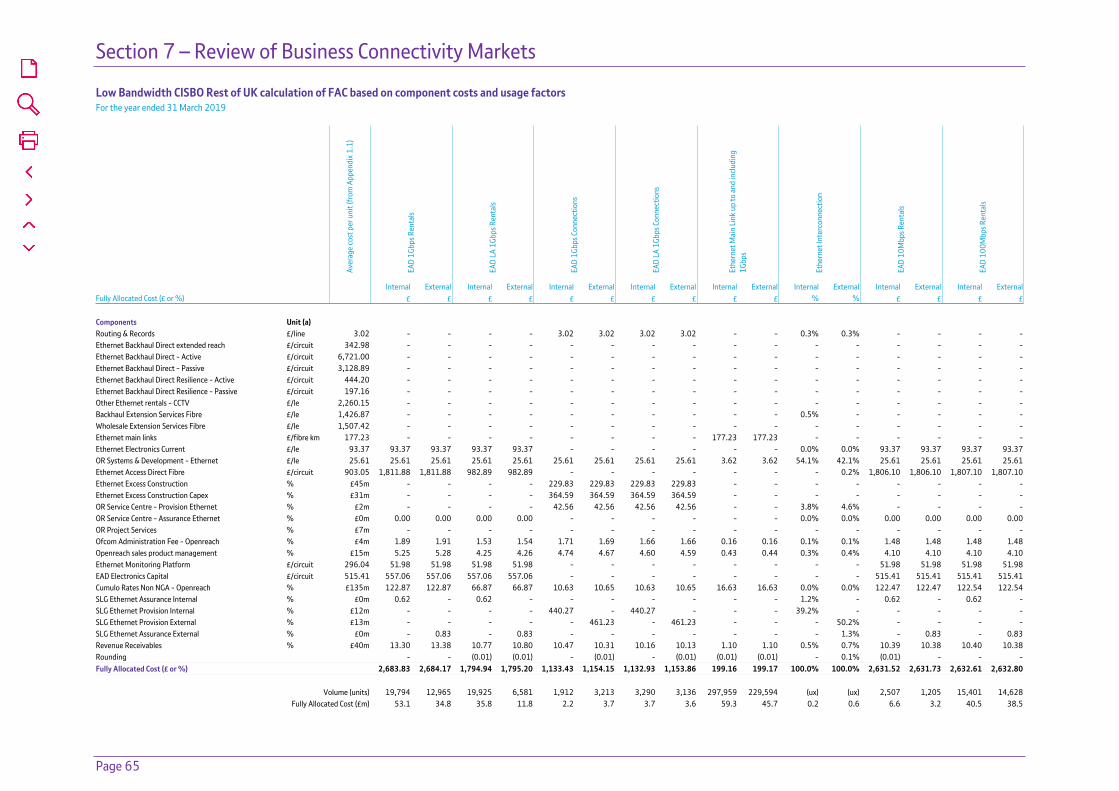
Section 7 – Review of Business Connectivity Markets
Page 65
Low Bandwidth CISBO Rest of UK calculation of FAC based on component costs and usage factorsFor the year ended 31 March 2019
Aver
age
cost
per
uni
t (fr
om A
ppen
dix 1
.1)
EAD
1Gbp
s Ren
tals
EAD
LA 1
Gbps
Ren
tals
EAD
1Gbp
s Con
nect
ions
EAD
LA 1
Gbps
Con
nect
ions
Ethe
rnet
Mai
n Li
nk u
p to
and
inclu
ding
1G
bps
Ethe
rnet
Inte
rcon
nect
ion
EAD
10M
bps R
enta
ls
EAD
100M
bps R
enta
ls
Internal External Internal External Internal External Internal External Internal External Internal External Internal External Internal ExternalFully Allocated Cost (£ or %) £ £ £ £ £ £ £ £ £ £ % % £ £ £ £ Components Unit (a) Routing & Records £/line 3.02 - - - - 3.02 3.02 3.02 3.02 - - 0.3% 0.3% - - - -Ethernet Backhaul Direct extended reach £/circuit 342.98 - - - - - - - - - - - - - - - -Ethernet Backhaul Direct - Active £/circuit 6,721.00 - - - - - - - - - - - - - - - -Ethernet Backhaul Direct - Passive £/circuit 3,128.89 - - - - - - - - - - - - - - - -Ethernet Backhaul Direct Resilience - Active £/circuit 444.20 - - - - - - - - - - - - - - - -Ethernet Backhaul Direct Resilience - Passive £/circuit 197.16 - - - - - - - - - - - - - - - -Other Ethernet rentals - CCTV £/le 2,260.15 - - - - - - - - - - - - - - - -Backhaul Extension Services Fibre £/le 1,426.87 - - - - - - - - - - 0.5% - - - - -Wholesale Extension Services Fibre £/le 1,507.42 - - - - - - - - - - - - - - - -Ethernet main links £/fibre km 177.23 - - - - - - - - 177.23 177.23 - - - - - -Ethernet Electronics Current £/le 93.37 93.37 93.37 93.37 93.37 - - - - - - 0.0% 0.0% 93.37 93.37 93.37 93.37OR Systems & Development - Ethernet £/le 25.61 25.61 25.61 25.61 25.61 25.61 25.61 25.61 25.61 3.62 3.62 54.1% 42.1% 25.61 25.61 25.61 25.61Ethernet Access Direct Fibre £/circuit 903.05 1,811.88 1,811.88 982.89 982.89 - - - - - - - 0.2% 1,806.10 1,806.10 1,807.10 1,807.10Ethernet Excess Construction % £45m - - - - 229.83 229.83 229.83 229.83 - - - - - - - -Ethernet Excess Construction Capex % £31m - - - - 364.59 364.59 364.59 364.59 - - - - - - - -OR Service Centre - Provision Ethernet % £2m - - - - 42.56 42.56 42.56 42.56 - - 3.8% 4.6% - - - -OR Service Centre - Assurance Ethernet % £0m 0.00 0.00 0.00 0.00 - - - - - - 0.0% 0.0% 0.00 0.00 0.00 0.00OR Project Services % £7m - - - - - - - - - - - - - - - -Ofcom Administration Fee - Openreach % £4m 1.89 1.91 1.53 1.54 1.71 1.69 1.66 1.66 0.16 0.16 0.1% 0.1% 1.48 1.48 1.48 1.48Openreach sales product management % £15m 5.25 5.28 4.25 4.26 4.74 4.67 4.60 4.59 0.43 0.44 0.3% 0.4% 4.10 4.10 4.10 4.10Ethernet Monitoring Platform £/circuit 296.04 51.98 51.98 51.98 51.98 - - - - - - - - 51.98 51.98 51.98 51.98EAD Electronics Capital £/circuit 515.41 557.06 557.06 557.06 557.06 - - - - - - - - 515.41 515.41 515.41 515.41Cumulo Rates Non NGA - Openreach % £135m 122.87 122.87 66.87 66.87 10.63 10.65 10.63 10.65 16.63 16.63 0.0% 0.0% 122.47 122.47 122.54 122.54SLG Ethernet Assurance Internal % £0m 0.62 - 0.62 - - - - - - - 1.2% - 0.62 - 0.62 -SLG Ethernet Provision Internal % £12m - - - - 440.27 - 440.27 - - - 39.2% - - - - -SLG Ethernet Provision External % £13m - - - - - 461.23 - 461.23 - - - 50.2% - - - -SLG Ethernet Assurance External % £0m - 0.83 - 0.83 - - - - - - - 1.3% - 0.83 - 0.83Revenue Receivables % £40m 13.30 13.38 10.77 10.80 10.47 10.31 10.16 10.13 1.10 1.10 0.5% 0.7% 10.39 10.38 10.40 10.38Rounding - - (0.01) (0.01) - (0.01) - (0.01) (0.01) (0.01) - 0.1% (0.01) - - -Fully Allocated Cost (£ or %) 2,683.83 2,684.17 1,794.94 1,795.20 1,133.43 1,154.15 1,132.93 1,153.86 199.16 199.17 100.0% 100.0% 2,631.52 2,631.73 2,632.61 2,632.80
Volume (units) 19,794 12,965 19,925 6,581 1,912 3,213 3,290 3,136 297,959 229,594 (ux) (ux) 2,507 1,205 15,401 14,628Fully Allocated Cost (£m) 53.1 34.8 35.8 11.8 2.2 3.7 3.7 3.6 59.3 45.7 0.2 0.6 6.6 3.2 40.5 38.5
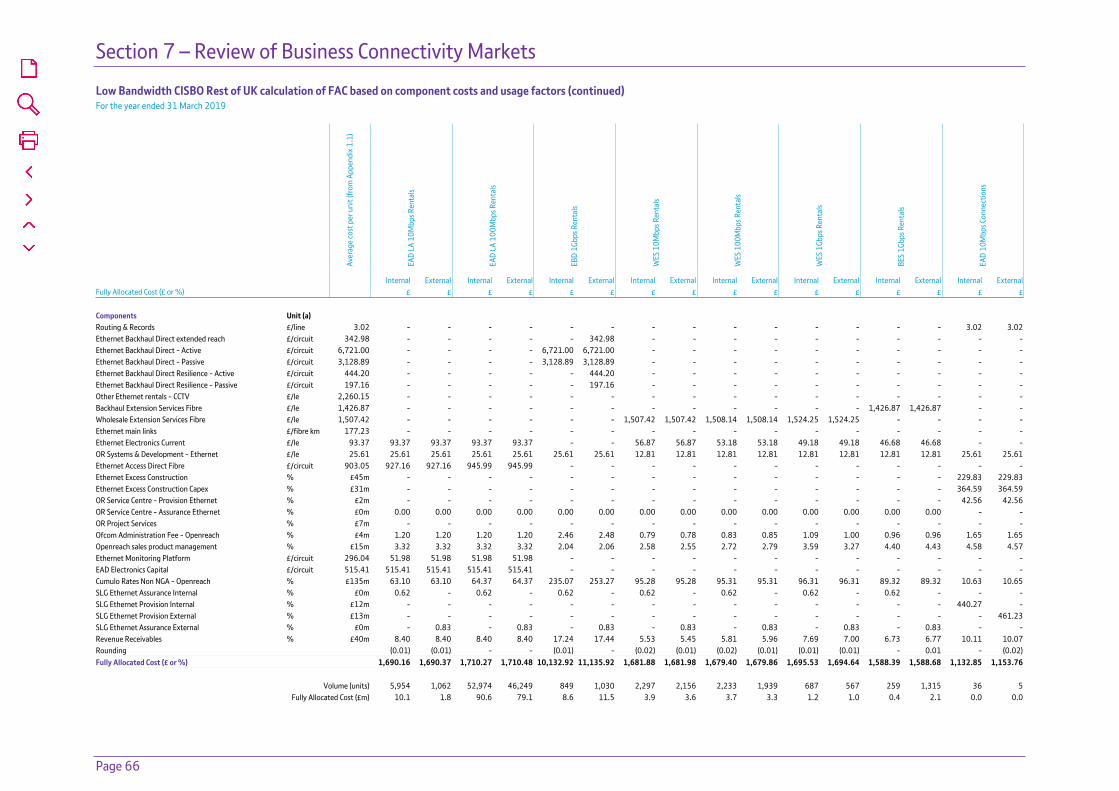
Section 7 – Review of Business Connectivity Markets
Page 66
Low Bandwidth CISBO Rest of UK calculation of FAC based on component costs and usage factors (continued)For the year ended 31 March 2019
Aver
age
cost
per
uni
t (fr
om A
ppen
dix 1
.1)
EAD
LA 1
0Mbp
s Ren
tals
EAD
LA 1
00M
bps R
enta
ls
EBD
1Gbp
s Ren
tals
WES
10M
bps R
enta
ls
WES
100
Mbp
s Ren
tals
WES
1Gb
ps R
enta
ls
BES
1Gbp
s Ren
tals
EAD
10M
bps C
onne
ctio
ns
Internal External Internal External Internal External Internal External Internal External Internal External Internal External Internal ExternalFully Allocated Cost (£ or %) £ £ £ £ £ £ £ £ £ £ £ £ £ £ £ £ Components Unit (a) Routing & Records £/line 3.02 - - - - - - - - - - - - - - 3.02 3.02Ethernet Backhaul Direct extended reach £/circuit 342.98 - - - - - 342.98 - - - - - - - - - -Ethernet Backhaul Direct - Active £/circuit 6,721.00 - - - - 6,721.00 6,721.00 - - - - - - - - - -Ethernet Backhaul Direct - Passive £/circuit 3,128.89 - - - - 3,128.89 3,128.89 - - - - - - - - - -Ethernet Backhaul Direct Resilience - Active £/circuit 444.20 - - - - - 444.20 - - - - - - - - - -Ethernet Backhaul Direct Resilience - Passive £/circuit 197.16 - - - - - 197.16 - - - - - - - - - -Other Ethernet rentals - CCTV £/le 2,260.15 - - - - - - - - - - - - - - - -Backhaul Extension Services Fibre £/le 1,426.87 - - - - - - - - - - - - 1,426.87 1,426.87 - -Wholesale Extension Services Fibre £/le 1,507.42 - - - - - - 1,507.42 1,507.42 1,508.14 1,508.14 1,524.25 1,524.25 - - - -Ethernet main links £/fibre km 177.23 - - - - - - - - - - - - - - - -Ethernet Electronics Current £/le 93.37 93.37 93.37 93.37 93.37 - - 56.87 56.87 53.18 53.18 49.18 49.18 46.68 46.68 - -OR Systems & Development - Ethernet £/le 25.61 25.61 25.61 25.61 25.61 25.61 25.61 12.81 12.81 12.81 12.81 12.81 12.81 12.81 12.81 25.61 25.61Ethernet Access Direct Fibre £/circuit 903.05 927.16 927.16 945.99 945.99 - - - - - - - - - - - -Ethernet Excess Construction % £45m - - - - - - - - - - - - - - 229.83 229.83Ethernet Excess Construction Capex % £31m - - - - - - - - - - - - - - 364.59 364.59OR Service Centre - Provision Ethernet % £2m - - - - - - - - - - - - - - 42.56 42.56OR Service Centre - Assurance Ethernet % £0m 0.00 0.00 0.00 0.00 0.00 0.00 0.00 0.00 0.00 0.00 0.00 0.00 0.00 0.00 - -OR Project Services % £7m - - - - - - - - - - - - - - - -Ofcom Administration Fee - Openreach % £4m 1.20 1.20 1.20 1.20 2.46 2.48 0.79 0.78 0.83 0.85 1.09 1.00 0.96 0.96 1.65 1.65Openreach sales product management % £15m 3.32 3.32 3.32 3.32 2.04 2.06 2.58 2.55 2.72 2.79 3.59 3.27 4.40 4.43 4.58 4.57Ethernet Monitoring Platform £/circuit 296.04 51.98 51.98 51.98 51.98 - - - - - - - - - - - -EAD Electronics Capital £/circuit 515.41 515.41 515.41 515.41 515.41 - - - - - - - - - - - -Cumulo Rates Non NGA - Openreach % £135m 63.10 63.10 64.37 64.37 235.07 253.27 95.28 95.28 95.31 95.31 96.31 96.31 89.32 89.32 10.63 10.65SLG Ethernet Assurance Internal % £0m 0.62 - 0.62 - 0.62 - 0.62 - 0.62 - 0.62 - 0.62 - - -SLG Ethernet Provision Internal % £12m - - - - - - - - - - - - - - 440.27 -SLG Ethernet Provision External % £13m - - - - - - - - - - - - - - - 461.23SLG Ethernet Assurance External % £0m - 0.83 - 0.83 - 0.83 - 0.83 - 0.83 - 0.83 - 0.83 - -Revenue Receivables % £40m 8.40 8.40 8.40 8.40 17.24 17.44 5.53 5.45 5.81 5.96 7.69 7.00 6.73 6.77 10.11 10.07Rounding (0.01) (0.01) - - (0.01) - (0.02) (0.01) (0.02) (0.01) (0.01) (0.01) - 0.01 - (0.02)Fully Allocated Cost (£ or %) 1,690.16 1,690.37 1,710.27 1,710.48 10,132.92 11,135.92 1,681.88 1,681.98 1,679.40 1,679.86 1,695.53 1,694.64 1,588.39 1,588.68 1,132.85 1,153.76
Volume (units) 5,954 1,062 52,974 46,249 849 1,030 2,297 2,156 2,233 1,939 687 567 259 1,315 36 5Fully Allocated Cost (£m) 10.1 1.8 90.6 79.1 8.6 11.5 3.9 3.6 3.7 3.3 1.2 1.0 0.4 2.1 0.0 0.0
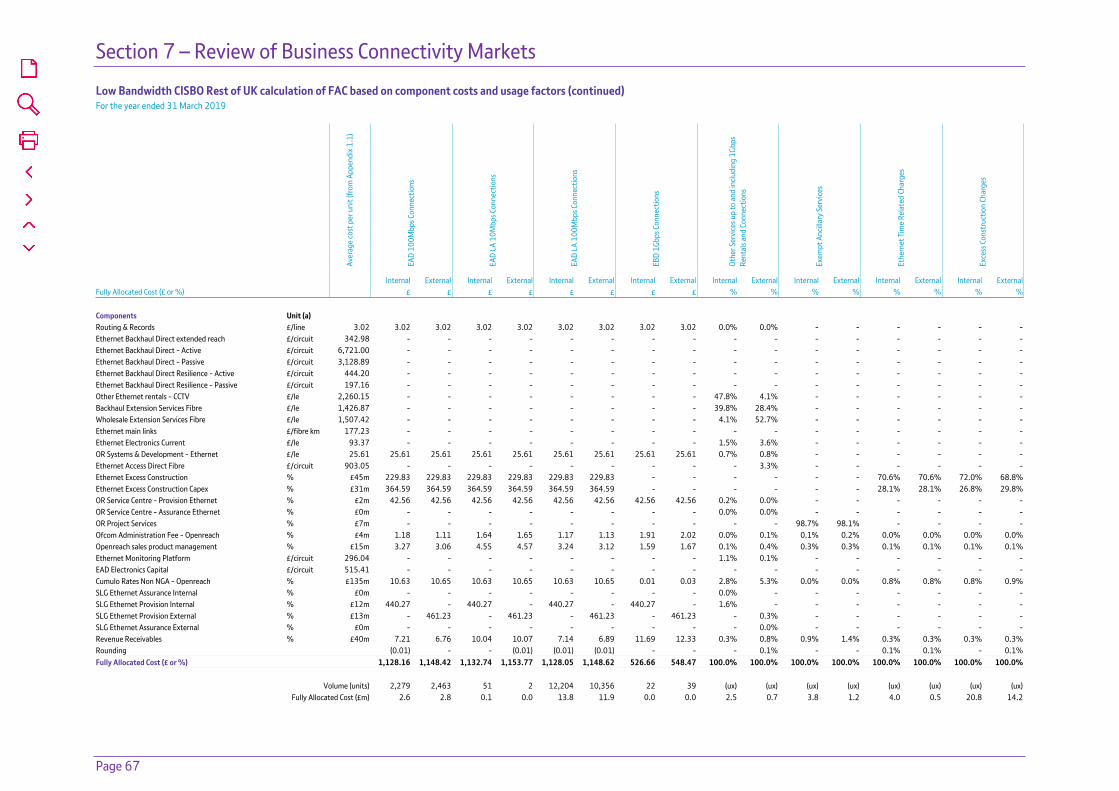
Section 7 – Review of Business Connectivity Markets
Page 67
Low Bandwidth CISBO Rest of UK calculation of FAC based on component costs and usage factors (continued)For the year ended 31 March 2019
Aver
age
cost
per
uni
t (fr
om A
ppen
dix 1
.1)
EAD
100M
bps C
onne
ctio
ns
EAD
LA 1
0Mbp
s Con
nect
ions
EAD
LA 1
00M
bps C
onne
ctio
ns
EBD
1Gbp
s Con
nect
ions
Othe
r Ser
vice
s up
to a
nd in
cludi
ng 1
Gbps
Re
ntal
s and
Con
nect
ions
Exem
pt A
ncill
ary
Serv
ices
Ethe
rnet
Tim
e Re
late
d Ch
arge
s
Exce
ss C
onst
ruct
ion
Char
ges
Internal External Internal External Internal External Internal External Internal External Internal External Internal External Internal ExternalFully Allocated Cost (£ or %) £ £ £ £ £ £ £ £ % % % % % % % % Components Unit (a) Routing & Records £/line 3.02 3.02 3.02 3.02 3.02 3.02 3.02 3.02 3.02 0.0% 0.0% - - - - - -Ethernet Backhaul Direct extended reach £/circuit 342.98 - - - - - - - - - - - - - - - -Ethernet Backhaul Direct - Active £/circuit 6,721.00 - - - - - - - - - - - - - - - -Ethernet Backhaul Direct - Passive £/circuit 3,128.89 - - - - - - - - - - - - - - - -Ethernet Backhaul Direct Resilience - Active £/circuit 444.20 - - - - - - - - - - - - - - - -Ethernet Backhaul Direct Resilience - Passive £/circuit 197.16 - - - - - - - - - - - - - - - -Other Ethernet rentals - CCTV £/le 2,260.15 - - - - - - - - 47.8% 4.1% - - - - - -Backhaul Extension Services Fibre £/le 1,426.87 - - - - - - - - 39.8% 28.4% - - - - - -Wholesale Extension Services Fibre £/le 1,507.42 - - - - - - - - 4.1% 52.7% - - - - - -Ethernet main links £/fibre km 177.23 - - - - - - - - - - - - - - - -Ethernet Electronics Current £/le 93.37 - - - - - - - - 1.5% 3.6% - - - - - -OR Systems & Development - Ethernet £/le 25.61 25.61 25.61 25.61 25.61 25.61 25.61 25.61 25.61 0.7% 0.8% - - - - - -Ethernet Access Direct Fibre £/circuit 903.05 - - - - - - - - - 3.3% - - - - - -Ethernet Excess Construction % £45m 229.83 229.83 229.83 229.83 229.83 229.83 - - - - - - 70.6% 70.6% 72.0% 68.8%Ethernet Excess Construction Capex % £31m 364.59 364.59 364.59 364.59 364.59 364.59 - - - - - - 28.1% 28.1% 26.8% 29.8%OR Service Centre - Provision Ethernet % £2m 42.56 42.56 42.56 42.56 42.56 42.56 42.56 42.56 0.2% 0.0% - - - - - -OR Service Centre - Assurance Ethernet % £0m - - - - - - - - 0.0% 0.0% - - - - - -OR Project Services % £7m - - - - - - - - - - 98.7% 98.1% - - - -Ofcom Administration Fee - Openreach % £4m 1.18 1.11 1.64 1.65 1.17 1.13 1.91 2.02 0.0% 0.1% 0.1% 0.2% 0.0% 0.0% 0.0% 0.0%Openreach sales product management % £15m 3.27 3.06 4.55 4.57 3.24 3.12 1.59 1.67 0.1% 0.4% 0.3% 0.3% 0.1% 0.1% 0.1% 0.1%Ethernet Monitoring Platform £/circuit 296.04 - - - - - - - - 1.1% 0.1% - - - - - -EAD Electronics Capital £/circuit 515.41 - - - - - - - - - - - - - - - -Cumulo Rates Non NGA - Openreach % £135m 10.63 10.65 10.63 10.65 10.63 10.65 0.01 0.03 2.8% 5.3% 0.0% 0.0% 0.8% 0.8% 0.8% 0.9%SLG Ethernet Assurance Internal % £0m - - - - - - - - 0.0% - - - - - - -SLG Ethernet Provision Internal % £12m 440.27 - 440.27 - 440.27 - 440.27 - 1.6% - - - - - - -SLG Ethernet Provision External % £13m - 461.23 - 461.23 - 461.23 - 461.23 - 0.3% - - - - - -SLG Ethernet Assurance External % £0m - - - - - - - - - 0.0% - - - - - -Revenue Receivables % £40m 7.21 6.76 10.04 10.07 7.14 6.89 11.69 12.33 0.3% 0.8% 0.9% 1.4% 0.3% 0.3% 0.3% 0.3%Rounding (0.01) - - (0.01) (0.01) (0.01) - - - 0.1% - - 0.1% 0.1% - 0.1%Fully Allocated Cost (£ or %) 1,128.16 1,148.42 1,132.74 1,153.77 1,128.05 1,148.62 526.66 548.47 100.0% 100.0% 100.0% 100.0% 100.0% 100.0% 100.0% 100.0%
Volume (units) 2,279 2,463 51 2 12,204 10,356 22 39 (ux) (ux) (ux) (ux) (ux) (ux) (ux) (ux)Fully Allocated Cost (£m) 2.6 2.8 0.1 0.0 13.8 11.9 0.0 0.0 2.5 0.7 3.8 1.2 4.0 0.5 20.8 14.2

Section 7 – Review of Business Connectivity Markets
Page 68
Low Bandwidth CISBO Rest of UK Summary Restated for the year ended 31 March 2018 (b)
Internal External Total Internal External Average Internal
Average External Internal External Total
Revenue Revenue Revenue Volume Volume Measure Price Price FAC FAC FAC Detailed service analysis £m £m £m £ £ £m £m £m Service EAD 1Gbps Rentals 54.2 31.9 86.1 18,099 10,586 ccts 2,995.78 3,012.79 43.3 25.3 68.6 EAD LA 1Gbps Rentals 39.5 10.0 49.5 16,536 4,172 ccts 2,387.71 2,398.04 27.2 6.9 34.1 EAD 1Gbps Connections* 4.7 4.1 8.8 3,334 2,840 ccts 1,420.75 1,454.96 4.1 5.7 9.8 EAD LA 1Gbps Connections* 4.6 2.8 7.4 3,357 2,062 ccts 1,364.76 1,367.70 4.2 4.1 8.3 Ethernet 1Gbps EAD and EAD LA Sub-basket 103.0 48.8 151.8 78.8 42.0 120.8 Ethernet Main Link Sub-basket up to and including 1Gbps 74.4 57.3 131.7 291,873 222,678 fibre km 254.78 257.19 52.6 40.1 92.7 Ethernet Interconnection Sub-basket 0.2 0.9 1.1 (ux) (ux) (ux) (sx) (sx) 0.2 1.1 1.3 EAD 10Mbps Rentals 5.7 2.9 8.6 3,163 1,613 ccts 1,800.23 1,800.00 7.4 3.8 11.2 EAD 100Mbps Rentals 27.9 24.6 52.5 15,457 13,682 ccts 1,804.04 1,800.07 36.0 31.9 67.9 EAD LA 10Mbps Rentals 10.2 2.2 12.4 7,280 1,570 ccts 1,398.04 1,398.00 11.2 2.4 13.6 EAD LA 100Mbps Rentals 65.4 54.9 120.3 46,757 39,239 ccts 1,398.31 1,398.04 72.9 61.2 134.1 EBD 1Gbps Rentals 2.4 3.0 5.4 847 1,068 ccts 2,801.19 2,845.01 9.4 12.7 22.1 WES 10Mbps Rentals 2.8 2.8 5.6 2,965 2,986 le 947.85 926.22 4.5 4.5 9.0 WES 100Mbps Rentals 3.1 2.8 5.9 3,047 2,760 le 1,005.20 1,001.00 4.6 4.2 8.8 WES 1Gbps Rentals 1.4 1.2 2.6 843 751 le 1,650.54 1,550.25 1.3 1.1 2.4 BES 1Gbps Rentals 0.4 2.8 3.2 288 1,858 le 1,505.48 1,497.14 0.4 2.5 2.9 EAD 10Mbps Connections* 0.1 0.0 0.1 31 8 ccts 1,978.71 1,942.50 0.0 0.0 0.0 EAD 100Mbps Connections* 2.2 3.1 5.3 2,154 3,197 ccts 1,010.09 963.92 2.7 6.4 9.1 EAD LA 10Mbps Connections* 0.1 0.0 0.1 56 6 ccts 1,896.96 1,898.33 0.1 0.0 0.1 EAD LA 100Mbps Connections* 11.3 11.8 23.1 11,521 11,854 ccts 979.86 995.40 14.2 23.7 37.9 EBD 1Gbps Connections 0.1 0.1 0.2 48 39 ccts 2,165.63 2,027.31 0.0 0.1 0.1 Other Services up to and including 1Gbps Rentals and Connections 1.5 1.2 2.7 (ux) (ux) (ux) (sx) (sx) 2.7 0.8 3.5 Total Ethernet Basket 312.2 220.4 532.6 299.0 238.5 537.5
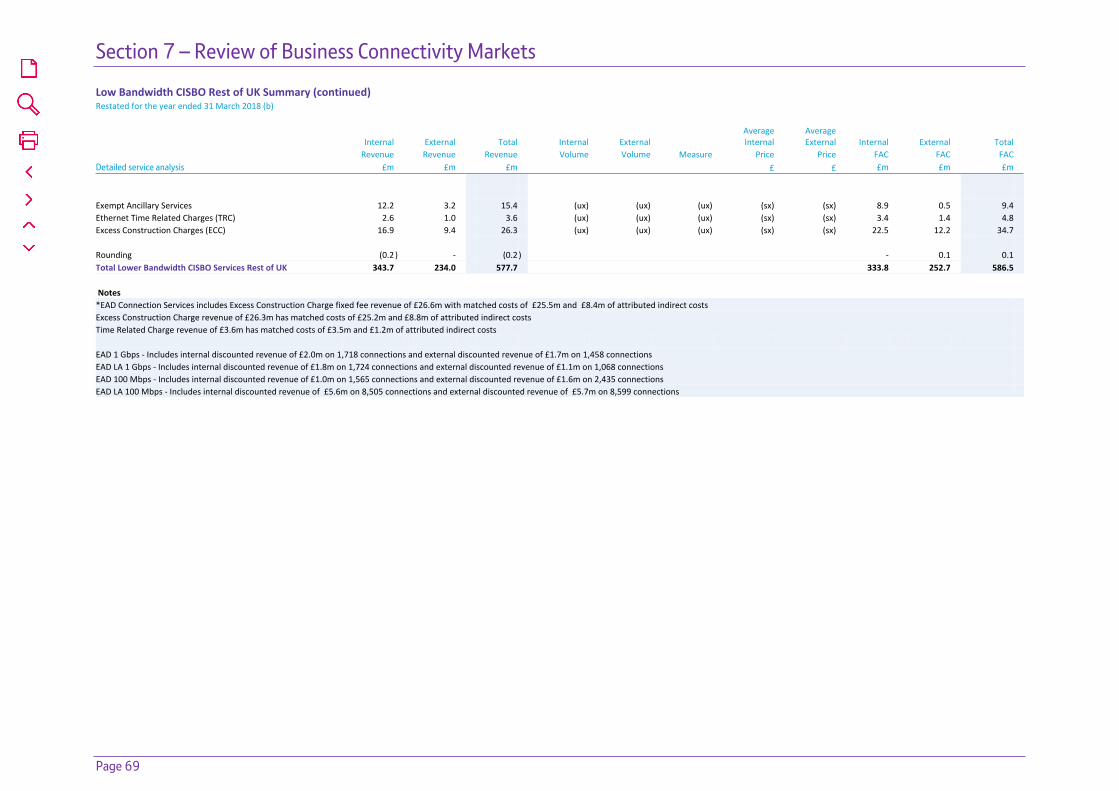
Section 7 – Review of Business Connectivity Markets
Page 69
Low Bandwidth CISBO Rest of UK Summary (continued) Restated for the year ended 31 March 2018 (b)
Internal External Total Internal External Average Internal
Average External Internal External Total
Revenue Revenue Revenue Volume Volume Measure Price Price FAC FAC FAC Detailed service analysis £m £m £m £ £ £m £m £m Exempt Ancillary Services 12.2 3.2 15.4 (ux) (ux) (ux) (sx) (sx) 8.9 0.5 9.4 Ethernet Time Related Charges (TRC) 2.6 1.0 3.6 (ux) (ux) (ux) (sx) (sx) 3.4 1.4 4.8 Excess Construction Charges (ECC) 16.9 9.4 26.3 (ux) (ux) (ux) (sx) (sx) 22.5 12.2 34.7 Rounding (0.2) - (0.2) - 0.1 0.1 Total Lower Bandwidth CISBO Services Rest of UK 343.7 234.0 577.7 333.8 252.7 586.5 Notes *EAD Connection Services includes Excess Construction Charge fixed fee revenue of £26.6m with matched costs of £25.5m and £8.4m of attributed indirect costs Excess Construction Charge revenue of £26.3m has matched costs of £25.2m and £8.8m of attributed indirect costs Time Related Charge revenue of £3.6m has matched costs of £3.5m and £1.2m of attributed indirect costs EAD 1 Gbps - Includes internal discounted revenue of £2.0m on 1,718 connections and external discounted revenue of £1.7m on 1,458 connections EAD LA 1 Gbps - Includes internal discounted revenue of £1.8m on 1,724 connections and external discounted revenue of £1.1m on 1,068 connections EAD 100 Mbps - Includes internal discounted revenue of £1.0m on 1,565 connections and external discounted revenue of £1.6m on 2,435 connections EAD LA 100 Mbps - Includes internal discounted revenue of £5.6m on 8,505 connections and external discounted revenue of £5.7m on 8,599 connections
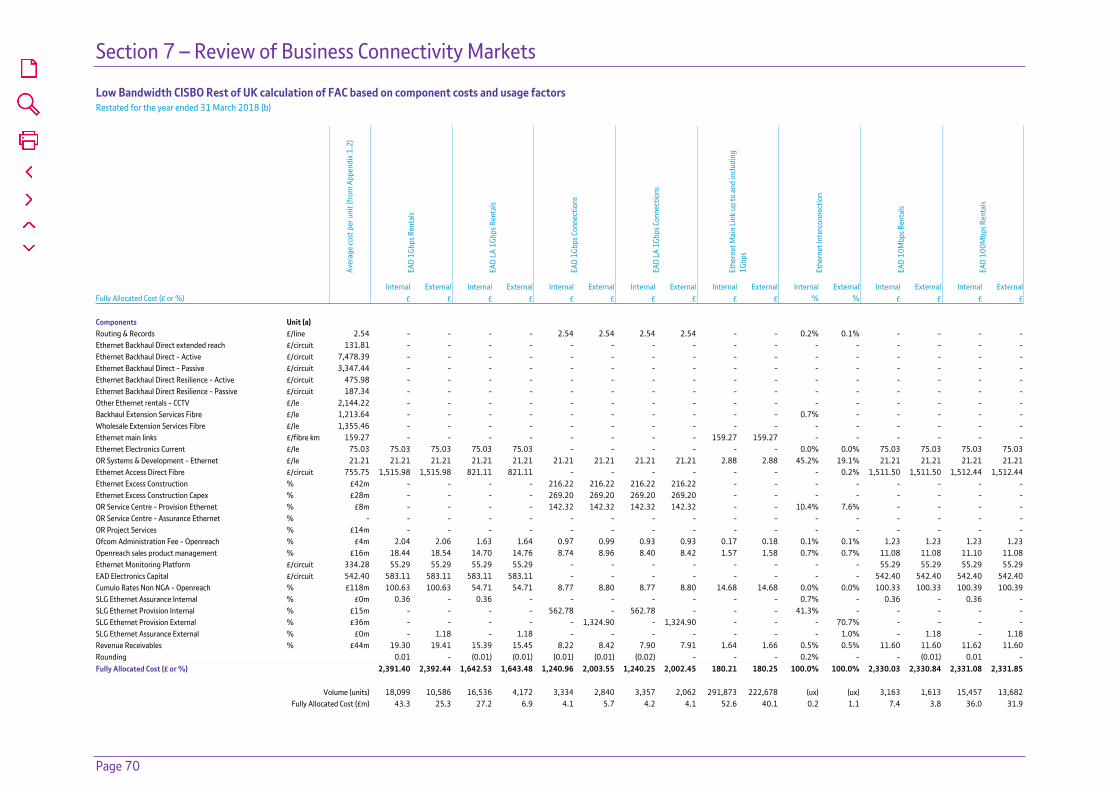
Section 7 – Review of Business Connectivity Markets
Page 70
Low Bandwidth CISBO Rest of UK calculation of FAC based on component costs and usage factorsRestated for the year ended 31 March 2018 (b)
Aver
age
cost
per
uni
t (fr
om A
ppen
dix 1
.2)
EAD
1Gbp
s Ren
tals
EAD
LA 1
Gbps
Ren
tals
EAD
1Gbp
s Con
nect
ions
EAD
LA 1
Gbps
Con
nect
ions
Ethe
rnet
Mai
n Li
nk u
p to
and
inclu
ding
1G
bps
Ethe
rnet
Inte
rcon
nect
ion
EAD
10M
bps R
enta
ls
EAD
100M
bps R
enta
ls
Internal External Internal External Internal External Internal External Internal External Internal External Internal External Internal ExternalFully Allocated Cost (£ or %) £ £ £ £ £ £ £ £ £ £ % % £ £ £ £ Components Unit (a) Routing & Records £/line 2.54 - - - - 2.54 2.54 2.54 2.54 - - 0.2% 0.1% - - - -Ethernet Backhaul Direct extended reach £/circuit 131.81 - - - - - - - - - - - - - - - -Ethernet Backhaul Direct - Active £/circuit 7,478.39 - - - - - - - - - - - - - - - -Ethernet Backhaul Direct - Passive £/circuit 3,347.44 - - - - - - - - - - - - - - - -Ethernet Backhaul Direct Resilience - Active £/circuit 475.98 - - - - - - - - - - - - - - - -Ethernet Backhaul Direct Resilience - Passive £/circuit 187.34 - - - - - - - - - - - - - - - -Other Ethernet rentals - CCTV £/le 2,144.22 - - - - - - - - - - - - - - - -Backhaul Extension Services Fibre £/le 1,213.64 - - - - - - - - - - 0.7% - - - - -Wholesale Extension Services Fibre £/le 1,355.46 - - - - - - - - - - - - - - - -Ethernet main links £/fibre km 159.27 - - - - - - - - 159.27 159.27 - - - - - -Ethernet Electronics Current £/le 75.03 75.03 75.03 75.03 75.03 - - - - - - 0.0% 0.0% 75.03 75.03 75.03 75.03OR Systems & Development - Ethernet £/le 21.21 21.21 21.21 21.21 21.21 21.21 21.21 21.21 21.21 2.88 2.88 45.2% 19.1% 21.21 21.21 21.21 21.21Ethernet Access Direct Fibre £/circuit 755.75 1,515.98 1,515.98 821.11 821.11 - - - - - - - 0.2% 1,511.50 1,511.50 1,512.44 1,512.44Ethernet Excess Construction % £42m - - - - 216.22 216.22 216.22 216.22 - - - - - - - -Ethernet Excess Construction Capex % £28m - - - - 269.20 269.20 269.20 269.20 - - - - - - - -OR Service Centre - Provision Ethernet % £8m - - - - 142.32 142.32 142.32 142.32 - - 10.4% 7.6% - - - -OR Service Centre - Assurance Ethernet % - - - - - - - - - - - - - - - - -OR Project Services % £14m - - - - - - - - - - - - - - - -Ofcom Administration Fee - Openreach % £4m 2.04 2.06 1.63 1.64 0.97 0.99 0.93 0.93 0.17 0.18 0.1% 0.1% 1.23 1.23 1.23 1.23Openreach sales product management % £16m 18.44 18.54 14.70 14.76 8.74 8.96 8.40 8.42 1.57 1.58 0.7% 0.7% 11.08 11.08 11.10 11.08Ethernet Monitoring Platform £/circuit 334.28 55.29 55.29 55.29 55.29 - - - - - - - - 55.29 55.29 55.29 55.29EAD Electronics Capital £/circuit 542.40 583.11 583.11 583.11 583.11 - - - - - - - - 542.40 542.40 542.40 542.40Cumulo Rates Non NGA - Openreach % £118m 100.63 100.63 54.71 54.71 8.77 8.80 8.77 8.80 14.68 14.68 0.0% 0.0% 100.33 100.33 100.39 100.39SLG Ethernet Assurance Internal % £0m 0.36 - 0.36 - - - - - - - 0.7% - 0.36 - 0.36 -SLG Ethernet Provision Internal % £15m - - - - 562.78 - 562.78 - - - 41.3% - - - - -SLG Ethernet Provision External % £36m - - - - - 1,324.90 - 1,324.90 - - - 70.7% - - - -SLG Ethernet Assurance External % £0m - 1.18 - 1.18 - - - - - - - 1.0% - 1.18 - 1.18Revenue Receivables % £44m 19.30 19.41 15.39 15.45 8.22 8.42 7.90 7.91 1.64 1.66 0.5% 0.5% 11.60 11.60 11.62 11.60Rounding 0.01 - (0.01) (0.01) (0.01) (0.01) (0.02) - - - 0.2% - - (0.01) 0.01 -Fully Allocated Cost (£ or %) 2,391.40 2,392.44 1,642.53 1,643.48 1,240.96 2,003.55 1,240.25 2,002.45 180.21 180.25 100.0% 100.0% 2,330.03 2,330.84 2,331.08 2,331.85
Volume (units) 18,099 10,586 16,536 4,172 3,334 2,840 3,357 2,062 291,873 222,678 (ux) (ux) 3,163 1,613 15,457 13,682Fully Allocated Cost (£m) 43.3 25.3 27.2 6.9 4.1 5.7 4.2 4.1 52.6 40.1 0.2 1.1 7.4 3.8 36.0 31.9
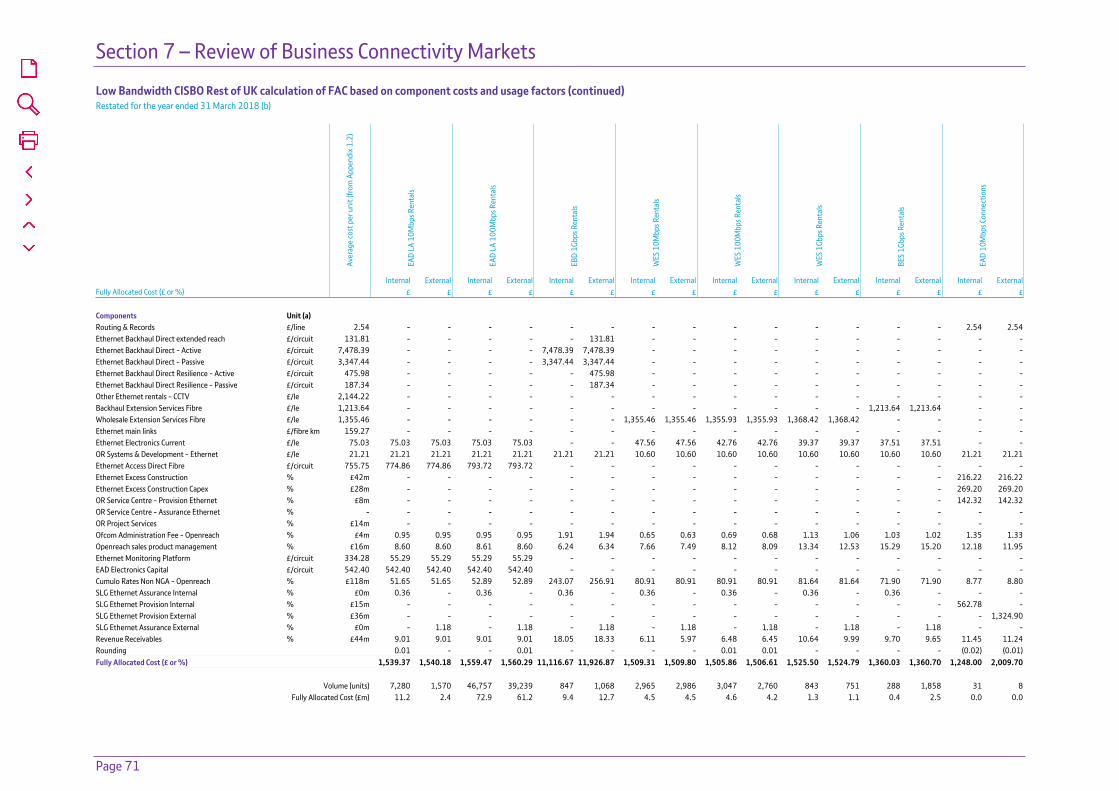
Section 7 – Review of Business Connectivity Markets
Page 71
Low Bandwidth CISBO Rest of UK calculation of FAC based on component costs and usage factors (continued)Restated for the year ended 31 March 2018 (b)
Aver
age
cost
per
uni
t (fr
om A
ppen
dix 1
.2)
EAD
LA 1
0Mbp
s Ren
tals
EAD
LA 1
00M
bps R
enta
ls
EBD
1Gbp
s Ren
tals
WES
10M
bps R
enta
ls
WES
100
Mbp
s Ren
tals
WES
1Gb
ps R
enta
ls
BES
1Gbp
s Ren
tals
EAD
10M
bps C
onne
ctio
ns
Internal External Internal External Internal External Internal External Internal External Internal External Internal External Internal ExternalFully Allocated Cost (£ or %) £ £ £ £ £ £ £ £ £ £ £ £ £ £ £ £ Components Unit (a) Routing & Records £/line 2.54 - - - - - - - - - - - - - - 2.54 2.54Ethernet Backhaul Direct extended reach £/circuit 131.81 - - - - - 131.81 - - - - - - - - - -Ethernet Backhaul Direct - Active £/circuit 7,478.39 - - - - 7,478.39 7,478.39 - - - - - - - - - -Ethernet Backhaul Direct - Passive £/circuit 3,347.44 - - - - 3,347.44 3,347.44 - - - - - - - - - -Ethernet Backhaul Direct Resilience - Active £/circuit 475.98 - - - - - 475.98 - - - - - - - - - -Ethernet Backhaul Direct Resilience - Passive £/circuit 187.34 - - - - - 187.34 - - - - - - - - - -Other Ethernet rentals - CCTV £/le 2,144.22 - - - - - - - - - - - - - - - -Backhaul Extension Services Fibre £/le 1,213.64 - - - - - - - - - - - - 1,213.64 1,213.64 - -Wholesale Extension Services Fibre £/le 1,355.46 - - - - - - 1,355.46 1,355.46 1,355.93 1,355.93 1,368.42 1,368.42 - - - -Ethernet main links £/fibre km 159.27 - - - - - - - - - - - - - - - -Ethernet Electronics Current £/le 75.03 75.03 75.03 75.03 75.03 - - 47.56 47.56 42.76 42.76 39.37 39.37 37.51 37.51 - -OR Systems & Development - Ethernet £/le 21.21 21.21 21.21 21.21 21.21 21.21 21.21 10.60 10.60 10.60 10.60 10.60 10.60 10.60 10.60 21.21 21.21Ethernet Access Direct Fibre £/circuit 755.75 774.86 774.86 793.72 793.72 - - - - - - - - - - - -Ethernet Excess Construction % £42m - - - - - - - - - - - - - - 216.22 216.22Ethernet Excess Construction Capex % £28m - - - - - - - - - - - - - - 269.20 269.20OR Service Centre - Provision Ethernet % £8m - - - - - - - - - - - - - - 142.32 142.32OR Service Centre - Assurance Ethernet % - - - - - - - - - - - - - - - - -OR Project Services % £14m - - - - - - - - - - - - - - - -Ofcom Administration Fee - Openreach % £4m 0.95 0.95 0.95 0.95 1.91 1.94 0.65 0.63 0.69 0.68 1.13 1.06 1.03 1.02 1.35 1.33Openreach sales product management % £16m 8.60 8.60 8.61 8.60 6.24 6.34 7.66 7.49 8.12 8.09 13.34 12.53 15.29 15.20 12.18 11.95Ethernet Monitoring Platform £/circuit 334.28 55.29 55.29 55.29 55.29 - - - - - - - - - - - -EAD Electronics Capital £/circuit 542.40 542.40 542.40 542.40 542.40 - - - - - - - - - - - -Cumulo Rates Non NGA - Openreach % £118m 51.65 51.65 52.89 52.89 243.07 256.91 80.91 80.91 80.91 80.91 81.64 81.64 71.90 71.90 8.77 8.80SLG Ethernet Assurance Internal % £0m 0.36 - 0.36 - 0.36 - 0.36 - 0.36 - 0.36 - 0.36 - - -SLG Ethernet Provision Internal % £15m - - - - - - - - - - - - - - 562.78 -SLG Ethernet Provision External % £36m - - - - - - - - - - - - - - - 1,324.90SLG Ethernet Assurance External % £0m - 1.18 - 1.18 - 1.18 - 1.18 - 1.18 - 1.18 - 1.18 - -Revenue Receivables % £44m 9.01 9.01 9.01 9.01 18.05 18.33 6.11 5.97 6.48 6.45 10.64 9.99 9.70 9.65 11.45 11.24Rounding 0.01 - - 0.01 - - - - 0.01 0.01 - - - - (0.02) (0.01)Fully Allocated Cost (£ or %) 1,539.37 1,540.18 1,559.47 1,560.29 11,116.67 11,926.87 1,509.31 1,509.80 1,505.86 1,506.61 1,525.50 1,524.79 1,360.03 1,360.70 1,248.00 2,009.70
Volume (units) 7,280 1,570 46,757 39,239 847 1,068 2,965 2,986 3,047 2,760 843 751 288 1,858 31 8Fully Allocated Cost (£m) 11.2 2.4 72.9 61.2 9.4 12.7 4.5 4.5 4.6 4.2 1.3 1.1 0.4 2.5 0.0 0.0
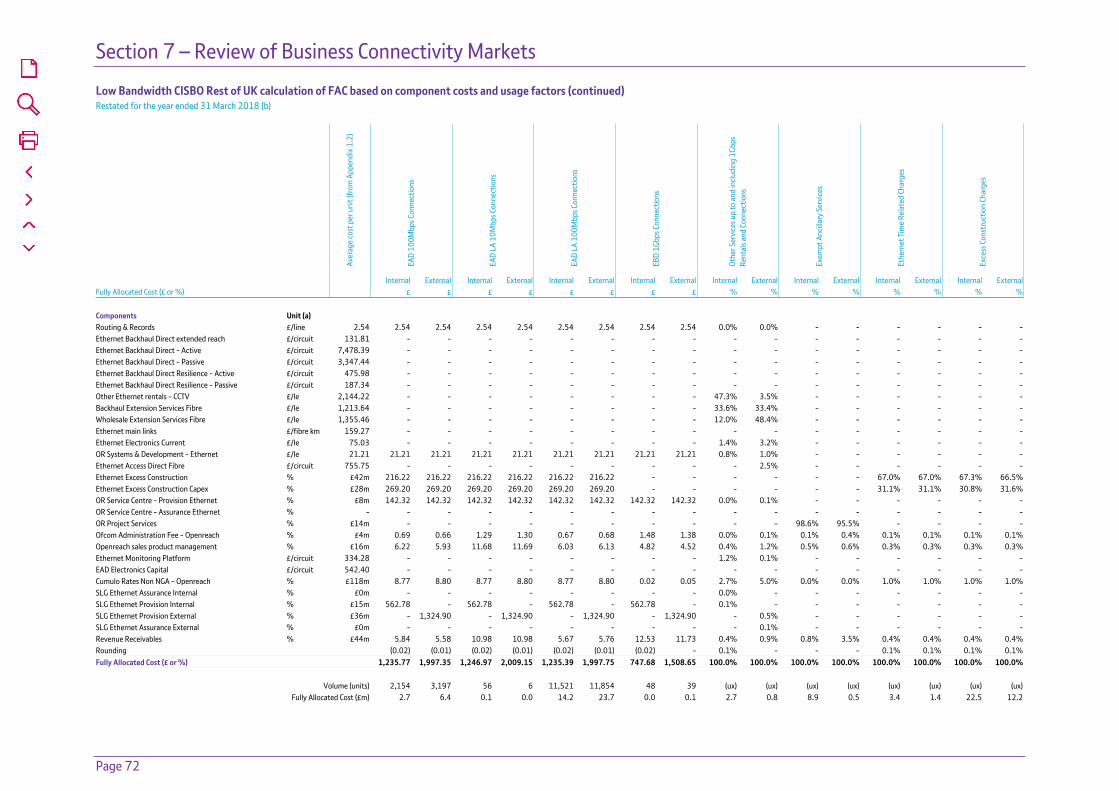
Section 7 – Review of Business Connectivity Markets
Page 72
Low Bandwidth CISBO Rest of UK calculation of FAC based on component costs and usage factors (continued)Restated for the year ended 31 March 2018 (b)
Aver
age
cost
per
uni
t (fr
om A
ppen
dix 1
.2)
EAD
100M
bps C
onne
ctio
ns
EAD
LA 1
0Mbp
s Con
nect
ions
EAD
LA 1
00M
bps C
onne
ctio
ns
EBD
1Gbp
s Con
nect
ions
Othe
r Ser
vice
s up
to a
nd in
cludi
ng 1
Gbps
Re
ntal
s and
Con
nect
ions
Exem
pt A
ncill
ary
Serv
ices
Ethe
rnet
Tim
e Re
late
d Ch
arge
s
Exce
ss C
onst
ruct
ion
Char
ges
Internal External Internal External Internal External Internal External Internal External Internal External Internal External Internal ExternalFully Allocated Cost (£ or %) £ £ £ £ £ £ £ £ % % % % % % % % Components Unit (a) Routing & Records £/line 2.54 2.54 2.54 2.54 2.54 2.54 2.54 2.54 2.54 0.0% 0.0% - - - - - -Ethernet Backhaul Direct extended reach £/circuit 131.81 - - - - - - - - - - - - - - - -Ethernet Backhaul Direct - Active £/circuit 7,478.39 - - - - - - - - - - - - - - - -Ethernet Backhaul Direct - Passive £/circuit 3,347.44 - - - - - - - - - - - - - - - -Ethernet Backhaul Direct Resilience - Active £/circuit 475.98 - - - - - - - - - - - - - - - -Ethernet Backhaul Direct Resilience - Passive £/circuit 187.34 - - - - - - - - - - - - - - - -Other Ethernet rentals - CCTV £/le 2,144.22 - - - - - - - - 47.3% 3.5% - - - - - -Backhaul Extension Services Fibre £/le 1,213.64 - - - - - - - - 33.6% 33.4% - - - - - -Wholesale Extension Services Fibre £/le 1,355.46 - - - - - - - - 12.0% 48.4% - - - - - -Ethernet main links £/fibre km 159.27 - - - - - - - - - - - - - - - -Ethernet Electronics Current £/le 75.03 - - - - - - - - 1.4% 3.2% - - - - - -OR Systems & Development - Ethernet £/le 21.21 21.21 21.21 21.21 21.21 21.21 21.21 21.21 21.21 0.8% 1.0% - - - - - -Ethernet Access Direct Fibre £/circuit 755.75 - - - - - - - - - 2.5% - - - - - -Ethernet Excess Construction % £42m 216.22 216.22 216.22 216.22 216.22 216.22 - - - - - - 67.0% 67.0% 67.3% 66.5%Ethernet Excess Construction Capex % £28m 269.20 269.20 269.20 269.20 269.20 269.20 - - - - - - 31.1% 31.1% 30.8% 31.6%OR Service Centre - Provision Ethernet % £8m 142.32 142.32 142.32 142.32 142.32 142.32 142.32 142.32 0.0% 0.1% - - - - - -OR Service Centre - Assurance Ethernet % - - - - - - - - - - - - - - - - -OR Project Services % £14m - - - - - - - - - - 98.6% 95.5% - - - -Ofcom Administration Fee - Openreach % £4m 0.69 0.66 1.29 1.30 0.67 0.68 1.48 1.38 0.0% 0.1% 0.1% 0.4% 0.1% 0.1% 0.1% 0.1%Openreach sales product management % £16m 6.22 5.93 11.68 11.69 6.03 6.13 4.82 4.52 0.4% 1.2% 0.5% 0.6% 0.3% 0.3% 0.3% 0.3%Ethernet Monitoring Platform £/circuit 334.28 - - - - - - - - 1.2% 0.1% - - - - - -EAD Electronics Capital £/circuit 542.40 - - - - - - - - - - - - - - - -Cumulo Rates Non NGA - Openreach % £118m 8.77 8.80 8.77 8.80 8.77 8.80 0.02 0.05 2.7% 5.0% 0.0% 0.0% 1.0% 1.0% 1.0% 1.0%SLG Ethernet Assurance Internal % £0m - - - - - - - - 0.0% - - - - - - -SLG Ethernet Provision Internal % £15m 562.78 - 562.78 - 562.78 - 562.78 - 0.1% - - - - - - -SLG Ethernet Provision External % £36m - 1,324.90 - 1,324.90 - 1,324.90 - 1,324.90 - 0.5% - - - - - -SLG Ethernet Assurance External % £0m - - - - - - - - - 0.1% - - - - - -Revenue Receivables % £44m 5.84 5.58 10.98 10.98 5.67 5.76 12.53 11.73 0.4% 0.9% 0.8% 3.5% 0.4% 0.4% 0.4% 0.4%Rounding (0.02) (0.01) (0.02) (0.01) (0.02) (0.01) (0.02) - 0.1% - - - 0.1% 0.1% 0.1% 0.1%Fully Allocated Cost (£ or %) 1,235.77 1,997.35 1,246.97 2,009.15 1,235.39 1,997.75 747.68 1,508.65 100.0% 100.0% 100.0% 100.0% 100.0% 100.0% 100.0% 100.0%
Volume (units) 2,154 3,197 56 6 11,521 11,854 48 39 (ux) (ux) (ux) (ux) (ux) (ux) (ux) (ux)Fully Allocated Cost (£m) 2.7 6.4 0.1 0.0 14.2 23.7 0.0 0.1 2.7 0.8 8.9 0.5 3.4 1.4 22.5 12.2

Section 7 – Review of Business Connectivity Markets
Page 73
Low Bandwidth CISBO Combined Geographic Summary For the year ended 31 March 2019
Internal External Total Internal External Average Internal
Average External Internal External Total
Revenue Revenue Revenue Volume Volume Measure Price Price FAC FAC FAC Detailed service analysis £m £m £m £ £ £m £m £m Service EAD 1Gbps Rentals 1.3 1.8 3.1 608 820 ccts 2,194.20 2,185.76 1.0 1.3 2.3 EAD LA 1Gbps Rentals 2.8 1.8 4.6 1,596 1,024 ccts 1,769.55 1,764.79 2.0 1.3 3.3 EAD 1Gbps Connections* 0.1 0.5 0.6 73 277 ccts 1,920.70 1,914.08 0.1 0.3 0.4 EAD LA 1Gbps Connections* 0.7 0.8 1.5 342 402 ccts 1,912.14 1,906.49 0.4 0.5 0.9 Ethernet 1Gbps EAD and EAD LA Sub-basket 4.9 4.9 9.8 3.5 3.4 6.9 Ethernet Main Link Sub-basket up to and including 1Gbps 1.1 1.3 2.4 5,761 7,373 fibre km 185.89 180.91 0.4 0.5 0.9 Ethernet Interconnection Sub-basket 0.0 0.1 0.1 (ux) (ux) (ux) (sx) (sx) 0.0 0.1 0.1 EAD 10Mbps Rentals 0.1 0.1 0.2 51 47 ccts 1,698.00 1,698.00 0.1 0.1 0.2 EAD 100Mbps Rentals 0.8 1.4 2.2 498 847 ccts 1,699.25 1,698.00 0.8 1.3 2.1 EAD LA 10Mbps Rentals 0.5 0.1 0.6 356 51 ccts 1,374.86 1,374.00 0.4 0.1 0.5 EAD LA 100Mbps Rentals 4.8 3.8 8.6 3,518 2,732 ccts 1,374.76 1,374.00 4.1 3.2 7.3 EBD 1Gbps Rentals 0.1 0.2 0.3 41 67 ccts 2,725.53 2,696.64 0.3 0.5 0.8 WES 10Mbps Rentals 0.1 0.1 0.2 130 111 le 897.46 861.25 0.1 0.1 0.2 WES 100Mbps Rentals 0.2 0.1 0.3 191 144 le 962.15 888.71 0.2 0.1 0.3 WES 1Gbps Rentals 0.1 0.0 0.1 85 16 le 1,162.22 1,147.25 0.1 0.0 0.1 EAD 10Mbps Connections* 0.0 0.0 0.0 1 2 ccts 1,940.00 1,902.50 0.0 0.0 0.0 EAD 100Mbps Connections* 0.1 0.2 0.3 73 178 ccts 1,303.86 1,290.16 0.1 0.2 0.3 EAD LA 10Mbps Connections* 0.0 - 0.0 3 - ccts 1,873.33 - 0.0 - 0.0 EAD LA 100Mbps Connections* 1.0 0.9 1.9 718 712 ccts 1,342.04 1,286.61 0.8 0.8 1.6 EBD 1Gbps Connections - 0.0 0.0 - 2 ccts - 2,100.00 - 0.0 0.0 Other Services up to and including 1Gbps Rentals and Connections 0.3 0.0 0.3 (ux) (ux) (ux) (sx) (sx) 0.3 0.0 0.3 Total Ethernet Basket 14.1 13.2 27.3 11.2 10.4 21.6
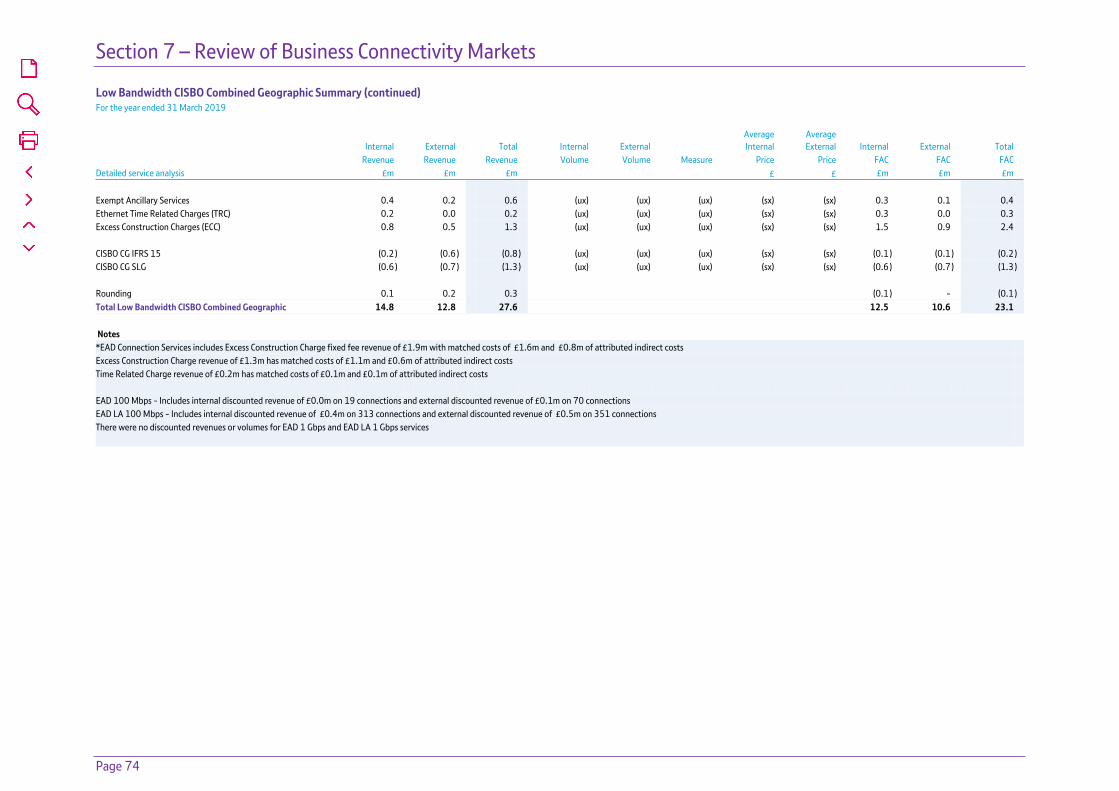
Section 7 – Review of Business Connectivity Markets
Page 74
Low Bandwidth CISBO Combined Geographic Summary (continued) For the year ended 31 March 2019
Internal External Total Internal External Average Internal
Average External Internal External Total
Revenue Revenue Revenue Volume Volume Measure Price Price FAC FAC FAC Detailed service analysis £m £m £m £ £ £m £m £m Exempt Ancillary Services 0.4 0.2 0.6 (ux) (ux) (ux) (sx) (sx) 0.3 0.1 0.4 Ethernet Time Related Charges (TRC) 0.2 0.0 0.2 (ux) (ux) (ux) (sx) (sx) 0.3 0.0 0.3 Excess Construction Charges (ECC) 0.8 0.5 1.3 (ux) (ux) (ux) (sx) (sx) 1.5 0.9 2.4 CISBO CG IFRS 15 (0.2 ) (0.6 ) (0.8 ) (ux) (ux) (ux) (sx) (sx) (0.1 ) (0.1 ) (0.2 )CISBO CG SLG (0.6 ) (0.7 ) (1.3 ) (ux) (ux) (ux) (sx) (sx) (0.6 ) (0.7 ) (1.3 ) Rounding 0.1 0.2 0.3 (0.1 ) - (0.1 )Total Low Bandwidth CISBO Combined Geographic 14.8 12.8 27.6 12.5 10.6 23.1 Notes *EAD Connection Services includes Excess Construction Charge fixed fee revenue of £1.9m with matched costs of £1.6m and £0.8m of attributed indirect costs Excess Construction Charge revenue of £1.3m has matched costs of £1.1m and £0.6m of attributed indirect costs Time Related Charge revenue of £0.2m has matched costs of £0.1m and £0.1m of attributed indirect costs EAD 100 Mbps - Includes internal discounted revenue of £0.0m on 19 connections and external discounted revenue of £0.1m on 70 connections EAD LA 100 Mbps - Includes internal discounted revenue of £0.4m on 313 connections and external discounted revenue of £0.5m on 351 connections There were no discounted revenues or volumes for EAD 1 Gbps and EAD LA 1 Gbps services
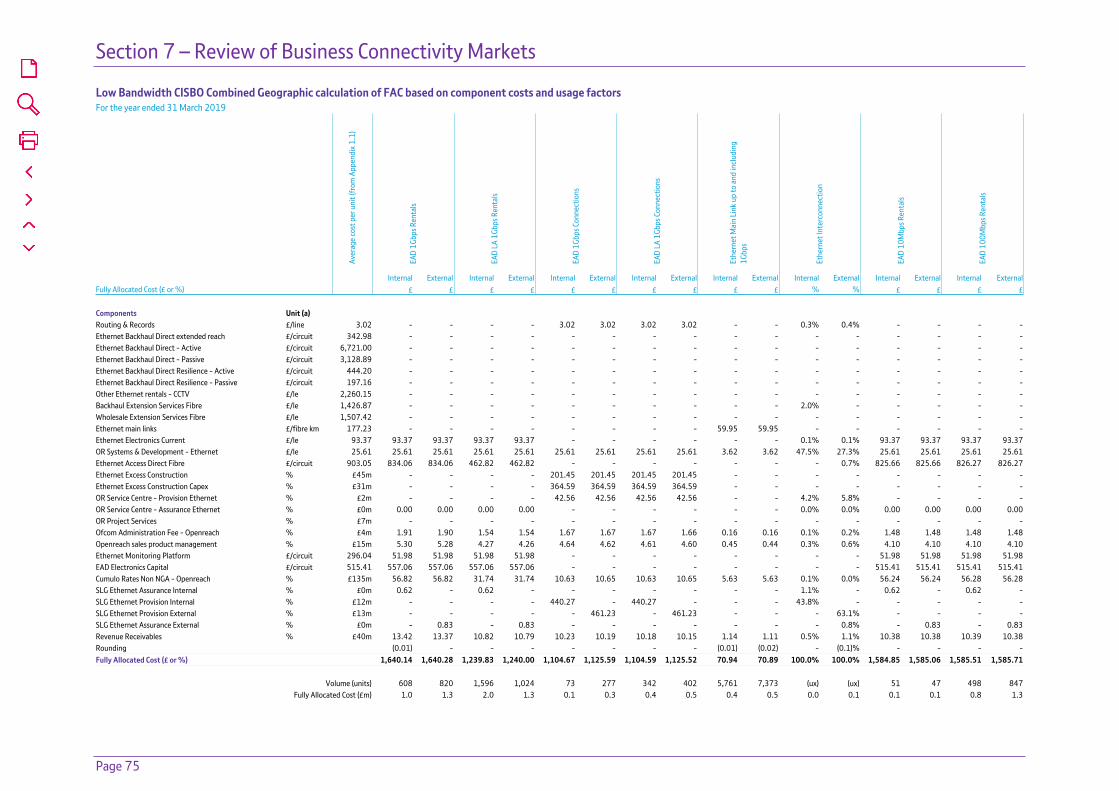
Section 7 – Review of Business Connectivity Markets
Page 75
Low Bandwidth CISBO Combined Geographic calculation of FAC based on component costs and usage factorsFor the year ended 31 March 2019
Aver
age
cost
per
uni
t (fr
om A
ppen
dix 1
.1)
EAD
1Gbp
s Ren
tals
EAD
LA 1
Gbps
Ren
tals
EAD
1Gbp
s Con
nect
ions
EAD
LA 1
Gbps
Con
nect
ions
Ethe
rnet
Mai
n Li
nk u
p to
and
inclu
ding
1G
bps
Ethe
rnet
Inte
rcon
nect
ion
EAD
10M
bps R
enta
ls
EAD
100M
bps R
enta
ls
Internal External Internal External Internal External Internal External Internal External Internal External Internal External Internal ExternalFully Allocated Cost (£ or %) £ £ £ £ £ £ £ £ £ £ % % £ £ £ £ Components Unit (a) Routing & Records £/line 3.02 - - - - 3.02 3.02 3.02 3.02 - - 0.3% 0.4% - - - -Ethernet Backhaul Direct extended reach £/circuit 342.98 - - - - - - - - - - - - - - - -Ethernet Backhaul Direct - Active £/circuit 6,721.00 - - - - - - - - - - - - - - - -Ethernet Backhaul Direct - Passive £/circuit 3,128.89 - - - - - - - - - - - - - - - -Ethernet Backhaul Direct Resilience - Active £/circuit 444.20 - - - - - - - - - - - - - - - -Ethernet Backhaul Direct Resilience - Passive £/circuit 197.16 - - - - - - - - - - - - - - - -Other Ethernet rentals - CCTV £/le 2,260.15 - - - - - - - - - - - - - - - -Backhaul Extension Services Fibre £/le 1,426.87 - - - - - - - - - - 2.0% - - - - -Wholesale Extension Services Fibre £/le 1,507.42 - - - - - - - - - - - - - - - -Ethernet main links £/fibre km 177.23 - - - - - - - - 59.95 59.95 - - - - - -Ethernet Electronics Current £/le 93.37 93.37 93.37 93.37 93.37 - - - - - - 0.1% 0.1% 93.37 93.37 93.37 93.37OR Systems & Development - Ethernet £/le 25.61 25.61 25.61 25.61 25.61 25.61 25.61 25.61 25.61 3.62 3.62 47.5% 27.3% 25.61 25.61 25.61 25.61Ethernet Access Direct Fibre £/circuit 903.05 834.06 834.06 462.82 462.82 - - - - - - - 0.7% 825.66 825.66 826.27 826.27Ethernet Excess Construction % £45m - - - - 201.45 201.45 201.45 201.45 - - - - - - - -Ethernet Excess Construction Capex % £31m - - - - 364.59 364.59 364.59 364.59 - - - - - - - -OR Service Centre - Provision Ethernet % £2m - - - - 42.56 42.56 42.56 42.56 - - 4.2% 5.8% - - - -OR Service Centre - Assurance Ethernet % £0m 0.00 0.00 0.00 0.00 - - - - - - 0.0% 0.0% 0.00 0.00 0.00 0.00OR Project Services % £7m - - - - - - - - - - - - - - - -Ofcom Administration Fee - Openreach % £4m 1.91 1.90 1.54 1.54 1.67 1.67 1.67 1.66 0.16 0.16 0.1% 0.2% 1.48 1.48 1.48 1.48Openreach sales product management % £15m 5.30 5.28 4.27 4.26 4.64 4.62 4.61 4.60 0.45 0.44 0.3% 0.6% 4.10 4.10 4.10 4.10Ethernet Monitoring Platform £/circuit 296.04 51.98 51.98 51.98 51.98 - - - - - - - - 51.98 51.98 51.98 51.98EAD Electronics Capital £/circuit 515.41 557.06 557.06 557.06 557.06 - - - - - - - - 515.41 515.41 515.41 515.41Cumulo Rates Non NGA - Openreach % £135m 56.82 56.82 31.74 31.74 10.63 10.65 10.63 10.65 5.63 5.63 0.1% 0.0% 56.24 56.24 56.28 56.28SLG Ethernet Assurance Internal % £0m 0.62 - 0.62 - - - - - - - 1.1% - 0.62 - 0.62 -SLG Ethernet Provision Internal % £12m - - - - 440.27 - 440.27 - - - 43.8% - - - - -SLG Ethernet Provision External % £13m - - - - - 461.23 - 461.23 - - - 63.1% - - - -SLG Ethernet Assurance External % £0m - 0.83 - 0.83 - - - - - - - 0.8% - 0.83 - 0.83Revenue Receivables % £40m 13.42 13.37 10.82 10.79 10.23 10.19 10.18 10.15 1.14 1.11 0.5% 1.1% 10.38 10.38 10.39 10.38Rounding (0.01) - - - - - - - (0.01) (0.02) - (0.1)% - - - -Fully Allocated Cost (£ or %) 1,640.14 1,640.28 1,239.83 1,240.00 1,104.67 1,125.59 1,104.59 1,125.52 70.94 70.89 100.0% 100.0% 1,584.85 1,585.06 1,585.51 1,585.71
Volume (units) 608 820 1,596 1,024 73 277 342 402 5,761 7,373 (ux) (ux) 51 47 498 847Fully Allocated Cost (£m) 1.0 1.3 2.0 1.3 0.1 0.3 0.4 0.5 0.4 0.5 0.0 0.1 0.1 0.1 0.8 1.3

Section 7 – Review of Business Connectivity Markets
Page 76
Low Bandwidth CISBO Combined Geographic calculation of FAC based on component costs and usage factors (continued)For the year ended 31 March 2019
Aver
age
cost
per
uni
t (fr
om A
ppen
dix 1
.1)
EAD
LA 1
0Mbp
s Ren
tals
EAD
LA 1
00M
bps R
enta
ls
EBD
1Gbp
s Ren
tals
WES
10M
bps R
enta
ls
WES
100
Mbp
s Ren
tals
WES
1Gb
ps R
enta
ls
EAD
10M
bps C
onne
ctio
ns
Internal External Internal External Internal External Internal External Internal External Internal External Internal ExternalFully Allocated Cost (£ or %) £ £ £ £ £ £ £ £ £ £ £ £ £ £ Components Unit (a) Routing & Records £/line 3.02 - - - - - - - - - - - - 3.02 3.02Ethernet Backhaul Direct extended reach £/circuit 342.98 - - - - - - - - - - - - - -Ethernet Backhaul Direct - Active £/circuit 6,721.00 - - - - 6,721.00 6,721.00 - - - - - - - -Ethernet Backhaul Direct - Passive £/circuit 3,128.89 - - - - 787.19 787.19 - - - - - - - -Ethernet Backhaul Direct Resilience - Active £/circuit 444.20 - - - - - 444.20 - - - - - - - -Ethernet Backhaul Direct Resilience - Passive £/circuit 197.16 - - - - - 49.60 - - - - - - - -Other Ethernet rentals - CCTV £/le 2,260.15 - - - - - - - - - - - - - -Backhaul Extension Services Fibre £/le 1,426.87 - - - - - - - - - - - - - -Wholesale Extension Services Fibre £/le 1,507.42 - - - - - - 689.12 689.12 697.34 697.34 702.72 702.72 - -Ethernet main links £/fibre km 177.23 - - - - - - - - - - - - - -Ethernet Electronics Current £/le 93.37 93.37 93.37 93.37 93.37 - - 49.78 49.78 53.21 53.21 50.37 50.37 - -OR Systems & Development - Ethernet £/le 25.61 25.61 25.61 25.61 25.61 25.61 25.61 12.81 12.81 12.81 12.81 12.81 12.81 25.61 25.61Ethernet Access Direct Fibre £/circuit 903.05 432.43 432.43 442.54 442.54 - - - - - - - - - -Ethernet Excess Construction % £45m - - - - - - - - - - - - 201.45 201.45Ethernet Excess Construction Capex % £31m - - - - - - - - - - - - 364.59 364.59OR Service Centre - Provision Ethernet % £2m - - - - - - - - - - - - 42.56 42.56OR Service Centre - Assurance Ethernet % £0m 0.00 0.00 0.00 0.00 0.00 0.00 0.00 0.00 0.00 0.00 0.00 0.00 - -OR Project Services % £7m - - - - - - - - - - - - - -Ofcom Administration Fee - Openreach % £4m 1.20 1.20 1.20 1.20 2.37 2.35 0.78 0.75 0.84 0.77 1.01 1.00 1.69 1.66Openreach sales product management % £15m 3.32 3.32 3.32 3.32 1.97 1.95 0.13 0.13 0.14 0.13 0.17 0.17 4.66 4.60Ethernet Monitoring Platform £/circuit 296.04 51.98 51.98 51.98 51.98 - - - - - - - - - -EAD Electronics Capital £/circuit 515.41 515.41 515.41 515.41 515.41 - - - - - - - - - -Cumulo Rates Non NGA - Openreach % £135m 29.68 29.68 30.36 30.36 76.50 80.08 43.65 43.65 44.18 44.18 44.51 44.51 10.63 10.63SLG Ethernet Assurance Internal % £0m 0.62 - 0.62 - 0.62 - 0.62 - 0.62 - 0.62 - - -SLG Ethernet Provision Internal % £12m - - - - - - - - - - - - 440.27 -SLG Ethernet Provision External % £13m - - - - - - - - - - - - - -SLG Ethernet Assurance External % £0m - 0.83 - 0.83 - 0.83 - 0.83 - 0.83 - 0.83 - -Revenue Receivables % £40m 8.41 8.40 8.41 8.40 16.67 16.49 5.49 5.27 5.88 5.43 7.11 7.02 10.33 10.13Rounding (0.01) (0.01) - - - 0.01 (0.01) (0.02) - 0.01 (0.01) (0.02) - -Fully Allocated Cost (£ or %) 1,162.02 1,162.22 1,172.82 1,173.02 7,631.93 8,129.31 802.37 802.32 815.02 814.71 819.31 819.41 1,104.81 664.25
Volume (units) 356 51 3,518 2,732 41 67 130 111 191 144 85 16 1 2Fully Allocated Cost (£m) 0.4 0.1 4.1 3.2 0.3 0.5 0.1 0.1 0.2 0.1 0.1 0.0 0.0 0.0

Section 7 – Review of Business Connectivity Markets
Page 77
Low Bandwidth CISBO Combined Geographic calculation of FAC based on component costs and usage factors (continued)For the year ended 31 March 2019
Aver
age
cost
per
uni
t (fr
om A
ppen
dix 1
.1)
EAD
100M
bps C
onne
ctio
ns
EAD
LA 1
0Mbp
s Con
nect
ions
EAD
LA 1
00M
bps C
onne
ctio
ns
EBD
1Gbp
s Con
nect
ions
Othe
r Ser
vice
s up
to a
nd in
cludi
ng 1
Gbps
Re
ntal
s and
Con
nect
ions
Exem
pt A
ncill
ary
Serv
ices
Ethe
rnet
Tim
e Re
late
d Ch
arge
s
Exce
ss C
onst
ruct
ion
Char
ges
Internal External Internal External Internal External Internal External Internal External Internal External Internal External Internal ExternalFully Allocated Cost (£ or %) £ £ £ £ £ £ £ £ % % % % % % % % Components Unit (a) Routing & Records £/line 3.02 3.02 3.02 3.02 - 3.02 3.02 - 3.02 0.1% - - - - - - -Ethernet Backhaul Direct extended reach £/circuit 342.98 - - - - - - - - - - - - - - - -Ethernet Backhaul Direct - Active £/circuit 6,721.00 - - - - - - - - - - - - - - - -Ethernet Backhaul Direct - Passive £/circuit 3,128.89 - - - - - - - - - - - - - - - -Ethernet Backhaul Direct Resilience - Active £/circuit 444.20 - - - - - - - - - - - - - - - -Ethernet Backhaul Direct Resilience - Passive £/circuit 197.16 - - - - - - - - - - - - - - - -Other Ethernet rentals - CCTV £/le 2,260.15 - - - - - - - - 57.6% 27.8% - - - - - -Backhaul Extension Services Fibre £/le 1,426.87 - - - - - - - - 25.3% 38.7% - - - - - -Wholesale Extension Services Fibre £/le 1,507.42 - - - - - - - - 0.5% 11.3% - - - - - -Ethernet main links £/fibre km 177.23 - - - - - - - - - - - - - - - -Ethernet Electronics Current £/le 93.37 - - - - - - - - 1.8% 5.1% - - - - - -OR Systems & Development - Ethernet £/le 25.61 25.61 25.61 25.61 - 25.61 25.61 - 25.61 1.2% 1.3% - - - - - -Ethernet Access Direct Fibre £/circuit 903.05 - - - - - - - - - 10.1% - - - - - -Ethernet Excess Construction % £45m 201.45 201.45 201.45 - 201.45 201.45 - - - - - - 70.0% 70.0% 72.0% 68.8%Ethernet Excess Construction Capex % £31m 364.59 364.59 364.59 - 364.59 364.59 - - - - - - 28.8% 28.8% 26.8% 29.8%OR Service Centre - Provision Ethernet % £2m 42.56 42.56 42.56 - 42.56 42.56 - 42.56 0.8% - - - - - - -OR Service Centre - Assurance Ethernet % £0m - - - - - - - - 0.0% 0.0% - - - - - -OR Project Services % £7m - - - - - - - - - - 98.7% 98.2% - - - -Ofcom Administration Fee - Openreach % £4m 1.14 1.12 1.63 - 1.17 1.12 - 1.83 0.1% 0.1% 0.1% 0.2% 0.0% 0.0% 0.0% 0.0%Openreach sales product management % £15m 3.15 3.11 4.52 - 3.24 3.11 - 1.51 0.2% 0.3% 0.3% 0.3% 0.1% 0.1% 0.1% 0.1%Ethernet Monitoring Platform £/circuit 296.04 - - - - - - - - 1.3% 0.6% - - - - - -EAD Electronics Capital £/circuit 515.41 - - - - - - - - - - - - - - - -Cumulo Rates Non NGA - Openreach % £135m 10.63 10.65 10.63 - 10.63 10.65 - 0.03 1.6% 3.8% 0.0% 0.0% 0.8% 0.8% 0.8% 0.9%SLG Ethernet Assurance Internal % £0m - - - - - - - - 0.0% - - - - - - -SLG Ethernet Provision Internal % £12m 440.27 - 440.27 - 440.27 - - - 8.7% - - - - - - -SLG Ethernet Provision External % £13m - 461.23 - - - 461.23 - 461.23 - - - - - - - -SLG Ethernet Assurance External % £0m - - - - - - - - - 0.1% - - - - - -Revenue Receivables % £40m 6.94 6.87 9.98 - 7.15 6.85 - 11.18 0.7% 0.8% 0.8% 1.3% 0.3% 0.3% 0.3% 0.3%Rounding - 0.01 - - - - - - 0.1% - 0.1% - - - - 0.1%Fully Allocated Cost (£ or %) 1,099.36 1,120.22 1,104.26 - 1,099.69 1,120.19 - 546.97 100.0% 100.0% 100.0% 100.0% 100.0% 100.0% 100.0% 100.0%
Volume (units) 73 178 3 - 718 712 - 2 (ux) (ux) (ux) (ux) (ux) (ux) (ux) (ux)Fully Allocated Cost (£m) 0.1 0.2 0.0 - 0.8 0.8 - 0.0 0.3 0.0 0.3 0.1 0.3 0.0 1.5 0.9
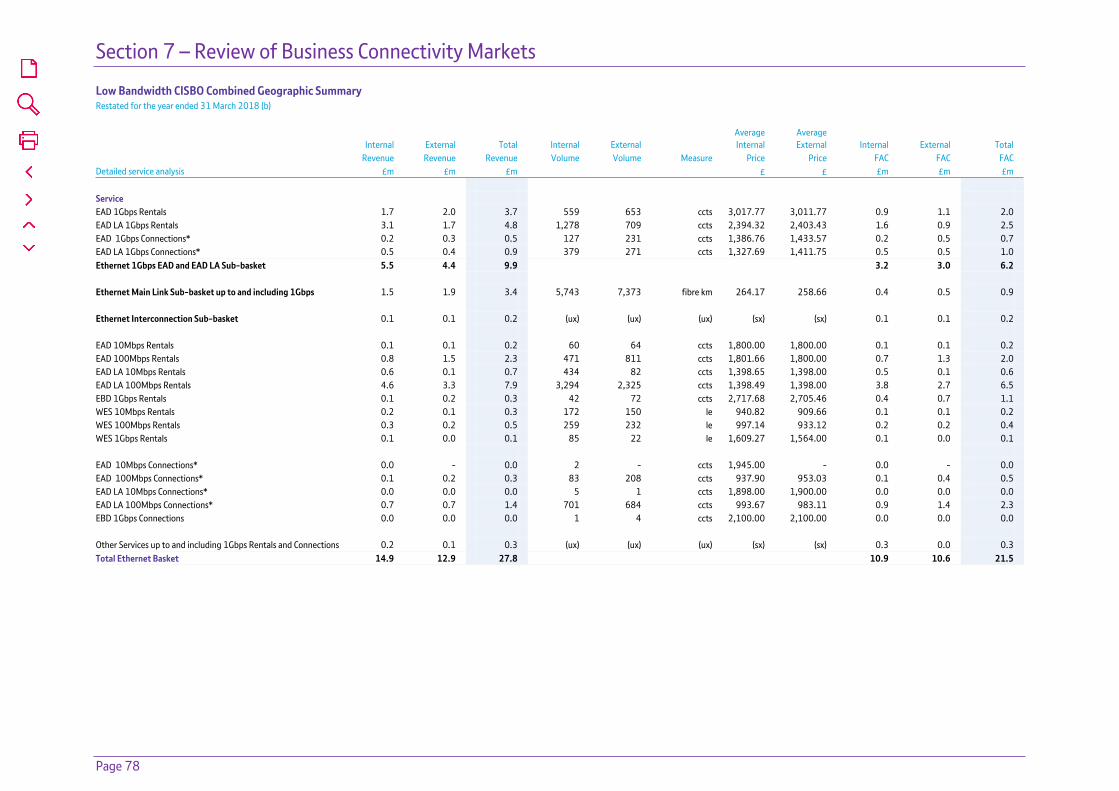
Section 7 – Review of Business Connectivity Markets
Page 78
Low Bandwidth CISBO Combined Geographic Summary Restated for the year ended 31 March 2018 (b)
Internal External Total Internal External Average Internal
Average External Internal External Total
Revenue Revenue Revenue Volume Volume Measure Price Price FAC FAC FAC Detailed service analysis £m £m £m £ £ £m £m £m Service EAD 1Gbps Rentals 1.7 2.0 3.7 559 653 ccts 3,017.77 3,011.77 0.9 1.1 2.0 EAD LA 1Gbps Rentals 3.1 1.7 4.8 1,278 709 ccts 2,394.32 2,403.43 1.6 0.9 2.5 EAD 1Gbps Connections* 0.2 0.3 0.5 127 231 ccts 1,386.76 1,433.57 0.2 0.5 0.7 EAD LA 1Gbps Connections* 0.5 0.4 0.9 379 271 ccts 1,327.69 1,411.75 0.5 0.5 1.0 Ethernet 1Gbps EAD and EAD LA Sub-basket 5.5 4.4 9.9 3.2 3.0 6.2 Ethernet Main Link Sub-basket up to and including 1Gbps 1.5 1.9 3.4 5,743 7,373 fibre km 264.17 258.66 0.4 0.5 0.9 Ethernet Interconnection Sub-basket 0.1 0.1 0.2 (ux) (ux) (ux) (sx) (sx) 0.1 0.1 0.2 EAD 10Mbps Rentals 0.1 0.1 0.2 60 64 ccts 1,800.00 1,800.00 0.1 0.1 0.2 EAD 100Mbps Rentals 0.8 1.5 2.3 471 811 ccts 1,801.66 1,800.00 0.7 1.3 2.0 EAD LA 10Mbps Rentals 0.6 0.1 0.7 434 82 ccts 1,398.65 1,398.00 0.5 0.1 0.6 EAD LA 100Mbps Rentals 4.6 3.3 7.9 3,294 2,325 ccts 1,398.49 1,398.00 3.8 2.7 6.5 EBD 1Gbps Rentals 0.1 0.2 0.3 42 72 ccts 2,717.68 2,705.46 0.4 0.7 1.1 WES 10Mbps Rentals 0.2 0.1 0.3 172 150 le 940.82 909.66 0.1 0.1 0.2 WES 100Mbps Rentals 0.3 0.2 0.5 259 232 le 997.14 933.12 0.2 0.2 0.4 WES 1Gbps Rentals 0.1 0.0 0.1 85 22 le 1,609.27 1,564.00 0.1 0.0 0.1 EAD 10Mbps Connections* 0.0 - 0.0 2 - ccts 1,945.00 - 0.0 - 0.0 EAD 100Mbps Connections* 0.1 0.2 0.3 83 208 ccts 937.90 953.03 0.1 0.4 0.5 EAD LA 10Mbps Connections* 0.0 0.0 0.0 5 1 ccts 1,898.00 1,900.00 0.0 0.0 0.0 EAD LA 100Mbps Connections* 0.7 0.7 1.4 701 684 ccts 993.67 983.11 0.9 1.4 2.3 EBD 1Gbps Connections 0.0 0.0 0.0 1 4 ccts 2,100.00 2,100.00 0.0 0.0 0.0 Other Services up to and including 1Gbps Rentals and Connections 0.2 0.1 0.3 (ux) (ux) (ux) (sx) (sx) 0.3 0.0 0.3 Total Ethernet Basket 14.9 12.9 27.8 10.9 10.6 21.5
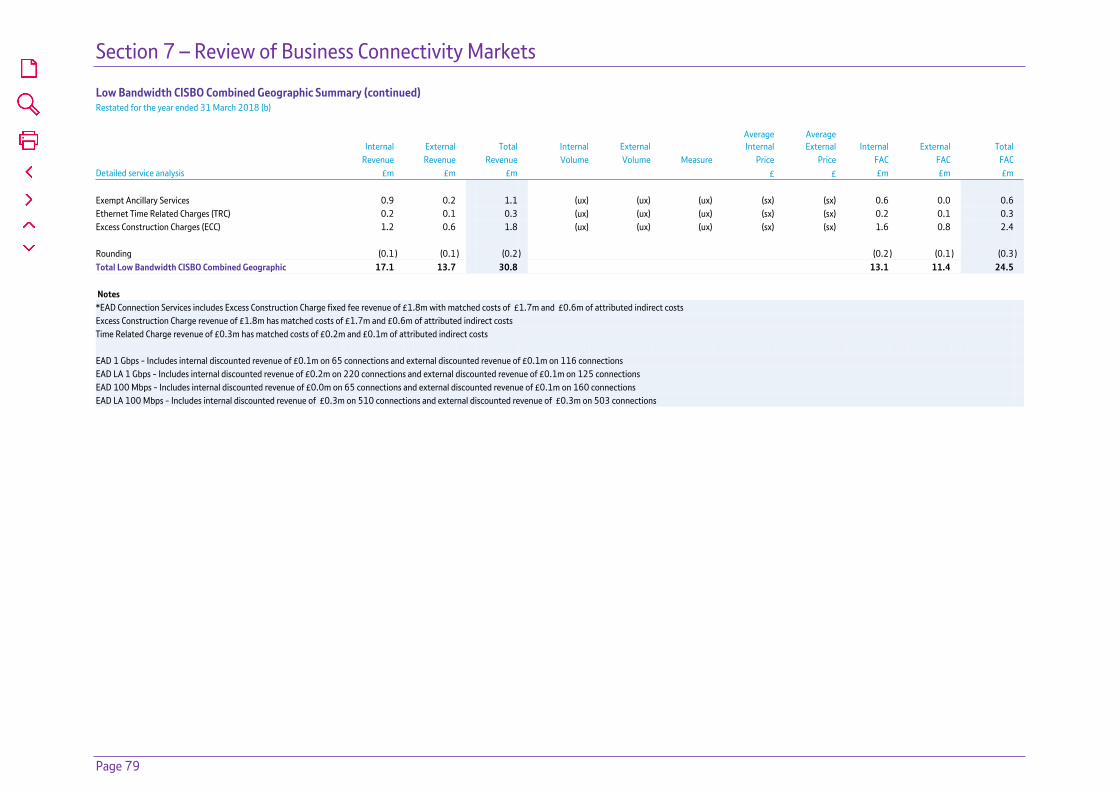
Section 7 – Review of Business Connectivity Markets
Page 79
Low Bandwidth CISBO Combined Geographic Summary (continued) Restated for the year ended 31 March 2018 (b)
Internal External Total Internal External Average Internal
Average External Internal External Total
Revenue Revenue Revenue Volume Volume Measure Price Price FAC FAC FAC Detailed service analysis £m £m £m £ £ £m £m £m Exempt Ancillary Services 0.9 0.2 1.1 (ux) (ux) (ux) (sx) (sx) 0.6 0.0 0.6 Ethernet Time Related Charges (TRC) 0.2 0.1 0.3 (ux) (ux) (ux) (sx) (sx) 0.2 0.1 0.3 Excess Construction Charges (ECC) 1.2 0.6 1.8 (ux) (ux) (ux) (sx) (sx) 1.6 0.8 2.4 Rounding (0.1 ) (0.1 ) (0.2 ) (0.2 ) (0.1 ) (0.3 )Total Low Bandwidth CISBO Combined Geographic 17.1 13.7 30.8 13.1 11.4 24.5 Notes *EAD Connection Services includes Excess Construction Charge fixed fee revenue of £1.8m with matched costs of £1.7m and £0.6m of attributed indirect costs Excess Construction Charge revenue of £1.8m has matched costs of £1.7m and £0.6m of attributed indirect costs Time Related Charge revenue of £0.3m has matched costs of £0.2m and £0.1m of attributed indirect costs EAD 1 Gbps - Includes internal discounted revenue of £0.1m on 65 connections and external discounted revenue of £0.1m on 116 connections EAD LA 1 Gbps - Includes internal discounted revenue of £0.2m on 220 connections and external discounted revenue of £0.1m on 125 connections EAD 100 Mbps - Includes internal discounted revenue of £0.0m on 65 connections and external discounted revenue of £0.1m on 160 connections EAD LA 100 Mbps - Includes internal discounted revenue of £0.3m on 510 connections and external discounted revenue of £0.3m on 503 connections
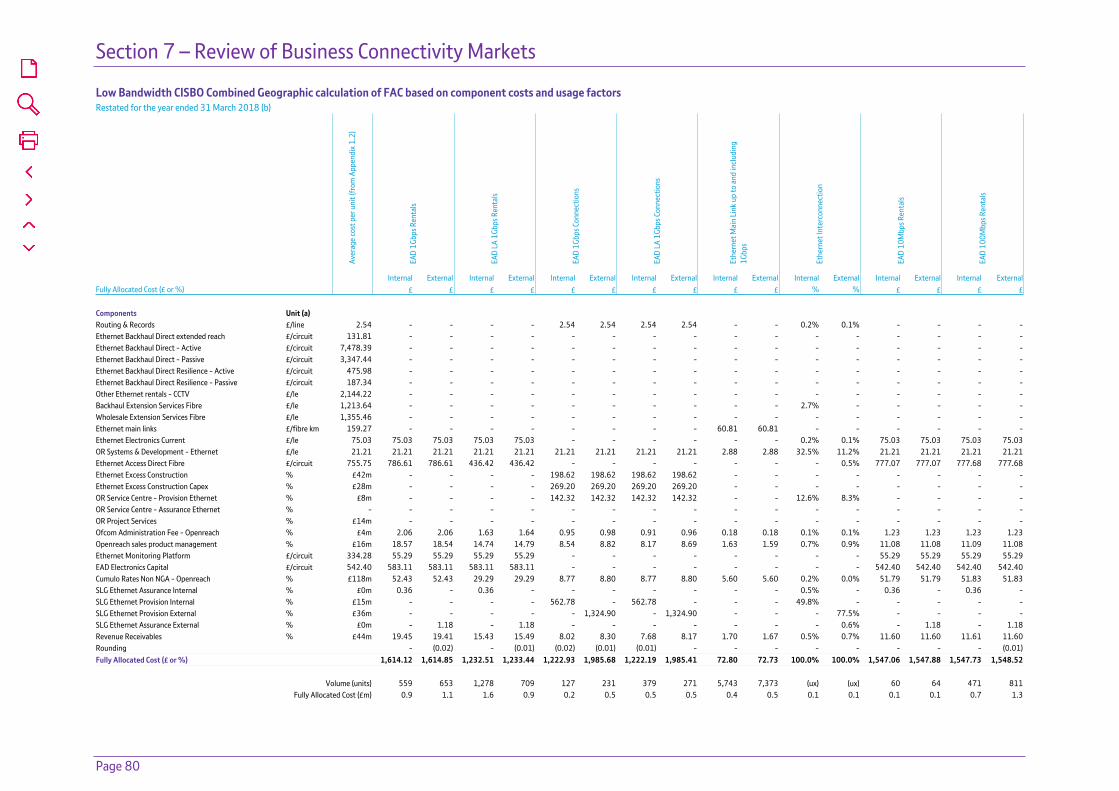
Section 7 – Review of Business Connectivity Markets
Page 80
Low Bandwidth CISBO Combined Geographic calculation of FAC based on component costs and usage factorsRestated for the year ended 31 March 2018 (b)
Aver
age
cost
per
uni
t (fr
om A
ppen
dix 1
.2)
EAD
1Gbp
s Ren
tals
EAD
LA 1
Gbps
Ren
tals
EAD
1Gbp
s Con
nect
ions
EAD
LA 1
Gbps
Con
nect
ions
Ethe
rnet
Mai
n Li
nk u
p to
and
inclu
ding
1G
bps
Ethe
rnet
Inte
rcon
nect
ion
EAD
10M
bps R
enta
ls
EAD
100M
bps R
enta
ls
Internal External Internal External Internal External Internal External Internal External Internal External Internal External Internal ExternalFully Allocated Cost (£ or %) £ £ £ £ £ £ £ £ £ £ % % £ £ £ £ Components Unit (a) Routing & Records £/line 2.54 - - - - 2.54 2.54 2.54 2.54 - - 0.2% 0.1% - - - -Ethernet Backhaul Direct extended reach £/circuit 131.81 - - - - - - - - - - - - - - - -Ethernet Backhaul Direct - Active £/circuit 7,478.39 - - - - - - - - - - - - - - - -Ethernet Backhaul Direct - Passive £/circuit 3,347.44 - - - - - - - - - - - - - - - -Ethernet Backhaul Direct Resilience - Active £/circuit 475.98 - - - - - - - - - - - - - - - -Ethernet Backhaul Direct Resilience - Passive £/circuit 187.34 - - - - - - - - - - - - - - - -Other Ethernet rentals - CCTV £/le 2,144.22 - - - - - - - - - - - - - - - -Backhaul Extension Services Fibre £/le 1,213.64 - - - - - - - - - - 2.7% - - - - -Wholesale Extension Services Fibre £/le 1,355.46 - - - - - - - - - - - - - - - -Ethernet main links £/fibre km 159.27 - - - - - - - - 60.81 60.81 - - - - - -Ethernet Electronics Current £/le 75.03 75.03 75.03 75.03 75.03 - - - - - - 0.2% 0.1% 75.03 75.03 75.03 75.03OR Systems & Development - Ethernet £/le 21.21 21.21 21.21 21.21 21.21 21.21 21.21 21.21 21.21 2.88 2.88 32.5% 11.2% 21.21 21.21 21.21 21.21Ethernet Access Direct Fibre £/circuit 755.75 786.61 786.61 436.42 436.42 - - - - - - - 0.5% 777.07 777.07 777.68 777.68Ethernet Excess Construction % £42m - - - - 198.62 198.62 198.62 198.62 - - - - - - - -Ethernet Excess Construction Capex % £28m - - - - 269.20 269.20 269.20 269.20 - - - - - - - -OR Service Centre - Provision Ethernet % £8m - - - - 142.32 142.32 142.32 142.32 - - 12.6% 8.3% - - - -OR Service Centre - Assurance Ethernet % - - - - - - - - - - - - - - - - -OR Project Services % £14m - - - - - - - - - - - - - - - -Ofcom Administration Fee - Openreach % £4m 2.06 2.06 1.63 1.64 0.95 0.98 0.91 0.96 0.18 0.18 0.1% 0.1% 1.23 1.23 1.23 1.23Openreach sales product management % £16m 18.57 18.54 14.74 14.79 8.54 8.82 8.17 8.69 1.63 1.59 0.7% 0.9% 11.08 11.08 11.09 11.08Ethernet Monitoring Platform £/circuit 334.28 55.29 55.29 55.29 55.29 - - - - - - - - 55.29 55.29 55.29 55.29EAD Electronics Capital £/circuit 542.40 583.11 583.11 583.11 583.11 - - - - - - - - 542.40 542.40 542.40 542.40Cumulo Rates Non NGA - Openreach % £118m 52.43 52.43 29.29 29.29 8.77 8.80 8.77 8.80 5.60 5.60 0.2% 0.0% 51.79 51.79 51.83 51.83SLG Ethernet Assurance Internal % £0m 0.36 - 0.36 - - - - - - - 0.5% - 0.36 - 0.36 -SLG Ethernet Provision Internal % £15m - - - - 562.78 - 562.78 - - - 49.8% - - - - -SLG Ethernet Provision External % £36m - - - - - 1,324.90 - 1,324.90 - - - 77.5% - - - -SLG Ethernet Assurance External % £0m - 1.18 - 1.18 - - - - - - - 0.6% - 1.18 - 1.18Revenue Receivables % £44m 19.45 19.41 15.43 15.49 8.02 8.30 7.68 8.17 1.70 1.67 0.5% 0.7% 11.60 11.60 11.61 11.60Rounding - (0.02) - (0.01) (0.02) (0.01) (0.01) - - - - - - - - (0.01)Fully Allocated Cost (£ or %) 1,614.12 1,614.85 1,232.51 1,233.44 1,222.93 1,985.68 1,222.19 1,985.41 72.80 72.73 100.0% 100.0% 1,547.06 1,547.88 1,547.73 1,548.52
Volume (units) 559 653 1,278 709 127 231 379 271 5,743 7,373 (ux) (ux) 60 64 471 811Fully Allocated Cost (£m) 0.9 1.1 1.6 0.9 0.2 0.5 0.5 0.5 0.4 0.5 0.1 0.1 0.1 0.1 0.7 1.3
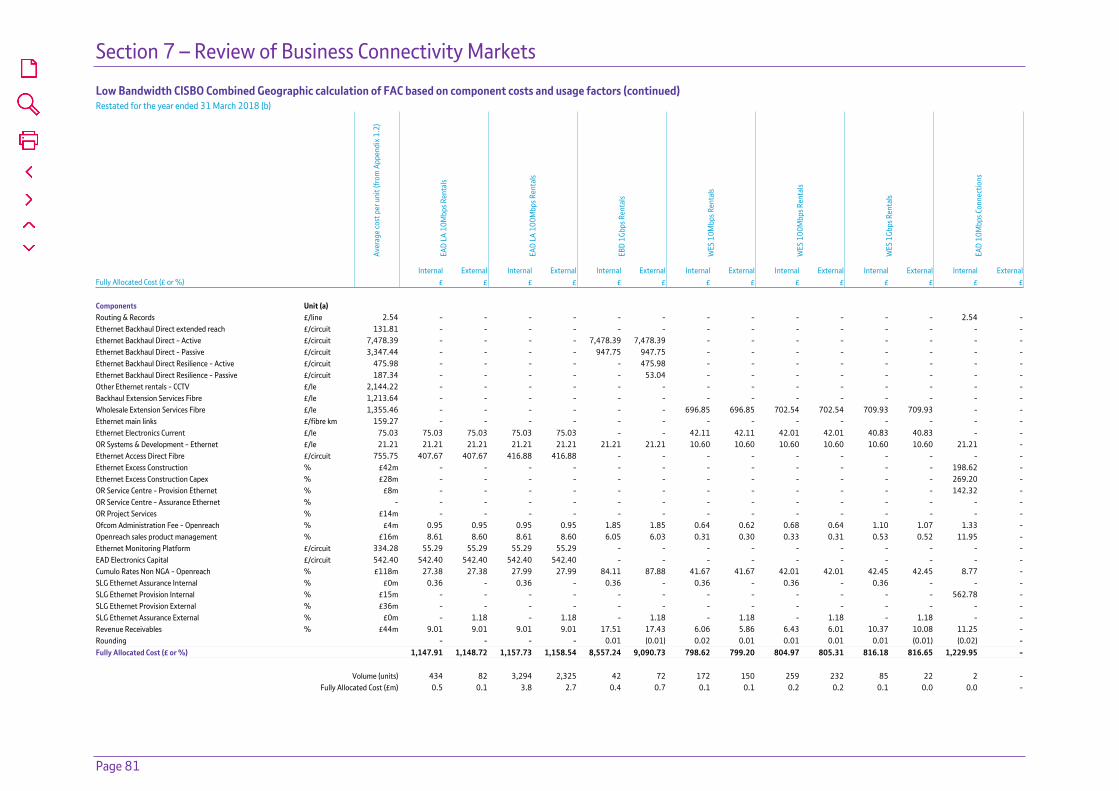
Section 7 – Review of Business Connectivity Markets
Page 81
Low Bandwidth CISBO Combined Geographic calculation of FAC based on component costs and usage factors (continued)Restated for the year ended 31 March 2018 (b)
Aver
age
cost
per
uni
t (fr
om A
ppen
dix 1
.2)
EAD
LA 1
0Mbp
s Ren
tals
EAD
LA 1
00M
bps R
enta
ls
EBD
1Gbp
s Ren
tals
WES
10M
bps R
enta
ls
WES
100
Mbp
s Ren
tals
WES
1Gb
ps R
enta
ls
EAD
10M
bps C
onne
ctio
ns
Internal External Internal External Internal External Internal External Internal External Internal External Internal ExternalFully Allocated Cost (£ or %) £ £ £ £ £ £ £ £ £ £ £ £ £ £ Components Unit (a) Routing & Records £/line 2.54 - - - - - - - - - - - - 2.54 -Ethernet Backhaul Direct extended reach £/circuit 131.81 - - - - - - - - - - - - - -Ethernet Backhaul Direct - Active £/circuit 7,478.39 - - - - 7,478.39 7,478.39 - - - - - - - -Ethernet Backhaul Direct - Passive £/circuit 3,347.44 - - - - 947.75 947.75 - - - - - - - -Ethernet Backhaul Direct Resilience - Active £/circuit 475.98 - - - - - 475.98 - - - - - - - -Ethernet Backhaul Direct Resilience - Passive £/circuit 187.34 - - - - - 53.04 - - - - - - - -Other Ethernet rentals - CCTV £/le 2,144.22 - - - - - - - - - - - - - -Backhaul Extension Services Fibre £/le 1,213.64 - - - - - - - - - - - - - -Wholesale Extension Services Fibre £/le 1,355.46 - - - - - - 696.85 696.85 702.54 702.54 709.93 709.93 - -Ethernet main links £/fibre km 159.27 - - - - - - - - - - - - - -Ethernet Electronics Current £/le 75.03 75.03 75.03 75.03 75.03 - - 42.11 42.11 42.01 42.01 40.83 40.83 - -OR Systems & Development - Ethernet £/le 21.21 21.21 21.21 21.21 21.21 21.21 21.21 10.60 10.60 10.60 10.60 10.60 10.60 21.21 -Ethernet Access Direct Fibre £/circuit 755.75 407.67 407.67 416.88 416.88 - - - - - - - - - -Ethernet Excess Construction % £42m - - - - - - - - - - - - 198.62 -Ethernet Excess Construction Capex % £28m - - - - - - - - - - - - 269.20 -OR Service Centre - Provision Ethernet % £8m - - - - - - - - - - - - 142.32 -OR Service Centre - Assurance Ethernet % - - - - - - - - - - - - - - -OR Project Services % £14m - - - - - - - - - - - - - -Ofcom Administration Fee - Openreach % £4m 0.95 0.95 0.95 0.95 1.85 1.85 0.64 0.62 0.68 0.64 1.10 1.07 1.33 -Openreach sales product management % £16m 8.61 8.60 8.61 8.60 6.05 6.03 0.31 0.30 0.33 0.31 0.53 0.52 11.95 -Ethernet Monitoring Platform £/circuit 334.28 55.29 55.29 55.29 55.29 - - - - - - - - - -EAD Electronics Capital £/circuit 542.40 542.40 542.40 542.40 542.40 - - - - - - - - - -Cumulo Rates Non NGA - Openreach % £118m 27.38 27.38 27.99 27.99 84.11 87.88 41.67 41.67 42.01 42.01 42.45 42.45 8.77 -SLG Ethernet Assurance Internal % £0m 0.36 - 0.36 - 0.36 - 0.36 - 0.36 - 0.36 - - -SLG Ethernet Provision Internal % £15m - - - - - - - - - - - - 562.78 -SLG Ethernet Provision External % £36m - - - - - - - - - - - - - -SLG Ethernet Assurance External % £0m - 1.18 - 1.18 - 1.18 - 1.18 - 1.18 - 1.18 - -Revenue Receivables % £44m 9.01 9.01 9.01 9.01 17.51 17.43 6.06 5.86 6.43 6.01 10.37 10.08 11.25 -Rounding - - - - 0.01 (0.01) 0.02 0.01 0.01 0.01 0.01 (0.01) (0.02) -Fully Allocated Cost (£ or %) 1,147.91 1,148.72 1,157.73 1,158.54 8,557.24 9,090.73 798.62 799.20 804.97 805.31 816.18 816.65 1,229.95 -
Volume (units) 434 82 3,294 2,325 42 72 172 150 259 232 85 22 2 -Fully Allocated Cost (£m) 0.5 0.1 3.8 2.7 0.4 0.7 0.1 0.1 0.2 0.2 0.1 0.0 0.0 -

Section 7 – Review of Business Connectivity Markets
Page 82
Low Bandwidth CISBO Combined Geographic calculation of FAC based on component costs and usage factors (continued)Restated for the year ended 31 March 2018 (b)
Aver
age
cost
per
uni
t (fr
om A
ppen
dix 1
.2)
EAD
100M
bps C
onne
ctio
ns
EAD
LA 1
0Mbp
s Con
nect
ions
EAD
LA 1
00M
bps C
onne
ctio
ns
EBD
1Gbp
s Con
nect
ions
Othe
r Ser
vice
s up
to a
nd in
cludi
ng 1
Gbps
Re
ntal
s and
Con
nect
ions
Exem
pt A
ncill
ary
Serv
ices
Ethe
rnet
Tim
e Re
late
d Ch
arge
s
Exce
ss C
onst
ruct
ion
Char
ges
Internal External Internal External Internal External Internal External Internal External Internal External Internal External Internal ExternalFully Allocated Cost (£ or %) £ £ £ £ £ £ £ £ % % % % % % % % Components Unit (a) Routing & Records £/line 2.54 2.54 2.54 2.54 2.54 2.54 2.54 2.54 2.54 0.0% - - - - - - -Ethernet Backhaul Direct extended reach £/circuit 131.81 - - - - - - - - - - - - - - - -Ethernet Backhaul Direct - Active £/circuit 7,478.39 - - - - - - - - - - - - - - - -Ethernet Backhaul Direct - Passive £/circuit 3,347.44 - - - - - - - - - - - - - - - -Ethernet Backhaul Direct Resilience - Active £/circuit 475.98 - - - - - - - - - - - - - - - -Ethernet Backhaul Direct Resilience - Passive £/circuit 187.34 - - - - - - - - - - - - - - - -Other Ethernet rentals - CCTV £/le 2,144.22 - - - - - - - - 63.9% 21.5% - - - - - -Backhaul Extension Services Fibre £/le 1,213.64 - - - - - - - - 28.3% 43.0% - - - - - -Wholesale Extension Services Fibre £/le 1,355.46 - - - - - - - - 0.5% 15.1% - - - - - -Ethernet main links £/fibre km 159.27 - - - - - - - - - - - - - - - -Ethernet Electronics Current £/le 75.03 - - - - - - - - 1.7% 4.5% - - - - - -OR Systems & Development - Ethernet £/le 21.21 21.21 21.21 21.21 21.21 21.21 21.21 21.21 21.21 0.7% 1.2% - - - - - -Ethernet Access Direct Fibre £/circuit 755.75 - - - - - - - - - 7.8% - - - - - -Ethernet Excess Construction % £42m 198.62 198.62 198.62 198.62 198.62 198.62 - - - - - - 66.9% 66.9% 67.3% 66.5%Ethernet Excess Construction Capex % £28m 269.20 269.20 269.20 269.20 269.20 269.20 - - - - - - 31.2% 31.2% 30.8% 31.6%OR Service Centre - Provision Ethernet % £8m 142.32 142.32 142.32 142.32 142.32 142.32 142.32 142.32 0.2% - - - - - - -OR Service Centre - Assurance Ethernet % - - - - - - - - - - - - - - - - -OR Project Services % £14m - - - - - - - - - - 98.6% 96.1% - - - -Ofcom Administration Fee - Openreach % £4m 0.64 0.65 1.30 1.30 0.68 0.67 1.43 1.43 0.1% 0.1% 0.1% 0.4% 0.1% 0.1% 0.1% 0.1%Openreach sales product management % £16m 5.77 5.87 11.68 11.71 6.12 6.05 4.69 4.69 0.1% 1.0% 0.5% 0.6% 0.3% 0.3% 0.3% 0.3%Ethernet Monitoring Platform £/circuit 334.28 - - - - - - - - 1.6% 0.6% - - - - - -EAD Electronics Capital £/circuit 542.40 - - - - - - - - - - - - - - - -Cumulo Rates Non NGA - Openreach % £118m 8.77 8.80 8.77 8.80 8.77 8.80 0.02 0.05 1.7% 4.0% 0.0% 0.0% 1.0% 1.0% 1.0% 1.0%SLG Ethernet Assurance Internal % £0m - - - - - - - - 0.0% - - - - - - -SLG Ethernet Provision Internal % £15m 562.78 - 562.78 - 562.78 - 562.78 - 0.6% - - - - - - -SLG Ethernet Provision External % £36m - 1,324.90 - 1,324.90 - 1,324.90 - 1,324.90 - - - - - - - -SLG Ethernet Assurance External % £0m - - - - - - - - - 0.1% - - - - - -Revenue Receivables % £44m 5.43 5.51 10.98 10.99 5.75 5.69 12.15 12.15 0.5% 1.1% 0.8% 3.0% 0.4% 0.4% 0.4% 0.4%Rounding (0.02) - (0.02) - (0.02) - (0.02) - 0.1% - - (0.1)% 0.1% 0.1% 0.1% 0.1%Fully Allocated Cost (£ or %) 1,217.26 1,979.62 1,229.38 1,991.59 1,217.97 1,980.00 747.12 1,509.29 100.0% 100.0% 100.0% 100.0% 100.0% 100.0% 100.0% 100.0%
Volume (units) 83 208 5 1 701 684 1 4 (ux) (ux) (ux) (ux) (ux) (ux) (ux) (ux)Fully Allocated Cost (£m) 0.1 0.4 0.0 0.0 0.9 1.4 0.0 0.0 0.3 0.0 0.6 0.0 0.2 0.1 1.6 0.8

Section 7 – Review of Business Connectivity Markets
Page 83
Low Bandwidth TISBO Summary For the year ended 31 March 2019
Internal External Total Internal External Average Internal
Average External Internal External Total
Revenue Revenue Revenue Volume Volume Measure Price Price FAC FAC FAC Detailed service analysis £m £m £m £ £ £m £m £m Service Radio Backhaul Services 64Kbps Connections 0.0 0.0 0.0 0 2 ccts 304.75 304.75 0.0 0.0 0.0 Radio Backhaul Services 64Kbps Rentals 0.7 3.1 3.8 (ux) (ux) (ux) (sx) (sx) 0.7 3.4 4.1 Radio Backhaul Services 2Mbps Connections 0.0 0.0 0.0 1 4 ccts 2,066.53 2,066.53 0.0 0.1 0.1 Radio Backhaul Services 2Mbps Rentals 2.0 9.2 11.2 (ux) (ux) (ux) (sx) (sx) 1.4 6.8 8.2 Other Mobile Services 0.4 - 0.4 (ux) (ux) (ux) (sx) (sx) 0.5 - 0.5 TI Mobile Services Sub-Cap 3.1 12.3 15.4 2.6 10.3 12.9 Partial and Private Circuits Point of Handover - 0.8 0.8 (ux) 13,707 le (sx) 58.33 - 1.5 1.5 TI Interconnection Sub-Cap - 0.8 0.8 - 1.5 1.5 Partial and Private Circuits 64Kbps Connections - - - (ux) (ux) (ux) (sx) (sx) 0.0 0.1 0.1 Partial and Private Circuits 64Kbps Local Ends 7.6 1.2 8.8 9,952 1,625 le 765.77 765.77 17.3 2.8 20.1 Partial and Private Circuits 64Kbps Links 5.3 0.9 6.2 28,650 4,988 links 183.60 183.27 4.7 0.8 5.5 Partial and Private Circuits 64Kbps Terminating segments 2.0 0.5 2.5 561,120 140,180 km 3.53 3.51 4.2 1.1 5.3 Partial and Private Circuits 2Mbps Connections 0.6 0.2 0.8 251 111 ccts 2,217.40 2,217.40 3.7 1.6 5.3 Partial and Private Circuits 2Mbps Local Ends 30.5 11.5 42.0 31,258 11,690 le 974.97 983.55 16.2 6.0 22.2 Partial and Private Circuits 2Mbps Links 6.3 3.8 10.1 14,938 9,566 links 418.97 397.61 3.1 2.0 5.1 Partial and Private Circuits 2Mbps Terminating segments 17.4 13.0 30.4 267,064 194,256 km 65.12 67.06 16.2 12.3 28.5 Partial and Private Circuits Other 1.5 3.8 5.3 (ux) (ux) (ux) (sx) (sx) 0.2 5.1 5.3 TI All Services Sub-Cap 71.2 34.9 106.1 65.6 31.8 97.4 TI Services Basket 74.3 48.0 122.3 68.2 43.6 111.8 TI Excess Construction Charges* 0.1 0.1 0.2 ECC Asset Depreciation** - - - Rounding (0.3 ) 0.2 (0.1 ) Total Low Bandwidth TISBO 74.1 48.3 122.4 Notes *Estimated matched cost of £0.1m (Internal) and £0.1m (External). These are capital costs and therefore not included in the market total of operating costs. ** Estimated depreciation on equipment of £3.2m
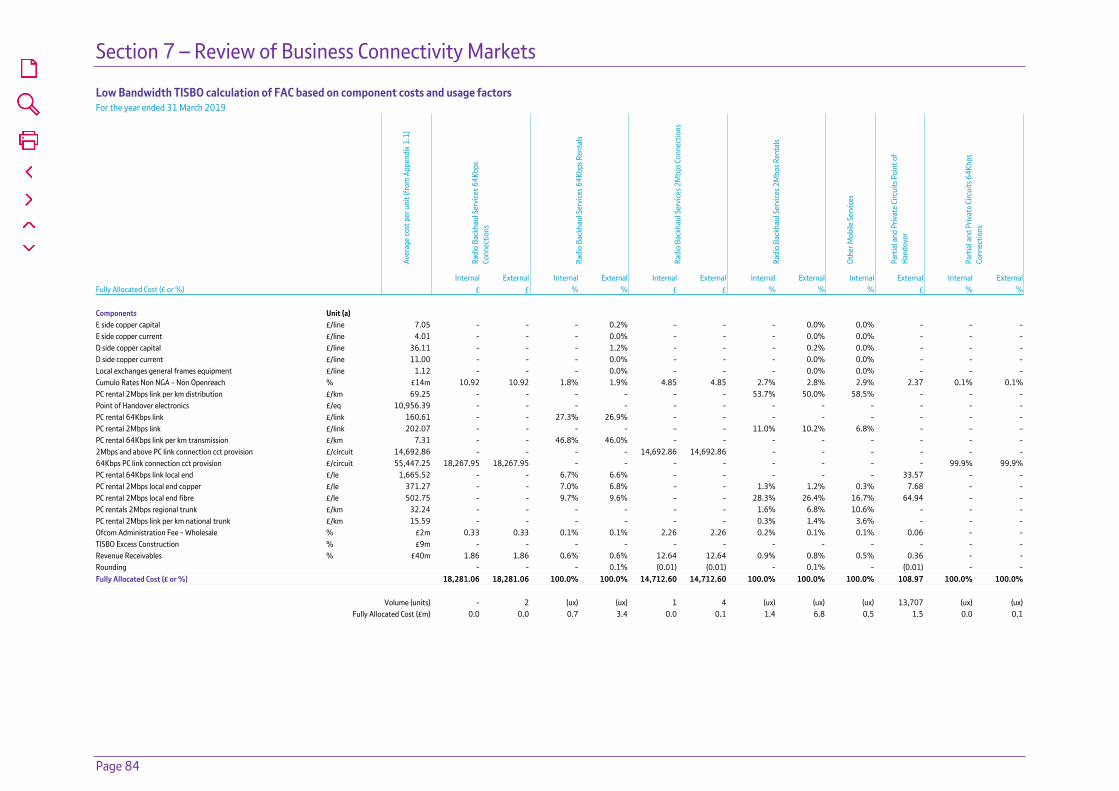
Section 7 – Review of Business Connectivity Markets
Page 84
Low Bandwidth TISBO calculation of FAC based on component costs and usage factorsFor the year ended 31 March 2019
Aver
age
cost
per
uni
t (fr
om A
ppen
dix 1
.1)
Radi
o Ba
ckha
ul S
ervi
ces 6
4Kbp
s Co
nnec
tions
Radi
o Ba
ckha
ul S
ervi
ces 6
4Kbp
s Ren
tals
Radi
o Ba
ckha
ul S
ervi
ces 2
Mbp
s Con
nect
ions
Radi
o Ba
ckha
ul S
ervi
ces 2
Mbp
s Ren
tals
Othe
r Mob
ile S
ervi
ces
Part
ial a
nd P
rivat
e Ci
rcui
ts P
oint
of
Hand
over
Part
ial a
nd P
rivat
e Ci
rcui
ts 6
4Kbp
s Co
nnec
tions
Internal External Internal External Internal External Internal External Internal External Internal ExternalFully Allocated Cost (£ or %) £ £ % % £ £ % % % £ % % Components Unit (a) E side copper capital £/line 7.05 - - - 0.2% - - - 0.0% 0.0% - - -E side copper current £/line 4.01 - - - 0.0% - - - 0.0% 0.0% - - -D side copper capital £/line 36.11 - - - 1.2% - - - 0.2% 0.0% - - -D side copper current £/line 11.00 - - - 0.0% - - - 0.0% 0.0% - - -Local exchanges general frames equipment £/line 1.12 - - - 0.0% - - - 0.0% 0.0% - - -Cumulo Rates Non NGA - Non Openreach % £14m 10.92 10.92 1.8% 1.9% 4.85 4.85 2.7% 2.8% 2.9% 2.37 0.1% 0.1%PC rental 2Mbps link per km distribution £/km 69.25 - - - - - - 53.7% 50.0% 58.5% - - -Point of Handover electronics £/eq 10,956.39 - - - - - - - - - - - -PC rental 64Kbps link £/link 160.61 - - 27.3% 26.9% - - - - - - - -PC rental 2Mbps link £/link 202.07 - - - - - - 11.0% 10.2% 6.8% - - -PC rental 64Kbps link per km transmission £/km 7.31 - - 46.8% 46.0% - - - - - - - -2Mbps and above PC link connection cct provision £/circuit 14,692.86 - - - - 14,692.86 14,692.86 - - - - - -64Kbps PC link connection cct provision £/circuit 55,447.25 18,267.95 18,267.95 - - - - - - - - 99.9% 99.9%PC rental 64Kbps link local end £/le 1,665.52 - - 6.7% 6.6% - - - - - 33.57 - -PC rental 2Mbps local end copper £/le 371.27 - - 7.0% 6.8% - - 1.3% 1.2% 0.3% 7.68 - -PC rental 2Mbps local end fibre £/le 502.75 - - 9.7% 9.6% - - 28.3% 26.4% 16.7% 64.94 - -PC rentals 2Mbps regional trunk £/km 32.24 - - - - - - 1.6% 6.8% 10.6% - - -PC rental 2Mbps link per km national trunk £/km 15.59 - - - - - - 0.3% 1.4% 3.6% - - -Ofcom Administration Fee - Wholesale % £2m 0.33 0.33 0.1% 0.1% 2.26 2.26 0.2% 0.1% 0.1% 0.06 - -TISBO Excess Construction % £9m - - - - - - - - - - - -Revenue Receivables % £40m 1.86 1.86 0.6% 0.6% 12.64 12.64 0.9% 0.8% 0.5% 0.36 - -Rounding - - - 0.1% (0.01) (0.01) - 0.1% - (0.01) - -Fully Allocated Cost (£ or %) 18,281.06 18,281.06 100.0% 100.0% 14,712.60 14,712.60 100.0% 100.0% 100.0% 108.97 100.0% 100.0%
Volume (units) - 2 (ux) (ux) 1 4 (ux) (ux) (ux) 13,707 (ux) (ux)Fully Allocated Cost (£m) 0.0 0.0 0.7 3.4 0.0 0.1 1.4 6.8 0.5 1.5 0.0 0.1

Section 7 – Review of Business Connectivity Markets
Page 85
Low Bandwidth TISBO calculation of FAC based on component costs and usage factors (continued)For the year ended 31 March 2019
Aver
age
cost
per
uni
t (fr
om A
ppen
dix 1
.1)
Part
ial a
nd P
rivat
e Ci
rcui
ts 6
4Kbp
s Loc
al
Ends
Part
ial a
nd P
rivat
e Ci
rcui
ts 6
4Kbp
s Lin
ks
Part
ial a
nd P
rivat
e Ci
rcui
ts 6
4Kbp
s Te
rmin
atin
g se
gmen
ts
Part
ial a
nd P
rivat
e Ci
rcui
ts 2
Mbp
s Co
nnec
tions
Part
ial a
nd P
rivat
e Ci
rcui
ts 2
Mbp
s Loc
al E
nds
Part
ial a
nd P
rivat
e Ci
rcui
ts 2
Mbp
s Lin
ks
Part
ial a
nd P
rivat
e Ci
rcui
ts 2
Mbp
s Te
rmin
atin
g se
gmen
ts
Part
ial a
nd P
rivat
e Ci
rcui
ts O
ther
Internal External Internal External Internal External Internal External Internal External Internal External Internal External Internal ExternalFully Allocated Cost (£ or %) £ £ £ £ £ £ £ £ £ £ £ £ £ £ % % Components Unit (a) E side copper capital £/line 7.05 7.05 7.05 - - - - - - 1.52 1.66 - - - - 0.1% -E side copper current £/line 4.01 3.33 3.33 - - - - - - 0.03 0.03 - - - - 0.0% -D side copper capital £/line 36.11 36.11 36.11 - - - - - - 7.78 8.48 - - - - 0.6% -D side copper current £/line 11.00 9.13 9.13 - - - - - - 0.07 0.08 - - - - 0.0% -Local exchanges general frames equipment £/line 1.12 1.12 1.12 - - - - - - 0.24 0.26 - - - - 0.0% -Cumulo Rates Non NGA - Non Openreach % £14m 12.20 12.20 1.00 1.00 0.19 0.19 4.85 4.85 15.58 15.46 1.38 1.38 1.83 1.89 2.8% 2.0%PC rental 2Mbps link per km distribution £/km 69.25 - - - - - - - - - - - - 49.68 54.84 47.3% 10.1%Point of Handover electronics £/eq 10,956.39 - - - - - - - - - - - - - - - 79.2%PC rental 64Kbps link £/link 160.61 - - 160.61 160.61 - - - - - - - - - - - -PC rental 2Mbps link £/link 202.07 - - - - - - - - - - 199.93 199.93 - - 4.6% 1.1%PC rental 64Kbps link per km transmission £/km 7.31 - - - - 7.31 7.31 - - - - - - - - - -2Mbps and above PC link connection cct provision £/circuit 14,692.86 - - - - - - 14,692.86 14,692.86 - - - - - - - -64Kbps PC link connection cct provision £/circuit 55,447.25 - - - - - - - - - - - - - - - -PC rental 64Kbps link local end £/le 1,665.52 1,665.52 1,665.52 - - - - - - - - - - - - - -PC rental 2Mbps local end copper £/le 371.27 - - - - - - - - 48.52 52.93 - - - - 3.7% -PC rental 2Mbps local end fibre £/le 502.75 - - - - - - - - 437.05 431.08 - - - - 24.4% 3.9%PC rentals 2Mbps regional trunk £/km 32.24 - - - - - - - - - - - - 8.67 6.22 12.3% 3.2%PC rental 2Mbps link per km national trunk £/km 15.59 - - - - - - - - - - - - - - - -Ofcom Administration Fee - Wholesale % £2m 0.84 0.84 0.20 0.20 0.00 0.00 2.42 2.42 1.06 1.07 0.46 0.43 0.07 0.07 0.6% 0.1%TISBO Excess Construction % £9m - - - - - - - - - - - - - - - -Revenue Receivables % £40m 4.68 4.68 1.12 1.12 0.02 0.02 13.56 13.56 5.96 6.01 2.56 2.43 0.40 0.41 3.6% 0.5%Rounding (0.01) (0.01) 0.01 0.01 - - - - - 0.01 - 0.01 - - - (0.1)%Fully Allocated Cost (£ or %) 1,739.97 1,739.97 162.94 162.94 7.52 7.52 14,713.69 14,713.69 517.81 517.07 204.33 204.18 60.65 63.43 100.0% 100.0%
Volume (units) 9,952 1,625 28,650 4,988 561,120 140,180 251 111 31,258 11,690 14,938 9,566 267,064 194,256 (ux) (ux)Fully Allocated Cost (£m) 17.3 2.8 4.7 0.8 4.2 1.1 3.7 1.6 16.2 6.0 3.1 2.0 16.2 12.3 0.2 5.1
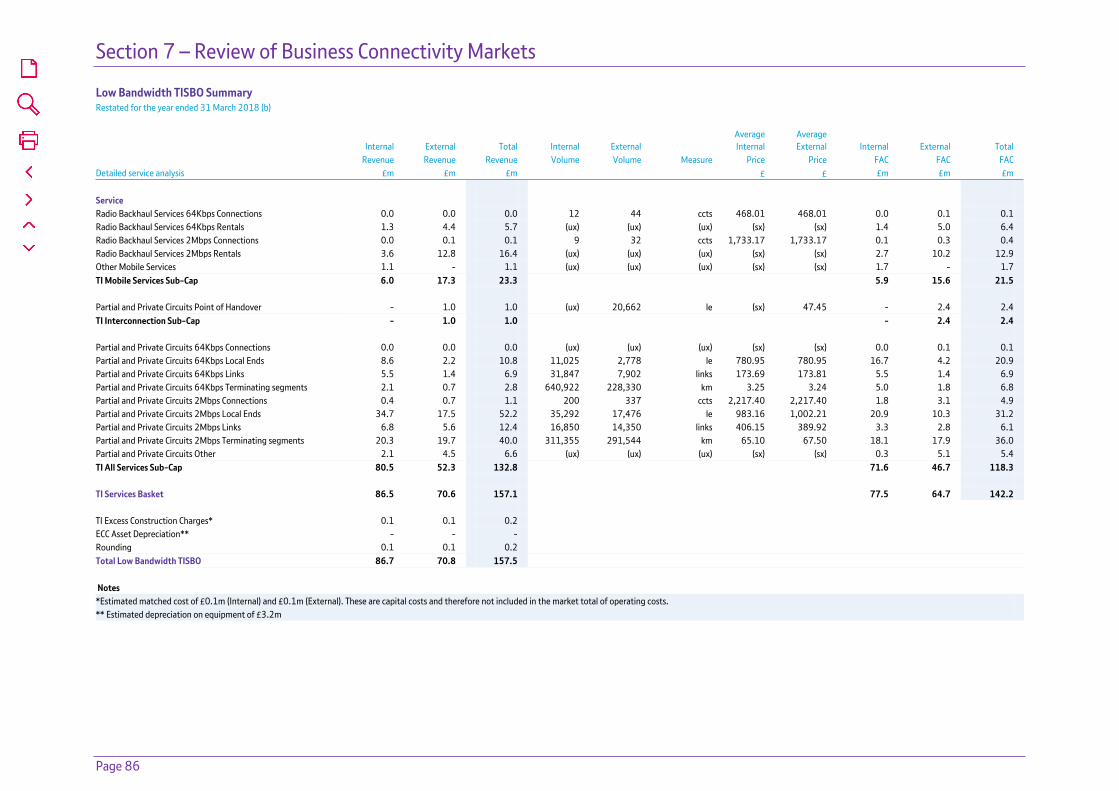
Section 7 – Review of Business Connectivity Markets
Page 86
Low Bandwidth TISBO Summary Restated for the year ended 31 March 2018 (b)
Internal External Total Internal External Average Internal
Average External Internal External Total
Revenue Revenue Revenue Volume Volume Measure Price Price FAC FAC FAC Detailed service analysis £m £m £m £ £ £m £m £m Service Radio Backhaul Services 64Kbps Connections 0.0 0.0 0.0 12 44 ccts 468.01 468.01 0.0 0.1 0.1 Radio Backhaul Services 64Kbps Rentals 1.3 4.4 5.7 (ux) (ux) (ux) (sx) (sx) 1.4 5.0 6.4 Radio Backhaul Services 2Mbps Connections 0.0 0.1 0.1 9 32 ccts 1,733.17 1,733.17 0.1 0.3 0.4 Radio Backhaul Services 2Mbps Rentals 3.6 12.8 16.4 (ux) (ux) (ux) (sx) (sx) 2.7 10.2 12.9 Other Mobile Services 1.1 - 1.1 (ux) (ux) (ux) (sx) (sx) 1.7 - 1.7 TI Mobile Services Sub-Cap 6.0 17.3 23.3 5.9 15.6 21.5 Partial and Private Circuits Point of Handover - 1.0 1.0 (ux) 20,662 le (sx) 47.45 - 2.4 2.4 TI Interconnection Sub-Cap - 1.0 1.0 - 2.4 2.4 Partial and Private Circuits 64Kbps Connections 0.0 0.0 0.0 (ux) (ux) (ux) (sx) (sx) 0.0 0.1 0.1 Partial and Private Circuits 64Kbps Local Ends 8.6 2.2 10.8 11,025 2,778 le 780.95 780.95 16.7 4.2 20.9 Partial and Private Circuits 64Kbps Links 5.5 1.4 6.9 31,847 7,902 links 173.69 173.81 5.5 1.4 6.9 Partial and Private Circuits 64Kbps Terminating segments 2.1 0.7 2.8 640,922 228,330 km 3.25 3.24 5.0 1.8 6.8 Partial and Private Circuits 2Mbps Connections 0.4 0.7 1.1 200 337 ccts 2,217.40 2,217.40 1.8 3.1 4.9 Partial and Private Circuits 2Mbps Local Ends 34.7 17.5 52.2 35,292 17,476 le 983.16 1,002.21 20.9 10.3 31.2 Partial and Private Circuits 2Mbps Links 6.8 5.6 12.4 16,850 14,350 links 406.15 389.92 3.3 2.8 6.1 Partial and Private Circuits 2Mbps Terminating segments 20.3 19.7 40.0 311,355 291,544 km 65.10 67.50 18.1 17.9 36.0 Partial and Private Circuits Other 2.1 4.5 6.6 (ux) (ux) (ux) (sx) (sx) 0.3 5.1 5.4 TI All Services Sub-Cap 80.5 52.3 132.8 71.6 46.7 118.3 TI Services Basket 86.5 70.6 157.1 77.5 64.7 142.2 TI Excess Construction Charges* 0.1 0.1 0.2 ECC Asset Depreciation** - - - Rounding 0.1 0.1 0.2 Total Low Bandwidth TISBO 86.7 70.8 157.5 Notes *Estimated matched cost of £0.1m (Internal) and £0.1m (External). These are capital costs and therefore not included in the market total of operating costs. ** Estimated depreciation on equipment of £3.2m
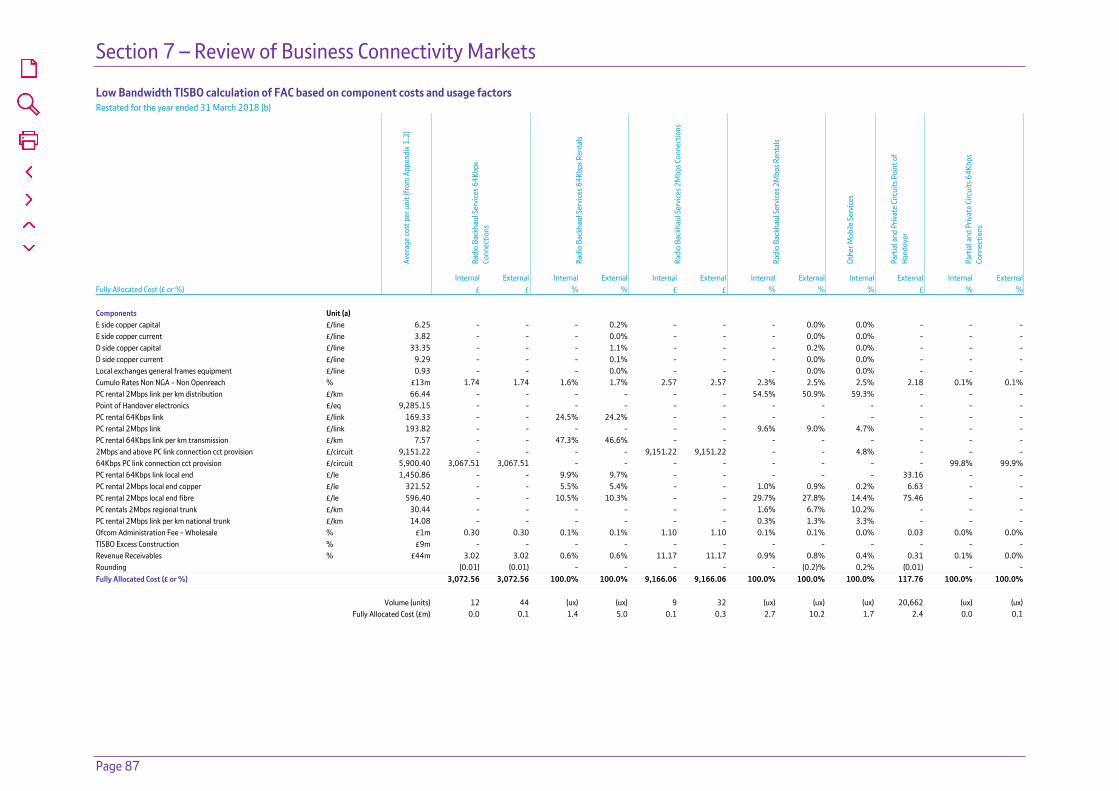
Section 7 – Review of Business Connectivity Markets
Page 87
Low Bandwidth TISBO calculation of FAC based on component costs and usage factorsRestated for the year ended 31 March 2018 (b)
Aver
age
cost
per
uni
t (fr
om A
ppen
dix 1
.2)
Radi
o Ba
ckha
ul S
ervi
ces 6
4Kbp
s Co
nnec
tions
Radi
o Ba
ckha
ul S
ervi
ces 6
4Kbp
s Ren
tals
Radi
o Ba
ckha
ul S
ervi
ces 2
Mbp
s Con
nect
ions
Radi
o Ba
ckha
ul S
ervi
ces 2
Mbp
s Ren
tals
Othe
r Mob
ile S
ervi
ces
Part
ial a
nd P
rivat
e Ci
rcui
ts P
oint
of
Hand
over
Part
ial a
nd P
rivat
e Ci
rcui
ts 6
4Kbp
s Co
nnec
tions
Internal External Internal External Internal External Internal External Internal External Internal ExternalFully Allocated Cost (£ or %) £ £ % % £ £ % % % £ % % Components Unit (a) E side copper capital £/line 6.25 - - - 0.2% - - - 0.0% 0.0% - - -E side copper current £/line 3.82 - - - 0.0% - - - 0.0% 0.0% - - -D side copper capital £/line 33.35 - - - 1.1% - - - 0.2% 0.0% - - -D side copper current £/line 9.29 - - - 0.1% - - - 0.0% 0.0% - - -Local exchanges general frames equipment £/line 0.93 - - - 0.0% - - - 0.0% 0.0% - - -Cumulo Rates Non NGA - Non Openreach % £13m 1.74 1.74 1.6% 1.7% 2.57 2.57 2.3% 2.5% 2.5% 2.18 0.1% 0.1%PC rental 2Mbps link per km distribution £/km 66.44 - - - - - - 54.5% 50.9% 59.3% - - -Point of Handover electronics £/eq 9,285.15 - - - - - - - - - - - -PC rental 64Kbps link £/link 169.33 - - 24.5% 24.2% - - - - - - - -PC rental 2Mbps link £/link 193.82 - - - - - - 9.6% 9.0% 4.7% - - -PC rental 64Kbps link per km transmission £/km 7.57 - - 47.3% 46.6% - - - - - - - -2Mbps and above PC link connection cct provision £/circuit 9,151.22 - - - - 9,151.22 9,151.22 - - 4.8% - - -64Kbps PC link connection cct provision £/circuit 5,900.40 3,067.51 3,067.51 - - - - - - - - 99.8% 99.9%PC rental 64Kbps link local end £/le 1,450.86 - - 9.9% 9.7% - - - - - 33.16 - -PC rental 2Mbps local end copper £/le 321.52 - - 5.5% 5.4% - - 1.0% 0.9% 0.2% 6.63 - -PC rental 2Mbps local end fibre £/le 596.40 - - 10.5% 10.3% - - 29.7% 27.8% 14.4% 75.46 - -PC rentals 2Mbps regional trunk £/km 30.44 - - - - - - 1.6% 6.7% 10.2% - - -PC rental 2Mbps link per km national trunk £/km 14.08 - - - - - - 0.3% 1.3% 3.3% - - -Ofcom Administration Fee - Wholesale % £1m 0.30 0.30 0.1% 0.1% 1.10 1.10 0.1% 0.1% 0.0% 0.03 0.0% 0.0%TISBO Excess Construction % £9m - - - - - - - - - - - -Revenue Receivables % £44m 3.02 3.02 0.6% 0.6% 11.17 11.17 0.9% 0.8% 0.4% 0.31 0.1% 0.0%Rounding (0.01) (0.01) - - - - - (0.2)% 0.2% (0.01) - -Fully Allocated Cost (£ or %) 3,072.56 3,072.56 100.0% 100.0% 9,166.06 9,166.06 100.0% 100.0% 100.0% 117.76 100.0% 100.0%
Volume (units) 12 44 (ux) (ux) 9 32 (ux) (ux) (ux) 20,662 (ux) (ux)Fully Allocated Cost (£m) 0.0 0.1 1.4 5.0 0.1 0.3 2.7 10.2 1.7 2.4 0.0 0.1

Section 7 – Review of Business Connectivity Markets
Page 88
Low Bandwidth TISBO calculation of FAC based on component costs and usage factors (continued)Restated for the year ended 31 March 2018 (b)
Aver
age
cost
per
uni
t (fr
om A
ppen
dix 1
.2)
Part
ial a
nd P
rivat
e Ci
rcui
ts 6
4Kbp
s Loc
al
Ends
Part
ial a
nd P
rivat
e Ci
rcui
ts 6
4Kbp
s Lin
ks
Part
ial a
nd P
rivat
e Ci
rcui
ts 6
4Kbp
s Te
rmin
atin
g se
gmen
ts
Part
ial a
nd P
rivat
e Ci
rcui
ts 2
Mbp
s Co
nnec
tions
Part
ial a
nd P
rivat
e Ci
rcui
ts 2
Mbp
s Loc
al E
nds
Part
ial a
nd P
rivat
e Ci
rcui
ts 2
Mbp
s Lin
ks
Part
ial a
nd P
rivat
e Ci
rcui
ts 2
Mbp
s Te
rmin
atin
g se
gmen
ts
Part
ial a
nd P
rivat
e Ci
rcui
ts O
ther
Internal External Internal External Internal External Internal External Internal External Internal External Internal External Internal ExternalFully Allocated Cost (£ or %) £ £ £ £ £ £ £ £ £ £ £ £ £ £ % % Components Unit (a) E side copper capital £/line 6.25 6.25 6.25 - - - - - - 1.34 1.48 - - - - 0.1% -E side copper current £/line 3.82 3.17 3.17 - - - - - - 0.02 0.03 - - - - 0.0% -D side copper capital £/line 33.35 33.35 27.68 - - - - - - 7.12 7.88 - - - - 0.5% -D side copper current £/line 9.29 7.71 7.71 - - - - - - 0.06 0.07 - - - - 0.0% -Local exchanges general frames equipment £/line 0.93 0.93 0.93 - - - - - - 0.20 0.22 - - - - 0.0% -Cumulo Rates Non NGA - Non Openreach % £13m 9.63 9.15 0.77 0.77 0.18 0.18 2.57 2.57 14.68 14.54 0.70 0.70 1.59 1.64 2.4% 1.8%PC rental 2Mbps link per km distribution £/km 66.44 - - - - - - - - - - - - 47.79 53.94 45.1% 10.8%Point of Handover electronics £/eq 9,285.15 - - - - - - - - - - - - - - - 77.6%PC rental 64Kbps link £/link 169.33 - - 169.33 169.33 - - - - - - - - - - - -PC rental 2Mbps link £/link 193.82 - - - - - - - - - - 192.05 192.05 - - 4.5% 1.2%PC rental 64Kbps link per km transmission £/km 7.57 - - - - 7.57 7.57 - - - - - - - - - -2Mbps and above PC link connection cct provision £/circuit 9,151.22 - - - - - - 9,151.22 9,151.22 - - - - - - - -64Kbps PC link connection cct provision £/circuit 5,900.40 - - - - - - - - - - - - - - - -PC rental 64Kbps link local end £/le 1,450.86 1,450.86 1,450.86 - - - - - - - - - - - - - -PC rental 2Mbps local end copper £/le 321.52 - - - - - - - - 41.67 46.11 - - - - 3.1% -PC rental 2Mbps local end fibre £/le 596.40 - - - - - - - - 519.10 510.87 - - - - 27.5% 4.7%PC rentals 2Mbps regional trunk £/km 30.44 - - - - - - - - - - - - 8.20 5.34 11.0% 3.3%PC rental 2Mbps link per km national trunk £/km 14.08 - - - - - - - - - - - - - - - -Ofcom Administration Fee - Wholesale % £1m 0.50 0.50 0.11 0.11 0.00 0.00 1.41 1.41 0.63 0.64 0.26 0.25 0.04 0.04 0.5% 0.1%TISBO Excess Construction % £9m - - - - - - - - - - - - - - - -Revenue Receivables % £44m 5.03 5.03 1.12 1.12 0.02 0.02 14.29 14.29 6.34 6.46 2.62 2.51 0.42 0.43 5.2% 0.6%Rounding 0.01 0.01 - - - - - - - (0.01) (0.01) - 0.01 0.01 0.1% (0.1)%Fully Allocated Cost (£ or %) 1,517.44 1,511.29 171.33 171.33 7.77 7.77 9,169.49 9,169.49 591.16 588.29 195.62 195.51 58.05 61.40 100.0% 100.0%
Volume (units) 11,025 2,778 31,847 7,902 640,922 228,330 200 337 35,292 17,476 16,850 14,350 311,355 291,544 (ux) (ux)Fully Allocated Cost (£m) 16.7 4.2 5.5 1.4 5.0 1.8 1.8 3.1 20.9 10.3 3.3 2.8 18.1 17.9 0.3 5.1

Section 8 – Review of Narrowband Markets
Page 89
Section 8Review of Narrowband Markets

Section 8 – Review of Narrowband Markets
Page 90
WFAEL Summary For the year ended 31 March 2019
Internal External Total Internal External Average Internal
Average External Internal External Total
Revenue Revenue Revenue Volume Volume Measure Price Price FAC FAC FAC Detailed service analysis £m £m £m £ £ £m £m £m Service Analogue WLR Basic Rentals 974.3 193.1 1,167.4 10,748,653 2,130,085 lines 90.64 90.66 972.4 192.8 1,165.2 WLR Connections 15.7 6.2 21.9 466,568 179,740 conns 33.63 34.41 13.1 4.6 17.7 WLR Transfers 15.8 4.8 20.6 1,355,542 408,764 transfer 11.68 11.80 7.3 2.1 9.4 WLR Conversions 9.6 4.2 13.8 339,704 151,726 conns 28.17 27.84 10.1 4.5 14.6 Analogue Premium Rentals 116.0 135.8 251.8 1,017,577 1,191,430 lines 114.00 114.00 95.5 111.9 207.4 WLR Premium Connections 1.2 2.3 3.5 41,497 76,356 conns 29.34 30.15 1.0 1.9 2.9 WLR Premium Transfers 0.4 0.7 1.1 29,537 59,549 transfer 11.87 11.10 0.2 0.5 0.7 Caller Display 3.2 0.8 4.0 3,693,650 881,867 rentals 0.87 0.88 1.8 0.4 2.2 Time Related Charges 25.7 7.6 33.3 (ux) (ux) (ux) (sx) (sx) 30.7 9.1 39.8 Other WLR 91.6 18.3 109.9 (ux) (ux) (ux) (sx) (sx) 48.6 5.0 53.6 WFAEL SLG (10.3 ) (3.2 ) (13.5 ) (ux) (ux) (ux) (sx) (sx) (10.3 ) (3.2 ) (13.5 )Rounding - - - 0.1 (0.1 ) - Total WFAEL 1,243.2 370.6 1,613.8 1,170.5 329.5 1,500.0

Section 8 – Review of Narrowband Markets
Page 91
WFAEL calculation of FAC based on component costs and usage factorsFor the year ended 31 March 2019
Aver
age
cost
per
un
it (fr
om
Appe
ndix
1.1
)
Anal
ogue
WLR
Ba
sic R
enta
ls
WLR
Con
nect
ions
WLR
Tra
nsfe
rs
WLR
Con
vers
ions
Anal
ogue
Pre
miu
m
Rent
als
WLR
Pre
miu
m
Conn
ectio
ns
WLR
Pre
miu
m
Tran
sfer
s
Calle
r Disp
lay
Tim
e Re
late
d Ch
arge
s
Othe
r WLR
Internal External Internal External Internal External Internal External Internal External Internal External Internal External Internal External Internal External Internal ExternalFully Allocated Cost (£ or %) £ £ £ £ £ £ £ £ £ £ £ £ £ £ £ £ % % % % Components Unit (a) Wholesale Access specific £/trans - - - - - - - - - - - - - - - - - - - - -Routing & Records £/line 3.02 - - 3.02 3.02 - - 3.02 3.02 - - 3.02 3.02 3.02 3.02 - - - - 1.3% 1.4%MDF Hardware jumpering £/line 16.13 - - 19.44 17.30 - - 21.25 21.25 - - 16.13 16.13 - - - - - - 8.8% 9.7%E side copper capital £/line 7.05 7.05 7.05 - - - - - - 7.05 7.05 - - - - - - - - - -E side copper current £/line 4.01 3.33 3.33 - - - - - - 4.03 4.03 - - - - - - - - 13.6% 7.1%D side copper capital £/line 36.11 36.11 36.11 - - - - - - 36.11 36.11 - - - - - - - - - -D side copper current £/line 11.00 9.13 9.13 - - - - - - 11.05 11.05 - - - - - - - - 37.4% 19.4%Local exchanges general frames equipment £/line 1.12 1.12 1.12 - - - - - - 1.12 1.12 - - - - - - - - - -Local exchanges general frames maintenance £/line 1.27 1.06 1.06 - - - - - - 1.28 1.28 - - - - - - - - 4.3% 2.2%Analogue line test equipment £/line 0.12 0.12 0.12 - - - - - - 0.12 0.12 - - - - - - - - - -Dropwire capital & analogue NTE £/line 17.41 17.41 17.41 - - - - - - 17.41 17.41 - - - - - - - - - -Analogue line drop maintenance £/line 2.22 1.84 1.84 - - - - - - 2.23 2.23 - - - - - - - - 7.5% 3.9%Abortive Visits £/trans 50.19 - - - - - - - - - - - - - - - - - - 7.7% 36.8%Analogue line cards £/line 7.76 7.76 7.76 - - - - - - 7.76 7.76 - - - - - - - - - -Pair gain £/line 0.00 0.00 0.00 - - - - - - 0.00 0.00 - - - - - - - - - -Combi Card and MSAN Access - Voice £/line 0.00 0.00 0.00 - - - - - - 0.00 0.00 - - - - - - - - - -Expedite Provision Costs £/line 98.64 - - - - - - - - - - - - - - - - - - 2.7% 3.1%SLG WLR Provision Internal % £7m - - 2.97 - 2.97 - 2.97 - - - 2.97 - 2.97 - - - - - 1.3% -SLG WLR Assurance Internal % £3m 0.27 - - - - - - - 0.27 - - - - - - - - - - -Cumulo Rates Non NGA - Openreach % £135m 3.86 3.86 0.00 0.00 0.00 0.00 0.00 0.00 3.86 3.86 0.00 0.00 0.00 0.00 0.00 0.00 0.0% 0.0% 0.0% 0.0%Local Loop Unbundling systems development % £1m - - 0.02 0.01 - - 0.04 0.04 - - - - - - - - - - 0.0% 0.0%iNode features % £1m - - - - - - - - - - - - - - - - - - 1.8% 1.4%Openreach time related charges % £74m - - - - - - - - - - - - - - - - 99.3% 99.3% - -OR Project Services % £7m - - - - - - - - - - - - - - - - - - 0.6% 1.7%Caller Display % £2m - - - - - - - - - - - - - - 0.48 0.48 - - - -Network Features % £5m - - - - - - - - - - - - - - - - - - 10.3% 7.6%Ofcom Administration Fee - Openreach % £4m 0.08 0.08 0.03 0.03 0.01 0.01 0.02 0.02 0.10 0.10 0.03 0.03 0.01 0.01 0.00 0.00 0.1% 0.1% 0.2% 0.3%Openreach sales product management % £15m 0.03 0.03 0.01 0.01 0.00 0.00 0.01 0.01 0.04 0.04 0.01 0.01 0.00 0.00 0.00 0.00 0.2% 0.2% 0.3% 0.7%OR Service Centre - Provision Analogue/ISDN2 % £8m - - 2.34 2.34 2.34 2.34 2.34 2.34 - - 2.34 2.34 2.34 2.34 - - - - 1.0% 1.1%OR Service Centre - Assurance Analogue/ISDN2 % £12m 0.75 0.75 - - - - - - 0.75 0.75 - - - - - - - - - -SLG WLR Provision External % £3m - - - 2.83 - 2.83 - 2.83 - - - 2.83 - 2.83 - - - - - 1.3%SLG WLR Assurance External % £1m - 0.29 - - - - - - - 0.29 - - - - - - - - - -Revenue Receivables % £40m 0.55 0.55 0.18 0.18 0.06 0.06 0.15 0.15 0.70 0.70 0.16 0.16 0.06 0.06 0.01 0.01 0.4% 0.4% 1.1% 2.2%Rounding - - 0.01 0.01 0.01 0.01 0.01 - (0.02) (0.01) - - 0.02 - - - - - 0.1% 0.1%Fully Allocated Cost (£ or %) 90.47 90.49 28.02 25.73 5.39 5.25 29.81 29.66 93.86 93.89 24.66 24.52 8.42 8.26 0.49 0.49 100.0% 100.0% 100.0% 100.0%
Volume (units) 10,748,653 2,130,085 466,568 179,740 1,355,542 408,764 339,704 151,726 1,017,577 1,191,430 41,497 76,356 29,537 59,549 3,693,650 881,867 (ux) (ux) (ux) (ux)Fully Allocated Cost (£m) 972.4 192.8 13.1 4.6 7.3 2.1 10.1 4.5 95.5 111.9 1.0 1.9 0.2 0.5 1.8 0.4 30.7 9.1 48.6 5.0

Section 8 – Review of Narrowband Markets
Page 92
WFAEL Summary Restated for the year ended 31 March 2018 (b)
Internal External Total Internal External Average Internal
Average External Internal External Total
Revenue Revenue Revenue Volume Volume Measure Price Price FAC FAC FAC Detailed service analysis £m £m £m £ £ £m £m £m Service Analogue WLR Basic Rentals 921.1 177.3 1,098.4 10,621,116 2,044,791 lines 86.72 86.72 881.7 169.8 1,051.5 WLR Connections 16.6 7.2 23.8 426,271 170,829 conns 38.91 42.37 11.8 4.4 16.2 WLR Transfers 12.5 4.0 16.5 1,417,581 432,217 transfer 8.80 9.26 11.7 3.6 15.3 WLR Conversions 12.5 2.0 14.5 412,458 67,043 conns 30.26 30.26 11.7 1.9 13.6 Analogue Premium Rentals 183.6 147.1 330.7 1,610,435 1,290,038 lines 114.00 114.00 138.6 111.1 249.7 WLR Premium Connections 2.3 3.4 5.7 60,922 88,091 conns 38.41 38.41 1.5 2.2 3.7 WLR Premium Transfers 0.4 0.6 1.0 36,959 72,226 transfer 10.80 8.53 0.4 0.8 1.2 Caller Display 1.7 0.3 2.0 3,733,972 636,835 rentals 0.45 0.45 1.9 0.3 2.2 Time Related Charges 33.5 10.0 43.5 (ux) (ux) (ux) (sx) (sx) 30.2 9.0 39.2 Other WLR 95.1 17.8 112.9 (ux) (ux) (ux) (sx) (sx) 52.4 4.9 57.3 Rounding (0.1 ) - (0.1 ) 0.1 - 0.1 Total WFAEL 1,279.2 369.7 1,648.9 1,142.0 308.0 1,450.0

Section 8 – Review of Narrowband Markets
Page 93
WFAEL calculation of FAC based on component costs and usage factorsRestated for the year ended 31 March 2018 (b)
Aver
age
cost
per
un
it (fr
om
Appe
ndix
1.2
)
Anal
ogue
WLR
Ba
sic R
enta
ls
WLR
Con
nect
ions
WLR
Tra
nsfe
rs
WLR
Con
vers
ions
Anal
ogue
Pre
miu
m
Rent
als
WLR
Pre
miu
m
Conn
ectio
ns
WLR
Pre
miu
m
Tran
sfer
s
Calle
r Disp
lay
Tim
e Re
late
d Ch
arge
s
Othe
r WLR
Internal External Internal External Internal External Internal External Internal External Internal External Internal External Internal External Internal External Internal ExternalFully Allocated Cost (£ or %) £ £ £ £ £ £ £ £ £ £ £ £ £ £ £ £ % % % % Components Unit (a) Wholesale Access specific £/trans 0.21 - - 0.04 0.17 0.21 0.21 - - - - 0.21 0.21 0.21 0.21 - - - - 0.1% 0.2%Routing & Records £/line 2.54 - - 2.54 2.54 - - 2.54 2.54 - - 2.54 2.54 2.54 2.54 - - - - 1.7% 1.9%MDF Hardware jumpering £/line 13.45 - - 16.84 14.36 - - 17.72 17.72 - - 13.45 13.45 - - - - - - 12.1% 13.5%E side copper capital £/line 6.25 6.25 6.25 - - - - - - 6.25 6.25 - - - - - - - - - -E side copper current £/line 3.82 3.17 3.17 - - - - - - 3.83 3.83 - - - - - - - - 13.0% 5.5%D side copper capital £/line 33.35 33.35 33.35 - - - - - - 33.35 33.35 - - - - - - - - - -D side copper current £/line 9.29 7.71 7.71 - - - - - - 9.33 9.33 - - - - - - - - 31.7% 13.4%Local exchanges general frames equipment £/line 0.93 0.93 0.93 - - - - - - 0.93 0.93 - - - - - - - - - -Local exchanges general frames maintenance £/line 1.27 1.05 1.05 - - - - - - 1.27 1.27 - - - - - - - - 4.3% 1.8%Analogue line test equipment £/line 0.09 0.09 0.09 - - - - - - 0.09 0.09 - - - - - - - - - -Dropwire capital & analogue NTE £/line 16.23 16.23 16.23 - - - - - - 16.23 16.23 - - - - - - - - - -Analogue line drop maintenance £/line 1.95 1.61 1.61 - - - - - - 1.95 1.95 - - - - - - - - 6.6% 2.8%Abortive Visits £/trans 49.71 - - - - - - - - - - - - - - - - - - 5.6% 32.4%Analogue line cards £/line 7.66 7.66 7.66 - - - - - - 7.66 7.66 - - - - - - - - - -Pair gain £/line 0.00 0.00 0.00 - - - - - - 0.00 0.00 - - - - - - - - - -Combi Card and MSAN Access - Voice £/line 0.00 0.00 0.00 - - - - - - 0.00 0.00 - - - - - - - - - -Expedite Provision Costs £/line 86.37 - - - - - - - - - - - - - - - - - - 2.9% 2.6%SLG WLR Provision Internal % £7m - - 2.53 - 2.53 - 2.53 - - - 2.53 - 2.53 - - - - - 1.7% -SLG WLR Assurance Internal % £4m 0.34 - - - - - - - 0.34 - - - - - - - - - - -Cumulo Rates Non NGA - Openreach % £118m 3.38 3.38 0.00 0.00 0.00 0.00 0.00 0.00 3.38 3.38 0.00 0.00 0.00 0.00 0.00 0.00 0.0% 0.0% 0.0% 0.0%Local Loop Unbundling systems development % £1m - - 0.02 0.01 - - 0.02 0.02 - - - - - - - - - - 0.0% 0.0%iNode features % £1m - - - - - - - - - - - - - - - - - - 2.0% 1.7%Regulated time related charges % £65m - - - - - - - - - - - - - - - - 98.8% 98.8% - -OR Project Services % £14m - - - - - - - - - - - - - - - - - - 2.3% 5.5%Caller Display % £2m - - - - - - - - - - - - - - 0.50 0.50 - - - -Network Features % £6m - - - - - - - - - - - - - - - - - - 10.3% 8.7%Ofcom Administration Fee - Openreach % £4m 0.06 0.06 0.03 0.03 0.01 0.01 0.02 0.02 0.08 0.08 0.03 0.03 0.01 0.01 0.00 0.00 0.1% 0.1% 0.1% 0.2%Openreach sales product management % £16m 0.07 0.07 0.03 0.03 0.01 0.01 0.02 0.02 0.09 0.09 0.03 0.03 0.01 0.01 0.00 0.00 0.5% 0.5% 0.8% 1.3%OR Service Centre - Provision Analogue/ISDN2 % £20m - - 5.44 5.44 5.44 5.44 5.44 5.44 - - 5.44 5.44 5.44 5.44 - - - - 3.6% 4.0%OR Service Centre - Assurance Analogue/ISDN2 % £9m 0.54 0.54 - - - - - - 0.54 0.54 - - - - - - - - - -SLG WLR Provision External % £3m - - - 2.68 - 2.68 - 2.68 - - - 2.68 - 2.68 - - - - - 2.0%SLG WLR Assurance External % £2m - 0.37 - - - - - - - 0.37 - - - - - - - - - -Revenue Receivables % £44m 0.56 0.56 0.23 0.25 0.05 0.05 0.18 0.18 0.73 0.73 0.22 0.22 0.06 0.05 0.00 0.00 0.6% 0.6% 1.2% 2.3%Rounding 0.02 0.02 (0.01) (0.01) - - - 0.01 0.03 0.03 - - - (0.01) 0.01 0.01 - - - 0.2%Fully Allocated Cost (£ or %) 83.02 83.05 27.69 25.50 8.25 8.40 28.47 28.63 86.08 86.11 24.45 24.60 10.80 10.93 0.51 0.51 100.0% 100.0% 100.0% 100.0%
Volume (units) 10,621,116 2,044,791 426,271 170,829 1,417,581 432,217 412,458 67,043 1,610,435 1,290,038 60,922 88,091 36,959 72,226 3,733,972 636,835 (ux) (ux) (ux) (ux)Fully Allocated Cost (£m) 881.7 169.8 11.8 4.4 11.7 3.6 11.7 1.9 138.6 111.1 1.5 2.2 0.4 0.8 1.9 0.3 30.2 9.0 52.4 4.9
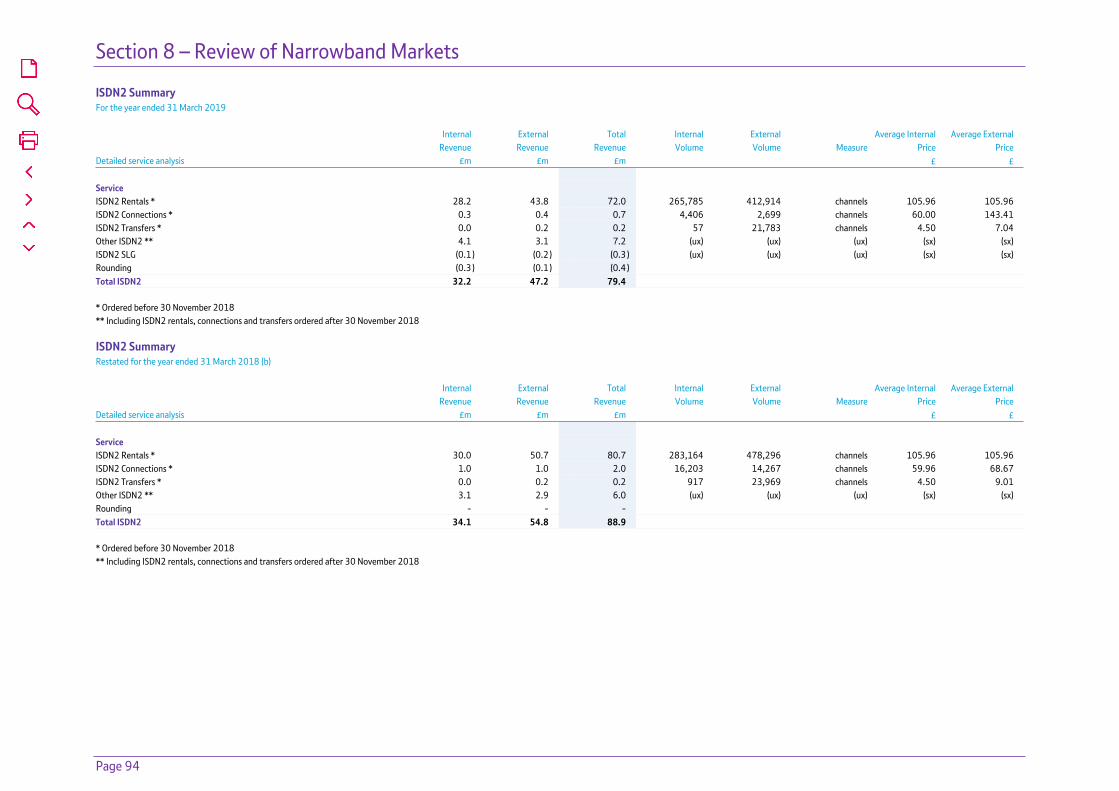
Section 8 – Review of Narrowband Markets
Page 94
ISDN2 Summary For the year ended 31 March 2019 Internal External Total Internal External Average Internal Average External Revenue Revenue Revenue Volume Volume Measure Price Price Detailed service analysis £m £m £m £ £ Service ISDN2 Rentals * 28.2 43.8 72.0 265,785 412,914 channels 105.96 105.96 ISDN2 Connections * 0.3 0.4 0.7 4,406 2,699 channels 60.00 143.41 ISDN2 Transfers * 0.0 0.2 0.2 57 21,783 channels 4.50 7.04 Other ISDN2 ** 4.1 3.1 7.2 (ux) (ux) (ux) (sx) (sx) ISDN2 SLG (0.1 ) (0.2 ) (0.3 ) (ux) (ux) (ux) (sx) (sx) Rounding (0.3 ) (0.1 ) (0.4 ) Total ISDN2 32.2 47.2 79.4 * Ordered before 30 November 2018 ** Including ISDN2 rentals, connections and transfers ordered after 30 November 2018
ISDN2 Summary Restated for the year ended 31 March 2018 (b) Internal External Total Internal External Average Internal Average External Revenue Revenue Revenue Volume Volume Measure Price Price Detailed service analysis £m £m £m £ £ Service ISDN2 Rentals * 30.0 50.7 80.7 283,164 478,296 channels 105.96 105.96 ISDN2 Connections * 1.0 1.0 2.0 16,203 14,267 channels 59.96 68.67 ISDN2 Transfers * 0.0 0.2 0.2 917 23,969 channels 4.50 9.01 Other ISDN2 ** 3.1 2.9 6.0 (ux) (ux) (ux) (sx) (sx) Rounding - - - Total ISDN2 34.1 54.8 88.9 * Ordered before 30 November 2018 ** Including ISDN2 rentals, connections and transfers ordered after 30 November 2018
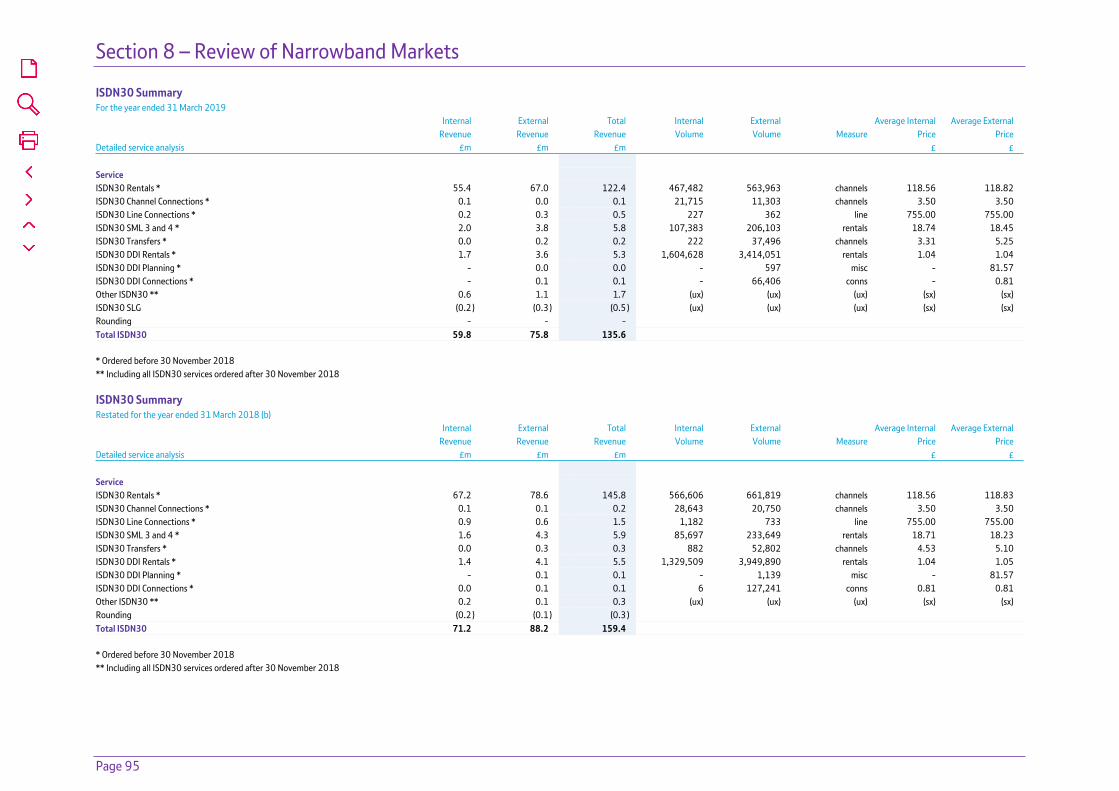
Section 8 – Review of Narrowband Markets
Page 95
ISDN30 Summary For the year ended 31 March 2019
Internal External Total Internal External Average Internal Average External Revenue Revenue Revenue Volume Volume Measure Price Price
Detailed service analysis £m £m £m £ £ Service ISDN30 Rentals * 55.4 67.0 122.4 467,482 563,963 channels 118.56 118.82 ISDN30 Channel Connections * 0.1 0.0 0.1 21,715 11,303 channels 3.50 3.50 ISDN30 Line Connections * 0.2 0.3 0.5 227 362 line 755.00 755.00 ISDN30 SML 3 and 4 * 2.0 3.8 5.8 107,383 206,103 rentals 18.74 18.45 ISDN30 Transfers * 0.0 0.2 0.2 222 37,496 channels 3.31 5.25 ISDN30 DDI Rentals * 1.7 3.6 5.3 1,604,628 3,414,051 rentals 1.04 1.04 ISDN30 DDI Planning * - 0.0 0.0 - 597 misc - 81.57 ISDN30 DDI Connections * - 0.1 0.1 - 66,406 conns - 0.81 Other ISDN30 ** 0.6 1.1 1.7 (ux) (ux) (ux) (sx) (sx) ISDN30 SLG (0.2 ) (0.3 ) (0.5 ) (ux) (ux) (ux) (sx) (sx) Rounding - - - Total ISDN30 59.8 75.8 135.6 * Ordered before 30 November 2018 ** Including all ISDN30 services ordered after 30 November 2018
ISDN30 Summary Restated for the year ended 31 March 2018 (b)
Internal External Total Internal External Average Internal Average External Revenue Revenue Revenue Volume Volume Measure Price Price
Detailed service analysis £m £m £m £ £ Service ISDN30 Rentals * 67.2 78.6 145.8 566,606 661,819 channels 118.56 118.83 ISDN30 Channel Connections * 0.1 0.1 0.2 28,643 20,750 channels 3.50 3.50 ISDN30 Line Connections * 0.9 0.6 1.5 1,182 733 line 755.00 755.00 ISDN30 SML 3 and 4 * 1.6 4.3 5.9 85,697 233,649 rentals 18.71 18.23 ISDN30 Transfers * 0.0 0.3 0.3 882 52,802 channels 4.53 5.10 ISDN30 DDI Rentals * 1.4 4.1 5.5 1,329,509 3,949,890 rentals 1.04 1.05 ISDN30 DDI Planning * - 0.1 0.1 - 1,139 misc - 81.57 ISDN30 DDI Connections * 0.0 0.1 0.1 6 127,241 conns 0.81 0.81 Other ISDN30 ** 0.2 0.1 0.3 (ux) (ux) (ux) (sx) (sx) Rounding (0.2 ) (0.1 ) (0.3 ) Total ISDN30 71.2 88.2 159.4 * Ordered before 30 November 2018 ** Including all ISDN30 services ordered after 30 November 2018
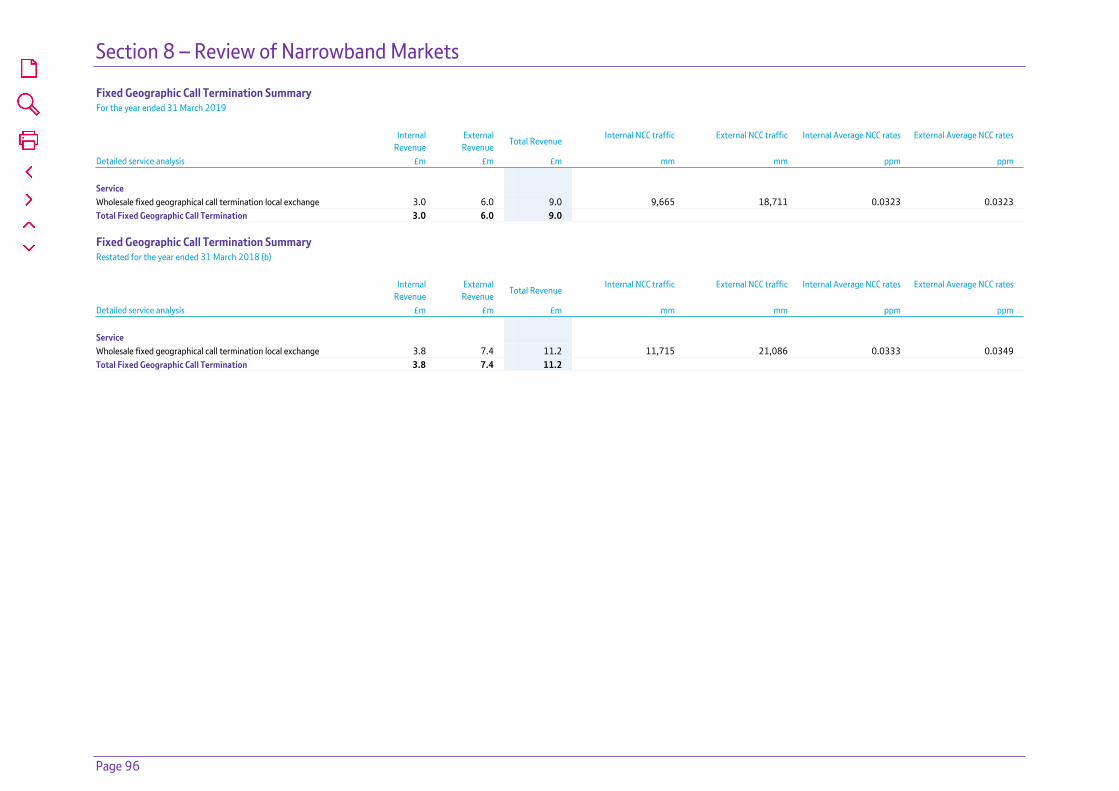
Section 8 – Review of Narrowband Markets
Page 96
Fixed Geographic Call Termination Summary For the year ended 31 March 2019
Internal
Revenue
External Revenue
Total Revenue Internal NCC traffic External NCC traffic Internal Average NCC rates External Average NCC rates
Detailed service analysis £m £m £m mm mm ppm ppm Service Wholesale fixed geographical call termination local exchange 3.0 6.0 9.0 9,665 18,711 0.0323 0.0323 Total Fixed Geographic Call Termination 3.0 6.0 9.0
Fixed Geographic Call Termination Summary Restated for the year ended 31 March 2018 (b)
Internal
Revenue
External Revenue
Total Revenue Internal NCC traffic External NCC traffic Internal Average NCC rates External Average NCC rates
Detailed service analysis £m £m £m mm mm ppm ppm Service Wholesale fixed geographical call termination local exchange 3.8 7.4 11.2 11,715 21,086 0.0333 0.0349 Total Fixed Geographic Call Termination 3.8 7.4 11.2
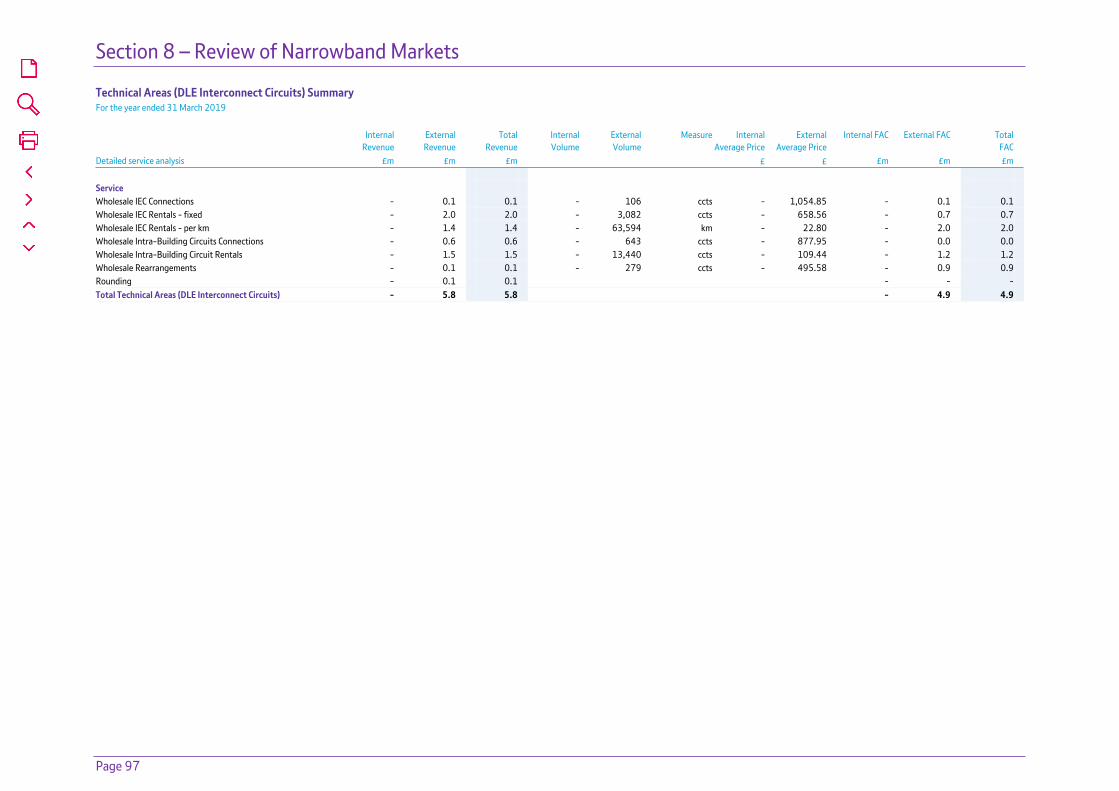
Section 8 – Review of Narrowband Markets
Page 97
Technical Areas (DLE Interconnect Circuits) Summary For the year ended 31 March 2019 Internal
Revenue External
Revenue Total
Revenue Internal
Volume External
Volume Measure Internal
Average Price External
Average Price Internal FAC External FAC Total
FAC
Detailed service analysis £m £m £m £ £ £m £m £m Service Wholesale IEC Connections - 0.1 0.1 - 106 ccts - 1,054.85 - 0.1 0.1 Wholesale IEC Rentals - fixed - 2.0 2.0 - 3,082 ccts - 658.56 - 0.7 0.7 Wholesale IEC Rentals - per km - 1.4 1.4 - 63,594 km - 22.80 - 2.0 2.0 Wholesale Intra-Building Circuits Connections - 0.6 0.6 - 643 ccts - 877.95 - 0.0 0.0 Wholesale Intra-Building Circuit Rentals - 1.5 1.5 - 13,440 ccts - 109.44 - 1.2 1.2 Wholesale Rearrangements - 0.1 0.1 - 279 ccts - 495.58 - 0.9 0.9 Rounding - 0.1 0.1 - - - Total Technical Areas (DLE Interconnect Circuits) - 5.8 5.8 - 4.9 4.9
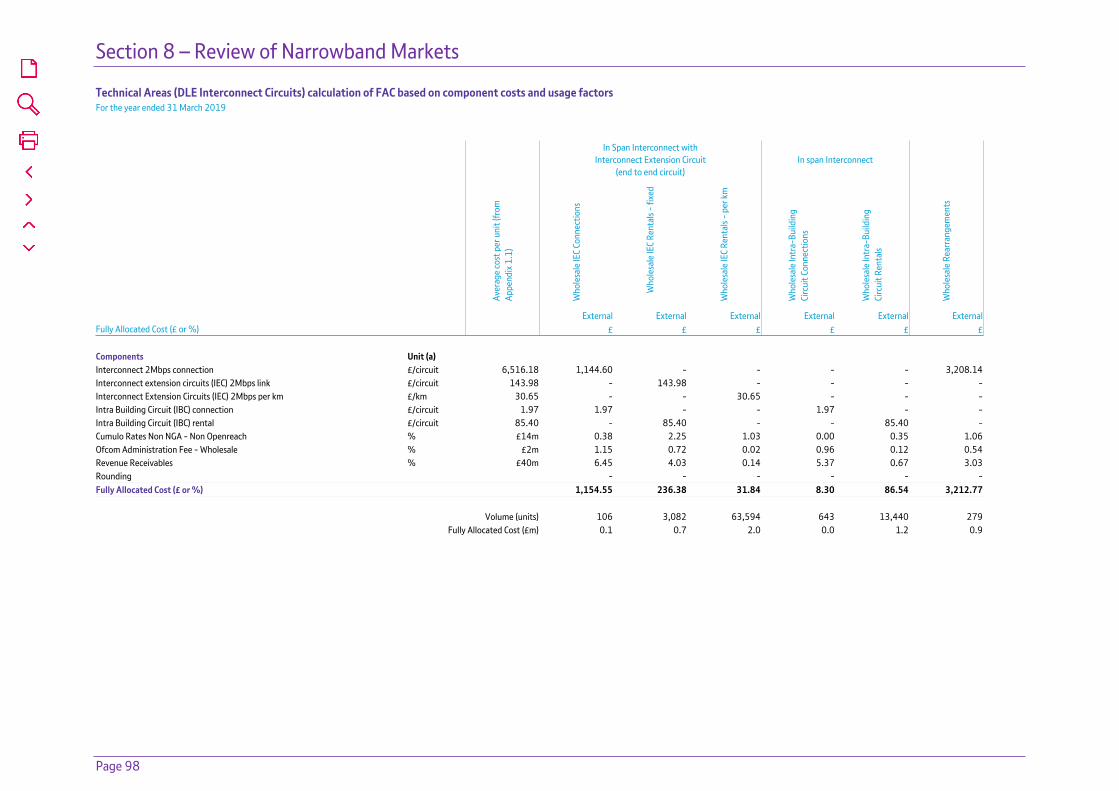
Section 8 – Review of Narrowband Markets
Page 98
Technical Areas (DLE Interconnect Circuits) calculation of FAC based on component costs and usage factors For the year ended 31 March 2019
In Span Interconnect withInterconnect Extension Circuit
(end to end circuit)In span Interconnect
Aver
age
cost
per
uni
t (fr
om
Appe
ndix
1.1
)
Who
lesa
le IE
C Co
nnec
tions
Who
lesa
le IE
C Re
ntal
s - fi
xed
Who
lesa
le IE
C Re
ntal
s - p
er k
m
Who
lesa
le In
tra-
Build
ing
Circ
uit C
onne
ctio
ns
Who
lesa
le In
tra-
Build
ing
Circ
uit R
enta
ls
Who
lesa
le R
earr
ange
men
ts
External External External External External External Fully Allocated Cost (£ or %) £ £ £ £ £ £ Components Unit (a) Interconnect 2Mbps connection £/circuit 6,516.18 1,144.60 - - - - 3,208.14 Interconnect extension circuits (IEC) 2Mbps link £/circuit 143.98 - 143.98 - - - - Interconnect Extension Circuits (IEC) 2Mbps per km £/km 30.65 - - 30.65 - - - Intra Building Circuit (IBC) connection £/circuit 1.97 1.97 - - 1.97 - - Intra Building Circuit (IBC) rental £/circuit 85.40 - 85.40 - - 85.40 - Cumulo Rates Non NGA - Non Openreach % £14m 0.38 2.25 1.03 0.00 0.35 1.06 Ofcom Administration Fee - Wholesale % £2m 1.15 0.72 0.02 0.96 0.12 0.54 Revenue Receivables % £40m 6.45 4.03 0.14 5.37 0.67 3.03 Rounding - - - - - - Fully Allocated Cost (£ or %) 1,154.55 236.38 31.84 8.30 86.54 3,212.77
Volume (units) 106 3,082 63,594 643 13,440 279 Fully Allocated Cost (£m) 0.1 0.7 2.0 0.0 1.2 0.9

Section 8 – Review of Narrowband Markets
Page 99
Technical Areas (DLE Interconnect Circuits) Summary Restated for the year ended 31 March 2018 (b) Internal
Revenue External
Revenue Total
Revenue Internal
Volume External
Volume Measure Internal
Average Price External
Average Price Internal FAC External FAC Total
FAC
Detailed service analysis £m £m £m £ £ £m £m £m Service Wholesale IEC Connections - 0.3 0.3 - 324 ccts - 1,003.19 - 0.4 0.4 Wholesale IEC Rentals - fixed - 2.2 2.2 - 3,458 ccts - 627.28 - 0.8 0.8 Wholesale IEC Rentals - per km - 1.5 1.5 - 70,535 km - 21.60 - 2.2 2.2 Wholesale Intra-Building Circuits Connections - 0.2 0.2 - 198 ccts - 834.95 - 0.0 0.0 Wholesale Intra-Building Circuit Rentals - 1.5 1.5 - 14,426 ccts - 104.23 - 1.3 1.3 Wholesale Rearrangements - 0.2 0.2 - 335 ccts - 471.31 - 1.3 1.3 Rounding - (0.1 ) (0.1 ) - (0.1 ) (0.1 )Total Technical Areas (DLE Interconnect Circuits) - 5.8 5.8 - 5.9 5.9
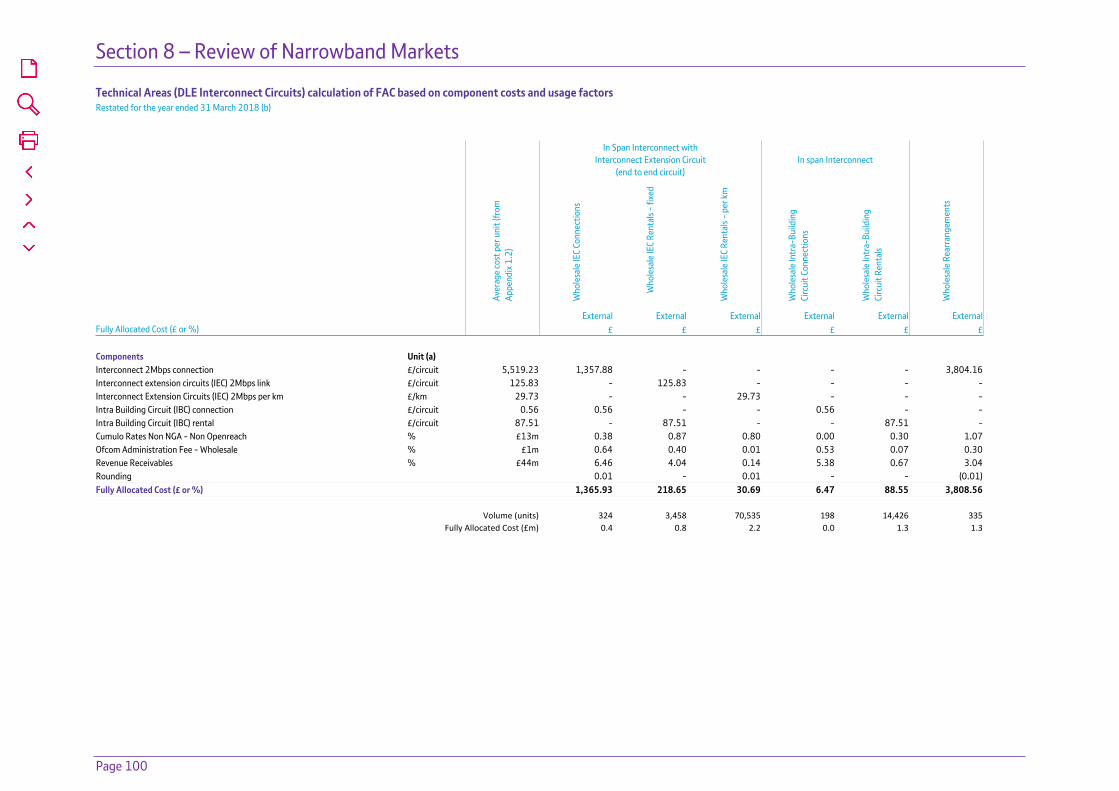
Section 8 – Review of Narrowband Markets
Page 100
Technical Areas (DLE Interconnect Circuits) calculation of FAC based on component costs and usage factors Restated for the year ended 31 March 2018 (b)
In Span Interconnect withInterconnect Extension Circuit
(end to end circuit)In span Interconnect
Aver
age
cost
per
uni
t (fr
om
Appe
ndix
1.2
)
Who
lesa
le IE
C Co
nnec
tions
Who
lesa
le IE
C Re
ntal
s - fi
xed
Who
lesa
le IE
C Re
ntal
s - p
er k
m
Who
lesa
le In
tra-
Build
ing
Circ
uit C
onne
ctio
ns
Who
lesa
le In
tra-
Build
ing
Circ
uit R
enta
ls
Who
lesa
le R
earr
ange
men
ts
External External External External External External Fully Allocated Cost (£ or %) £ £ £ £ £ £ Components Unit (a) Interconnect 2Mbps connection £/circuit 5,519.23 1,357.88 - - - - 3,804.16 Interconnect extension circuits (IEC) 2Mbps link £/circuit 125.83 - 125.83 - - - - Interconnect Extension Circuits (IEC) 2Mbps per km £/km 29.73 - - 29.73 - - - Intra Building Circuit (IBC) connection £/circuit 0.56 0.56 - - 0.56 - - Intra Building Circuit (IBC) rental £/circuit 87.51 - 87.51 - - 87.51 - Cumulo Rates Non NGA - Non Openreach % £13m 0.38 0.87 0.80 0.00 0.30 1.07 Ofcom Administration Fee - Wholesale % £1m 0.64 0.40 0.01 0.53 0.07 0.30 Revenue Receivables % £44m 6.46 4.04 0.14 5.38 0.67 3.04 Rounding 0.01 - 0.01 - - (0.01) Fully Allocated Cost (£ or %) 1,365.93 218.65 30.69 6.47 88.55 3,808.56
Volume (units) 324 3,458 70,535 198 14,426 335 Fully Allocated Cost (£m) 0.4 0.8 2.2 0.0 1.3 1.3
Section 9 – Review of Wholesale Broadband Access Markets
Page 101
Section 9Review of Wholesale Broadband Access Markets

Section 9 – Review of Wholesale Broadband Access Markets
Page 102
WBA (Market A) Summary For the year ended 31 March 2019
Internal External Total Internal External Average Internal
Average External Internal External Total Internal External
Revenue Revenue Revenue Volume Volume Measure Price Price FAC FAC FAC EOI EOI Detailed service analysis £m £m £m £ £ £m £m £m £m £m IPstream Connect Max and Max Premium End User Access - Rental 1.0 0.2 1.2 16,331 3,278 rentals 58.85 63.48 9.2 1.8 11.0 1.3 0.3 IPstream Connect Contracted Bandwidth per Mbps per node rental 3.8 0.6 4.4 94,845 15,140 bandwidth 40.00 40.00 26.2 4.4 30.6 - - WBC Connections 1.4 0.0 1.4 29,654 67 conns 46.31 45.35 1.2 0.0 1.2 1.2 0.0 WBC End User Access - Rental 19.6 0.1 19.7 186,457 609 rentals 105.25 95.79 14.1 0.0 14.1 7.1 0.0 WBC Bandwidth 71.4 0.2 71.6 1,786,200 4,204 bandwidth 40.00 40.00 5.3 0.0 5.3 1.6 0.0 WBC Ancillary Charges & other 0.6 0.2 0.8 (ux) (ux) (ux) (sx) (sx) 1.2 0.2 1.4 1.2 0.2 Other WBA (Market A)* 1.3 1.9 3.22 (ux) (ux) (ux) (sx) (sx) 1.9 0.3 2.2 0.9 0.0 Total WBA (Market A) (including EOI and Internal) 99.1 3.2 102.3 59.1 6.7 65.8 13.3 0.5 Adjustment for EOI and Internal (13.3 ) (0.5 ) (13.8 ) (13.3 ) (0.5 ) (13.8 ) Rounding (0.1 ) (0.1 ) (0.2 ) - 0.1 0.1 Total WBA (Market A) (adjusted for EOI and Internal) 85.7 2.6 88.3 45.8 6.3 52.1
Notes: * Included in Other WBA (Market A) are the following services where revenue is below £5m and EOI is below £1m: IPstream Connect End User Re-grade, IPstream Connect End User Migration, IPstream Connect ADSL Cancellation, Other IPstream Connect Market and Cease Basket
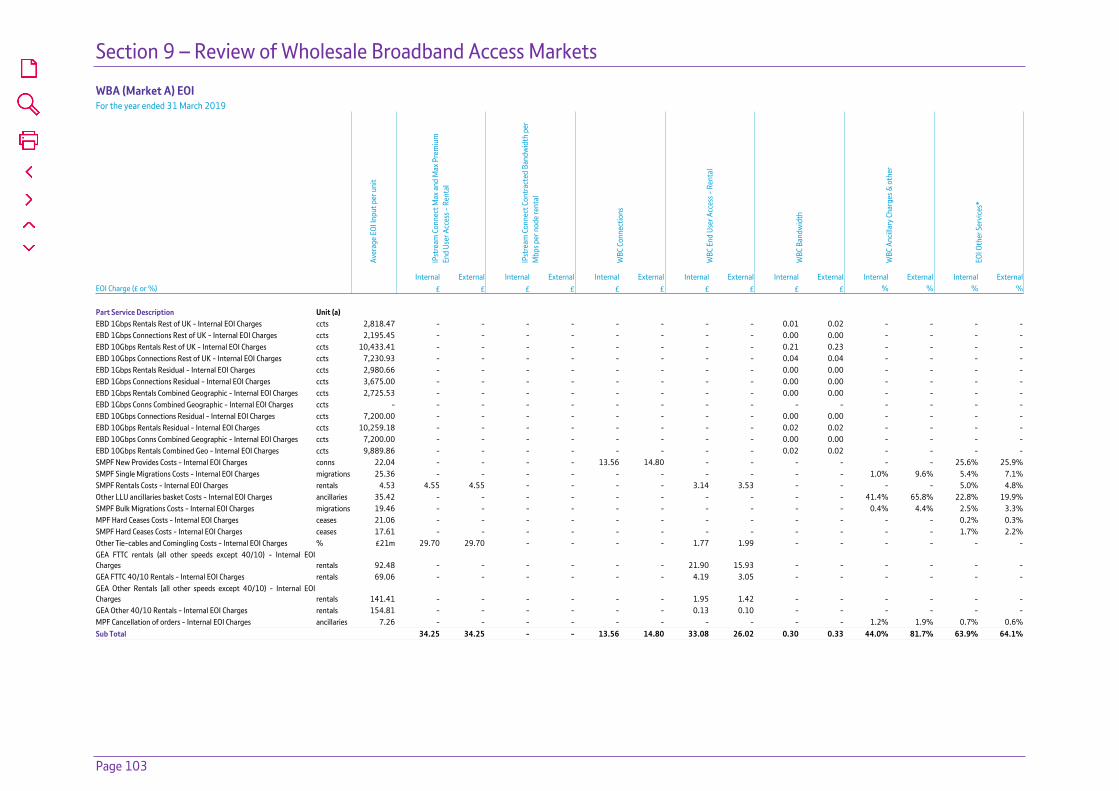
Section 9 – Review of Wholesale Broadband Access Markets
Page 103
WBA (Market A) EOI For the year ended 31 March 2019
Aver
age
EOI I
nput
per
uni
t
IPst
ream
Con
nect
Max
and
Max
Pre
miu
m
End
User
Acc
ess -
Ren
tal
IPst
ream
Con
nect
Con
trac
ted
Band
wid
th p
er
Mbp
s per
nod
e re
ntal
WBC
Con
nect
ions
WBC
End
Use
r Acc
ess -
Ren
tal
WBC
Ban
dwid
th
WBC
Anc
illar
y Ch
arge
s & o
ther
EOI O
ther
Ser
vice
s*
Internal External Internal External Internal External Internal External Internal External Internal External Internal ExternalEOI Charge (£ or %) £ £ £ £ £ £ £ £ £ £ % % % % Part Service Description Unit (a) EBD 1Gbps Rentals Rest of UK - Internal EOI Charges ccts 2,818.47 - - - - - - - - 0.01 0.02 - - - -EBD 1Gbps Connections Rest of UK - Internal EOI Charges ccts 2,195.45 - - - - - - - - 0.00 0.00 - - - -EBD 10Gbps Rentals Rest of UK - Internal EOI Charges ccts 10,433.41 - - - - - - - - 0.21 0.23 - - - -EBD 10Gbps Connections Rest of UK - Internal EOI Charges ccts 7,230.93 - - - - - - - - 0.04 0.04 - - - -EBD 1Gbps Rentals Residual - Internal EOI Charges ccts 2,980.66 - - - - - - - - 0.00 0.00 - - - -EBD 1Gbps Connections Residual - Internal EOI Charges ccts 3,675.00 - - - - - - - - 0.00 0.00 - - - -EBD 1Gbps Rentals Combined Geographic - Internal EOI Charges ccts 2,725.53 - - - - - - - - 0.00 0.00 - - - -EBD 1Gbps Conns Combined Geographic - Internal EOI Charges ccts - - - - - - - - - - - - - - -EBD 10Gbps Connections Residual - Internal EOI Charges ccts 7,200.00 - - - - - - - - 0.00 0.00 - - - -EBD 10Gbps Rentals Residual - Internal EOI Charges ccts 10,259.18 - - - - - - - - 0.02 0.02 - - - -EBD 10Gbps Conns Combined Geographic - Internal EOI Charges ccts 7,200.00 - - - - - - - - 0.00 0.00 - - - -EBD 10Gbps Rentals Combined Geo - Internal EOI Charges ccts 9,889.86 - - - - - - - - 0.02 0.02 - - - -SMPF New Provides Costs - Internal EOI Charges conns 22.04 - - - - 13.56 14.80 - - - - - - 25.6% 25.9%SMPF Single Migrations Costs - Internal EOI Charges migrations 25.36 - - - - - - - - - - 1.0% 9.6% 5.4% 7.1%SMPF Rentals Costs - Internal EOI Charges rentals 4.53 4.55 4.55 - - - - 3.14 3.53 - - - - 5.0% 4.8%Other LLU ancillaries basket Costs - Internal EOI Charges ancillaries 35.42 - - - - - - - - - - 41.4% 65.8% 22.8% 19.9%SMPF Bulk Migrations Costs - Internal EOI Charges migrations 19.46 - - - - - - - - - - 0.4% 4.4% 2.5% 3.3%MPF Hard Ceases Costs - Internal EOI Charges ceases 21.06 - - - - - - - - - - - - 0.2% 0.3%SMPF Hard Ceases Costs - Internal EOI Charges ceases 17.61 - - - - - - - - - - - - 1.7% 2.2%Other Tie-cables and Comingling Costs - Internal EOI Charges % £21m 29.70 29.70 - - - - 1.77 1.99 - - - - - -GEA FTTC rentals (all other speeds except 40/10) - Internal EOI Charges rentals 92.48 - - - - - - 21.90 15.93 - - - - - -GEA FTTC 40/10 Rentals - Internal EOI Charges rentals 69.06 - - - - - - 4.19 3.05 - - - - - -GEA Other Rentals (all other speeds except 40/10) - Internal EOI Charges rentals 141.41 - - - - - - 1.95 1.42 - - - - - -GEA Other 40/10 Rentals - Internal EOI Charges rentals 154.81 - - - - - - 0.13 0.10 - - - - - -MPF Cancellation of orders - Internal EOI Charges ancillaries 7.26 - - - - - - - - - - 1.2% 1.9% 0.7% 0.6%Sub Total 34.25 34.25 - - 13.56 14.80 33.08 26.02 0.30 0.33 44.0% 81.7% 63.9% 64.1%

Section 9 – Review of Wholesale Broadband Access Markets
Page 104
WBA (Market A) EOI (continued) For the year ended 31 March 2019
Aver
age
EOI I
nput
per
uni
t
IPst
ream
Con
nect
Max
and
Max
Pre
miu
m
End
User
Acc
ess -
Ren
tal
IPst
ream
Con
nect
Con
trac
ted
Band
wid
th p
er
Mbp
s per
nod
e re
ntal
WBC
Con
nect
ions
WBC
End
Use
r Acc
ess -
Ren
tal
WBC
Ban
dwid
th
WBC
Anc
illar
y Ch
arge
s & o
ther
EOI O
ther
Ser
vice
s*
Internal External Internal External Internal External Internal External Internal External Internal External Internal ExternalEOI Charge (£ or %) £ £ £ £ £ £ £ £ £ £ % % % % Part Service Description Unit (a) GEA Other FTTC PCP Only Install Connections - Internal EOI Charges conns 46.96 - - - - 11.83 10.10 - - - - - - - -GEA FTTC 40/10 PCP Only Install - Internal EOI Charges conns 46.96 - - - - 6.01 5.13 - - - - - - - -GEA FTTC connections - Internal EOI Charges conns 96.93 - - - - 2.98 2.54 - - - - - - - -GEA FTTP connections - Internal EOI Charges conns 92.00 - - - - 3.42 2.92 - - - - - - - -GEA FTTC 40/10 Connections - Internal EOI Charges conns 99.00 - - - - 0.78 0.67 - - - - - - - -GEA Other FTTC Start of a Stopped Line Connections - Internal EOI Charges conns 4.63 - - - - 0.12 0.10 - - - - - - - -GEA 40/10 FTTP Other Connections - Internal EOI Charges conns 92.00 - - - - 0.24 0.20 - - - - - - - -GEA FTTC 40/10 Start of a Stopped Line - Internal EOI Charges conns 4.63 - - - - 0.06 0.05 - - - - - - - -GEA FTTP 40/10 Conns Voice and Data - Internal EOI Charges conns 92.00 - - - - 0.42 0.36 - - - - - - - -GEA CP to CP Migration Costs - Internal EOI Charges migrations 4.63 - - - - - - - - - - 56.0% 18.3% - -Special Faults Investigation - Internal EOI Charges ancillaries 103.48 1.64 1.64 - - - - 1.13 1.27 - - - - 13.5% 25.8%Tie Cables Costs - Internal EOI Charges ancillaries 33.06 41.02 41.02 - - - - 1.98 2.23 - - - - - -21CN Backhaul EAD - Internal EOI Charges ccts 5,467.97 - - - - - - - - 0.60 0.47 - - - -WLA Time Related Charges Costs - Internal EOI Charges ancillaries 83.77 1.50 0.87 - - - - 1.08 0.82 - - - - 0.9% 0.9%SMPF Expedites - Internal EOI Charges ancillaries 79.78 - - - - - - - - - - - - 1.4% 0.6%NGA Expedites - Internal EOI Charges ancillaries 110.67 - - - - - - - - - - - - 0.9% 0.0%SMPF Enhanced Care - Internal EOI Charges ancillaries 36.53 - - - - - - - - - - - - 11.6% 8.5%NGA Enhanced Care - Internal EOI Charges ancillaries 40.20 - - - - - - - - - - - - 1.0% 0.1%NGA Visit Assure EOI - Internal EOI Charges ancillaries 130.00 - - - - - - 0.81 0.59 - - - - - -Copper Broadband Boost - Internal EOI Charges ancillaries 143.13 - - - - - - - - - - - - 6.7% -Roundings - - - - - - 0.02 (0.01) 0.02 0.01 - - 0.1% -EOI cost (£) or % 78.41 77.78 - - 39.42 36.87 38.10 30.92 0.92 0.81 100.0% 100.0% 100.0% 100.0%
Volume (units) 16,331 3,278 94,845 15,140 29,654 67 186,457 609 1,786,200 4,204 (ux) (ux) (ux) (ux)Unit Rentals Rentals Bandwidth Bandwidth Conns Conns Rentals Rentals Bandwidth Bandwidth
Total EOI Cost (£m) 1.3 0.3 0.0 0.0 1.2 0.0 7.1 0.0 1.6 0.0 1.2 0.2 0.9 0.0
Notes: * Included in EOI Other Services are the following services where EOI is below £1m: IPStream Connect End User Re-grade, IPstream Connect End User Migration, IPstream Connect ADSL Cancellation, Other IPstream Connect Market and Cease Basket
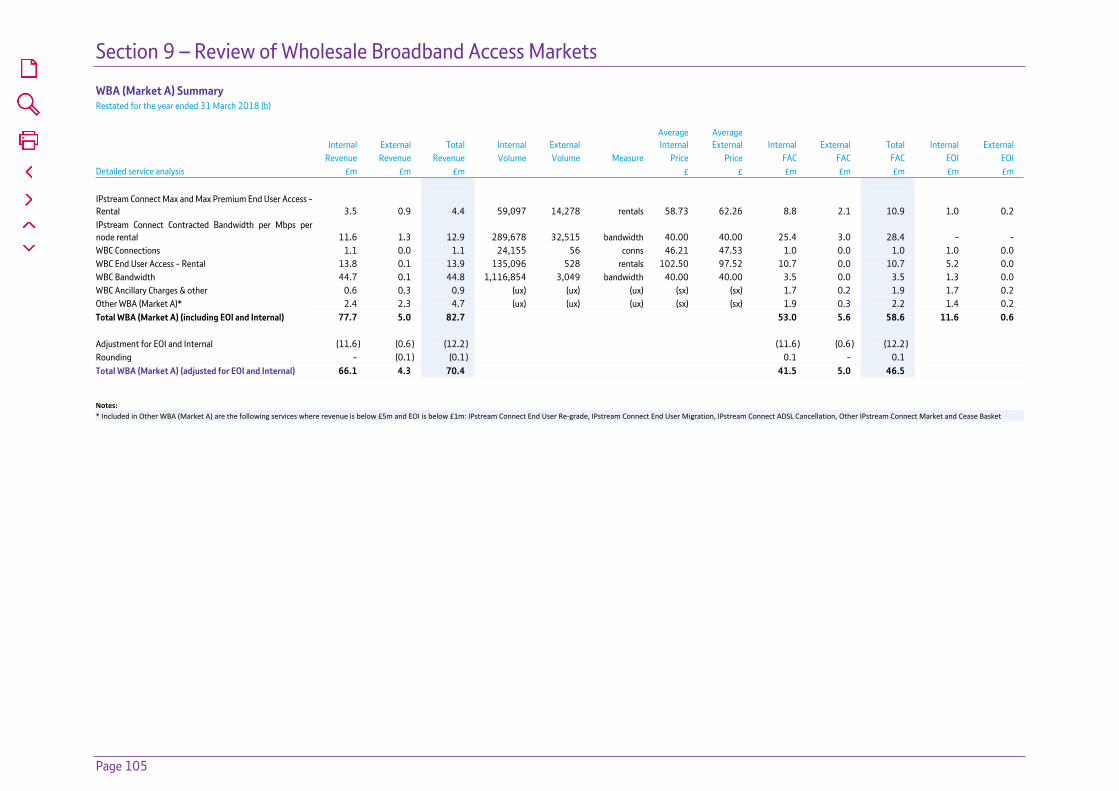
Section 9 – Review of Wholesale Broadband Access Markets
Page 105
WBA (Market A) Summary Restated for the year ended 31 March 2018 (b)
Internal External Total Internal External Average Internal
Average External Internal External Total Internal External
Revenue Revenue Revenue Volume Volume Measure Price Price FAC FAC FAC EOI EOI Detailed service analysis £m £m £m £ £ £m £m £m £m £m IPstream Connect Max and Max Premium End User Access - Rental 3.5 0.9 4.4 59,097 14,278 rentals 58.73 62.26 8.8 2.1 10.9 1.0 0.2 IPstream Connect Contracted Bandwidth per Mbps per node rental 11.6 1.3 12.9 289,678 32,515 bandwidth 40.00 40.00 25.4 3.0 28.4 - - WBC Connections 1.1 0.0 1.1 24,155 56 conns 46.21 47.53 1.0 0.0 1.0 1.0 0.0 WBC End User Access - Rental 13.8 0.1 13.9 135,096 528 rentals 102.50 97.52 10.7 0.0 10.7 5.2 0.0 WBC Bandwidth 44.7 0.1 44.8 1,116,854 3,049 bandwidth 40.00 40.00 3.5 0.0 3.5 1.3 0.0 WBC Ancillary Charges & other 0.6 0.3 0.9 (ux) (ux) (ux) (sx) (sx) 1.7 0.2 1.9 1.7 0.2 Other WBA (Market A)* 2.4 2.3 4.7 (ux) (ux) (ux) (sx) (sx) 1.9 0.3 2.2 1.4 0.2 Total WBA (Market A) (including EOI and Internal) 77.7 5.0 82.7 53.0 5.6 58.6 11.6 0.6 Adjustment for EOI and Internal (11.6 ) (0.6 ) (12.2 ) (11.6 ) (0.6 ) (12.2 ) Rounding - (0.1 ) (0.1 ) 0.1 - 0.1 Total WBA (Market A) (adjusted for EOI and Internal) 66.1 4.3 70.4 41.5 5.0 46.5
Notes: * Included in Other WBA (Market A) are the following services where revenue is below £5m and EOI is below £1m: IPstream Connect End User Re-grade, IPstream Connect End User Migration, IPstream Connect ADSL Cancellation, Other IPstream Connect Market and Cease Basket

Section 9 – Review of Wholesale Broadband Access Markets
Page 106
WBA (Market A) EOI Restated for the year ended 31 March 2018 (b)
Aver
age
EOI I
nput
per
uni
t
IPst
ream
Con
nect
Max
and
Max
Pre
miu
m E
nd U
ser
Acce
ss -
Rent
al
IPst
ream
Con
nect
Con
trac
ted
Band
wid
th p
er M
bps
per n
ode
rent
al
WBC
Con
nect
ions
WBC
End
Use
r Acc
ess -
Ren
tal
WBC
Ban
dwid
th
WBC
Anc
illar
y Ch
arge
s & o
ther
EOI O
ther
Ser
vice
s*
Internal External Internal External Internal External Internal External Internal External Internal External Internal ExternalEOI Charge (£ or %) £ £ £ £ £ £ £ £ £ £ % % % % Part Service Description Unit (a) EBD 1Gbps Rentals Rest of UK - Internal EOI Charges ccts 2,801.19 - - - - - - - - 0.02 0.02 - - - -EBD 1Gbps Connections Rest of UK - Internal EOI Charges ccts 2,165.63 - - - - - - - - 0.00 0.00 - - - -EBD 10Gbps Rentals Rest of UK - Internal EOI Charges ccts 10,445.10 - - - - - - - - 0.20 0.21 - - - -EBD 10Gbps Connections Rest of UK - Internal EOI Charges ccts 7,225.71 - - - - - - - - 0.03 0.03 - - - -EBD 1Gbps Rentals Residual - Internal EOI Charges ccts 2,866.92 - - - - - - - - 0.00 0.00 - - - -EBD 1Gbps Connections Residual - Internal EOI Charges ccts 2,100.00 - - - - - - - - 0.00 - - - - -EBD 1Gbps Rentals Combined Geographic - Internal EOI Charges ccts 2,717.68 - - - - - - - - 0.00 0.00 - - - -EBD 1Gbps Conns Combined Geographic - Internal EOI Charges ccts 2,100.00 - - - - - - - - 0.00 - - - - -EBD 10Gbps Connections Residual - Internal EOI Charges ccts 7,310.77 - - - - - - - - 0.00 0.00 - - - -EBD 10Gbps Rentals Residual - Internal EOI Charges ccts 10,297.67 - - - - - - - - 0.02 0.02 - - - -EBD 10Gbps Conns Combined Geographic - Internal EOI Charges ccts 7,200.00 - - - - - - - - 0.00 0.00 - - - -EBD 10Gbps Rentals Combined Geo - Internal EOI Charges ccts 9,889.32 - - - - - - - - 0.02 0.02 - - - -SMPF New Provides Costs - Internal EOI Charges conns 26.43 - - - - 16.25 14.16 - - - - - - 30.9% 31.0%SMPF Single Migrations Costs - Internal EOI Charges migrations 30.26 - - - - - - - - - - 3.1% 8.2% 4.7% 4.7%SMPF Rentals Costs - Internal EOI Charges rentals 2.50 2.57 2.57 - - - - 1.84 1.95 - - - - 1.1% 1.1%Other LLU ancillaries basket Costs - Internal EOI Charges ancillaries 46.78 - - - - - - - - - - 38.7% 67.7% 25.1% 25.1%SMPF Bulk Migrations Costs - Internal EOI Charges migrations 20.97 - - - - - - - - - - 0.9% 2.3% 1.3% 1.3%MPF Hard Ceases Costs - Internal EOI Charges ceases 27.16 - - - - - - - - - - - - 0.1% 0.1%SMPF Hard Ceases Costs - Internal EOI Charges ceases 21.37 - - - - - - - - - - - - 2.1% 2.1%Other Tie-cables and Comingling Costs - Internal EOI Charges % £18m 4.04 4.04 - - - - 1.39 1.48 - - - - - -GEA FTTC rentals (all other speeds except 40/10) - Internal EOI Charges rentals 110.18 - - - - - - 25.27 21.33 - - - - - -GEA FTTC 40/10 Rentals - Internal EOI Charges rentals 88.80 - - - - - - 4.11 3.47 - - - - - -GEA Other Rentals (all other speeds except 40/10) - Internal EOI Charges rentals 122.91 - - - - - - 1.11 0.93 - - - - - -GEA Other 40/10 Rentals - Internal EOI Charges rentals 189.48 - - - - - - 0.08 0.07 - - - - - -MPF Cancellation of orders - Internal EOI Charges ancillaries 10.31 - - - - - - - - - - 0.1% 0.2% 0.1% 0.1%Sub Total 6.61 6.61 - - 16.25 14.16 33.80 29.23 0.29 0.30 42.8% 78.4% 65.4% 65.5%
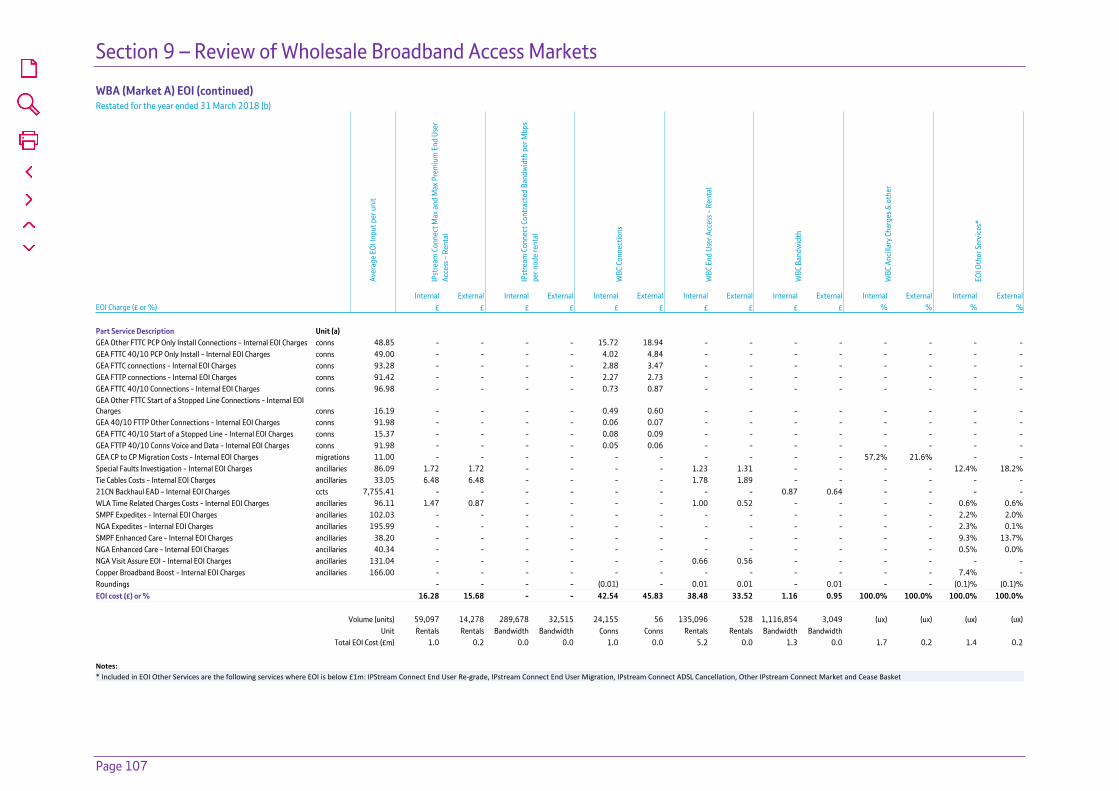
Section 9 – Review of Wholesale Broadband Access Markets
Page 107
WBA (Market A) EOI (continued) Restated for the year ended 31 March 2018 (b)
Aver
age
EOI I
nput
per
uni
t
IPst
ream
Con
nect
Max
and
Max
Pre
miu
m E
nd U
ser
Acce
ss -
Rent
al
IPst
ream
Con
nect
Con
trac
ted
Band
wid
th p
er M
bps
per n
ode
rent
al
WBC
Con
nect
ions
WBC
End
Use
r Acc
ess -
Ren
tal
WBC
Ban
dwid
th
WBC
Anc
illar
y Ch
arge
s & o
ther
EOI O
ther
Ser
vice
s*
Internal External Internal External Internal External Internal External Internal External Internal External Internal ExternalEOI Charge (£ or %) £ £ £ £ £ £ £ £ £ £ % % % % Part Service Description Unit (a) GEA Other FTTC PCP Only Install Connections - Internal EOI Charges conns 48.85 - - - - 15.72 18.94 - - - - - - - -GEA FTTC 40/10 PCP Only Install - Internal EOI Charges conns 49.00 - - - - 4.02 4.84 - - - - - - - -GEA FTTC connections - Internal EOI Charges conns 93.28 - - - - 2.88 3.47 - - - - - - - -GEA FTTP connections - Internal EOI Charges conns 91.42 - - - - 2.27 2.73 - - - - - - - -GEA FTTC 40/10 Connections - Internal EOI Charges conns 96.98 - - - - 0.73 0.87 - - - - - - - -GEA Other FTTC Start of a Stopped Line Connections - Internal EOI Charges conns 16.19 - - - - 0.49 0.60 - - - - - - - -GEA 40/10 FTTP Other Connections - Internal EOI Charges conns 91.98 - - - - 0.06 0.07 - - - - - - - -GEA FTTC 40/10 Start of a Stopped Line - Internal EOI Charges conns 15.37 - - - - 0.08 0.09 - - - - - - - -GEA FTTP 40/10 Conns Voice and Data - Internal EOI Charges conns 91.98 - - - - 0.05 0.06 - - - - - - - -GEA CP to CP Migration Costs - Internal EOI Charges migrations 11.00 - - - - - - - - - - 57.2% 21.6% - -Special Faults Investigation - Internal EOI Charges ancillaries 86.09 1.72 1.72 - - - - 1.23 1.31 - - - - 12.4% 18.2%Tie Cables Costs - Internal EOI Charges ancillaries 33.05 6.48 6.48 - - - - 1.78 1.89 - - - - - -21CN Backhaul EAD - Internal EOI Charges ccts 7,755.41 - - - - - - - - 0.87 0.64 - - - -WLA Time Related Charges Costs - Internal EOI Charges ancillaries 96.11 1.47 0.87 - - - - 1.00 0.52 - - - - 0.6% 0.6%SMPF Expedites - Internal EOI Charges ancillaries 102.03 - - - - - - - - - - - - 2.2% 2.0%NGA Expedites - Internal EOI Charges ancillaries 195.99 - - - - - - - - - - - - 2.3% 0.1%SMPF Enhanced Care - Internal EOI Charges ancillaries 38.20 - - - - - - - - - - - - 9.3% 13.7%NGA Enhanced Care - Internal EOI Charges ancillaries 40.34 - - - - - - - - - - - - 0.5% 0.0%NGA Visit Assure EOI - Internal EOI Charges ancillaries 131.04 - - - - - - 0.66 0.56 - - - - - -Copper Broadband Boost - Internal EOI Charges ancillaries 166.00 - - - - - - - - - - - - 7.4% -Roundings - - - - (0.01) - 0.01 0.01 - 0.01 - - (0.1)% (0.1)%EOI cost (£) or % 16.28 15.68 - - 42.54 45.83 38.48 33.52 1.16 0.95 100.0% 100.0% 100.0% 100.0%
Volume (units) 59,097 14,278 289,678 32,515 24,155 56 135,096 528 1,116,854 3,049 (ux) (ux) (ux) (ux)Unit Rentals Rentals Bandwidth Bandwidth Conns Conns Rentals Rentals Bandwidth Bandwidth
Total EOI Cost (£m) 1.0 0.2 0.0 0.0 1.0 0.0 5.2 0.0 1.3 0.0 1.7 0.2 1.4 0.2
Notes: * Included in EOI Other Services are the following services where EOI is below £1m: IPStream Connect End User Re-grade, IPstream Connect End User Migration, IPstream Connect ADSL Cancellation, Other IPstream Connect Market and Cease Basket
Appendix 1 – Network Activity Statements
Page 108
Appendix 1Network Activity Statements

Appendix 1 – Network Activity Statements
Page 109
Appendix 1.1 Network Activity Statements Consolidated For the year ended 31 March 2019
Fully Allocated Cost (£m)
HCA operating
cost Supplementary
depreciation
Holding (gain)/loss and other CCA
adjustments Roundings
Total CCA operating
costs
CCA mean capital
employed
Applicable rate of return on
capital % Capital
costs
Total of operating costs and capital costs relating to
current year Volume (ii) Units
Average costs per min/unit on a current cost basis relating to
current year Revenue Receivables - - - - - 439.7 9.1 % 40.0 40.0 (i) - (i) TISBO Excess Construction 3.2 - - - 3.2 56.8 9.3 % 5.3 8.5 (i) - (i) Ethernet Excess Construction 15.6 - - - 15.6 295.6 9.8 % 29.0 44.6 (i) - (i) MPF line testing systems 17.2 0.6 (0.4 ) - 17.4 35.1 8.1 % 2.8 20.2 9,557,147 lines 2.12 EVOTAM Testing Systems 14.5 0.5 (0.3 ) (0.1 ) 14.6 29.5 8.1 % 2.4 17.0 3,615,465 lines 4.71 PC rentals 2Mbps regional trunk 4.5 0.6 (0.5 ) - 4.6 17.0 9.3 % 1.6 6.2 192,443 km 32.24 PC rental 2Mbps link national trunk 3.8 0.4 (0.4 ) - 3.8 12.5 9.3 % 1.2 5.0 321,152 km 15.59 Openreach time related charges 74.1 - - - 74.1 (3.4 ) 9.3 % (0.3 ) 73.8 (i) - (i) Co-mingling set up 14.7 0.5 0.1 - 15.3 56.8 8.1 % 4.6 19.9 14,718 rooms 1,354.74 Co-mingling rentals 16.3 0.1 0.0 - 16.4 34.7 8.1 % 2.8 19.2 545,993 hostels 35.20 WLA tie cables 9.0 1.5 (1.1 ) - 9.4 50.5 8.1 % 4.1 13.5 1,170,863 cables 11.50 Local Loop Unbundling systems development 0.7 - - - 0.7 1.5 8.1 % 0.1 0.8 (i) - (i) Wholesale Access specific - - - - - - 8.1 % - - 2,505,191 trans - Routing & Records 24.4 - - - 24.4 (1.3 ) 8.1 % (0.1 ) 24.3 8,048,185 lines 3.02 MDF Hardware jumpering 114.5 - - - 114.5 (5.8 ) 8.1 % (0.5 ) 114.0 7,066,872 lines 16.13 E side copper capital 99.3 24.0 (22.6 ) (0.1 ) 100.6 939.4 8.1 % 76.1 176.7 25,068,691 lines 7.05 E side copper current 104.1 - - - 104.1 (5.4 ) 8.1 % (0.4 ) 103.7 25,855,514 lines 4.01 D side copper capital 496.5 126.3 (121.2 ) - 501.6 4,981.8 8.1 % 403.5 905.1 25,068,691 lines 36.11 D side copper current 285.5 - - - 285.5 (13.0 ) 8.1 % (1.1 ) 284.4 25,855,514 lines 11.00 Local exchanges general frames equipment 40.9 - - - 40.9 31.7 8.1 % 2.6 43.5 38,944,076 lines 1.12 Local exchanges general frames maintenance 33.1 - - - 33.1 (1.6 ) 8.1 % (0.1 ) 33.0 25,855,076 lines 1.27 Analogue line test equipment 2.6 - - - 2.6 3.8 8.1 % 0.3 2.9 25,046,069 lines 0.12 Dropwire capital & analogue NTE 338.3 35.4 (31.0 ) (0.1 ) 342.6 1,140.5 8.1 % 92.4 435.0 24,986,349 lines 17.41 Analogue line drop maintenance 54.6 - - - 54.6 (1.7 ) 8.1 % (0.1 ) 54.5 24,555,772 lines 2.22 Analogue line cards 104.1 0.4 1.7 - 106.2 135.1 8.1 % 10.9 117.1 15,087,745 lines 7.76 Pair gain 0.0 - - - 0.0 0.0 8.1 % 0.0 0.0 15,087,745 lines 0.00 FTTC Development 15.3 - - - 15.3 33.2 9.3 % 3.1 18.4 (i) - (i) OR Service Centre - Provision Analogue/ISDN2 7.6 - - - 7.6 3.5 8.1 % 0.3 7.9 (i) - (i) OR Service Centre - Provision WLA 9.6 - - - 9.6 3.0 8.1 % 0.2 9.8 (i) - (i) OR Service Centre - Provision Ethernet 2.3 - - - 2.3 (0.2 ) 9.8 % (0.0 ) 2.3 (i) - (i) OR Service Centre - Provision GEA 22.6 - - - 22.6 (1.9 ) 9.3 % (0.2 ) 22.4 (i) - (i) OR Service Centre - Assurance Analogue/ISDN2 11.6 - - - 11.6 2.2 8.1 % 0.2 11.8 (i) - (i) OR Service Centre - Assurance WLA 9.7 - - - 9.7 1.5 8.1 % 0.1 9.8 (i) - (i) OR Service Centre - Assurance Ethernet 0.0 - - - 0.0 (0.0 ) 9.8 % (0.0 ) 0.0 (i) - (i) SLG WLA External 22.0 - - - 22.0 2.6 8.1 % 0.2 22.2 (i) - (i) Ethernet Backhaul Direct extended reach 0.6 0.0 (0.0 ) - 0.6 2.1 9.8 % 0.2 0.8 2,278 circuits 342.98 Ethernet Backhaul Direct - Active 40.0 0.5 (0.2 ) - 40.3 92.1 9.8 % 9.0 49.3 7,336 circuits 6,721.00 Ethernet Backhaul Direct - Passive 10.9 2.8 (2.2 ) - 11.5 89.4 9.8 % 8.8 20.3 6,465 circuits 3,128.89 Ethernet Backhaul Direct Resilience - Active 0.8 0.0 (0.0 ) - 0.8 2.2 9.8 % 0.2 1.0 2,230 circuits 444.20 Ethernet Backhaul Direct Resilience - Passive 0.2 0.1 (0.0 ) (0.1 ) 0.2 1.6 9.8 % 0.2 0.4 1,994 circuits 197.16 Combi Card - Broadband 47.8 0.6 (0.2 ) - 48.2 76.9 9.3 % 7.2 55.4 3,615,402 lines 15.30 iNode features 0.9 0.0 (0.0 ) - 0.9 0.9 9.3 % 0.1 1.0 (i) - (i) Core/Metro (broadband) 41.2 0.1 (0.1 ) - 41.2 115.7 9.3 % 10.8 52.0 134,596,414 circuits 0.39 Core Directors - Broadband 0.6 0.0 (0.0 ) - 0.6 1.7 9.3 % 0.2 0.8 307,360 circuits 2.52 Edge Ethernet ports broadband 0.5 0.0 (0.0 ) - 0.5 1.3 9.3 % 0.1 0.6 126,313,406 bandwidth 0.00 Metro BRAS and MSE 74.3 0.3 (0.1 ) - 74.5 206.1 9.3 % 19.2 93.7 126,313,406 bandwidth 0.74

Appendix 1 – Network Activity Statements
Page 110
Appendix 1.1 Network Activity Statements Consolidated (continued) For the year ended 31 March 2019
Fully Allocated Cost (£m)
HCA operating
cost Supplementary
depreciation
Holding (gain)/loss and other CCA
adjustments Roundings
Total CCA operating
costs
CCA mean capital
employed
Applicable rate of return on
capital % Capital
costs
Total of operating costs and capital costs relating to
current year Volume (ii) Units
Average costs per min/unit on a current cost basis relating to
current year Broadband MSAN access 61.6 0.7 (0.3 ) 0.1 62.1 102.5 9.3 % 9.5 71.6 3,615,465 rentals 19.80 Ethernet Switch BB 50.7 0.3 (0.1 ) - 50.9 104.8 9.3 % 9.7 60.6 126,313,406 circuits 0.48 MSAN Access - SFBB 6.8 0.1 (0.0 ) (0.1 ) 6.8 12.7 9.3 % 1.2 8.0 6,406,714 rentals 1.24 Metro core broadband transmission 14.0 0.5 (0.4 ) - 14.1 46.6 9.3 % 4.3 18.4 132,082,085 circuits 0.14 ADSL connections 0.1 - - - 0.1 0.0 9.3 % 0.0 0.1 567,611 conns 0.17 OR Project Services 7.0 - - - 7.0 (0.6 ) 9.8 % (0.1 ) 6.9 (i) - (i) Caller Display 1.9 0.0 0.0 0.1 2.0 2.5 9.3 % 0.2 2.2 (i) - (i) Network Features 4.7 0.0 0.1 - 4.8 6.0 9.3 % 0.6 5.4 (i) - (i) PC rental 2Mbps link per km distribution 26.2 2.0 (1.5 ) - 26.7 73.4 9.3 % 6.8 33.5 483,839 km 69.25 Point of Handover electronics 5.5 0.2 (0.2 ) 0.1 5.6 11.0 9.3 % 1.0 6.6 603 eq 10,956.39 PC rental 64Kbps link 5.7 0.1 (0.0 ) - 5.8 7.8 9.3 % 0.7 6.5 40,510 links 160.61 PC rental 2Mbps link 5.9 0.1 (0.0 ) - 6.0 6.4 9.3 % 0.6 6.6 32,483 links 202.07 PC rental 64Kbps link per km transmission 6.8 0.4 (0.3 ) - 6.9 16.4 9.3 % 1.5 8.4 1,149,431 km 7.31 2Mbps and above PC link connection cct provision 5.4 - - - 5.4 0.0 9.3 % 0.0 5.4 367 circuits 14,692.86 64Kbps PC link connection cct provision 0.2 - - - 0.2 0.0 9.3 % 0.0 0.2 3 circuits 55,447.25 PC rental 64Kbps link local end 17.6 0.3 (0.1 ) - 17.8 24.3 9.3 % 2.3 20.1 12,016 le 1,665.52 PC rental 2Mbps local end copper 2.5 0.0 (0.0 ) - 2.5 1.8 9.3 % 0.2 2.7 7,088 le 371.27 PC rental 2Mbps local end fibre 23.3 0.9 (0.9 ) - 23.3 12.2 9.3 % 1.1 24.4 48,567 le 502.75 Backhaul Extension Services Fibre 2.4 0.3 (0.3 ) - 2.4 13.8 9.8 % 1.4 3.8 2,650 le 1,426.87 Wholesale Extension Services Fibre 11.0 1.2 (1.2 ) - 11.0 62.2 9.8 % 6.1 17.1 11,350 le 1,507.42 Interconnect 2Mbps connection 5.2 - - - 5.2 0.0 9.3 % 0.0 5.2 796 circuits 6,516.18 Interconnect extension circuits IEC 2Mbps link 0.5 0.0 (0.0 ) - 0.5 0.6 9.3 % 0.1 0.6 3,968 circuits 143.98 Interconnect Extension Circuits IEC 2Mbps per km 2.0 0.1 (0.1 ) - 2.0 5.4 9.3 % 0.5 2.5 81,887 km 30.65 Intra Building Circuit IBC connection 0.0 - - - 0.0 0.0 9.3 % 0.0 0.0 2,322 circuits 1.97 Intra Building Circuit IBC rental 3.6 0.0 0.0 0.1 3.7 4.1 9.3 % 0.4 4.1 47,378 circuits 85.40 Ethernet main links 48.2 21.5 (17.1 ) - 52.6 620.0 9.8 % 60.8 113.4 639,749 fibre km 177.23 Ethernet Electronics Current 21.5 0.3 (0.1 ) - 21.7 21.7 9.8 % 2.1 23.8 254,774 le 93.37 Broadband backhaul circuits excl Virtual Paths 48.3 6.5 (5.0 ) - 49.8 219.8 9.3 % 20.4 70.2 1 circuits 70,261,589.64 OR Systems & Development - Ethernet 9.3 - - - 9.3 20.2 9.8 % 2.0 11.3 440,657 le 25.61 Ofcom Administration Fee - Wholesale 2.3 - - - 2.3 0.3 9.3 % 0.0 2.3 (i) - (i) Ofcom Administration Fee - Openreach 4.4 - - - 4.4 0.6 8.1 % 0.0 4.4 (i) - (i) Special Fault Investigation 41.3 - - - 41.3 (2.2 ) 9.3 % (0.2 ) 41.1 (i) - (i) Openreach sales product management 19.2 - - - 19.2 (46.5 ) 8.1 % (3.8 ) 15.4 (i) - (i) Broadband line testing systems 0.5 - - - 0.5 0.3 9.3 % 0.0 0.5 3,681,554 lines 0.15 DSLAM support 15.6 0.2 (0.1 ) 0.1 15.8 32.9 9.3 % 3.1 18.9 387,072 lines 48.63 DSLAM equipment 2.9 - - - 2.9 8.6 9.3 % 0.8 3.7 430,294 lines 8.56 Co-mingling power & vent 27.8 1.0 (0.8 ) - 28.0 52.3 8.1 % 4.2 32.2 114,602 hostels 281.49 Ethernet Access Direct Fibre 186.3 20.6 (21.6 ) - 185.3 928.9 9.8 % 91.0 276.3 305,989 circuits 903.05 Other Ethernet rentals - CCTV 1.8 - - - 1.8 (0.1 ) 9.8 % (0.0 ) 1.8 798 le 2,260.15 Ethernet Excess Construction Capex 25.3 - - - 25.3 59.3 9.8 % 5.8 31.1 (i) - (i) Ethernet Monitoring Platform 15.2 - - - 15.2 2.2 9.8 % 0.2 15.4 51,892 circuits 296.04 SLG Ethernet Provision External 12.4 - - - 12.4 1.5 9.8 % 0.1 12.5 (i) - (i) SLG Ethernet Assurance External 0.1 - - - 0.1 0.0 9.8 % 0.0 0.1 (i) - (i) SLG WLR Provision External 2.7 - - - 2.7 0.3 8.1 % 0.0 2.7 (i) - (i) SLG WLR Assurance External 1.2 - - - 1.2 0.1 8.1 % 0.0 1.2 (i) - (i) SLG Ethernet Provision Internal 11.9 - - - 11.9 1.7 9.8 % 0.2 12.1 (i) - (i)

Appendix 1 – Network Activity Statements
Page 111
Appendix 1.1 Network Activity Statements Consolidated (continued) For the year ended 31 March 2019
Fully Allocated Cost (£m)
HCA operating
cost Supplementary
depreciation
Holding (gain)/loss and other CCA
adjustments Roundings
Total CCA operating
costs
CCA mean capital
employed
Applicable rate of return on
capital % Capital
costs
Total of operating costs and capital costs relating to
current year Volume (ii) Units
Average costs per min/unit on a current cost basis relating to
current year SLG Ethernet Assurance Internal 0.1 - - - 0.1 0.0 9.8 % 0.0 0.1 (i) - (i) SLG WLR Provision Internal 7.2 - - - 7.2 1.0 8.1 % 0.1 7.3 (i) - (i) SLG WLR Assurance Internal 3.3 - - - 3.3 0.5 8.1 % 0.0 3.3 (i) - (i) Expedite Provision Costs 3.6 0.4 (0.4 ) - 3.6 12.7 8.1 % 1.0 4.6 46,986 lines 98.64 Combi Card and MSAN Access - Voice 0.0 0.0 (0.0 ) - 0.0 0.1 8.1 % 0.0 0.0 15,087,745 lines 0.00 Abortive Visits 11.5 - - - 11.5 0.0 8.1 % 0.0 11.5 229,504 trans 50.19 EAD Electronics Capital 108.4 - - - 108.4 217.8 9.8 % 21.3 129.7 251,815 circuits 515.41 NGA E side Copper cable 57.9 5.1 (3.8 ) - 59.2 336.2 9.3 % 31.3 90.5 10,669,498 lines 8.48 NGA Visit Assure 35.4 - - - 35.4 (1.8 ) 8.1 % (0.1 ) 35.3 (i) - (i) FTTP Development 22.0 - - - 22.0 47.8 9.3 % 4.4 26.4 (i) - (i) OR Service Centre - Assurance GEA 20.6 - - - 20.6 (3.5 ) 9.3 % (0.3 ) 20.3 (i) - (i) SLG WLA Internal 10.3 - - - 10.3 1.5 8.1 % 0.1 10.4 (i) - (i) GEA FTTC Access Fibre Spine 8.6 1.2 (1.1 ) - 8.7 72.1 9.3 % 6.7 15.4 10,669,498 rentals 1.45 GEA FTTC Distribution Fibre Spine 50.7 3.0 (3.3 ) - 50.4 309.3 9.3 % 28.8 79.2 10,669,498 rentals 7.42 GEA FTTC Electronics 7.5 - - - 7.5 36.1 9.3 % 3.4 10.9 10,669,498 rentals 1.01 GEA DSLAM & Cabinets 57.7 - - - 57.7 400.9 9.3 % 37.3 95.0 (i) - (i) GEA FTTC Customer Site Electronics 160.6 - - - 160.6 (2.5 ) 9.3 % (0.2 ) 160.4 (i) - (i) GEA FTTC Repairs 16.5 - - - 16.5 (0.9 ) 9.3 % (0.1 ) 16.4 (i) - (i) GEA FTTP Repairs 1.1 - - - 1.1 (0.1 ) 9.3 % (0.0 ) 1.1 (i) - (i) GEA FTTP Provisions 7.8 - - - 7.8 0.5 9.3 % 0.1 7.9 (i) - (i) GEA FTTC Provisions 30.2 - - - 30.2 (0.7 ) 9.3 % (0.1 ) 30.1 (i) - (i) FTTP Funded Fibre Rollout Spend 20.2 0.6 (9.7 ) - 11.1 383.6 9.3 % 35.7 46.8 (i) - (i) FTTP Fibre Rollout Funding (15.4 ) - - - (15.4 ) (96.0 ) 9.3 % (8.9 ) (24.3 ) (i) - (i) GEA FTTP Electronics 8.2 - - - 8.2 40.0 9.3 % 3.7 11.9 302,742 rentals 39.51 GEA Cable Links 8.9 - - - 8.9 1.0 9.3 % 0.1 9.0 10,614 conns 846.98 GEA FTTP Customer Site Installation 15.9 - - - 15.9 (0.2 ) 9.3 % (0.0 ) 15.9 (i) - (i) FTTC Fibre Rollout Funding (52.8 ) - - - (52.8 ) (329.2 ) 9.3 % (30.6 ) (83.4 ) (i) - (i) FTTC Funded Fibre Rollout Spend 114.1 3.1 (29.5 ) - 87.7 1,248.6 9.3 % 116.1 203.8 (i) - (i) GEA FTTP Access Fibre Spine 6.2 0.9 (0.8 ) - 6.3 51.7 9.3 % 4.8 11.1 302,742 rentals 36.63 GEA FTTP Distribution Fibre Spine 72.5 4.2 (4.6 ) - 72.1 448.3 9.3 % 41.7 113.8 302,742 rentals 375.87 Cumulo Rates NGA 71.4 - - - 71.4 9.2 8.1 % 0.7 72.1 (i) - (i) Cumulo Rates Non NGA - Non Openreach 13.7 - - - 13.7 1.8 9.3 % 0.2 13.9 (i) - (i) Cumulo Rates Non NGA - Openreach 133.0 - - - 133.0 17.1 9.8 % 1.7 134.7 (i) - (i) SMP Accounting Separation components 252.9 6.4 (2.2 ) - 257.1 458.1 42.4 299.5 Residual components 736.8 10.2 (7.9 ) (0.1 ) 739.0 554.4 50.9 789.9 Roundings (0.1 ) (0.1 ) (0.2 ) 0.1 (0.3 ) 0.3 (0.1 ) (0.4 ) Total 4,965.3 287.0 (292.0 ) - 4,960.3 15,515.2 1,363.9 6,324.2
(i) This component is attributed on a % basis so no volume or unit cost is derivable
(ii) See glossary for volume unit descriptors

Appendix 1 – Network Activity Statements
Page 112
Appendix 1.2 Network Activity Statements Consolidated Restated for the year ended 31 March 2018 (b)
Fully Allocated Cost (£m)
HCA operating
cost Supplementary
depreciation
Holding (gain)/loss and other CCA
adjustments Roundings
Total CCA operating
costs
CCA mean capital
employed
Applicable rate of return on
capital % Capital
costs
Total of operating costs and capital costs relating to
current year Volume (ii) Units
Average costs per min/unit on a current cost basis relating to
current year Revenue Receivables - - - - - 455.2 9.7 % 44.0 44.0 (i) - (i) TISBO Excess Construction 3.2 - - - 3.2 59.8 9.8 % 5.9 9.1 (i) - (i) Ethernet Excess Construction 15.7 - - - 15.7 272.2 9.8 % 26.7 42.4 (i) - (i) MPF line testing systems 18.5 0.6 (0.6 ) (0.1 ) 18.4 37.1 8.8 % 3.3 21.7 9,183,277 lines 2.36 EVOTAM Testing Systems 18.9 0.6 (0.6 ) (0.1 ) 18.8 37.9 8.8 % 3.3 22.1 4,178,409 lines 5.30 PC rentals 2Mbps regional trunk 5.2 0.8 (0.9 ) 0.1 5.2 22.1 9.8 % 2.2 7.4 240,995 km 30.44 PC rental 2Mbps link national trunk 3.7 0.5 (0.6 ) 0.1 3.7 13.7 9.8 % 1.3 5.0 356,560 km 14.08 Openreach time related charges 65.6 - - - 65.6 (4.7 ) 9.8 % (0.5 ) 65.1 (i) - (i) Co-mingling set up 19.3 0.5 (1.1 ) - 18.7 52.5 8.8 % 4.6 23.3 7,199 rooms 3,242.30 Co-mingling rentals 23.2 - - - 23.2 33.1 8.8 % 2.9 26.1 530,270 hostels 49.22 WLA tie cables 26.8 3.6 (3.6 ) - 26.8 104.5 8.8 % 9.2 36.0 1,211,552 cables 29.72 Local Loop Unbundling systems development 0.5 - - - 0.5 1.2 8.8 % 0.1 0.6 (i) - (i) Wholesale Access specific 0.3 - - - 0.3 3.4 8.8 % 0.3 0.6 2,716,441 trans 0.21 Routing & Records 19.2 - - - 19.2 (1.3 ) 8.8 % (0.1 ) 19.1 7,507,808 lines 2.54 MDF Hardware jumpering 103.1 - - - 103.1 (7.4 ) 8.8 % (0.6 ) 102.5 7,613,020 lines 13.45 E side copper capital 89.0 23.4 (30.5 ) (0.1 ) 81.8 862.5 8.8 % 75.9 157.7 25,226,074 lines 6.25 E side copper current 101.1 - - - 101.1 (6.2 ) 8.8 % (0.5 ) 100.6 26,346,526 lines 3.82 D side copper capital 446.2 122.0 (170.2 ) - 398.0 5,037.1 8.8 % 443.3 841.3 25,225,601 lines 33.35 D side copper current 246.3 - - - 246.3 (16.3 ) 8.8 % (1.4 ) 244.9 26,346,526 lines 9.29 Local exchanges general frames equipment 34.5 - - - 34.5 29.6 8.8 % 2.6 37.1 39,858,948 lines 0.93 Local exchanges general frames maintenance 33.7 - - - 33.7 (2.4 ) 8.8 % (0.2 ) 33.5 26,357,096 lines 1.27 Analogue line test equipment 2.1 - - - 2.1 3.2 8.8 % 0.3 2.4 25,198,347 lines 0.09 Dropwire capital & analogue NTE 322.9 31.8 (45.0 ) - 309.7 1,115.7 8.8 % 98.2 407.9 25,130,387 lines 16.23 Analogue line drop maintenance 48.4 - - - 48.4 (2.2 ) 8.8 % (0.2 ) 48.2 24,767,455 lines 1.95 Analogue line cards 103.9 0.1 3.0 0.1 107.1 138.1 8.8 % 12.2 119.3 15,566,380 lines 7.66 Pair gain 0.0 - - - 0.0 0.0 8.8 % 0.0 0.0 15,566,380 lines 0.00 FTTC Development 16.9 - - - 16.9 44.0 9.8 % 4.3 21.2 (i) - (i) OR Service Centre - Provision Analogue/ISDN2 18.8 - - - 18.8 10.2 8.8 % 0.9 19.7 (i) - (i) OR Service Centre - Provision WLA 21.3 - - - 21.3 9.1 8.8 % 0.8 22.1 (i) - (i) OR Service Centre - Provision Ethernet 7.8 - - - 7.8 (0.7 ) 9.8 % (0.1 ) 7.7 (i) - (i) OR Service Centre - Provision GEA 19.7 - - - 19.7 (1.7 ) 9.8 % (0.2 ) 19.5 (i) - (i) OR Service Centre - Assurance Analogue/ISDN2 8.4 - - - 8.4 4.2 8.8 % 0.4 8.8 (i) - (i) OR Service Centre - Assurance WLA 8.1 - - - 8.1 3.5 8.8 % 0.3 8.4 (i) - (i) OR Service Centre - Assurance Ethernet - - - - - - 9.8 % - - (i) - (i) SLG WLA External 24.3 - - - 24.3 1.6 8.8 % 0.1 24.4 (i) - (i) Ethernet Backhaul Direct extended reach 0.2 0.0 (0.0 ) - 0.2 0.8 9.8 % 0.1 0.3 2,188 circuits 131.81 Ethernet Backhaul Direct - Active 38.7 0.4 (0.7 ) 0.1 38.5 89.9 9.8 % 8.8 47.3 6,322 circuits 7,478.39 Ethernet Backhaul Direct - Passive 9.8 2.9 (3.1 ) - 9.6 91.4 9.8 % 9.0 18.6 5,536 circuits 3,347.44 Ethernet Backhaul Direct Resilience - Active 0.8 0.0 (0.0 ) - 0.8 2.2 9.8 % 0.2 1.0 2,152 circuits 475.98 Ethernet Backhaul Direct Resilience - Passive 0.2 0.1 (0.1 ) - 0.2 1.6 9.8 % 0.2 0.4 1,905 circuits 187.34 Combi Card - Broadband 53.3 0.6 (0.9 ) - 53.0 87.8 9.8 % 8.6 61.6 4,051,578 lines 15.21 iNode features 0.9 0.0 (0.0 ) - 0.9 2.3 9.8 % 0.2 1.1 (i) - (i) Core/Metro (broadband) 34.0 0.1 (0.2 ) - 33.9 92.0 9.8 % 9.0 42.9 108,910,606 circuits 0.39 Core Directors - Broadband 0.6 0.0 (0.0 ) - 0.6 1.5 9.8 % 0.1 0.7 1,514,300 circuits 0.47 Edge Ethernet ports broadband 0.9 0.0 (0.0 ) - 0.9 2.5 9.8 % 0.2 1.1 100,954,106 bandwidth 0.01 Metro BRAS and MSE 41.3 0.2 (0.3 ) (0.1 ) 41.1 107.7 9.8 % 10.6 51.7 100,954,106 bandwidth 0.51

Appendix 1 – Network Activity Statements
Page 113
Appendix 1.2 Network Activity Statements Consolidated (continued) Restated for the year ended 31 March 2018 (b)
Fully Allocated Cost (£m)
HCA operating
cost Supplementary
depreciation
Holding (gain)/loss and other CCA
adjustments Roundings
Total CCA operating
costs
CCA mean capital
employed
Applicable rate of return on
capital % Capital
costs
Total of operating costs and capital costs relating to
current year Volume (ii) Units
Average costs per min/unit on a current cost basis relating to
current year Broadband MSAN access 66.6 0.7 (1.1 ) - 66.2 115.9 9.8 % 11.4 77.6 4,178,409 rentals 18.56 Ethernet Switch BB 53.7 0.3 (0.4 ) (0.1 ) 53.5 119.1 9.8 % 11.7 65.2 100,954,106 circuits 0.65 MSAN Access - SFBB 6.1 0.0 (0.1 ) - 6.0 13.3 9.8 % 1.3 7.3 5,610,643 rentals 1.31 Metro core broadband transmission 11.6 0.5 (0.6 ) 0.1 11.6 39.8 9.8 % 3.9 15.5 107,546,126 circuits 0.14 ADSL connections 0.0 - - - 0.0 0.0 9.8 % 0.0 0.0 854,245 conns 0.04 OR Project Services 14.1 - - - 14.1 (1.4 ) 8.8 % (0.1 ) 14.0 (i) - (i) Caller Display 1.9 0.0 0.0 0.1 2.0 2.5 9.8 % 0.2 2.2 (i) - (i) Network Features 5.0 0.0 0.1 0.1 5.2 6.5 9.8 % 0.6 5.8 (i) - (i) PC rental 2Mbps link per km distribution 34.5 2.7 (3.0 ) - 34.2 100.3 9.8 % 9.8 44.0 662,796 km 66.44 Point of Handover electronics 5.2 0.2 (0.3 ) - 5.1 11.1 9.8 % 1.1 6.2 669 eq 9,285.15 PC rental 64Kbps link 7.4 0.1 (0.2 ) - 7.3 9.5 9.8 % 0.9 8.2 48,878 links 169.33 PC rental 2Mbps link 7.4 0.1 (0.1 ) (0.1 ) 7.3 8.4 9.8 % 0.8 8.1 41,988 links 193.82 PC rental 64Kbps link per km transmission 8.8 0.7 (0.7 ) - 8.8 24.3 9.8 % 2.4 11.2 1,471,902 km 7.57 2Mbps and above PC link connection cct provision 5.4 - - - 5.4 (0.2 ) 9.8 % (0.0 ) 5.4 587 circuits 9,151.22 64Kbps PC link connection cct provision 0.3 - - - 0.3 0.0 9.8 % 0.0 0.3 47 circuits 5,900.40 PC rental 64Kbps link local end 18.9 0.3 (0.5 ) - 18.7 26.4 9.8 % 2.6 21.3 14,704 le 1,450.86 PC rental 2Mbps local end copper 2.7 0.0 (0.0 ) - 2.7 2.3 9.8 % 0.2 2.9 8,993 le 321.52 PC rental 2Mbps local end fibre 33.6 1.3 (1.9 ) - 33.0 33.8 9.8 % 3.3 36.3 60,920 le 596.40 Backhaul Extension Services Fibre 2.7 0.3 (0.5 ) 0.1 2.6 15.7 9.8 % 1.5 4.1 3,393 le 1,213.64 Wholesale Extension Services Fibre 14.0 1.7 (2.5 ) - 13.2 79.9 9.8 % 7.8 21.0 15,500 le 1,355.46 Interconnect 2Mbps connection 5.2 - - - 5.2 (0.2 ) 9.8 % (0.0 ) 5.2 936 circuits 5,519.23 Interconnect extension circuits IEC 2Mbps link 0.5 0.0 (0.0 ) - 0.5 0.6 9.8 % 0.1 0.6 4,572 circuits 125.83 Interconnect Extension Circuits IEC 2Mbps per km 2.2 0.2 (0.2 ) (0.1 ) 2.1 6.4 9.8 % 0.6 2.7 93,266 km 29.73 Intra Building Circuit IBC connection 0.0 - - - 0.0 0.0 9.8 % 0.0 0.0 1,103 circuits 0.56 Intra Building Circuit IBC rental 3.9 0.0 (0.0 ) - 3.9 4.8 9.8 % 0.5 4.4 50,090 circuits 87.51 Ethernet main links 40.5 21.2 (22.8 ) 0.1 39.0 608.4 9.8 % 59.6 98.6 618,956 fibre km 159.27 Ethernet Electronics Current 15.7 0.3 (0.4 ) (0.1 ) 15.5 18.5 9.8 % 1.8 17.3 230,902 le 75.03 Broadband backhaul circuits excl Virtual Paths 48.8 6.8 (7.5 ) - 48.1 231.2 9.8 % 22.7 70.8 1 circuits 70,768,127.19 OR Systems & Development - Ethernet 6.7 - - - 6.7 19.8 9.8 % 1.9 8.6 406,983 le 21.21 Ofcom Administration Fee - Wholesale 1.4 - - - 1.4 0.1 9.8 % 0.0 1.4 (i) - (i) Ofcom Administration Fee - Openreach 3.6 - - - 3.6 0.2 9.8 % 0.0 3.6 (i) - (i) Special Fault Investigation 45.7 - - - 45.7 (3.4 ) 9.8 % (0.3 ) 45.4 (i) - (i) Openreach sales product management 18.2 - - - 18.2 (29.5 ) 8.8 % (2.6 ) 15.6 (i) - (i) Broadband line testing systems 0.5 - - - 0.5 1.3 9.8 % 0.1 0.6 4,577,760 lines 0.14 DSLAM support 23.8 0.4 (0.6 ) - 23.6 44.2 9.8 % 4.3 27.9 1,945,374 lines 14.34 DSLAM equipment 0.2 - - - 0.2 10.4 9.8 % 1.0 1.2 1,945,349 lines 0.62 Co-mingling power & vent 25.2 0.9 (1.1 ) 0.1 25.1 48.6 8.8 % 4.3 29.4 83,191 hostels 352.62 Ethernet Access Direct Fibre 145.9 18.5 (27.9 ) - 136.5 755.2 9.8 % 74.0 210.5 278,557 circuits 755.75 Other Ethernet rentals - CCTV 1.9 - - - 1.9 (0.1 ) 9.8 % (0.0 ) 1.9 876 le 2,144.22 Ethernet Excess Construction Capex 21.8 - - - 21.8 65.5 9.8 % 6.4 28.2 (i) - (i) Ethernet Monitoring Platform 14.7 - - - 14.7 1.1 9.8 % 0.1 14.8 44,235 circuits 334.28 SLG Ethernet Provision External 36.0 - - - 36.0 2.4 9.8 % 0.2 36.2 (i) - (i) SLG Ethernet Assurance External 0.1 - - - 0.1 0.0 9.8 % 0.0 0.1 (i) - (i) SLG WLR Provision External 2.6 - - - 2.6 0.2 8.8 % 0.0 2.6 (i) - (i) SLG WLR Assurance External 1.7 - - - 1.7 0.1 8.8 % 0.0 1.7 (i) - (i) SLG Ethernet Provision Internal 15.1 - - - 15.1 1.1 9.8 % 0.1 15.2 (i) - (i)
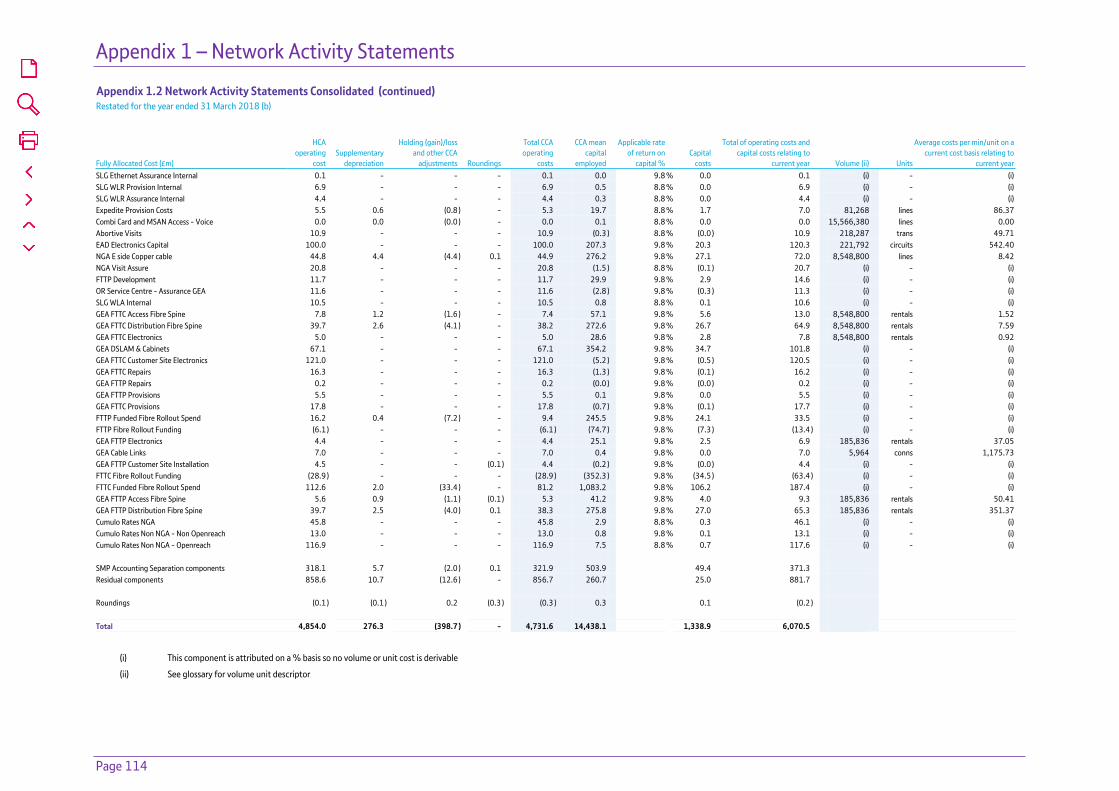
Appendix 1 – Network Activity Statements
Page 114
Appendix 1.2 Network Activity Statements Consolidated (continued) Restated for the year ended 31 March 2018 (b)
Fully Allocated Cost (£m)
HCA operating
cost Supplementary
depreciation
Holding (gain)/loss and other CCA
adjustments Roundings
Total CCA operating
costs
CCA mean capital
employed
Applicable rate of return on
capital % Capital
costs
Total of operating costs and capital costs relating to
current year Volume (ii) Units
Average costs per min/unit on a current cost basis relating to
current year SLG Ethernet Assurance Internal 0.1 - - - 0.1 0.0 9.8 % 0.0 0.1 (i) - (i) SLG WLR Provision Internal 6.9 - - - 6.9 0.5 8.8 % 0.0 6.9 (i) - (i) SLG WLR Assurance Internal 4.4 - - - 4.4 0.3 8.8 % 0.0 4.4 (i) - (i) Expedite Provision Costs 5.5 0.6 (0.8 ) - 5.3 19.7 8.8 % 1.7 7.0 81,268 lines 86.37 Combi Card and MSAN Access - Voice 0.0 0.0 (0.0 ) - 0.0 0.1 8.8 % 0.0 0.0 15,566,380 lines 0.00 Abortive Visits 10.9 - - - 10.9 (0.3 ) 8.8 % (0.0 ) 10.9 218,287 trans 49.71 EAD Electronics Capital 100.0 - - - 100.0 207.3 9.8 % 20.3 120.3 221,792 circuits 542.40 NGA E side Copper cable 44.8 4.4 (4.4 ) 0.1 44.9 276.2 9.8 % 27.1 72.0 8,548,800 lines 8.42 NGA Visit Assure 20.8 - - - 20.8 (1.5 ) 8.8 % (0.1 ) 20.7 (i) - (i) FTTP Development 11.7 - - - 11.7 29.9 9.8 % 2.9 14.6 (i) - (i) OR Service Centre - Assurance GEA 11.6 - - - 11.6 (2.8 ) 9.8 % (0.3 ) 11.3 (i) - (i) SLG WLA Internal 10.5 - - - 10.5 0.8 8.8 % 0.1 10.6 (i) - (i) GEA FTTC Access Fibre Spine 7.8 1.2 (1.6 ) - 7.4 57.1 9.8 % 5.6 13.0 8,548,800 rentals 1.52 GEA FTTC Distribution Fibre Spine 39.7 2.6 (4.1 ) - 38.2 272.6 9.8 % 26.7 64.9 8,548,800 rentals 7.59 GEA FTTC Electronics 5.0 - - - 5.0 28.6 9.8 % 2.8 7.8 8,548,800 rentals 0.92 GEA DSLAM & Cabinets 67.1 - - - 67.1 354.2 9.8 % 34.7 101.8 (i) - (i) GEA FTTC Customer Site Electronics 121.0 - - - 121.0 (5.2 ) 9.8 % (0.5 ) 120.5 (i) - (i) GEA FTTC Repairs 16.3 - - - 16.3 (1.3 ) 9.8 % (0.1 ) 16.2 (i) - (i) GEA FTTP Repairs 0.2 - - - 0.2 (0.0 ) 9.8 % (0.0 ) 0.2 (i) - (i) GEA FTTP Provisions 5.5 - - - 5.5 0.1 9.8 % 0.0 5.5 (i) - (i) GEA FTTC Provisions 17.8 - - - 17.8 (0.7 ) 9.8 % (0.1 ) 17.7 (i) - (i) FTTP Funded Fibre Rollout Spend 16.2 0.4 (7.2 ) - 9.4 245.5 9.8 % 24.1 33.5 (i) - (i) FTTP Fibre Rollout Funding (6.1 ) - - - (6.1 ) (74.7 ) 9.8 % (7.3 ) (13.4 ) (i) - (i) GEA FTTP Electronics 4.4 - - - 4.4 25.1 9.8 % 2.5 6.9 185,836 rentals 37.05 GEA Cable Links 7.0 - - - 7.0 0.4 9.8 % 0.0 7.0 5,964 conns 1,175.73 GEA FTTP Customer Site Installation 4.5 - - (0.1 ) 4.4 (0.2 ) 9.8 % (0.0 ) 4.4 (i) - (i) FTTC Fibre Rollout Funding (28.9 ) - - - (28.9 ) (352.3 ) 9.8 % (34.5 ) (63.4 ) (i) - (i) FTTC Funded Fibre Rollout Spend 112.6 2.0 (33.4 ) - 81.2 1,083.2 9.8 % 106.2 187.4 (i) - (i) GEA FTTP Access Fibre Spine 5.6 0.9 (1.1 ) (0.1 ) 5.3 41.2 9.8 % 4.0 9.3 185,836 rentals 50.41 GEA FTTP Distribution Fibre Spine 39.7 2.5 (4.0 ) 0.1 38.3 275.8 9.8 % 27.0 65.3 185,836 rentals 351.37 Cumulo Rates NGA 45.8 - - - 45.8 2.9 8.8 % 0.3 46.1 (i) - (i) Cumulo Rates Non NGA - Non Openreach 13.0 - - - 13.0 0.8 9.8 % 0.1 13.1 (i) - (i) Cumulo Rates Non NGA - Openreach 116.9 - - - 116.9 7.5 8.8 % 0.7 117.6 (i) - (i) SMP Accounting Separation components 318.1 5.7 (2.0 ) 0.1 321.9 503.9 49.4 371.3 Residual components 858.6 10.7 (12.6 ) - 856.7 260.7 25.0 881.7 Roundings (0.1 ) (0.1 ) 0.2 (0.3 ) (0.3 ) 0.3 0.1 (0.2 ) Total 4,854.0 276.3 (398.7 ) - 4,731.6 14,438.1 1,338.9 6,070.5
(i) This component is attributed on a % basis so no volume or unit cost is derivable
(ii) See glossary for volume unit descriptor

Appendix 2 – Time Related Charges and Special Fault Investigation Costs
Page 115
Appendix 2Time Related Charges and Special Fault Investigation Costs

Appendix 2 – Time Related Charges and Special Fault Investigation Costs
Page 116
Appendix 2.1 Time Related Charges Relating to WFAEL Appendix 2.3 Ethernet Time Related Charges For the year ended 31 March 2019 For the year ended 31 March 2019 Volumes (hours) - Billed (exc volume deals) Volumes (hours) - Billed (exc volume deals) Normal hours 444,363 Normal hours 42,426 Other hours Not available Other hours Not available Sunday/Bank Holiday hours Not available Sunday/Bank Holiday hours Not available Total TRC hours 444,363 Total TRC hours 42,426 Total Direct Costs £ per hour 39.80 Total Direct Costs £ per hour 50.95 Note - TRCs are available outside of normal working hours and Sundays and bank holidays. It has not been possible to split TRC hours into normal, other, and Sunday/Bank holidays for the purposes of this report. The "Normal hours" represents the number of visits plus the number of additional hours.
Note - TRCs are available outside of normal working hours and Sundays and bank holidays. It has not been possible to split TRC hours into normal, other, and Sunday/Bank holidays for the purposes of this report. The "Normal hours" represents the number of visits plus the number of additional hours.
Appendix 2.2 Time Related Charges Relating to WFAEL Appendix 2.4 Ethernet Time Related Charges Restated for the year ended 31 March 2018 (b) Restated for the year ended 31 March 2018 (b) Volumes (hours) - Billed (exc volume deals) Volumes (hours) - Billed (exc volume deals) Normal hours 523,581 Normal hours 52,451 Other hours Not available Other hours Not available Sunday/Bank Holiday hours Not available Sunday/Bank Holiday hours Not available Total TRC hours 523,581 Total TRC hours 52,451 Total Direct Costs £ per hour 37.50 Total Direct Costs £ per hour 50.77 Note - TRCs are available outside of normal working hours and Sundays and bank holidays. It has not been possible to split TRC hours into normal, other, and Sunday/Bank holidays for the purposes of this report. The "Normal hours" represents the number of visits plus the number of additional hours.
Note - TRCs are available outside of normal working hours and Sundays and bank holidays. It has not been possible to split TRC hours into normal, other, and Sunday/Bank holidays for the purposes of this report. The "Normal hours" represents the number of visits plus the number of additional hours.

Appendix 2 – Time Related Charges and Special Fault Investigation Costs
Page 117
Appendix 2.5 Special Fault Investigation Costs Relating to Wholesale Local Access For the year ended 31 March 2019
ModuleCost per module
£m Base 38.2 Network 1.9 Frame 0.5 Internal Wiring 0.2 Internal Equipment 0.2 Co-op - Frame Direct 0.3 41.3 Note - Special Fault Investigation service costs includes all of the cost of the Special Fault Investigation component and some of the cost of other components e.g. Openreach Sales Product Management and Revenue Receivables.
Appendix 2.6 Special Fault Investigation Costs Relating to Wholesale Local Access Restated for the year ended 31 March 2018 (b)
ModuleCost per module
£m Base 39.2 Network 4.3 Frame 0.6 Internal Wiring 0.4 Internal Equipment 0.6 Co-op - Frame Direct 0.7 45.8 Note - Special Fault Investigation service costs includes all of the cost of the Special Fault Investigation component and some of the cost of other components e.g. Openreach Sales Product Management and Revenue Receivables.

Appendix 3 – Reconciliation Report – Impact of Methodology Changes and Errors
Page 118
Appendix 3Reconciliation Report – Impact of Methodology Changes and Errors
Appendix 3 – Reconciliation Report – Impact of Methodology Changes and Errors
Page 119
3.1.1 Change Control Notification – amendments and additional methodologies
BT has an obligation most recently set out in SMP Condition 7.21 of Annex 1 of the 2018 Wholesale Broadband Access Statement, to publish all methodology changes that were implemented between the 2018 RFS published on 31 July 2018 and these Regulatory Financial Statements published on 31 July 2019. This obligation was met by the publication of the Change Control Notification (CCN), dated 31 March 2019.
Our CCN contained all the methodology changes we proposed and have implemented up to 31 March 2019.
3.1.2 Directions relating to the Reconciliation Report
Annex 1 to the Regulatory Financial Reporting Direction published 20 March 2019 includes Direction 5: Direction setting the requirements in relation to the Reconciliation Report and the accompanying audit opinion, requires BT to set out:
In relation to changes to the Regulatory Accounting Methodology:
1) each and every change (including a description that can be referenced to the Change Control Notification)
2) the impact of each Material Change at the Markets and Technical Areas Level, by setting out, for each Material Change separately, the difference between the Current Year Figures and the Current Year Figures had such Material Change not been made, expressed as an absolute amount
3) the impact of changes which are not Material Changes at the Markets and Technical Areas Level, by setting out, on an aggregated basis, the difference between the Current Year Figures and the Current Year Figures had such changes not been made, expressed as an absolute
In relation to Material Errors (as defined by Ofcom – refer section 3.1.5) identified since the publication of the previous Financial Year’s RFS:
1) for each Material Error, a description of the Material Error, the circumstances of discovery of the Material Error, the reason for the Material Error, and whether such Material Error has been corrected in the restated Prior Year Comparatives
2) the impact of all Material Errors presented in the RFS for the previous Financial Year, by setting out:
a) the Current Year Figures set out in the RFS for the previous Financial Year had such Material Errors been corrected in the previous Financial Year (“the Corrected Previous Year Figures”)
b) the difference as an absolute amount between the Current Year Figures set out in the RFS for the previous Financial Year and the Corrected Previous Year Figures
3) the impact of each Material Error at the Markets and Technical Areas Level, by setting out, for each Material Error, the difference as an absolute amount between:
a) the Current Year Figures set out in the RFS for the previous Financial Year
b) the Current Year Figures set out in the RFS for the previous Financial Year had such Material Error been corrected in the previous Financial Year
These requirements are met by the narrative and tables set out on pages 126-132.
3.1.3 Comparability of current and prior year results
This Appendix contains the Reconciliation Report which sets out changes to regulatory accounting methodologies for 2018/19 and the impact of such changes on the 2019 RFS. It also sets out the impact of errors subsequently identified in the 2018 RFS which exceed Ofcom’s definition of materiality. The Reconciliation Report is prepared on the basis of preparation set out in Section 2 of these RFS except for the adjustments of methodologies and correction of errors described in Appendix 3.1.4 and 3.1.5 below.
This Appendix also includes restatement walks which show the impact of methodology changes and correction of identified errors which meet Ofcom’s materiality threshold on the results for 2017/18 originally published on 31 July 2018. These walks are set out on pages 120 to 125.

Appendix 3 – Reconciliation Report – Impact of Methodology Changes and Errors
Page 120
Impact of Changes on Revenue
Wholesale Local
Access Markets
Business Connectivity
MarketsNarrowband Markets
Business Connectivity
MarketsNarrowband
Wholesale Broadband
Access Markets
Refe
renc
e to
3.1
.4 M
etho
dolo
gy ch
ange
s and
Er
ror C
orre
cted
in P
rior Y
ear C
ompa
rativ
es
WLA
Low
Ban
dwid
th C
ISBO
Res
t of U
K
Low
Ban
dwid
th C
ISBO
Com
bine
d Ge
ogra
phic
WFA
EL
ISDN
2
ISDN
30
Tota
l Ope
nrea
ch S
MP
Open
reac
h Re
sidua
l
Tota
l Ope
nrea
ch
Low
Ban
dwid
th T
ISBO
Fixe
d Ca
ll Or
igin
atio
n
Fixe
d Ge
ogra
phic
Call
Term
inat
ion
Tech
nica
l Are
as (D
LE In
terc
onne
ct C
ircui
ts)
WBA
(Mar
ket A
)
Tota
l Res
t of B
T SM
P
Tota
l SM
P M
arke
ts
Who
lesa
le R
esid
ual
EOI E
limin
atio
ns
Reta
il Re
sidua
l
Rest
of B
T Re
sidua
l
Tota
l Res
t of B
T
Elim
inat
ions
Roun
ding
s
Tota
l Mar
kets
£m £m £m £m £m £m £m £m £m £m £m £m £m £m £m £m £m £m £m £m £m £m £m £m
2017/18 as originally published 2,368 578 31 1,644 88 165 - - - 157 143 11 6 425 - 5,616 2,607 (1,079) 20,950 - - (4,372) 1 23,723 CCN Methodologies RFS Presentation Changes Change of presentation of the RFS 2,368 578 31 1,644 88 165 4,874 393 5,267 157 143 11 6 425 742 5,616 - - - 23,164 23,906 (5,451) 1 23,723 Market definition changes Change of market structure for the Wholesale Broadband Access (WBA) markets
- - - - - - - - - - - - - (342) (342) (342) - - - 126 (216) 216 - -
Market definition changes - - - - - - - - - - - - - (342) (342) (342) - - - 126 (216) 216 - - Methodology Changes proposed by Ofcom Installation costs to be treated as operating expenses II - - - - - - - - - - - - - - - - - - - - - - - -Service level guarantees V - - - - - - - - - - - - - - - - - - - - - - - -Methodology Changes proposed by Ofcom - - - - - - - - - - - - - - - - - - - - - - - - Methodology changes proposed by BT Software VIII - - - - - - - - - - - - - - - - - - - - - - - -CCA valuation review IX - - - - - - - - - - - - - - - - - - - - - - - -Changes to CCA indexation X - - - - - - - - - - - - - - - - - - - - - - - -Enterprise simplification and re-organisation XII - - - - - - - - - - - - - - - - - - - - - - - -Half year cost allocation XIII - - - - - - - - - - - - - - - - - - - - - - - -Cost allocation simplification XIV - - - - - - - - - - - - - - - - - - - - - - - -Time of day simplification XVI - - - - - - - - - - - - - - - - - - - - - - - -Disclosure of Openreach costs XVIII - - - - - - - - - - - - - - - - - - - - - - - -Cumulative non-material changes, interactions and roundings
- - - - - (1) (1) - (1) 1 - - - - 1 - - - - (8) (7) 8 - -
Methodology Changes proposed by BT - - - - - (1) (1) - (1) 1 - - - - 1 - - - - (8) (7) 8 - -

Appendix 3 – Reconciliation Report – Impact of Methodology Changes and Errors
Page 121
Impact of Changes on Revenue (continued)
Wholesale Local
Access Markets
Business Connectivity
MarketsNarrowband Markets
Business Connectivity
MarketsNarrowband
Wholesale Broadband
Access Markets
Refe
renc
e to
3.1
.4 M
etho
dolo
gy ch
ange
s and
Er
ror C
orre
cted
in P
rior Y
ear C
ompa
rativ
es
WLA
Low
Ban
dwid
th C
ISBO
Res
t of U
K
Low
Ban
dwid
th C
ISBO
Com
bine
d Ge
ogra
phic
WFA
EL
ISDN
2
ISDN
30
Tota
l Ope
nrea
ch S
MP
Open
reac
h Re
sidua
l
Tota
l Ope
nrea
ch
Low
Ban
dwid
th T
ISBO
Fixe
d Ca
ll Or
igin
atio
n
Fixe
d Ge
ogra
phic
Call
Term
inat
ion
Tech
nica
l Are
as (D
LE In
terc
onne
ct C
ircui
ts)
WBA
(Mar
ket A
)
Tota
l Res
t of B
T SM
P
Tota
l SM
P M
arke
ts
Who
lesa
le R
esid
ual
EOI E
limin
atio
ns
Reta
il Re
sidua
l
Rest
of B
T Re
sidua
l
Tota
l Res
t of B
T
Elim
inat
ions
Roun
ding
s
Tota
l Mar
kets
£m £m £m £m £m £m £m £m £m £m £m £m £m £m £m £m £m £m £m £m £m £m £m £m Total CCN Methodologies - - - - - (1) (1) - (1) 1 - - - (342) (341) (342) - - - 118 (223) 224 - - 2017/18 RFS market figures reflecting all methodology changes 2,368 578 31 1,644 88 164 4,873 393 5,266 158 143 11 6 83 401 5,274 - - - 23,282 23,683 (5,227) 1 23,723
Changes due to Errors Corrected in Prior Year Comparatives
Broadband Backhaul circuits I - - - - - - - - - - - - - - - - - - - - - - - -Inter Activity Group Allocations II - - - - - - - - - - - - - - - - - - - - - - - -ISDN30 DDI Rentals III - - - 5 1 (5) 1 - 1 - - - - - - 1 - - - - - - (1) -Northern Ireland IV - - - - - - - 9 9 - - - - - - - - - - - - (9) - -ACPA asset transfer V - - - - - - - - - - - - - - - - - - - - - - - -CISBO EAD Discounts RFS Disclosure Note VI - - - - - - - - - - - - - - - - - - - - - - - -Changes due to Errors Corrected in Prior Year Comparatives - - - 5 1 (5) 1 9 10 - - - - - - 1 - - - - - (9) (1) -
Total changes - - - 5 1 (6) - 9 9 1 - - - (342) (341) (341) - - - 118 (223) 215 (1) - 2017/18 as restated 2,368 578 31 1,649 89 159 4,874 402 5,276 158 143 11 6 83 401 5,275 - - - 23,282 23,683 (5,236) - 23,723
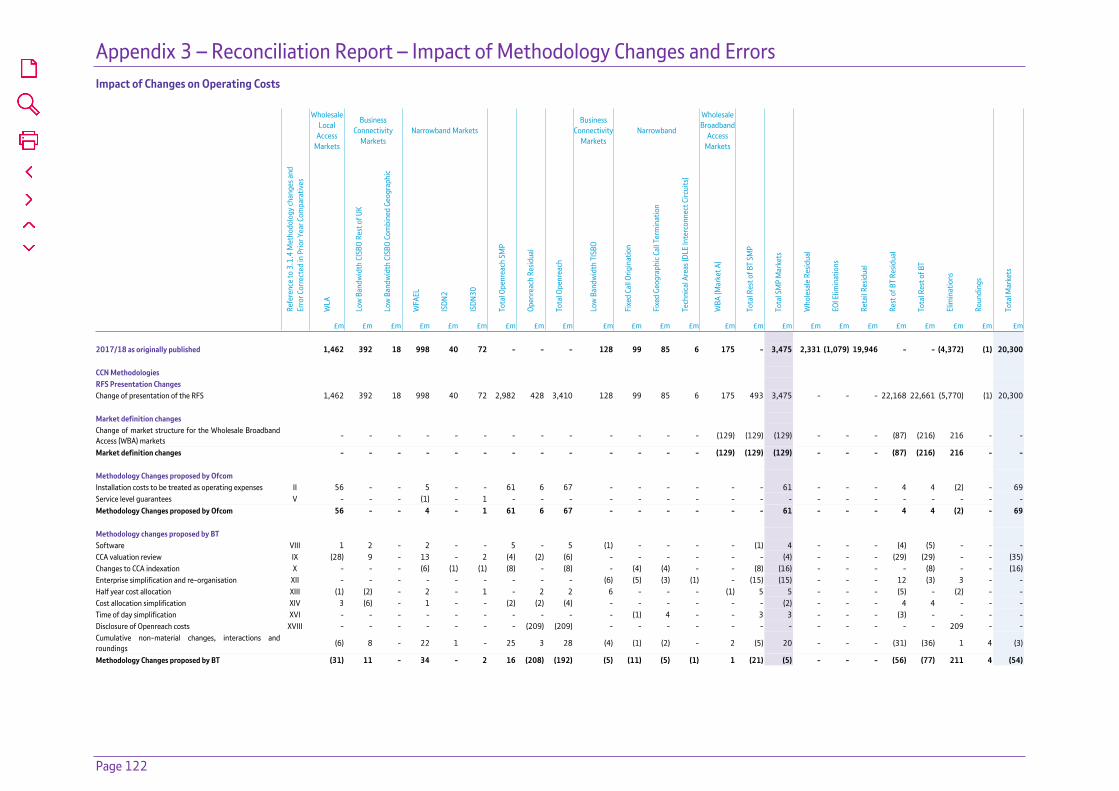
Appendix 3 – Reconciliation Report – Impact of Methodology Changes and Errors
Page 122
Impact of Changes on Operating Costs
Wholesale Local
Access Markets
Business Connectivity
MarketsNarrowband Markets
Business Connectivity
MarketsNarrowband
Wholesale Broadband
Access Markets
Refe
renc
e to
3.1
.4 M
etho
dolo
gy ch
ange
s and
Er
ror C
orre
cted
in P
rior Y
ear C
ompa
rativ
es
WLA
Low
Ban
dwid
th C
ISBO
Res
t of U
K
Low
Ban
dwid
th C
ISBO
Com
bine
d Ge
ogra
phic
WFA
EL
ISDN
2
ISDN
30
Tota
l Ope
nrea
ch S
MP
Open
reac
h Re
sidua
l
Tota
l Ope
nrea
ch
Low
Ban
dwid
th T
ISBO
Fixe
d Ca
ll Or
igin
atio
n
Fixe
d Ge
ogra
phic
Call
Term
inat
ion
Tech
nica
l Are
as (D
LE In
terc
onne
ct C
ircui
ts)
WBA
(Mar
ket A
)
Tota
l Res
t of B
T SM
P
Tota
l SM
P M
arke
ts
Who
lesa
le R
esid
ual
EOI E
limin
atio
ns
Reta
il Re
sidua
l
Rest
of B
T Re
sidua
l
Tota
l Res
t of B
T
Elim
inat
ions
Roun
ding
s
Tota
l Mar
kets
£m £m £m £m £m £m £m £m £m £m £m £m £m £m £m £m £m £m £m £m £m £m £m £m
2017/18 as originally published 1,462 392 18 998 40 72 - - - 128 99 85 6 175 - 3,475 2,331 (1,079) 19,946 - - (4,372) (1) 20,300 CCN Methodologies RFS Presentation Changes Change of presentation of the RFS 1,462 392 18 998 40 72 2,982 428 3,410 128 99 85 6 175 493 3,475 - - - 22,168 22,661 (5,770) (1) 20,300 Market definition changes Change of market structure for the Wholesale Broadband Access (WBA) markets
- - - - - - - - - - - - - (129) (129) (129) - - - (87) (216) 216 - -
Market definition changes - - - - - - - - - - - - - (129) (129) (129) - - - (87) (216) 216 - - Methodology Changes proposed by Ofcom Installation costs to be treated as operating expenses II 56 - - 5 - - 61 6 67 - - - - - - 61 - - - 4 4 (2) - 69Service level guarantees V - - - (1) - 1 - - - - - - - - - - - - - - - - - -Methodology Changes proposed by Ofcom 56 - - 4 - 1 61 6 67 - - - - - - 61 - - - 4 4 (2) - 69 Methodology changes proposed by BT Software VIII 1 2 - 2 - - 5 - 5 (1) - - - - (1) 4 - - - (4) (5) - - -CCA valuation review IX (28) 9 - 13 - 2 (4) (2) (6) - - - - - - (4) - - - (29) (29) - - (35)Changes to CCA indexation X - - - (6) (1) (1) (8) - (8) - (4) (4) - - (8) (16) - - - - (8) - - (16)Enterprise simplification and re-organisation XII - - - - - - - - - (6) (5) (3) (1) - (15) (15) - - - 12 (3) 3 - -Half year cost allocation XIII (1) (2) - 2 - 1 - 2 2 6 - - - (1) 5 5 - - - (5) - (2) - -Cost allocation simplification XIV 3 (6) - 1 - - (2) (2) (4) - - - - - - (2) - - - 4 4 - - -Time of day simplification XVI - - - - - - - - - - (1) 4 - - 3 3 - - - (3) - - - -Disclosure of Openreach costs XVIII - - - - - - - (209) (209) - - - - - - - - - - - - 209 - -Cumulative non-material changes, interactions and roundings
(6) 8 - 22 1 - 25 3 28 (4) (1) (2) - 2 (5) 20 - - - (31) (36) 1 4 (3)
Methodology Changes proposed by BT (31) 11 - 34 - 2 16 (208) (192) (5) (11) (5) (1) 1 (21) (5) - - - (56) (77) 211 4 (54)
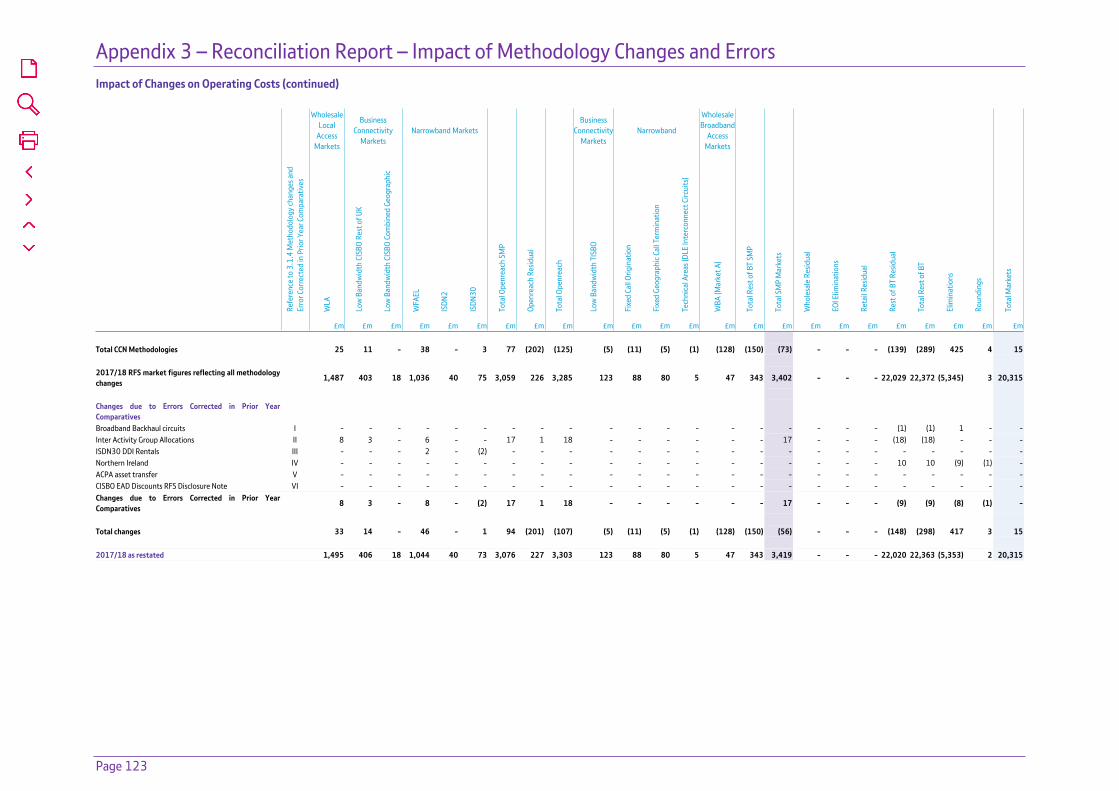
Appendix 3 – Reconciliation Report – Impact of Methodology Changes and Errors
Page 123
Impact of Changes on Operating Costs (continued)
Wholesale Local
Access Markets
Business Connectivity
MarketsNarrowband Markets
Business Connectivity
MarketsNarrowband
Wholesale Broadband
Access Markets
Refe
renc
e to
3.1
.4 M
etho
dolo
gy ch
ange
s and
Er
ror C
orre
cted
in P
rior Y
ear C
ompa
rativ
es
WLA
Low
Ban
dwid
th C
ISBO
Res
t of U
K
Low
Ban
dwid
th C
ISBO
Com
bine
d Ge
ogra
phic
WFA
EL
ISDN
2
ISDN
30
Tota
l Ope
nrea
ch S
MP
Open
reac
h Re
sidua
l
Tota
l Ope
nrea
ch
Low
Ban
dwid
th T
ISBO
Fixe
d Ca
ll Or
igin
atio
n
Fixe
d Ge
ogra
phic
Call
Term
inat
ion
Tech
nica
l Are
as (D
LE In
terc
onne
ct C
ircui
ts)
WBA
(Mar
ket A
)
Tota
l Res
t of B
T SM
P
Tota
l SM
P M
arke
ts
Who
lesa
le R
esid
ual
EOI E
limin
atio
ns
Reta
il Re
sidua
l
Rest
of B
T Re
sidua
l
Tota
l Res
t of B
T
Elim
inat
ions
Roun
ding
s
Tota
l Mar
kets
£m £m £m £m £m £m £m £m £m £m £m £m £m £m £m £m £m £m £m £m £m £m £m £m Total CCN Methodologies 25 11 - 38 - 3 77 (202) (125) (5) (11) (5) (1) (128) (150) (73) - - - (139) (289) 425 4 15 2017/18 RFS market figures reflecting all methodology changes 1,487 403 18 1,036 40 75 3,059 226 3,285 123 88 80 5 47 343 3,402 - - - 22,029 22,372 (5,345) 3 20,315
Changes due to Errors Corrected in Prior Year Comparatives
Broadband Backhaul circuits I - - - - - - - - - - - - - - - - - - - (1) (1) 1 - -Inter Activity Group Allocations II 8 3 - 6 - - 17 1 18 - - - - - - 17 - - - (18) (18) - - -ISDN30 DDI Rentals III - - - 2 - (2) - - - - - - - - - - - - - - - - - -Northern Ireland IV - - - - - - - - - - - - - - - - - - - 10 10 (9) (1) -ACPA asset transfer V - - - - - - - - - - - - - - - - - - - - - - - -CISBO EAD Discounts RFS Disclosure Note VI - - - - - - - - - - - - - - - - - - - - - - - -Changes due to Errors Corrected in Prior Year Comparatives 8 3 - 8 - (2) 17 1 18 - - - - - - 17 - - - (9) (9) (8) (1) -
Total changes 33 14 - 46 - 1 94 (201) (107) (5) (11) (5) (1) (128) (150) (56) - - - (148) (298) 417 3 15 2017/18 as restated 1,495 406 18 1,044 40 73 3,076 227 3,303 123 88 80 5 47 343 3,419 - - - 22,020 22,363 (5,353) 2 20,315
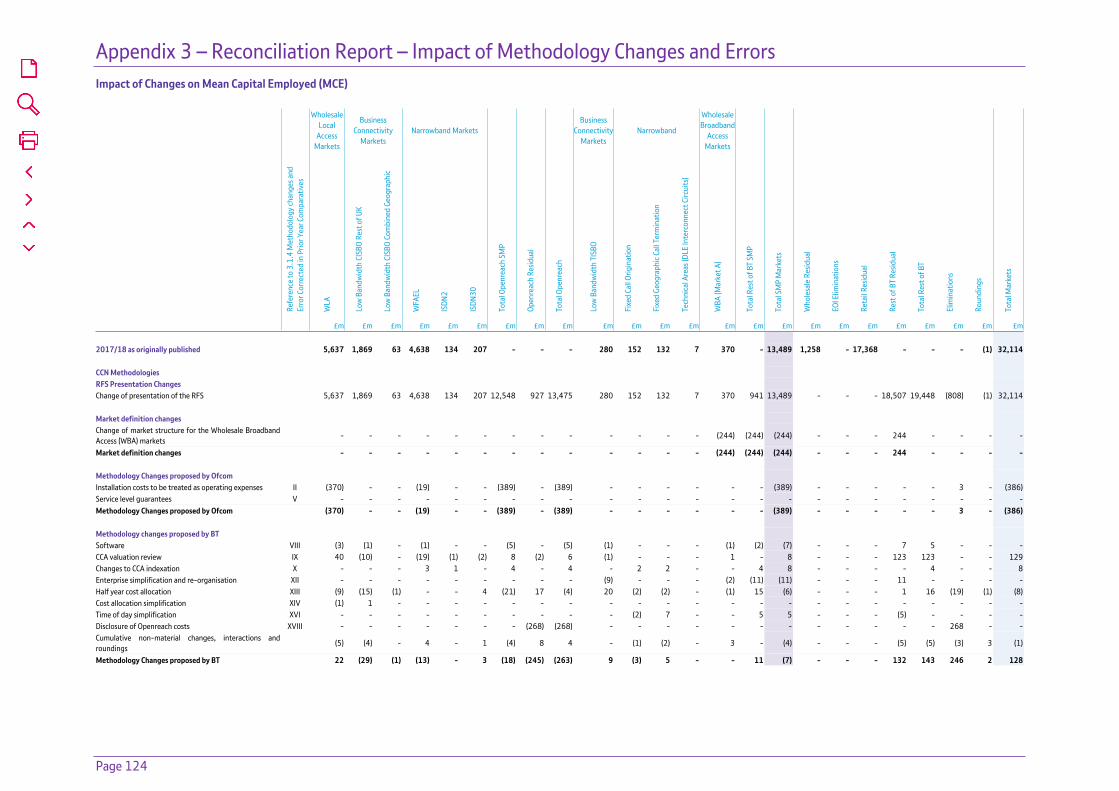
Appendix 3 – Reconciliation Report – Impact of Methodology Changes and Errors
Page 124
Impact of Changes on Mean Capital Employed (MCE)
Wholesale Local
Access Markets
Business Connectivity
MarketsNarrowband Markets
Business Connectivity
MarketsNarrowband
Wholesale Broadband
Access Markets
Refe
renc
e to
3.1
.4 M
etho
dolo
gy ch
ange
s and
Er
ror C
orre
cted
in P
rior Y
ear C
ompa
rativ
es
WLA
Low
Ban
dwid
th C
ISBO
Res
t of U
K
Low
Ban
dwid
th C
ISBO
Com
bine
d Ge
ogra
phic
WFA
EL
ISDN
2
ISDN
30
Tota
l Ope
nrea
ch S
MP
Open
reac
h Re
sidua
l
Tota
l Ope
nrea
ch
Low
Ban
dwid
th T
ISBO
Fixe
d Ca
ll Or
igin
atio
n
Fixe
d Ge
ogra
phic
Call
Term
inat
ion
Tech
nica
l Are
as (D
LE In
terc
onne
ct C
ircui
ts)
WBA
(Mar
ket A
)
Tota
l Res
t of B
T SM
P
Tota
l SM
P M
arke
ts
Who
lesa
le R
esid
ual
EOI E
limin
atio
ns
Reta
il Re
sidua
l
Rest
of B
T Re
sidua
l
Tota
l Res
t of B
T
Elim
inat
ions
Roun
ding
s
Tota
l Mar
kets
£m £m £m £m £m £m £m £m £m £m £m £m £m £m £m £m £m £m £m £m £m £m £m £m
2017/18 as originally published 5,637 1,869 63 4,638 134 207 - - - 280 152 132 7 370 - 13,489 1,258 - 17,368 - - - (1) 32,114 CCN Methodologies RFS Presentation Changes Change of presentation of the RFS 5,637 1,869 63 4,638 134 207 12,548 927 13,475 280 152 132 7 370 941 13,489 - - - 18,507 19,448 (808) (1) 32,114 Market definition changes Change of market structure for the Wholesale Broadband Access (WBA) markets
- - - - - - - - - - - - - (244) (244) (244) - - - 244 - - - -
Market definition changes - - - - - - - - - - - - - (244) (244) (244) - - - 244 - - - - Methodology Changes proposed by Ofcom Installation costs to be treated as operating expenses II (370) - - (19) - - (389) - (389) - - - - - - (389) - - - - - 3 - (386)Service level guarantees V - - - - - - - - - - - - - - - - - - - - - - - -Methodology Changes proposed by Ofcom (370) - - (19) - - (389) - (389) - - - - - - (389) - - - - - 3 - (386) Methodology changes proposed by BT Software VIII (3) (1) - (1) - - (5) - (5) (1) - - - (1) (2) (7) - - - 7 5 - - -CCA valuation review IX 40 (10) - (19) (1) (2) 8 (2) 6 (1) - - - 1 - 8 - - - 123 123 - - 129Changes to CCA indexation X - - - 3 1 - 4 - 4 - 2 2 - - 4 8 - - - - 4 - - 8Enterprise simplification and re-organisation XII - - - - - - - - - (9) - - - (2) (11) (11) - - - 11 - - - -Half year cost allocation XIII (9) (15) (1) - - 4 (21) 17 (4) 20 (2) (2) - (1) 15 (6) - - - 1 16 (19) (1) (8)Cost allocation simplification XIV (1) 1 - - - - - - - - - - - - - - - - - - - - - -Time of day simplification XVI - - - - - - - - - - (2) 7 - - 5 5 - - - (5) - - - -Disclosure of Openreach costs XVIII - - - - - - - (268) (268) - - - - - - - - - - - - 268 - -Cumulative non-material changes, interactions and roundings
(5) (4) - 4 - 1 (4) 8 4 - (1) (2) - 3 - (4) - - - (5) (5) (3) 3 (1)
Methodology Changes proposed by BT 22 (29) (1) (13) - 3 (18) (245) (263) 9 (3) 5 - - 11 (7) - - - 132 143 246 2 128

Appendix 3 – Reconciliation Report – Impact of Methodology Changes and Errors
Page 125
Impact of Changes on Mean Capital Employed (MCE) (continued)
Wholesale Local
Access Markets
Business Connectivity
MarketsNarrowband Markets
Business Connectivity
MarketsNarrowband
Wholesale Broadband
Access Markets
Refe
renc
e to
3.1
.4 M
etho
dolo
gy ch
ange
s and
Er
ror C
orre
cted
in P
rior Y
ear C
ompa
rativ
es
WLA
Low
Ban
dwid
th C
ISBO
Res
t of U
K
Low
Ban
dwid
th C
ISBO
Com
bine
d Ge
ogra
phic
WFA
EL
ISDN
2
ISDN
30
Tota
l Ope
nrea
ch S
MP
Open
reac
h Re
sidua
l
Tota
l Ope
nrea
ch
Low
Ban
dwid
th T
ISBO
Fixe
d Ca
ll Or
igin
atio
n
Fixe
d Ge
ogra
phic
Call
Term
inat
ion
Tech
nica
l Are
as (D
LE In
terc
onne
ct C
ircui
ts)
WBA
(Mar
ket A
)
Tota
l Res
t of B
T SM
P
Tota
l SM
P M
arke
ts
Who
lesa
le R
esid
ual
EOI E
limin
atio
ns
Reta
il Re
sidua
l
Rest
of B
T Re
sidua
l
Tota
l Res
t of B
T
Elim
inat
ions
Roun
ding
s
Tota
l Mar
kets
£m £m £m £m £m £m £m £m £m £m £m £m £m £m £m £m £m £m £m £m £m £m £m £m Total CCN Methodologies (348) (29) (1) (32) - 3 (407) (245) (652) 9 (3) 5 - (244) (233) (640) - - - 376 143 249 2 (258) 2017/18 RFS market figures reflecting all methodology changes 5,289 1,840 62 4,606 134 210 12,141 682 12,823 289 149 137 7 126 708 12,849 - - - 18,883 19,591 (559) 1 31,856
Changes due to Errors Corrected in Prior Year Comparatives
Broadband Backhaul circuits I 9 (3) - (6) - - - (1) (1) (2) (1) (1) - (3) (7) (7) - - - 8 1 - - -Inter Activity Group Allocations II 3 1 - 2 - - 6 1 7 - - - - - - 6 - - - (7) (7) - - -ISDN30 DDI Rentals III - - - 2 1 (3) - - - - - - - - - - - - - - - - - -Northern Ireland IV - - - 1 - - 1 1 2 - - - - - - 1 - - - (1) (1) - (1) -ACPA asset transfer V - - - - - - - - - - - - - - - - - - - - - - - -CISBO EAD Discounts RFS Disclosure Note VI - - - - - - - - - - - - - - - - - - - - - - - -Changes due to Errors Corrected in Prior Year Comparatives 12 (2) - (1) 1 (3) 7 1 8 (2) (1) (1) - (3) (7) - - - - - (7) - (1) -
Total changes (336) (31) (1) (33) 1 - (400) (244) (644) 7 (4) 4 - (247) (240) (640) - - - 376 136 249 1 (258) 2017/18 as restated 5,301 1,838 62 4,605 135 207 12,148 683 12,831 287 148 136 7 123 701 12,849 - - - 18,883 19,584 (559) - 31,856
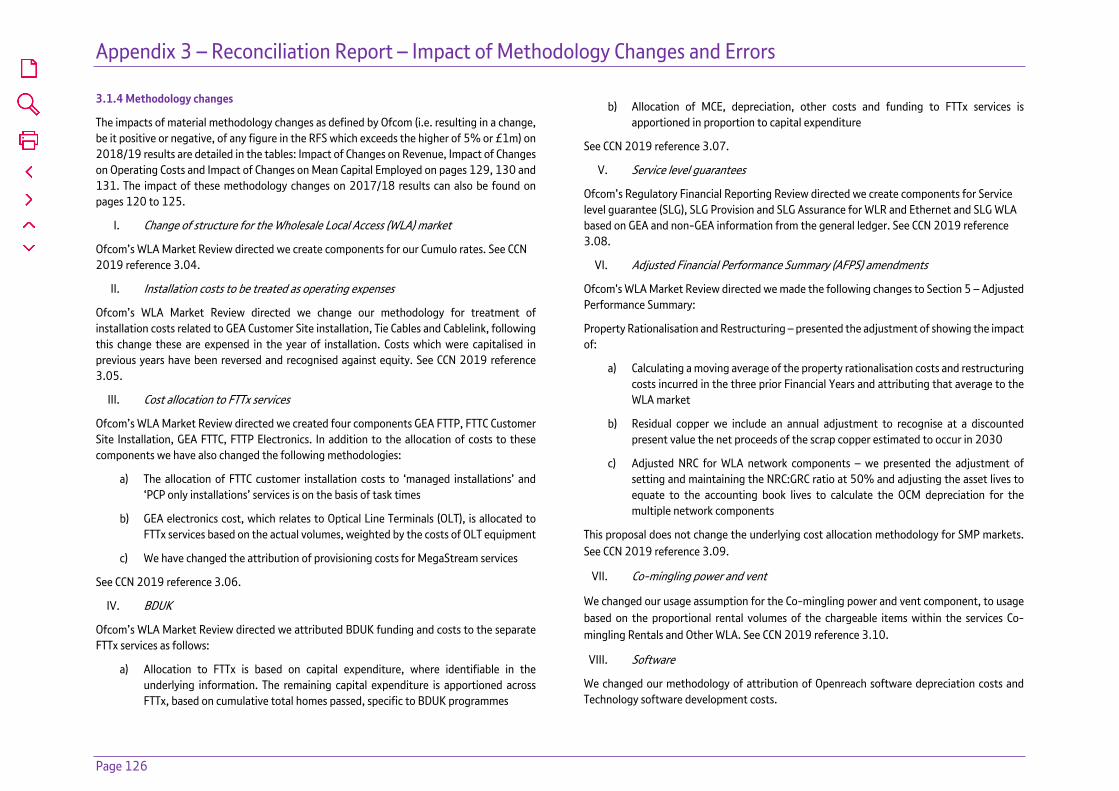
Appendix 3 – Reconciliation Report – Impact of Methodology Changes and Errors
Page 126
3.1.4 Methodology changes
The impacts of material methodology changes as defined by Ofcom (i.e. resulting in a change, be it positive or negative, of any figure in the RFS which exceeds the higher of 5% or £1m) on 2018/19 results are detailed in the tables: Impact of Changes on Revenue, Impact of Changes on Operating Costs and Impact of Changes on Mean Capital Employed on pages 129, 130 and 131. The impact of these methodology changes on 2017/18 results can also be found on pages 120 to 125.
I. Change of structure for the Wholesale Local Access (WLA) market
Ofcom’s WLA Market Review directed we create components for our Cumulo rates. See CCN 2019 reference 3.04.
II. Installation costs to be treated as operating expenses
Ofcom’s WLA Market Review directed we change our methodology for treatment of installation costs related to GEA Customer Site installation, Tie Cables and Cablelink, following this change these are expensed in the year of installation. Costs which were capitalised in previous years have been reversed and recognised against equity. See CCN 2019 reference 3.05.
III. Cost allocation to FTTx services
Ofcom’s WLA Market Review directed we created four components GEA FTTP, FTTC Customer Site Installation, GEA FTTC, FTTP Electronics. In addition to the allocation of costs to these components we have also changed the following methodologies:
a) The allocation of FTTC customer installation costs to ‘managed installations’ and ‘PCP only installations’ services is on the basis of task times
b) GEA electronics cost, which relates to Optical Line Terminals (OLT), is allocated to FTTx services based on the actual volumes, weighted by the costs of OLT equipment
c) We have changed the attribution of provisioning costs for MegaStream services
See CCN 2019 reference 3.06.
IV. BDUK
Ofcom’s WLA Market Review directed we attributed BDUK funding and costs to the separate FTTx services as follows:
a) Allocation to FTTx is based on capital expenditure, where identifiable in the underlying information. The remaining capital expenditure is apportioned across FTTx, based on cumulative total homes passed, specific to BDUK programmes
b) Allocation of MCE, depreciation, other costs and funding to FTTx services is apportioned in proportion to capital expenditure
See CCN 2019 reference 3.07.
V. Service level guarantees
Ofcom’s Regulatory Financial Reporting Review directed we create components for Service level guarantee (SLG), SLG Provision and SLG Assurance for WLR and Ethernet and SLG WLA based on GEA and non-GEA information from the general ledger. See CCN 2019 reference 3.08.
VI. Adjusted Financial Performance Summary (AFPS) amendments
Ofcom's WLA Market Review directed we made the following changes to Section 5 – Adjusted Performance Summary:
Property Rationalisation and Restructuring – presented the adjustment of showing the impact of:
a) Calculating a moving average of the property rationalisation costs and restructuring costs incurred in the three prior Financial Years and attributing that average to the WLA market
b) Residual copper we include an annual adjustment to recognise at a discounted present value the net proceeds of the scrap copper estimated to occur in 2030
c) Adjusted NRC for WLA network components – we presented the adjustment of setting and maintaining the NRC:GRC ratio at 50% and adjusting the asset lives to equate to the accounting book lives to calculate the OCM depreciation for the multiple network components
This proposal does not change the underlying cost allocation methodology for SMP markets. See CCN 2019 reference 3.09.
VII. Co-mingling power and vent
We changed our usage assumption for the Co-mingling power and vent component, to usage based on the proportional rental volumes of the chargeable items within the services Co-mingling Rentals and Other WLA. See CCN 2019 reference 3.10.
VIII. Software
We changed our methodology of attribution of Openreach software depreciation costs and Technology software development costs.

Appendix 3 – Reconciliation Report – Impact of Methodology Changes and Errors
Page 127
Openreach software depreciation costs are now attributed based on the level of GEA investment over the full life of the asset, rather than in-year investment.
Following the Technology re-organisation during the year Technology software development costs are attributed on an Openreach or Enterprise previously allocated costs (PAC) basis as applicable. See CCN 2019 reference 3.11.
IX. CCA valuation review
We changed our methodology of which assets we apply CCA valuation to. CCA valuation is no longer applied to the following classes of work: SDH, ETHER, MSAN, COR21 and WDM21. These assets have an immaterial attribution to regulated markets and are virtually fully depreciated. In addition for WDM21, the historical cost basis has been identified as a reasonable proxy for CCA values. New system implementation has improved matching of the CCA valuation methodology to the corresponding assets. See CCN 2019 reference 3.12.
X. Changes to CCA indexation
We have changed our valuation methodology of LDX class of work to align the assumption for the end of asset life with BT Group accounting policy, which uses an expectation of migration to modern voice services by 2025. We have also frozen the index used to calculate the revaluation as there is minimal recent changes in the valuation. See CCN 2019 reference 3.13.
XI. Openreach re-organisation
We have made the following changes to attributions as a result of new Openreach organisational structure effective from 1 April 2018:
a) BDUK costs - FND costs are now attributed based on subledger records to allocate the costs relating to BDUK. Government Grant funding costs are updated to continue to allocate to BDUK funding
b) Openreach Northern Ireland is reported within Openreach reporting from 1 January 2019. Openreach Northern Ireland was previously reported within BT’s Business and Public Sector business unit. See CCN 2019 reference 3.14
XII. Enterprise simplification and re-organisation
We have made several methodology changes as a result of the creation of our Enterprise business unit effective 1 January 2019. Enterprise combines our Wholesale and Ventures (WAV) and Business and Public Sector (BPS) business units:
a) SG&A and software costs are now directly allocated to Rest of BT Residual rather than the new Enterprise organisation
b) The remaining cost attributions will be updated to reflect the new organisation structure. See CCN 2019 reference 3.15
XIII. Half year cost allocation
We changed our methodology for some usage assumptions where we concluded that the half-year position better represented the in-year trend as opposed to the year-end position for example: full time equivalent staff, usage of buildings, take-up of employee benefits, task time and hourly rate data, and circuit volumes. See CCN 2019 reference 3.16.
XIV. Cost allocation simplification
We have removed or simplified several immaterial or redundant apportionment methodologies. Including:
a) Simplification of the PAC methodology to create a consistent allocation of opening and closing balances
b) Matching of credits to underlying costs by using an Activity Group (AG407, Openreach Engineering Pay)
c) Simplified the allocation pay costs by using an Activity Group
d) Simplified the allocation of legacy Intelligent Network and Call Handling costs (DMC and DC bases) by replacing a manual model with system-driven apportionment
We have frozen several immaterial apportionment models (related to Rest of BT Residual and Enterprise). See CCN 2019 reference 3.17.
XV. Wholesale call volume review
We have made several changes to the Fixed Call Origination and Fixed Geographic Call Termination markets by using fixed routing factors where these have remained static over recent years and improving our assumptions on ported calls revenue to include ported calls between BT OLO (Other Licensed Operators) products, in addition to BT-to-BT.
See CCN 2019 reference 3.18.
XVI. Time of day simplification
We made changes to the Fixed Call Origination and Fixed Geographic Call Termination markets, where prices had no time of day variance, we removed the redundant time of day gradient methodology. See CCN 2019 reference 3.19.

Appendix 3 – Reconciliation Report – Impact of Methodology Changes and Errors
Page 128
XVII. LRIC simplification
We simplified our Long Run Incremental Costs (LRIC) calculation, by reducing the number of adjustments we make to our results. This change does not impact the underlying cost allocation methodology for SMP markets. See CCN 2019 reference 3.20.
XVIII. Disclosure of Openreach costs
We made changes to the Openreach reconciliation disclosures. Costs relating to exchange MSANs and TDM transmission electronics, which are specific to ePPC services are no longer disclosed as Openreach costs in the Openreach reconciliation disclosures, as these do not contribute to the products and services that Openreach provides. This proposal does not change the underlying cost attribution methodology for SMP markets. See CCN 2019 reference 3.21.
Methodology changes not reversed in reconciliation appendix
All of these methodology changes are included in the restated results within these RFS. There are several changes which we included in our CCN which we have not reversed in the methodology reversal results shown below on pages 129-131. These, and the associated rationale for them not being reversed, are discussed below.
Presentation of the RFS change (CCN reference 3.01); this was implemented as Ofcom-driven change to schedules presented in RFS and the removal of others rather than a methodology change. Therefore this change has not been reversed.
Change of market structure for the Wholesale Broadband Access (WBA) markets (CCN reference 3.02) and change of ISDN 30 and ISDN 2 markets (CCN reference 3.03); these were implemented as Ofcom-driven market redefinitions rather than changes in methodology, so they have not been reversed as part of this report.
Wholesale Local Access (WLA) market change (CCN reference 3.04) was partly reversed. Change that has not been reversed relates to adjustments to the additional financial information provided to Ofcom, which is not a methodology change.
BDUK change (CCN reference 3.07) is related to Ofcom-driven presentational changes of separate reporting of BDUK funding in RFS section 5 and WLA market definition change, therefore has not been reversed as part of this report.
Adjusted Financial Performance Summary (AFPS) amendments change (CCN reference 3.09); related to presentational changes to the RFS rather than a change in methodology, therefore has not been reversed.
Openreach re-organisation (CCN reference 3.14); related to business structure reorganisation rather than a change in methodology, therefore has not been reversed.
Enterprise simplification and re-organisation (CCN reference 3.15); related to group re-organisational change which is not appropriate to reverse in this report.
Wholesale call volume review (CCN reference 3.18); this change was as a result of freezing calls routing factors due to decommissioned old network records system and system’s data being no longer available. Therefore it was not possible to reverse this change.
Time of day simplification (CCN reference 3.19); change relates to the removal of redundant time of day gradient as prices have no time of day variance anymore. It is not possible to revert previous pricing policy, therefore the change has not been reversed.
LRIC simplification (CCN reference 3.20); this methodology change only affected additional financial information provided to Ofcom privately (LRIC) rather than any figures relevant to the RFS.
Disclosure of Openreach costs (CCN reference 3.21); related to presentational change in Openreach reconciliation schedule rather than a methodology change, therefore has not been reversed.

Appendix 3 – Reconciliation Report – Impact of Methodology Changes and Errors
Page 129
Reconciliation statement impactsImpact of Methodology Changes on Revenue
Wholesale
Local Access Markets
Business Connectivity
MarketsNarrowband Markets
Business Connectivity
MarketsNarrowband
Wholesale Broadband
Access Markets
Refe
renc
e to
3.1
.4 M
etho
dolo
gy ch
ange
s
WLA
Low
Ban
dwid
th C
ISBO
Res
t of U
K
Low
Ban
dwid
th C
ISBO
Com
bine
d Ge
ogra
phic
WFA
EL
ISDN
2
ISDN
30
Tota
l Ope
nrea
ch S
MP
Open
reac
h Re
sidua
l
Tota
l Ope
nrea
ch
Low
Ban
dwid
th T
ISBO
Fixe
d Ca
ll Or
igin
atio
n
Fixe
d Ge
ogra
phic
Call
Term
inat
ion
Tech
nica
l Are
as (D
LE In
terc
onne
ct C
ircui
ts)
WBA
- M
arke
t A
Tota
l Res
t of B
T SM
P
Rest
of B
T Re
sidua
l
Tota
l Res
t of B
T
Elim
inat
ions
Roun
ding
s
Tota
l Mar
kets
£m £m £m £m £m £m £m £m £m £m £m £m £m £m £m £m £m £m £m £m
2019 published RFS 2,353 499 28 1,614 79 136 4,709 366 5,075 122 138 9 6 102 377 22,940 23,317 (4,966) 2 23,428Change of structure for the Wholesale Local Access (WLA) market I - - - - - - - - - - - - - - - 4 4 (3) (1) -Installation costs to be treated as operating expenses II - - - - - - - - - - - - - - - (1) (1) 1 - -Cost allocation to FTTx services III - - - - - - - - - - - - - - - - - - - -Service level guarantees V - - - - - - - - - - - - - - - - - - - -Co-mingling power and vent VII - - - - - - - - - - - - - - - - - - - -Software VIII - - - - - - - - - - - - - - - - - - - -CCA valuation review IX - - - - - - - - - - - - - - - 35 35 (35) - -Changes to CCA indexation X - - - - - - - - - - - - - - - - - - - -Half year cost allocation XII - - - - - - - - - - - - - - - - - - - -Cost allocation simplification XIV - - - - - - - - - - - - - - - 2 2 (2) - - Cumulative non-material changes, interactions and roundings - - - - 1 - 1 - 1 - 1 - - - 1 - 1 - (2) - 2019 RFS using 2018 methodologies 2,353 499 28 1,614 80 136 4,710 366 5,076 122 139 9 6 102 378 22,980 23,358 (5,005) (1) 23,428
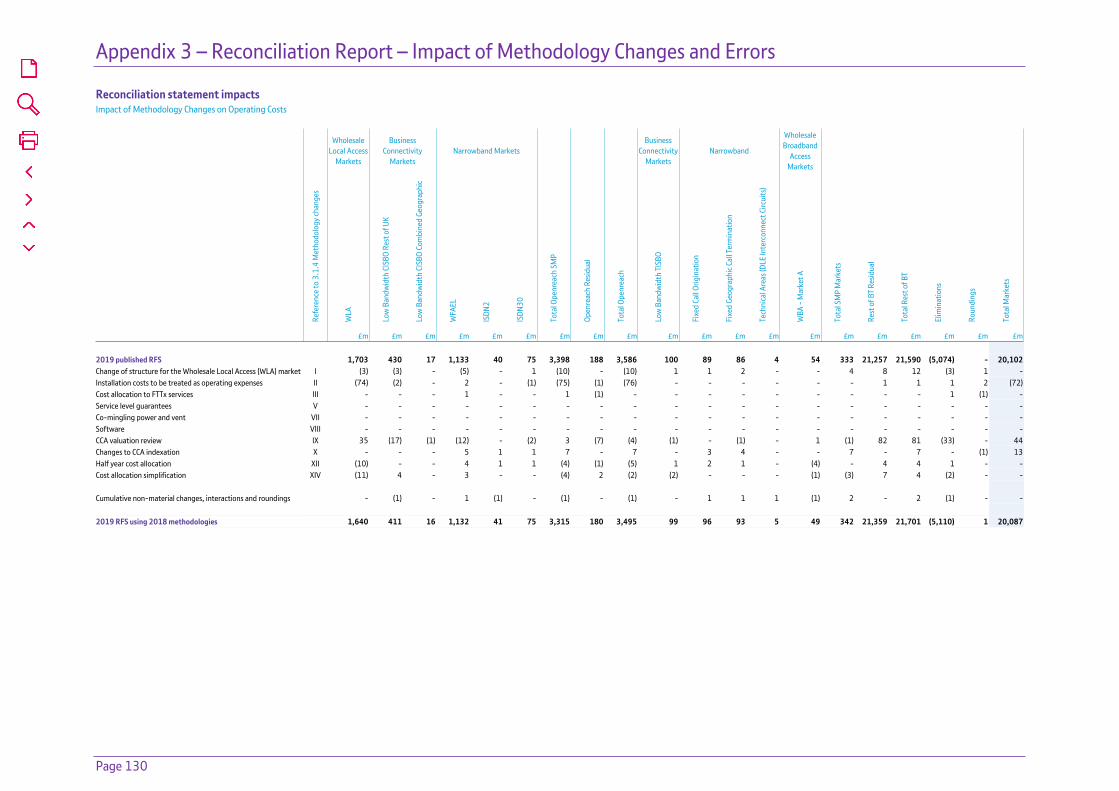
Appendix 3 – Reconciliation Report – Impact of Methodology Changes and Errors
Page 130
Reconciliation statement impactsImpact of Methodology Changes on Operating Costs
Wholesale
Local Access Markets
Business Connectivity
MarketsNarrowband Markets
Business Connectivity
MarketsNarrowband
Wholesale Broadband
Access Markets
Refe
renc
e to
3.1
.4 M
etho
dolo
gy ch
ange
s
WLA
Low
Ban
dwid
th C
ISBO
Res
t of U
K
Low
Ban
dwid
th C
ISBO
Com
bine
d Ge
ogra
phic
WFA
EL
ISDN
2
ISDN
30
Tota
l Ope
nrea
ch S
MP
Open
reac
h Re
sidua
l
Tota
l Ope
nrea
ch
Low
Ban
dwid
th T
ISBO
Fixe
d Ca
ll Or
igin
atio
n
Fixe
d Ge
ogra
phic
Call
Term
inat
ion
Tech
nica
l Are
as (D
LE In
terc
onne
ct C
ircui
ts)
WBA
- M
arke
t A
Tota
l SM
P M
arke
ts
Rest
of B
T Re
sidua
l
Tota
l Res
t of B
T
Elim
inat
ions
Roun
ding
s
Tota
l Mar
kets
£m £m £m £m £m £m £m £m £m £m £m £m £m £m £m £m £m £m £m £m
2019 published RFS 1,703 430 17 1,133 40 75 3,398 188 3,586 100 89 86 4 54 333 21,257 21,590 (5,074) - 20,102Change of structure for the Wholesale Local Access (WLA) market I (3) (3) - (5) - 1 (10) - (10) 1 1 2 - - 4 8 12 (3) 1 -Installation costs to be treated as operating expenses II (74) (2) - 2 - (1) (75) (1) (76) - - - - - - 1 1 1 2 (72)Cost allocation to FTTx services III - - - 1 - - 1 (1) - - - - - - - - - 1 (1) -Service level guarantees V - - - - - - - - - - - - - - - - - - - -Co-mingling power and vent VII - - - - - - - - - - - - - - - - - - - -Software VIII - - - - - - - - - - - - - - - - - - - -CCA valuation review IX 35 (17) (1) (12) - (2) 3 (7) (4) (1) - (1) - 1 (1) 82 81 (33) - 44Changes to CCA indexation X - - - 5 1 1 7 - 7 - 3 4 - - 7 - 7 - (1) 13Half year cost allocation XII (10) - - 4 1 1 (4) (1) (5) 1 2 1 - (4) - 4 4 1 - -Cost allocation simplification XIV (11) 4 - 3 - - (4) 2 (2) (2) - - - (1) (3) 7 4 (2) - - Cumulative non-material changes, interactions and roundings - (1) - 1 (1) - (1) - (1) - 1 1 1 (1) 2 - 2 (1) - - 2019 RFS using 2018 methodologies 1,640 411 16 1,132 41 75 3,315 180 3,495 99 96 93 5 49 342 21,359 21,701 (5,110) 1 20,087

Appendix 3 – Reconciliation Report – Impact of Methodology Changes and Errors
Page 131
Reconciliation statement impactsImpact of Methodology Changes on MCE
Wholesale
Local Access Markets
Business Connectivity
MarketsNarrowband Markets
Business Connectivity
MarketsNarrowband
Wholesale Broadband
Access Markets
Refe
renc
e to
3.1
.5 M
etho
dolo
gy ch
ange
s
WLA
Low
Ban
dwid
th C
ISBO
Res
t of U
K
Low
Ban
dwid
th C
ISBO
Com
bine
d Ge
ogra
phic
WFA
EL
ISDN
2
ISDN
30
Tota
l Ope
nrea
ch S
MP
Open
reac
h Re
sidua
l
Tota
l Ope
nrea
ch
Low
Ban
dwid
th T
ISBO
Fixe
d Ca
ll Or
igin
atio
n
Fixe
d Ge
ogra
phic
Call
Term
inat
ion
Tech
nica
l Are
as (D
LE In
terc
onne
ct C
ircui
ts)
WBA
- M
arke
t A
Tota
l SM
P M
arke
ts
Rest
of B
T Re
sidua
l
Tota
l Res
t of B
T
Elim
inat
ions
Roun
ding
s
Tota
l Mar
kets
£m £m £m £m £m £m £m £m £m £m £m £m £m £m £m £m £m £m £m £m
2019 published RFS 6,077 1,980 63 4,518 125 195 12,958 801 13,759 217 147 143 6 131 644 20,692 21,336 (503) 1 34,593Change of structure for the Wholesale Local Access (WLA) market I - - - - - - - - - - - - - - - 1 1 - (1) -Installation costs to be treated as operating expenses II 456 10 - 19 1 1 487 - 487 - - (1) - - (1) (17) (18) 1 - 470Cost allocation to FTTx services III - - - - - - - - - - - - - - - - - - - -Service level guarantees V - - - - - - - - - - - - - - - - - - - -Co-mingling power and vent VII - - - - - - - - - - - - - - - - - - - -Software VIII - - - - - - - - - - - - - - - - - - - -CCA valuation review IX (78) 28 1 32 1 3 (13) 2 (11) 2 - 1 - (2) 1 (156) (155) (5) (1) (172)Changes to CCA indexation X (1) - - (3) (1) - (5) - (5) - (1) (2) - - (3) - (3) - 2 (6)Half year cost allocation XII (9) 2 - 3 1 1 (2) (2) (4) 1 3 4 - (7) 1 2 3 3 (2) -Cost allocation simplification XIV 10 - - (3) - 1 8 - 8 - - - - (4) (4) (4) (8) - - - Cumulative non-material changes, interactions and roundings (1) - - (1) (1) (1) (4) 1 (3) - 1 - 1 1 3 (3) - (1) 1 (3) 2019 RFS using 2018 methodologies 6,454 2,020 64 4,565 126 200 13,429 802 14,231 220 150 145 7 119 641 20,515 21,156 (505) - 34,882

Appendix 3 – Reconciliation Report – Impact of Methodology Changes and Errors
Page 132
3.1.5 Errors Corrected in Prior Year Comparatives
The prior year comparatives have been restated to reflect the correction of errors which meet Ofcom’s definition of Material Error. Ofcom defines a Material Error as one which results in a correction (be it positive or negative) to any figure in the RFS which exceeds the higher of 5% or £1 million. The percentage correction to a figure shall be calculated by taking the value of the affected figure in the Regulatory Financial Reporting before the error is corrected, and subtracting from it, the value of the same figure after the error is corrected, and then dividing this result by the former value. The error must fulfil at least one of the following conditions:
(a) the error has arisen within the Regulatory Attribution System; or(b) the error has been brought to the attention of the Audit and Risk Committee
by the Regulatory Auditor.
The impact of correcting these errors on the 2017/18 results are detailed in the tables: Impact of Changes on Revenue, Impact of Changes on Operating Costs and Impact of Changes on Mean Capital Employed on pages 129, 130 and 131.
The errors identified in the 2018 RFS are detailed below:
I. Broadband Backhaul circuits
An error was identified in the classification of costs for the component Broadband Backhaul circuits (excl Virtual Paths). This was identified due to a change in services provided.
II. Inter Activity Group allocations
An error was identified in the calculation of system generated drivers used to allocate costs through specific activity groups. This was identified through the implementation of CostPerform.
III. ISDN30 DDI Rentals
An error was identified in the allocation of internal revenue for ISDN 30 DDI Rentals. This was identified during implementation of the Narrowband Market Review.
IV. Northern Ireland
An error was identified in the classification of internal trades of the Northern Ireland Networks between the regulated and un-regulated markets. This was identified as a result of the Openreach re-organisation.
V. ACPA asset transfer
An error was identified in the transfer of ACPA class of work asset balances to LFME class of work. This was identified during routine process reviews.
VI. CISBO EAD Discounts RFS Disclosure Note
An error was identified in the calculation of 2017/18 EAD discounts. This was identified as part of routine review of the notes to the published RFS.

Glossary and Footnotes List
Page 133
Glossary and Footnotes List

Glossary and Footnotes List
Page 134
Glossary20CN 20th Century Network
21CN 21st Century Network
ADSL Asymmetric Digital Subscriber Line
AG Activity Group
AMD Accounting Methodology Document. This sets out the detailed processes by which revenues and costs are attributed between the SMP Markets, Services and Residual activities.
Annual Report BT Group plc's Annual Report including the consolidated financial statements for the year ended 31 March 2019. These are available on the BT website at:
https://www.btplc.com/Sharesandperformance/Financialreportingandnews/Annualreportandreview/index.htm
ATM Asynchronous Transfer Mode
BB Broadband
BCMR Business Connectivity Market Review
BDUK Broadband Delivery UK
BES Backhaul Extension Services
BPS Business and Public Sector
BRAS Broadband Remote Access Server
CAT Competition Appeal Tribunal
CBD Central Business District
Cct Circuits
CCN Change Control Notification
CG Customer Group
CISBO Contemporary Interface Symmetric Broadband Origination
CLA Central London Area
Commitments The Commitments given to Ofcom and industry by BT on how Openreach will operate dated 10 March 2017.
Cost accounting A cost accounting system is a set of rules which supports the attribution of costs, revenues and mean capital employed to individual activities and services.
CoW Class of Work
CP Communication Provider
CPI Consumer Price Index
Current CostAccounting ("CCA") adjustments
The change to historical costs arising from the revaluation of assets on a current cost basis. In the statements for individual markets the adjustments comprise the holding gains or losses arising from changes in asset values, together with the effect on asset values and depreciation of the appropriate allocation of current cost asset values between markets and Wholesale services.
D Side Distribution Side
DDI Distributed Data Interface
DLE Digital Local Exchange
DSLAM Digital Subscriber Line Access Multiplexer
E Side Exchange Side
EAD Ethernet Access Direct
EBD Ethernet Backhaul Direct
EBITDA Earnings before Interest, Tax, Depreciation and Amortisation
ECC Excess Construction Charge
Eq Equipment Units
EOI Equivalence of Input
ePPCs Elemental Partial Private Circuits
ERDF European Regional Development Fund

Glossary and Footnotes List
Page 135
EVOTAM Evolution Test Access Matrix
FAC Fully Allocated Cost
FCM Financial Capital Maintenance
FND Fibre and Network Delivery
FTMR Fixed Telecoms Market Review
FTTC Fibre To The Cabinet
FTTP Fibre To The Premises
Gbps Gigabits per second
GEA Generic Ethernet Access
GRC Gross Replacement Cost
HCA Historical Cost Accounting
IAS International Accounting Standards
IASB International Accounting Standards Board
IBC Intra-Building Circuit
IC Interconnect Circuits
IEC Interconnection Extension Circuit
IFRS International Financial Reporting Standard
IP Internet Protocol
ISDN Integrated Services Digital Network
Kbps Kilobits Per Second
km Kilometres
LA Local Access
Le Local ends
LFME Local Network Service Module Equipment
Line No. of Lines
LLCC Leased Lines Charge Controls
LLU Local Loop Unbundling
LRIC Long Run Incremental Cost
m Metres
MDF Main Distribution Frame
Mean Capital Employed (MCE)
Mean capital employed is defined as total assets less current liabilities, excluding corporate taxes and dividends payable, and provisions other than those for deferred taxation. The mean is computed from the start and end values for the period.
Mbps Mega Bits Per Second
mm Millions of Minutes
MPF Metallic Path Facilities
MSAN Multi Service Access Node
MSL Minimum service level obligations
MSE Multi Service Edge
MVNO Mobile Virtual Network Operator
NMR Narrowband Market Review
n/a Not Applicable.
NGA Next Generation Access
NRC Net Replacement Costs
NTE Network Terminating Equipment
OCM Operating Capability Maintenance
Ofcom Office of Communications
OLO Other Licenced Operatiors
OLT Optical Line Terminals
OR Openreach

Glossary and Footnotes List
Page 136
PAC Previously Allocated Costs
PCO Principal Core Operations
PCP Primary Cross Connection Point
PDH Plesiochronous Digital Hierarchy
ppm Pence Per Minute
RAM Regulatory Accounting Methodology
RAP Regulatory Accounting Principles
RAV Regulatory Asset Valuation
RFS Regulatory Financial Statements
ROCE Return on Capital Employed
RoUK Rest of United Kingdom
RPI Retail Price Index
SDH Synchronous Digital Hierarchy
SFBB Super Fast Broadband
SG&A Selling, General and Administrative Expenses
SLG Service Level Guarantees
SML Service Maintenance Level
SMP Significant Market Power
SMPF Shared Metallic Path Facilities
SIP Session Initiation Protocol
TDM Time Division Multiplexing
TI Traditional Interface
TISBO Traditional Interface Symmetric Broadband Origination
TRC Time Related Charges
TUPE Transfer of Undertakings Protection of Employment
Use The proportional bandwidth use of each circuit
Usage Factors Usage Factors refer to the usage of any network component, including conveyance components.
VoIP Voice over Internet Protocol
VULA Virtual Unbundled Local Access
WACC Weighted Average Cost of Capital
WAV Wholesale and Ventures
WBA Wholesale Broadband Access
WBAMR Wholesale Broadband Access Market Review
WBC Wholesale Broadband Connect
WDM Wave Division Multiplexing
WES Wholesale Extension Services
WFAEL Wholesale Fixed Analogue Exchange Lines
WLA Wholesale Local Access
WLAMR Wholesale Local Access Market Review
WLR Wholesale Line Rental
0 A numerical value of between <£0.5m and >£(0.5)m
<1 A numerical value of below £1m
Glossary and Footnotes List
Page 137
Footnotes
(a) ppm = pence per minute; £/2Mbit cct = £ per 2 Mbps circuit; £/km = £ per kilometre; £/100m = £ per 100 metres; £/trans = £ per transaction; £/circuit = £ per circuit; £/ hostel rental = £ per hostel rental; % = % utilisation; £/line = £ per line; £/room = £ per room; £/cable = £ per cable; £/link = £ per link; £/eq = £ per equipment units; £/le = £ per local end; £/conn = £ per connection; £/channel = £ per channel; £/fibre km = £ per fibre km.
(b) See Section 2 - Basis of Preparation and Appendix 3 for explanation of restatement.
(sx) This service comprises a number of individual prices as indicated by the value of x.
(ux) This service comprises a number of individual volume types as indicated by the value of x.

Additional Information
Page 138
Additional Information

Additional Information
Page 139
Addditional InformationHard copy versions of the published RFS and the AMD can be obtained from:
Shareholder helpline
Tel: Freephone 0808 100 4141
Fax: 01903 833371
Textphone: Freephone 0800 169 6907
From outside the UK:
Tel: +44 121 415 7178
Fax: +44 1903 833371
Textphone: +44 121 415 7028
https://help.shareview.co.uk
The Registrar
Equiniti
Aspect House
Spencer Road
Lancing
West Sussex
BN99 6DA
United Kingdom
Website: www.equiniti.com
Electronic copies of the above documents are also available from the following website:
https://www.btplc.com/Thegroup/Policyandregulation/Governance/Financialstatements/index.htm