
Regulation of OTT: Merger Control and abuse of major ... · Merger Control and abuse of major...
15
Regulation of OTT: Merger Control and abuse of major communications platforms Roger Blackshaw
Transcript of Regulation of OTT: Merger Control and abuse of major ... · Merger Control and abuse of major...

Regulation of OTT:
Merger Control and abuse of major
communications platforms
Roger Blackshaw

2
The objective is to discuss whether there are competition concerns between OTT providers.
Objective
Regulation and OTTs
We know about OTTs and telecom regulation:
OTTs offer similar services to licensed telecommunications operators without any obligations.
OTTs “use up” telco bandwidth without investing.
OTTs test neutrality via ‘zero rating’ arrangements with operators.
BUT
Are there issues of dominance in the OTT sector that might require intervention from a competition point of view?
Is it true there are no barriers to entry to OTTs?
OTT market shares
Advertising revenue
Community effect

3
Overview
Evaluated are the three segments of OTT global consumer markets with regard to domination.
Which players are dominating this market?
Which geographical areas are dominating in terms of revenue?
What is the demographic distribution of top social platforms?
Which players are dominating this market?
Which geographical areas are dominating in terms of revenue?
Which players are dominating this market?
Which geographical areas are dominating in terms of revenue?
Is there a regional dominance of certain IP messaging players
Social
Networking
Sites
Voice over IP
(VoIP)
IP Messaging
4
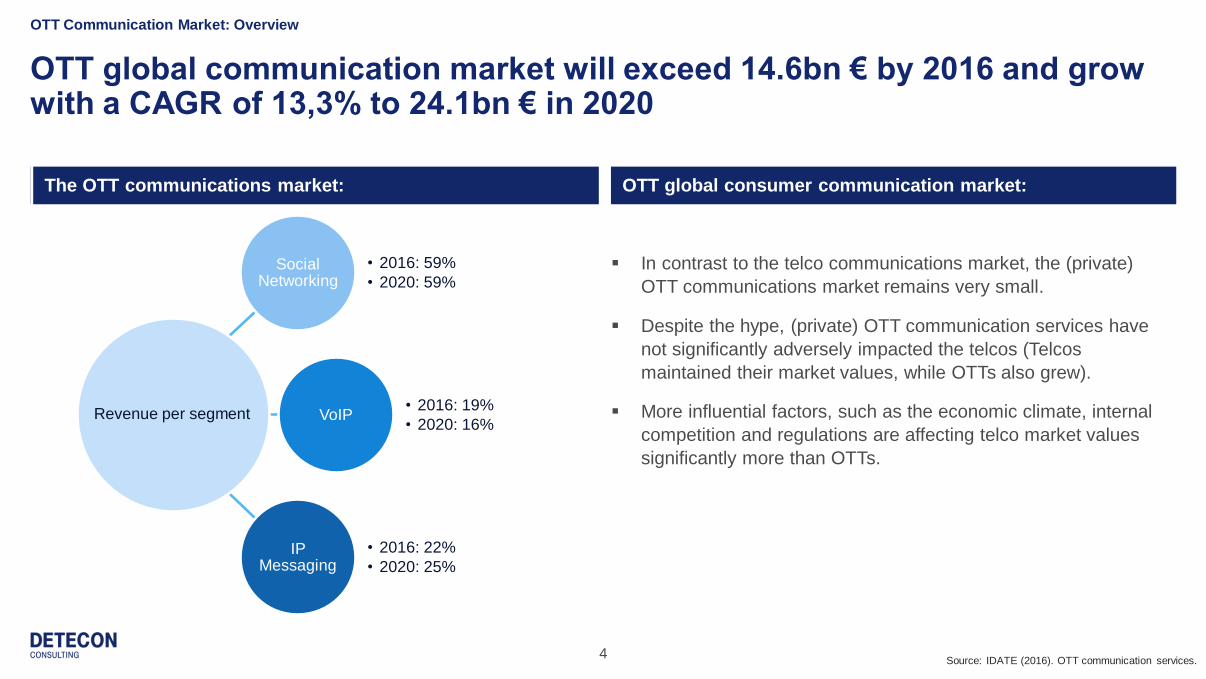
OTT global communication market will exceed 14.6bn € by 2016 and grow with a CAGR of 13,3% to 24.1bn € in 2020
OTT Communication Market: Overview
Heading always left-aligned OTT global consumer communication market:
Level 1
Level 2
Level 3
Level 4
In contrast to the telco communications market, the (private)
OTT communications market remains very small.
Despite the hype, (private) OTT communication services have
not significantly adversely impacted the telcos (Telcos
maintained their market values, while OTTs also grew).
More influential factors, such as the economic climate, internal
competition and regulations are affecting telco market values
significantly more than OTTs.
Social Networking
• 2016: 59%
• 2020: 59%
VoIP• 2016: 19%
• 2020: 16%
IP Messaging
• 2016: 22%
• 2020: 25%
Revenue per segment
Source: IDATE (2016). OTT communication services.
The OTT communications market:
5
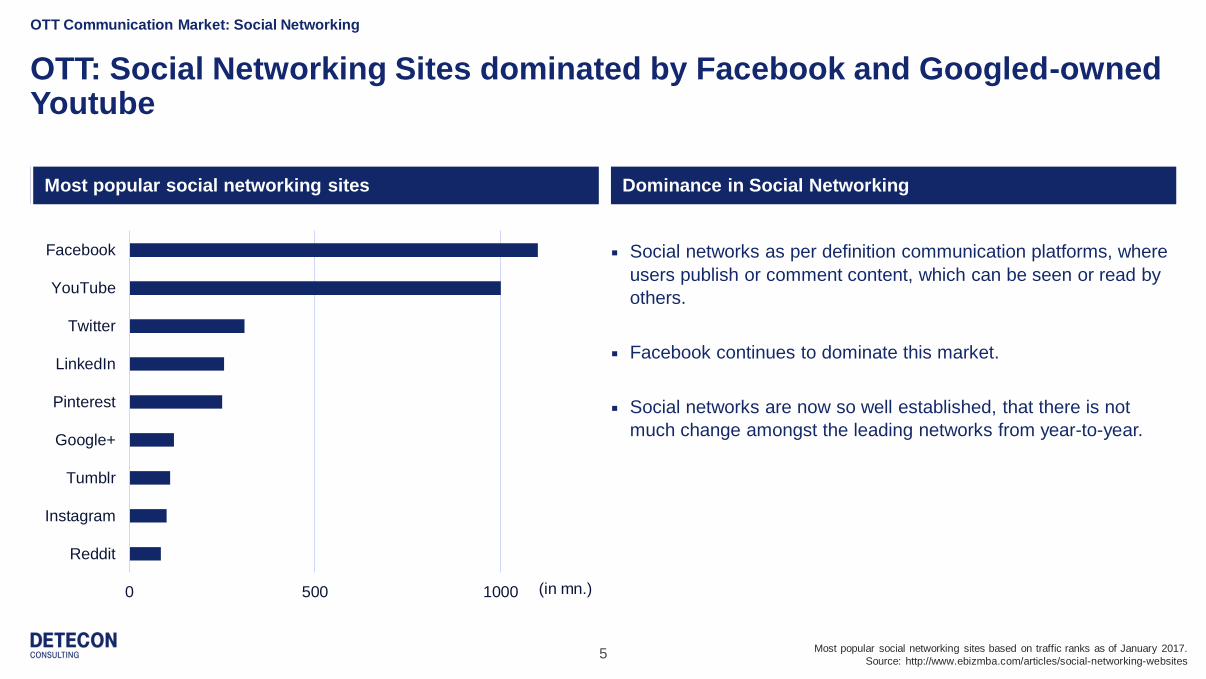
OTT: Social Networking Sites dominated by Facebook and Googled-owned Youtube
OTT Communication Market: Social Networking
Heading always left-aligned Dominance in Social Networking
Level 1
Level 2
Level 3
Level 4
Social networks as per definition communication platforms, where
users publish or comment content, which can be seen or read by
others.
Facebook continues to dominate this market.
Social networks are now so well established, that there is not
much change amongst the leading networks from year-to-year.
0 500 1000
Tumblr
Google+
YouTube
(in mn.)
Most popular social networking sites based on traffic ranks as of January 2017.
Source: http://www.ebizmba.com/articles/social-networking-websites
Most popular social networking sites

6
North America is expected to have highest social networking revenue.
OTT Communication Market: Social Networking
Level 1
Level 2
Level 3
Level 4
the social networking communication market (the part of social
networking advertising revenues which can be attributed to
communications) is the largerst of the three OTT communication
sub-markets.
North America leads with over half the total market. This is due to
the fact that the business model based on advertising revenues is
very strong, particularly in the US, and social networking
advertising revenues as a whole are thus strong in North America
Social networking communication market worldwide
0
2000
4000
6000
8000
10000
12000
14000
16000
2012 2013 2014 2015 2016 2017 2018 2019 2020
2012-2020 (Million EUR)
North America Europe APAC Rest of World
Source: IDATE (2016) - OTT communication services.

7
OTT: The days of Skype‘s dominance are over since new players enteredthe field of Free Calling Services.
OTT Communication Market: VoIP
Dominance in the VoIP market
Level 1
Level 2
Level 3
Level 4
The number of users on a service is an important parameter in
free calling - the more people there are the better are your
chances to communicate for free, because free VoIP
communication is offered only between users of the same
service.
Market used to be dominated by Skype (Microsoft), but IP
messaging players with larger communities are entering the
market and Whatsapp users are now making more than 100
million voice calls every day. (Skype does not make the number
of daily calls public)
48
100
215
249
300
697
853
900
1000
0 500 1000
Kakaotalk
Blackberry Messenger
LINE
Viber
Skype
QQ Mobile
Facebook Messenger
(in mn.)
Most popular global mobile messenger apps as of April 2016, based on number of monthly active users.
Source: https://www.statista.com/statistics/258749/most-popular-global-mobile-messenger-apps/
Most popular apps which offer voice communication

8
48
100
100
215
249
300
697
853
900
1000
0 500 1000
Kakaotalk
Telegram
Blackberry Messenger
LINE
Viber
Skype
QQ Mobile
Facebook Messenger
Most popular global mobile messenger apps
OTT: Leading Messenger Apps are Facebook-owned Whatsapp and theFacebook-Messenger itself.
OTT Communication Market: IP Messaging
Most popular global mobile messenger apps Dominance in the IP messaging market
For the telcos, SMS messaging, and to a lesser extent, MMS messaging,
formed an integral part of business.
WhatsApp has greater global reach than nearly any other mobile app,
dominant in India, South America and Africa where it was the first to offer
people a cheap way to communicate over the Internet
Though, most popular global mobile messenger apps vary a lot by level of
usage in different countries and demographics, as it can be seen in the
following slides.
(in mn.)
Most popular global mobile messenger apps as of April 2016, based on number of monthly active users.
Source: https://www.statista.com/statistics/258749/most-popular-global-mobile-messenger-apps/

9
Asia Pacific is expected to have highest IP messaging revenue.
OTT Communication Market: IP Messaging
Level 1
Level 2
Level 3
Level 4
APAC (in particular the Southeast Asian countries China/WeChat,
Japan/LINE and South Korea/Kakao Talk) is strong in IP
messaging, but only represents 22% of the overall OTT
communications market in 2016 (although this is expected to
increase slightly to 25% in 2022).
Strong revenues in APAC due to the differing business models
adopted: Large user base is used for monetization through
different means (such as paid stickers, advertising, paid games
or e-commerce).
OTT IP messaging market worldwide
0
1000
2000
3000
4000
5000
6000
7000
2012 2013 2014 2015 2016 2017 2018 2019 2020
2012-2020 (Million EUR)
North America Europe APAC Rest of World
Source: IDATE (2016). OTT communication services.

10
In messaging - Whatsapp as the world leader, though several countries dominated by other IP messaging services.
OTT Communication Market: IP Messaging
Heading always left-aligned
Level 1
Level 2
Level 3
Level 4
South Korea:
Kakao-Talk
installed on 93% of
all South-Korean
smartphones
WeChat has become
practically synonymous
with the smartphone in
China
Facebook Messenger
on 2nd place, claiming
49 countries
Viber shows strong
popularity in some Eastern
European and North
African countries
In Indonesia, the BBM is installed on 87.5% of all Android devices in
the country, far surpassing any other country in terms of BBM use.
WhatsApp is the
world leader claiming
109 countries, or
55.6% of the world.
WhatsApp’s
countries include
Brazil, Mexico,
India, Russia, and
many other countries
in South America,
Europe, Africa,
Asia, and Oceania.
Line dominates the
messaging market in
Japan, Taiwan and
Thailand. Instead of
competing with Facebook’s
Messenger and WhatsApp
in Europe and the U.S., the
Tokyo-based company has
set its sights, for now, on
emerging Asian markets
and the Middle East. It’s
tailoring its service to
countries like Malaysia and
Indonesia, where
smartphone adoption is still
under way.
The cloud-based mobile
and desktop messaging
App Telegram leads in
Uzbekistan & Iran
Source: https://www.similarweb.com/blog/worldwide-messaging-apps

11
Regional Dominance: Whatsapp and Facebook Messenger together leading in over 75% of all countries.
OTT Communication Market: IP Messaging
Most popular global mobile messenger apps Dominance in the IP messaging market
Of 187 countries that were examined, Whatsapp was the world leader
claiming 109 countries (55,6%)
Facebook’s messenger claiming 49 countries
Viber as the only other messaging app to claim 10 or more countries
Line, WeChat and Telegram are 3 other messaging apps claiming multiple
countries
(in mn.)
Whatsapp, 109
Facebook Messenger,
49
Viber, 15
Line, 4
WeChat, 3
Telegram, 2
KakaoTalk, 1
imo, 1Zalo, 1
BBM, 1ChatOn, 1
Others; 14
Source: https://www.similarweb.com/blog/worldwide-messaging-apps

12
Tumblr has the youngest, Facebook the second-oldest audience in terms of the age profile of its active users.
OTT Communication Market: Demographic distribution top social platforms
In terms of social networking motivations, 16-24s over-index the most for following celebrities, for the fear-of-missing-out and for
finding content. This helps to explain why Tumblr has the youngest audience of all the major networks, and why Pinterest has seen a
rise of 90% in active usage among 16-24s.
Motivation for the groups of 25-34 and 35-44 year old is largely promoting their work and networking for work
In contrast, 45-54s and 55-64s are ahead for using networks out of habit and because lots of their friends use them too. Hence
Facebook is the second-oldest network of all in terms of the age profile of its active users, and saw the smallest decrease in active
usage among the oldest age group.
Active users of the top social platforms and messaging tools, by age.
Source: Global WebIndex 2014

13
The dominance of Google & Facebook can also be seen in the digital ad area, where they control 57.6% of the market.
Lookout: The Digital Ad Market
The digital advertisement market. Dominance in the digital ad market.
Over the next couple years, digital advertising is expected to pass
television to become the largest ad market in existence
This does not mean a bright future for many publishers, since the digital
advertising is increasingly dominated by just two players
Close to $0.60 of every dollar spent on digital advertising goes to Google
and Facebook.
Growing market: Facebook grew its digital ad revenue by 59% in 2015.
In the digital advertising landscape, it’s all about the power of platforms.
The majority of the chart is loaded with companies that have created (or
bought) platforms full of user-generated content that people use every day.
Google, 41.0%
Facebook, 16.6%
Microsoft, 3.8%
Yahoo, 3.1%
Twitter, 1.9%
Verizon, 1.8%
Amazon, 1.3%
LinkedIn, 1.0%
IAC, 0.8%
Yelp, 0.8%
Snapchat;0.5%
Other, 27.4%
Source: http://www.visualcapitalist.com/dominance-google-and-facebook-one-chart/

14
In the largest market, the US, Netflix is clearly dominating the TV-related OTT services.
Lookout: OTTs in the TV market
Use of subscription video-on-demand services in the US OTTs in the TV market
Global OTT TV and video revenues (for 100 countries) will reach $64.78
billion in 2021; a massive increase from $4.47 billion in 2010 and $29.41
billion in 2015.
From the $35.37 billion extra revenues between 2015 and 2021, Asia
Pacific will contribute $12.65 billion, Western Europe $8.25 billion and
North America $9.00 billion.
The Global OTT TV & Video Forecasts report estimates that Latin
American revenues will nearly triple, with even greater growth expected in
Eastern Europe and the Middle East & Africa.
The US will remain the dominant territory for online TV and video revenues
– which will rise by $8.24 billion to $22.82 billion between 2015 and 2021.
China will add a further $6.24 billion, with its total revenues nearly
quintupling over the period to give it second place.
0 20 40 60 80 100 120 140
2016
2015
2014
2013
Netflix Amazon Prime Video
Hulu HBO NOW
Do not use any of these services
Source: Digiworld Research (Dec. 2016) – TV Broadcasters in the new OTT environment, and
Digital TV research (2016) – Global OTT TV and Video Forecasts.