REGULAR MEETING OF THE MONTANA BOARD OF INVESTMENTS...
229
The Board of Investments makes reasonable accommodations for any known disability that may interfere with a person’s ability to participate in public meetings. Persons needing an accommodation must notify the Board (call 444-0001 or write to P.O. Box 200126, Helena, Montana 59620) no later than three days prior to the meeting to allow adequate time to make needed arrangements. REGULAR MEETING OF THE MONTANA BOARD OF INVESTMENTS DEPARTMENT OF COMMERCE 2401 Colonial Drive, 3 rd Floor Helena, Montana February 23, 2016 AGENDA COMMITTEE MEETINGS A. Audit Committee 8:15 AM 1. Public Comment – Public Comment on issues with Committee Jurisdiction 2. Approval of November Committee Minutes 3. Status of 2015 Financials, Audit, and Legislative Audit Committee 4. Risk Assessment Plan and Internal Control Testing Schedule – Decision 5. FY 2016 Financial Compliance Audit 6. State Fund – Update 7. STIP a. STIP Resolution – Update b. STIP Management Change c. Internal Control Policy STIP Changes – Decisions i. Use of STIP Reserve ii. STIP Pricing to Web iii. Review Process of Participation Changes d. Investment Loss Charge to STIP Reserve 8. Additional Internal Controls Policy Changes (In-State Loan Checks; AIM Trade Process; External Managers; INTERCAP Wiring Document) – Decisions 9. 2016 Audit Checklist Review 10. Open Items – Update B. Human Resource Committee 9:15 AM 1. Public Comment – Public Comment on issues with Committee Jurisdiction 2. Executive Director – Comments C. Loan Committee 10:15 AM 1. Public Comment – Public Comment on issues with Committee Jurisdiction 2. Approval of November and December Committee Minutes 3. INTERCAP Loan Requests – Decisions 4. In-State Loan Program Requests – Kettlehouse Brewing Company, LLC – Decision a. VA Home Loan Policy Revision – Decision b. Commercial Loan Policy Revision – Decision 5. Purchase Coal Severance Tax Bond – DNRC – Decision BREAK 11:15 AM Tab 1 CALL TO ORDER – Mark Noennig, Chairman 11:30 AM A. Roll Call B. Notice of Video Recording C. Public Comment – Public Comment on issues with Board Jurisdiction D. Approval of the November 2015 Meeting Minutes – Decision E. Administrative Business 1. Audit Committee Report – Decision 2. Human Resource Committee Report 3. Loan Committee Report – Decision F. Comments from TRS and PERS Board Members G. Comments from Board Legislative Liaisons
Transcript of REGULAR MEETING OF THE MONTANA BOARD OF INVESTMENTS...

The Board of Investments makes reasonable accommodations for any known disability that may interfere with a person’s ability to participate in public meetings. Persons needing an accommodation must notify the Board (call 444-0001 or write to P.O. Box 200126, Helena, Montana 59620) no later than three days prior to the meeting to allow adequate time to make needed arrangements.
REGULAR MEETING OF THE MONTANA BOARD OF INVESTMENTS
DEPARTMENT OF COMMERCE 2401 Colonial Drive, 3rd Floor
Helena, Montana February 23, 2016
AGENDA
COMMITTEE MEETINGS
A. Audit Committee 8:15 AM 1. Public Comment – Public Comment on issues with Committee Jurisdiction 2. Approval of November Committee Minutes 3. Status of 2015 Financials, Audit, and Legislative Audit Committee 4. Risk Assessment Plan and Internal Control Testing Schedule – Decision 5. FY 2016 Financial Compliance Audit 6. State Fund – Update 7. STIP
a. STIP Resolution – Update b. STIP Management Change c. Internal Control Policy STIP Changes – Decisions
i. Use of STIP Reserve ii. STIP Pricing to Web iii. Review Process of Participation Changes
d. Investment Loss Charge to STIP Reserve 8. Additional Internal Controls Policy Changes (In-State Loan Checks; AIM Trade Process;
External Managers; INTERCAP Wiring Document) – Decisions 9. 2016 Audit Checklist Review 10. Open Items – Update
B. Human Resource Committee 9:15 AM
1. Public Comment – Public Comment on issues with Committee Jurisdiction 2. Executive Director – Comments
C. Loan Committee 10:15 AM
1. Public Comment – Public Comment on issues with Committee Jurisdiction 2. Approval of November and December Committee Minutes 3. INTERCAP Loan Requests – Decisions 4. In-State Loan Program Requests – Kettlehouse Brewing Company, LLC – Decision
a. VA Home Loan Policy Revision – Decision b. Commercial Loan Policy Revision – Decision
5. Purchase Coal Severance Tax Bond – DNRC – Decision BREAK 11:15 AM Tab 1 CALL TO ORDER – Mark Noennig, Chairman 11:30 AM
A. Roll Call B. Notice of Video Recording C. Public Comment – Public Comment on issues with Board Jurisdiction D. Approval of the November 2015 Meeting Minutes – Decision E. Administrative Business
1. Audit Committee Report – Decision 2. Human Resource Committee Report 3. Loan Committee Report – Decision
F. Comments from TRS and PERS Board Members G. Comments from Board Legislative Liaisons

The Board of Investments makes reasonable accommodations for any known disability that may interfere with a person’s ability to participate in public meetings. Persons needing an accommodation must notify the Board (call 444-0001 or write to P.O. Box 200126, Helena, Montana 59620) no later than three days prior to the meeting to allow adequate time to make needed arrangements.
LUNCH 12:00 PM Tab 2 EXECUTIVE DIRECTOR REPORTS – David Ewer 12:45 PM
A. Member Requests or Follow up from Prior Meeting B. Quarterly Cost Report C. Monthly Snapshot D. Ethics Policy E. FY 2015 Annual Report and Financial Statements – Update F. Emergency Preparedness and Disaster Recovery G. Staff Outreach Efforts H. STIP Participation Protocol and Charge to STIP reserve – Update
Tab 3 MONTANA LOAN PROGRAM REPORT – Herb Kulow, MCMB 1:00 PM Tab 4 INVESTMENT CONSULTANT – RVK, Inc. 1:15 PM
A. Executive Summary Report B. Capital Markets Review
Tab 5 INVESTMENT ACTIVITIES/REPORTS – Joe Cullen, CFA, CAIA, FRM 1:35 PM
A. Retirement System Asset Allocation Report B. Internally Managed Fixed Income Reports
1. Short-term (STIP) and Other Fixed Income Portfolios – John Romasko, CFA 2. Core Internal Bond Pool and Trust Fund Bond Pool – Nathan Sax, CFA 3. Below Investment Grade Holdings 4. Investment Policy Statement:
Montana University System Workers’ Compensation – Decision 5. State Fund Portfolio – Jon Putnam, CFA, FRM, CAIA
C. Public Markets Reports – Rande Muffick, CFA 1. Retirement Fund Bond Pool and Trust Fund Investment Pool 2. Domestic Equity (MDEP) 3. International Equity (MTIP)
D. Private Asset Pool Reports – Ethan Hurley, CAIA 1. Private Equity Pool (MPEP) 2. Real Estate Pool (MTRP) 3. Carried Interest - Update
BREAK 2:15 PM CONTINUE WITH Tab 5 INVESTMENT ACTIVITIES/REPORTS 2:30 PM Tab 6 PERFORMANCE REPORT – RVK, Inc. 3:45 PM Tab 7 INTERCAP PROGRAM OVERVIEW AND QUARTERLY REPORT – Louise Welsh 4:15 PM RECAP OF STAFF TO DO LIST AND ADJOURNMENT – Mark Noennig, Chairman 4:45 PM ADJOURNMENT 4:50 PM Appendix
A. Annual Board Meeting Schedule B. Systematic Work and Education Plan C. Acronym Index D. Terminology List E. Public Market Manager Evaluation Policy F. Educational Resources

Pending Approval February 23, 2016
MONTANA BOARD OF INVESTMENTS
DEPARTMENT OF COMMERCE 2401 Colonial Drive, 3rd Floor
Helena, Montana MINUTES OF THE MEETING – November 17-18, 2015
BOARD MEMBERS PRESENT:
Mark Noennig, Chairman Karl Englund, Vice Chairman
Kathy Bessette Terry Cohea
Quinton Nyman Jack Prothero Marilyn Ryan
Jon Satre Sheena Wilson
LEGISLATIVE LIAISONS PRESENT: Representative Kelly McCarthy
Senator Bob Keenan
STAFF PRESENT: Polly Boutin, Associate Financial Manager
Jason Brent, CFA, Alternative Investments Analyst
Geri Burton, Deputy Director Dana Chapman, Board Secretary
Richard Cooley, CFA, Portfolio Manager, Fixed Income/STIP
Frank Cornwell, CPA, Associate Financial Manager
Craig Coulter, Alternative Investments Analyst
Joseph M. Cullen, CFA, CAIA, FRM Chief Investment Officer
Roberta Diaz, Investment Accountant David Ewer, Executive Director
Julie Feldman, CPA, Financial Manager Julie Flynn, Bond Program Officer
Tim House, Equity Analyst/Investment Operations Chief
Ethan Hurley, CAIA, Portfolio Manager, Alternative Equities
Ed Kelly, Alternative Investments Analyst Teri Kolnik, CFA, Alternative Investments Analyst
Eron Krpan, CIPM, Investment Data Analyst Tammy Lindgren, Investment Accountant
April Madden, Investment Accountant Savannah McCormack, Administrative Assistant
Rande Muffick, CFA, Portfolio Manager, Public Equities
Mary Noack, Network Administrator Kelsey Poore, CPA, Investment Accountant
Jon Putnam, CFA, FRM, CAIA, Fixed Income Investment Analyst
John Romasko, CFA, Fixed Income Investment Analyst
Nathan Sax, CFA, Portfolio Manager, Fixed Income
Steve Strong, Equity Investment Analyst Louise Welsh, Senior Bond Program Officer
Maria Wise, Administrative Assistant Dan Zarling, CFA, Director of Research
GUESTS: Meg O’Leary, Executive Director, Department of Commerce
Becky Gratsinger, CFA, RVK, Inc. Mark Higgins, CFA, RVK, Inc.
Dore Schwinden, Executive Director, MPERA William Holahan, MPERA
Shawn Graham, Executive Director, TRS Herb Kulow, CMB, Portfolio Manager, In-State Loan Program (Contracted)
CALL TO ORDER Board Chairman Mark Noennig called the regular meeting of the Board of Investments (Board) to order at 12:45 PM. As noted above, a quorum of Board Members was present. Chairman Noennig advised video recording of the meeting was underway and called for public comment. There was none. Chairman Noennig called for comments or revisions to the August 18-19 Board Meeting Minutes.

Pending Approval February 23, 2016
2
Member Marilyn Ryan provided a correction on the TRS report on page 3 and Member Sheena Wilson provided a correction on the same page to the PERS report.
Member Ryan made a motion to accept the August 18-19, 2015 Board Meeting Minutes as revised. Member Jack Prothero seconded the motion. The motion carried.
Chairman Noennig called for comments or revisions to the October 6 Board Meeting Minutes. There were none.
Member Prothero made a motion to accept the October 6, 2015 Board Meeting Minutes as presented. Member Terry Cohea seconded the motion. The motion carried.
Introduction Executive Director David Ewer introduced and welcomed BOI’s new Chief Investment Officer, Joseph Cullen. Mr. Cullen has been on board two weeks. Chairman Noennig also welcomed Mr. Cullen and noted he has already met all Board members.
ADMINISTRATIVE BUSINESS Audit Committee Report The Audit Committee met prior to the Board meeting. Committee Chairman Jon Satre advised the Committee had several decision items. The first item was an update on the FY 2015 Financial Audit. The legislative auditors were on site in mid-October. Staff has received draft opinions, which have been tentatively approved with no audit recommendations. An optional exit conference with the auditors is planned for the first week of December, if it is deemed necessary. The Committee received a staff update on revisions to the Annual Report. Member Sheena Wilson assisted staff in developing the new format, which gives the Report a more modern feel. The Audit Committee is recommending the Board approve the draft Report and authorize staff to proceed with the changes, incorporating minor suggestions being coordinated with Member Wilson.
Audit Committee Chairman Satre made a motion to accept the Audit Committee’s recommendation to approve the new draft Annual Report. Member Sheena Wilson seconded the motion. The motion carried.
Chairman Satre reported the Committee reviewed the Consolidated Unified Investment Program Financial Statement highlighting changes recently made to address STIP reporting requirements for participation (by the pools only) and clarifications in the footnotes. Previous statements in the footnotes reflected BOI did not have certain policies in place addressing cash risk. Several related policies have been revised to disclose cash risks and the related “no policy exists” footnotes were removed from the financials. The Enterprise Fund financials also incorporated changes due to GASB 68 and GASB 71 reporting requirements.
Chairman Satre made a motion recommending Board approval of the financial statements as presented. Member Sheena Wilson seconded the motion. The motion carried.
Chairman Satre reported the Committee approved a minor change in the Governance Manual Securities Litigation Policy Appendix F, as presented in Director Ewer’s memo on securities litigation under Tab 3 in the Board packet. Staff is proposing the change to revise the frequency the executive director receive securities litigation reports from monthly to quarterly.
Chairman Satre made a motion to accept and implement the change in the Governance Manual, Appendix F. Member Sheena Wilson seconded the motion. The motion carried.

Pending Approval February 23, 2016
3
Chairman Satre stated the Audit Committee also considered and approved the proposed STIP Local Government Resolution and Participation requirements as detailed in Executive Director Ewer’s memo.
Chairman Satre stated the Committee is recommending approval by the full Board and made a motion for approval. Member Sheena Wilson seconded the motion. The motion carried.
Human Resource Committee Report The Human Resource Committee met prior to the Board meeting. Human Resource Committee Chairman Karl Englund stated the Committee reviewed and discussed evaluations of exempt staff; no actions were taken and no motions were required. Loan Committee Report The Loan Committee met prior to the Board meeting. Committee Chairman Jack Prothero reported the Committee considered two INTERCAP loans for approval. The Committee approved a loan for $1.54 million to the City of Great Falls for waste management vehicles; the loan will be in the form of a revenue bond. The Committee also considered a loan request, received annually, from the Montana Department of Transportation (MDT) for $3.3 million to finance vehicle purchases for the state motor pool. MDT is an ongoing relationship; the Committee approved the loan. Chairman Prothero stated the Committee considered the INTERCAP Bond Anticipation Note and Additional Bonds Resolution No. 235 and asked Ms. Louise Welsh to provide details to the Board. Ms. Welsh stated that Bond Program staff is requesting Board approval on a preliminary resolution for a new ~$10 million bond to be issued in 2017 during the annual remarketing period. Staff is also asking for approval to issue an $8.5 million Bond Anticipation Note (BAN) in the event funds need to be borrowed from the Board’s Coal Tax STIP fund. Two bond issues, 1997 and 1998 are both approaching maturity making it difficult to make long-term loans with these funds; thus they are of limited use to INTERCAP. The 1997 bond matures in 2017 and will be fully redeemed in 2016. The 1998 bond matures in 2018 and staff intends to partially redeem that bond in 2017. The move will save money and balance out program needs. Staff is requesting approval.
Committee Chairman Jack Prothero made a motion to approve the BAN and the issue of the additional bonds. Member Cohea seconded the motion. The motion carried.
Chairman Prothero stated the Committee approved a two-part In-State loan package, which requires full Board approval. The first part is a participation loan for $10 million to Consumer Direct Holdings, Inc. (Consumer Direct) and Consumer Direct Grant Creek Campus, LLC, in participation with the Bank of Montana, Missoula. The loan term is 20 years. The as yet to be built building will serve as loan collateral and the loan terms fall well within policy guidelines.
The Committee recommends full Board approval of the Consumer Direct loan package as presented by staff and Committee Chairman Prothero so moved. Member Kathy Bessette seconded the motion. Member Karl Englund advised that both Consumer Direct and the Bank of Montana are clients, and therefore he will abstain from the vote. The motion carried.
Chairman Prothero stated the second part of the loan is an infrastructure loan, requested by the City of Missoula for $2 million for a term of 20 years. The loan is part of the financial package for Consumer Direct for the purchase of the land for the building construction.
Chairman Prothero made a motion to approve the $2 million infrastructure loan to the City of Missoula. Member Terry Cohea seconded the motion. Member Englund noted he would again recuse himself from the vote. The motion carried.

Pending Approval February 23, 2016
4
Chairman Prothero noted loan requests are picking up and staff has been busy; next year should be an active year for the loan program. Public Employees’ Retirement System (PERS) and Teachers’ Retirement System (TRS) Updates PERS Representative Sheena Wilson had no comments. TRS Representative Marilyn Ryan noted Executive Director Shawn Graham would present the TRS Actuarial Report later in the agenda. Member Ryan reported she attended the TRS San Diego conference, which included some familiar faces. Representatives from TRS actuary Cavanaugh Macdonald Consulting, LLC were presenters at the conference. Legislative Liaisons Comments Senator Bob Keenan had no comments. Representative Kelly McCarthy detailed comments he shared with the Loan Committee regarding a recent conversation he had at an infrastructure meeting of area mayors held in Miles City. Comments were made expressing the sentiment that the state was not doing enough to assist the region financially. Representative McCarthy explained to the group all that is being done, and added the requests for free money submitted during the last legislature session were not granted. Representative McCarthy reported the state of state finances looks good. The legislative fiscal report is out and reveals that although there has been a downturn in oil and gas activity, the lack of revenue has not had an extreme impact. Additionally, the usual correlation shown between personal income tax wage reports and withholdings, which the Department of Revenue receives, shows withholdings are higher than originally anticipated. Revenue is $7 million above previous estimates, due in part to drawing dollars from 401K taxes.
RETIREMENT SYSTEMS ANNUAL PRESENTATIONS
Mr. Shawn Graham, Executive Director, Montana Teachers’ Retirement System (TRS) and Mr. Dore Schwinden, Executive Director, Montana Public Employee Retirement Administration (MPERA) Mr. Graham stated TRS is required to present the actuarial evaluation to BOI annually. Last legislative session included three bills that impacted TRS, including Senator Brown’s bill which required recording of board meetings, but none had an actuarial impact. Mr. Graham reviewed the basic retirement funding equation: contributions, plus investment income, minus distributions. The results of valuations for FY15 were not as strong as FY14 with 4.57% market asset return vs. the 7.75% actuarial assumption. Valuations are calculated using an actuarial smoothing over four years. The smoothed rate is 9.95% or 1.84% above the actuarial rate of 7.75%. Based on 2013 legislative changes, the funded rate is expected to increase. The GABA (Guaranteed Annual Benefit Adjustment) is 1.5% for employees hired prior to July 2013; however, GABA varies from 0.5% to a maximum of 1.5% for those hired after July 2013, depending on the funded status of the plan. Mr. Graham reviewed data for active vs. retired employees. The number of active employees has remained static since 2005 and the districts are not hiring more staff. Retirees have increased by 3.4% annually, averaged over 10 years, and the trend is holding. Last year the rate was 3.4%, or 0.8 retirees per active member. Ten years ago, there were 0.6 retirees per active member. In 2015, the average salary for all active members was $52,551. Retirees average income for 2015 was $21,667 and salaries increased by 1.5% while retiree benefits increased by 2.4%. Member Jon Satre asked what the average length of service is for employees.

Pending Approval February 23, 2016
5
Mr. Graham stated the average for current employees is 11.6 years of service and the average age for TRS employees is 45.6 years. The average years of service credit at retirement is 26, and 58 is the average retirement age. Representative McCarthy asked if the reason full time salaries remain flat is due to higher earners being replaced by lower earning employees, and if so, is that planned. Mr. Graham stated contributions are a percent of pay, so yes. Additionally, it is partly the result of the recession; from 2005 – 2010 salaries increased at a higher rate. The current trend of baby boomers retiring, with their many years of service, and the new entries into the job market have lower pay and consequently a lower rate going into retirement. Representative McCarthy asked with the GABA change effective after July 1, 2013, under the new law did the payroll contribution percent remain the same for new employees. Mr. Graham explained there is a two-tier system. For tier one employees the contribution rate is 8.15% and for tier two employees, the contribution is 7.15%, plus 1% depending on the funded status of the plan. The benefit status for both tiers remains the same. Mr. Graham noted the combined payroll vs. benefits trend remains relatively steady and even though the market rate of return for FY15 was 4.57%, amortization still occurs sooner. The unfunded accrued liability decreased from $1.793 billion to $1.741 billion and the funding rate increased from 65.45% to 67% and amortization decreased from 28 to 26 years. If all valuations hold true, the fund will be fully funded in 2041. Member Prothero asked how funding of Montana compares with other states. Mr. Graham stated the funded ratio and amortization period are not mutually exclusive. Montana is on track with most systems, due in part to several revisions in the systems. The push is to be 80% or more funded, and triggers in statutes rely on being 80% funded. TRS wants to get to 100%, and even ideally to 110% funded status. Across the country, 70% is about average. Member Cohea asked for an update on the request from the Colorado attorney for plan member names and benefit information. Mr. Graham stated at the last TRS board meeting the request was denied and the Colorado attorney who made the request was notified of the board’s decision. So far, the board has not received any further communication from the individual. The overwhelming response from members was that the privacy of members far outweighs the right to know and the board upheld the wishes of the members. If the request is revised and resubmitted, the board may consider providing the information. The board received a similar request in 2011 and the attorney general ruled the information as public, but the board voted the same way then, not to provide the information. That prior request for information did not ask for retiree names and TRS complied with the request. Mr. Dore Schwinden presented the MPERA 2015 actuarial report, stating that while MPERA is not compelled by law to provide the report, they do so annually. MPERA manages eight defined benefit programs. Mr. Schwinden reviewed the funding status and highlights of the 2015 valuation report. The valuation determines the amount of contributions needed to fund benefits and determines the funded status. The report is generated annually and provides year-to-year comparisons. In 2015, much like TRS, the plan saw a 4.5% investment market return with a 9–9.6% smoothed return. The plans increased by a total of over $7 billion. PERS, the largest fund, gained $85 million. Most funds are adequately funded and six of the eight amortize within 30 years. Generally, funded status increased and amortization periods were reduced.

Pending Approval February 23, 2016
6
Game Wardens funded status remained the same as a year ago at 84% and the system does not amortize; the system includes correctional officers and game wardens. No plan has been devised yet to fix the funding of the system and to amortize the system in under 30 years. MPERA has worked on the Sherriff’s plan and the system is 81-83% funded, but still does not amortize; however, steps are being taken to devise a fix and there is a tentative agreement in place for prospective funding. There is hope for legislation that will assist the amortization of the system. Member Englund asked if there is a solution. Mr. Schwinden stated an increase of employee and employer contributions, whether as a onetime injection or an ongoing basis would help; the system has not amortized for a number of legislative sessions. Member Englund asked is there anything the BOI Board could be doing more or less of working with MPERA, other than create returns. Mr. Schwinden stated the relationship with BOI is very good; lower fees are always positive, but it is not within MPERA’s control. BOI staff provides great service and wonderful expertise at the Board and legislative levels and it was a pleasure working with Mr. Cliff Sheets. Mr. Graham added TRS is looking forward to working with new CIO Mr. Joe Cullen, and an excellent relationship exists with Executive Director Ewer.
EXECUTIVE DIRECTOR’S REPORT Overall Comments Executive Director Ewer presented his Executive Director Reports, including the following items: • Requests from the prior Board Meeting - memo from Department of Commerce Chief Legal Counsel
Marty Tuttle detailing the procurement of outside legal services; authority for approval is designated solely to the Legal Services Review Committee by Executive Order 5-93.
• Quarterly cost report and the MBOI snapshot. There were no comments or questions.
• Resolutions – Certain Board resolutions are presented annually for Board review per the Governance Manual: o The Resolution 217 memo lists all changes of approved investment managers and lists new or
removed managers in the past year. Resolution 217 also lists any changes made regarding BOI staff authorized to conduct financial transactions with the investment managers;
o Resolution 218 is the delegation of authority in the absence of the Executive Director; and o Resolution 234 is the delegation of authority in the absence of the Chief Investment Officer.
• Financial Statements Update - the statements are provided and posted by December 31 of each
year; FY15 statements are nearly complete, pending a few minor changes. • Governor’s Letter of Public Participation - a reminder we work for the public, democracy is open and
transparent in Montana and is required by law and the constitution. • 2016 Board Meeting Calendar - Dates are nearly identical to 2015 and do not vary much from year to
year as meetings must be scheduled to allow reporting on quarterly work flow to the Board.
• 2016 Systematic Work and Education Plan - implemented over the last four years, the work plan draft for 2016 may be revised for items the CIO is responsible for now that new CIO Joe Cullen is on board. A review of all policies is conducted each April, and that will remain the same. Having a

Pending Approval February 23, 2016
7
structured work plan in place provides collateral benefit to the public. The plan includes a schedule showing all items before the Board at least once every 24 months; many items are before the Board annually per policy. The draft Work Plan is used by the Executive Director, in consultation with the Board Chairman, to set Board meeting agendas.
BENCHMARKING
Benchmarks as Currently Implemented by the Board – Mr. Eron Krpan, CIPM Mr. Eron Krpan presented an overview of benchmarking. Many managers claim to beat the market and benchmarks are used to measure manager performance. Benchmarks also dictate which assets are invested in, as well as identifying and evaluating risk exposure; for example, a large cap stock manager will not take risks similar to those of a small cap manager. MBOI uses benchmarks to appraise the performance of managers and custom benchmarks are used for the pension plans, the weighted averages for the pools, specified for each pool and reflective of the underlying assets in the pool. A relevant underlying index does not exist for private equity; MBOI uses the S&P 1500 + 4% to approximate the expected returns. The benchmark litmus test should reveal whether it provides an appropriate measure of performance against return and should be consistent with the style and expertise of a manager. It should also be reflective of current investment opinions, the underlying assets, and a benchmark cannot be retroactively applied. Using an invalid benchmark would be similar to measuring the skill of Tiger Woods as a bowler. To measure absolute return, or actuarial rate, one benchmark that meets criteria is an index; however, they are not available for all asset classes. A custom benchmark is appropriate when a manager’s style is not represented by a publicly available benchmark. Peer group benchmarks are not particularly valid due to differences in asset allocations and without knowledge of the underlying assets. Overall plan benchmarks are calculated on a monthly basis and the calculated weights match the weights in the pools. A manager can purposefully overweight or underweight an asset to try and time the market. The public equity pools do not deviate much from zero/excess return, whereas the private equity and bond pools do. It is important to understand why a pool is exceeding or falling short of its benchmark. The Montana Private Equity Pool (MPEP) benchmark has been discussed over time; however, the pool has provided excess return over 10 years, therefore as a rule, the benchmark is an accurate reflection of returns over time. The benchmark used for the Montana Domestic Equity Pool (MDEP) is the S&P 1500. The benchmark is investable through passive or ETFs, it is measurable daily and the BOI portfolio is relatively similar to the composition of the S&P 1500. BOI specifies benchmarks in advance when hiring managers. The Montana International Investment Pool (MTIP) is similar to MDEP in criteria. MTIP uses the MSCI ACW ex US benchmark which is unambiguous, technically investable, and can be approximated; therefore, it is measurable and appropriate. The benchmark is an all cap world index, minus the U.S. and is a very broad, investible market. The benchmark used for the Retirement Funds Bond Pool (RFBP) is the Barclays US Aggregate Bond Index. The index is technically investible, but due to size it is approximate. The index is measurable; however, it is important to note differences between the pool and the benchmark, including credit quality. The RFBP contains high yield assets, whereas the benchmark does not. The bond pool will behave slightly different, but is still accountable to the benchmark. Member Terry Cohea asked if it would be appropriate to have a benchmark containing 10% of high yield bonds.

Pending Approval February 23, 2016
8
Mr. Krpan stated it would be possible to use a customized benchmark and it may eliminate some tracking error; there are investment analytic products, which could make it easier. Mr. Nathan Sax added it would be possible to use a hybrid index which would be appropriate for a strategic allocation to High Yield. Executive Director Ewer added the Barclays universe has changed dramatically over time; before the Great Financial crisis (GFC) it contained a lot less U.S. treasuries, vs. 11 years ago. Currently BOI is not overweight in treasuries. The notion that if year over year the portfolio has potentially more yield because you have more high yield, it does not necessarily mean the benchmark should be changed. Theoretically, you want the same benchmark through the decades. Mutual funds close out funds and open new ones rather than change the benchmark. If an asset class always performs over or above the benchmark, it is important to understand how the measurement is working. Mr. Krpan stated within the RFBP, the benchmark meets the necessary criteria. Sector allocation, credit quality and yield curve placement all factor in over time. Mr. Krpan reviewed the Montana Real Estate Pool (MTRP) benchmark criteria. The NCREIF ODCE Index is unambiguous and is technically investable, which differs from the RFBP where funds are closed. It is measurable and appropriate, but will behave differently dependent on market cycle. Core real estate may vary due to timber holdings; it is still accountable to the benchmark, although the benchmark will have differences, based on attributes. The MPEP benchmark uses the S&P 1500 + 4% premium expected return. The 4% is not investible and the benchmark has a 90-day lag on return and it is influenced by the J curve effect and therefore will behave differently than equity. Over the short and midterm, the benchmark will not approximate return activity; however, over the long term it will be more reflective. It is a subjective benchmark. Executive Director Ewer added the annual CEM report does not use the BOI private equity benchmark. Member Prothero stated that over time, the Board has looked at the private equity benchmark and he would like to see the benchmark changed to the S&P 1500 plus 3.5% instead of 4%. Chairman Mark Noennig noted the intent of the private equity benchmark is to apply a premium on private assets to ensure the risks are worth the premium expected returns above the S&P 1500. If the premium is lowered to 350 or 375 basis points vs. 400, is it worth changing the benchmark for. Ms. Becky Gratsinger noted other funds do not look so much at returns vs. a benchmark, but rather at the internal rates of return. Most systems use equity returns plus a 300 to 500 return premium benchmark. The spread is under a lot of debate these days since the domestic equity market has done so well. In the last 10 years, the benchmark question has been raised regarding the target rate expected as compared with the requirement to tie up money over the long term. Member Prothero asked Ms. Gratsinger what she would recommend, if the private equity pool was starting from scratch. Ms. Gratsinger stated a good base would be the Russell 3000 index, but RVK would support using a benchmark with a slightly lower premium. Member Karl Englund asked what the advantages of setting a lower return premium would produce. Ms. Gratsinger stated it could decrease tracking error over the short term and may be worth looking into. She added there is no perfect solution, the return should be captured within the total fund, but the benchmark is hard to beat.

Pending Approval February 23, 2016
9
Member Prothero asked Mr. Hurley if he had an opinion to share with the Board on the private equity benchmark discussion. Mr. Hurley stated he expects to have a full discussion with new CIO Joe Cullen. Mr. Cullen stated benchmarks will be reviewed when asset allocation is reviewed in regards to managers and he recommends against taking a one-off look at one benchmark, but rather an overall look at all benchmarks in general. It is important to understand why BOI uses the benchmarks it does and whether they are appropriate. Any changes should be made for the long term, not changed and then risk having to make subsequent changes. Next year, as part of the asset allocation process, staff will conduct a comprehensive review. Executive Director Ewer commented it is sometimes acceptable to have provocative numbers; for 25 years, private equity has by far been the best performing asset for BOI. Director Ewer stated he supports a high bar, and it shows a commitment to private equity over the long term. The asset has different characteristics and private equity has been extremely beneficial to the portfolio. Representative Kelly McCarthy asked how accurate the valuation of private equity is; since they are private assets and the true value is unknown until you capitalize them. Director Ewer stated in the short term, asset value is the professional judgement of the general partner and there has been a lot of pressure recently on those general partners. Cash flows are demonstrable and the numbers look good. Member Satre stated he appreciated all the comments. The topic should be part of an overall discussion at some point and he added at each Board meeting there is discussion as to why private equity does not match its benchmark. Ms. Gratsinger added even if there was a change to the benchmark, the records will keep all prior periods, to accurately display past performance. A change would only affect performance going forward. Plan sponsors can go to world equity plus spread and it would make a bit of difference. However, you want to be sure there is accurate historical representation, and be aware of “moving the goal posts.” Mr. Krpan summarized it is important to keep in mind the differences between pools vs. their benchmarks. MDEP varies, private equities vs. public assets, STIP has slightly less risk than the benchmark. In context of the entire plan, BOI can afford to take risk that is mitigated on a plan wide basis due to correlations and diversification within pools. For plan vs. peer group, the numbers look phenomenal over time, but returns will go up and down. The CEM benchmarking study shows there are other ways of measuring plan performance and costs. Benchmarks From an RVK Perspective – Mark Higgins, CFA, RVK, Inc. Mr. Higgins presented the RVK perspective on benchmarks, stating it is a complimentary view to staff’s presentation. As a Board, the evaluation of benchmarks should be approached to ensure the objectives and duties of the Board are met. The Board sets a framework to prioritize performance monitoring for meetings. The different metrics of performance for an investment portfolio from a Board perspective should include close monitoring of the things you can control and the impacts analyzed. Some things, such as liquidity, can only be controlled to a certain degree. Strategic asset allocation is set each year and manager selection is mostly staff controlled. Investment fees are monitored effectively and asset class style biases, i.e. U.S. equity vs. small cap equity, are also reviewed; however, tactical allocation is not engaged in to any degree. Liquidity has an impact on performance and is monitored on a biennial basis. The frictional costs, those associated with market movement in different directions, are beyond your control. High priority items monitored by staff and Board include strategic allocation of the total fund vs. peers, while keeping in mind the biggest driver in performance differences is due to asset allocation; comparing

Pending Approval February 23, 2016
10
to peers is helpful. The risk-adjusted risk/return area is where you always want to perform better than your peers; better performance while taking on less risk. The annual CEM Benchmarking Report, produced over the past several years, provides information such as the benefit of internal management of the bond pool and the avoidance of hedge funds. Pacing analysis is also performed, the monitoring of distributions and contributions. Responding to a question from Member Prothero asking for areas needing improvement, Mr. Higgins noted a review of asset class style bias might be beneficial. Past benchmarks were more selective, but more general benchmarks are currently used. Performance reports are thorough, fees are monitored closely; these practices should continue. BOI does a solid job in general. Ms. Gratsinger added one option is to create a benchmark that mirrors the asset mix, using a target allocation vs. a system of ranges and using a total target allocation composite benchmark. Member Englund asked Ms. Gratsinger to explain the advantages. Ms. Gratsinger stated a target allocation measures the frictional effect and provides additional information and insight. Mr. Higgins added each asset class is assigned a target allocation, such as real estate, domestic equity, international equity, etc., and RVK is able to use the target to summarize fund performance for clients. It shows whether return is added or taken away vs. the target allocation. Ms. Gratsinger noted BOI uses a range system for flexibility. RVK is able to run additional analytics on a fund when a target allocation is used. Mr. Krpan added that CEM uses a target weight of the midpoint of ranges for calculations on its annual report analysis. Mr. Cullen stated the industry standard is mid-range, but it does not have to be and can vary depending on the asset. A target allocation would allow for more attribution data and may provide information which could affect long-term decisions. Mr. Higgins reviewed the benchmark matrix and important limits on allocations. For gross returns vs. other peer plans over $3 Billion, at least 30 plans are preferable for comparison; however, the other participants need to reflect a similar asset allocation to the Montana plan. RVK uses BNY Mellon, which contains over 30 institutions. There are still limits on return data and participants may vary quarter to quarter. Additionally, the maturity status of plans varies from plan to plan. For strategic asset allocation on a risk-adjusted basis, risk vs. return vs. peers, ideally you generate higher returns with less overall risk; doing well vs. peers on risk adjusted basis. The BOI portfolio underperformance vs. peers may be due to style bias; over time, the plan will have ebbs and flows of under and over performance vs. the benchmark. Overall, performance cannot be attributed only to managers. The portfolio’s lower allocation to developed and emerging markets, which have performed well, is partly responsible for portfolio underperformance. Mr. Higgins stated in terms of spending, BOI spends less than the median fund, and fees are very important to total return. BOI costs have been reduced due to higher allocations to passive assets and more efficient asset classes, the avoidance of fund of funds, and a low cost model for internally managed fixed income. Mr. Higgins reviewed liquidity analysis, and stated liquidity will become more important in the future and will require close monitoring. An analysis should be conducted every two years, which includes asset allocation and the commitment to private equity and real estate, as well as a forecast of plan contribution needs.

Pending Approval February 23, 2016
11
In summary, Mr. Higgins stated RVK encourages the Board to focus on evaluating the things within its control and to make appropriate decisions. Private equity continues to contribute absolute return and diversification; and it is good practice to continue reviewing benchmarks regularly.
MONTANA LOAN PROGRAMS In-State Loan Program Mr. Herb Kulow presented the Montana Loan Program Report. The outstanding commercial loan portfolio balance as of September 30, 2015 was $85,239,228 not including $560,000 of other real estate. There was $38,738,000 in outstanding reservations and $28,632,000 in commitments. Mr. Kulow reviewed the status of the Intermediary Relending Loan Program (IRP). The legislature allocated $5 million to local economic development entities to utilize as matching fund vehicles; entities can apply to USDA for matching funds. Currently there is $3.2 million available, however over $1 million of that amount has outstanding commitments, bringing the total of outstanding and unused commitments to $4.273 million, which means $727,084 remains available to economic development organizations. For the unused commitments, organizations can make loans to use with matching funds over three years, with a remaining term of 27 years; therefore, there is a low repayment rate to replenish the fund. There was an attempt to provide an additional allocation to the program during the last legislative session, which did not occur. Funding for the program is out of the Coal Tax Trust. Mr. Kulow presented a summary of the residential loan program. As of September 30, 2015 the balance was $8.7 million with three loans past due totaling $201,716. The portfolio yield at September 30 was 6.29%. Many borrowers are opting not to refinance due to short remaining terms or low outstanding loan balances. Mr. Kulow presented a summary of the Veterans Home Mortgage (VA) portfolio. The outstanding balance as of September 30, 2015 was $27,801,382 with 14 outstanding reservations totaling $2,486,360. One loan was 90 days past due; however, it was brought current in October. There is one loan under 90 days past due for $104,000. Member Cohea asked how the VA loan guarantee functions. Mr. Kulow stated there is a VA guarantee on loans; however, it is not 100% like FHA guarantees and depends on the veteran’s allocation. BOI policy requires that the allocation certificate is 100% and that the guarantee is not shared with any other parties. Mr. Kulow reported the average one-year return on the VA portfolio is 1.82% as of September 30. The total VA program allocation is $40 million as of July 1, 2015. Payoffs are generally received when a home is sold, although the VA does allow assumptions. However, so far there have been no requests to assume any of the loans.
BOND PROGRAM REPORTS Activity Report Ms. Welsh reviewed the quarterly Activity Summary Report as of September 30, 2015, and presented staff approved loans. Total loans outstanding were nearly $80 million and most loans are going towards construction. Among staff approved loans, there were five borrowers new to the INTERCAP Program; all school districts. DA Davidson referred a couple of the borrowers and one came from a conference Ms. Julie Flynn presented at. Being no further business for the day, the meeting adjourned at 3:54 p.m.

Pending Approval February 23, 2016
12
BOARD MEETING - DAY 2 CALL TO ORDER Board Chairman Mark Noennig called the regular meeting of the Board of Investments (Board) to order at 8:30 AM. As noted above, a quorum of Board Members was present. Chairman Noennig advised video recording of the meeting was underway. Chairman Noennig called for public comment. There was no public comment.
CONSULTANT REPORT
RVK, Inc. – Ms. Becky Gratsinger, CFA and Mr. Mark Higgins, CFA Ms. Gratsinger stated she would present the RVK quarterly performance report for the quarter ending September 30, 2015 and Mr. Higgins would present the executive summary. Mr. Higgins stated there is both good and bad news. The bad news is it was a difficult quarter in absolute return terms, particularly for international and domestic equity. Fixed income and private equity did not provide enough positive return to compensate, and although BOI has done much better than peers, the quarter still had a loss for the quarter. The major economic drivers include concerns over the weakening economy and bad economic indicators coming out of China, which prompted market reactions. China tried reducing rates as a stimulus and because it is the second largest world economy, is has a big impact. Commodities were down 14.5%, U.S. equity markets and developed markets were down and both the Russell 2000 and the S&P 500 were down. Another factor is market speculation on when the Federal Reserve (Fed) will increase rates. There were fears from investors approaching the last Fed meeting, but the Fed did right thing and did not raise rates. Speculation is running 50/50 as to if the Fed will raise rates in December, but even with positive numbers in the job market and moderate economic growth, things remain shaky. Mr. Higgins stated the outlook going forward calls for continued volatility as uncertainties continue, and the question of how much the Fed will raise rates, likely 25 basis points, so the market may be over reacting. For international markets, China remains a big uncertainty and it is still unknown how severe the slowdown is or will continue to be. At any rate, it will affect all markets. The BOI portfolio is well diversified which helped a lot over the quarter. The portfolio needs to evolve constantly and RVK is looking forward to working with new CIO, Joe Cullen. Ms. Gratsinger presented a summary of markets through September 30, and into October. Market conditions were difficult overall, although October was much more productive; year to date the S&P 500 was down but bounced back in October. The MSCI EAFE also bounced back, so results were more positive in October. Small caps are still down, as are emerging markets, and there is a lot of concern about commodities, which remain weak. Ms. Gratsinger stated interest rates have risen over the last quarter, which fixed income managers were not expecting. Reviewing economic indicators, unemployment is now down to 5% but wage growth is still being monitored. There is some inflation out in the market; U.S. government GDP is still fairly high. Market volatility will continue and relative to history, consumer confidence is moderate. Ms. Gratsinger reviewed asset class performance for the quarter. Portfolio diversifying classes such as real estate did well and returned 11.3% through September. Real estate returns are based on appraisals and income so are slower to react to market changes. BOI does not have direct commodity exposure where returns were down almost 15%. Responding to questions from Members Cohea and Satre, Ms. Gratsinger stated small caps tend not to be as reactive to market movement and can benefit from a low interest rate environment, and REITs are public, and so are more affected by a market sell off.

Pending Approval February 23, 2016
13
Ms. Gratsinger reviewed the retirement plans in aggregate, which now total $9.7 billion; PERS makes up $4.8 billion and TRS $3.5 billion. Asset allocation structure of the plans includes domestic and international equity at 54%; however, if you include private equity, total equity is 65%. Real estate is at 9% with the remaining balance in bonds and cash. Ms. Gratsinger stated the PERS net of fee return for the quarter was -3.75% vs. the benchmark at -3.92%. Returns for calendar year-to-date are also negative, but returns remain positive over 1, 3 and 5 years. Relative to the benchmark, performance slippage is driven largely by the private equity benchmark. Gross of fees, compared to other public pension plans over $3 billion, plan rankings have steadily improved year over year and in absolute returns, the plan ranks in the top decile over one year and in the top quartile for quarter and calendar year to date. Private equity has helped, as well as the overweight of domestic equity relative to other plans, and tremendous relative results overall. Ms. Gratsinger reviewed other plan factors and noted it is important to look at risk; it is not just about returns but the path you take to generate those returns, on a gross of fee and a risk/return basis; BOI is in the optimal quadrant. Total plan risk/return is favorable; higher returns, but not with more risk, and the plan is tracking right on top of the benchmark, a very good result. Reviewing the Sharpe ratio, which measures both elements together, BOI is ranked in the third percentile compared to 36 other plans with a five-year history. BOI also performs very favorable on risk/return vs. the benchmark; less volatility with more return, and beta is a little lower than other plans over 10 years. Excess return and downside risk all look good. Ms. Gratsinger reviewed the asset class performance for the investment pools, which totaled $14.1 billion as of September 30, 2015. The $3.7 billion Montana Domestic Equity Pool (MDEP) and the $2.2 billion Retirement Funds Bond Pool (RFBP) had a slight underperformance for the quarter. The performance of the asset class pools used for trust funds and retirement plans had a slight underperformance over the quarter. As plan passive holdings have been increased, the plan has become more aligned with the benchmark, and correspondingly, fees have come down. International equity looks good, although compared to peers is not as positive; however, relative to the benchmark since restructuring, performance is very good. The Trust Funds Investment Pool (TFIP) has done well and recent performance for the Montana Real Estate Pool (MTRP), for non-core, has beaten the benchmark. STIP continues with minimal yield in short duration securities. For private equity, which lags by a quarter, absolute numbers were very strong; although relative to beating the benchmark, equity plus 4%, it was a bit behind. The 10-year absolute return for private equity is 10.5%, compared to the 10-year return for equity markets at 6.6%. Reviewing peer rankings for asset classes, Ms. Gratsinger noted MDEP is just under the median, and ranking has improved as managers have changed and indexing has been added. For international equity, the ranking has not been as good. One reason is the peer group of funds over $3 billion contains more emerging markets, which has an impact. Global strategies are lumped into international, which is also a factor. Other peers have used managers who invest in developed in emerging markets; it is worth noting however, that peer ranking has a lot of noise. All asset classes have done well compared to the benchmarks, except private equity due to the benchmark, and compared to peers. Other classes really do provide diversification, the RFPB, MPEP and MTRP are not adding to equity beta. The reason private equity does not is due to private strategies, and they are only marked to market periodically. In theory, equity exposure includes private equity, but it does not add to equity volatility. Member Prothero asked Ms. Gratsinger if there were concerns about any individual manager. Ms. Gratsinger stated staff has made a lot of changes, including manager changes, and the watch list is a very short list these days compared to five years ago. A couple of managers remain on the watch list, but not all are due to performance concerns.

Pending Approval February 23, 2016
14
Member Englund stated although the international pool provides diversification, when considering factors like China, is it too uncertain. Ms. Gratsinger stated there are several factors involved. Relative prices for international vs. domestic U.S. have been cheaper, and consideration as to where we are in the Fed cycle is a factor; international markets saw the central bank take action. For the U.S. market, the Fed is in a tightening environment, whereas international markets are more poised and have reacted upon concerns in the market. If you are counting on future actions by the European Central Bank (ECB), the first bail out is always more impactful. Ms. Gratsinger added there is still validity in the global equity story and investments that are not U.S. based. Additionally, U.S. companies provide substantial global sales and the dollar has been strengthened as of late. The valuation of the U.S. dollar has an impact and instead of lowering international exposure, the question is should action be taken to hedge the dollar exposure. If so, RVK can provide the Board with education. Currency has a price, whether you guess right or wrong. Mr. Higgins added BOI has an overweight to U.S. equity compared to other plans, and the overweight has helped performance vs. peers, but international equity does provide diversification. It is a valuable diversifier even though it has not paid off over the past 10 years. Executive Director Ewer asked if the accepted conclusion is that foreign equities should outperform over time and grow faster than U.S. equities, and the theory is that stocks roughly track the economy, is the growth potential for international markets still expected to be higher. Mr. Higgins replied the underlying fundamentals when comparing U.S. and international regarding dividend yield, expected inflation, historical valuations and building blocks, is that international has higher expectations at this point. Over the next 20 to 30 years, both look attractive, but international still looks more favorable. Director Ewer noted while the theory is still valid, keeping a U.S. centric view has proven to be a shrewder strategy. Considering the ability to get work, lay off workers, patent laws and the engine for capital growth, no one protects capital better than the U.S. Peers with equal weights of domestic and international are underperforming. Ms. Gratsinger noted RVK also looks at the historical relation of pricing for when you enter into a market. The evaluation of expected return, over the next 10 years, is factored into markets. International has higher volatility over time, and emerging market exposure comes with currency issues. Some plan sponsors have pursued defensive hedges, an issue that is often discussed. Chairman Noennig asked Ms. Gratsinger what she thought interest rates will do and what the impact will be and if rates might be kept low until after the election regardless of market conditions. Ms. Gratsinger stated within the industry, the large fixed income shops, the general theme is lower rates for longer and any moves the Fed makes will be incremental. The political issue is a factor, although the Fed may make the first move to get it over with, maybe raise rates to 1% next year. Chairman Noennig asked if rates are raised, will the economy then be stimulated in other ways. Ms. Gratsinger stated the stimulative action has been to leave rates low; people are borrowing, spending money, and oil prices are low. The Fed has looked at the numbers, and seen a mixed picture. Unemployment has made progress, it is now under 5%, which is terrific, but wage growth has lagged, and the average consumer may not be realizing the benefits. Additionally, productivity numbers have fluctuated. For investors, if rates go up too fast it will be detrimental. It is unlikely the Fed will move rates up drastically; however, this continued low interest rate is not normal.

Pending Approval February 23, 2016
15
Mr. Higgins added the Fed has two mandates: full employment and keeping inflation under control. Right now, under normal circumstances, you would assume with low unemployment that inflation would be increasing, but the unemployment rate may be deceiving. Normally, inflation would prompt the raising of rates, however, inflation has not occurred and the economy is fragile, thus raising rates too quickly could be detrimental.
INVESTMENT ACTIVITIES/REPORTS Retirement System Asset Allocation Report Mr. Joe Cullen reviewed asset allocation and performance for the pension plans for the quarter ending September 30, 2015. At quarter end, the pension plans totaled $9.6 billion. Total change from the previous quarter is $402 million, a significant decrease of a 4% decline. The plans benefited from the diversification of asset classes, but still realized a significant decline. A portion, $25 million, was paid out for plan benefits, more than $20 million was added to domestic equity, $29 million to international; $1 million was taken out of the private equity pool, $5 million from real estate and $6 million from the bond pool for a net total of $37 million, which was funded out of STIP. Mr. Cullen reviewed peer comparisons as provided by State Street Bank as of September 30, 2015. The State Street universe varies from the RVK universe. The TRS and PERS plans are slightly overweight in fixed income, real estate and U.S. equity and slightly under for cash, international and private equity. Montana Private Equity Pool (MPEP) Mr. Ethan Hurley presented the Montana Private Equity Pool report for the quarter ending June 30, 2015. There were three commitments for private equity since the last meeting. Board briefs are included in the packet.
Fund Name Vintage Subclass Sector Amount Date Angeles Equity Partners I, LP 2015 Buyout Diversified $20M 5/1/15
Audax Private Equity V, LP 2015 Buyout Diversified $20M 9/18/15
Gridiron Capital Fund III, LP 2015 Buyout Diversified $20M 10/9/15
Member Prothero asked Mr. Hurley why he chose those three particular managers. Mr. Hurley stated Angeles is a low middle market buyout manager, co-founders Tim Meyer and Jordan Katz focus on deep value, carve-outs and underperforming companies. Mr. Hurley added while a lot of folks shy away from “I” funds, the partnership framework has been in place for years, and he concluded they work together well and the team has a good track record. Mr. Hurley checked credibility and spoke with lenders and CEOs who all gave high marks. The team has the ability to raise capital and closed on $120 million of a $300 million cap. Mr. Hurley added staff identified the major risks and was comfortable with them. Also, as a first time fund, BOI had some leverage and will pay 17.5% carry vs. 20%. Mr. Hurley noted Audax V was a re-up position with a very well established manager, which has performed well so far. They are a lower middle market buyout shop and have created what is referred to as a factory; they identify a platform company and train existing managers; they have good performance historically. They achieve multiple expansion on exit and have consistent performance overall. BOI has a 30% premium carry, and staff looked at multiples and the IRR level; the J curve is muted and the fee is lower at 1%. Member Satre asked as staff decided on these three managers, how many others were considered during the process. Mr. Hurley replied that for Audax and Gridiron III, staff was not comparing these managers against others. They were all known quantities; BOI has established relationships already and believe in conviction of relationships over time.

Pending Approval February 23, 2016
16
Member Cohea asked on the new manager, how were they selected and was staff looking for more than one manager. Mr. Hurley responded in the case of Angeles, staff was looking at other managers. In any given year, commitments are roughly a mix of 50% new and 50% established relationships. Angeles fit within the private equity strategic plan; however, staff also ran a full recommendation on another manager, which was not chosen. Member Englund asked Mr. Hurley if he had any concerns with the Audax co-CEO arrangement. Mr. Hurley stated no, staff knows them both well. Audax has a debt side and an equity side of the house and the two CEO’s founded the business together; and they have put a lot of their own money in. Mr. Hurley stated Gridiron is also a re-up manager, and staff expects they will continue to perform. Mr. Hurley presented the private equity report noting that cash flow ran negative for the quarter; the last time that occurred was the last quarter of 2014. Executive Director Ewer asked if the negative cash flow is due to funding commitments, and Mr. Hurley replied yes, correct. Mr. Hurley stated the portfolio by exposure is broadly diversified; buyouts are the largest exposure. The portfolio is highly diversified and geographic exposure remains highly North American centric, with no attempt to act globally; this should remain the case. By investment vehicle exposure, most investments are direct primary commitments and those will increase as fund of funds decrease over time. Fund of funds are pursued only in certain cases, such as Asia and venture capital. Representative Kelly McCarthy asked about determining market value for private equity and if there is any standard used, as evaluation of private equity seems a bit vague. Mr. Hurley stated historically GPs would hold assets at cost until they sold. Today there are accounting principles which employ three different tier methodologies as to how investments are valued. Regardless of the valuation methodology applied, true value remains unknown until the final transaction. Representative McCarthy observed it seems there are arbitrary valuations and an arbitrary benchmark. Mr. Hurley stated it is how the industry works, however there is an attempt to determine value. Executive Director Ewer stated the implied question is whether managers are misstating; however, there is no advantage for managers to misstate, rather, they are conservative in estimates. There are upcoming changes to GASB regulations regarding valuation of private equity. Ms. Julie Feldman added GASB 72 goes into effect June 30, 2016 regarding the method of classifying fair market value, such as the market for an asset, similar/like assets, and classifying fair market value. Staff has been working with State Street Bank, discussing which of three buckets BOI private assets will fall into. The financial footnotes will include an explanation of how the assets are classified. Member Englund asked Mr. Hurley if he agreed that general partners have no incentive to overstate value. Mr. Hurley replied generally, yes. During the marketing period is only time managers might overinflate, although ideally that is not the case. At any rate, staff spends the necessary time to vet managers and any manager who misrepresents would soon be out of business.
Pending Approval February 23, 2016
17
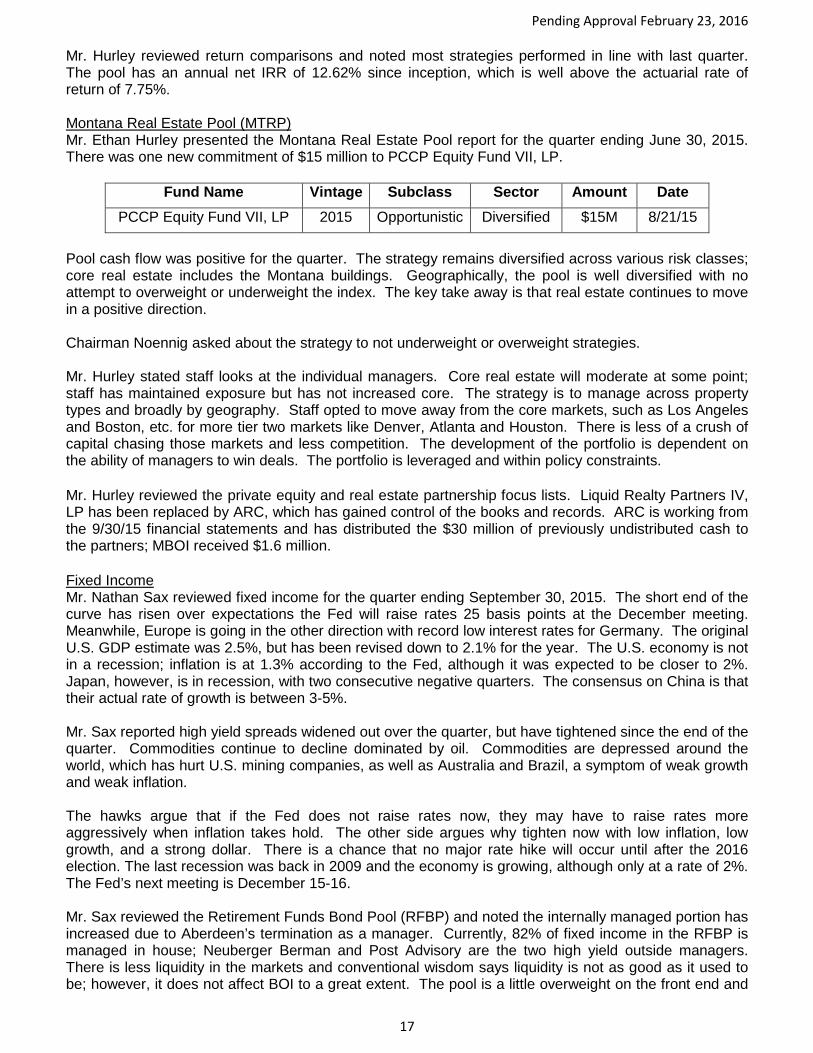
Mr. Hurley reviewed return comparisons and noted most strategies performed in line with last quarter. The pool has an annual net IRR of 12.62% since inception, which is well above the actuarial rate of return of 7.75%. Montana Real Estate Pool (MTRP) Mr. Ethan Hurley presented the Montana Real Estate Pool report for the quarter ending June 30, 2015. There was one new commitment of $15 million to PCCP Equity Fund VII, LP.
Fund Name Vintage Subclass Sector Amount Date PCCP Equity Fund VII, LP 2015 Opportunistic Diversified $15M 8/21/15
Pool cash flow was positive for the quarter. The strategy remains diversified across various risk classes; core real estate includes the Montana buildings. Geographically, the pool is well diversified with no attempt to overweight or underweight the index. The key take away is that real estate continues to move in a positive direction. Chairman Noennig asked about the strategy to not underweight or overweight strategies. Mr. Hurley stated staff looks at the individual managers. Core real estate will moderate at some point; staff has maintained exposure but has not increased core. The strategy is to manage across property types and broadly by geography. Staff opted to move away from the core markets, such as Los Angeles and Boston, etc. for more tier two markets like Denver, Atlanta and Houston. There is less of a crush of capital chasing those markets and less competition. The development of the portfolio is dependent on the ability of managers to win deals. The portfolio is leveraged and within policy constraints. Mr. Hurley reviewed the private equity and real estate partnership focus lists. Liquid Realty Partners IV, LP has been replaced by ARC, which has gained control of the books and records. ARC is working from the 9/30/15 financial statements and has distributed the $30 million of previously undistributed cash to the partners; MBOI received $1.6 million. Fixed Income Mr. Nathan Sax reviewed fixed income for the quarter ending September 30, 2015. The short end of the curve has risen over expectations the Fed will raise rates 25 basis points at the December meeting. Meanwhile, Europe is going in the other direction with record low interest rates for Germany. The original U.S. GDP estimate was 2.5%, but has been revised down to 2.1% for the year. The U.S. economy is not in a recession; inflation is at 1.3% according to the Fed, although it was expected to be closer to 2%. Japan, however, is in recession, with two consecutive negative quarters. The consensus on China is that their actual rate of growth is between 3-5%. Mr. Sax reported high yield spreads widened out over the quarter, but have tightened since the end of the quarter. Commodities continue to decline dominated by oil. Commodities are depressed around the world, which has hurt U.S. mining companies, as well as Australia and Brazil, a symptom of weak growth and weak inflation. The hawks argue that if the Fed does not raise rates now, they may have to raise rates more aggressively when inflation takes hold. The other side argues why tighten now with low inflation, low growth, and a strong dollar. There is a chance that no major rate hike will occur until after the 2016 election. The last recession was back in 2009 and the economy is growing, although only at a rate of 2%. The Fed’s next meeting is December 15-16. Mr. Sax reviewed the Retirement Funds Bond Pool (RFBP) and noted the internally managed portion has increased due to Aberdeen’s termination as a manager. Currently, 82% of fixed income in the RFBP is managed in house; Neuberger Berman and Post Advisory are the two high yield outside managers. There is less liquidity in the markets and conventional wisdom says liquidity is not as good as it used to be; however, it does not affect BOI to a great extent. The pool is a little overweight on the front end and

Pending Approval February 23, 2016
18
middle of the curve, and underweight treasuries and agencies and is tracking the index relatively closely; relative performance is good. Mr. Sax stated the Trust Funds Investment Pool (TFIP) performance has been similar to the RFBP. Neuberger Berman, a high yield manager, provided index-like performance; after fees performance has been mediocre. Post is ranked in the top decile for 1, 3 and 5 years; they are a bottom up manager and rely on internally generated information. Post has provided 427 basis points of alpha for the last five years and organizational stability has improved. Core real estate, at 7.3% is near the top of the range and has been a real additive to performance over the last year. The Core Internal Bond Pool (CIBP) has averaged 129 basis points per year over the benchmark for 7 years and ranks at the 5th percentile for one year and at 21st for 5 years. Mr. Sax stated there were two additions to the below investment grade holdings. Teck Resources Limited, a BB rated Canadian mining company specializing in tar sands development in Canada, has been affected by China making a lot less steel, and copper and zinc have been depressed. BOI has a $3 million investment in Teck. The other addition is Edgewell Personal Care, a spin off from Energizer. Edgewell will grow at a low rate; BOI has $10 million invested. Edgewell is trading at $102.35 and has not lost much market value. Fixed Income External Managers Watch List Mr. Sax reported there are no managers currently on the watch list. Aberdeen was terminated and Reams was removed from the list after steadily improving performance. Reams, a core plus manager, has come back strong. They ranked at the 73rd percentile for three years, averaging 152 basis points above the benchmark per year over 7 years. Member Satre asked if Reams is similar to the core internal fund. Mr. Sax replied no, they have more turnover and active trading, and got into trouble when they anticipated interest rates would increase, which did not happen. Member Englund asked about Talen Energy Supply, listed on the below investment grade report. Mr. Sax stated the status has not changed much; the book value is $17 million, market value is $15 million and they have a low BB rating. Member Englund asked if there was a change in price. Mr. John Romasko explained Talen, a spin off from PPL, did make a significant purchase for gas-fired generation. The price had only modest recovery, but over the long term, there is a reasonable expectation BOI will be made whole on the deal. Mr. Romasko added he does not believe Talen will be downgraded or upgraded. Short Term Investment Pool, State Fund Insurance & Treasurer’s Fund Report Mr. Rich Cooley gave an overview of the Treasurer’s Fund for the quarter ending September 30, 2015. The fund total is $833 million with $140 million in securities, including 1-3 year in governments and agencies to pick up additional yield; a 92 basis point pickup over STIP. Mr. Cooley reviewed STIP for the quarter and noted there was little movement in short term rates, as the Fed did not make a move on rates in September. The market expects an increase at the next Fed meeting in mid-December; however, November employment numbers may have an impact. The Fed could move 25 to 50 basis points, but there is still a chance they may not make a move until 2016. The yield curve is widening out a bit and LIBOR rates have moved up a bit in the last week or two.

Pending Approval February 23, 2016
19
STIP total was $2.22 billion, so down a bit from last quarter. The portfolio is well diversified and operating within policy. Purchases over the quarter included $25 million of floating rate agencies, $75 million of floating rate Yankee CDs and corporate notes and $25 million of fixed rate Yankee CDs. Average days to maturity is 48; policy maximum is 60 days. STIP net daily yield is 29 basis points, compared to the benchmark, the one-month LIBOR rate at 19 basis points. Member Satre asked if given the nature of the portfolio, with the frequent turnover of assets, if the same names are purchased. Mr. Cooley state, yes, generally for 30 – 60 day short term paper many of the same names are typically purchased. Trades are same day cash settlements with trades in the morning for commercial paper; Yankee CD settlements are longer, but the bulk of trading is cash trades. The STIP reserve fund impact accounts for 12 basis points of yield and the daily reserve amount added is $8,000. The residual SIV book value decreased by $1.44 million for the quarter and has paid down from $27.8 to $26.3 million compared to last quarter end. The reserve fund balance increased by $844,610 over the quarter, from $28.7 to $29.4 million. Member Cohea asked about the decrease in book value for the SIV’s. Mr. Cooley explained principal payments received on the SIV’s reduce the book value, and security gains from asset sales are also added into the reserve. Total impact to the STIP yield is 12 basis points. An example of a securities gain was on a GE holding. GE had a number of bond calls/options to switch into securities that offered attractive rates on a $30 million GE floater, which on a six month security offered 94 basis points providing a gain of $300,000. That gain was added into the reserve fund and will be reflected on next quarter’s data. Mr. Cooley reviewed the State Fund Insurance for the quarter ending September 30, 2015. The fixed income portion of the portfolio outperformed the benchmark by 12 basis points for the quarter and and 36 basis points for one year. The portfolio equity portion is 10.5%; the client preferred range is between 8-12%. Core real estate totals $86 million, or almost 6% of the portfolio. The total State Fund portfolio performance for one year at quarter end was 3.06% compared to the custom composite benchmark at 2.07%. Equity total return for domestic and international index funds combined was -1.89; total fixed income return was 3.14% and real estate was the star of the show at 13.3%. Over 10 years, the total fund return was 4.86%, compared to 4.17% for the Barclays Gov/Credit Intermediate benchmark, or 69 basis points of outperformance. Montana Domestic Equity Pool (MDEP) Mr. Rande Muffick reported on the Montana Domestic Equity Pool (MDEP) for the quarter ending September 30, 2015. Markets remained volatile over the quarter, although have mostly recovered in the current quarter. It is a nervous market; China is a concern, as are questions about pending Fed action. There was a correction in the third quarter, but a decent rally is underway this quarter. The market does correct when the Fed raises rates, usually about a 5% correction. Generally, the market realizes it is not a big deal, and markets come back and even out. At some point, the Fed will raise rates and markets will react. The Fed has been forecasting a raise in rates for so long there may not be the usual 5% correction. Equities can increase in value during a rising rate environment as long as inflation does not kick in. The Fed will take it slow and easy, some volatility is still expected. There was not much activity for MDEP over the quarter; however, staff did act to take advantage of corrections in the market and rather than wait until month-end or quarter-end to rebalance, staff

Pending Approval February 23, 2016
20
purchased S&P 500 ETF SPDRs when the market was oversold, to put some money to work. Over the long-term, staff did this five or six times, taking money out of cash with the mid-month buy. Chairman Noennig asked what indicates the market is oversold and is it just a matter of prices reacting to supply and demand. Mr. Muffick stated there are certain indicators, as seen on Bloomberg, a lot of selling activity and contrary indicators. When investors are all selling, it is a good opportunity to buy. A buy-in on an oversold day, putting money into the market and using the intraday moves in the market, is a tactical move. ETFs are liquid, whereas index funds need a one-day notice to trade on and the market can move in the meantime. Responding to a question from Member Cohea, Mr. Muffick stated ETF transactions cost two pennies per share. Mr. Muffick reported managers are doing well, although active management for the quarter for MDEP was disappointing. Large cap enhanced outperformed, but otherwise for active managers it was a tough quarter overall. Staff is still concerned with the mid cap style bucket, which has struggled for a while now and the portfolio is overweighted. Staff is a bit concerned with one manager in particular. Mid-cap growth stocks have suffered in particular. Staff will take a closer look at why BOI managers in particular are struggling. The JP Morgan 130/30 has added a lot of value; however, they hold a large portion at 8.54% of the portfolio, and they have struggled this fiscal year so far. If a manager has 8-9% of the portfolio and they underperform, it affects total fund performance. Mr. Eron Krpan has run an analysis and determined JP Morgan is one of the biggest risks in the portfolio overall. Mr. Muffick stated he is not concerned about JP Morgan over the long term. They have a bit higher beta than the benchmark, but the long-term numbers are good and they are sticking to their philosophy and style. Member Cohea asked about Iridian Asset management, which seems to have a concentrated position. Mr. Muffick answered Iridian is a mid-cap value manager, which compliments the other value manager Artisan. Iridian does run a concentrated portfolio, up to 5% in any given name/holding. They have done well, although have struggled a bit as of late, as with all mid-caps. MDEP continues overweight in small and mid-caps which is expected to remain the same; as is the active/passive mix. Portfolio exposure is in small and mid-caps, and underweight mega and giant caps. By economic sectors, the portfolio is well diversified, no over/under weight greater than 1.5%. Discretionary is the biggest overweight, but is still close to the benchmark. The portfolio is positioned slightly cyclical, but close to the benchmark for consumer discretionary. On a macro basis, China is slowing and retail will likely slow, causing concern. The oil price decline was supposed to be good for consumers; but there should be more consumer spending than we have seen. Montana International Equity Pool (MTIP) Mr. Muffick reported on the Montana International Equity Pool (MTIP) for the quarter ending September 30, 2015. International markets have mirrored domestic in some ways. International stocks experienced a sell off as well, and emerging markets suffered the most. MTIP activity for the quarter included the same type of purchases as for MDEP using iShares and MSCI EAFE ETFs for purchases of developed market stocks. International active managers performed better than domestic for the quarter. The only negative for the quarter was large cap growth where the two new managers struggled a bit. MTIP managers have MSCI ACWI mandates, which include emerging markets. The peer group comparisons do not include emerging markets, so when emerging markets do poorly, it is noticeably worse than developed markets. Consequently, MTIP managers have a tough time vs. peer group comparisons.

Pending Approval February 23, 2016
21
Executive Director Ewer asked if there is bifurcation between emerging and developed markets. Mr. Muffick stated with emerging markets, there is the growth factor potential; however, there is volatility and risk involved. Ideally, you want to pick up the growth in international markets, but there will be times of underperformance and it can vary widely. Member Cohea added small cap international does outperform over the long term. Mr. Muffick noted core growth and value have done well, and have added value to the portfolio. Mr. Muffick stated there are no plans to change the current strategy. The active/passive weight levels and small and mid-cap overweights will continue as is. Exposure by economic sector is well diversified and slightly cyclical; managers are favoring consumer discretionary. Public Equity External Manager Watch List Mr. Muffick reviewed the Public Equity External Manager Watch List. There are no changes since last quarter. New managers were hired for the international pool and others were terminated. Artisan remains on the list. Staff still has confidence in them; they are currently out of favor and do not perform as well in up markets. The long up market, as well as a few areas of stock selection have contributed to sagging performance. Long-term, the numbers still look good and they are sticking to their style. The second manager on the watch list, Alliance Bernstein, is a small cap upside capture manager and should be performing better. Some stock picks have worked against them; staff continues to monitor them closely.
PUBLIC EQUITIES MANAGER WATCH LIST November 2015
Manager Style Bucket Reason Invested amount ($mil) Inclusion Date
Artisan Domestic – MC Value Performance $119.8 November 2014
Alliance Bernstein Domestic – SC Growth Performance $32.9 February 2015
RECAP OF STAFF TO DO LIST AND ADJOURNMENT
Executive Director Ewer reviewed items on the “to do” list for the next Board meeting: 1. Mr. Hurley will include policy ranges in the quarterly reports. 2. Member Sheena Wilson will meet with staff to work on the Annual Report edits.
Being no further business before the Board, the meeting adjourned at 11:44 a.m. Next Meeting The next regular meeting of the Board will be February 23-24, 2016 in Helena, Montana. Complete copies of all reports presented to the Board are on file with the Board of Investments. BOARD OF INVESTMENTS APPROVE: Mark E. Noennig, Chairman ATTEST: David Ewer, Executive Director DATE: MBOI:drc 12/16/15
Return to Agenda

MEMORANDUM Montana Board of Investments Department of Commerce 2401 Colonial Drive, 3rd Floor Helena, MT 59601 (406) 444-0001 To: Members of the Board
From: David Ewer, Executive Director Date: February 23, 2016 Subject: Executive Director Reports
A. Member Requests or Follow up from Prior Meeting None.
B. Quarterly Cost Report – Included under Tab 2
C. Monthly Snapshot – Included under Tab 2
D. Ethics Policy – Included under Tab 2
E. FY 2015 Annual Report and Financial Statements – verbal update
F. Emergency Preparedness and Disaster Recovery – Included under Tab 2
G. Outreach Efforts – Included under Tab 2
H. STIP
a. Participation Protocol – verbal update b. STIP Investment Loss Charged to Reserve
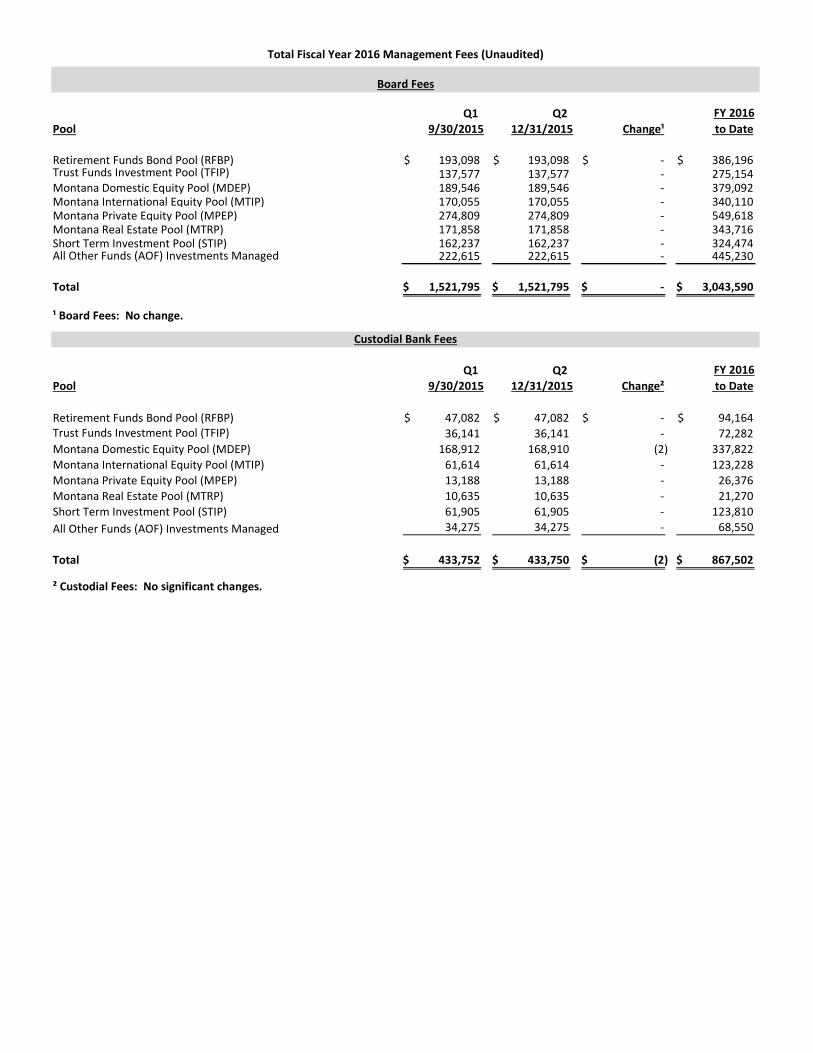
Q1 Q2 FY 2016Pool 9/30/2015 12/31/2015 Change¹ to Date
Retirement Funds Bond Pool (RFBP) 193,098$ 193,098$ -$ 386,196$ Trust Funds Investment Pool (TFIP) 137,577 137,577 - 275,154 Montana Domestic Equity Pool (MDEP) 189,546 189,546 - 379,092 Montana International Equity Pool (MTIP) 170,055 170,055 - 340,110 Montana Private Equity Pool (MPEP) 274,809 274,809 - 549,618 Montana Real Estate Pool (MTRP) 171,858 171,858 - 343,716 Short Term Investment Pool (STIP) 162,237 162,237 - 324,474 All Other Funds (AOF) Investments Managed 222,615 222,615 - 445,230
Total 1,521,795$ 1,521,795$ -$ 3,043,590$
Q1 Q2 FY 2016Pool 9/30/2015 12/31/2015 Change² to Date
Retirement Funds Bond Pool (RFBP) 47,082$ 47,082$ -$ 94,164$ Trust Funds Investment Pool (TFIP) 36,141 36,141 - 72,282 Montana Domestic Equity Pool (MDEP) 168,912 168,910 (2) 337,822 Montana International Equity Pool (MTIP) 61,614 61,614 - 123,228 Montana Private Equity Pool (MPEP) 13,188 13,188 - 26,376 Montana Real Estate Pool (MTRP) 10,635 10,635 - 21,270 Short Term Investment Pool (STIP) 61,905 61,905 - 123,810 All Other Funds (AOF) Investments Managed 34,275 34,275 - 68,550
Total 433,752$ 433,750$ (2)$ 867,502$
Total Fiscal Year 2016 Management Fees (Unaudited)
Board Fees
¹ Board Fees: No change.
Custodial Bank Fees
² Custodial Fees: No significant changes.

Q1 Q2 FY 2016Pool 9/30/2015 12/31/2015 Change³ to Date
Retirement Funds Bond Pool (RFBP) 349,816$ 293,258$ (56,558)$ 643,074$ Trust Funds Investment Pool (TFIP) 457,895 460,657 2,762 918,552 Montana Domestic Equity Pool (MDEP) 2,398,693 2,253,186 (145,507) 4,651,879 Montana International Equity Pool (MTIP) 942,766 875,165 (67,601) 1,817,931 Montana Private Equity Pool (MPEP) 3,446,800 3,834,017 387,217 7,280,817 Montana Real Estate Pool (MTRP) 1,101,050 1,299,035 197,985 2,400,085 Short Term Investment Pool (STIP) - - - - All Other Funds (AOF) Investments Managed 164,522 167,649 3,127 332,171
Total 8,861,542$ 9,182,967$ 321,425$ 18,044,509$
Q1 Q2 FY 2016Pool 9/30/2015 12/31/2015 Change to Date
Retirement Funds Bond Pool (RFBP) 589,996$ 533,438$ (56,558)$ 1,123,434$ Trust Funds Investment Pool (TFIP) 631,613 634,375 2,762 1,265,988 Montana Domestic Equity Pool (MDEP) 2,757,151 2,611,642 (145,509) 5,368,793 Montana International Equity Pool (MTIP) 1,174,435 1,106,834 (67,601) 2,281,269 Montana Private Equity Pool (MPEP) 3,734,797 4,122,014 387,217 7,856,811 Montana Real Estate Pool (MTRP) 1,283,543 1,481,528 197,985 2,765,071 Short Term Investment Pool (STIP) 224,142 224,142 - 448,284 All Other Funds (AOF) Investments Managed 421,412 424,539 3,127 845,951
Total 10,817,089$ 11,138,512$ 321,423$ 21,955,601$
AOF: No significant changes.Total Fees
³ RFBP: No significant changes.TFIP: No significant changes.MDEP: Fees are lower due to a decrease in the market values.MTIP: No significant changes.MPEP: Fees are higher due to unrecorded fees for the first quarter which were recorded fees for the second quarter. Because reportedfees are subject to a lag, they are inconsistent quarter to quarter. Therefore, quarterly fee comparisons are less meaningful.
MTRP: Fees are higher due to unrecorded fees for the first quarter which were recorded fees for the second quarter. Because reportedfees are subject to a lag, they are inconsistent quarter to quarter. Therefore, quarterly fee comparisons are less meaningful.
External Manager Fees
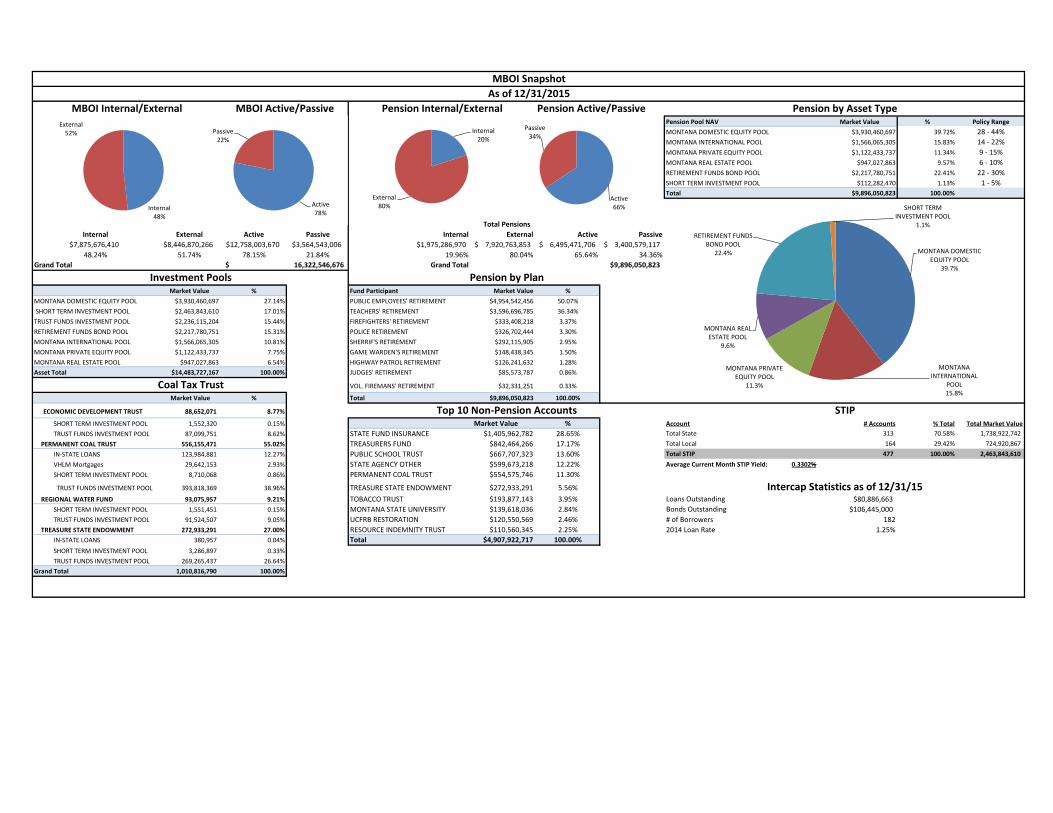
Pension Pool NAV Market Value % Policy Range
MONTANA DOMESTIC EQUITY POOL $3,930,460,697 39.72% 28 - 44%
MONTANA INTERNATIONAL POOL $1,566,065,305 15.83% 14 - 22%
MONTANA PRIVATE EQUITY POOL $1,122,433,737 11.34% 9 - 15%
MONTANA REAL ESTATE POOL $947,027,863 9.57% 6 - 10%
RETIREMENT FUNDS BOND POOL $2,217,780,751 22.41% 22 - 30%
SHORT TERM INVESTMENT POOL $112,282,470 1.13% 1 - 5%
Total $9,896,050,823 100.00%
Internal External Active Passive Internal External Active Passive
$7,875,676,410 $8,446,870,266 $12,758,003,670 $3,564,543,006 $1,975,286,970 7,920,763,853$ 6,495,471,706$ 3,400,579,117$
48.24% 51.74% 78.15% 21.84% 19.96% 80.04% 65.64% 34.36%
Grand Total Grand Total
Market Value % Fund Participant Market Value %
MONTANA DOMESTIC EQUITY POOL $3,930,460,697 27.14% PUBLIC EMPLOYEES' RETIREMENT $4,954,542,456 50.07%
SHORT TERM INVESTMENT POOL $2,463,843,610 17.01% TEACHERS' RETIREMENT $3,596,696,785 36.34%
TRUST FUNDS INVESTMENT POOL $2,236,115,204 15.44% FIREFIGHTERS' RETIREMENT $333,408,218 3.37%
RETIREMENT FUNDS BOND POOL $2,217,780,751 15.31% POLICE RETIREMENT $326,702,444 3.30%
MONTANA INTERNATIONAL POOL $1,566,065,305 10.81% SHERRIF'S RETIREMENT $292,115,905 2.95%
MONTANA PRIVATE EQUITY POOL $1,122,433,737 7.75% GAME WARDEN'S RETIREMENT $148,438,345 1.50%
MONTANA REAL ESTATE POOL $947,027,863 6.54% HIGHWAY PATROL RETIREMENT $126,241,632 1.28%
Asset Total $14,483,727,167 100.00% JUDGES' RETIREMENT $85,573,787 0.86%
VOL. FIREMANS' RETIREMENT $32,331,251 0.33%
Market Value % Total $9,896,050,823 100.00%
ECONOMIC DEVELOPMENT TRUST 88,652,071 8.77%
SHORT TERM INVESTMENT POOL 1,552,320 0.15% Market Value % Account # Accounts % Total Total Market Value
TRUST FUNDS INVESTMENT POOL 87,099,751 8.62% STATE FUND INSURANCE $1,405,962,782 28.65% Total State 313 70.58% 1,738,922,742
PERMANENT COAL TRUST 556,155,471 55.02% TREASURERS FUND $842,464,266 17.17% Total Local 164 29.42% 724,920,867
IN-STATE LOANS 123,984,881 12.27% PUBLIC SCHOOL TRUST $667,707,323 13.60% Total STIP 477 100.00% 2,463,843,610
VHLM Mortgages 29,642,153 2.93% STATE AGENCY OTHER $599,673,218 12.22% Average Current Month STIP Yield: 0.3302%
SHORT TERM INVESTMENT POOL 8,710,068 0.86% PERMANENT COAL TRUST $554,575,746 11.30%
TRUST FUNDS INVESTMENT POOL 393,818,369 38.96% TREASURE STATE ENDOWMENT $272,933,291 5.56%
REGIONAL WATER FUND 93,075,957 9.21% TOBACCO TRUST $193,877,143 3.95% Loans Outstanding $80,886,663
SHORT TERM INVESTMENT POOL 1,551,451 0.15% MONTANA STATE UNIVERSITY $139,618,036 2.84% Bonds Outstanding $106,445,000
TRUST FUNDS INVESTMENT POOL 91,524,507 9.05% UCFRB RESTORATION $120,550,569 2.46% # of Borrowers 182
TREASURE STATE ENDOWMENT 272,933,291 27.00% RESOURCE INDEMNITY TRUST $110,560,345 2.25% 2014 Loan Rate 1.25%
IN-STATE LOANS 380,957 0.04% Total $4,907,922,717 100.00%
SHORT TERM INVESTMENT POOL 3,286,897 0.33%
TRUST FUNDS INVESTMENT POOL 269,265,437 26.64%
Grand Total 1,010,816,790 100.00%
16,322,546,676$ $9,896,050,823
Top 10 Non-Pension Accounts STIP
MBOI Snapshot
As of 12/31/2015
Total Pensions
MBOI Active/PassiveMBOI Internal/External Pension Internal/External Pension Active/Passive Pension by Asset Type
Intercap Statistics as of 12/31/15
Investment Pools Pension by Plan
Coal Tax Trust
Active 66%
Passive 34%
Internal 48%
External 52%
Active 78%
Passive 22%
Internal 20%
External 80%
MONTANA DOMESTIC EQUITY POOL
39.7%
MONTANA INTERNATIONAL
POOL 15.8%
MONTANA PRIVATE EQUITY POOL
11.3%
MONTANA REAL ESTATE POOL
9.6%
RETIREMENT FUNDS BOND POOL
22.4%
SHORT TERM INVESTMENT POOL
1.1%

MONTANA BOARD OF INVESTMENTS 11 OF 41 GOVERNANCE MANUAL CODE OF ETHICS APPROVED 11/6/07 APPENDIX B
I. PURPOSE State law regarding the standards of conduct for public officers and employees defines both Montana Board of Investments (Board) members and staff as public employees and includes them within the state’s Code of Ethics (Ethics Code). The Board finds that the state Ethics Code is subject to differing interpretations and may not adequately address the fiduciary responsibilities of Board members and staff. Therefore, the Board adopts this Code of Ethics tailored specifically for its members and staff who have the fiduciary responsibility of managing billions of dollars in state and local government funds. The Board’s Code of Ethics, while derived from and conforming to state law, establishes standards for Board members and staff conduct that specifically relate to the Board’s responsibilities, mission, and potential for conflicts of interest. The state Ethics Code contains four major provisions that are applicable to the Board’s investment and operations activities.
• Monetary Provisions• Relationship Provisions• Time and Facilities Provisions• Dual Salary Provisions
II. STATE CODE OF ETHIC PROVISIONS1. Monetary Provisions - The state’s Ethics Code is found in Title 2, chapter 2, part 1, Montana CodeAnnotated. Legislative intent for the law is described in the statement of purpose:
Section 2-2-101. Statement of purpose. The purpose of this part is to set forth a code of ethics prohibiting conflict between public duty and private interest as required by the constitution of Montana. This code recognizes distinctions between legislators, other officers and employees of state government, and officers and employees of local government and prescribes some standards of conduct common to all categories and some standards of conduct adapted to each category. The provisions of this part recognize that some actions are conflicts per se between public duty and private interest while other actions may or may not pose such conflicts depending upon the surrounding circumstances.
The underlined language (emphasis added) reflects the remainder of the state Ethics Code in that it is rather ambiguous and subject to interpretation. The underlined language seems to imply that it is the circumstances surrounding the action that may be more important in determining conflict rather than the action itself. Generally, the state’s Ethics Code attempts to describe circumstances under which a public employee responsible for making material decisions impacting others may have a conflict of interest. The conflict could involve a personal or financial relationship with an existing or potential vendor/contractor/borrower or the receipt of a gift with monetary value from these entities if such a gift could influence an action favorable to the entity.
Section 2-2-104. A public officer, legislator, or public employee may not accept a gift of substantial value or a substantial economic benefit tantamount to a gift that would tend improperly to influence a reasonable person in the person's position to depart from the faithful and impartial discharge of the person's public duties or that the person knows or that a reasonable person in that position should know under the circumstances is primarily for the purpose of rewarding the person for official action taken.
The underlined language (emphasis added) prohibits a public employee from receiving a “gift of substantial value” if such a gift would influence the recipients official action (assumed to be an action relating to the gift giver). This section apparently does not prevent public employees not serving in a “decision making” role

MONTANA BOARD OF INVESTMENTS 12 OF 41 GOVERNANCE MANUAL CODE OF ETHICS APPROVED 11/6/07 APPENDIX B
from accepting gifts. Lending more ambiguity to this section is how a “gift of substantial value” is defined. Section 2-2-102(3) (a) describes a gift of substantial value as a gift with a value of $50.00 or more per individual unless the gift is not used and within 30 days of receipt is returned to the donor or donated to charity. The problem with this definition is there are no frequency limitations that might cap the cumulative effect of gifts over time, i.e. could one receive a $49.00 gift each day of the week and still not receive a “gift of substantial value?” In an extreme example, a person receiving a $49.00 gift every day of the year would have received gifts totaling $17,885 but would have never crossed the $50.00 substantial value threshold. Another potential problem is how the recipient would know the value of the gift without a pricing source. A pen for example, could be nothing more than an advertising prop or could be worth well over $50.00 dollars.
While the preceding discussion highlights the ambiguities and “subject to interpretation” provisions in the state Ethics Code, another section of state law is more on target as it relates to public employees who serve in material decision-making capacities. These provisions are found in Title 45 “Crimes” with a short title of "Criminal Code of 1973.”
Section 45-7-104 (2) “No public servant having any discretionary function to perform in connection with contracts, purchases, payments, claims, or other pecuniary transactions of the government shall solicit, accept, or agree to accept any pecuniary benefit from any person known to be interested in or likely to become interested in any such contract, purchase, payment, claim, or transaction.”
This provision is very blunt and to the point but is tempered somewhat later in subsection (5) (b):
“This section shall not apply to trivial benefits incidental to personal, professional, or business contacts and involving no substantial risk of undermining official impartiality.”
Discretionary function is not defined here but a definition in the state Ethics Code likely describes the type of discretion referred to here. Section 2-2-102(5) states:
"Official act" or "official action" means a vote, decision, recommendation, approval, disapproval, or other action, including inaction, that involves the use of discretionary authority.
The above provisions would seem to prevent any Board member or staff who has any responsibility for scoring/selecting investment vendors and contractors, or recommending/approving loans from receiving any type of monetary benefit from current or potential vendors, contractors, or borrowers unless the benefit is “trivial” which is subject to interpretation. While “pecuniary” is not defined here, the dictionary describes it as “consisting of or measured in money” and in Section 45-2-101(56) is defined as “benefit in the form of money, property, commercial interest, or anything else the primary significance of which is economic gain.”
2. Relationship Provisions – The state Ethics Code prohibits certain types of relationships that mayimproperly interfere with a public employee’s partiality.
Section 2-2-105, MCA (1) The requirements in this section are intended as rules of conduct, and violations constitute a breach of the public trust and public duty of office or employment in state or local government. (2) Except as provided in subsection (4), a public officer or public employee may not acquire an interest in any business or undertaking that the officer or employee has reason to believe may be directly and substantially affected to its economic benefit by official action to be taken by the officer's or employee's agency. *

MONTANA BOARD OF INVESTMENTS 13 OF 41 GOVERNANCE MANUAL CODE OF ETHICS APPROVED 11/6/07 APPENDIX B
(4) When a public employee who is a member of a quasi-judicial board or commission or of a board, commission, or committee with rulemaking authority is required to take official action on a matter as to which the public employee has a conflict created by a personal or private interest that would directly give rise to an appearance of impropriety as to the public employee's influence, benefit, or detriment in regard to the matter, the public employee shall disclose the interest creating the conflict prior to participating in the official action. (5) A public officer or public employee may not perform an official act directly and substantially affecting a business or other undertaking to its economic detriment when the officer or employee has a substantial personal interest in a competing firm or undertaking. *(3) Has been excluded because it is not immediately relevant.
This provision relates directly to the official duties of Board members and staff who are involved in the decision making process. Subsection (2) prevents a public employee from acquiring a personal or financial interest in an entity that they believe could benefit from future action the public employee may take. Examples would be a Board member or staff taking a financial interest in a business that had a loan request pending upon which the Board member or staff would ultimately act. Subsection (5) is the reverse situation in which a public employee has a financial or personal interest in a business that is a direct competitor of a business with a pending loan request before the Board. The competing interest of the Board member or staff could color the ultimate decision. Subsection (4) is specifically aimed at quasi-judicial Board members, such as the Board. It recognizes that lay board members have day-to-day business interests some of which may come before them in their official capacity as board members. Specific examples of this would be board members who are bank officials or employees when loan requests submitted by their bank are considered by the Board.
3. Time and Facilities Provisions – The state Ethics Code prohibits public employees fromconducting private business on state time or facilities.
Section 2-2-121 (2) A public officer or a public employee may not: (a) subject to subsection (7), use public time, facilities, equipment, supplies, personnel, or funds for the officer's or employee's private business purposes
This provision prohibits public employees from using state time, facilities, etc. to conduct private business. Private business is not defined here but would likely mean conducting some type of business generating revenue rather than sending an occasional personal e-mail or making a personal phone call. This interpretation of private business is further reinforced by the reference to subsection (7) which states:
A listing by a public officer or a public employee in the electronic directory provided for in 30-17-101 of any product created outside of work in a public agency is not in violation of subsection (2)(a) of this section. The public officer or public employee may not make arrangements for the listing in the electronic directory during work hours.
This language implies that the reference to private business is in fact a bona fide business that produces a product for sale that may be listed in the “Made in Montana” electronic directory provided by the Department of Commerce.
4. Dual Salaries Provisions – The Ethics Code prohibits public employees from drawing two salariesfrom public agencies for the same period of time.

MONTANA BOARD OF INVESTMENTS 14 OF 41 GOVERNANCE MANUAL CODE OF ETHICS APPROVED 11/6/07 APPENDIX B
Section 2-2-104(3)(a) Except as provided in subsection (3)(b), a public officer, legislator, or public employee may not receive salaries from two separate public employment positions that overlap for the hours being compensated, unless: the public officer, legislator, or public employee reimburses the public entity from which the employee is absent for the salary paid for performing the function from which the officer, legislator, or employee is absent; or the public officer's, legislator's, or public employee's salary from one employer is reduced by the amount of salary received from the other public employer in order to avoid duplicate compensation for the overlapping hours.
This provision prohibits a Board member who is also a public employee from receiving compensation from both sources for the same period of time. For example, if a Board member spent two days away from a public employee job to attend Board meetings and was a salaried employee who remained on a public payroll during the period, he/she could not receive per diem for attending the Board meeting. However, as clarified later in the state Ethics Code if the Board member was an hourly employee who took accrued leave or compensation time to attend the meeting he/she would be eligible for per diem for Board attendance.
This provision is reinforced in the law that governs quasi-judicial Boards:
2-15-124 (7) Unless otherwise provided by law, each member is entitled to be paid $50 for each day in which he is actually and necessarily engaged in the performance of board duties, and he is also entitled to be reimbursed for travel expenses, as provided for in 2-18-501 through 2-18-503, incurred while in the performance of board duties. Members who are full-time salaried officers or employees of this state or of a political subdivision of this state are not entitled to be compensated for their service as members except when they perform their board duties outside their regular working hours or during time charged against their annual leave, but such members are entitled to be reimbursed for travel expenses as provided for in 2-18-501 through 2-18-503. Ex officio board members may not receive compensation but shall receive travel expenses.
III. RATIONALE FOR A BOARD OF INVESTMENTS CODE OF ETHICSThe Board’s composition does not lend itself to the “pay to play” problems that have been discovered in other investment Boards. There are no elected officials on the Board as voting members nor do any elected officials exert any influence on the Board’s decision making process. Therefore campaign contributions to any Montana elected official will have no impact on the Board’s decision to hire or fire an investment vendor, make or deny a loan, or to conduct business with a political contributor.
Perhaps the greatest potential for conflicts of interest of Board members and staff is with private investment vendor relationships. The Board’s mission requires it to have numerous relationships with these vendors; including investment managers, investment brokers, investment consultants, investment and custodian banks, and commercial banks. Vendors selected by the Board to provide these services will receive millions in fees during the contract period. Therefore, the process for establishing and terminating these relationships must be based on well established protocol. When existing and potential vendors provide any type of financial benefits to persons who are ultimately responsible for selecting and maintaining these relationships a potential conflict could exist.
The type of “financial benefit” does not have to be direct to create a potential conflict of interest. There are firms in the investment business who sponsor conferences couched as educational in nature but are in fact a not so subtle attempt to get “buyers” and “sellers” of services (vendors) in the same place at the same time. Generally, the service “buyers”, such as the Board are provided a host of “free” amenities to attend and mix with potential vendors. Basically, it is the vendors paying for the amenities provided free to the buyers.
MONTANA BOARD OF INVESTMENTS 15 OF 41 GOVERNANCE MANUAL CODE OF ETHICS APPROVED 11/6/07 APPENDIX B
While it is difficult to put a dollar value on these amenities, the cost to the vendors of providing free services to potential buyers is a “gift equivalent.”
This restriction does not apply to meals/beverages provided at investor conferences held by General Partners in which the Board is a Limited Partner. This is the only opportunity Board Members/staff have to meet and interact with other Limited Partners and hear the General Partner discuss the strategy and progress of the fund. Because of the significant number of Limited Partners in the larger General Partnerships, the General Partners do not usually visit the Limited Partners individually but rather host periodic investor meetings.
The second greatest potential for conflict of interest involves the Board’s economic development role. The Board manages several loan programs that lend Coal Tax Trust funds to hundreds of Montana borrowers. If Board members or staff in the “decision making loop” have personal or financial relationships with local lenders or borrowers whose loans are pending, serious conflicts could occur.
Also, Board employees are unique in state government because many of them have state-provided access to financial research tools and information that could benefit them when investing a personal portfolio. While research information obtained by staff in the course of normal job duties may provide incidental knowledge and benefit to the management of a personal portfolio, state time and facilities must not be used for personal enrichment. Personal security trading must not be conducted on state time/facilities nor should staff conduct any type of business enterprise on state time and facilities.
The Board adopts the following Code of Ethics (Code) for its members and staff to: ensure that the conduct of members and staff conform to state law, that potential conflicts of interest are reduced or eliminated and; that the Board’s fiduciary reputation is not damaged in perception or in fact. All Board members and staff shall sign the Code annually and all new members and staff shall sign when appointed or hired. By signing the Code, each Board member and staff pledges to the best of his/her ability to comply with all provisions of the Code.
IV. BOARD OF INVESTMENTS CODE OF ETHICS PROVISIONS1. Monetary Provisions
A) Board members/staff shall not attend conferences if any of the actual costs to the Board ofattending such conferences are subsidized by current or potential investment vendors. However, Board members/staff may attend if the Board pays the actual cost for such attendance. If the conference is truly educational and otherwise worthwhile Board funds should be used to cover costs for member/staff attendance. These costs would include transportation, lodging, meals, and reasonable registration fees.
This restriction does not apply to meals/beverages provided at investor conferences held by General Partners in which the Board is a Limited Partner as this is usually the only opportunity Board Members/staff have to meet and interact with other Limited Partners and hear the General Partner discuss the strategy and progress of the fund. B) A gift from current or potential vendors sent to a Board member/staff at the member’s or staff’shome or at the Board’s office shall be donated to charity if the perceived value of the gift exceeds $50.00. The Board member/staff should immediately notify the Executive Director of such gift, the disposition of such gift, and the Executive Director shall maintain a log of such gifts and their
MONTANA BOARD OF INVESTMENTS 16 OF 41 GOVERNANCE MANUAL CODE OF ETHICS APPROVED 11/6/07 APPENDIX B
disposition. Such gifts received by the Executive Director shall be immediately reported to the Board Chairperson. C) A perishable gift from current or potential vendors to a Board member/staff at the Board’s officewith a perceived value of less than $50.00 shall be shared with all Board staff. The Executive Director shall maintain a log of such gifts and their disposition. D) A non-perishable gift from current or potential vendors to a Board member/staff at the Board’soffice with a perceived value of less than $50.00 shall be auctioned and the auction proceeds deposited in the “employee fund.” The Executive Director shall maintain a log of such gifts and their disposition. E) All restaurant dinners attended by Board members\staff and current or potential investmentvendors, or lenders shall be “no host.” F) The above meal restriction does not apply to Board members\staff attending meetings held by theGeneral Partner of private equity funds, private real estate funds, or other private funds in which the Board is a Limited Partner.
2. Relationship Provisions
A) Board staff who have a material personal or financial relationship with a current or potentialvendor shall recuse themselves from participating in any part of the decision to select, negotiate a contract with, or terminate the services of the vendor and shall not attempt to influence in any way Board members/staff who are part of the decision making process. B) Board members who have a material personal or financial relationship with a current or potentialvendor shall recuse themselves from participating in any part of the decision to select or terminate the services of the vendor and shall not attempt to influence in any way Board members/staff who are part of the decision making process. If the Board, as an entity, has the final authority to make the decision the Board member with the relationship shall, at the Board’s public meeting, divulge in general terms the relationship and abstain from voting. Such abstention and the reason for the abstention shall be recorded in the meeting minutes. C) Board staff who have a material personal or financial relationship with a current or potentiallender or borrower shall recuse themselves from participating in any part of the decision to participate or not participate in the loan with the current or potential lender or borrower and shall not attempt to influence in any way Board members/staff who are part of the decision making process. D) Board members who have a material personal or financial relationship with a current or potentiallender or borrower shall recuse themselves from participating in any part of the decision to participate or not participate in the loan with the current or potential lender or borrower and shall not attempt to influence in any way Board members/staff who are part of the decision making process. If the Board, as an entity, has the final authority to make the decision the Board member with the relationship shall, at the Board’s public meeting, divulge in general terms the relationship and abstain from voting. Such abstention and the reason for the abstention shall be recorded in the meeting minutes. E) Board members may vote on INTERCAP loans made to local governments in the jurisdiction inwhich a Board member resides. Board members represent the entire state on the Board regardless of where they may reside.
3. Time and Facilities ProvisionA) Board staff shall not use state time and facilities to conduct private business; which includes theresearching of securities for personal portfolios, the trading of securities; or conduct any activities for a revenue generating business.

MONTANA BOARD OF INVESTMENTS 17 OF 41 GOVERNANCE MANUAL CODE OF ETHICS APPROVED 11/6/07 APPENDIX B
4. Dual Salaries Provision
A) Board members who are also public employees shall inform the Executive Director if they are in apublic employee salaried position that continues to pay their salaries while they are carrying out Board activity for which they are entitled to per diem. Board members in this status shall not receive per diem for the same hours for which their salaries are paid but shall receive travel, meal, and lodging entitlement, and reimbursement for out of pocket expenses as do other Board members. This provision does not apply if the public employee takes accrued leave or compensatory time from the public employee position in order to carry out Board activities.
I have read and understand the Montana Board of Investments Code of Ethic and agree to the best of my ability to comply with all its provisions.
Board member/staff Date

MEMORANDUM Montana Board of Investments Department of Commerce 2401 Colonial Drive, 3rd Floor Helena, MT 59601 (406) 444-0001 To: Members of the Board
From: David Ewer, Executive Director Date: February 23, 2016 Subject: Emergency and Disaster Preparedness Board staff has implemented many policies and procedures to address emergency and disaster preparedness. Reflected below is an outline on the Board’s readiness for various types of emergencies or work disruptions. Staff will answer more detailed questions at the Board meeting if desired. These efforts, plans and contingencies are in addition to the State’s emergency and disaster preparedness, although some of these comments overlap with the larger state system. Computer and Communications Systems
• MBOI transactions backed up daily • Secure off-site setting • MBOI has capability to process critical work flow (cash movement) off site with secure access to
other work stations and secure access mechanisms • Call down list to staff • Back up communications have been tested during the past 12 months - offsite access to
SinglePoint (for ACH and wires) and Bloomberg (for trades) • 2nd Annual Cash Movement Emergency Preparedness meeting held January 13, 2016 – MBOI,
Department of Administration, State Street Bank and Trust (the custodial bank) and U.S. Bank (the state’s depository bank)
• Annual IT security course completed by all employees Building and Employee & Visitor Safety
• Fire drills occur annually – next fire drill is scheduled for summer of 2016 • Sprinkler and fire alarm systems tested annually; fire extinguishers are checked monthly • Earthquake drill scheduled every October • First aid kits on-site • Defibrillator (AED), on-site • CPR, AED and First Aid training provided on-site • Keyless entry system • Nightly and weekend building checks conducted by private security company • Office Manager trained for ADA building compliancy in past year • Annual building inspections conducted by Board staff and contracted property manager • Colonial Drive Emergency Action Plan updated annually

Staff Outreach for 2015
INTERCAP – Louise Welsh and Julie Flynn
• February 18-20 – Attended and staffed booth at the Montana Rural Water Systems conference held in Great Falls. Presented INTERCAP overview with other Water, Wastewater and Solid Waste Action Coordinating Team (WWASACT) agencies.
• March 18-19 – Facilitated and presented INTERCAP overview at a WWASACT workshop held in Kalispell.
• March 23-24 – Facilitated and presented INTERCAP overview at a WWASACT workshop held in Miles City.
• June 17-18 – Presented INTERCAP overview during a roundtable discussion at the Montana Association of School Board Officials (MASBO) conference for district clerks held in Whitefish.
• September 17 – Presented INTERCAP overview to school district leaders as part of MASBO’s facility workshop held in Bozeman.
• September 21-23 – Attended and staffed booth at the Montana Association of Counties (MACo) conference held in Missoula.
• October 7-9 – Attended and staffed booth at the Montana League of Cities and Towns conference held in Bozeman.
• October 15 – Presented INTERCAP overview during a roundtable discussion at the Montana Conference of Education Leadership (MCEL) held in Billings. INVESTMENT STAFF
• May & September – Semi-annual meetings with University of Montana Accounting & Finance Board to discuss UM curriculum and activities in relation to business and government needs.
• February 12 – Presented to Dr. Tim Manuel’s investments markets class at U of M on MBOI bond portfolios.
• March 27 – Hosted Montana State University’s Dr. Frank Kerins advanced investments class; each asset class gave an overview.
• Ongoing mentors to U of M students for CFA Research Challenge, competition involves students preparing an equity research paper on a local company.
• October 21 – CFA networking event in Missoula.
• Involved in arranging the annual Montana CFA Forecast dinner in April each year as a member of the Montana committee for the CFA Spokane Society.
IN-STATE LOAN PROGRAM – Herb Kulow, CMB
• Meetings with commissioners of Cascade County and presentation at County Commissioner’s meeting.
• Native American Conference in Billings.
• Presentation to Missoula County Commissioners.
• Presentation to Missoula Airport Authority.
• Co-chairman of US Treasury national committee for underserved borrowers in the nation.
• Meeting with Big Sky Economic Development Authority – Billings.
• Multiple meetings with lenders discussing the use of MBOI In-State Loan Program.
• Met with multiple businesses discussing the use of MBOI In-State Loan Program in the structuring of their loans.
• Ongoing outreach via phone and email talking to state lenders who are interested in participating in the MBOI In-State Loan Program.

Return to Agenda

MEMORANDUM Montana Board of Investments Department of Commerce 2401 Colonial Drive, 3rd Floor Helena, MT 59601 (406) 444-0001 To: Board of Directors From: Herb Kulow, CMB Date: February 23, 2016 Subject: Commercial and Residential Loan Portfolios
As of January 31, 2016, the commercial loan portfolio balance was $110,625,265, after deducting $549,641 of other real estate, and represents 104 individual loans or participations. Reservations totaled $43,888,924 and commitments totaled $17,881,920. The commercial loan portfolio has a yield of 3.79%, as of January 31, 2016. There were six loans past due over 30 days, totaling $8,951,444 and represents 8.09% of the total portfolio. Of that total, Shoot the Moon represents $6,876,372.
The residential loan portfolio, as of January 31, 2016, has an outstanding balance of $8,281,450. There were no outstanding reservations. There were five loans over 90 days past due totaling $300,459 or 3.63% of the portfolio. Four of the past due loans, totaling $262,663, are FHA guaranteed. One loan for $37,796 is a conventional loan and a demand for payment has been made to the borrower. The residential loan portfolio is made up of 85 FHA guaranteed loans totaling $3,883,631, 83 conventional loans totaling $4,064,444 and six VA guaranteed loans totaling $333,375.
The Veterans Home Mortgage portfolio reflected an outstanding balance, as of January 31, 2016, of $30,233,183. There were five reservations totaling $808,230. One loan was past due over 90 days totaling $203,358 and a demand letter was sent to the borrower on this loan. There is one loan past due less than 90 days, but more than 30 days, totaling $175,762, which is guaranteed by the FHA. Past due loans totaled $379,121 or 1.25% of the portfolio, as of January 31, 2016. The VA loan portfolio is compiled of 177 VA guaranteed loans totaling $29,878,177 and two FHA guaranteed loans totaling $355,007. MBOI VA policy, Section 4(b) states, in part, that any loan to be purchased by MBOI under this program must be insured by either the VA, FHA or under the HUD 184 program. The Section 184 Indian Home Loan Guarantee Program is a home mortgage specifically designed for American Indian and Alaska Native families, Alaska Villages, Tribes, or Tribally Designated Housing Entities. Section 184 loans can be used, both on and off native lands, for new construction, rehabilitation, purchase of an existing home, or refinance.

MEMORANDUM Montana Board of Investments Department of Commerce 2401 Colonial Drive, 3rd Floor Helena, MT 59601 (406) 444-0001 To: David Ewer, Executive Director From: Herb Kulow, CMB Date: February 23, 2016 Subject: Veterans Home Loan Policy Change Attached you will find a recommended change to the Veterans Home Loan Policy increasing the hazard insurance deductible, that is found in Section 4(j) from $1,000 to $1,500. The original $1,000 deductible has been the MBOI standard for many years, however the insurance companies currently write a minimum deductible of $1,500 and either do not offer a $1,000 deductible or the premiums are substantially higher than their standard $1,500 deductible. It is recommended MBOI increase its deductible to be more in line with the industry standard. The Montana Board of Housing is already accepting the $1,500 deductible and this would make MBOI consistent with the housing experts.

Page 1 of 3 Veterans Home Loan Mortgage Policy August 21Pending Approval February 23, 2016, 2012
Montana Veterans’ Home Loan Mortgage Policy
Veterans’ Home Loan Mortgage Program is authorized under 90-6-6 M.C.A. The following Veterans’ Home Loan Mortgage Policy applies to this statute. Loans under this program are purchased from eligible participating lenders by the Montana Board of Investments (MBOI) and serviced by the Montana Board of Housing (MBOH).
1. ELIGIBLE VETERAN a) Veteran is or has been a member of the Montana national guard; b) Veteran is or has been a member of the federal reserve forces of the armed
forces of the United States, serving pursuant to Title 10 of the United States Code;
c) Veteran is serving or has served on federal active duty pursuant to Title 10 of the United States Code;
d) Veteran is an un-remarried spouse of an individual who was otherwise an eligible veteran who was killed in the line of duty;
e) An eligible veteran as defined pursuant to 90-6-602(3) M.C.A.; f) If previously a member of the armed forces, Veteran was discharged under
honorable conditions; g) Veteran is a resident of the state of Montana maintaining a permanent place of
abode within Montana and who has not established a residence elsewhere even though the individual may be temporarily absent from the state;
i. Proof of residency qualification can be a copy of a filed Montana tax return showing a full year of residency in Montana;
ii. Current Montana driver’s license and/or a copy of a current Montana vehicle registration and/or other Montana identification acceptable to MBOH and MBOI.
h) Veteran is a first-time homebuyer – income tax showing no interest in real estate for the previous three calendar years preceding the time of purchase or other MBOH required documentation;
i) Veteran must complete a MBOH approved homebuyer education class; j) Veteran must provide a minimum of $2,500, resulting in a loan to value of
less than 100%. The maximum loan amount under this program is based upon the lesser of the appraised value of the property, the purchase price of the property or the hard construction costs of the property, including eligible land, reduced by the Veteran’s cash investment.
2. PROPERTY ELIGIBILITY
a) Contract purchase price is limited to 95% of the MBOH’s statewide range; i. The statewide range is determined annually by the MBOH;
ii. In no case will the MBOI loan amount exceed the maximum guarantor’s or insurer’s allowed loan amount.
b) Property must be located in Montana; c) Property must be secured by a first lien Trust Indenture on the property
pursuant to the Small Tract Financing Act of Montana, 71-1-301 M.C.A.;

Page 2 of 3 Veterans Home Loan Mortgage Policy August 21Pending Approval February 23, 2016, 2012
d) Property, where the borrower is utilizing the VA guarantee program, must be
in full repair prior to purchase by MBOI; e) If a new construction, the property and improvements must be fully completed
prior to closing f) Manufactured homes must be de-titled and on a permanent foundation;
i. Foundation must be certified as meeting FHA requirements; ii. NO single-wide manufactured homes
iii. Manufactured home must be 1976 or newer. g) Single family residence; h) In the case of new construction, the appraised value of land cannot exceed
35% of the mortgage loan; i) Condominiums are INELIGIBLE.
3. NO LONGER PRIMARY RESIDENCE
a) Veterans who cease to use the home as their primary residence must repay the loan in full;
i. As servicer, MBOH will request verification of continued primary residency from time to time;
ii. If borrower fails to provide documentation of primary residency, MBOI may declare the loan immediately due and payable and foreclose on the loan;
iii. Veterans have up to 12 months after the time they cease to use the home as their primary residence to repay the loan;
a. If the Veteran fails to repay the loan within 12 months, the note may become immediately due and payable and the property may be foreclosed;
b. The Veteran may request from MBOI an additional 12-month repayment period based upon the Veteran’s inability to sell the property despite good faith efforts;
c. The MBOI, in its sole discretion, may extend or decline to extend the repayment period based upon consideration of the following factors:
1. prompt and continuing listing of the property for sale; 2. reasonableness of the listing price and other offering
terms; 3. any offers the Veteran has received or refused; 4. market conditions; 5. preservation of the loan collateral; and 6. any other factors deemed relevant by the MBOI.
4. GENERAL LOAN INFORMATION a) There is no limit on the maximum amount of income that may be earned by an
eligible veteran for the purposes of a loan program; b) Loan must be insured by VA, FHA or HUD 184; c) Veteran must have all of their original VA eligibility available to apply under
this program;

Page 3 of 3 Veterans Home Loan Mortgage Policy August 21Pending Approval February 23, 2016, 2012
d) All loans must receive “approve/eligible” or other similarly high response
from automated underwriting; e) No manual underwriting or underwriting exceptions are allowed; f) All participating lenders will be an approved lender with MBOI and have
completed an Approved Lender Residential Service Agreement and an EFT Agreement;
g) Veterans who are stationed elsewhere, but who do not establish a primary residence elsewhere, may obtain a rental waiver from the MBOI.
h) Maximum loan term of 30 years; i) Interest rate to be determined by MBOH. Rates can be found at:
http://housing.mt.gov/About/homeownership/veteranratesandfunds.mcpx j) Complete replacement insurance coverage with a maximum $1,000 $1,500
deductible for hazard insurance; k) Maximum $1,000 $1,500 deductible for flood insurance, if needed; l) No cash back at closing; m) Veteran will be required to make monthly payments for taxes and insurance to
MBOH, who is the servicer of the Montana Veterans’ Home Loan Mortgage Program;
n) Loan will be reserved, processed and serviced by MBOH; o) All loans will be endorsed to the Montana Board of Investments, without
recourse; p) Trust Indenture will be assigned to the Montana Board of Investments. MBOI
is not a “MERS” participating member; q) Trust Indenture must have a “due-on-sale” clause; r) Sweat equity will not be considered; s) The Veteran’s loan may not be assumed by a non veteran; t) Appraisals must be Uniform Appraisal Dataset (UAD) compliant; u) Repurchase of delinquent loans: MBOI retains the right to require repurchase
of a program loan that is 30 days delinquent within the first 90 days or 60 days delinquent within the first 180 days of scheduled payments;
v) Repurchase of loans: Lenders receiving a request to repurchase a loan have five (5) days from notification to repurchase the loan. For the first 30 days thereafter, the loan will accumulate interest at the note rate plus 250 basis points until payment is received. After 30 days, the loan will accumulate interest at the note rate plus 500 basis points until payment is received;
w) All first Trust Indenture loan Notes and Trust Indentures must be on either Fannie Mae or Freddie Mac accepted loan documents;
x) Coal tax trust fund money will be used to fund the Montana Veterans’ Home Loan Mortgage program as provided by 90-6-603 M.C.A;
i. Maximum coal tax trust fund allocation is determined by 90-6-603(2) M.C.A;
ii. This is a revolving loan fund program. For additional forms and assistance call or E-mail: (406) 444-1218 [email protected]

MEMORANDUM Montana Board of Investments Department of Commerce 2401 Colonial Drive, 3rd Floor Helena, MT 59601 (406) 444-0001 To: David Ewer, Executive Director Board of Directors From: Herb Kulow, CMB Date: February 23, 2016 Subject: Commercial Loan Policy Change Recommendation I am presenting for your consideration a change in the Commercial Loan Policy, Section 11(t), which currently reads:
The Board’s participation in hotel/motel facilities is limited to a maximum 50% of the lender’s loan, unless MBOI participates in a lender loan which also has SBA 504 financing, in which case MBOI would participate in up to 80% of the lender portion of the SBA 504 loan.
I recommend this section be eliminated. On April 8, 1993, Bob Pancich, Assistant Investment Officer, submitted a memorandum to the MBOI Board suggesting limitations in loans to the lodging industry, (hotel/motel industry of the Service Sector) due to a concentration of hotel/motel loans not only in the portfolio, but also in specific towns/communities. The memorandum focused on portfolio risk and loss exposure in the lodging industry. He recommended and the Board agreed that no more than 50% of the lodging industry exposure be at risk. This would exclude guaranteed loans and link deposit loans. This was NOT made part of the existing policy, but more of a guideline. This “at risk” exposure is related to the 25% of the Coal Tax Trust available to the In-State Loan Program. In 1993, 25% of the Coal Tax Trust was approximately $123,250,000 and the “at risk” exposure was to be limited to a maximum of $30,800,000 (25% X $123,250,000). Today the amount available to the In-State Loan Program, from the Coal Tax Trust, is about $235,000,000, which would limit our “at risk” exposure today to nearly $58,750,000 (25% X $235,000,000). As of 1-31-16, MBOI has three hotel/motel loans, all un-guaranteed, totaling $5,048,702. This represents 2.14% ($5,048,702 / $235,000,000) of the 25% Coal Tax Trust allocation to the In-State Loan Program and 8.59% ($5,048,702 / $58,750,000) of the 1993 maximum allowable exposure guideline. In 1993, in order to limit this exposure, it was determined the In-State Loan Program would only participate in 50% of loans used to finance hotel/motels. This carried forward until it was incorporated into policy, during my tenure with the Board. This is not an underwriting issue, but a concentration of credit and associated risk and exposure in a specific industry, hotel/motel, in a specific sector, Service. All underwriting has been and will continue to be in strict compliance with underwriting standards and the Commercial Loan Policy. Due to the very low exposure in the hotel/motel industry of the Service sector, the limitation of only a 50% participation should be eliminated.

Return to Agenda
Montana Board of InvestmentsInvestment Performance Analysis
Period Ended: December 31, 2015

1 Executive Summary Page 1
2 Capital Markets Review Page 6
Table Of Contents

Page 1

EXECUTIVE SUMMARY QUARTER ENDING DECEMBER 31, 2015
Economic and Capital Market Review The fourth quarter of 2015 was a positive quarter for most asset classes; however, gains in risk assets were erased in January and February of 2016. Weakening economic indicators in China and a Federal Reserve rate increase served as the primary catalysts for the sharp selloff in risk assets. Several other drivers of overall market performance are presented in Figure 1 below. In addition, Figure 2 presents returns for key market indices. In order to provide a glimpse of market activity in 2016, we have also provided year-to-date returns for several key indices through February 5, 2016, which was the last available date prior to the production of this summary.
Figure 1: Drivers of 2nd Quarter Asset Class Performance
Positive Drivers Negative Drivers 1. Continued Strength in U.S. Real Estate Markets – Private
real estate was one of the few asset classes that showed strength in 2015. The near-term outlook remains positive, as low vacancies across most property types provide owners with pricing power.
2. Interest Rate Declines – Interest rates increased modestly during the fourth quarter, but then sharply reversed course during the first 6 weeks of 2016, as deflationary concerns and flight from risk assets trumped concerns about future rate increases by the Federal Reserve. In fact, immediately following the first U.S. GDP release for the fourth quarter, the market began pricing in far less than the four rate increases previously telegraphed by the Fed. Additionally, the spread between high yield and investment grade bonds widened considerably, which caused high yield bonds to decline more sharply than investment grade bonds over the past several months.
1. Weakening of Chinese Economy and Declining Faith in the Chinese Government – The immediate trigger for the January 2016 sell-off was fear about Chinese economic growth, and, more importantly, the ability of the Chinese government to manage markets effectively. Both of these issues sparked a broad sell-off in global equities, especially in emerging markets.
2. Softening of U.S. Economy – While the U.S. economy showed strength relative to China, it too showed signs of weakness. Manufacturing activity slowed, job growth softened, and the first read of fourth quarter GDP showed that growth slowed to an anemic 0.7% (annualized).
3. Global Oil Supply Glut – Several factors have led to a persistent oversupply of crude oil, which briefly pushed prices of crude below $30/bbl. Factors include: increased U.S. shale production, a strengthening U.S. dollar, a reduction of geopolitical instability in the Middle East, and a Saudi-led price war to regain market share from higher cost producers. While consumers welcomed lower gas prices, lower production is placing a strain on energy sectors in U.S. equity, U.S. high yield, and MLPs.
Figure 2: Key Market Index Returns
Period Ending December 31, 2015
Index Asset Class CYTD 2016
Q4 2015
1 Year
5 Year
10 Year
S&P 500 U.S. Large Cap Equity -7.85 7.04 1.38 12.57 7.31 Russell 2000 U.S. Small Cap Equity -13.16 3.59 -4.41 9.18 6.80 MSCI EAFE (Net) Int’l Developed Markets -8.64 4.71 -0.81 3.60 3.03 MSCI Emerging Markets (Net) Int’l Emerging Markets -6.81 0.66 -14.92 -4.80 3.62 Barclays US Agg Bond U.S. Fixed Income 1.62 -0.57 0.55 3.25 4.52 NCREIF ODCE (Gross) Private Real Estate N/A 3.34 15.01 13.66 6.53 Bloomberg Commodity Commodities -3.75 -10.52 -24.66 -13.47 -6.43
* CYTD returns are for the period ending February 5, 2016. All other returns are for the period ending December 31, 2015.
Page 2

EXECUTIVE SUMMARY – QUARTER ENDING DECEMBER 31, 2015 PAGE 2
MBOI Performance Highlights: Total Fund
Figure 3 shows the performance of the MBOI pension plans, as represented by the Public Employees’ Retirement Plan. A short commentary regarding performance at the total fund level is also provided below.
Figure 3: MBOI Total Fund Performance Period Ending December 31, 2015
QTD 1 Year
3 Years
5 Years
7 Years
10 Years
Total Fund Composite (Net) 3.12 1.86 8.92 8.36 9.97 5.94 Actual Allocation Index 2.63 1.40 9.27 8.79 10.23 6.10 Difference 0.49 0.46 -0.35 -0.43 -0.26 -0.16
Rank 13 8 1 1 8 6
RVK Commentary
Strong Absolute Returns—Risk Assets recovered in the fourth quarter, although as previously stated, these gains were erased early in the first quarter of 2016. U.S. and International Equity Pools provided the strongest returns of 6.34% and 3.79%, respectively. The Real Estate Pool provided a solid quarterly return of 3.03% and ended the year with an annual return of 14.27%. The Private Equity Pool, Retirement Funds Bond Pool, and Trust Funds Investment Pool provided flat to slightly negative returns for the quarter.
Continued Strength of Peer Rankings—MBOI rankings against peers are extremely strong, and the Plans now rank in the top decile over all annualized trailing periods longer than one quarter out to 10 years. Given the rough starting point for the plans 10 years ago, this is an outstanding achievement and a credit to decision-making of the Board and staff members.
Continued Improvement of Relative Performance for the Domestic and International Equity Pools—The Domestic and International Equity Pools, which were a source of underperformance for many years, have shown a substantial improvement over the trailing 5-year period. The Domestic Equity Pool is now exceeding its index over the annualized 3- and 7-year periods, and the International Equity Pool is exceeding its index for all periods out to five years.
Underperformance of Retirement Funds Bond Pool—Although long-term performance relative to the Barclays U.S. Agg Bond Index and peers remains strong, the Retirement Funds Bond Pool underperformed for the quarter. The Pool trailed the index by 37 basis points and ranked 85th percentile.
Reversal of Private Equity Relative Performance Trend—For the past several years we have highlighted the tendency of private equity to trail public indices in strong, sustained bull markets. We also explained that a reversal should occur when the bull market fizzles. With the bull market slowing in 2015, MBOI is finally seeing private equity returns catch up with its index. For the fourth quarter (one-quarter lagged), the Private Equity Pool returned 0.22%, outperforming its index by 591 basis points. For the trailing year, the pool returned 7.20%, outperforming the index by 350
Page 3

EXECUTIVE SUMMARY – QUARTER ENDING DECEMBER 31, 2015 PAGE 3
basis points.
MBOI Performance Highlights: Asset Class Composites
The performance of the major asset class composites within the MBOI portfolio are summarized on pages 11-13 of the quarterly performance report. A high level commentary on each asset class is also provided below. Unless stated otherwise, all returns are reported on a net-of-fees basis.
Montana Domestic Equity Pool—The MBOI Domestic Equity Pool returned 6.34% for the quarter, underperforming the S&P 1500 composite index by 25 basis points. Relative to peers, the Pool ranked in the 17th percentile for the quarter. With improved performance, the Pool is now outperforming peers over all trailing, annualized periods out to ten years. It also ranks in the top quartile over the 3- and 5-year periods. The medium term results should provide increased confidence that the changes made in the portfolio to increase passive exposure in more efficient asset classes (e.g., large cap equity) and select new managers in less efficient sectors (e.g., small cap equity), are paying off.
Montana International Equity Pool—The MBOI International Equity Pool returned 3.79% for the quarter, outperforming the International Equity Custom Benchmark by 39 basis points. Relative to peers, the Pool ranked in the 56th percentile for the quarter. Similar to domestic equity, the changes in strategy within the international equity portfolio have thus far produced positive results. Over the past 3- and 5- year periods, the International Equity Pool is now exceeding its benchmark. While peer rankings continue to lag, the Pool has shown modest improvement on this metric as well.
Retirement Funds Bond Pool—The Retirement Funds Bond Pool returned -0.94% for the quarter, trailing the Barclays US Aggregate Bond Fund by 37 basis points. Despite the negative relative performance for the quarter, the Pool continues to perform well over all trailing periods from 3 years and beyond.
Trust Funds Investment Pool—The fixed income portion of the Trust Funds Investment Pool largely mirrored the Retirement Funds Bond Pool. However, absolute and relative returns were notably better due to the presence of real estate in the portfolio, which provided strong positive returns for the quarter and calendar year.
Real Estate Pool—The Real Estate Pool, which is benchmarked on a lagged basis, returned 3.03% for the quarter, trailing the NCREIF ODCE Index by 40 basis points. Relative to peers, the pool ranked in the 41st percentile. The diversification benefit of the Real Estate Pool was clearly evident over the past year, as the Pool provided strong positive returns while other asset classes struggled. Over the longer term, the Real Estate Pool continues to lag the index for reasons that involve timing of entry into the asset class, as well as material differences between benchmark and portfolio holdings. Nevertheless, performance of the Real Estate Pool continues to strengthen.
Short Term Investment Pool—The Short Term Investment Pool performed in line for the quarter relative to the 1-Month Libor Index and the iMoneynet Money Fund Median1. The absolute return
1 The iMoneynet Money Fund Median is reported on a gross of fees basis.
Page 4

EXECUTIVE SUMMARY – QUARTER ENDING DECEMBER 31, 2015 PAGE 4
of the Pool over the past year was only 22 basis points, which is due to extremely low interest rates on the short end of the yield curve.
Private Equity Pool—The Private Equity Pool returned 0.22% for the quarter, which outperformed the S&P 1500 + 4% (one quarter lagged) by 591 basis points. Private equity continues to provide valuable diversification and return enhancement for the MBOI pension plans. Over 10 years, the portfolio has returned 10.38% net of fees, which exceeds the return of all other asset classes in the portfolio. In addition, the Private Equity Pool has provided valuable diversification as the U.S. equity bull market has fizzled in 2015. As anticipated, the Private Equity Pool has added value relative to the index, as returns have caught up with public markets.
Overall, the MBOI portfolio continues to perform well and has strengthened in comparison to peers. RVK supports several of the recent changes that were made in order to improve performance, particularly in the international and domestic equity portfolios. Unfortunately, absolute returns for 2015 (and especially early 2016) have proven considerably less attractive than prior years. While the Plans remain well positioned and are performing well, we have entered a more challenging environment for returns in 2016.
Page 5

Page 6
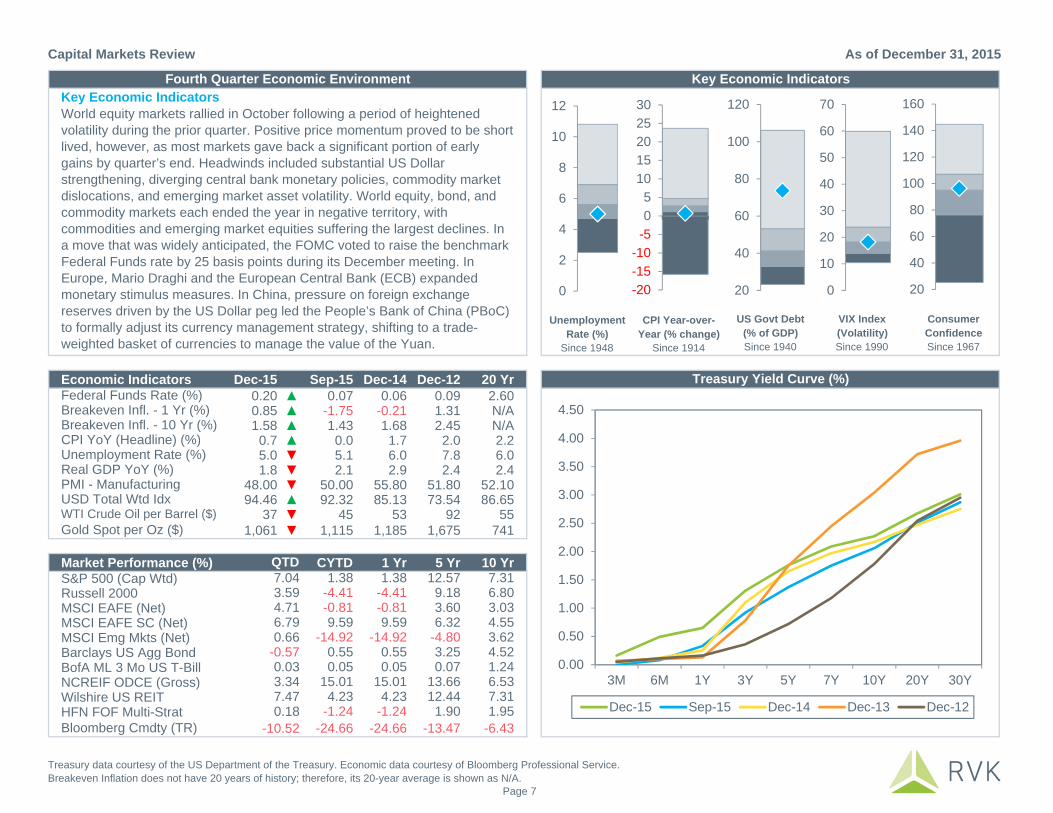
Capital Markets Review As of December 31, 2015
Economic Indicators Dec-15 Sep-15 Dec-14 Dec-12 20 Yr0.20 ▲ 0.07 0.06 0.09 2.600.85 ▲ -1.75 -0.21 1.31 N/A1.58 ▲ 1.43 1.68 2.45 N/A0.7 ▲ 0.0 1.7 2.0 2.25.0 ▼ 5.1 6.0 7.8 6.01.8 ▼ 2.1 2.9 2.4 2.4
48.00 ▼ 50.00 55.80 51.80 52.1094.46 ▲ 92.32 85.13 73.54 86.65
37 ▼ 45 53 92 551,061 ▼ 1,115 1,185 1,675 741
Market Performance (%) CYTD 1 Yr 5 Yr 10 Yr1.38 1.38 12.57 7.31
-4.41 -4.41 9.18 6.80-0.81 -0.81 3.60 3.039.59 9.59 6.32 4.55
-14.92 -14.92 -4.80 3.620.55 0.55 3.25 4.520.05 0.05 0.07 1.24
15.01 15.01 13.66 6.534.23 4.23 12.44 7.31
-1.24 -1.24 1.90 1.95-24.66 -24.66 -13.47 -6.43
Russell 2000MSCI EAFE (Net)MSCI EAFE SC (Net)MSCI Emg Mkts (Net)Barclays US Agg Bond
Key Economic Indicators
Treasury Yield Curve (%)
Key Economic IndicatorsWorld equity markets rallied in October following a period of heightened volatility during the prior quarter. Positive price momentum proved to be short lived, however, as most markets gave back a significant portion of early gains by quarter’s end. Headwinds included substantial US Dollar strengthening, diverging central bank monetary policies, commodity market dislocations, and emerging market asset volatility. World equity, bond, and commodity markets each ended the year in negative territory, with commodities and emerging market equities suffering the largest declines. In a move that was widely anticipated, the FOMC voted to raise the benchmark Federal Funds rate by 25 basis points during its December meeting. In Europe, Mario Draghi and the European Central Bank (ECB) expanded monetary stimulus measures. In China, pressure on foreign exchange reserves driven by the US Dollar peg led the People’s Bank of China (PBoC) to formally adjust its currency management strategy, shifting to a trade-weighted basket of currencies to manage the value of the Yuan.
Fourth Quarter Economic Environment
UnemploymentRate (%)
Since 1948
CPI Year-over-Year (% change)
Since 1914
US Govt Debt (% of GDP)Since 1940
VIX Index(Volatility)Since 1990
Consumer ConfidenceSince 1967
Unemployment Rate (%)
Federal Funds Rate (%)Breakeven Infl. - 1 Yr (%)Breakeven Infl. - 10 Yr (%)CPI YoY (Headline) (%)
Real GDP YoY (%)
USD Total Wtd IdxWTI Crude Oil per Barrel ($)Gold Spot per Oz ($)
S&P 500 (Cap Wtd)
PMI - Manufacturing
0.18-10.52
BofA ML 3 Mo US T-BillNCREIF ODCE (Gross)Wilshire US REITHFN FOF Multi-StratBloomberg Cmdty (TR)
0.66-0.570.033.347.47
QTD7.043.594.716.79
0.00
0.50
1.00
1.50
2.00
2.50
3.00
3.50
4.00
4.50
3M 6M 1Y 3Y 5Y 7Y 10Y 20Y 30Y
Dec-15 Sep-15 Dec-14 Dec-13 Dec-12
0
2
4
6
8
10
12
20
40
60
80
100
120
0
10
20
30
40
50
60
70
20
40
60
80
100
120
140
160
-20-15-10-505
1015202530
0.7
Treasury data courtesy of the US Department of the Treasury. Economic data courtesy of Bloomberg Professional Service.Breakeven Inflation does not have 20 years of history; therefore, its 20-year average is shown as N/A.
Page 7

US Equity Review As of December 31, 2015
US Large-Cap Equity
R1000 12M P/ESince 1995
US Small-Cap Equity
R2000 12M P/ESince 1995
US Large-Cap Value Equity
R1000V 12M P/ESince 1995
US Large-Cap Growth Equity
R1000G 12M P/ESince 1995
US Large-Cap Equity
Shiller S&P 10Y P/ESince 1900
Broad MarketThe US equity market recovered during the fourth quarter, erasing losses incurred during the global sell-off in August. Despite poor performance in November and December, the Russell 3000 Index delivered strong returns in October and finished the quarter up 6.3%. The strong fourth quarter lifted the broad US equity market into positive territory for the year, with the Russell 3000 Index posting a return of 0.5% for 2015. While the index avoided a loss, 2015 marked the lowest calendar year return for the index since 2008.
Market CapLarge-cap stocks continued to outpace small-cap. The top ten largest stocks in the S&P 500 Index averaged a 23.4% return for the year, while the remaining 490 stocks averaged a -2.0% return.
Style and SectorGrowth leadership persisted across the market cap spectrum.
Style and Capitalization Market Performance (%)
S&P 500 Index Sector Performance (%)
Fourth Quarter Review
Valuations
-1.38
5.67
-7.47
-3.83
-4.41
0.92
1.38
0.48
4.32
7.32
2.88
5.64
3.59
6.50
7.04
6.27
-15 -10 -5 0 5 10 15
R 2000 Growth
R 1000 Growth
R 2000 Value
R 1000 Value
R 2000
R 1000
S&P 500
R 3000 QTD
1 Yr
-4.85
3.40
-8.38
5.92
-2.53
6.89
-1.53
-21.12
6.60
10.11
1.07
7.61
9.69
9.17
8.00
9.22
5.96
0.20
7.64
5.79
-40 -30 -20 -10 0 10 20 30
Utilities
TeleCom
Materials
Information Tech
Industrials
Health Care
Financials
Energy
Cons Staples
Cons Discretion
QTD
1 Yr
0
5
10
15
20
25
30
10
15
20
25
30
20
40
60
80
100
10
15
20
25
10
20
30
40
50
Valuation data courtesy of Bloomberg Professional Service and Robert J. Shiller, Irrational Exuberance, Second Edition.P/E metrics shown represent the 5th through 95th percentiles to minimize the effect of outliers.
Page 8

Non-US Equity Review As of December 31, 2015
Developed IntlEquity
MSCI EAFE12M P/E
Since 1995
Intl EquityMSCI ACW x US
12M P/ESince 1995
MSCI Style and Capitalization Market Performance (%)
MSCI Region Performance (%)
EmergingMarkets Equity
MSCI EM12M P/E
Since 1995
Developed Intl Growth EquityMSCI EAFE Gro
12M P/ESince 1995
Developed Intl Value Equity
MSCI EAFE Val12M P/E
Since 1995
Fourth Quarter Review
Valuations
Broad MarketDeveloped international equity markets finished the quarter in positive territory after a strong start in October.
Market Cap & StyleGrowth continued to outperform value, resulting in increased style dispersion. In contrast to the US, small-cap stocks outperformed large-cap stocks.
Developed MarketsBy region, returns were mainly positive with only a few developed market countries lagging the general market. Central bank policies continued to diverge with monetary stimulus continuing in Europe, but pausing in Japan.
Emerging MarketsEmerging markets equity lagged their developed counterparts by a wide margin, but still delivered slightly positive returns during the quarter. Prior to the selloff in 2016, China was the strongest contributor to performance in Q4.
-14.92
2.96
-2.84
9.59
4.09
-5.68
-0.81
-5.66
0.66
9.00
2.49
6.79
6.67
2.68
4.71
3.24
-30 -20 -10 0 10 20
Emg Mkts
Pacific
Europe
EAFE SC
EAFE Growth
EAFE Value
EAFE
ACW Ex US QTD
1 Yr
-14.92
-24.16
9.57
-8.47
10.38
-7.56
-0.65
0.66
-5.11
9.34
8.29
8.91
0.73
3.27
-40 -30 -20 -10 0 10 20
Emg Mkts
Canada
Japan
Pacific ex Japan
Middle East
United Kingdom
Europe Ex UK
QTD1 Yr
0
20
40
60
80
100
0
10
20
30
40
0
10
20
30
40
50
60
0
10
20
30
40
50
0
10
20
30
40
50
Valuation data courtesy of Bloomberg Professional Service.P/E metrics shown represent the 5th through 95th percentiles to minimize the effect of outliers.All returns are shown net of foreign taxes on dividends.
Page 9

Fixed Income Review As of December 31, 2015
US Aggregate Bonds
Barclays US Agg Spreads
Since 2000
US Corporate Bonds
Barclays US Corp Spreads
Since 1989
US CreditBonds
Barclays US Credit Spreads
Since 2000
US Treasury Bonds10-Yr US Treasury
YieldsSince 1953
US High-Yield Bonds
Barclays US Corp:HY Spreads
Since 2000
Fixed Income Performance (%)Broad MarketThe Barclays US Aggregate Bond Index finished the quarter and year with relatively poor returns of -0.6% and 0.6%, respectively. Currency fluctuations continue to drive global bond returns. As the dollar strengthened during the quarter, the Citigroup World Government Bond Index returned -1.2% and ended at -3.6% for the year.
Credit MarketThe BofA ML US High Yield Master II Index returned -4.6% for the year, as the US high yield market continued to suffer from depressed oil and commodity prices. Emerging Market DebtWeakness in emerging markets and a fairly aggressive trend of devaluation among emerging market currencies caused the JPM GBI-EM Global Diversified Index to finish the year at -14.9%, the worst calendar year return since the inception of the local currency index.
Fourth Quarter Review
Valuations
-14.92
1.23
-3.58
-3.15
-0.38
-4.47
1.25
1.51
1.01
-0.68
0.94
-1.44
0.84
0.55
-0.01
1.55
-1.23
-0.92
-1.96
-2.07
-0.57
-0.10
-0.64
-0.58
-1.32
-0.64
-0.94
-0.57
-25 -15 -5 5
JPM GBI-EM Glbl Dvf'd (USD)(Unhedged)
JPM Emg Mkts Bond Global
Citi Wrld Gov't Bond
Barclays Global Agg Bond
CS Leveraged Loan
Barclays US Corp: Hi Yld
Barclays US ABS
Barclays US MBS
Barclays US Agcy
Barclays US Corp: Credit
Barclays US CMBS Inv Grade
Barclays US Trsy: US TIPS
Barclays US Trsy
Barclays US Agg QTD
1 Yr
0
2
4
6
8
10
12
14
0.0
0.2
0.4
0.6
0.8
1.0
1.2
0.0
0.5
1.0
1.5
2.0
2.5
3.0
0.0
0.5
1.0
1.5
2.0
2.5
3.0
3.5
0
2
4
6
8
10
12
Valuation data courtesy of Bloomberg Professional Service.Valuations shown represent the 5th through 95th percentiles to minimize the effect of outliers.
Page 10

Alternatives Review As of December 31, 2015
General Market - Diversified Inflation Strategies (DIS)In a year with historically low inflation expectations, strategies designed to protect against inflation underperformed by a wide margin. Deflationary headwinds included a strengthening US Dollar, sharp declines in commodity prices (particularly crude oil), and weakening growth expectations for major exporting nations. REITs allocations were a bright spot while MLP, commodities, and natural resource equity exposures detracted significantly.
General Market - Real EstateAs a result of continued demand for well-occupied, well-located property, core real estate investors were rewarded with strong positive returns in the fourth quarter. In particular, the NCREIF-ODCE Index marked its 24th consecutive quarter of gains with an estimated 3.3% return. Even as US property valuations surpass all-time peak levels, as measured by capitalization rates, fundamentals amongst major property types remain strong and increased dry powder indicates continued investor appetite.
General Market - Hedge FundsHedge funds returns were mixed for the fourth quarter, capping off a year that saw a widening of dispersion across hedge fund strategies. Outsized equity market gains in the month of October were a relative detractor, as many hedged equity managers de-risked portfolios following drawdowns in the third quarter. Managers tracked closely by RVK were generally able to generate alpha in both long and short positions over the course of the year. Distressed debt was the worst performing strategy for the quarter and year.
General Market - Global Tactical Asset Allocation (GTAA)Diversification did not reward investors in 2014, and 2015 saw a continuation of a similar theme wherein most GTAA managers underperformed a standard 60/40 blend. Managers with significant allocations to emerging markets equity or that relied on short US equity exposure in favor of other regional exposures provided the highest level of underperformance. Risk parity managers provided disparate returns with most poor performers suffering from difficult performance in credit-sensitive fixed income, TIPS, and non-US equity.
Fourth Quarter Review - Absolute Return
HFN Hedge Fund Performance (%)
Fourth Quarter Review - Real Assets
Real Asset Performance (%)
-1.62
1.14
-1.17
0.68
2.58
-5.88
2.87
4.83
3.69
0.91
-1.24
-1.51
1.23
0.41
0.33
-0.04
-2.62
2.64
0.90
2.31
0.18
0.18
-10 -5 0 5 10
FI ArbitrageMerger/Risk Arb
Event DrivenRelative Value
MacroDistressedShort Bias
Mkt Neutral EqLong/Short EqConv ArbitrageFOF Multi-Strat QTD
1 Yr
-1.44
-32.59
-24.00
-24.66
4.23
13.33
15.01
-0.64
-2.76
0.59
-10.52
7.47
2.91
3.34
-60 -45 -30 -15 0 15 30 45
Barclays US Trsy: US TIPS
Alerian MLP
S&P Glbl Nat. Res. (TR)
Bloomberg Cmdty (TR)
Wilshire US REIT
NCREIF Property
NCREIF ODCE (Gross) QTD
1 Yr
Page 11

2001 2002 2003 2004 2005 2006 2007 2008 2009 2010 2011 2012 2013 2014 2015
Best12.35 25.91 61.34 33.16 34.00 35.97 39.38 8.44 78.51 28.60 22.49 20.00 38.82 31.78 15.01
8.44 16.56 55.81 31.45 26.19 32.18 16.23 5.24 58.21 26.86 15.99 18.23 32.39 19.31 9.59
7.89 14.81 47.25 25.55 21.39 26.34 15.97 2.06 46.78 22.04 13.56 17.59 29.30 13.69 4.23
7.28 10.25 38.59 20.25 21.36 19.31 11.63 -2.35 31.78 18.88 9.24 17.32 22.78 12.50 1.38
6.61 5.54 36.18 18.33 13.82 18.37 11.17 -10.01 28.60 16.83 7.84 16.34 13.94 5.97 0.55
5.64 3.58 28.97 13.06 13.54 16.32 9.91 -20.47 27.18 16.36 4.98 16.00 9.10 4.89 0.05
5.28 3.12 28.68 11.13 6.75 15.79 6.97 -26.16 26.46 15.12 2.11 15.81 7.44 3.64 -0.81
4.42 1.78 23.93 10.88 5.33 11.85 6.60 -33.79 18.91 15.06 0.10 10.94 1.86 3.03 -1.24
2.49 -1.41 11.93 9.15 4.91 9.85 5.49 -35.65 11.41 10.16 -4.18 8.82 0.07 2.45 -1.44
-2.62 -6.17 9.28 8.56 4.55 4.85 5.00 -37.00 9.72 7.75 -5.55 6.98 -2.02 0.04 -3.30
-11.89 -7.83 8.39 8.46 3.07 4.33 1.87 -39.20 5.93 6.54 -12.14 4.80 -2.60 -2.19 -4.41
-12.53 -15.94 5.87 6.79 2.84 2.71 1.45 -43.38 1.92 6.31 -13.32 4.21 -8.61 -4.90 -4.47
-19.51 -20.48 4.10 4.34 2.74 2.07 -1.57 -47.01 0.21 4.77 -15.94 0.11 -8.83 -4.95 -14.92
Worst-21.44 -22.10 1.15 1.33 2.43 0.41 -17.55 -53.33 -29.76 0.13 -18.42 -1.06 -9.52 -17.01 -24.66
S&P 500 -US Large
Cap
R 2000 -US Small
Cap
MSCI EAFE(Net) - Int'l
Dev.
MSCI EAFESC (Net) -
Int'l SC
MSCI EM(Net) - Int'lEmg Mkts
BarclaysUS Agg
Bond - FI
BarclaysUS Corp:
Hi Yield - FI
BarclaysUS Trsy:US TIPS -
FI
BarclaysUS
Gov/Credit:Lng - FI
NCREIFODCE
(Gross) -Real Estate
WilshireUS REIT -
REITs
HFN FOFMulti-Strat(Net) - ARS
BloombrgCmdty (TR)- Commod.
BofA ML 3Mo T-Bill -
Cash Equiv
Annual Asset Class Performance As of December 31, 2015
NCREIF ODCE (Gross) performance is reported quarterly; performance is shown N/A in interim-quarter months.
Page 12

Disclaimer of Warranties and Limitation of Liability - This document was prepared by RVK, Inc. (RVK) and may include information and data from some or all of the following sources: client staff; custodian banks; investment managers; specialty investment consultants; actuaries; plan administrators/record-keepers; index providers; as well as other third-party sources as directed by the client or as we believe necessary or appropriate. RVK has taken reasonable care to ensure the accuracy of the information or data, but makes no warranties and disclaims responsibility for the accuracy or completeness of information or data provided or methodologies employed by any external source. This document is provided for the client’s internal use only and does not constitute a recommendation by RVK or an offer of, or a solicitation for, any particular security and it is not intended to convey any guarantees as to the future performance of the investment products, asset classes, or capital markets.

Return to Agenda

Investment Activities and Reports February 23, 2016
1) Retirement System Asset Allocation Summary 4th Quarter Calendar 2015:
• The Asset Allocation market value percentages for each asset pool are
consistent across retirement plans. All allocations were within defined policy ranges with the exception of the Highway Patrol and Volunteer Firefighters that were slightly below the 1% for cash (STIP) for one day (12/31/15) when benefit payments were made, but were back within the range as of 1/4/2016.
• During the quarter there were generally small changes in asset allocations
with additions in Domestic Equity, International Equity, and Real Estate and reductions in Private Equity, Bonds, and STIP.
• As of December 31, 2015, the total cash position held at the pension plan and
pool levels was slightly above 2%. Historically, cash has been reported only at the pension level, but including the pool level cash is a more comprehensive view of cash that we can utilize.
• During the quarter, total pension assets, net of distributions, increased by
approximately $224 million.
• During the quarter, the plans made net distributions totaling approximately $76 million which were paid through a combination of dividends, interest, and asset sales. Over this period we made sales of $45 million in the Domestic Equity Pool and reduced STIP by about $45.5 million. Of this $90 million from STIP and MDEP, $47 million of these funds were used in rebalancing of the other pools while the remaining $43.5 million was used to make up the net distribution that was not fully covered by the $32.5 million in dividends and interest.
2) Retirement System Asset Allocation Summary Calendar 2015:
• Comparing beginning and ending asset allocations for calendar year 2015
there were generally small additions in Private Equity and Real Estate and small reductions in Domestic Equity, International Equity, and STIP. Bond allocations remained steady.
• During calendar year 2015, total pension assets, net of distributions, decreased
by approximately $48.5 million.
• During calendar year 2015, the plans made net distributions totaling approximately $231 million, which was funded by dividends and interest totaling approximately $132.5 million and the remaining amount primarily funded from reducing the assets in the Domestic Equity Pool and STIP.

MDEP MTIP MPEP MTRP RFBP STIP TotalPublic Employees Retirement 39.6% 15.8% 11.4% 9.6% 22.4% 1.2% 4,945,087,228 Teachers Retirement 39.6% 15.9% 11.4% 9.6% 22.5% 1.1% 3,589,824,589 Firefighters Retirement 39.6% 15.8% 11.4% 9.6% 22.4% 1.2% 332,772,173 Police Retirement 39.7% 15.9% 11.4% 9.6% 22.5% 1.0% 326,077,852 Sheriffs Retirement 39.5% 15.8% 11.3% 9.6% 22.4% 1.5% 291,560,279 Game Wardens Retirement 39.5% 15.8% 11.3% 9.6% 22.4% 1.4% 148,155,802 Highway Patrol Retirement 39.7% 15.9% 11.4% 9.6% 22.5% 0.8% 125,999,870 Judges Retirement 39.6% 15.8% 11.4% 9.6% 22.4% 1.2% 85,410,578 Vol. Firefighters Retirement 39.7% 15.9% 11.4% 9.6% 22.5% 0.8% 32,269,298
12/31/2015 39.6% 15.9% 11.4% 9.6% 22.5% 1.1% 9,877,157,670 Approved Ranges 28 - 44% 14 - 22% 9 - 15% 6-10% 22 - 30% 1 - 5%
MDEP MTIP MPEP MTRP RFBP STIP TotalPublic Employees Retirement 1.0% 0.3% (0.2%) 0.2% (0.8%) (0.4%) 121,775,644 Teachers Retirement 0.8% 0.2% (0.3%) 0.1% (0.9%) 0.0% 69,180,744 Firefighters Retirement 2.5% 0.9% 0.3% 0.6% 0.1% (4.4%) 7,588,205 Police Retirement 2.6% 0.9% 0.3% 0.6% 0.1% (4.5%) 6,727,572 Sheriffs Retirement 0.9% 0.3% (0.2%) 0.2% (0.8%) (0.3%) 8,351,410 Game Wardens Retirement 1.1% 0.4% (0.1%) 0.2% (0.8%) (0.8%) 4,872,352 Highway Patrol Retirement 1.1% 0.3% (0.2%) 0.2% (0.8%) (0.7%) 2,891,712 Judges Retirement 1.1% 0.3% (0.2%) 0.2% (0.8%) (0.7%) 2,162,289 Vol. Firefighters Retirement 1.0% 0.3% (0.2%) 0.2% (0.8%) (0.4%) 313,786
Increase (Decrease) From Q3 1.0% 0.3% (0.2%) 0.2% (0.8%) (0.5%) 223,863,715
MDEP MTIP MPEP MTRP RFBP STIP TotalAs Percent of Pool 0.7% 1.8% 2.9% 2.2% 0.0% 100% 2.2%As Percent of Pension 0.3% 0.3% 0.3% 0.2% 0.0% 1.1% 2.2%In Dollars 26,101,654 28,222,718 32,091,417 20,970,788 730,884 112,282,470 220,399,930
12/31/2015 3,911,567,544 1,566,065,305 1,122,433,737 947,027,863 2,217,780,751 112,282,470 9,877,157,670
MDEP MTIP MPEP MTRP RFBP STIP TotalPublic Employees Retirement (23,309,380) 4,570,007 2,418,195 7,257,921 (2,888,465) (15,876,900) (27,828,621) Teachers Retirement (30,413,631) (1,479,299) (2,377,931) 2,010,631 (10,158,918) 2,019,148 (40,400,000) Firefighters Retirement 3,324,204 2,258,764 1,650,287 1,691,341 2,766,830 (14,170,617) (2,479,191) Police Retirement 3,107,309 2,141,381 1,578,989 1,628,648 2,615,512 (14,237,521) (3,165,683) Sheriffs Retirement (946,512) 469,353 269,381 519,703 87,503 (805,836) (406,408) Game Wardens Retirement (10,948) 445,153 312,489 385,866 319,505 (1,010,039) 442,026 Highway Patrol Retirement (551,524) 156,414 77,419 200,119 (31,820) (782,885) (932,277) Judges Retirement (288,754) 137,456 82,516 151,346 24,931 (521,671) (414,175) Vol. Firefighters Retirement (344,685) (29,608) (43,508) (148) (124,306) (136,096) (678,351)
9/30/15 - 12/31/2015 (49,433,920) 8,669,622 3,967,837 13,845,428 (7,389,229) (45,522,417) (75,862,680)
MDEP MTIP MPEP MTRP RFBP STIP Total9/30/2015 3,724,578,276 1,500,139,157 1,116,021,619 908,633,627 2,246,232,346 157,688,929 9,653,293,955
Dollar Value Added 236,423,188 57,256,527 2,444,281 24,548,809 (21,062,367) 115,957 299,726,395 Dividend and Interest Distributed (4,433,920) (1,330,378) (1,032,163) (8,154,572) (17,389,229) (115,957) (32,456,221) Pools Bought (Sold) (45,000,000) 10,000,000 5,000,000 22,000,000 10,000,000 (45,406,459) (43,406,459)
12/31/2015 3,911,567,544 1,566,065,305 1,122,433,737 947,027,863 2,217,780,751 112,282,470 9,877,157,670 $ Change From 9/30/2015 186,989,268 65,926,148 6,412,118 38,394,236 (28,451,596) (45,406,459) 223,863,715 % Change From 9/30/2015 5.0% 4.4% 0.6% 4.2% (1.3%) (28.8%) 2.3%
12/31/2015Q3 2015 - Q4 2015
Pool Changes from Last Period
Net Plan Contributions (Distributions)
Plan Asset Allocation
Pension and Pool Cash Exposure
Allocation Changes from Last Period
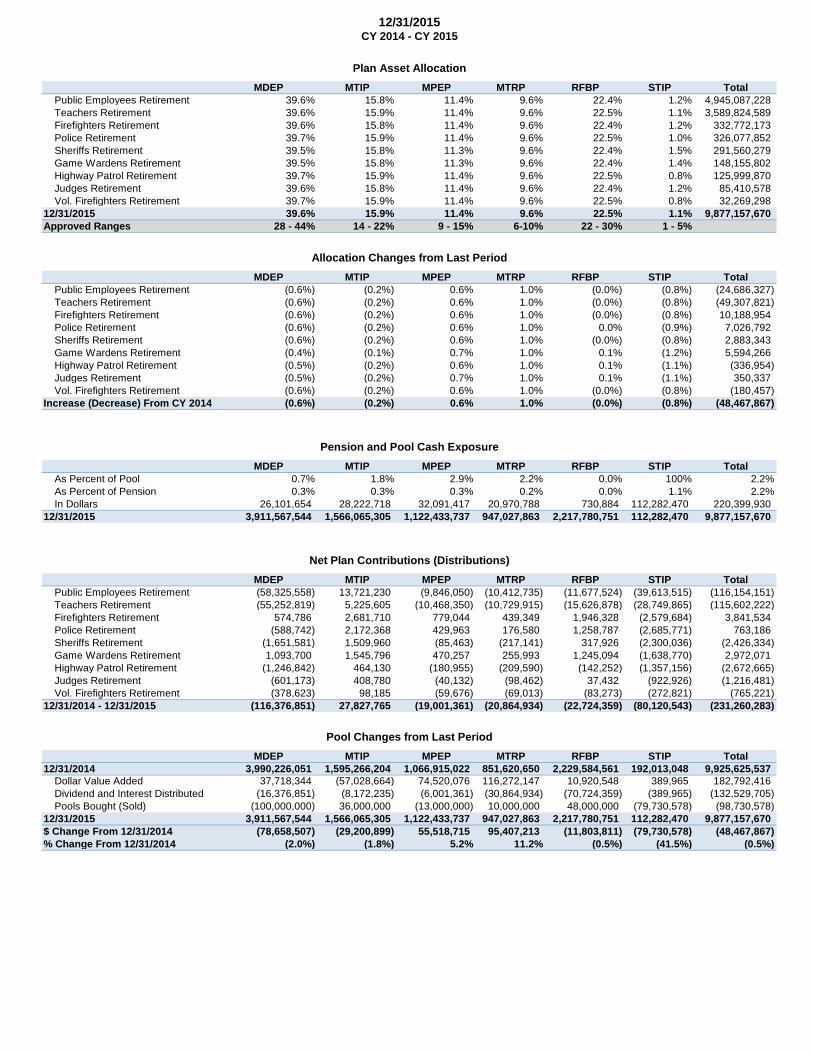
MDEP MTIP MPEP MTRP RFBP STIP TotalPublic Employees Retirement 39.6% 15.8% 11.4% 9.6% 22.4% 1.2% 4,945,087,228 Teachers Retirement 39.6% 15.9% 11.4% 9.6% 22.5% 1.1% 3,589,824,589 Firefighters Retirement 39.6% 15.8% 11.4% 9.6% 22.4% 1.2% 332,772,173 Police Retirement 39.7% 15.9% 11.4% 9.6% 22.5% 1.0% 326,077,852 Sheriffs Retirement 39.5% 15.8% 11.3% 9.6% 22.4% 1.5% 291,560,279 Game Wardens Retirement 39.5% 15.8% 11.3% 9.6% 22.4% 1.4% 148,155,802 Highway Patrol Retirement 39.7% 15.9% 11.4% 9.6% 22.5% 0.8% 125,999,870 Judges Retirement 39.6% 15.8% 11.4% 9.6% 22.4% 1.2% 85,410,578 Vol. Firefighters Retirement 39.7% 15.9% 11.4% 9.6% 22.5% 0.8% 32,269,298
12/31/2015 39.6% 15.9% 11.4% 9.6% 22.5% 1.1% 9,877,157,670 Approved Ranges 28 - 44% 14 - 22% 9 - 15% 6-10% 22 - 30% 1 - 5%
MDEP MTIP MPEP MTRP RFBP STIP TotalPublic Employees Retirement (0.6%) (0.2%) 0.6% 1.0% (0.0%) (0.8%) (24,686,327) Teachers Retirement (0.6%) (0.2%) 0.6% 1.0% (0.0%) (0.8%) (49,307,821) Firefighters Retirement (0.6%) (0.2%) 0.6% 1.0% (0.0%) (0.8%) 10,188,954 Police Retirement (0.6%) (0.2%) 0.6% 1.0% 0.0% (0.9%) 7,026,792 Sheriffs Retirement (0.6%) (0.2%) 0.6% 1.0% (0.0%) (0.8%) 2,883,343 Game Wardens Retirement (0.4%) (0.1%) 0.7% 1.0% 0.1% (1.2%) 5,594,266 Highway Patrol Retirement (0.5%) (0.2%) 0.6% 1.0% 0.1% (1.1%) (336,954) Judges Retirement (0.5%) (0.2%) 0.7% 1.0% 0.1% (1.1%) 350,337 Vol. Firefighters Retirement (0.6%) (0.2%) 0.6% 1.0% (0.0%) (0.8%) (180,457)
Increase (Decrease) From CY 2014 (0.6%) (0.2%) 0.6% 1.0% (0.0%) (0.8%) (48,467,867)
MDEP MTIP MPEP MTRP RFBP STIP TotalAs Percent of Pool 0.7% 1.8% 2.9% 2.2% 0.0% 100% 2.2%As Percent of Pension 0.3% 0.3% 0.3% 0.2% 0.0% 1.1% 2.2%In Dollars 26,101,654 28,222,718 32,091,417 20,970,788 730,884 112,282,470 220,399,930
12/31/2015 3,911,567,544 1,566,065,305 1,122,433,737 947,027,863 2,217,780,751 112,282,470 9,877,157,670
MDEP MTIP MPEP MTRP RFBP STIP TotalPublic Employees Retirement (58,325,558) 13,721,230 (9,846,050) (10,412,735) (11,677,524) (39,613,515) (116,154,151) Teachers Retirement (55,252,819) 5,225,605 (10,468,350) (10,729,915) (15,626,878) (28,749,865) (115,602,222) Firefighters Retirement 574,786 2,681,710 779,044 439,349 1,946,328 (2,579,684) 3,841,534 Police Retirement (588,742) 2,172,368 429,963 176,580 1,258,787 (2,685,771) 763,186 Sheriffs Retirement (1,651,581) 1,509,960 (85,463) (217,141) 317,926 (2,300,036) (2,426,334) Game Wardens Retirement 1,093,700 1,545,796 470,257 255,993 1,245,094 (1,638,770) 2,972,071 Highway Patrol Retirement (1,246,842) 464,130 (180,955) (209,590) (142,252) (1,357,156) (2,672,665) Judges Retirement (601,173) 408,780 (40,132) (98,462) 37,432 (922,926) (1,216,481) Vol. Firefighters Retirement (378,623) 98,185 (59,676) (69,013) (83,273) (272,821) (765,221)
12/31/2014 - 12/31/2015 (116,376,851) 27,827,765 (19,001,361) (20,864,934) (22,724,359) (80,120,543) (231,260,283)
MDEP MTIP MPEP MTRP RFBP STIP Total12/31/2014 3,990,226,051 1,595,266,204 1,066,915,022 851,620,650 2,229,584,561 192,013,048 9,925,625,537
Dollar Value Added 37,718,344 (57,028,664) 74,520,076 116,272,147 10,920,548 389,965 182,792,416 Dividend and Interest Distributed (16,376,851) (8,172,235) (6,001,361) (30,864,934) (70,724,359) (389,965) (132,529,705) Pools Bought (Sold) (100,000,000) 36,000,000 (13,000,000) 10,000,000 48,000,000 (79,730,578) (98,730,578)
12/31/2015 3,911,567,544 1,566,065,305 1,122,433,737 947,027,863 2,217,780,751 112,282,470 9,877,157,670 $ Change From 12/31/2014 (78,658,507) (29,200,899) 55,518,715 95,407,213 (11,803,811) (79,730,578) (48,467,867) % Change From 12/31/2014 (2.0%) (1.8%) 5.2% 11.2% (0.5%) (41.5%) (0.5%)
12/31/2015CY 2014 - CY 2015
Pool Changes from Last Period
Net Plan Contributions (Distributions)
Plan Asset Allocation
Pension and Pool Cash Exposure
Allocation Changes from Last Period
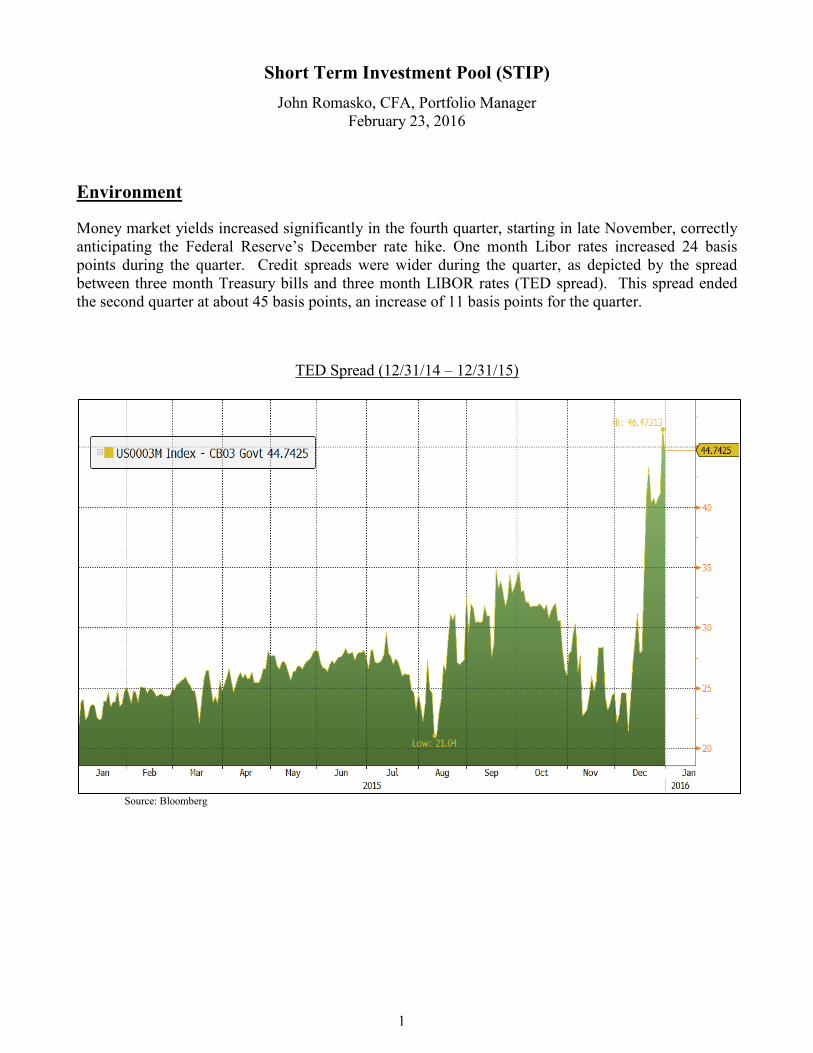
1
Short Term Investment Pool (STIP)
John Romasko, CFA, Portfolio Manager February 23, 2016
Environment Money market yields increased significantly in the fourth quarter, starting in late November, correctly anticipating the Federal Reserve’s December rate hike. One month Libor rates increased 24 basis points during the quarter. Credit spreads were wider during the quarter, as depicted by the spread between three month Treasury bills and three month LIBOR rates (TED spread). This spread ended the second quarter at about 45 basis points, an increase of 11 basis points for the quarter.
TED Spread (12/31/14 – 12/31/15)
Source: Bloomberg

2
Characteristics The STIP portfolio is currently well diversified.
Daily liquidity is at a minimum of $150 million and weekly liquidity is at a minimum of $250 million.
During the third quarter we purchased $50 million of floating rate agencies. We also purchased $80 million of floating rate Yankee CDs and corporate notes. We sold one floating rate note for $20 million.
STIP Policy RangeWeighted Average Maturity 35 Days Maximum 60 DaysU.S. Treasury Securities 0% 100% MaximumU.S. Government Agency Securities 10% 65% Maximum
Largest Agency Issuer 4% 25% MaximumCorporate CP, bonds, notes 30% 40% Maximum
Corporate CP 7% 40% MaximumCorporate bonds, notes 23% 25% Maximum
Certificates of Deposit 25% 30% MaximumAsset Backed C P(ABCP) 22% 40% MaximumMoney Market Funds 11% 15% MaximumOther - SIV 1%Largest Non-Gov't Issuer > 7 Days 2% 2% MaximumLargest Non-Gov't Issuer Total 2% 3% MaximumLargest Non-financial Industry 6% 15% MaximumCollateral Concentration not measured 10% MaximumMaximum Maturity Fixed 197 Days Maximum 397 DaysMaximum Maturity Floating 676 Days Maximum 2yrsNon-Gov't Maturities > 1 year 23% Maximum 25%Minimum one-day liquidity see below Minimum 5%Minimum one-week liquidity by observation Minimum 10%
Short Term Investment Pool (STIP) Guidelines 12/31/15

3
State entities made up 71% of STIP. Municipalities made up 29%.
STIP BALANCES 12/31/16
STIP as a % of
Account Name % Total Total Shares Client's Holdings
TREASURE ST. OF MT 27.8% 685,348,945 81.4%
MT STATE UNIVERSITY 5.0% 123,851,958 88.7%
YELLOWSTONE CO TREAS 4.5% 110,105,087 100.0%
LEWIS & CLARK CO TRE 3.1% 75,573,167 100.0%
MISSOULA CNTY TREAS 2.9% 71,036,559 100.0%
FIRE SUPPRESSION FU 2.7% 66,356,495 100.0%
GALLATIN CO. TREAS 2.6% 63,000,000 100.0%
PUBLIC EMPLOYEES RET 2.4% 58,209,690 1.2%
BUTTE SILVER BOW TRE 2.3% 57,000,110 100.0%
LONG RANGE BUILDING 2.2% 54,027,285 100.0%
TRUST FUND INVS POOL 1.6% 40,456,653 1.8%
TEACHERS RETIREMENT 1.5% 37,983,235 1.1%
CITY OF HELENA/FINAN 1.4% 35,719,343 100.0%
CITY OF BILLINGS 1.4% 35,581,059 100.0%
MSU BLGS STIP CLEAR 1.3% 31,954,713 100.0%
AGENCY INSURANCE 1.2% 30,393,426 100.0%
ROOSEVELT CNTY TRES 1.1% 27,413,343 100.0%
CASCADE CO. TREASURE 1.0% 24,567,867 100.0%
LICENSE ACCT 1.0% 23,807,143 79.0%
MT REAL ESTATE POOL 0.9% 20,970,788 2.2%
67.9% 1,673,356,865
OTHER STATE ENTITIES 23.0% 565,562,411
OTHER MUNICIPALITIES 9.1% 224,924,334
32.1% 790,486,744
100.0% 2,463,843,610
STATE ENTITIES 70.6% 1,738,922,742
MUNICIPALITIES 29.4% 724,920,867
100.0% 2,463,843,610
TOTAL STATE ENTITIES 70.6% 1,738,922,742
TOTAL MUNICIPALITIES 29.4% 724,920,867
- Municipal

4
Performance The net daily yield on STIP finished the quarter at 0.35% as compared to the quarter end one-month LIBOR rate of 0.43%. The STIP yield increased .08% from the previous quarter end, trailing the .24% increase in 1 month LIBOR. STIP is expected to trail movements in LIBOR, particularly around movements due to fed funds target rates. The current fed funds target rate is 0.25%-0.50%.
The STIP net yield subtracts the reserve and administrative expenses from the gross yield. The amounts subtracted are in actual dollars. The percentage reduction in yield is a function of the absolute dollars and the size of the portfolio. The quarter end impact is shown below.
The reserve is available to offset losses, including any potential losses from the residual assets of the former SIV’s as shown below.
STIP Portfolio Size, Yield and Reserve Impact4Q15 3Q15
Avg STIP Portfolio $2.32B $2.45BSTIP Quarter End $2.49B $2.39B
Total Reserve 30,591,091$ 29,435,971$
Daily Reserve ($) 8,000$ 8,000$ Daily Administrative Expense 2,410$ 2,410$
Gross Yield Quarter End 0.51% 0.43%Reserve Yield Impact -0.12% -0.12%Administrative Yield Impact -0.04% -0.04%
Net Yield Quarter End 0.35% 0.27%
Residual Assets from the Former SIV's4Q15 3Q15 Change
Book Value 25,317,217$ 26,377,006$ (1,059,789)$
STIP Performance (12/31/15) 1 Year 3 Year 5 Year 10 Year
STIP Net of Fees/Reserve 0.22% 0.17% 0.22% 1.52% Libor 1 Month Index 0.21% 0.18% 0.20% 1.45% iMoneynet First Tier Instit. (Gross) 0.25% 0.22% 0.24% 1.57%
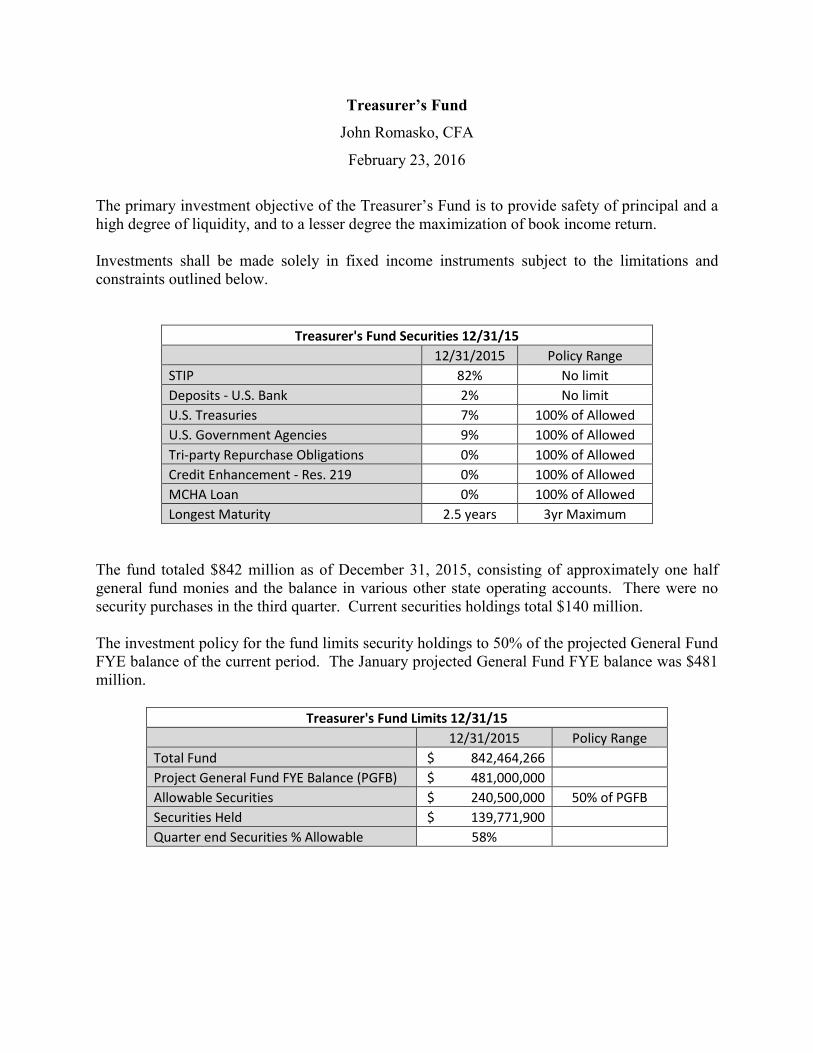
Treasurer’s Fund
John Romasko, CFA
February 23, 2016
The primary investment objective of the Treasurer’s Fund is to provide safety of principal and a high degree of liquidity, and to a lesser degree the maximization of book income return. Investments shall be made solely in fixed income instruments subject to the limitations and constraints outlined below.
Treasurer's Fund Securities 12/31/15 12/31/2015 Policy Range STIP 82% No limit Deposits - U.S. Bank 2% No limit U.S. Treasuries 7% 100% of Allowed U.S. Government Agencies 9% 100% of Allowed Tri-party Repurchase Obligations 0% 100% of Allowed Credit Enhancement - Res. 219 0% 100% of Allowed MCHA Loan 0% 100% of Allowed Longest Maturity 2.5 years 3yr Maximum
The fund totaled $842 million as of December 31, 2015, consisting of approximately one half general fund monies and the balance in various other state operating accounts. There were no security purchases in the third quarter. Current securities holdings total $140 million. The investment policy for the fund limits security holdings to 50% of the projected General Fund FYE balance of the current period. The January projected General Fund FYE balance was $481 million.
Treasurer's Fund Limits 12/31/15 12/31/2015 Policy Range Total Fund $ 842,464,266 Project General Fund FYE Balance (PGFB) $ 481,000,000 Allowable Securities $ 240,500,000 50% of PGFB Securities Held $ 139,771,900 Quarter end Securities % Allowable 58%

1
INTERNAL FIXED INCOME MANAGEMENT OVERVIEW & STRATEGY Nathan Sax, CFA, Portfolio Manager
February 23, 2016
RETIREMENT & TRUST FUND BOND POOLS Strategy/Economic Commentary The yield on the benchmark U.S. Treasury 10-year note ended the fourth quarter at a yield-to-maturity of 2.27%, 23 basis points higher than the prior quarter-end. A much anticipated rise in the target Federal Funds rate took place on December 16 when the Federal Reserve set a new target range of 25-50 basis points. This marks the first change following a seven-year period where short-term rates were held between zero and 25 basis points.
4Q15 Historical Yield Curve – Quarterly Comparison
Source: Bloomberg Real GDP in the fourth quarter 2015 was reported at an annualized rate of +0.7%, following a pace of +2.0% in the third quarter. The year 2015 is estimated at +2.4% GDP, approximately the same rate of growth as 2014. Weakness in exports has continued because of strength in the U.S. dollar. This may be exacerbated by the Bank of Japan’s announcement regarding a new policy of negative interest rates. The Bank of Japan will charge for some reserves banks hold with them. The slower pace of growth in the fourth quarter in the U.S. took place amid slowing inventory investment and cuts in capital investment. Consumer spending grew at a respectable 2.2% and 851,000 jobs were added during the quarter, an average of 283,000 per month. After-tax income was up 3.2% for the quarter but the savings rate increased to 5.4%, the highest level since 2012. Thus, consumers were increasing their savings rather than spending. As shown in the following graph, High Yield option-adjusted spreads reached 7.90% before tightening modestly. In comparison, Investment Grade bond spreads were at recent wides: +196 on February 2. Both sectors, despite recent spread widening, would have to widen a great deal more to approach the kind of deterioration seen during the Great Financial Crisis of 2008.
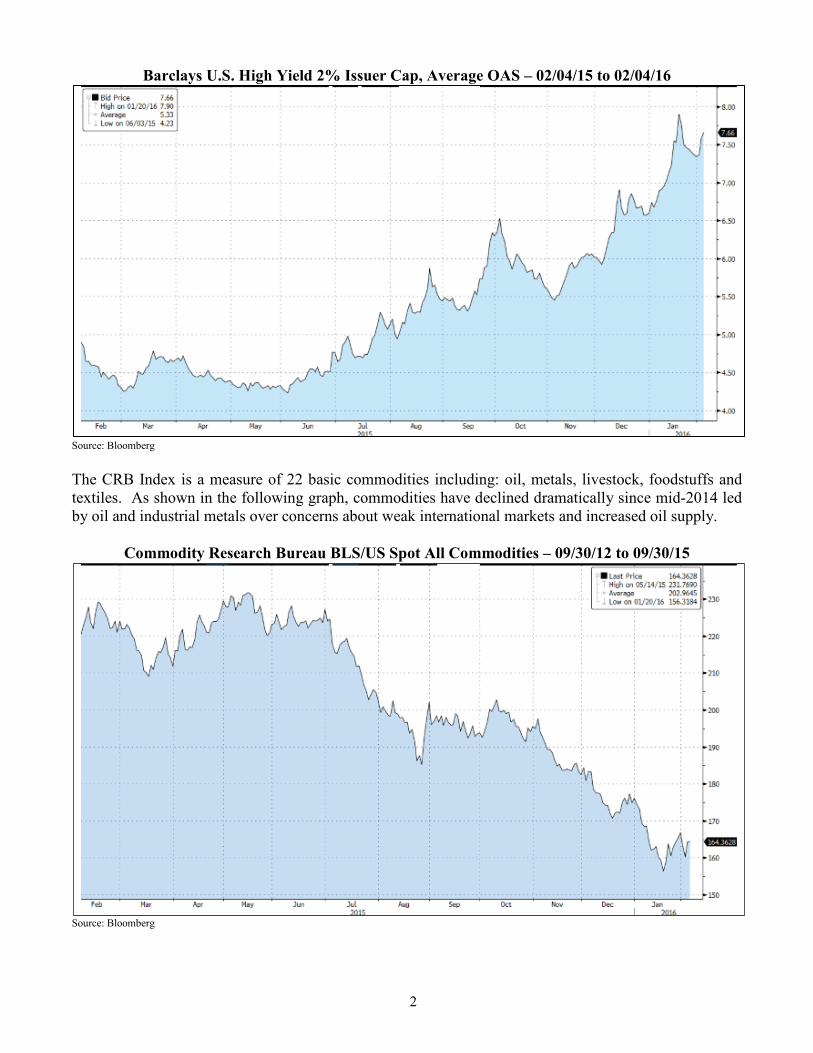
2
Barclays U.S. High Yield 2% Issuer Cap, Average OAS – 02/04/15 to 02/04/16
Source: Bloomberg The CRB Index is a measure of 22 basic commodities including: oil, metals, livestock, foodstuffs and textiles. As shown in the following graph, commodities have declined dramatically since mid-2014 led by oil and industrial metals over concerns about weak international markets and increased oil supply.
Commodity Research Bureau BLS/US Spot All Commodities – 09/30/12 to 09/30/15
Source: Bloomberg

3
Concluding Comments The internally managed pools continue to keep their duration slightly longer than that of the index. Both the CIBP and the TFIP have modest yield advantages to the yield of the Barclays Aggregate bond index. Governments and agencies are underweight the index while investment grade credit, CMBS and asset backed securities are more heavily weighted versus their index components. All sectors have been placing emphasis on issue size, liquidity, and an up-in-quality bias in consideration of liquidity concerns. As such, the portfolios do not have the yield they might have otherwise so that we can better withstand periods of volatility and market disruption. 12/31/15 Performance (%)
3 Month Fiscal YTD 1 Year 3 Year 5 Year 10 Year
CORE INTERNAL BOND PORTFOLIO (0.89) 0.62 0.83 1.81 3.91 5.14 TRUST FUNDS BOND POOL (0.83) 0.73 1.03 2.07 4.07
Barclays Aggregate (0.57) 0.65 0.55 1.44 3.25 4.52

4
Portfolio Characteristics - Core Internal Bond Pool: December 31, 2015
Portfolio Metrics
Sector Weights
CIBP Merrill U.S. Broad
Index
CIBP Barclays
Aggregate Policy Range
Total Market Value $1.82B $22.54T
Treasuries 24.14% 36.43% 15-45% # of issues 300 13,280
Agency/Govt Related 5.76% 8.20% 5-15%
Effective Duration 5.51 5.43
ABS 5.69% 0.56% 0-7% Spread Duration 5.8 5.75
MBS 23.49% 28.64% 20-40%
Yield to Maturity 2.76% 2.53%
CMBS 8.00% 1.83% 0-12% Average Quality Aa3 Aa1
Financial 11.68% 7.61%
Industrial 16.42% 14.85%
Utility 2.68% 1.81%
TOTAL Corporate 30.78% 24.27% 10-40%
Cash 2.14% 0.07%
Credit Quality (Moody's)
Duration Distribution
CIBP Barclays
Aggregate Difference
CIBP Merrill U.S. Broad Index Difference
AAA 64.62% 71.81% -7.19%
0 -1 6.08% 1.35% 4.73% AA 6.19% 4.43% 1.76%
1 - 3 21.68% 31.15% -9.47%
A 11.00% 10.59% 0.41%
3 - 5 28.07% 32.27% -4.20% BBB 16.69% 13.17% 3.52%
5 - 7 21.61% 13.47% 8.14%
BB 1.50% 0.00% 1.50%
7 - 10 11.59% 7.92% 3.67% B 0.00% 0.00% 0.00%
10+ 10.97% 13.84% -2.87%
CCC/D 0.00% 0.00% 0.00%
* Internal ratings have been applied to certain bonds.

5
Portfolio Characteristics - Trust Funds Bond Pool: December 31, 2015
Portfolio Metrics
Sector Weights
TFBP Merrill U.S. Broad
Index
TFBP Barclays
Aggregate Policy Range
Total Market Value $1.98B $22.54T
Treasuries 24.70% 36.43% 15-45% # of issues 327 13,280
Agency/Govt Related 5.07% 8.20% 5-15%
Effective Duration 5.54 5.43
ABS 5.49% 0.56% 0-7% Spread Duration 5.84 5.75
MBS 23.30% 28.64% 20-40%
Yield to Maturity 2.85% 2.53%
CMBS 8.00% 1.83% 0-12% Average Quality Aa3 Aa1
Financial 10.98% 7.61%
Industrial 17.25% 14.85%
Utility 3.15% 1.81%
TOTAL Corporate 31.38% 24.27% 10-40%
Cash 2.06% 0.07%
Credit Quality (Moody's)
Duration Distribution
TFBP Barclays
Aggregate Difference
TFBP Merrill U.S. Broad Index Difference
AAA 66.16% 71.81% -5.65%
0 -1 7.12% 1.35% 5.77% AA 3.46% 4.43% -0.97%
1 - 3 20.84% 31.15% -10.31%
A 11.00% 10.59% 0.41%
3 - 5 28.31% 32.27% -3.96% BBB 17.10% 13.17% 3.93%
5 - 7 21.05% 13.47% 7.58%
BB 2.27% 0.00% 2.27%
7 - 10 10.48% 7.92% 2.56% B 0.00% 0.00% 0.00%
10+ 12.20% 13.84% -1.64%
CCC/D 0.02% 0.00% 0.02%
* Internal ratings have been applied to certain bonds.

Portfolio Metrics Sector Weights
CIBPMerrill U.S. Broad Index
CIBPBarclays
AggregatePolicy Range
Total Market Value $1.82B $22.54T Treasuries 24.14% 36.43% 15-45%# of issues 300 13,280 Agency/Govt Related 5.76% 8.20% 5-15%Effective Duration 5.51 5.43 ABS 5.69% 0.56% 0-7%Spread Duration 5.8 5.75 MBS 23.49% 28.64% 20-40%Yield to Maturity 2.76% 2.53% CMBS 8.00% 1.83% 0-12%Average Quality Aa3 Aa1 Financial 11.68% 7.61%
Industrial 16.42% 14.85% Utility 2.68% 1.81%TOTAL Corporate 30.78% 24.27% 10-40%Cash 2.14% 0.07%Total 100.00% 100.00%
Credit Quality (Moody's) Duration Distribution
CIBPBarclays
AggregateDifference CIBP
Merrill U.S. Broad Index
Difference
AAA 64.62% 71.81% -7.19% 0 -1 6.08% 1.35% 4.73%AA 6.19% 4.43% 1.76% 1 - 3 21.68% 31.15% -9.47%A 11.00% 10.59% 0.41% 3 - 5 28.07% 32.27% -4.20%BBB 16.69% 13.17% 3.52% 5 - 7 21.61% 13.47% 8.14%BB 1.50% 0.00% 1.50% 7 - 10 11.59% 7.92% 3.67%B 0.00% 0.00% 0.00% 10+ 10.97% 13.84% -2.87%CCC/D 0.00% 0.00% 0.00% Total 100.00% 100.00% 0.00%Total 100.00% 100.00% 0.00%* Internal ratings have been applied to certain bonds.
Portfolio Characteristics - Core Internal Bond Pool: December 31, 2015

Portfolio Metrics Sector Weights
TFBPMerrill U.S. Broad Index
TFBPBarclays
AggregatePolicy Range
Total Market Value $1.98B $22.54T Treasuries 24.70% 36.43% 15-45%# of issues 327 13,280 Agency/Govt Related 5.07% 8.20% 5-15%Effective Duration 5.54 5.43 ABS 5.49% 0.56% 0-7%Spread Duration 5.84 5.75 MBS 23.30% 28.64% 20-40%Yield to Maturity 2.85% 2.53% CMBS 8.00% 1.83% 0-12%Average Quality Aa3 Aa1 Financial 10.98% 7.61%
Industrial 17.25% 14.85% Utility 3.15% 1.81%TOTAL Corporate 31.38% 24.27% 10-40%Cash 2.06% 0.07%Total 100.00% 100.00%
Credit Quality (Moody's) Duration Distribution
TFBPBarclays
AggregateDifference TFBP
Merrill U.S. Broad Index
Difference
AAA 66.16% 71.81% -5.65% 0 -1 7.12% 1.35% 5.77%AA 3.46% 4.43% -0.97% 1 - 3 20.84% 31.15% -10.31%A 11.00% 10.59% 0.41% 3 - 5 28.31% 32.27% -3.96%BBB 17.10% 13.17% 3.93% 5 - 7 21.05% 13.47% 7.58%BB 2.27% 0.00% 2.27% 7 - 10 10.48% 7.92% 2.56%B 0.00% 0.00% 0.00% 10+ 12.20% 13.84% -1.64%CCC/D 0.02% 0.00% 0.02% Total 100.00% 100.00% 0.00%Total 100.01% 100.00% 0.00%* Internal ratings have been applied to certain bonds.
Portfolio Characteristics - Trust Funds Bond Pool: December 31, 2015

Par Book Market Price Name Coupon % MaturityRating M/S&P Comments
$3.000 $3.040 $1.860 $62.00 Teck Resources Limited 3.000 03/01/19 Ba3/BB
Teck was downgraded in Sept. of 2015 due to stress in the Metals and Mining industry along with required continuing capital expenditures for tar sands development
$10.000 $10.451 $10.090 $100.90 Edgewell Personal Care 4.700 05/19/21 Ba1/BB
Edgewell is the survivor of the Energizer company after the spinoff of the battery and light units. The company was downgraded in August of 2015 due to reduced size and product diversity.
$17.000 $17.424 $10.450 $61.47 Talen Energy Supply 4.600 12/15/21 Ba3/BB-
In June of 2014 PPL announced its intention to spin out PPL Energy Supply into a new corporation to be combined with the generation assets of a private equity company and renamed Talen Energy Supply. The rating agencies downgraded PPL Energy Supply in anticipation of higher leverage and the removal of PPL parent support, since realized
$30.000 $30.000 $33.199 $110.66 DOT Headquarters II Lease 6.001 12/07/21 NR/BB+
The bond was insured by XL Capital which has defaulted. However, lease payments are guaranteed by the US govt and the bond is collateralized by the building.
$5.000 $4.784 $3.700 $74.00 American Presidents Co 8.000 01/15/24 NR/NR
Downgraded to below investment grade in December of 1997 due to high leverage and overall stress in the industry. The rating was dropped in August of 1999 when the company was acquired by NOL. NOL is wholly owned by AAA rated TEMASEK which will likely continue support.
$10.000 $0.000 $0.743 $7.43 Lehman Brothers 5.500 05/25/10 NR/NR Currently in default and liquidation$75.000 $65.699 $60.042
A
None
D = Deletions since 09/30/15None
$10.000 $0.000 $0.743 $7.430 Lehman Brothers 5.500 05/25/10 NR/NR Currently in default and liquidation
BELOW INVESTMENT GRADE FIXED INCOME HOLDINGS (INTERNALLY MANAGED)
In default
December 31, 2015(in millions)
= Additions since 09/30/15

Total In Default In Default of TotalDate Market Market(1) of Mkt. (par) (market) Market
12/31/2010 $73.4 $4,697.5 1.56% $15.0 $3.4 0.07%9/30/2010 $102.9 $4,853.6 2.12% $15.0 $3.3 0.07%6/30/2010 $91.3 $4,734.8 1.93% $15.0 $3.0 0.06%
6/30/2009 $61.3 $4,376.4 1.40% $15.0 $2.2 0.05%6/30/2008 $26.7 $4,382.3 0.61% $0.0 $0.00 0.00%6/30/2007 $54.7 $4,034.0 1.36% $0.0 $0.00 0.00%6/30/2006 $106.2 $3,820.6 2.78% $10.0 $0.01 0.00%6/30/2005 $90.3 $3,785.1 2.39% $10.0 $0.01 0.00%6/30/2004 $92.3 $3,472.7 2.66% $10.0 $3.75 0.11%6/30/2003 $159.0 $3,447.9 4.61% $41.0 $11.11 0.32%6/30/2002 $168.5 $3,508.7 4.80% $35.0 $5.05 0.14%6/30/2001 $90.4 $3,632.0 2.49% $0.0 $0.0 0.00%6/30/2000 $87.4 $3,446.9 2.53% $0.0 $0.0 0.00%6/30/1999 $77.5 $3,435.2 2.26% $0.0 $0.0 0.00%6/30/1998 $73.3 $3,523.1 2.08% $0.0 $0.0 0.00%6/30/1997 $71.4 $3,153.3 2.26% $0.0 $0.0 0.00%6/30/1996 $133.9 $3,026.8 4.42% $0.0 $0.0 0.00%
As % of Total Fixed Income HoldingsBELOW INVESTMENT GRADE FIXED INCOME HOLDINGS
(1) Excludes STIP

MEMORANDUM Montana Board of Investments Department of Commerce 2401 Colonial Drive, 3rd Floor Helena, MT 59601 (406) 444-0001 To: Montana Board of Investments
From: Nathan Sax Date: February 23, 2016 Subject: Investment Policy MUS Workers Compensation The Montana University System (Self-Funded Workers Compensation Program) would like to expand their investment universe beyond STIP. They had been invested solely in STIP since starting operation in 2003. They have approval from the Self-Funded Workers’ Compensation Committee to invest $5 million currently in the Trust Fund Investment Pool (TFIP). This represents approximately 27% of current portfolio market value. The Committee authorized an investment up to 35% of invested assets into TFIP. I am recommending Board approval for this change with the understanding that the Workers’ Compensation Finance Subcommittee of the Montana University System has authorized the Program Director to take this step. Within this new structure, MUS Workers Compensation will still have sufficient cash to meet their liquidity needs.

Page 1 of 1 Pending Approval: February 23, 2016
MONTANA BOARD OF INVESTMENTS
MONTANA UNIVERSITY SYSTEM (FUND 06082) Workers Compensation
INVESTMENT POLICY STATEMENT
INTRODUCTION MUS began operations on July 1, 2003 as a self-insurance program to provide workers compensation coverage for the Montana University System. This is an operating account requiring liquidity; historically funds have been invested solely in the Short Term Investment Pool. However, the account has accumulated an excess of reserves so that some investment in the TFIP shall be considered prudent in order to achieve a higher level of investment income. OBJECTIVE The investment objective is to preserve principal through conservative risk parameters and to allow for liquidity needs. To the extent possible, incremental income may also be added through exposure to moderately longer maturities through exposure to the Trust Fund Investment Pool. PERMISSIBLE INVESTMENTS This account may invest in STIP and TFIP.
ASSET ALLOCATION (at market)
FIXED INCOME Maximum
Trust Funds Investment Pool (TFIP) 35%
Short Term Investment Pool (STIP) 100%
Total Fixed Income 100%
LEGAL CONSIDERATIONS The Department of Labor and Industry requires the Workers’ Compensation Program to maintain adequate equity (fund balance, net position or surplus) to meet the Program’s anticipated and contingency funding needs in the event of adverse developments or uncharacteristically high costs.

1
STATE FUND INSURANCE
Jon Putnam, CFA, FRM, CAIA February 24, 2015
The tables below show the allocation of assets in the State Fund Insurance portfolio at the end of the 4th quarter across asset classes and relative to the policy statement. At year end, State Fund Insurance transitioned from a June 30th fiscal year end to a calendar year end. As part of this transition, State Fund Insurance directed MBOI to allow cash to drop below the 1-5% range at year end. Cash was back into policy range as of January 6, 2016. All other assets were within approved policy ranges.
12/31/2015 Target Policy Bonds U.S. Treasury/Agency 32.31% 20% - 45% Non-U.S. Developed Country (USD) 1.86% 0% - 5% U.S. Mortgage Backed Securities 0.30% 0% - 20% CMBS/ABS 3.25% Corporate Bonds 44.50% 30% - 55% Cash Cash 0.00% 1% - 5% Total Bond Pool 82.22% none 51% - 89% Equity Blackrock Equity Index 10.35% 6% - 12% Blackrock ACWI ex. US 1.22% 0% - 4% Total Equity 11.57% 10% 8% - 12% Real Estate TIAA CREF Core Property 2.92% American Core Realty Fund 3.29% Total Real Estate 6.21% 5% 3% - 7% Total AUM 100.00%
$1163.11 M
$146.51 M
$17.31 M $41.36 M $46.61 M $ M
$200 M
$400 M
$600 M
$800 M
$1000 M
$1200 M
$1400 M
State Fund BondPool
Blackrock EquityIndex
Blackrock ACWI ex.US
TIAA CREF CoreProperty
American CoreRealty Fund
SFBP Equity Real Estate
State Fund Investment Pool - 12/31/15
2
The chart on the following page shows the characteristics of the State Fund Bond Pool as of quarter end. The bond pool has an overweight in agencies, asset backed securities (ABS) and corporate bonds and is underweight Treasuries relative to the benchmark. The portfolio generally seeks to build in a yield advantage to the index. The primary objective of this portfolio is to maximize investment income consistent with safety of principal. The portfolio had a slightly shorter duration than the benchmark in the 4th quarter as we built cash in order for State Fund to distribute $35M of dividend payments in the 1st quarter of 2016. In addition, the Federal Reserve had telegraphed its intent to raise interest rates and rates moved higher in the quarter. During the 4th quarter, there were total purchases of $13M in the 5-10 year part of the curve consisting of $8M corporate bonds and $5M Treasury notes. This was more than offset by total maturities and sales of $18M. There were no transactions in the equity funds or core real estate during the quarter. Corporate spreads tightened 4 bps during the quarter, but were 34 basis points wider year over year ending at 165 basis points. However, spreads within the energy and metals and mining sectors widened significantly more than other corporate debt as commodity prices weakened, particularly in the second half of the year. The portfolio is slightly overweight the energy sector relative to the index but primarily in higher quality, integrated and refining names such as Conoco, Phillips 66 and Shell. The portfolio has no exposure to the metals and mining sector. The portfolio’s overweight to financials was a relative benefit as the sector held up better than other corporate debt during the year as regulatory pressures have constrained risk and M&A activity. Going forward, the intent is to move the portfolio duration back toward neutral relative to the benchmark, depending on market conditions. Corporate credit within stressed sectors of the market remains an area of concern and exposure is not expected to grow. Corporate and/or ABS exposure in select names may grow opportunistically in order to maximize investment income for the portfolio.

3
State Fund Bond Pool Characteristics: December 31, 2015
Portfolio Metrics
Sector Weights
SFBP Merrill U.S.
Govt/Corp 1-10yr
SFBP Merrill U.S.
Govt/Corp 1-10yr Difference
Total Market Value $1.16B $12.43T
Treasuries 17.32% 57.91% -40.59% # of issues 206 6,270
Agency/Govt Related 24.24% 10.86% 13.38%
Effective Duration 3.58 3.86
ABS 3.95% 0.00% 3.95% Spread Duration 3.58 3.84
MBS 0.37% 0.00% 0.37%
Yield to Maturity 2.09% 2.07%
CMBS 0.00% 0.00% 0.00% Average Quality Aa3 Aa2
Financial 26.68% 10.53% 16.15%
Industrial 23.54% 18.99% 4.55%
Utility 3.90% 1.71% 2.19%
Cash 0.00% 0.00% 0.00%
Other 0.00% 0.00% 0.00%
Total 100.00% 100.00%
Credit Quality (Lowest Rating)
Duration Distribution
SFBP Merrill U.S.
Govt/Corp 1-10yr Difference
SFBP Merrill U.S. Govt/Corp 1-10yr Difference
AAA 4.43% 4.36% 0.07%
0 -1 12.53% 1.08% 11.45% AA 45.45% 66.06% -20.61%
1 - 3 32.65% 39.86% -7.21%
A 26.94% 12.20% 14.74%
3 - 5 26.05% 30.77% -4.72% BBB 23.15% 16.74% 6.41%
5 - 7 18.96% 18.76% 0.20%
BB 0.00% 0.64% -0.64%
7 - 9 9.82% 9.53% 0.29% B 0.00% 0.00% 0.00%
9 - 10 0.00% 0.01% -0.01%
CCC/D 0.03% 0.00% 0.03%
Total 100.00% 100.00% Total 100.00% 100.00%
* Internal ratings have been applied to 1 bond representing .03% of the portfolio.

4
The table below is a summary of performance as of 12/31/15 from State Street. The portfolio has enjoyed good performance relative to the custom composite across all time periods. The custom composite index is an asset-weighted index that holds the same weights as the portfolio in each of the underlying benchmarks. State Fund Bond Pool (SFBP) returns have exceeded the benchmark due to a persistent overweight in spread product. The SFBP outperformed the benchmark by 38 basis points during the 4th quarter although the absolute return was negative. The SFBP outperformed by 64 bps in 2015 driven by a slight underweight in duration, an overweight to financials and an underweight to stressed names in the energy and metals and mining sectors. Equity was a positive driver of portfolio performance during the 4th quarter. However, it was a drag on portfolio performance relative to bonds for 2015 particularly in the international fund. Core real estate continued to be a strong performer and has boosted portfolio returns across all time periods. Real estate will begin to show 3-year performance in the 2nd quarter of 2016 as our initial investment was in April 2013.
12/31/15 Performance (%)
MANAGERS 3 Month Fiscal YTD 1 Year 3 Year 5 Year 10 Year
STATE FUND INSURANCE 0.62 0.88 2.21 3.43 4.55 5.21 BONDS STATE FUND BOND POOL -0.31 0.76 1.71 1.69 3.38 4.49 EQUITY 6.62 -0.92 0.64 13.56 11.28 6.93 BLACKROCK EQUITY INDEX 7.04 0.17 1.45 15.18 12.64 7.60 BLACKROCK ACWI ex. US 3.24 -9.31 -5.62 1.57 1.15 REAL ESTATE CORE REAL ESTATE 3.15 6.28 12.89
INDICES 3 Month Fiscal YTD 1 Year 3 Year 5 Year 10 Year
STATE FUND INSURANCE CUSTOM COMPOSITE 0.15 0.11 0.98 2.49 3.53 4.41 BARCLAYS GOVT/CREDIT INTERMEDIATE -0.69 0.25 1.07 1.10 2.58 4.04 NCREIF ODCE (1QTR LAG) 3.43 7.14 13.86 12.39 12.94 5.72 S&P 500 7.04 0.15 1.38 15.13 12.57 7.31 MSCI ACWI ex US 3.24 -9.32 -5.66 1.50 1.06 2.92

Montana Retirement Funds Bond Pool & Trust Fund Investment Pool
Rande R. Muffick, CFA, Portfolio Manager February 23, 2016
The exhibits in this section provide details on the following items:
1) Retirement Funds Bond Pool Composition and Performance: The pool consists of the Core Internal Bond Portfolio, Reams the core-plus portfolio, and the two high yield portfolios, Post Advisory, and Neuberger Berman. There were no substantial allocation changes within the pool during the quarter and all allocations are within the approved ranges. For the quarter the pool returned -0.94% vs -0.57% for the Barclays US Aggregate Bond Index. Relative performance was impacted by an overweight to high yield and a general widening of credit spreads.
2) Retirement Funds Bond Pool Characteristics: The RFBP continues to be typically underweight treasuries and agencies and overweight corporates as well as overweight asset backed and CMBS.
Duration is slightly less than the Merrill U.S. Broad Index at 5.34. Overall credit quality is steady at A1 as compared to Aa1 for the Merrill U.S. Broad Index. The pool has an effective overweight in high yield due to the core plus portfolio and the dedicated high yield portfolios. Cash is lower than last quarter at 2.6% vs 4.0%.
3) Trust Fund Investment Pool Composition and Performance:
The pool consists of the Trust Fund Bond Portfolio, Post Advisory High Yield LP, and the two core real estate funds, TIAA-CREF and American Real Estate. All allocations are within the approved ranges. The high yield allocation increased by approximately 2% from last quarter due to outperformance when compared to the Trust Fund Bond Portfolio. For the quarter the pool returned -0.51% vs - 0.57% for the Barclays US Aggregate Bond Index. Relative performance was impacted negatively by the Trust Fund Bond Portfolio, but the core real estate holdings contributed strong positive returns of over 3% for the quarter.

Portfolio Metrics Sector Weights
RFBPMerrill U.S. Broad Index
RFBPBarclays
AggregateDifference
Total Market Value $2.21B $22.54T Treasuries 24.01% 36.43% -12.42%# of issues 946 13,280 Agency/Govt Related 4.75% 8.20% -3.45%Effective Duration 5.39 5.43 ABS 4.83% 0.56% 4.27%Spread Duration 5.65 5.75 MBS 20.59% 28.64% -8.05%Yield to Maturity 3.08% 2.53% CMBS 7.16% 1.83% 5.33%Average Quality A1 Aa1 Financial 12.17% 7.61% 4.56%
Industrial 21.42% 14.85% 6.57%Utility 2.36% 1.81% 0.55%Cash 2.71% 0.07% 2.64%Other 0.00% 0.00% 0.00%Total 100.00% 100.00% 0.00%
Credit Quality (Moody's)
RFBPBarclays
AggregateDifference
AAA 60.23% 71.81% -11.58%AA 5.27% 4.43% 0.84%A 10.71% 10.59% 0.12%BBB 15.61% 13.17% 2.44%BB 4.33% 0.00% 4.33%B 2.75% 0.00% 2.75%CCC/D 1.10% 0.00% 1.10%
100.00% 100.00% 0.00%* Internal ratings have been applied to certain bonds.
Portfolio Characteristics - Retirement Funds Bond Pool: December 31, 2015

Policy RangeCore Internal Bond Pool $1,821,583,075 82.44%Reams Asset Management $232,102,106 10.50%Core (U.S. Investment Grade) Managers $2,053,685,181 92.94% 80 - 100%Neuberger Berman $99,371,201 4.50%Post Advisory Group, LLC $56,522,855 2.56%Total High Yield Managers $155,894,056 7.06% 0 - 15%Total Retirement Fund Bond Pool $2,209,579,237 100.00%
3 Month Fiscal YTD 1 Year 3 Year 5 Year 10 Year Since Incept RETIREMENT FUNDS BOND POOL (0.915) 0.156 0.587 1.976 4.200 5.371 6.698 CORE INTERNAL BOND PORTFOLIO (0.888) 0.616 0.831 1.809 3.906 5.153 6.591 REAMS ASSET MANAGEMENT (1.358) (0.272) 0.238 1.375 4.081 6.448 NEUBERGER BERMAN (1.407) (6.104) (3.891) 2.129 5.330 7.166 POST ADVISORY GROUP, LLC 0.035 (2.074) 1.429 5.899 7.601 10.629 Barclays Aggregate (Daily) (0.570) 0.654 0.550 1.443 3.247 4.515 5.486 Barclays US Universal Index - Daily (0.546) 0.129 0.430 1.506 3.460 4.925 Barclays US High Yield - 2% Issuer Cap (2.056) (6.788) (4.433) 1.704 5.034 6.623
RFBP - 12/31/15
$1821.58 M
$232.1 M $99.37 M $56.52 M
$ M
$200 M
$400 M
$600 M
$800 M
$1000 M
$1200 M
$1400 M
$1600 M
$1800 M
$2000 M
Core Internal Bond Pool Reams Asset Mgmt Neuberger Berman Post Advisory
CIBP Core Plus High Yield
Retirement Funds Bond Pool

Policy RangeTrust Fund Bond Pool $1,975,068,484 87.84% 0-100%Post Traditional High Yield Fund LP $100,425,242 4.47% 0-10%American Core Realty $98,943,426 4.40%TIAA-CREF $74,030,902 3.29%Total Core Real Estate Managers $172,974,328 7.69% 0-8%Total Trust Fund Investment Pool $2,248,468,054 100.00%
3 Month Fiscal YTD 1 Year 3 Year 5 Year 10 Year Since Incept TRUST FUNDS INVESTMENT POOL (0.500) 1.002 1.890 2.898 4.793 5.660 6.511 TRUST FUND BOND POOL (0.830) 0.730 1.030 2.070 4.070 POST TRADITIONAL HIGH YIELD FUND LP (0.038) (2.219) 1.414 5.824 7.695 AMERICAN CORE REALTY FUND 3.119 6.769 13.105 12.077 13.051 TIAA-CREF CORE PROPERTY FUND LP 3.171 5.662 12.741 10.944 12.015 Barclays Aggregate (Daily) (0.570) 0.654 0.550 1.443 3.247 4.515 Barclays US High Yield - 2% Issuer Cap (2.056) (6.788) (4.433) 1.704 5.034 NCREIF ODCE (1 Qtr Lag) 3.430 7.140 13.860 12.390 12.940 5.72
TFIP - 12/31/15
$1975.07 M
$100.43 M $172.97 M
$ M
$500 M
$1000 M
$1500 M
$2000 M
$2500 M
Trust Fund Bond Pool Post Advisory - High Yield Core Real Estate
Trust Funds Investment Pool

Back to Agenda
MDEP & MTIP
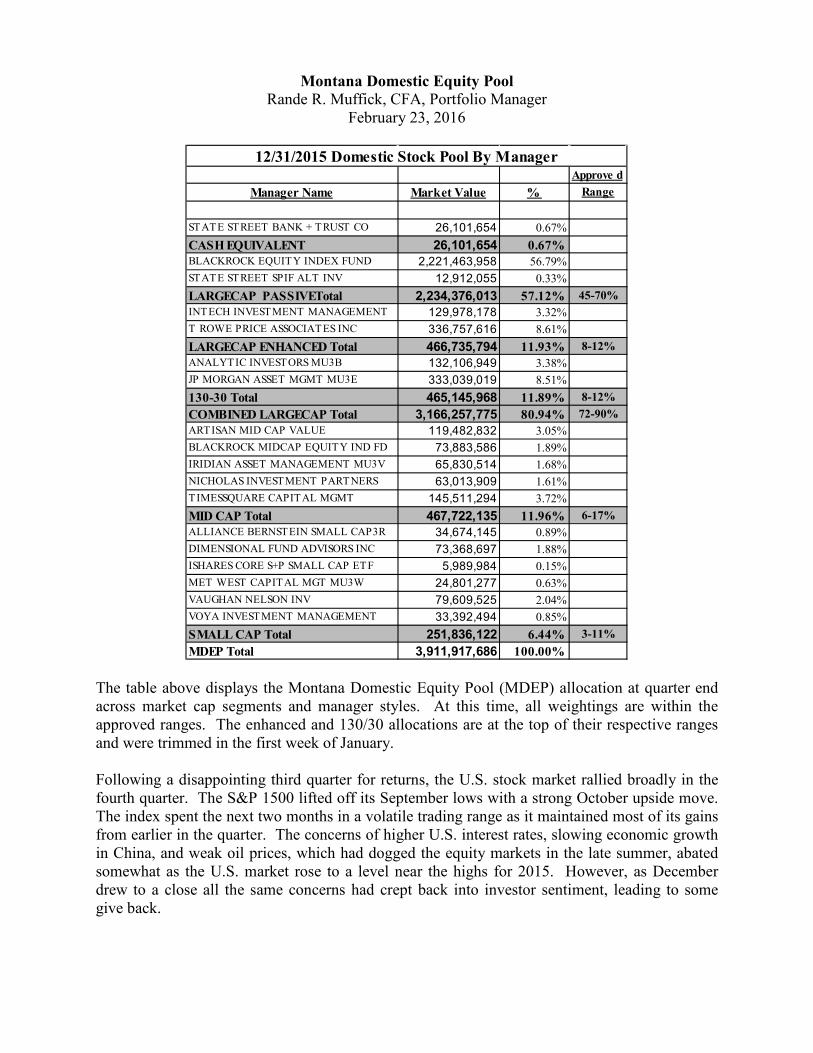
Montana Domestic Equity Pool Rande R. Muffick, CFA, Portfolio Manager
February 23, 2016
The table above displays the Montana Domestic Equity Pool (MDEP) allocation at quarter end across market cap segments and manager styles. At this time, all weightings are within the approved ranges. The enhanced and 130/30 allocations are at the top of their respective ranges and were trimmed in the first week of January. Following a disappointing third quarter for returns, the U.S. stock market rallied broadly in the fourth quarter. The S&P 1500 lifted off its September lows with a strong October upside move. The index spent the next two months in a volatile trading range as it maintained most of its gains from earlier in the quarter. The concerns of higher U.S. interest rates, slowing economic growth in China, and weak oil prices, which had dogged the equity markets in the late summer, abated somewhat as the U.S. market rose to a level near the highs for 2015. However, as December drew to a close all the same concerns had crept back into investor sentiment, leading to some give back.
Approve dManager Name Market Value % Range
STATE STREET BANK + TRUST CO 26,101,654 0.67%CASH EQUIVALENT 26,101,654 0.67%BLACKROCK EQUITY INDEX FUND 2,221,463,958 56.79%STATE STREET SPIF ALT INV 12,912,055 0.33%LARGECAP PASSIVETotal 2,234,376,013 57.12% 45-70%INTECH INVESTMENT MANAGEMENT 129,978,178 3.32%T ROWE PRICE ASSOCIATES INC 336,757,616 8.61%LARGECAP ENHANCED Total 466,735,794 11.93% 8-12%ANALYTIC INVESTORS MU3B 132,106,949 3.38%JP MORGAN ASSET MGMT MU3E 333,039,019 8.51%130-30 Total 465,145,968 11.89% 8-12%COMBINED LARGECAP Total 3,166,257,775 80.94% 72-90%ARTISAN MID CAP VALUE 119,482,832 3.05%BLACKROCK MIDCAP EQUITY IND FD 73,883,586 1.89%IRIDIAN ASSET MANAGEMENT MU3V 65,830,514 1.68%NICHOLAS INVESTMENT PARTNERS 63,013,909 1.61%TIMESSQUARE CAPITAL MGMT 145,511,294 3.72%MID CAP Total 467,722,135 11.96% 6-17%ALLIANCE BERNSTEIN SMALL CAP3R 34,674,145 0.89%DIMENSIONAL FUND ADVISORS INC 73,368,697 1.88%ISHARES CORE S+P SMALL CAP ETF 5,989,984 0.15%MET WEST CAPITAL MGT MU3W 24,801,277 0.63%VAUGHAN NELSON INV 79,609,525 2.04%VOYA INVESTMENT MANAGEMENT 33,392,494 0.85%SMALL CAP Total 251,836,122 6.44% 3-11%MDEP Total 3,911,917,686 100.00%
12/31/2015 Domestic Stock Pool By Manager

The broad based rally is evident in the market capitalization returns displayed above. Large caps led with returns in the mid to upper single digits. Mid cap and small cap returns were similar and were two to three percentage points below those of the large caps. Growth stocks outperformed value stocks within all cap sizes, no doubt partially due to the energy component of the value stocks continuing to be a drag. Large cap growth was the top performing category for the quarter and the disparity between growth and value returns was greatest within the large cap stocks. Still, all in all it was a rewarding quarter for investors no matter what cap size or style tilts their portfolios may have had.
The Volatility Index (VIX) settled into the teens as the severe stresses of late August were for the time being forgotten. The VIX displayed more volatility in its movements than earlier in the year, but still was at much lower levels than the third quarter. Equity markets have become so
Value Neutral Growth Value Neutral GrowthLa
rge
5.6% 6.5% 7.3% Larg
e
-3.8% 0.9% 5.7%
Mid
3.1% 3.6% 4.1% Mid
-4.8% -2.4% -0.2%
Smal
l
2.9% 3.6% 4.3% Smal
l
-7.5% -4.4% -1.4%
Last Twelve MonthsUS Market Environment
4Q 2015

data dependent that the daily movement of stocks and the amount of volatility experienced on a daily basis are largely determined by the daily movement of oil prices and the Chinese economic news of any particular day. MDEP underperformed by 25 basis points in the quarter as active managers as a whole added slightly to performance while the pool tilts toward mid caps and small caps detracted from performance. There was some slight cash drag to performance at the pool level as well. Within the pool, large cap active management fared well in the quarter with three of the four portfolios outperforming. This included the JP Morgan portfolio, which has struggled for much of the past twelve months. Only the INTECH portfolio failed to add value in the quarter. Mid cap active management struggled in the quarter as three of the four portfolios underperformed. This was similar to most of the past several quarters. The Artisan portfolio in particular continues to lag its benchmark significantly. Small cap active management performances were mixed. The core and value portfolios, DFA, Vaughan Nelson, and MetWest, detracted from pool performance. Both of the growth portfolios, Alliance Bernstein and Voya added to pool performance by beating their benchmarks for the quarter. The strategy going forward is to continue overweight positions within the mid cap and small cap allocations. The active/passive weights are expected to remain approximately the same. The cash level at the pool level will continue to be elevated. 12/31/15
3 Month Fiscal YTD 1 Year 3 Year 5 Year 10 Year
Montana Domestic Equity Pool 6.34 -1.20 0.86 14.97 12.19 7.01 S&P 1500 Super Composite 6.59 -0.54 1.01 14.90 12.39 7.41

DOMESTIC EXPOSURE-MARKET CAP %December 31, 2015
WTD AVGMEGA GIANT LARGE MID SMALL MICRO MARKET
MANAGERS $200B+ $100-$200B $50-$100B $20-$50B $10-$20B $2.5-$10B $500MM-$2.5B < $500MM CAP ($B)Alliance Bernstein -- -- -- -- -- 59.8 36.8 3.4 3,127 Analytic Investors, Inc 12.5 23.7 17.5 33.8 1.0 12.0 -3.0 -- 110,411 Artisan Partners -- -- -- 8.3 24.6 61.9 5.2 -- 10,834 Dimensional Fund Advisors -- -- -- -- 0.2 26.6 60.8 12.4 1,816 INTECH Investment Management 9.8 13.1 11.8 36.4 18.5 10.3 -- -- 83,230 Iridian Asset Mgmt -- -- -- 26.3 12.9 55.5 5.3 -- 14,657 J.P. Morgan 18.6 13.3 30.6 26.5 5.1 3.6 0.4 -- 129,072 Met West Capital Mgt -- -- -- -- -- 40.0 57.4 2.6 2,509 Nicholas Investment Partners -- -- -- 21.2 33.4 43.0 2.4 -- 13,109 T. Rowe Associates 21.0 22.0 16.8 20.6 12.8 6.7 -- -- 134,412 TimesSquare Cap Mgmt -- -- -- 12.1 38.8 45.9 3.3 -- 11,290 Vaughan Nelson Mgmt -- -- -- -- -- 63.3 36.3 0.4 2,898 Voya Investment Management -- -- -- -- -- 47.6 51.5 0.9 2,737 BlackRock S&P 500 Index Fund 21.2 23.1 17.3 22.2 11.1 4.9 -- -- 139,310 BlackRock Midcap Equity Index Fund -- -- -- -- 4.3 81.8 13.7 -- 4,964 Domestic Equity Pool SPIF 21.3 23.1 17.3 22.2 11.1 4.9 -- -- 139,310 iShares S&P 600 Index ETF -- -- -- -- -- 16.4 78.2 5.3 1,605
ALL DOMESTIC EQUITY PORTFOLIOS 16.4 17.6 15.1 20.7 11.6 14.2 3.8 0.3 110.9 Benchmark: S&P Composite 1500 19.0 20.7 15.5 19.9 10.3 11.0 3.5 0.2 125.1 Over/underweight(-) -2.6 -3.1 -0.5 0.8 1.4 3.3 0.3 0.1
MEGA GIANT LARGE MID SMALL MICRO$200B+ $100-$200B $50-$100B $20-$50B $10-$20B $2.5-$10B $500MM-$2.5B < $500MM
-4.0
-3.0
-2.0
-1.0
0.0
1.0
2.0
3.0
4.0

DOMESTIC EXPOSURE-SECTOR %December 31, 2015
Consumer Consumer Health TelecomMANAGERS Discretionary Staples Energy Financials Care Industrials Technology Materials Services Utilities
Alliance Bernstein 18.2 1.5 2.2 7.1 26.4 14.0 27.9 2.7 -- --Analytic Investors, Inc 12.7 9.3 6.9 13.9 14.4 6.0 23.0 3.7 3.6 3.9Artisan Partners 17.8 1.3 6.9 25.7 -- 16.9 17.3 8.6 -- 5.4Dimensional Fund Advisors 17.1 5.0 2.6 20.6 10.1 17.3 17.8 4.4 0.9 4.3INTECH Investment Management 15.5 11.5 3.6 17.5 17.6 9.9 15.7 4.3 0.7 3.8Iridian Asset Mgmt 14.3 6.0 4.7 2.1 14.8 15.5 15.3 27.3 -- --J.P. Morgan 16.8 3.5 6.6 21.0 15.5 8.3 24.8 1.7 -- -0.2Met West Capital Mgt 11.2 6.0 8.2 32.2 9.3 17.1 8.9 3.7 -- 1.9Nicholas Investment Partners 26.2 6.9 1.9 12.8 11.9 12.8 22.2 4.0 1.3 --T. Rowe Associates 13.4 9.5 5.7 16.2 15.2 9.5 21.3 4.0 1.9 3.2TimesSquare Cap Mgmt 17.0 4.7 1.4 12.0 13.9 24.6 19.5 2.7 4.4 --Vaughan Nelson Mgmt 8.4 -- 2.6 24.0 14.9 18.2 12.3 9.6 -- 7.6Voya Investment Management 16.8 2.8 1.4 8.7 24.4 15.0 25.3 4.4 -- --BlackRock S&P 500 Index Fund 12.9 10.1 6.5 16.4 15.1 10.0 20.7 2.8 2.4 3.0BlackRock Midcap Equity Index Fund 12.8 3.5 3.0 27.0 9.8 15.1 16.7 6.4 0.2 5.1Domestic Equity Pool SPIF 12.9 10.1 6.5 16.5 15.2 10.0 20.7 2.8 2.4 3.0iShares S&P 600 Index ETF 13.9 2.8 2.5 24.4 13.5 16.9 16.6 4.5 0.9 4.1
All Domestic Equity Portfolios 13.9 8.3 5.8 17.0 14.6 11.1 20.5 3.7 1.9 2.7Benchmark: S&P Composite 1500 12.9 9.4 6.1 17.5 14.7 10.6 20.3 3.1 2.2 3.2Over/underweight(-) 1.0 -1.1 -0.3 -0.5 -0.1 0.5 0.2 0.6 -0.3 -0.4
Consumer Consumer Health TelecomDiscretionary Staples Energy Financials Care Industrials Technology Materials Services Utilities
-1.5
-1.0
-0.5
0.0
0.5
1.0
1.5
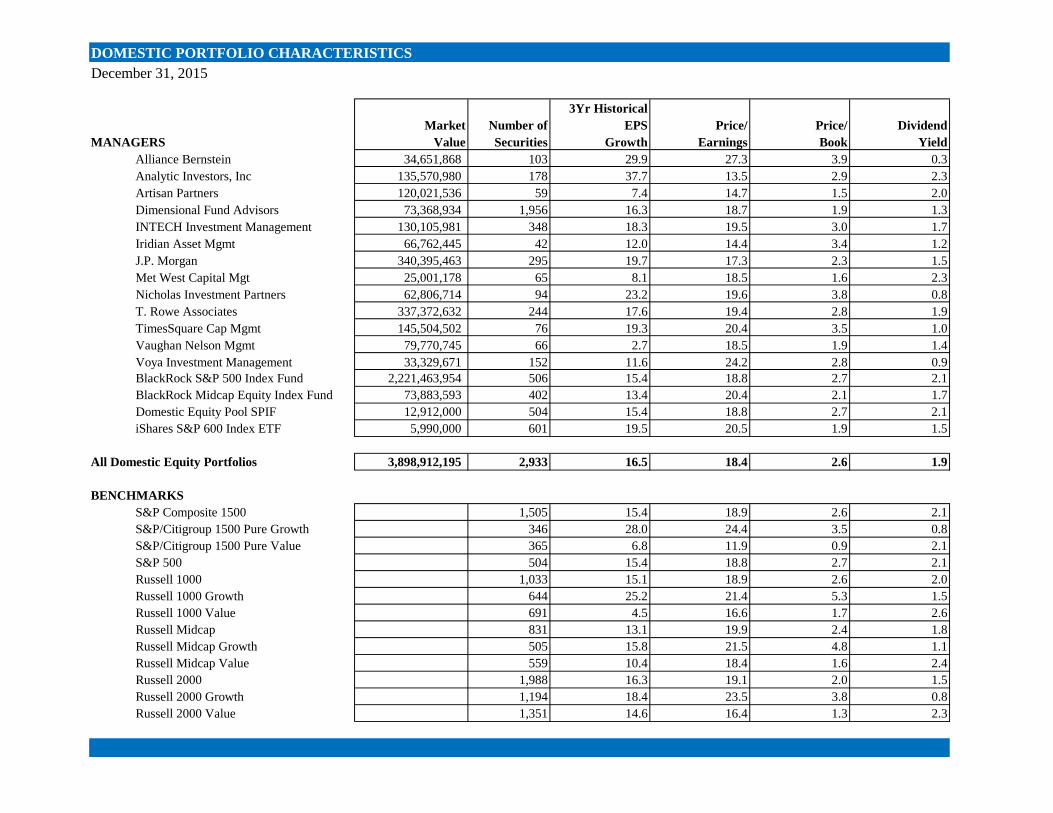
DOMESTIC PORTFOLIO CHARACTERISTICSDecember 31, 2015
3Yr HistoricalMarket Number of EPS Price/ Price/ Dividend
MANAGERS Value Securities Growth Earnings Book YieldAlliance Bernstein 34,651,868 103 29.9 27.3 3.9 0.3Analytic Investors, Inc 135,570,980 178 37.7 13.5 2.9 2.3Artisan Partners 120,021,536 59 7.4 14.7 1.5 2.0Dimensional Fund Advisors 73,368,934 1,956 16.3 18.7 1.9 1.3INTECH Investment Management 130,105,981 348 18.3 19.5 3.0 1.7Iridian Asset Mgmt 66,762,445 42 12.0 14.4 3.4 1.2J.P. Morgan 340,395,463 295 19.7 17.3 2.3 1.5Met West Capital Mgt 25,001,178 65 8.1 18.5 1.6 2.3Nicholas Investment Partners 62,806,714 94 23.2 19.6 3.8 0.8T. Rowe Associates 337,372,632 244 17.6 19.4 2.8 1.9TimesSquare Cap Mgmt 145,504,502 76 19.3 20.4 3.5 1.0Vaughan Nelson Mgmt 79,770,745 66 2.7 18.5 1.9 1.4Voya Investment Management 33,329,671 152 11.6 24.2 2.8 0.9BlackRock S&P 500 Index Fund 2,221,463,954 506 15.4 18.8 2.7 2.1BlackRock Midcap Equity Index Fund 73,883,593 402 13.4 20.4 2.1 1.7Domestic Equity Pool SPIF 12,912,000 504 15.4 18.8 2.7 2.1iShares S&P 600 Index ETF 5,990,000 601 19.5 20.5 1.9 1.5
All Domestic Equity Portfolios 3,898,912,195 2,933 16.5 18.4 2.6 1.9
BENCHMARKSS&P Composite 1500 1,505 15.4 18.9 2.6 2.1S&P/Citigroup 1500 Pure Growth 346 28.0 24.4 3.5 0.8S&P/Citigroup 1500 Pure Value 365 6.8 11.9 0.9 2.1S&P 500 504 15.4 18.8 2.7 2.1Russell 1000 1,033 15.1 18.9 2.6 2.0Russell 1000 Growth 644 25.2 21.4 5.3 1.5Russell 1000 Value 691 4.5 16.6 1.7 2.6Russell Midcap 831 13.1 19.9 2.4 1.8Russell Midcap Growth 505 15.8 21.5 4.8 1.1Russell Midcap Value 559 10.4 18.4 1.6 2.4Russell 2000 1,988 16.3 19.1 2.0 1.5Russell 2000 Growth 1,194 18.4 23.5 3.8 0.8Russell 2000 Value 1,351 14.6 16.4 1.3 2.3
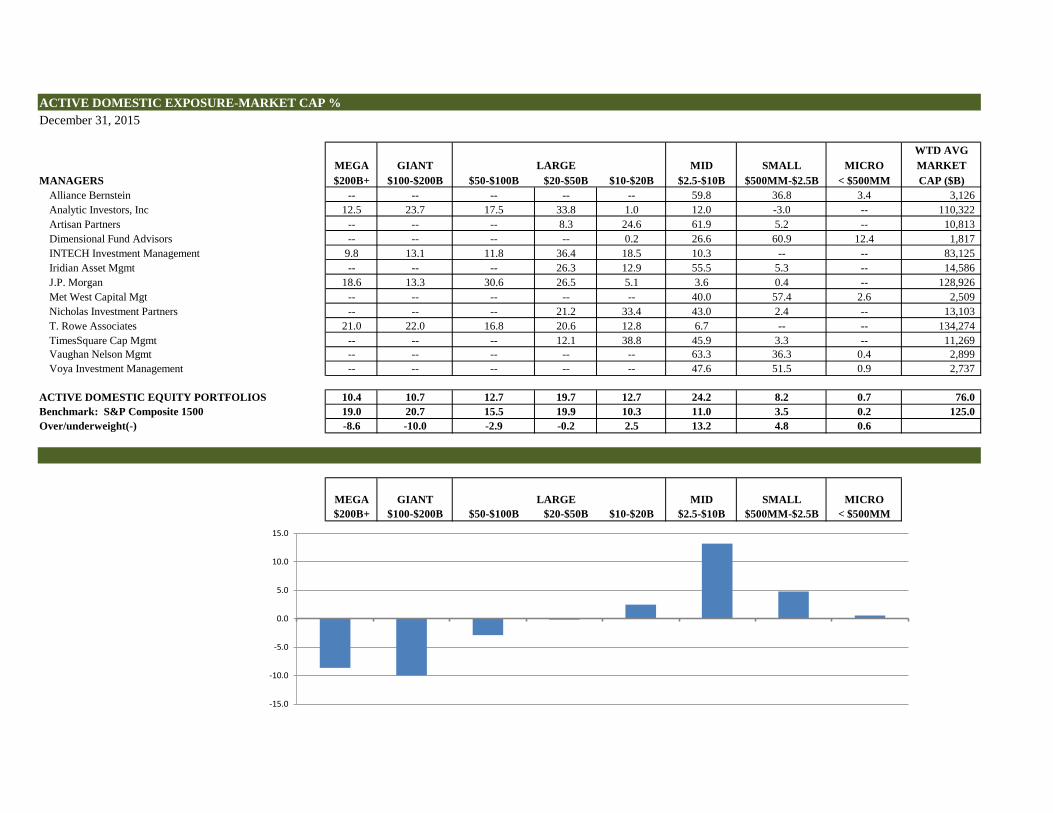
ACTIVE DOMESTIC EXPOSURE-MARKET CAP %December 31, 2015
WTD AVGMEGA GIANT LARGE MID SMALL MICRO MARKET
MANAGERS $200B+ $100-$200B $50-$100B $20-$50B $10-$20B $2.5-$10B $500MM-$2.5B < $500MM CAP ($B)Alliance Bernstein -- -- -- -- -- 59.8 36.8 3.4 3,126 Analytic Investors, Inc 12.5 23.7 17.5 33.8 1.0 12.0 -3.0 -- 110,322 Artisan Partners -- -- -- 8.3 24.6 61.9 5.2 -- 10,813 Dimensional Fund Advisors -- -- -- -- 0.2 26.6 60.9 12.4 1,817 INTECH Investment Management 9.8 13.1 11.8 36.4 18.5 10.3 -- -- 83,125 Iridian Asset Mgmt -- -- -- 26.3 12.9 55.5 5.3 -- 14,586 J.P. Morgan 18.6 13.3 30.6 26.5 5.1 3.6 0.4 -- 128,926 Met West Capital Mgt -- -- -- -- -- 40.0 57.4 2.6 2,509 Nicholas Investment Partners -- -- -- 21.2 33.4 43.0 2.4 -- 13,103 T. Rowe Associates 21.0 22.0 16.8 20.6 12.8 6.7 -- -- 134,274 TimesSquare Cap Mgmt -- -- -- 12.1 38.8 45.9 3.3 -- 11,269 Vaughan Nelson Mgmt -- -- -- -- -- 63.3 36.3 0.4 2,899 Voya Investment Management -- -- -- -- -- 47.6 51.5 0.9 2,737
ACTIVE DOMESTIC EQUITY PORTFOLIOS 10.4 10.7 12.7 19.7 12.7 24.2 8.2 0.7 76.0 Benchmark: S&P Composite 1500 19.0 20.7 15.5 19.9 10.3 11.0 3.5 0.2 125.0 Over/underweight(-) -8.6 -10.0 -2.9 -0.2 2.5 13.2 4.8 0.6
MEGA GIANT LARGE MID SMALL MICRO$200B+ $100-$200B $50-$100B $20-$50B $10-$20B $2.5-$10B $500MM-$2.5B < $500MM
-15.0
-10.0
-5.0
0.0
5.0
10.0
15.0

ACTIVE DOMESTIC EXPOSURE-SECTOR %December 31, 2015
Consumer Consumer Health TelecomMANAGERS Discretionary Staples Energy Financials Care Industrials Technology Materials Services Utilities
Alliance Bernstein 18.2 1.5 2.2 7.1 26.4 14.0 27.9 2.7 -- --Analytic Investors, Inc 12.7 9.3 6.9 13.9 14.4 6.0 23.0 3.7 3.6 3.9Artisan Partners 17.8 1.3 6.9 25.7 -- 16.9 17.3 8.6 -- 5.4Dimensional Fund Advisors 17.1 5.0 2.6 20.6 10.1 17.3 17.8 4.4 0.9 4.3INTECH Investment Management 15.5 11.5 3.6 17.5 17.6 9.9 15.7 4.3 0.7 3.8Iridian Asset Mgmt 14.3 6.0 4.7 2.1 14.8 15.5 15.3 27.3 -- --J.P. Morgan 16.8 3.5 6.6 21.0 15.5 8.3 24.8 1.7 -- -0.2Met West Capital Mgt 11.2 6.0 8.2 32.2 9.3 17.1 8.9 3.7 -- 1.9Nicholas Investment Partners 26.2 6.9 1.9 12.8 11.9 12.8 22.2 4.0 1.3 --T. Rowe Associates 13.4 9.5 5.7 16.2 15.2 9.5 21.3 4.0 1.9 3.2TimesSquare Cap Mgmt 17.0 4.7 1.4 12.0 13.9 24.6 19.5 2.7 4.4 --Vaughan Nelson Mgmt 8.4 -- 2.6 24.0 14.9 18.2 12.3 9.6 -- 7.6Voya Investment Management 16.8 2.8 1.4 8.7 24.4 15.0 25.3 4.4 -- --
Active Domestic Equity Portfolios 15.5 6.0 4.9 17.2 14.1 12.4 20.5 4.9 1.3 2.3Benchmark: S&P Composite 1500 12.9 9.4 6.1 17.5 14.7 10.6 20.3 3.1 2.2 3.2Over/underweight(-) 2.6 -3.3 -1.2 -0.3 -0.6 1.8 0.2 1.9 -0.9 -0.9
Consumer Consumer Health TelecomDiscretionary Staples Energy Financials Care Industrials Technology Materials Services Utilities
-4.0
-3.0
-2.0
-1.0
0.0
1.0
2.0
3.0


ACTIVE DOMESTIC PORTFOLIO CHARACTERISTICSDecember 31, 2015
3Yr HistoricalMarket Number of EPS Price/ Price/ Dividend
MANAGERS Value Securities Growth Earnings Book YieldAlliance Bernstein 34,651,868 103 28.9 27.1 3.9 0.3Analytic Investors, Inc 135,570,980 178 40.0 13.3 2.9 2.3Artisan Partners 120,021,536 59 4.4 14.9 1.5 2.0Dimensional Fund Advisors 73,368,934 1,956 16.3 18.6 1.9 1.3INTECH Investment Management 130,105,981 348 18.0 19.6 3.0 1.7Iridian Asset Mgmt 66,762,445 42 11.3 14.6 3.3 1.2J.P. Morgan 340,395,463 295 20.8 17.1 2.3 1.5Met West Capital Mgt 25,001,178 65 5.3 18.3 1.6 2.3Nicholas Investment Partners 62,806,714 94 27.9 19.2 3.8 0.8T. Rowe Associates 337,372,632 244 17.2 19.4 2.7 1.9TimesSquare Cap Mgmt 145,504,502 76 20.3 20.5 3.5 1.0Vaughan Nelson Mgmt 79,770,745 66 2.6 18.8 1.9 1.4Voya Investment Management 33,329,671 152 10.4 24.3 2.8 0.9
Active Domestic Equity Portfolios 1,584,662,648 2,747 18.6 17.7 2.5 1.6
BENCHMARKSS&P Composite 1500 1,505 15.5 19.0 2.6 2.1S&P/Citigroup 1500 Pure Growth 346 28.1 24.5 3.5 0.8S&P/Citigroup 1500 Pure Value 365 6.0 12.0 0.9 2.1S&P 500 504 15.5 18.9 2.7 2.1Russell 1000 1,033 15.2 18.9 2.6 2.0Russell 1000 Growth 644 26.3 21.3 5.3 1.5Russell 1000 Value 691 3.6 16.8 1.7 2.6Russell Midcap 831 13.8 19.7 2.4 1.8Russell Midcap Growth 505 16.3 21.5 4.8 1.1Russell Midcap Value 559 11.1 18.2 1.6 2.5Russell 2000 1,988 17.4 19.2 2.0 1.5Russell 2000 Growth 1,194 21.0 23.4 3.8 0.8Russell 2000 Value 1,351 14.4 16.5 1.3 2.3

Montana International Equity Pool Rande R. Muffick, CFA, Portfolio Manager
February 23, 2016
The table above displays the Montana International Equity Pool (MTIP) allocation at quarter end across market cap segments and manager styles. At this time, all weightings are within the approved ranges. Following a tumultuous third quarter, international stocks rebounded off the September lows to post broad based gains. The concerns about Chinese economic growth and their currency devaluation along with the fiscal and currency pressures of lower oil prices on other countries were brushed aside as investors looked to the U.S. Fed interest rate increase as a sign that the global economic picture was not so bad after all. The MSCI ACWI ex US Index returned 3.24% for the quarter.
ApprovedManager Name Market Value % Range
STATE STREET BANK + TRUST CO 28,222,718 1.80%CASH EQUIVALENT 28,222,718 1.80%BLACKROCK ACWI EX US SUPERFUND 964,824,903 61.57%BLACKROCK MSCI EM MKT FR FD B 27,912,262 1.78% 0-5%EAFE STOCK PERFORMANCE INDEX 12,589,067 0.80%PASSIVE Total 1,005,326,232 64.15% 42-66%ACADIAN ACWI EX US VALUE 92,806,386 5.92%BERNSTEIN ACWI EX 160,379 0.01%LAZARD INTERNATIONAL VALUE 88,017,000 5.62%VALUE Total 180,983,766 11.55%BAILLIE GIFFORD INT L GROWTH 85,506,301 5.46%HANSBERGER INTL EQUITY GROWTH 119,341 0.01%INVESCO INTERNATIONAL GROWTH 84,168,382 5.37%MARTIN CURRIE ACWI X 144,446 0.01%GROWTH Total 169,938,471 10.84%AMERICAN CENTURY INV MGMT 30,394,138 1.94%BLACKROCK ACWI EX US SMALL CAP 27,449,462 1.75%DFA INTERNATIONAL SMALL COMPAN 77,186,462 4.93%TEMPLETON INVESTMENT COUNSEL 47,453,950 3.03%SMALL CAP Total 182,484,011 11.64% 8-16%MU38 TRANSITION ACCOUNT 123,640 0.01%TRANSITION TOTAL 123,640 0.01%MTIP Total 1,567,078,837 100.00%
12/31/2015 International Stock Pool By Manager

For the most part international stocks posted solid gains in the quarter. Contrary to the U.S. however, mid cap stocks and small cap stocks performed better than their large cap brethren. Developed market small cap growth stocks were the best performing category with a return of 7.8%. Growth stocks significantly outpaced value stocks within all market cap segments. Emerging market stocks lagged compared to developed market stocks. In fact the large cap value EM stocks and the mid cap value EM stocks were the only categories to post losses in the quarter. Within EM the small cap stocks in all style categories did the best by returning 3% or slightly more in the quarter.
Value Neutral Growth Value Neutral GrowthLa
rge
2.1% 3.6% 5.3% Larg
e
-8.5% -4.1% 0.8%
Mid
2.4% 5.0% 6.6% Mid
-3.2% 1.4% 4.4%
Smal
l
3.8% 5.8% 7.8% Smal
l
1.1% 5.5% 9.9%
Value Neutral Growth Value Neutral Growth
Larg
e
-1.2% 0.8% 2.8% Larg
e
-18.2% -15.2% -12.3%
Mid
-2.7% 0.0% 2.1% Mid
-21.0% -13.2% -6.4%
Smal
l
3.0% 3.3% 3.6% Smal
l
-8.9% -6.9% -4.8%
Last Twelve Months
Last Twelve Months4Q 2015
Non-US Developed Market Environment
Emerging Market Environment
4Q 2015
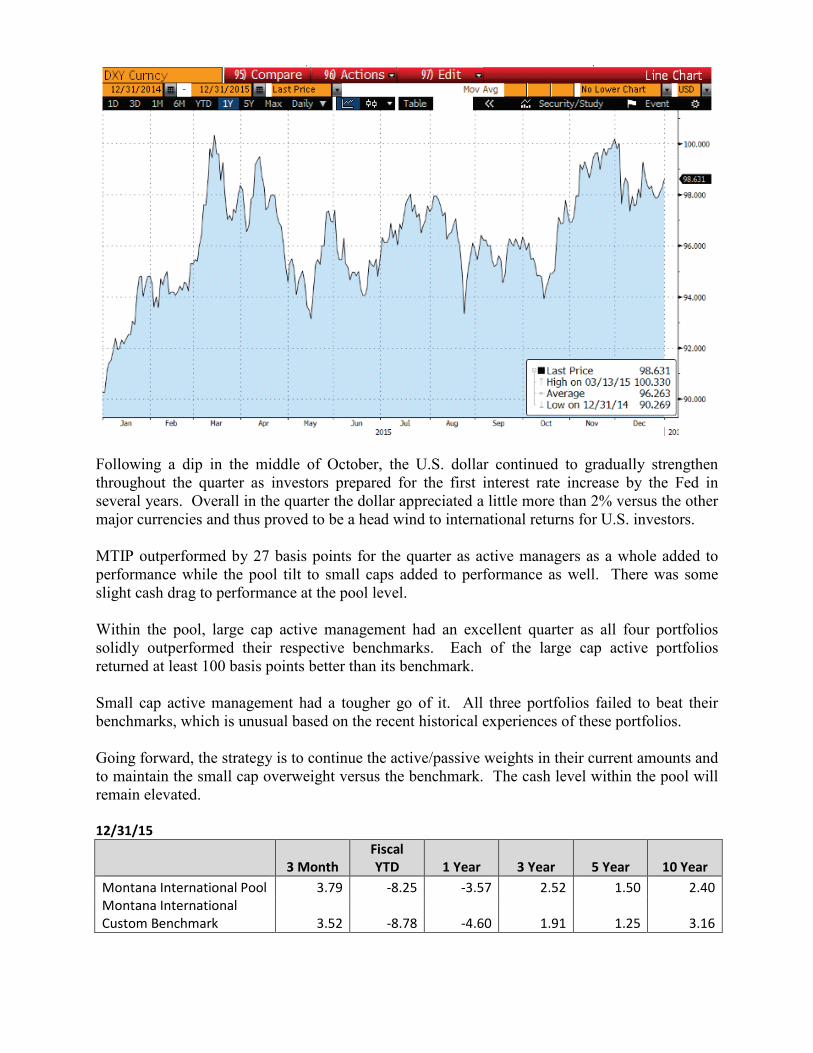
Following a dip in the middle of October, the U.S. dollar continued to gradually strengthen throughout the quarter as investors prepared for the first interest rate increase by the Fed in several years. Overall in the quarter the dollar appreciated a little more than 2% versus the other major currencies and thus proved to be a head wind to international returns for U.S. investors. MTIP outperformed by 27 basis points for the quarter as active managers as a whole added to performance while the pool tilt to small caps added to performance as well. There was some slight cash drag to performance at the pool level. Within the pool, large cap active management had an excellent quarter as all four portfolios solidly outperformed their respective benchmarks. Each of the large cap active portfolios returned at least 100 basis points better than its benchmark. Small cap active management had a tougher go of it. All three portfolios failed to beat their benchmarks, which is unusual based on the recent historical experiences of these portfolios. Going forward, the strategy is to continue the active/passive weights in their current amounts and to maintain the small cap overweight versus the benchmark. The cash level within the pool will remain elevated. 12/31/15
3 Month Fiscal YTD 1 Year 3 Year 5 Year 10 Year
Montana International Pool 3.79 -8.25 -3.57 2.52 1.50 2.40 Montana International Custom Benchmark 3.52 -8.78 -4.60 1.91 1.25 3.16
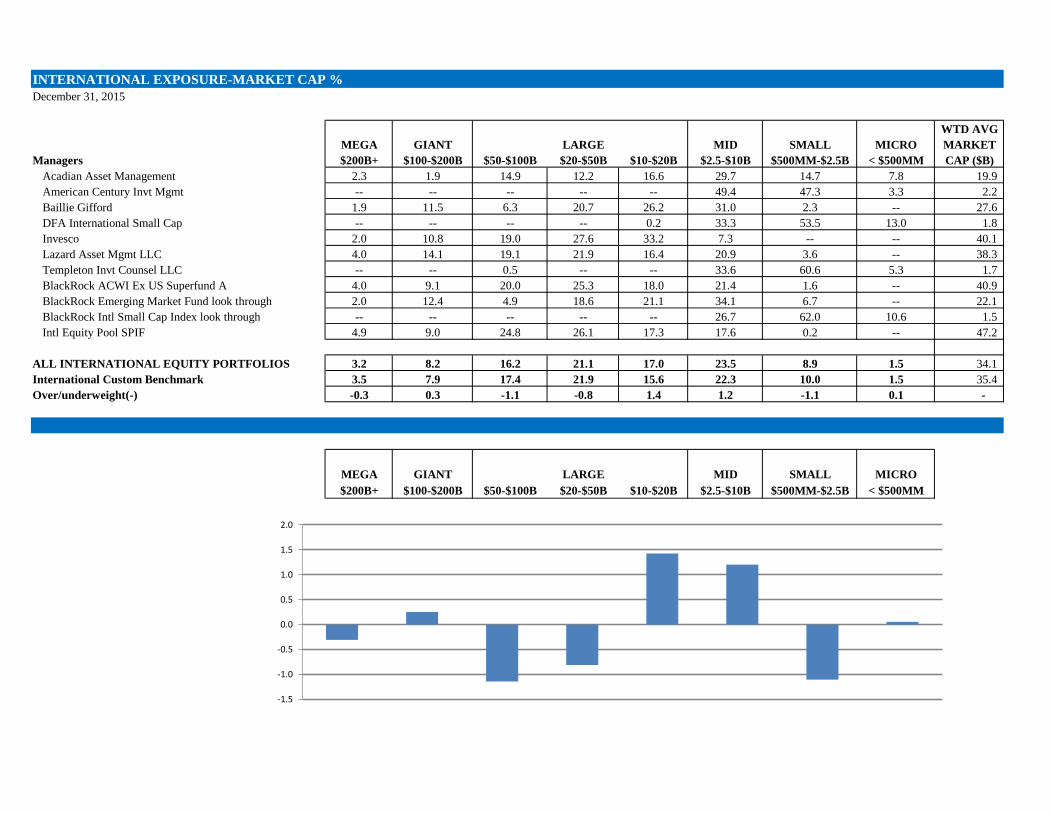
INTERNATIONAL EXPOSURE-MARKET CAP %December 31, 2015
WTD AVGMEGA GIANT LARGE MID SMALL MICRO MARKET
Managers $200B+ $100-$200B $50-$100B $20-$50B $10-$20B $2.5-$10B $500MM-$2.5B < $500MM CAP ($B)Acadian Asset Management 2.3 1.9 14.9 12.2 16.6 29.7 14.7 7.8 19.9 American Century Invt Mgmt -- -- -- -- -- 49.4 47.3 3.3 2.2 Baillie Gifford 1.9 11.5 6.3 20.7 26.2 31.0 2.3 -- 27.6 DFA International Small Cap -- -- -- -- 0.2 33.3 53.5 13.0 1.8 Invesco 2.0 10.8 19.0 27.6 33.2 7.3 -- -- 40.1 Lazard Asset Mgmt LLC 4.0 14.1 19.1 21.9 16.4 20.9 3.6 -- 38.3 Templeton Invt Counsel LLC -- -- 0.5 -- -- 33.6 60.6 5.3 1.7 BlackRock ACWI Ex US Superfund A 4.0 9.1 20.0 25.3 18.0 21.4 1.6 -- 40.9 BlackRock Emerging Market Fund look through 2.0 12.4 4.9 18.6 21.1 34.1 6.7 -- 22.1 BlackRock Intl Small Cap Index look through -- -- -- -- -- 26.7 62.0 10.6 1.5 Intl Equity Pool SPIF 4.9 9.0 24.8 26.1 17.3 17.6 0.2 -- 47.2
ALL INTERNATIONAL EQUITY PORTFOLIOS 3.2 8.2 16.2 21.1 17.0 23.5 8.9 1.5 34.1 International Custom Benchmark 3.5 7.9 17.4 21.9 15.6 22.3 10.0 1.5 35.4 Over/underweight(-) -0.3 0.3 -1.1 -0.8 1.4 1.2 -1.1 0.1 -
MEGA GIANT LARGE MID SMALL MICRO$200B+ $100-$200B $50-$100B $20-$50B $10-$20B $2.5-$10B $500MM-$2.5B < $500MM
-1.5
-1.0
-0.5
0.0
0.5
1.0
1.5
2.0

INTERNATIONAL EXPOSURE-SECTOR %December 31, 2015
Consumer Consumer Health Telecom.MANAGERS Discretionary Staples Energy Financials Care Industrials Technology Materials Services Utilities
Acadian Asset Management 6.9 3.6 15.0 30.7 8.3 13.4 11.6 5.2 3.4 1.8American Century Invt Mgmt 23.3 8.5 1.5 12.1 11.1 15.3 14.9 7.3 1.5 2.3Baillie Gifford 19.2 19.0 1.9 17.6 10.8 14.1 14.8 2.6 -- --DFA International Small Cap 19.7 6.6 3.4 15.5 6.8 24.5 9.2 10.5 1.6 2.2Invesco 24.8 12.3 3.5 18.7 10.1 9.4 17.4 3.7 -- --Lazard Asset Mgmt LLC 13.4 11.5 6.4 25.1 11.6 8.4 9.2 3.6 9.1 1.7Templeton Invt Counsel LLC 29.2 9.5 3.1 15.3 6.6 17.5 13.5 3.2 -- --BlackRock ACWI Ex US Superfund A 12.1 10.7 5.9 26.9 9.4 11.1 8.3 6.4 5.1 3.4BlackRock Emerging Market Fund look through 10.1 8.3 7.0 27.8 2.9 6.9 20.8 6.0 6.7 3.2BlackRock Intl Small Cap Index look through 17.0 6.8 3.0 20.8 7.7 20.3 10.9 9.3 1.3 2.1Intl Equity Pool SPIF 13.2 11.9 4.5 25.6 11.9 12.6 5.2 6.4 4.9 3.8
All International Equity Portfolios 14.1 10.4 5.8 24.8 9.3 12.2 9.9 6.0 4.2 2.7International Custom Benchmark 12.8 10.2 5.5 26.2 9.3 12.4 8.7 6.8 4.6 3.3Over/underweight(-) 1.3 0.2 0.3 -1.5 0.0 -0.2 1.3 -0.8 -0.4 -0.6
Consumer Consumer Health Telecom. Discretionary Staples Energy Financials Care Industrials Technology Materials Services Utilities
-2.0
-1.5
-1.0
-0.5
0.0
0.5
1.0
1.5
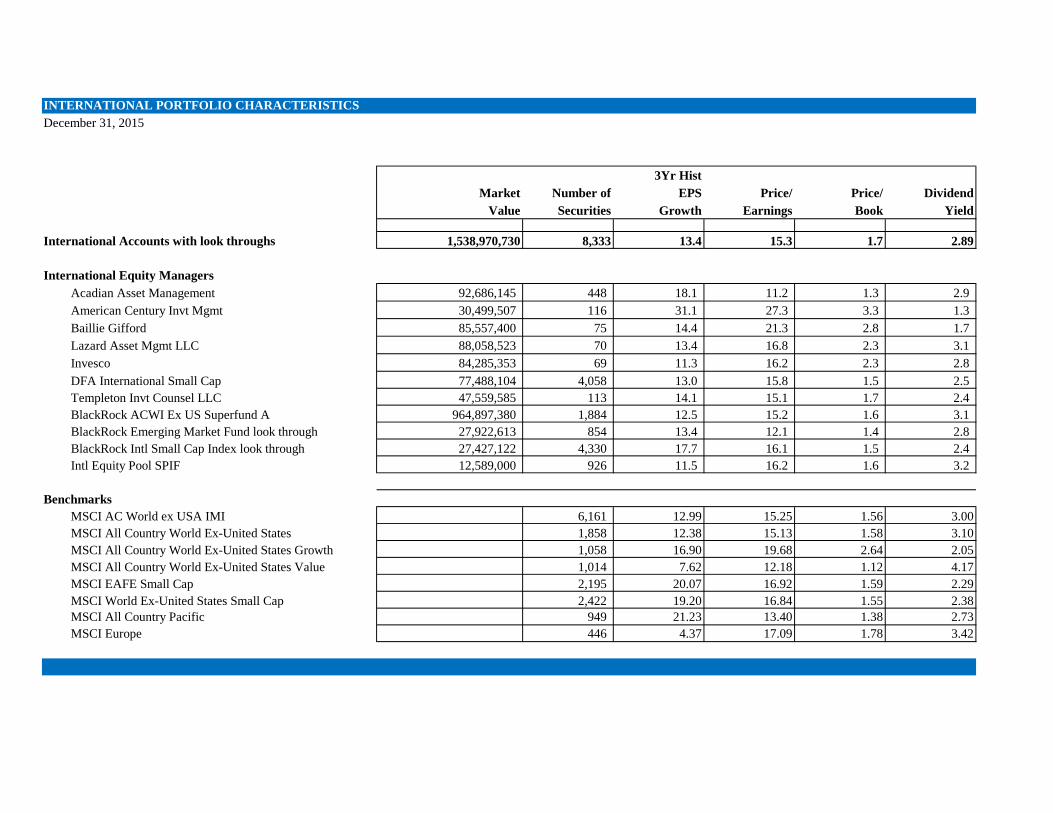
INTERNATIONAL PORTFOLIO CHARACTERISTICSDecember 31, 2015
3Yr HistMarket Number of EPS Price/ Price/ Dividend
Value Securities Growth Earnings Book Yield
International Accounts with look throughs 1,538,970,730 8,333 13.4 15.3 1.7 2.89
International Equity ManagersAcadian Asset Management 92,686,145 448 18.1 11.2 1.3 2.9 American Century Invt Mgmt 30,499,507 116 31.1 27.3 3.3 1.3 Baillie Gifford 85,557,400 75 14.4 21.3 2.8 1.7 Lazard Asset Mgmt LLC 88,058,523 70 13.4 16.8 2.3 3.1 Invesco 84,285,353 69 11.3 16.2 2.3 2.8 DFA International Small Cap 77,488,104 4,058 13.0 15.8 1.5 2.5 Templeton Invt Counsel LLC 47,559,585 113 14.1 15.1 1.7 2.4 BlackRock ACWI Ex US Superfund A 964,897,380 1,884 12.5 15.2 1.6 3.1 BlackRock Emerging Market Fund look through 27,922,613 854 13.4 12.1 1.4 2.8 BlackRock Intl Small Cap Index look through 27,427,122 4,330 17.7 16.1 1.5 2.4 Intl Equity Pool SPIF 12,589,000 926 11.5 16.2 1.6 3.2
BenchmarksMSCI AC World ex USA IMI 6,161 12.99 15.25 1.56 3.00MSCI All Country World Ex-United States 1,858 12.38 15.13 1.58 3.10MSCI All Country World Ex-United States Growth 1,058 16.90 19.68 2.64 2.05MSCI All Country World Ex-United States Value 1,014 7.62 12.18 1.12 4.17MSCI EAFE Small Cap 2,195 20.07 16.92 1.59 2.29MSCI World Ex-United States Small Cap 2,422 19.20 16.84 1.55 2.38MSCI All Country Pacific 949 21.23 13.40 1.38 2.73MSCI Europe 446 4.37 17.09 1.78 3.42
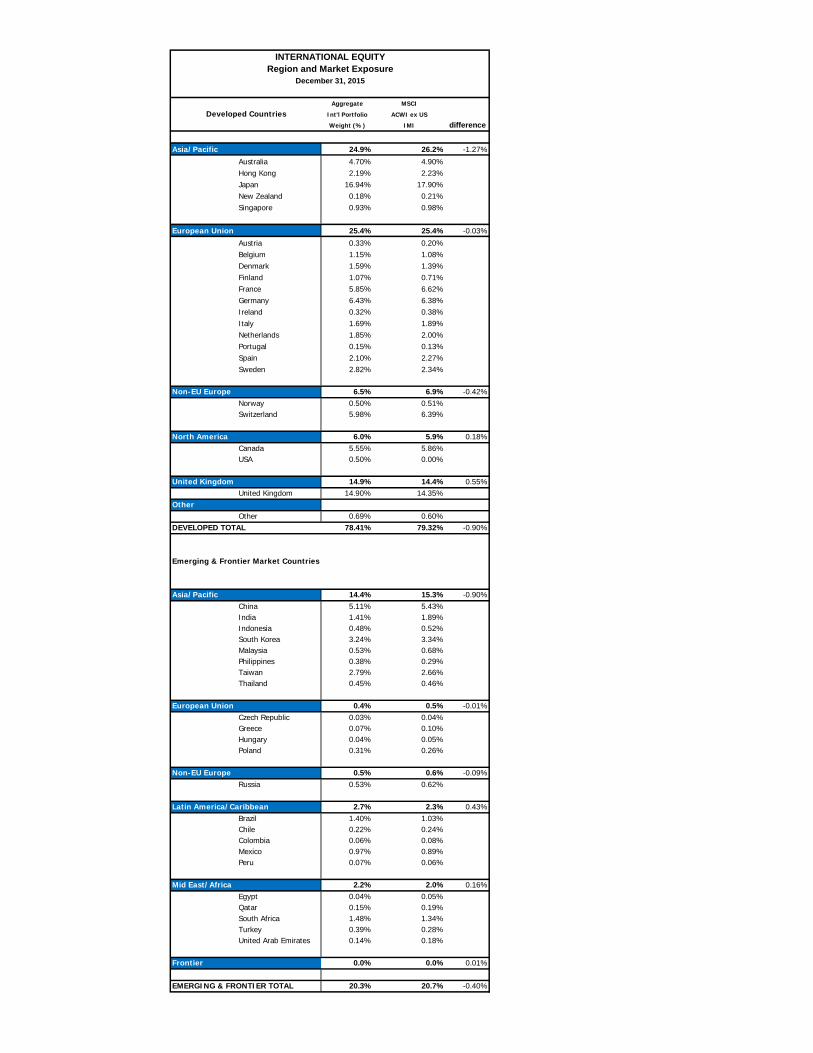
INTERNATIONAL EQUITYRegion and Market Exposure
Aggregate MSCI
Int'l Portfolio ACWI ex US
Weight (%) IMI difference
Asia/Pacific 24.9% 26.2% -1.27%Australia 4.70% 4.90%Hong Kong 2.19% 2.23%Japan 16.94% 17.90%New Zealand 0.18% 0.21%Singapore 0.93% 0.98%
European Union 25.4% 25.4% -0.03%Austria 0.33% 0.20%Belgium 1.15% 1.08%Denmark 1.59% 1.39%Finland 1.07% 0.71%France 5.85% 6.62%Germany 6.43% 6.38%Ireland 0.32% 0.38%Italy 1.69% 1.89%Netherlands 1.85% 2.00%Portugal 0.15% 0.13%Spain 2.10% 2.27%Sweden 2.82% 2.34%
Non-EU Europe 6.5% 6.9% -0.42%Norway 0.50% 0.51%Switzerland 5.98% 6.39%
North America 6.0% 5.9% 0.18%Canada 5.55% 5.86%USA 0.50% 0.00%
United Kingdom 14.9% 14.4% 0.55%United Kingdom 14.90% 14.35%
OtherOther 0.69% 0.60%
DEVELOPED TOTAL 78.41% 79.32% -0.90%
Asia/Pacific 14.4% 15.3% -0.90%China 5.11% 5.43%India 1.41% 1.89%Indonesia 0.48% 0.52%South Korea 3.24% 3.34%Malaysia 0.53% 0.68%Philippines 0.38% 0.29%Taiwan 2.79% 2.66%Thailand 0.45% 0.46%
European Union 0.4% 0.5% -0.01%Czech Republic 0.03% 0.04%Greece 0.07% 0.10%Hungary 0.04% 0.05%Poland 0.31% 0.26%
Non-EU Europe 0.5% 0.6% -0.09%Russia 0.53% 0.62%
Latin America/Caribbean 2.7% 2.3% 0.43%Brazil 1.40% 1.03%Chile 0.22% 0.24%Colombia 0.06% 0.08%Mexico 0.97% 0.89%Peru 0.07% 0.06%
Mid East/Africa 2.2% 2.0% 0.16%Egypt 0.04% 0.05%Qatar 0.15% 0.19%South Africa 1.48% 1.34%Turkey 0.39% 0.28%United Arab Emirates 0.14% 0.18%
Frontier 0.0% 0.0% 0.01%
EMERGING & FRONTIER TOTAL 20.3% 20.7% -0.40%
Developed Countries
Emerging & Frontier Market Countries
December 31, 2015

ACTIVE INTERNATIONAL EXPOSURE-MARKET CAP %December 31, 2015
WTD AVGMEGA GIANT LARGE MID SMALL MICRO MARKET
Managers $200B+ $100-$200B $50-$100B $20-$50B $10-$20B $2.5-$10B $500MM-$2.5B < $500MM CAP ($B)Acadian Asset Management 2.3 1.9 14.9 12.2 16.6 29.7 14.7 7.8 19.9 American Century Invt Mgmt -- -- -- -- -- 49.4 47.3 3.3 2.2 Baillie Gifford 3.1 10.3 6.3 20.7 26.2 31.0 2.3 -- 27.6 DFA International Small Cap -- -- -- -- 0.4 33.2 53.4 13.0 1.8 Invesco 2.0 10.8 19.0 27.6 33.2 7.3 -- -- 40.1 Lazard Asset Mgmt LLC 4.0 14.1 19.1 21.9 16.4 20.9 3.6 -- 38.3 Templeton Invt Counsel LLC -- -- 0.5 -- -- 33.6 60.6 5.3 1.7
ACTIVE INTERNATIONAL EQUITY PORTFOLIOS 2.0 6.3 10.3 14.0 15.8 26.9 20.6 4.2 22.0 International Custom Benchmark 3.7 7.7 17.4 21.9 15.6 22.2 10.0 1.5 35.4 Over/underweight(-) -1.7 -1.4 -7.1 -7.8 0.2 4.6 10.5 2.7 -
MEGA GIANT LARGE MID SMALL MICRO$200B+ $100-$200B $50-$100B $20-$50B $10-$20B $2.5-$10B $500MM-$2.5B < $500MM
-10.0
-5.0
0.0
5.0
10.0
15.0

ACTIVE INTERNATIONAL EXPOSURE-SECTOR %December 31, 2015
Consumer Consumer Health Telecom.MANAGERS Discretionary Staples Energy Financials Care Industrials Technology Materials Services Utilities
Acadian Asset Management 6.9 3.6 15.1 30.7 8.3 13.4 11.6 5.2 3.4 1.8American Century Invt Mgmt 23.3 8.5 1.5 12.7 11.1 14.7 14.9 7.3 1.5 2.3Baillie Gifford 19.2 19.0 1.9 17.6 10.8 14.1 14.8 2.6 -- --DFA International Small Cap 19.7 6.6 3.4 15.5 6.8 24.4 9.2 10.5 1.6 2.2Invesco 24.8 12.3 3.5 18.7 10.1 9.4 17.4 3.7 -- --Lazard Asset Mgmt LLC 13.4 11.5 6.4 25.1 11.6 8.4 9.2 3.6 9.1 1.7Templeton Invt Counsel LLC 29.2 9.5 3.1 15.3 6.6 17.5 13.5 3.2 -- --
Active International Equity Portfolios 18.0 10.3 5.7 20.7 9.4 14.2 12.7 5.0 2.5 1.1International Custom Benchmark 12.8 10.2 5.5 26.2 9.3 12.4 8.7 6.8 4.6 3.3Over/underweight(-) 5.2 0.1 0.2 -5.5 0.0 1.8 4.0 -1.8 -2.1 -2.2
Consumer Consumer Health Telecom. Discretionary Staples Energy Financials Care Industrials Technology Materials Services Utilities
-8.0
-6.0
-4.0
-2.0
0.0
2.0
4.0
6.0

ACTIVE INTERNATIONAL PORTFOLIO CHARACTERISTICSDecember 31, 2015
3Yr HistMarket Number of EPS Price/ Price/ Dividend
Value Securities Growth Earnings Book Yield
Active International External Portfolios 506,062,935 4,496 14.7 15.9 1.9 2.49
International Equity ManagersAcadian Asset Management 92,686,145 448 17.6 11.2 1.3 2.9 American Century Invt Mgmt 30,499,507 116 31.4 27.3 3.3 1.3 Baillie Gifford 85,557,400 75 14.0 21.3 2.8 1.7 Lazard Asset Mgmt LLC 88,058,523 70 13.5 16.8 2.3 3.1 Invesco 84,285,353 69 10.2 16.2 2.3 2.8 DFA International Small Cap 77,416,423 4,058 13.2 15.8 1.5 2.5 Templeton Invt Counsel LLC 47,559,585 113 14.6 15.1 1.7 2.4
BenchmarksMSCI AC World ex USA IMI 6,161 12.79 15.25 1.56 3.00MSCI All Country World Ex-United States 1,858 12.15 15.13 1.58 3.10MSCI All Country World Ex-United States Growth 1,058 17.00 19.68 2.64 2.05MSCI All Country World Ex-United States Value 1,014 7.06 12.18 1.12 4.17MSCI EAFE Small Cap 2,195 20.24 16.92 1.59 2.29MSCI World Ex-United States Small Cap 2,422 19.37 16.84 1.55 2.38MSCI All Country Pacific 949 21.01 13.40 1.38 2.73MSCI Europe 446 4.17 17.09 1.78 3.42

INTERNATIONAL EQUITYActive Region and Market Exposure
Aggregate MSCI
Int'l Portfolio ACWI ex US
Weight (%) IMI difference
Asia/Pacific 24.8% 26.2% -1.38%Australia 4.42% 4.90%Hong Kong 2.17% 2.23%Japan 16.99% 17.90%New Zealand 0.27% 0.21%Singapore 0.98% 0.98%
European Union 26.0% 25.4% 0.65%Austria 0.72% 0.20%Belgium 1.39% 1.08%Denmark 2.08% 1.39%Finland 1.92% 0.71%France 3.73% 6.62%Germany 6.44% 6.38%Ireland 0.38% 0.38%Italy 1.61% 1.89%Netherlands 1.48% 2.00%Portugal 0.26% 0.13%Spain 1.77% 2.27%Sweden 4.27% 2.34%
Non-EU Europe 5.5% 6.9% -1.42%Norway 0.68% 0.51%Switzerland 4.80% 6.39%
North America 7.0% 5.9% 1.09%Canada 5.45% 5.86%USA 1.51% 0.00%
United Kingdom 17.2% 14.4% 2.86%United Kingdom 17.21% 14.35%
OtherOther 1.03% 0.60%
DEVELOPED TOTAL 81.54% 79.32% 2.22%
Asia/Pacific 10.5% 15.3% -4.73%China 3.43% 5.43%India 0.25% 1.89%Indonesia 0.29% 0.52%South Korea 2.64% 3.34%Malaysia 0.13% 0.68%Philippines 0.49% 0.29%Taiwan 2.88% 2.66%Thailand 0.42% 0.46%
European Union 0.4% 0.5% -0.09%Czech Republic 0.01% 0.04%Greece 0.00% 0.10%Hungary 0.00% 0.05%Poland 0.35% 0.26%
Non-EU Europe 0.1% 0.6% -0.55%Russia 0.07% 0.62%
Latin America/Caribbean 3.0% 2.3% 0.67%Brazil 1.81% 1.03%Chile 0.14% 0.24%Colombia 0.01% 0.08%Mexico 0.94% 0.89%Peru 0.06% 0.06%
Mid East/Africa 2.0% 2.0% 0.00%Egypt 0.00% 0.05%Qatar 0.00% 0.19%South Africa 1.46% 1.34%Turkey 0.58% 0.28%United Arab Emirates 0.00% 0.18%
Frontier 0.03% 0.0% 0.03%
EMERGING & FRONTIER TOTAL 16.0% 20.7% -4.67%
Developed Countries
Emerging & Frontier Market Countries
December 31, 2015

MEMORANDUM Montana Board of Investments Department of Commerce 2401 Colonial Drive, 3rd Floor Helena, MT 59601 (406) 444-0001 To: Members of the Board
From: Rande R. Muffick, CFA Date: February 23, 2016 Subject: Public Equity External Managers Watch List - Quarterly Update There were no changes to the Watch List this quarter.
PUBLIC EQUITIES MANAGER WATCH LIST
February 2016
Manager Style Bucket Reason $ Invested (mil) Inclusion Date
Artisan Domestic – MC Value Performance $119.5 November 2014
Alliance Bernstein Domestic – SC Growth Performance $34.7 February 2015

Return to Agenda
cc0153
Sticky Note

MEMORANDUM Montana Board of Investments Department of Commerce 2401 Colonial Drive, 3rd Floor Helena, MT 59601 (406) 444-0001 To: Members of the Board From: Ethan Hurley, Portfolio Manager – Alternative Investments Date: February 23, 2016 Subject: Montana Private Equity Pool (MPEP) Following this memo are the items listed below: (i) Montana Private Equity Pool Review:
Comprehensive overview of the private equity portfolio for the quarter ended September 30.
(ii) New Commitments:
The table below summarizes the investment decisions made by staff since the last board meeting. Two new $25M commitments were made to Axiom Asia Private Capital IV, LP and McCarthy Capital Fund VI, LP. Investment briefs summarizing these funds and the general partners follow.
Fund Name Vintage Subclass Sector Amount Date Axiom Asia Private
Capital IV, LP 2016 Buyout/Venture
FoF Diversified $25M 12/16/15
McCarthy Capital Fund VI, LP 2016 Buyout Diversified $25M
12/15/15
(iii) Portfolio Index Comparison:
Table comparing the performance of the private equity portfolio to the State Street Global Exchange Private Equity IndexTM.
Montana Board of Investments
Private Equity Board Report
Q3 2015
Due to, among other things, the lack of a valuation standard in the private equity industry, differences in the pace of investment across funds and the understatement of returns in the early years of a fund's life, the internal rate of return information may not accurately reflect current or expected future returns, and the internal rates of return and all other disclosures with respect to the Partnerships have not been prepared, reviewed or approved by the Partnerships, the General Partners, or any other affiliates.

1
Contents
• Quarterly Cash Flow Chart
• Strategy – Total Exposure Chart
• Industry – Market Value Exposure Chart
• Geography – Total Exposure Chart
• Investment Vehicle – Total Exposure Chart
• Periodic Return Comparison
• LPs by Family of Funds Table

2
MPEP Quarterly Cash Flow December 31, 2010 through December 31, 2015
Net cash flow for the quarter ending 12/31/15 was positive. Broadly speaking relative to 3Q15, the total number of US leveraged buyout transactions for the period ending 4Q15 was down from 35 to 13, with absolute dollars transacted more than halved. In the US there were a total of 173 IPOs in 2015, a decrease of 41% relative to 2014. In total $33.3B in proceeds were raised, down 44% relative to 2014. For the quarter ended 4Q15, a total of 33 deals were done raising $4B relative to 4Q14 when a total of 69 deals raised $8.7B.
$(80,000,000)
$(60,000,000)
$(40,000,000)
$(20,000,000)
$-
$20,000,000
$40,000,000
$60,000,000
$80,000,000
$100,000,000
$120,000,000
MPEP Cash Flows
Distributions Capital Calls & Fees Net Cash Flow
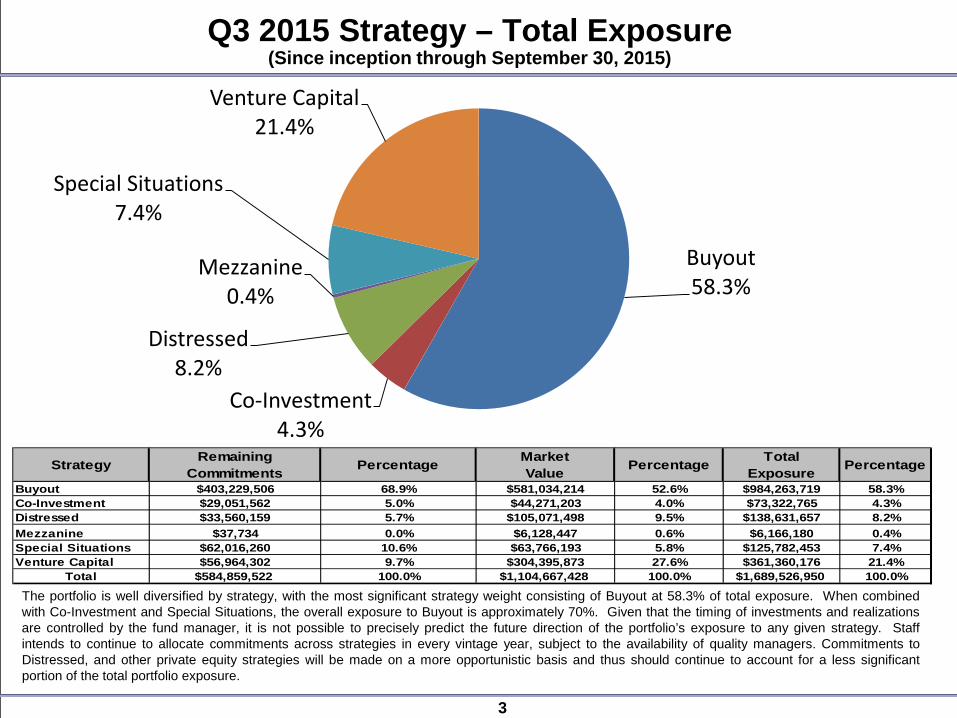
3
Q3 2015 Strategy – Total Exposure (Since inception through September 30, 2015)
Strategy Remaining Commitments Percentage Market
Value Percentage Total Exposure Percentage
Buyout $403,229,506 68.9% $581,034,214 52.6% $984,263,719 58.3%Co-Investment $29,051,562 5.0% $44,271,203 4.0% $73,322,765 4.3%Distressed $33,560,159 5.7% $105,071,498 9.5% $138,631,657 8.2%Mezzanine $37,734 0.0% $6,128,447 0.6% $6,166,180 0.4%Special Situations $62,016,260 10.6% $63,766,193 5.8% $125,782,453 7.4%Venture Capital $56,964,302 9.7% $304,395,873 27.6% $361,360,176 21.4%
Total $584,859,522 100.0% $1,104,667,428 100.0% $1,689,526,950 100.0%
The portfolio is well diversified by strategy, with the most significant strategy weight consisting of Buyout at 58.3% of total exposure. When combined with Co-Investment and Special Situations, the overall exposure to Buyout is approximately 70%. Given that the timing of investments and realizations are controlled by the fund manager, it is not possible to precisely predict the future direction of the portfolio’s exposure to any given strategy. Staff intends to continue to allocate commitments across strategies in every vintage year, subject to the availability of quality managers. Commitments to Distressed, and other private equity strategies will be made on a more opportunistic basis and thus should continue to account for a less significant portion of the total portfolio exposure.
Buyout 58.3%
Co-Investment 4.3%
Distressed 8.2%
Mezzanine 0.4%
Special Situations 7.4%
Venture Capital 21.4%

4
Q3 2015 Industry – Market Value Exposure (Since inception through September 30, 2015)
The portfolio is broadly diversified by industry with the information technology, industrials, healthcare, commercial services and supplies and consumer discretionary sectors representing the five largest industry exposures at approximately 67% of total assets. With the exception of energy and the information technology‐related industries, the portfolio’s underlying managers tend to be multi-sector investors. Therefore, composition of the portfolio by industry is and will continue to primarily be a function of a manager’s industry expertise and success in sourcing deals rather than a function of staff’s desire to over or underweight a specific industry.
Industry Investments, At Market Value Percentage
Information Technology 198,791,163 18.6%Industrials 156,168,497 14.6%Health Care 139,760,891 13.0%Commercial Services and Supplies 115,270,441 10.8%Consumer Discretionary 104,014,923 9.7%Financials 98,689,950 9.2%Energy 75,240,315 7.0%Materials 61,871,889 5.8%Consumer Staples 29,696,980 2.8%Media/Telecom 25,865,110 2.4%Real Estate Services 21,460,635 2.0%Other 21,167,981 2.0%Telecommunication Services 17,305,202 1.6%Utilities 6,098,363 0.6%
Total 1,071,402,340 100%

5
Q3 2015 Geography – Total Exposure (Since inception through September 30, 2015)
(1) Remaining commitments are based upon the investment location of the partnerships.(2) Market Value represents the agrregate market values of the underlying investment companies of the partnerships.
Geography Remaining Commitments (1)
PercentageMarket Value (2)
Percentage Total Exposure
Percentage
US & Canada 537,567,175$ 91.9% 891,737,466$ 83.2% 1,429,304,642$ 86.3%Western Europe 13,182,308$ 2.3% 77,817,365$ 7.3% 90,999,673$ 5.5%Asia/ROW 34,110,038$ 5.8% 101,847,509$ 9.5% 135,957,547$ 8.2%
Total 584,859,522$ 100.0% 1,071,402,340$ 100.0% 1,656,261,862$ 100.0%
The portfolio’s predominate geographic exposure is to developed North America, representing 86.3% of the market value and uncalled capital domiciled in or targeted for the US and Canada. No significant divergence from this is expected in the near-term. Targeted international investments will continue to be made largely through fund-of-funds given existing constraints on internal resources.

6
Q3 2015 Investment Vehicle – Total Exposure (Since inception through September 30, 2015)
Investment Vehicle
Remaining Commitments Percentage
Market Value Percentage
Total Exposure Percentage
Direct 479,179,941$ 81.9% 741,677,200$ 67.1% 1,220,857,141$ 72.3%Fund of Fund 76,709,499$ 13.1% 261,451,484$ 23.7% 338,160,984$ 20.0%Secondary 28,970,082$ 5.0% 101,538,743$ 9.2% 130,508,825$ 7.7%
Total 584,859,522$ 100.0% 1,104,667,428$ 100.0% 1,689,526,950$ 100.0%
The portfolio is invested primarily through direct private equity commitments. To the extent the quality of managers invested with directly is comparable to the quality of managers available through a fund-of-funds, a direct strategy should outperform fund-of-funds due to a reduced fee burden. In the medium-term, the portfolio is likely to continue to depend upon fund-of-funds managers for its targeted international investments. Longer term it is the intention of staff to leverage fund-of-funds relationships to slowly move away from this model in order to access more of these specialized managers directly and to reduce overall costs.
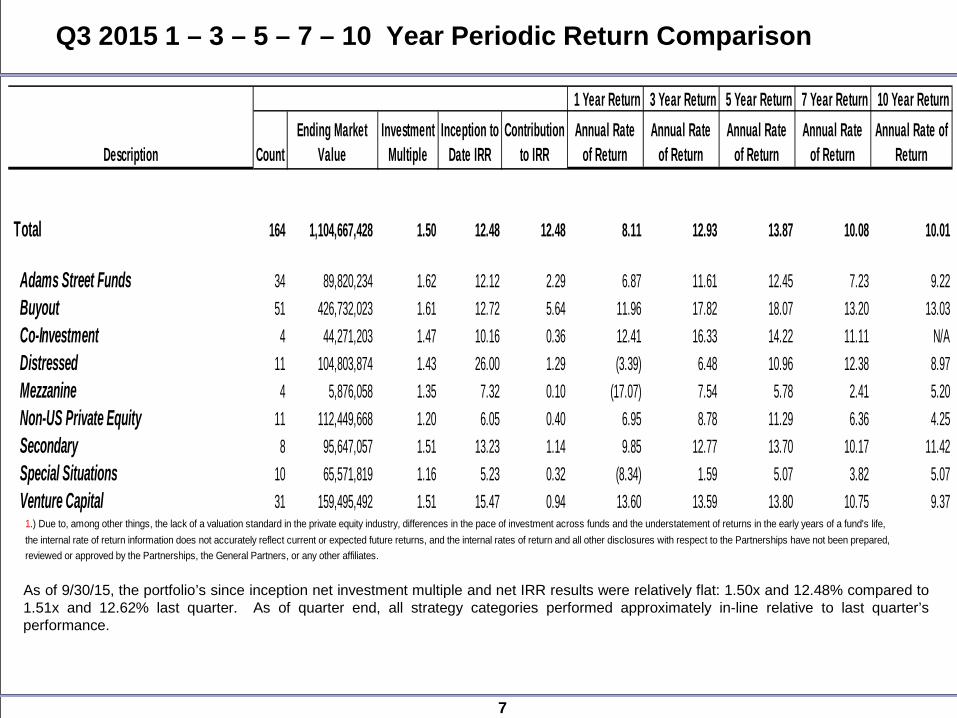
7
Q3 2015 1 – 3 – 5 – 7 – 10 Year Periodic Return Comparison
1.) Due to, among other things, the lack of a valuation standard in the private equity industry, differences in the pace of investment across funds and the understatement of returns in the early years of a fund's life, the internal rate of return information does not accurately reflect current or expected future returns, and the internal rates of return and all other disclosures with respect to the Partnerships have not been prepared,reviewed or approved by the Partnerships, the General Partners, or any other affiliates.
As of 9/30/15, the portfolio’s since inception net investment multiple and net IRR results were relatively flat: 1.50x and 12.48% compared to 1.51x and 12.62% last quarter. As of quarter end, all strategy categories performed approximately in-line relative to last quarter’s performance.
1 Year Return 3 Year Return 5 Year Return 7 Year Return 10 Year Return
Description CountEnding Market
ValueInvestment
MultipleInception to
Date IRRContribution
to IRRAnnual Rate
of ReturnAnnual Rate
of ReturnAnnual Rate
of ReturnAnnual Rate
of ReturnAnnual Rate of
Return
Total 164 1,104,667,428 1.50 12.48 12.48 8.11 12.93 13.87 10.08 10.01
Adams Street Funds 34 89,820,234 1.62 12.12 2.29 6.87 11.61 12.45 7.23 9.22 Buyout 51 426,732,023 1.61 12.72 5.64 11.96 17.82 18.07 13.20 13.03 Co-Investment 4 44,271,203 1.47 10.16 0.36 12.41 16.33 14.22 11.11 N/A Distressed 11 104,803,874 1.43 26.00 1.29 (3.39) 6.48 10.96 12.38 8.97 Mezzanine 4 5,876,058 1.35 7.32 0.10 (17.07) 7.54 5.78 2.41 5.20 Non-US Private Equity 11 112,449,668 1.20 6.05 0.40 6.95 8.78 11.29 6.36 4.25 Secondary 8 95,647,057 1.51 13.23 1.14 9.85 12.77 13.70 10.17 11.42 Special Situations 10 65,571,819 1.16 5.23 0.32 (8.34) 1.59 5.07 3.82 5.07 Venture Capital 31 159,495,492 1.51 15.47 0.94 13.60 13.59 13.80 10.75 9.37
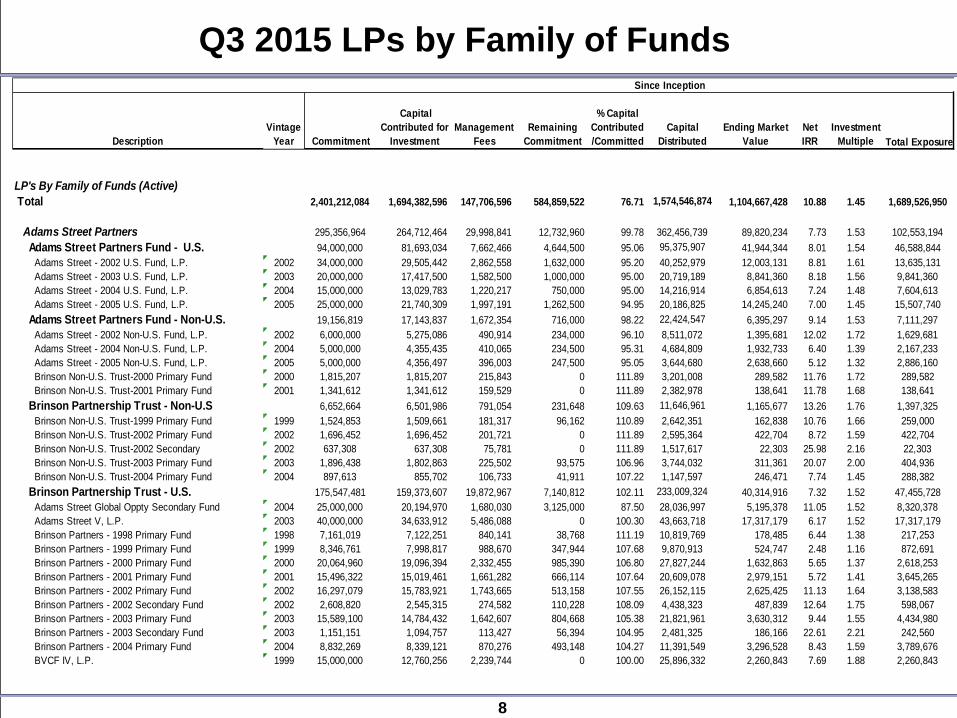
8
Q3 2015 LPs by Family of Funds Since Inception
DescriptionVintage
Year Commitment
Capital Contributed for
InvestmentManagement
FeesRemaining
Commitment
% Capital Contributed/Committed
Capital Distributed
Ending Market Value
Net IRR
Investment Multiple Total Exposure
LP's By Family of Funds (Active) Total 2,401,212,084 1,694,382,596 147,706,596 584,859,522 76.71 1,574,546,874 1,104,667,428 10.88 1.45 1,689,526,950
Adams Street Partners 295,356,964 264,712,464 29,998,841 12,732,960 99.78 362,456,739 89,820,234 7.73 1.53 102,553,194 Adams Street Partners Fund - U.S. 94,000,000 81,693,034 7,662,466 4,644,500 95.06 95,375,907 41,944,344 8.01 1.54 46,588,844 Adams Street - 2002 U.S. Fund, L.P. 2002 34,000,000 29,505,442 2,862,558 1,632,000 95.20 40,252,979 12,003,131 8.81 1.61 13,635,131 Adams Street - 2003 U.S. Fund, L.P. 2003 20,000,000 17,417,500 1,582,500 1,000,000 95.00 20,719,189 8,841,360 8.18 1.56 9,841,360 Adams Street - 2004 U.S. Fund, L.P. 2004 15,000,000 13,029,783 1,220,217 750,000 95.00 14,216,914 6,854,613 7.24 1.48 7,604,613 Adams Street - 2005 U.S. Fund, L.P. 2005 25,000,000 21,740,309 1,997,191 1,262,500 94.95 20,186,825 14,245,240 7.00 1.45 15,507,740 Adams Street Partners Fund - Non-U.S. 19,156,819 17,143,837 1,672,354 716,000 98.22 22,424,547 6,395,297 9.14 1.53 7,111,297 Adams Street - 2002 Non-U.S. Fund, L.P. 2002 6,000,000 5,275,086 490,914 234,000 96.10 8,511,072 1,395,681 12.02 1.72 1,629,681 Adams Street - 2004 Non-U.S. Fund, L.P. 2004 5,000,000 4,355,435 410,065 234,500 95.31 4,684,809 1,932,733 6.40 1.39 2,167,233 Adams Street - 2005 Non-U.S. Fund, L.P. 2005 5,000,000 4,356,497 396,003 247,500 95.05 3,644,680 2,638,660 5.12 1.32 2,886,160 Brinson Non-U.S. Trust-2000 Primary Fund 2000 1,815,207 1,815,207 215,843 0 111.89 3,201,008 289,582 11.76 1.72 289,582 Brinson Non-U.S. Trust-2001 Primary Fund 2001 1,341,612 1,341,612 159,529 0 111.89 2,382,978 138,641 11.78 1.68 138,641 Brinson Partnership Trust - Non-U.S 6,652,664 6,501,986 791,054 231,648 109.63 11,646,961 1,165,677 13.26 1.76 1,397,325 Brinson Non-U.S. Trust-1999 Primary Fund 1999 1,524,853 1,509,661 181,317 96,162 110.89 2,642,351 162,838 10.76 1.66 259,000 Brinson Non-U.S. Trust-2002 Primary Fund 2002 1,696,452 1,696,452 201,721 0 111.89 2,595,364 422,704 8.72 1.59 422,704 Brinson Non-U.S. Trust-2002 Secondary 2002 637,308 637,308 75,781 0 111.89 1,517,617 22,303 25.98 2.16 22,303 Brinson Non-U.S. Trust-2003 Primary Fund 2003 1,896,438 1,802,863 225,502 93,575 106.96 3,744,032 311,361 20.07 2.00 404,936 Brinson Non-U.S. Trust-2004 Primary Fund 2004 897,613 855,702 106,733 41,911 107.22 1,147,597 246,471 7.74 1.45 288,382 Brinson Partnership Trust - U.S. 175,547,481 159,373,607 19,872,967 7,140,812 102.11 233,009,324 40,314,916 7.32 1.52 47,455,728 Adams Street Global Oppty Secondary Fund 2004 25,000,000 20,194,970 1,680,030 3,125,000 87.50 28,036,997 5,195,378 11.05 1.52 8,320,378 Adams Street V, L.P. 2003 40,000,000 34,633,912 5,486,088 0 100.30 43,663,718 17,317,179 6.17 1.52 17,317,179 Brinson Partners - 1998 Primary Fund 1998 7,161,019 7,122,251 840,141 38,768 111.19 10,819,769 178,485 6.44 1.38 217,253 Brinson Partners - 1999 Primary Fund 1999 8,346,761 7,998,817 988,670 347,944 107.68 9,870,913 524,747 2.48 1.16 872,691 Brinson Partners - 2000 Primary Fund 2000 20,064,960 19,096,394 2,332,455 985,390 106.80 27,827,244 1,632,863 5.65 1.37 2,618,253 Brinson Partners - 2001 Primary Fund 2001 15,496,322 15,019,461 1,661,282 666,114 107.64 20,609,078 2,979,151 5.72 1.41 3,645,265 Brinson Partners - 2002 Primary Fund 2002 16,297,079 15,783,921 1,743,665 513,158 107.55 26,152,115 2,625,425 11.13 1.64 3,138,583 Brinson Partners - 2002 Secondary Fund 2002 2,608,820 2,545,315 274,582 110,228 108.09 4,438,323 487,839 12.64 1.75 598,067 Brinson Partners - 2003 Primary Fund 2003 15,589,100 14,784,432 1,642,607 804,668 105.38 21,821,961 3,630,312 9.44 1.55 4,434,980 Brinson Partners - 2003 Secondary Fund 2003 1,151,151 1,094,757 113,427 56,394 104.95 2,481,325 186,166 22.61 2.21 242,560 Brinson Partners - 2004 Primary Fund 2004 8,832,269 8,339,121 870,276 493,148 104.27 11,391,549 3,296,528 8.43 1.59 3,789,676 BVCF IV, L.P. 1999 15,000,000 12,760,256 2,239,744 0 100.00 25,896,332 2,260,843 7.69 1.88 2,260,843

9
Q3 2015 LPs by Family of Funds – Continued Since Inception
Description Vintage Year Commitment
Capital Contributed for
Investment Management FeesRemaining
Commitment
% Capital Contributed/C
ommitted Capital DistributedEnding Market
Value Net IRRInvestment
Multiple Total Exposure
Affinity Asia Capital 35,000,000 17,749,661 3,261,680 14,659,135 60.03 17,755,063 14,462,641 14.99 1.53 29,121,776 Affinity Asia Pacific Fund III, L.P. 2006 15,000,000 12,257,067 2,280,236 1,149,925 96.92 17,543,864 5,329,408 13.26 1.57 6,479,333 Affinity Asia Pacific Fund IV, L.P. 2013 20,000,000 5,492,594 981,444 13,509,210 32.37 211,199 9,133,233 38.30 1.44 22,642,443 American Securities LLC 55,000,000 22,627,426 1,706,404 30,666,170 44.24 2,368,407 34,675,659 21.97 1.52 65,341,829 American Securities Partners VI, L.P. 2011 35,000,000 22,627,426 1,706,404 10,666,170 69.53 2,368,407 34,675,659 21.97 1.52 45,341,829 American Securities Partners VII, L.P. 2014 20,000,000 0 0 20,000,000 0.00 0 0 N/A 0.00 20,000,000 Arclight Energy Partners 90,000,000 57,696,990 4,291,747 28,011,286 68.88 69,135,304 19,165,940 11.20 1.42 47,177,226 ArcLight Energy Partners Fund II, L.P. 2004 25,000,000 19,895,920 1,278,260 3,825,820 84.70 33,842,794 637,061 16.91 1.63 4,462,881 ArcLight Energy Partners Fund III, L.P. 2006 25,000,000 19,724,180 1,879,521 3,396,322 86.41 31,063,637 3,366,858 8.66 1.59 6,763,180 ArcLight Energy Partners Fund V, L.P. 2011 20,000,000 14,578,417 962,798 4,458,785 77.71 4,228,873 11,803,837 1.77 1.03 16,262,622 ArcLight Energy Partners Fund VI, L.P. 2015 20,000,000 3,498,473 171,168 16,330,359 18.35 0 3,358,184 -8.49 0.92 19,688,543 Audax 25,000,000 17,751,914 132,094 7,115,992 71.54 2,388,103 20,978,080 22.48 1.31 28,094,072 Audax Private Equity Fund IV, L.P. 2012 25,000,000 17,751,914 132,094 7,115,992 71.54 2,388,103 20,978,080 22.48 1.31 28,094,072 Avenue Investments 35,000,000 33,123,011 2,086,886 0 100.60 46,063,536 264,014 10.93 1.32 264,014 Avenue Special Situations Fund V, LP 2007 35,000,000 33,123,011 2,086,886 0 100.60 46,063,536 264,014 10.93 1.32 264,014 Axiom Asia Private Capital 50,000,000 28,241,856 2,345,725 19,450,903 61.18 4,002,652 37,076,568 12.23 1.34 56,527,471 Axiom Asia Private Capital II, LP 2009 25,000,000 18,088,937 1,598,116 5,351,431 78.75 4,002,644 24,403,407 12.21 1.44 29,754,838 Axiom Asia Private Capital III, LP 2012 25,000,000 10,152,919 747,609 14,099,472 43.60 8 12,673,161 12.31 1.16 26,772,633 Black Diamond Capital Management 25,000,000 20,442,830 1,738,661 2,818,509 88.73 2,355,487 24,595,197 9.20 1.22 27,413,706 BDCM Opportunity Fund III, L.P. 2011 25,000,000 20,442,830 1,738,661 2,818,509 88.73 2,355,487 24,595,197 9.20 1.22 27,413,706 Carlyle Partners 60,000,000 50,344,362 5,423,077 5,472,075 92.95 86,220,861 15,843,516 11.84 1.83 21,315,591 Carlyle Partners IV, L.P. 2005 35,000,000 31,395,087 1,701,010 2,801,627 94.56 65,234,917 4,483,391 13.74 2.11 7,285,018 Carlyle U.S. Growth Fund III, L.P. 2006 25,000,000 18,949,275 3,722,067 2,670,448 90.69 20,985,944 11,360,125 7.41 1.43 14,030,573 Cartesian Capital Group, LLC 20,000,000 8,578,887 1,414,026 10,029,095 49.96 2,242,840 9,730,025 9.84 1.20 19,759,120 Pangaea Two, L.P. 2012 20,000,000 8,578,887 1,414,026 10,029,095 49.96 2,242,840 9,730,025 9.84 1.20 19,759,120 CCMP Associates 55,000,000 36,287,108 3,394,187 16,399,325 72.15 32,846,885 28,960,099 13.62 1.56 45,359,424 CCMP Capital Investors II, L.P. 2006 30,000,000 26,459,311 2,595,231 2,066,105 96.85 32,603,321 17,993,062 14.09 1.74 20,059,167 CCMP Capital Investors III, L.P. 2013 25,000,000 9,827,797 798,956 14,333,220 42.51 243,564 10,967,037 4.64 1.05 25,300,257 Centerbridge 77,500,000 50,619,096 2,838,849 24,718,519 68.98 16,692,434 45,067,941 6.35 1.16 69,786,460 Centerbridge Capital Partners II, L.P. 2011 25,000,000 19,506,827 1,542,607 4,026,209 84.20 561,970 22,429,222 3.65 1.09 26,455,431 Centerbridge Capital Partners III, L.P. 2014 20,000,000 3,044,092 138,598 16,817,310 15.91 0 3,220,651 2.17 1.01 20,037,961 Centerbridge Special Credit Partners 2009 12,500,000 10,944,941 280,880 1,875,000 89.81 14,627,334 2,366,239 12.36 1.51 4,241,239 Centerbridge Special Credit Partners II 2012 20,000,000 17,123,236 876,764 2,000,000 90.00 1,503,130 17,051,829 1.36 1.03 19,051,829 CIVC Partners 25,000,000 18,837,670 2,510,912 3,873,565 85.39 21,913,032 16,443,781 36.73 1.80 20,317,346 CIVC Partners Fund IV, L.P. 2010 25,000,000 18,837,670 2,510,912 3,873,565 85.39 21,913,032 16,443,781 36.73 1.80 20,317,346
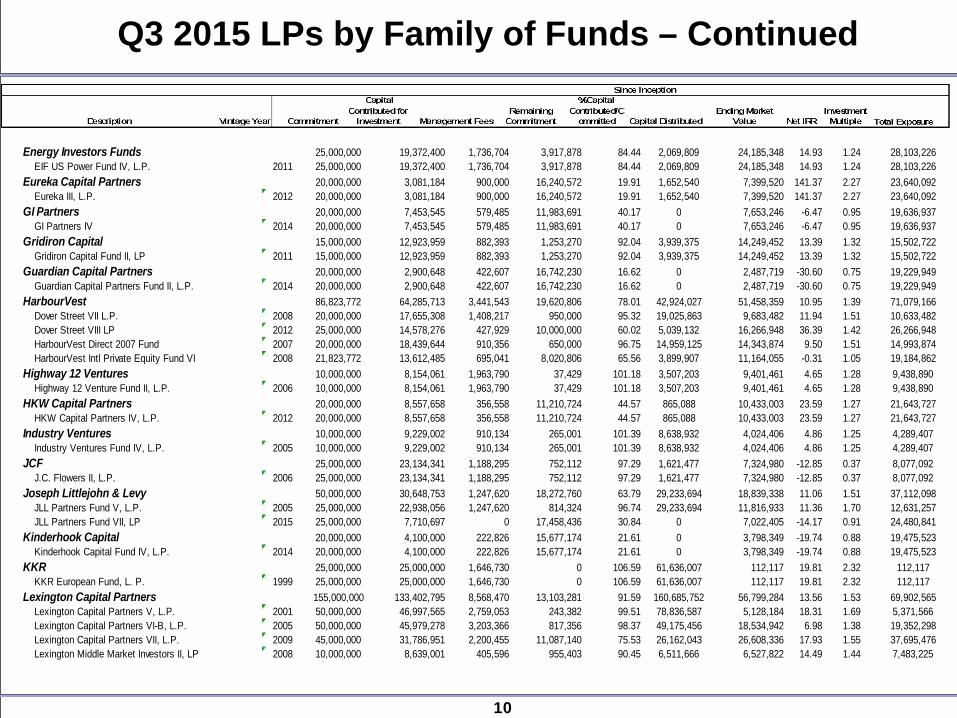
10
Q3 2015 LPs by Family of Funds – Continued
Energy Investors Funds 25,000,000 19,372,400 1,736,704 3,917,878 84.44 2,069,809 24,185,348 14.93 1.24 28,103,226 EIF US Power Fund IV, L.P. 2011 25,000,000 19,372,400 1,736,704 3,917,878 84.44 2,069,809 24,185,348 14.93 1.24 28,103,226 Eureka Capital Partners 20,000,000 3,081,184 900,000 16,240,572 19.91 1,652,540 7,399,520 141.37 2.27 23,640,092 Eureka III, L.P. 2012 20,000,000 3,081,184 900,000 16,240,572 19.91 1,652,540 7,399,520 141.37 2.27 23,640,092 GI Partners 20,000,000 7,453,545 579,485 11,983,691 40.17 0 7,653,246 -6.47 0.95 19,636,937 GI Partners IV 2014 20,000,000 7,453,545 579,485 11,983,691 40.17 0 7,653,246 -6.47 0.95 19,636,937 Gridiron Capital 15,000,000 12,923,959 882,393 1,253,270 92.04 3,939,375 14,249,452 13.39 1.32 15,502,722 Gridiron Capital Fund II, LP 2011 15,000,000 12,923,959 882,393 1,253,270 92.04 3,939,375 14,249,452 13.39 1.32 15,502,722 Guardian Capital Partners 20,000,000 2,900,648 422,607 16,742,230 16.62 0 2,487,719 -30.60 0.75 19,229,949 Guardian Capital Partners Fund II, L.P. 2014 20,000,000 2,900,648 422,607 16,742,230 16.62 0 2,487,719 -30.60 0.75 19,229,949 HarbourVest 86,823,772 64,285,713 3,441,543 19,620,806 78.01 42,924,027 51,458,359 10.95 1.39 71,079,166 Dover Street VII L.P. 2008 20,000,000 17,655,308 1,408,217 950,000 95.32 19,025,863 9,683,482 11.94 1.51 10,633,482 Dover Street VIII LP 2012 25,000,000 14,578,276 427,929 10,000,000 60.02 5,039,132 16,266,948 36.39 1.42 26,266,948 HarbourVest Direct 2007 Fund 2007 20,000,000 18,439,644 910,356 650,000 96.75 14,959,125 14,343,874 9.50 1.51 14,993,874 HarbourVest Intl Private Equity Fund VI 2008 21,823,772 13,612,485 695,041 8,020,806 65.56 3,899,907 11,164,055 -0.31 1.05 19,184,862 Highway 12 Ventures 10,000,000 8,154,061 1,963,790 37,429 101.18 3,507,203 9,401,461 4.65 1.28 9,438,890 Highway 12 Venture Fund II, L.P. 2006 10,000,000 8,154,061 1,963,790 37,429 101.18 3,507,203 9,401,461 4.65 1.28 9,438,890 HKW Capital Partners 20,000,000 8,557,658 356,558 11,210,724 44.57 865,088 10,433,003 23.59 1.27 21,643,727 HKW Capital Partners IV, L.P. 2012 20,000,000 8,557,658 356,558 11,210,724 44.57 865,088 10,433,003 23.59 1.27 21,643,727 Industry Ventures 10,000,000 9,229,002 910,134 265,001 101.39 8,638,932 4,024,406 4.86 1.25 4,289,407 Industry Ventures Fund IV, L.P. 2005 10,000,000 9,229,002 910,134 265,001 101.39 8,638,932 4,024,406 4.86 1.25 4,289,407 JCF 25,000,000 23,134,341 1,188,295 752,112 97.29 1,621,477 7,324,980 -12.85 0.37 8,077,092 J.C. Flowers II, L.P. 2006 25,000,000 23,134,341 1,188,295 752,112 97.29 1,621,477 7,324,980 -12.85 0.37 8,077,092 Joseph Littlejohn & Levy 50,000,000 30,648,753 1,247,620 18,272,760 63.79 29,233,694 18,839,338 11.06 1.51 37,112,098 JLL Partners Fund V, L.P. 2005 25,000,000 22,938,056 1,247,620 814,324 96.74 29,233,694 11,816,933 11.36 1.70 12,631,257 JLL Partners Fund VII, LP 2015 25,000,000 7,710,697 0 17,458,436 30.84 0 7,022,405 -14.17 0.91 24,480,841 Kinderhook Capital 20,000,000 4,100,000 222,826 15,677,174 21.61 0 3,798,349 -19.74 0.88 19,475,523 Kinderhook Capital Fund IV, L.P. 2014 20,000,000 4,100,000 222,826 15,677,174 21.61 0 3,798,349 -19.74 0.88 19,475,523 KKR 25,000,000 25,000,000 1,646,730 0 106.59 61,636,007 112,117 19.81 2.32 112,117 KKR European Fund, L. P. 1999 25,000,000 25,000,000 1,646,730 0 106.59 61,636,007 112,117 19.81 2.32 112,117 Lexington Capital Partners 155,000,000 133,402,795 8,568,470 13,103,281 91.59 160,685,752 56,799,284 13.56 1.53 69,902,565 Lexington Capital Partners V, L.P. 2001 50,000,000 46,997,565 2,759,053 243,382 99.51 78,836,587 5,128,184 18.31 1.69 5,371,566 Lexington Capital Partners VI-B, L.P. 2005 50,000,000 45,979,278 3,203,366 817,356 98.37 49,175,456 18,534,942 6.98 1.38 19,352,298 Lexington Capital Partners VII, L.P. 2009 45,000,000 31,786,951 2,200,455 11,087,140 75.53 26,162,043 26,608,336 17.93 1.55 37,695,476 Lexington Middle Market Investors II, LP 2008 10,000,000 8,639,001 405,596 955,403 90.45 6,511,666 6,527,822 14.49 1.44 7,483,225
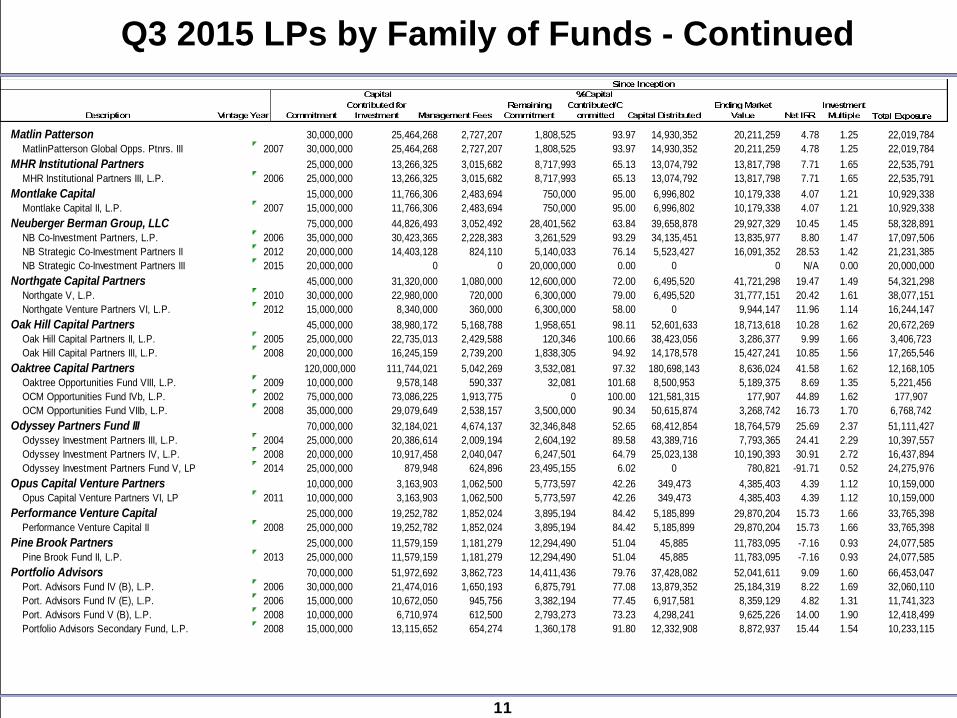
11
Q3 2015 LPs by Family of Funds - Continued
Matlin Patterson 30,000,000 25,464,268 2,727,207 1,808,525 93.97 14,930,352 20,211,259 4.78 1.25 22,019,784 MatlinPatterson Global Opps. Ptnrs. III 2007 30,000,000 25,464,268 2,727,207 1,808,525 93.97 14,930,352 20,211,259 4.78 1.25 22,019,784 MHR Institutional Partners 25,000,000 13,266,325 3,015,682 8,717,993 65.13 13,074,792 13,817,798 7.71 1.65 22,535,791 MHR Institutional Partners III, L.P. 2006 25,000,000 13,266,325 3,015,682 8,717,993 65.13 13,074,792 13,817,798 7.71 1.65 22,535,791 Montlake Capital 15,000,000 11,766,306 2,483,694 750,000 95.00 6,996,802 10,179,338 4.07 1.21 10,929,338 Montlake Capital II, L.P. 2007 15,000,000 11,766,306 2,483,694 750,000 95.00 6,996,802 10,179,338 4.07 1.21 10,929,338 Neuberger Berman Group, LLC 75,000,000 44,826,493 3,052,492 28,401,562 63.84 39,658,878 29,927,329 10.45 1.45 58,328,891 NB Co-Investment Partners, L.P. 2006 35,000,000 30,423,365 2,228,383 3,261,529 93.29 34,135,451 13,835,977 8.80 1.47 17,097,506 NB Strategic Co-Investment Partners II 2012 20,000,000 14,403,128 824,110 5,140,033 76.14 5,523,427 16,091,352 28.53 1.42 21,231,385 NB Strategic Co-Investment Partners III 2015 20,000,000 0 0 20,000,000 0.00 0 0 N/A 0.00 20,000,000 Northgate Capital Partners 45,000,000 31,320,000 1,080,000 12,600,000 72.00 6,495,520 41,721,298 19.47 1.49 54,321,298 Northgate V, L.P. 2010 30,000,000 22,980,000 720,000 6,300,000 79.00 6,495,520 31,777,151 20.42 1.61 38,077,151 Northgate Venture Partners VI, L.P. 2012 15,000,000 8,340,000 360,000 6,300,000 58.00 0 9,944,147 11.96 1.14 16,244,147 Oak Hill Capital Partners 45,000,000 38,980,172 5,168,788 1,958,651 98.11 52,601,633 18,713,618 10.28 1.62 20,672,269 Oak Hill Capital Partners II, L.P. 2005 25,000,000 22,735,013 2,429,588 120,346 100.66 38,423,056 3,286,377 9.99 1.66 3,406,723 Oak Hill Capital Partners III, L.P. 2008 20,000,000 16,245,159 2,739,200 1,838,305 94.92 14,178,578 15,427,241 10.85 1.56 17,265,546 Oaktree Capital Partners 120,000,000 111,744,021 5,042,269 3,532,081 97.32 180,698,143 8,636,024 41.58 1.62 12,168,105 Oaktree Opportunities Fund VIII, L.P. 2009 10,000,000 9,578,148 590,337 32,081 101.68 8,500,953 5,189,375 8.69 1.35 5,221,456 OCM Opportunities Fund IVb, L.P. 2002 75,000,000 73,086,225 1,913,775 0 100.00 121,581,315 177,907 44.89 1.62 177,907 OCM Opportunities Fund VIIb, L.P. 2008 35,000,000 29,079,649 2,538,157 3,500,000 90.34 50,615,874 3,268,742 16.73 1.70 6,768,742 Odyssey Partners Fund III 70,000,000 32,184,021 4,674,137 32,346,848 52.65 68,412,854 18,764,579 25.69 2.37 51,111,427 Odyssey Investment Partners III, L.P. 2004 25,000,000 20,386,614 2,009,194 2,604,192 89.58 43,389,716 7,793,365 24.41 2.29 10,397,557 Odyssey Investment Partners IV, L.P. 2008 20,000,000 10,917,458 2,040,047 6,247,501 64.79 25,023,138 10,190,393 30.91 2.72 16,437,894 Odyssey Investment Partners Fund V, LP 2014 25,000,000 879,948 624,896 23,495,155 6.02 0 780,821 -91.71 0.52 24,275,976 Opus Capital Venture Partners 10,000,000 3,163,903 1,062,500 5,773,597 42.26 349,473 4,385,403 4.39 1.12 10,159,000 Opus Capital Venture Partners VI, LP 2011 10,000,000 3,163,903 1,062,500 5,773,597 42.26 349,473 4,385,403 4.39 1.12 10,159,000 Performance Venture Capital 25,000,000 19,252,782 1,852,024 3,895,194 84.42 5,185,899 29,870,204 15.73 1.66 33,765,398 Performance Venture Capital II 2008 25,000,000 19,252,782 1,852,024 3,895,194 84.42 5,185,899 29,870,204 15.73 1.66 33,765,398 Pine Brook Partners 25,000,000 11,579,159 1,181,279 12,294,490 51.04 45,885 11,783,095 -7.16 0.93 24,077,585 Pine Brook Fund II, L.P. 2013 25,000,000 11,579,159 1,181,279 12,294,490 51.04 45,885 11,783,095 -7.16 0.93 24,077,585 Portfolio Advisors 70,000,000 51,972,692 3,862,723 14,411,436 79.76 37,428,082 52,041,611 9.09 1.60 66,453,047 Port. Advisors Fund IV (B), L.P. 2006 30,000,000 21,474,016 1,650,193 6,875,791 77.08 13,879,352 25,184,319 8.22 1.69 32,060,110 Port. Advisors Fund IV (E), L.P. 2006 15,000,000 10,672,050 945,756 3,382,194 77.45 6,917,581 8,359,129 4.82 1.31 11,741,323 Port. Advisors Fund V (B), L.P. 2008 10,000,000 6,710,974 612,500 2,793,273 73.23 4,298,241 9,625,226 14.00 1.90 12,418,499 Portfolio Advisors Secondary Fund, L.P. 2008 15,000,000 13,115,652 654,274 1,360,178 91.80 12,332,908 8,872,937 15.44 1.54 10,233,115

12
Q3 2015 LPs by Family of Funds - Continued
1.) Due to, among other things, the lack of a valuation standard in the private equity industry, differences in the pace of investment across funds and the understatement of returns in the early years of a fund's the internal rate of return information does not accurately reflect current or expected future returns, and the internal rates of return and all other disclosures with respect to the Partnerships have not been prepreviewed or approved by the Partnerships, the General Partners, or any other affiliates.
Quintana Energy Partners 15,000,000 14,316,819 1,793,757 482,042 107.40 8,611,701 5,077,044 -1.84 0.85 5,559,086 Quintana Energy Partners Fund I, L.P. 2006 15,000,000 14,316,819 1,793,757 482,042 107.40 8,611,701 5,077,044 -1.84 0.85 5,559,086 Siguler Guff & Company 50,000,000 38,001,025 1,881,263 10,250,000 79.76 24,573,979 34,100,159 11.07 1.47 44,350,159 Siguler Guff Small Buyout Opportunities 2007 25,000,000 22,263,097 1,494,191 1,375,000 95.03 21,981,459 17,258,556 11.56 1.65 18,633,556 Siguler Guff Small Buyout Opps Fund II 2011 25,000,000 15,737,928 387,072 8,875,000 64.50 2,592,520 16,841,603 8.94 1.21 25,716,603 Southern Capital 15,000,000 11,118,363 843,699 3,038,608 79.75 0 10,278,414 -13.50 0.86 13,317,023 Southern Capital Fund III, L.P. 2013 15,000,000 11,118,363 843,699 3,038,608 79.75 0 10,278,414 -13.50 0.86 13,317,023 Spire Capital Partners 15,000,000 4,206,919 857,595 9,938,099 33.76 0 4,398,779 -17.93 0.87 14,336,878 Spire Capital Partners III 2014 15,000,000 4,206,919 857,595 9,938,099 33.76 0 4,398,779 -17.93 0.87 14,336,878 Sterling Capital Partners 20,000,000 9,727,237 1,156,646 9,174,827 54.42 2,307,657 9,758,509 8.06 1.11 18,933,336 Sterling Capital Partners IV 2012 20,000,000 9,727,237 1,156,646 9,174,827 54.42 2,307,657 9,758,509 8.06 1.11 18,933,336 Summit Ventures 20,000,000 12,669,562 508,410 6,900,000 65.89 2,019,730 14,300,603 15.16 1.24 21,200,603 Summit Partners Growth Equity Fund VIII 2011 20,000,000 12,669,562 508,410 6,900,000 65.89 2,019,730 14,300,603 15.16 1.24 21,200,603 TA Associates, Inc. 10,000,000 8,455,158 744,842 800,000 92.00 4,450,000 9,585,051 18.68 1.53 10,385,051 TA XI, L.P. 2010 10,000,000 8,455,158 744,842 800,000 92.00 4,450,000 9,585,051 18.68 1.53 10,385,051 Tenaya Capital 35,000,000 15,987,158 1,233,110 17,779,732 49.20 (0) 17,768,118 1.91 1.03 35,547,850 Tenaya Capital VI, L.P. 2012 20,000,000 14,284,814 1,089,777 4,625,409 76.87 (0) 16,001,899 2.20 1.04 20,627,308 Tenaya Capital VII, L.P. 2014 15,000,000 1,702,343 143,333 13,154,323 12.30 0 1,766,219 -6.33 0.96 14,920,542 Tenex Capital Management 20,000,000 14,645,429 1,006,811 5,251,670 78.26 7,500,009 14,766,675 19.65 1.42 20,018,345 Tenex Capital Partners LP 2012 20,000,000 14,645,429 1,006,811 5,251,670 78.26 7,500,009 14,766,675 19.65 1.42 20,018,345 Terra Firma Capital Partners 25,432,997 21,981,050 3,389,451 79,548 99.75 1,238,479 13,941,738 -8.37 0.60 14,021,286 Terra Firma Capital Partners III, L.P. 2007 25,432,997 21,981,050 3,389,451 79,548 99.75 1,238,479 13,941,738 -8.37 0.60 14,021,286 Thayer Hidden Creek Management, L.P. 45,000,000 27,241,142 2,936,195 15,458,601 67.06 5,995,319 35,748,249 15.33 1.38 51,206,850 HCI Equity Partners III, LP 2008 20,000,000 18,061,509 1,934,413 640,016 99.98 5,995,319 24,418,461 15.22 1.52 25,058,477 HCI Equity Partners IV, LP 2013 25,000,000 9,179,633 1,001,782 14,818,585 40.73 0 11,329,788 16.64 1.11 26,148,373 The Catalyst Capital Group 30,000,000 16,119,768 1,175,913 12,768,040 57.65 1,228,884 17,861,514 9.90 1.10 30,629,554 Catalyst Fund IV Parallel, L.P. 2014 15,000,000 8,038,125 211,875 6,750,000 55.00 123,413 8,293,109 5.07 1.02 15,043,109 Catalyst Fund LP IV 2012 15,000,000 8,081,643 964,038 6,018,040 60.30 1,105,472 9,568,405 10.56 1.18 15,586,445 Trilantic Capital Partners 51,098,351 17,585,666 2,297,644 31,259,220 38.91 11,221,157 13,525,331 9.29 1.24 44,784,551 Trilantic Capital Partners IV L.P. 2007 11,098,351 8,563,368 1,137,588 1,512,802 87.41 11,157,738 4,792,743 14.29 1.64 6,305,545 Trilantic Capital Partners V L.P. 2013 20,000,000 6,019,672 1,050,044 12,973,337 35.35 63,419 5,830,581 -10.83 0.83 18,803,918 Trilantic Energy Partners (NA) LP 2014 20,000,000 3,002,626 110,012 16,773,081 15.56 0 2,902,007 -4.44 0.93 19,675,088 Veritas Capital 45,000,000 31,839,840 524,971 12,635,189 71.92 0 44,298,086 14.29 1.37 56,933,275 The Veritas Capital Fund IV, L.P. 2010 25,000,000 24,066,553 450,046 483,401 98.07 0 36,648,421 14.71 1.49 37,131,822 Veritas Capital Fund V, L.P. 2014 20,000,000 7,773,287 74,925 12,151,788 39.24 0 7,649,665 -3.73 0.97 19,801,453 Welsh, Carson, Anderson & Stowe 75,000,000 68,925,391 5,506,948 750,000 99.24 96,306,396 18,596,932 8.79 1.54 19,346,932 Welsh, Carson, Anderson & Stowe IV, LP 2004 25,000,000 23,138,884 1,861,116 0 100.00 26,483,287 5,876,058 5.38 1.29 5,876,058 Welsh, Carson, Anderson & Stowe IX, L.P. 2000 25,000,000 22,704,505 2,045,495 250,000 99.00 42,024,086 47,423 11.91 1.70 297,423 Welsh, Carson, Anderson & Stowe X, L.P. 2005 25,000,000 23,082,002 1,600,337 500,000 98.73 27,799,023 12,673,451 7.99 1.64 13,173,451 White Deer 25,000,000 6,784,593 1,436,301 16,779,106 32.88 1 5,360,392 -27.34 0.65 22,139,498 White Deer Energy II L.P. 2013 25,000,000 6,784,593 1,436,301 16,779,106 32.88 1 5,360,392 -27.34 0.65 22,139,498LP's by Family of Funds (Inactive) Total 391,151,089 353,841,381 21,177,845 0 95.88 646,227,427 0 14.57 1.72 0
One new commitment, NB Strategic Co-Investment Partners III was added since 2Q15.

13
MPEP Holdings Report as of December 31, 2015
Commitment Summary Market Value Summary
Fund NameTotal
Commitment Funded CapitalUnfunded
Commitment%
UnfundedBeginning
Market ValueEnding Market
Value
Total 2,456,212,084 1,894,771,010.49 588,352,795.48 23.95 1,094,383,749.25 1,088,971,731.80
ASP Fund of Funds 185,787,510 187,619,560.08 8,493,690.00 4.57 55,359,232.87 53,622,527.27 Buyout 901,098,351 576,334,617.19 330,657,122.98 36.69 435,447,134.91 445,283,782.81 Co-Investments 95,000,000 67,808,653.26 28,495,756.74 30.00 43,885,535.60 39,036,232.28 Distressed 297,500,000 266,586,746.18 32,187,973.17 10.82 102,954,634.98 101,631,575.07 Mezzanine Debt 25,000,000 25,000,000.00 0.00 0.00 2,406,777.30 2,406,777.30 Non-US Private Equity 257,428,944 209,531,559.91 52,070,843.34 20.23 119,085,739.75 121,250,211.60 Secondary 254,397,279 227,551,694.08 27,987,348.00 11.00 96,155,366.14 91,945,264.75 Special Situation 180,000,000 123,268,616.22 58,748,448.05 32.64 61,890,383.29 62,554,297.77 Venture Capital 260,000,000 211,069,563.57 49,711,613.20 19.12 177,198,944.41 171,241,062.95

Confidential Page 4
IRR Benchmark Comparison (Since 1980)As of September 30, 2015
By Investment FocusDescription PIC Client DPI Client RVPI Client TVPI Client IRR ClientBuyout 0.83 0.78 1.03 1.02 0.48 0.48 1.52 1.50 12.59 11.69
Venture Capital 0.88 0.82 0.96 0.82 0.65 0.78 1.61 1.61 14.34 15.76Private Debt 0.84 1.00 0.98 1.13 0.43 0.22 1.41 1.35 11.14 7.32
Pooled IRR 0.84 0.79 1.02 1.00 0.50 0.50 1.51 1.50 12.73 12.48
By OriginDescription PIC Client DPI Client RVPI Client TVPI Client IRR ClientUS 0.84 0.80 1.08 1.04 0.48 0.48 1.56 1.52 13.11 12.79Non-US 0.83 0.81 1.03 0.73 0.47 0.56 1.50 1.28 12.38 7.24
Pooled IRR 0.84 0.79 1.02 1.00 0.50 0.50 1.51 1.50 12.73 12.48
By Vintage YearDescription PIC Client DPI Client RVPI Client TVPI Client IRR Client1990 1.00 1.04 2.46 2.41 0.00 0.00 2.46 2.41 18.60 27.63
1991 1.03 1.07 2.51 2.29 0.00 0.00 2.51 2.29 23.47 24.24
1992 1.04 0.00 2.42 0.00 0.00 0.00 2.42 0.00 25.75 0.00
1993 1.04 1.03 2.48 2.23 0.00 0.00 2.48 2.23 26.33 23.25
1994 0.98 0.00 3.01 0.00 0.00 0.00 3.01 0.00 33.67 0.00
1995 0.97 0.00 2.05 0.00 0.00 0.00 2.05 0.00 23.58 0.00
1996 1.00 1.12 1.85 1.65 0.01 0.00 1.86 1.65 17.78 14.80
1997 0.99 1.05 1.54 1.89 0.00 0.00 1.54 1.89 9.85 15.19
1998 0.97 1.11 1.42 1.33 0.01 0.02 1.44 1.35 7.67 6.01
1999 0.93 1.04 1.27 1.91 0.02 0.05 1.30 1.96 5.41 14.84
2000 0.99 1.03 1.55 1.52 0.06 0.04 1.61 1.56 10.72 8.85
2001 1.02 1.01 1.73 1.61 0.09 0.09 1.82 1.70 16.73 13.83
2002 1.01 1.00 1.72 1.51 0.12 0.13 1.84 1.63 19.55 25.09
2003 0.96 1.00 1.78 1.17 0.25 0.38 2.03 1.56 18.09 7.64
2004 1.02 0.92 1.53 1.36 0.22 0.27 1.74 1.63 13.96 12.21
2005 1.02 0.97 1.33 1.24 0.29 0.37 1.62 1.61 9.94 9.41
2006 0.99 0.91 0.98 0.95 0.43 0.40 1.42 1.36 6.84 6.19
2007 0.98 0.96 0.92 0.75 0.55 0.52 1.47 1.27 8.84 5.89
2008 0.94 0.84 0.83 0.93 0.66 0.62 1.49 1.55 12.22 14.03
2009 0.99 0.81 0.77 0.71 0.75 0.78 1.52 1.49 14.09 13.82
2010 0.93 0.88 0.47 0.42 0.95 1.20 1.43 1.62 13.64 21.55
2011 0.82 0.75 0.30 0.32 1.04 0.93 1.35 1.25 15.38 12.01
2012 0.78 0.60 0.27 0.19 0.99 1.07 1.26 1.26 15.36 15.95
2013 0.53 0.43 0.11 0.01 1.01 0.96 1.12 0.97 9.74 -2.75
2014 0.31 0.22 0.04 0.00 0.97 0.92 1.02 0.93 2.34 -14.162015 0.12 0.18 0.02 0.00 0.92 0.91 0.94 0.91 -15.65 -21.95
Pooled IRR 0.84 0.79 1.02 1.00 0.50 0.50 1.51 1.50 12.73 12.48
Based on data compiled from 2,462 Private Equity funds, including fully liquidated partnerships, formed between 1980 to 2015.
IRR: Pooled Average IRR is net of fees, expenses and carried interest.
Data Source: State Street Global Exchange.
State Street Private Equity IndexSM
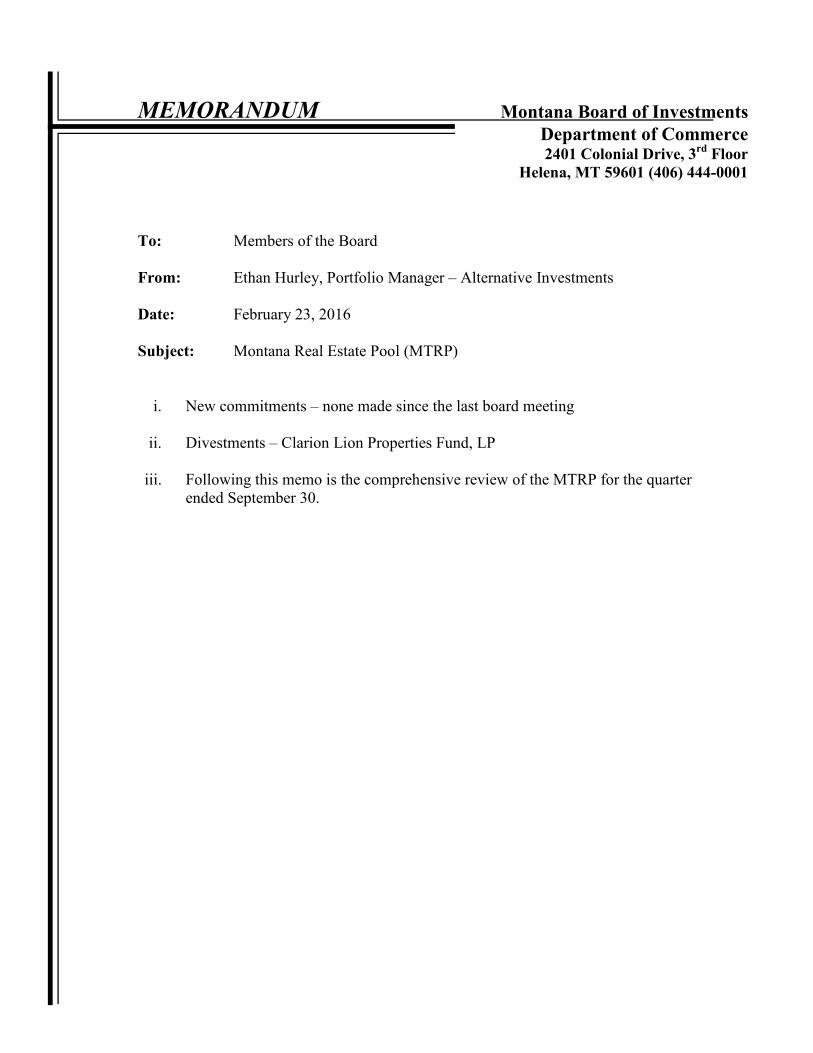
MEMORANDUM Montana Board of Investments Department of Commerce 2401 Colonial Drive, 3rd Floor Helena, MT 59601 (406) 444-0001 To: Members of the Board
From: Ethan Hurley, Portfolio Manager – Alternative Investments Date: February 23, 2016 Subject: Montana Real Estate Pool (MTRP)
i. New commitments – none made since the last board meeting
ii. Divestments – Clarion Lion Properties Fund, LP
iii. Following this memo is the comprehensive review of the MTRP for the quarter ended September 30.
Montana Board of Investments Real Estate Board Report
Q3 2015
Due to, among other things, the lack of a valuation standard in the real estate private equity industry, differences in the pace of investment across funds and the understatement of returns in the early years of a fund's life, the internal rate of return information may not accurately reflect current or expected future returns, and the internal rates of return and all other disclosures with respect to the Partnerships have not been prepared, reviewed or approved by the Partnerships, the General Partners, or any other affiliates.

1
Contents
• Quarterly Cash Flow Chart
• Strategy – Total Exposure Chart
• Geography – Total Exposure Chart
• Property Type – Market Value Exposure Chart
• Time Weighted Returns
• Internal Rates of Return
• Commitment Summary
• Leverage
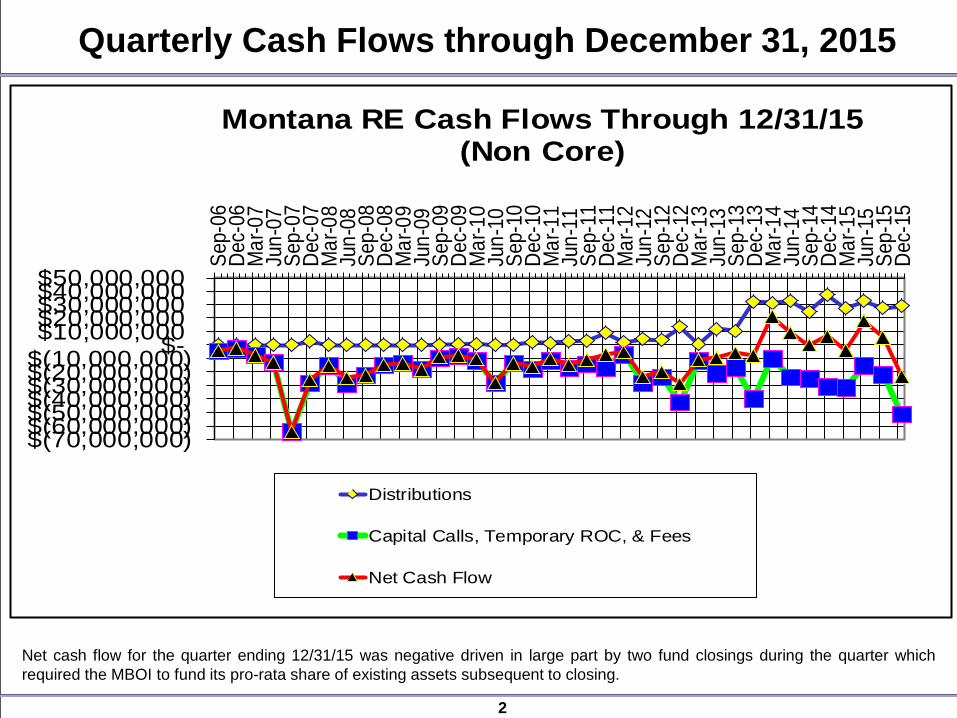
2
Quarterly Cash Flows through December 31, 2015
$(70,000,000) $(60,000,000) $(50,000,000) $(40,000,000) $(30,000,000) $(20,000,000) $(10,000,000) $- $10,000,000 $20,000,000 $30,000,000 $40,000,000 $50,000,000
Sep-
06De
c-06
Mar
-07
Jun-
07Se
p-07
Dec-
07M
ar-0
8Ju
n-08
Sep-
08De
c-08
Mar
-09
Jun-
09Se
p-09
Dec-
09M
ar-1
0Ju
n-10
Sep-
10De
c-10
Mar
-11
Jun-
11Se
p-11
Dec-
11M
ar-1
2Ju
n-12
Sep-
12De
c-12
Mar
-13
Jun-
13Se
p-13
Dec-
13M
ar-1
4Ju
n-14
Sep-
14De
c-14
Mar
-15
Jun-
15Se
p-15
Dec-
15
Montana RE Cash Flows Through 12/31/15 (Non Core)
Distributions
Capital Calls, Temporary ROC, & Fees
Net Cash Flow
Net cash flow for the quarter ending 12/31/15 was negative driven in large part by two fund closings during the quarter which required the MBOI to fund its pro-rata share of existing assets subsequent to closing.
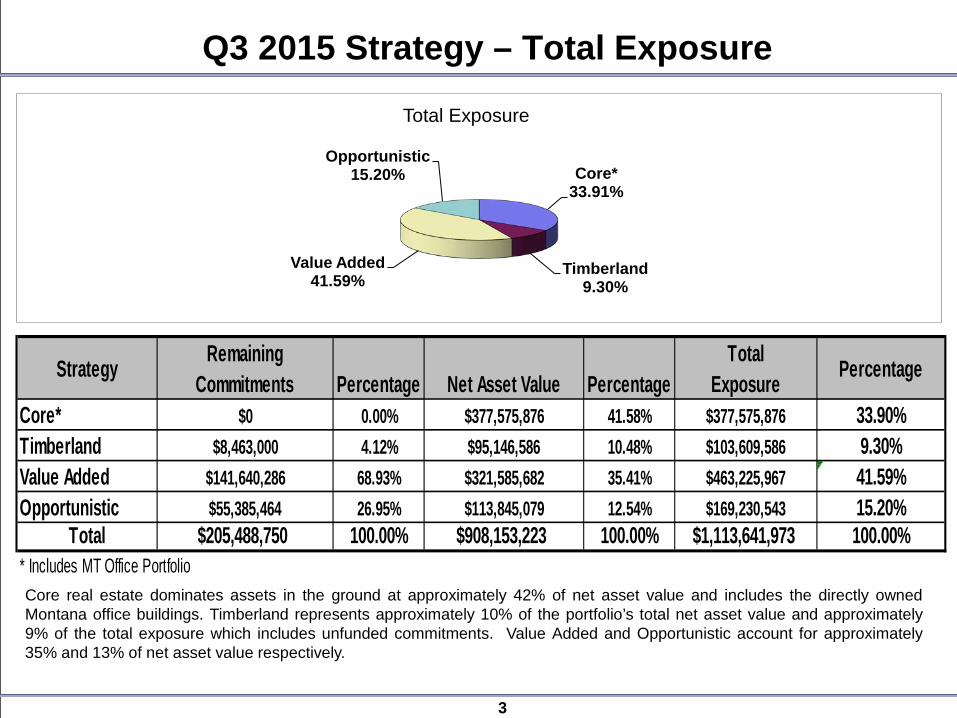
3
Q3 2015 Strategy – Total Exposure
Core* 33.91%
Timberland 9.30%
Value Added 41.59%
Opportunistic 15.20%
Total Exposure
Strategy Remaining Commitments Percentage Net Asset Value Percentage
Total Exposure Percentage
Core* $0 0.00% $377,575,876 41.58% $377,575,876 33.90%Timberland $8,463,000 4.12% $95,146,586 10.48% $103,609,586 9.30%Value Added $141,640,286 68.93% $321,585,682 35.41% $463,225,967 41.59%Opportunistic $55,385,464 26.95% $113,845,079 12.54% $169,230,543 15.20%
Total $205,488,750 100.00% $908,153,223 100.00% $1,113,641,973 100.00%* Includes MT Office PortfolioCore real estate dominates assets in the ground at approximately 42% of net asset value and includes the directly owned Montana office buildings. Timberland represents approximately 10% of the portfolio’s total net asset value and approximately 9% of the total exposure which includes unfunded commitments. Value Added and Opportunistic account for approximately 35% and 13% of net asset value respectively.

4
Q3 2015 Geography – Total Exposure
The geographic mix of the real estate portfolio is fairly aligned with NCREIF. As a reminder, while the portfolio is underweight in the West, East and Midwest and overweight to the South relative to the index, no attempt is made to match index weights. Approximately 7% of the portfolio is broadly diversified across the remainder of the US and the portfolio’s international exposure represents approximately 7% of the mix.
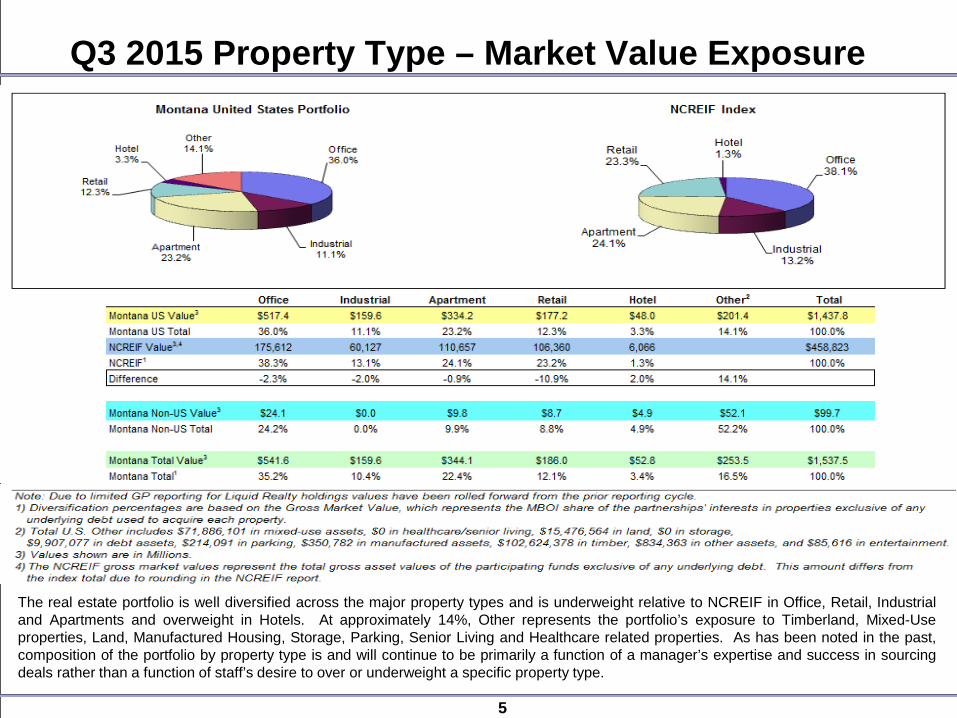
5
Q3 2015 Property Type – Market Value Exposure
The real estate portfolio is well diversified across the major property types and is underweight relative to NCREIF in Office, Retail, Industrial and Apartments and overweight in Hotels. At approximately 14%, Other represents the portfolio’s exposure to Timberland, Mixed-Use properties, Land, Manufactured Housing, Storage, Parking, Senior Living and Healthcare related properties. As has been noted in the past, composition of the portfolio by property type is and will continue to be primarily a function of a manager’s expertise and success in sourcing deals rather than a function of staff’s desire to over or underweight a specific property type.
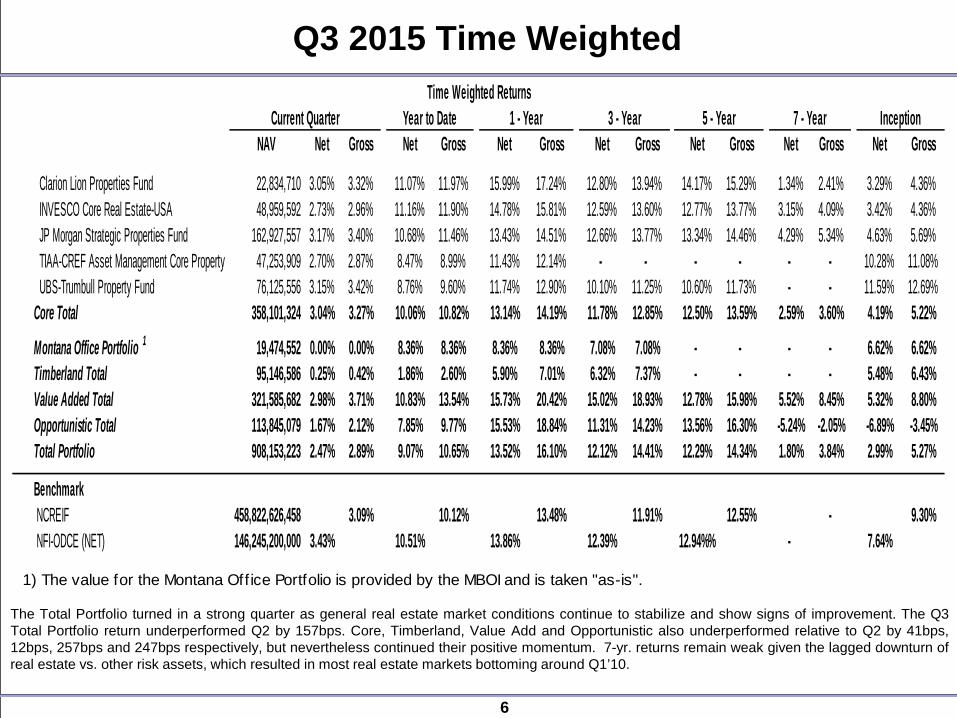
6
Q3 2015 Time Weighted
1) The value for the Montana Office Portfolio is provided by the MBOI and is taken "as-is".
NAV Net Gross Net Gross Net Gross Net Gross Net Gross Net Gross Net Gross
Clarion Lion Properties Fund 22,834,710 3.05% 3.32% 11.07% 11.97% 15.99% 17.24% 12.80% 13.94% 14.17% 15.29% 1.34% 2.41% 3.29% 4.36% INVESCO Core Real Estate-USA 48,959,592 2.73% 2.96% 11.16% 11.90% 14.78% 15.81% 12.59% 13.60% 12.77% 13.77% 3.15% 4.09% 3.42% 4.36% JP Morgan Strategic Properties Fund 162,927,557 3.17% 3.40% 10.68% 11.46% 13.43% 14.51% 12.66% 13.77% 13.34% 14.46% 4.29% 5.34% 4.63% 5.69% TIAA-CREF Asset Management Core Property 47,253,909 2.70% 2.87% 8.47% 8.99% 11.43% 12.14% - - - - - - 10.28% 11.08% UBS-Trumbull Property Fund 76,125,556 3.15% 3.42% 8.76% 9.60% 11.74% 12.90% 10.10% 11.25% 10.60% 11.73% - - 11.59% 12.69% Core Total 358,101,324 3.04% 3.27% 10.06% 10.82% 13.14% 14.19% 11.78% 12.85% 12.50% 13.59% 2.59% 3.60% 4.19% 5.22%
Montana Office Portfolio 1 19,474,552 0.00% 0.00% 8.36% 8.36% 8.36% 8.36% 7.08% 7.08% - - - - 6.62% 6.62% Timberland Total 95,146,586 0.25% 0.42% 1.86% 2.60% 5.90% 7.01% 6.32% 7.37% - - - - 5.48% 6.43% Value Added Total 321,585,682 2.98% 3.71% 10.83% 13.54% 15.73% 20.42% 15.02% 18.93% 12.78% 15.98% 5.52% 8.45% 5.32% 8.80% Opportunistic Total 113,845,079 1.67% 2.12% 7.85% 9.77% 15.53% 18.84% 11.31% 14.23% 13.56% 16.30% -5.24% -2.05% -6.89% -3.45% Total Portfolio 908,153,223 2.47% 2.89% 9.07% 10.65% 13.52% 16.10% 12.12% 14.41% 12.29% 14.34% 1.80% 3.84% 2.99% 5.27%
Benchmark NCREIF 458,822,626,458 3.09% 10.12% 13.48% 11.91% 12.55% - 9.30% NFI-ODCE (NET) 146,245,200,000 3.43% 10.51% 13.86% 12.39% 12.94%% - 7.64%
Time Weighted ReturnsInception7 - Year5 - Year3 - Year1 - YearYear to DateCurrent Quarter
The Total Portfolio turned in a strong quarter as general real estate market conditions continue to stabilize and show signs of improvement. The Q3 Total Portfolio return underperformed Q2 by 157bps. Core, Timberland, Value Add and Opportunistic also underperformed relative to Q2 by 41bps, 12bps, 257bps and 247bps respectively, but nevertheless continued their positive momentum. 7-yr. returns remain weak given the lagged downturn of real estate vs. other risk assets, which resulted in most real estate markets bottoming around Q1’10.

7
Q3 2015 Net Internal Rates of Return
Returns for Timberland, Value Add, Opportunistic and the Total Portfolio were all lower vs. Q2 by 12bps, 353bps, 203bps and 227bps respectively. Nonetheless, all risk categories turned in positive quarters.
NAV Current Quarter
Year to Date 1 - Year 3 - Year 5 - Year 7 - Year Inception
Montana Office Portfolio 19,474,552 0.00% 8.49% 8.44% 7.12% - - 6.41%
Molpus Woodlands Fund III, LP 46,363,694 0.80% 1.29% 7.56% 7.55% - - 6.24% ORM Timber Fund III, LLC 21,440,777 -1.91% 1.18% 1.01% 1.84% - - 1.70% RMS Forest Growth III LP 27,342,115 1.03% 3.38% 6.79% 6.10% - - 5.82% Timberland 95,146,586 0.25% 1.85% 5.82% 6.20% - - 5.51%
ABR Chesapeake Fund III 12,901,000 2.83% 6.43% 11.23% 8.24% 6.86% 3.38% 3.52% ABR Chesapeake Fund IV 27,078,270 1.83% 4.15% 9.63% 10.65% 10.38% - 10.32% AG Core Plus Realty Fund II 1,342,404 0.77% 9.00% 8.96% 15.73% 14.82% 9.53% 8.55% AG Core Plus Realty Fund III 27,890,599 3.64% 21.68% 30.05% 23.97% - - 20.53% AG Core Plus Realty Fund IV, L.P. 3,598,700 0.24% - - - - - -4.00% Apollo Real Estate Finance Corp. 3,758,290 1.03% 11.34% -9.40% 2.38% 1.05% -2.40% -1.42% AREFIN Co-Invest 17,157.00 - - - - - - 8.50% BPG Investment Partnership IX 23,484,815 1.88% 11.15% 16.55% - - - 16.89% CBRE Strategic Partners US Value Fund 6 20,170,038 2.10% 8.57% 18.80% - - - 14.74% CBRE Strategic Partners US Value Fund 7 13,585,572 1.24% 2.79% 1.71% - - - 1.35% DRA Growth & Income Fund VI 7,663,075 4.37% 10.06% -2.60% 22.54% 19.55% 11.42% 10.98% DRA Growth & Income Fund VII 29,879,866 3.95% 10.20% 14.00% 15.67% - - 15.63% DRA Growth and Income Fund VIII 9,232,900 4.28% 10.42% 13.08% - - - 14.10% Equus Investment Partnership X, LP 4 -45,981 - - - - - - - Five Arrows Securities V, L.P. 16,699,780 0.72% 1.35% 8.46% 15.69% 13.17% 12.48% 11.61% Harbert US Real Estate Fund V, LP 14,087,134 8.45% 12.21% 24.86% - - - 21.27% Hudson RE Fund IV Co-Invest 400,292 0.33% 4.54% 14.98% 23.61% 12.05% 7.00% 6.69% Hudson Realty Capital Fund IV 4,561,783 0.90% 5.65% 10.46% 1.02% 1.43% -5.17% -4.26% Landmark Real Estate Partners VI 9,790,734 3.99% 9.24% 11.58% 18.36% - - 25.84% Realty Associates Fund VIII 13,928,399 2.65% 12.29% 15.10% 9.79% 6.00% -2.15% -1.25% Realty Associates Fund IX 18,094,383 4.01% 12.01% 15.39% 12.14% 12.31% - 11.33% Realty Associates Fund X 21,736,231 3.60% 11.01% 14.81% - - - 13.70% Stockbridge Value Fund, LP 19,575,818 3.76% 18.97% 29.16% 21.62% - - 20.59% Stockbridge Value Fund II, LP 12,802,230 1.88% - - - - - 8.46% Stoltz Real Estate Fund V, LP 4 910,346 - - - - - - - Strategic Partners Value Enhancement Fund 8,441,847 2.12% 31.48% 48.71% 9.55% 12.86% 1.43% 2.12% Value Added 321,585,682 2.98% 10.92% 15.78% 15.08% 13.31% 8.13% 7.87%
AG Realty Fund VII L.P. 5,702,818 -1.44% 0.46% 10.91% 25.33% 18.08% 15.60% 13.53% AG Realty Fund VIII L.P. 16,755,980 2.39% 14.85% 23.42% 18.26% - - 14.65% ARC (GP1) Ltd 3 3,264,147 -3.00% 14.08% 7.52% 5.47% 10.18% -1.17% -1.38% Beacon Capital Strategic Partners V 4,727,986 3.21% 5.65% 19.15% 7.52% 8.13% -5.00% -7.44% Carlyle Europe Real Estate Partners III 11,353,654 -0.75% 5.38% 3.57% -7.48% -1.88% -3.70% -5.32% CIM Fund III, L.P. 28,510,740 2.27% 8.21% 9.72% 15.15% 16.90% 13.28% 11.79% GEM Realty Fund IV 6,461,680 6.70% 32.62% 51.09% 24.30% 22.23% - 21.33% GEM Realty Fund V 7,838,894 12.81% 24.51% 26.66% - - - 13.35% JER Real Estate Partners IV 5,238 - - - - - - -5.65% MGP Asia Fund III, LP 18,500,123 -3.07% -3.77% 14.82% 11.27% 18.16% 6.71% 5.70% MSREF VI International 6,052,768 2.92% 5.48% 5.19% 6.97% 8.56% -15.30% -16.86% O'Connor North American Property Partners II 4,671,051 1.48% 2.32% 46.48% 16.95% 13.17% -1.90% -2.43% Opportunistic 113,845,079 1.67% 8.00% 16.23% 11.21% 13.11% 2.76% 0.86%
Total 550,051,899 2.11% 8.55% 13.86% 12.35% 11.98% 5.99% 5.08%1) The value for the Montana Office Portfolio is provided by the MBOI and is taken "as-is" per their request.2) This asset w as sold. As such, only the Since Inception return is considered meaningful.3) ARC (GP1) Ltd w as formerly know n as Liquid Realty IV.4) The performance period has not yet started as the Fund has not acquired real estate.

8
Q3 2015 Commitment Summary
Recent commitments now showing include Equus Investment Partnership Fund X, LP and Stoltz Real Estate Fund V, LP.
Vintage Year CommitmentCapital
Contributed 1 Contributed %Remaining
CommitmentCapital
Distributed Net Asset Value NAV % Total Exposure Total Exposure%Investment
Multiple
Core 278,236,254 278,236,254 100% - 62,342,836 358,101,324 39.43% 358,101,324 32.16% 1.45 Clarion Lion Properties Fund 2006 48,236,254 48,236,254 100% - 33,450,324 22,834,710 2.51% 22,834,710 2.05% 1.19 INVESCO Core Real Estate-USA 2007 45,000,000 45,000,000 100% - 10,434,012 48,959,592 5.39% 48,959,592 4.40% 1.25 JP Morgan Strategic Property Fund 2007 95,000,000 95,000,000 100% - 1,759,599 162,927,557 17.94% 162,927,557 14.63% 1.62 TIAA-CREF Asset Management Core Property 2013 40,000,000 40,000,000 100% - 3,738,147 47,253,909 5.20% 47,253,909 4.24% 1.26 UBS-Trumbull Property Fund 2010 50,000,000 50,000,000 100% - 12,960,753 76,125,556 8.38% 76,125,556 6.84% 1.67
Montana Office Portfolio 2011 17,674,045 17,674,045 100% - 3,518,351 19,474,552 2.14% 19,474,552 1.75% 1.30
Timberland 99,457,253 90,994,253 91% 8,463,000 11,318,601 95,146,586 10.48% 103,609,586 9.31% 1.17 Molpus Woodlands Fund III, LP 2 2011 44,664,311 44,664,311 100% - 8,167,420 46,363,694 5.11% 46,363,694 4.16% 1.22 ORM Timber Fund III, LLC 2012 30,000,000 21,537,000 72% 8,463,000 783,895 21,440,777 2.36% 29,903,777 2.69% 1.03 RMS Forest Growth III LP 2011 24,792,942 24,792,942 100% - 2,367,285 27,342,115 3.01% 27,342,115 2.46% 1.19
Value Added 572,013,598 430,591,714 75% 141,421,884 216,364,398 321,585,682 35.41% 463,007,565 41.58% 1.22 ABR Chesapeake Fund III 2006 20,000,000 20,000,000 100% - 12,364,288 12,901,000 1.42% 12,901,000 1.16% 1.25 ABR Chesapeake Fund IV 2010 30,000,000 30,000,000 100% - 8,367,390 27,078,270 2.98% 27,078,270 2.43% 1.17 AG Core Plus Realty Fund II 2007 20,000,000 16,625,976 83% 3,374,024 18,575,113 1,342,404 0.15% 4,716,428 0.42% 1.19 AG Core Plus Realty Fund III 2011 35,000,000 26,131,624 75% 8,868,376 7,356,593 27,890,599 3.07% 36,758,975 3.30% 1.35 AG Core Plus Realty Fund IV, L.P. 2015 20,000,000 3,700,000 19% 16,300,000 - 3,598,700 0.40% 19,898,700 1.79% 0.97 Apollo Real Estate Finance Corp. 2007 10,000,000 10,000,000 100% - 5,619,748 3,758,290 0.41% 3,758,290 0.34% 0.93 AREFIN Co-Invest 2008 8,336,000 8,336,000 100% - 11,633,356 17,157 0.00% 17,157 0.00% 1.39 BPG Investment Partnership IX 2013 30,000,000 27,033,360 90% 2,966,640 8,483,410 23,484,815 2.59% 26,451,455 2.38% 1.18 CBRE Strategic Partners US Value Fund 6 2011 20,000,000 19,538,146 98% 461,854 6,235,459 20,170,038 2.22% 20,631,892 1.85% 1.33 CBRE Strategic Partners US Value Fund 7 2014 25,000,000 13,425,409 54% 11,574,591 29,990 13,585,572 1.50% 25,160,163 2.26% 1.01 DRA Growth & Income Fund VI 2007 24,696,000 22,655,319 92% 2,040,681 23,908,991 7,663,075 0.84% 9,703,756 0.87% 1.23 DRA Growth & Income Fund VII 2011 30,000,000 28,362,000 95% 1,638,000 10,812,728 29,879,866 3.29% 31,517,866 2.83% 1.35 DRA Growth and Income Fund VIII, LLC 2014 25,000,000 8,873,073 35% 16,126,927 426,237 9,232,900 1.02% 25,359,827 2.28% 1.08 Equus Investment Partnership X, LP 2015 20,000,000 - 0% 20,000,000 - (45,981) -0.01% 19,954,019 1.79% - Five Arrows Securities V, L.P.7 2007 29,781,598 29,353,096 99% 428,502 24,847,362 16,699,780 1.84% 17,128,282 1.54% 1.33 Harbert US Real Estate Fund V, LP 2014 20,000,000 13,757,619 69% 6,242,381 1,199,812 14,087,134 1.55% 20,329,515 1.83% 1.09 Hudson RE Fund IV Co-Invest 2008 10,000,000 10,000,000 100% - 14,510,882 400,292 0.04% 400,292 0.04% 1.48 Hudson Realty Capital Fund IV 2007 15,000,000 15,000,000 100% - 6,347,818 4,561,783 0.50% 4,561,783 0.41% 0.73 Landmark Real Estate Partners VI 2011 20,000,000 16,489,606 82% 3,510,394 16,589,606 9,790,734 1.08% 13,301,128 1.19% 1.58 Realty Associates Fund VIII 2007 20,000,000 20,000,000 100% - 4,422,916 13,928,399 1.53% 13,928,399 1.25% 0.91 Realty Associates Fund IX 2009 20,000,000 20,000,000 100% - 10,920,756 18,094,383 1.99% 18,094,383 1.63% 1.44 Realty Associates Fund X 2012 20,000,000 20,000,000 100% - 2,266,345 21,736,231 2.39% 21,736,231 1.95% 1.20 Stockbridge Value Fund, LP 2011 25,000,000 19,661,189 79% 5,338,811 8,028,892 19,575,818 2.16% 24,914,629 2.24% 1.36 Stockbridge Value Fund II, LP 2014 35,000,000 12,449,298 36% 22,550,702 632,364 12,802,230 0.00% 35,000,000 3.14% 1.08 Stoltz Real Estate Fund V, LP 2014 20,000,000 - 0% 20,000,000 - 910,346 0.10% 0 0.00% - Strategic Partners Value Enhancement Fund 2007 19,200,000 19,200,000 100% - 12,784,341 8,441,847 0.93% 8,441,847 0.76% 1.10
Opportunistic 269,713,046 214,327,582 79% 55,385,464 96,105,613 113,845,079 12.54% 169,230,543 15.20% 0.95 AG Realty Fund VII L.P. 2007 20,000,000 16,054,000 80% 3,946,000 16,131,103 5,702,818 0.63% 9,648,818 0.87% 1.35 AG Realty Fund VIII L.P. 2011 20,000,000 16,315,668 82% 3,684,332 3,172,120 16,755,980 1.85% 20,440,312 1.84% 1.23 AG Realty Fund IX, L.P. 2015 20,000,000 - 0% 20,000,000 - - 0.00% 20,000,000 1.80% - ARC (GP1) Ltd 3 2011 18,818,203 18,818,202 100% 1 16,140,739 3,264,147 0.36% 3,264,148 0.29% 0.94 Beacon Capital Strategic Partners V 2007 23,750,000 22,500,000 95% 1,250,000 9,936,198 4,727,986 0.52% 5,977,986 0.54% 0.65 Carlyle Europe Real Estate Partners III 4 2007 30,994,690 26,706,005 86% 4,288,685 9,074,552 11,353,654 1.25% 15,642,340 1.40% 0.75 CIM Fund III, L.P. 2007 25,000,000 25,000,000 100% - 9,061,820 28,510,740 3.14% 28,510,740 2.56% 1.34 GEM Realty Fund IV 2010 15,000,000 11,550,000 77% 3,450,000 8,833,469 6,461,680 0.71% 9,911,680 0.89% 1.31 GEM Realty Fund V 2013 20,000,000 7,332,500 37% 12,667,500 226,018 7,838,894 0.86% 20,506,394 1.84% 1.08 JER Real Estate Partners - Fund IV 2007 7,506,175 7,506,175 100% - 3,833,807 5,238 0.00% 5,238 0.00% 0.51 MGP Asia Fund III, LP 2007 26,143,978 20,083,259 77% 6,060,719 8,706,883 18,500,123 2.04% 24,560,842 2.21% 1.34 MSREF VI International 5 2007 27,500,000 27,500,000 100% - 2,152,403 6,052,768 0.67% 6,052,768 0.54% 0.29 O'Connor North American Property Partners II 6 2008 15,000,000 14,961,772 100% 38,228 8,836,501 4,671,051 0.51% 4,709,279 0.42% 0.88
Montana Real Estate 1,237,094,196 1,031,823,848 83% 205,270,348 389,649,798 908,153,223 1,113,423,571 1.22
1) Capital contributed does not include contributions for expenses outside of the commitment amounts.2) GP's reflects $0 unfunded as the investment period has expired.3) ARC (GP1) Ltd was formerly known as Liquid Realty IV. GP gave a voluntary reduction to Montana on 3/24/20144) Carlyle Europe III's Commitment amount is converted to USD by using the EUR exchange rate from 10/9/2007, the date Montana committed to the fund. The current unfunded capital is based on this figure less the cumulative USD activity.5) Morgan Stanley has the ability to call a 10% reserve from the investors. The full reserve, $2.5 million, was called on 5/21/2009.6) GP's unfunded is $0 but they have the right to call an additional 10% of original commitment.7) Contractual reduction in commitment occurred in July 2013. However, the GP notified us of this reduction in November of 2013. Unfunded commitment is accurately displayed.
Since Inception

9
Holdings Summary through December 31, 2015 Investment Name Vintage Year
Total Commitment
Net Capital Contributed
Unfunded Commitment
% of Unfunded Adjusted NAV5
Total 1,241,318,920 1,086,543,929 152,691,582 12.30% 911,717,092
Core 278,236,254 278,236,254 0 0.00% 358,653,829 Clarion Lion Properties Fund 2006 48,236,254 48,236,254 0 0.00% 22,834,710 INVESCO Core Real Estate-USA 2007 45,000,000 45,000,000 0 0.00% 48,959,592 JP Morgan Strategic Property Fund 2007 95,000,000 95,000,000 0 0.00% 162,927,557 TIAA-CREF Core Property Fund 2013 40,000,000 40,000,000 0 0.00% 47,806,414 UBS-Trumbull Property Fund 2010 50,000,000 50,000,000 0 0.00% 76,125,556
Montana Office Portfolio 2011 0 0 0 0.00% 19,474,552
Timber 105,000,000 99,267,628 45,000 0.04% 103,235,304 Molpus Woodlands Fund III, L.P. 2011 50,000,000 44,519,686 0 0.00% 46,363,694 ORM Timber Fund III, LLC 2012 30,000,000 29,955,000 45,000 0.15% 29,858,777 RMS Forest Growth III LP 2011 25,000,000 24,792,942 0 0.00% 27,012,833
Value Added 572,013,598 477,660,033 94,357,772 16.50% 336,015,294 ABR Chesapeake Fund III 2006 20,000,000 20,000,000 0 0.00% 11,883,560 ABR Chesapeake Fund IV 2010 30,000,000 30,000,000 0 0.00% 26,720,786 AG Core Plus Realty Fund II 2007 20,000,000 18,500,000 1,500,000 7.50% 1,342,404 AG Core Plus Realty Fund III 2011 35,000,000 34,076,334 923,666 2.64% 23,932,099 AG Core Plus Realty Fund IV 2015 20,000,000 3,200,000 16,800,000 84.00% 3,098,700 Apollo Real Estate Finance Corp. 2007 10,000,000 10,000,000 0 0.00% 3,758,290 AREFIN Co-Invest 2008 8,336,000 8,336,000 0 0.00% 46,426 BPG Investment Partnership IX, LP 2013 30,000,000 27,602,510 2,397,490 7.99% 23,891,195 CBRE Strategic Partners U.S. Value Fund 6 2011 20,000,000 19,538,146 461,854 2.31% 18,326,188 CBRE Strategic Partners US Value Fund 7 2014 25,000,000 22,465,919 2,534,081 10.14% 22,573,294 DRA Growth & Income Fund VII 2007 30,000,000 30,468,000 -468,000 -1.56% 28,578,803 DRA Growth & Income Fund VI 2011 24,696,000 22,655,319 2,040,681 8.26% 7,298,837 DRA Growth and Income Fund VIII 2014 25,000,000 10,370,369 14,629,631 58.52% 10,494,367 Equus Investment Partnership X, LP 2015 20,000,000 4,877,241 15,122,759 75.61% 4,831,260 Five Arrows Securities V, L.P. 1 2007 29,781,598 29,785,806 0 0.00% 16,703,239 Harbert US Real Estate Fund V, LP 2014 20,000,000 16,892,388 3,107,612 15.54% 16,077,208 Hudson RE Fund IV Co-Invest 2008 10,000,000 10,000,000 0 0.00% 400,292 Hudson Realty Capital Fund IV 2007 15,000,000 15,000,000 0 0.00% 4,561,783 Landmark Real Estate Partners VI 2011 20,000,000 16,179,928 3,820,072 19.10% 9,354,407 Realty Associates Fund IX 2007 20,000,000 20,000,000 0 0.00% 16,320,742 Realty Associates Fund VIII 2009 20,000,000 20,000,000 0 0.00% 13,200,680 Realty Associates Fund X 2012 20,000,000 20,000,000 0 0.00% 21,252,236 Stockbridge Value Fund 2011 25,000,000 19,947,331 5,052,669 20.21% 15,607,663 Stockbridge Value Fund II, LP 2014 35,000,000 18,564,743 16,435,257 46.96% 18,776,682 Stoltz Real Estate Fund V, LP 2014 20,000,000 10,000,000 10,000,000 50.00% 10,775,036 Strategic Partners Value Enhancement Fund 2007 19,200,000 19,200,000 0 0.00% 6,209,117
Opportunistic 286,069,068 231,380,014 58,288,810 20.38% 113,812,665 AG Realty Fund VII L.P. 2007 20,000,000 18,800,000 1,200,000 6.00% 5,330,631 AG Realty Fund VIII L.P. 2011 20,000,000 21,150,000 0 0.00% 14,539,480 AG Realty Fund IX, L.P. 2015 20,000,000 2,550,000 17,450,000 87.25% 2,550,000 ARC (GP1) Ltd 3 2011 18,818,203 18,818,203 0 0.00% 1,794,129 Beacon Capital Strategic Partners V 2007 23,750,000 22,500,000 1,250,000 5.26% 4,727,986 Carlyle Europe Real Estate Partners III 2 2007 30,994,690 28,774,805 2,219,885 7.16% 10,420,984 CIM Fund III, L.P. 2007 25,000,000 25,000,000 0 0.00% 28,510,740 GEM Realty Fund IV 2010 15,000,000 11,031,791 3,968,209 26.45% 5,611,957 GEM Realty Fund V 2013 20,000,000 8,865,000 11,135,000 55.68% 9,427,644 JER Real Estate Partners IV 2007 7,506,175 7,477,129 29,046 0.39% (1,886) MGP Asia Fund III, LP 2007 30,000,000 19,789,469 10,210,531 34.04% 18,500,123 MSREF VI International 4 2007 25,000,000 27,500,000 0 0.00% 3,871,660 OConnor North American Partners II 2008 15,000,000 14,684,623 265,133 1.77% 4,112,410 PCCP Equity VII, LP 2015 15,000,000 4,438,993 10,561,007 70.41% 4,416,808
1. Contractual reduction in commitment occurred in July 2013. However, the GP notified us of this reduction in November of 2013. Unfunded commitment is accurately displayed. 2. Change in Market Value is due to end of month FX changes.3. GP gave a voluntary reduction in commitment to MT on 3/24/2014, fka Liquid Realty Partners IV, LP4. Morgan Stanley has the ability to call a 10% reserve from the investors. The full reserve, $2.5 million, was called on 5/21/2009. As a result, the unfunded commitment will be stated at $0.5. 9/30/15 NAVs adjusted for contributions, distribution and market value changes through 12/31/15
In addition to Equus X, Stoltz V and PCCP VII calling initial capital during the quarter, ORM III made its final acquisition calling $8.4M.

10
Q3 2015 Leverage
Q4 2014
Q1 2015
Q2 2015
Q3 2015
Core (0% - 50%) 23.84% 23.36% 22.78% 22.74%Timber (0% - 30%) 5.62% 5.63% 5.63% 5.68%Non-Core (Total) (0% - 75%) 56.02% 55.55% 56.26% 57.03%Total (0% - 60) 43.11% 42.36% 42.54% 42.96%
Non-Core Breakout:Opportunistic 44.53% 44.62% 43.10% 44.61%Value Add 60.33% 59.06% 60.21% 60.35%
The portfolio remains moderately leveraged and well within all policy constraints.

MEMORANDUM Montana Board of Investments Department of Commerce 2401 Colonial Drive, 3rd Floor Helena, MT 59601 (406) 444-0001 To: Members of the Board From: Ethan Hurley, Portfolio Manager – Alternative Investments Date: February 23, 2016 Subject: Private Equity and Private Real Estate Partnership Focus Lists – Quarterly update The Partnership Focus Lists (PFL) for private equity (MPEP) and private real estate (MTRP) are shown below. No new funds have been added since the last Board meeting. Net Asset Values shown are as of 9/30/2015.
MPEP Partnership Focus List
February 2016 Partnership Strategy Reason Net Asset
Value Inclusion
Date J.C. Flowers II, L.P. Buyout Performance $7,324,980 August 2010 Terra Firma Capital Partners III, L.P.
Buyout Performance, Risk Management
$13,941,738 August 2010
MTRP Partnership Focus List
February 2016 Partnership Strategy Reason Net Asset
Value Inclusion
Date JER Real Estate Partners IV, L.P. Opportunistic Risk Management, Staff
Turnover, Performance $5,238 August 2010
ARC (GP1) Ltd. (fka Liquid Realty Partners IV, L.P.)
Opportunistic Staff Turnover $3,264,147 August 2010
Morgan Stanley Real Estate Fund VI International-TE, L.P.
Opportunistic Performance, Risk Management, Staff Turnover
$6,052,768 August 2010
Strategic Partners Value Enhancement Fund, L.P.
Value-Added Performance, Platform Stability
$8,441,847 November 2010
Hudson Realty Capital Fund IV, L.P.
Value-Added Performance $4,561,783 May 2011
O’Connor North American Property Partners II, L.P.
Opportunistic Performance, Platform Stability
$4,671,051 May 2011
Beacon Capital Strategic Partners V, LP
Opportunistic Performance, Platform Stability
$4,727,986 August 2012
Carlyle European Real Estate Partners III, LP
Opportunistic Performance, Staff Turnover
$11,353,654 October 2014

Partnership Focus List Background The purpose of the Partnership Focus Lists (PFL’s) is to detail those MPEP and MTRP partnerships for which Staff has concerns regarding their ability to realize appropriate relative private investment returns over the life of the partnership. Factors which may trigger such concerns include, but are not limited to, the following:
• Changes in key personnel • General Partner misconduct • Adverse regulatory, macroeconomic, or capital market developments • Financial distress at the partnership’s sponsor or in the Limited Partner base • A material departure from partnership strategy • Risk management deficiencies (inappropriate use of leverage, investment pace, portfolio
diversification, etc.) • An ineffective sourcing effort • Performance relative to benchmarks • Performance relative to peers
Staff also considers partnership maturity when deciding which funds to include on the PFL. Unseasoned partnerships are not being included on the list simply because they are in the J-curve, and mature partnerships that are substantially realized are excluded from PFL consideration. It is important to understand that unlike public equity managers, our contractual commitments to private equity and closed-end private real estate partnerships cannot be terminated or transitioned to a different manager except under unique circumstances specified in the contract and then usually only with agreement among a super-majority of all LP’s. Therefore, readers of the PFLs should not expect that partnerships listed will see their managers replaced, outstanding commitments rescinded, or other action that as a legal or practical matter may be difficult to implement. The PFLs are administered by the MBOI’s Alternative Investments Staff (AIS), who meet at least quarterly to review and recommend changes to the lists. While all AIS are responsible for providing input into the composition of the PFLs, final decision making authority over which partnerships to include rests with the MBOI’s Chief Investment Officer.

Return to Agenda

Montana Board of InvestmentsInvestment Performance Analysis
Period Ended: December 31, 2015

QTD FYTD1
Year3
Years5
Years7
Years10
Years2014 2013 2012 2011 2010
Public Employees' Retirement - Net 3.12 -0.75 1.86 8.92 8.36 9.97 5.94 8.07 17.38 13.24 2.13 12.77
Public Employees' Benchmark 2.63 -1.39 1.40 9.27 8.79 10.23 6.10 9.08 17.94 14.88 1.67 12.44
Difference 0.49 0.64 0.46 -0.35 -0.43 -0.26 -0.16 -1.01 -0.56 -1.64 0.46 0.33
Public Employees' Retirement - Gross 3.22 -0.55 2.31 9.44 8.91 10.55 6.44 8.61 17.96 13.83 2.68 13.44
All Public Plans > $3B Total Fund Median 2.23 -2.48 0.17 6.78 6.91 9.75 5.88 6.76 15.03 13.34 0.96 12.82
Rank 13 6 8 1 1 8 6 9 10 34 26 41
Teachers' Retirement - Net 3.12 -0.76 1.86 8.93 8.37 9.98 5.94 8.09 17.38 13.24 2.14 12.80
Teachers' Benchmark 2.63 -1.40 1.40 9.28 8.79 10.23 6.10 9.11 17.94 14.89 1.66 12.45
Difference 0.49 0.64 0.46 -0.35 -0.42 -0.25 -0.16 -1.02 -0.56 -1.65 0.48 0.35
Teachers' Retirement - Gross 3.22 -0.56 2.32 9.45 8.92 10.56 6.44 8.63 17.96 13.84 2.68 13.47
All Public Plans > $3B Total Fund Median 2.23 -2.48 0.17 6.78 6.91 9.75 5.88 6.76 15.03 13.34 0.96 12.82
Rank 13 7 8 1 1 8 6 9 10 34 26 41
Police Retirement - Net 3.12 -0.74 1.86 8.93 8.36 9.95 5.90 8.07 17.41 13.23 2.10 12.62
Police Benchmark 2.63 -1.38 1.41 9.27 8.77 10.20 6.04 9.10 17.92 14.80 1.66 12.26
Difference 0.49 0.64 0.45 -0.34 -0.41 -0.25 -0.14 -1.03 -0.51 -1.57 0.44 0.36
Police Retirement - Gross 3.22 -0.55 2.31 9.45 8.90 10.52 6.39 8.61 18.00 13.78 2.65 13.29
All Public Plans > $3B Total Fund Median 2.23 -2.48 0.17 6.78 6.91 9.75 5.88 6.76 15.03 13.34 0.96 12.82
Rank 13 6 8 1 1 9 7 9 10 36 27 43
Montana Board of Investments
Retirement PlansComparative Performance
As of December 31, 2015
Net performance shown is net of all manager fees and expenses (Net-All). All Public Plans > $3B Total Fund Median is reported gross of fees.Benchmark returns reflect unmanaged indices which are not impacted by management fees.
Page 1

Montana Board of Investments
Retirement PlansComparative Performance
As of December 31, 2015
QTD FYTD1
Year3
Years5
Years7
Years10
Years2014 2013 2012 2011 2010
Firefighters' Retirement - Net 3.12 -0.74 1.87 8.93 8.36 9.95 5.92 8.07 17.41 13.22 2.10 12.61
Firefighters' Benchmark 2.63 -1.38 1.41 9.27 8.77 10.20 6.06 9.10 17.92 14.80 1.66 12.24
Difference 0.49 0.64 0.46 -0.34 -0.41 -0.25 -0.14 -1.03 -0.51 -1.58 0.44 0.37
Firefighters' Retirement - Gross 3.22 -0.55 2.32 9.45 8.90 10.52 6.42 8.61 17.99 13.81 2.64 13.27
All Public Plans > $3B Total Fund Median 2.23 -2.48 0.17 6.78 6.91 9.75 5.88 6.76 15.03 13.34 0.96 12.82
Rank 13 6 8 1 1 9 7 9 10 34 27 43
Sheriffs' Retirement - Net 3.12 -0.74 1.86 8.90 8.35 9.94 5.92 8.05 17.35 13.19 2.12 12.68
Sherriffs' Benchmark 2.63 -1.38 1.40 9.25 8.77 10.21 6.09 9.07 17.91 14.84 1.65 12.33
Difference 0.49 0.64 0.46 -0.35 -0.42 -0.27 -0.17 -1.02 -0.56 -1.65 0.47 0.35
Sheriffs' Retirement - Gross 3.22 -0.55 2.32 9.43 8.89 10.51 6.42 8.59 17.93 13.79 2.66 13.34
All Public Plans > $3B Total Fund Median 2.23 -2.48 0.17 6.78 6.91 9.75 5.88 6.76 15.03 13.34 0.96 12.82
Rank 13 6 8 1 1 10 7 9 10 36 27 42
Highway Patrol Retirement - Net 3.12 -0.74 1.87 8.92 8.37 9.99 5.94 8.08 17.38 13.24 2.12 12.81
Highway Patrol Benchmark 2.63 -1.38 1.41 9.28 8.79 10.26 6.10 9.10 17.94 14.88 1.65 12.44
Difference 0.49 0.64 0.46 -0.36 -0.42 -0.27 -0.16 -1.02 -0.56 -1.64 0.47 0.37
Highway Patrol Retirement - Gross 3.23 -0.54 2.32 9.45 8.91 10.57 6.44 8.62 17.96 13.84 2.66 13.47
All Public Plans > $3B Total Fund Median 2.23 -2.48 0.17 6.78 6.91 9.75 5.88 6.76 15.03 13.34 0.96 12.82
Rank 13 6 8 1 1 8 6 9 10 34 27 41
Net performance shown is net of all manager fees and expenses (Net-All). All Public Plans > $3B Total Fund Median is reported gross of fees.Benchmark returns reflect unmanaged indices which are not impacted by management fees.
Page 2
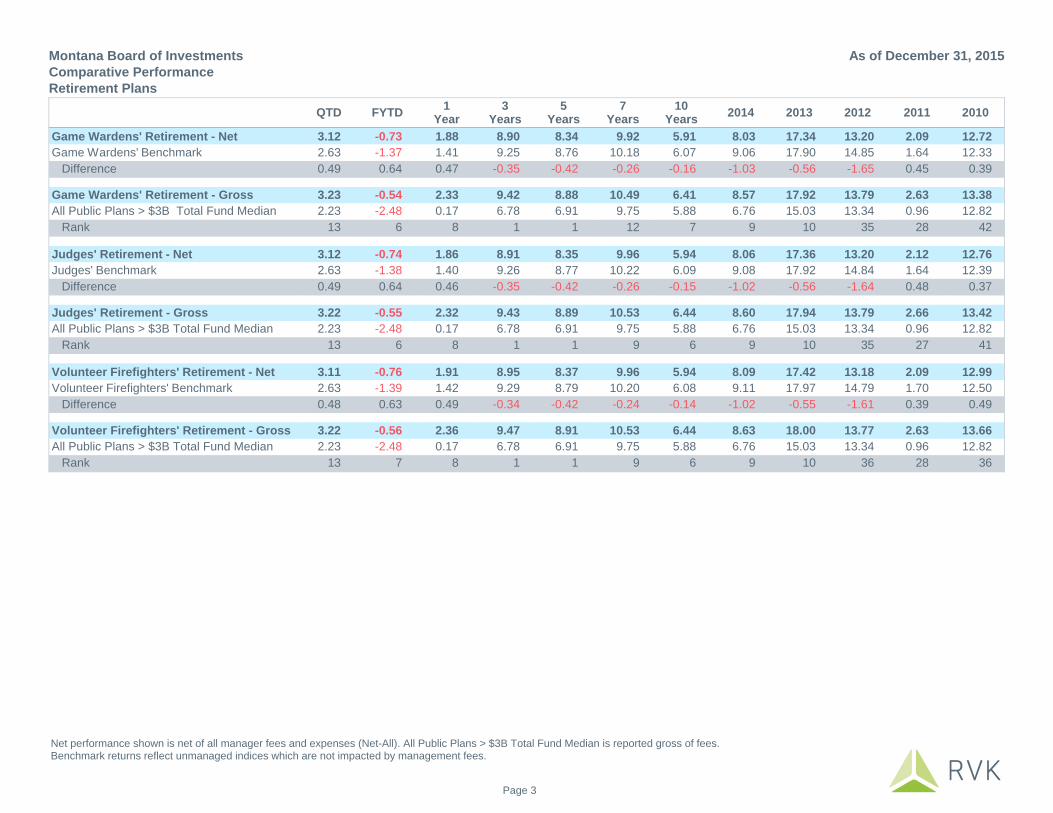
Montana Board of Investments
Retirement PlansComparative Performance
As of December 31, 2015
QTD FYTD1
Year3
Years5
Years7
Years10
Years2014 2013 2012 2011 2010
Game Wardens' Retirement - Net 3.12 -0.73 1.88 8.90 8.34 9.92 5.91 8.03 17.34 13.20 2.09 12.72
Game Wardens' Benchmark 2.63 -1.37 1.41 9.25 8.76 10.18 6.07 9.06 17.90 14.85 1.64 12.33
Difference 0.49 0.64 0.47 -0.35 -0.42 -0.26 -0.16 -1.03 -0.56 -1.65 0.45 0.39
Game Wardens' Retirement - Gross 3.23 -0.54 2.33 9.42 8.88 10.49 6.41 8.57 17.92 13.79 2.63 13.38
All Public Plans > $3B Total Fund Median 2.23 -2.48 0.17 6.78 6.91 9.75 5.88 6.76 15.03 13.34 0.96 12.82
Rank 13 6 8 1 1 12 7 9 10 35 28 42
Judges' Retirement - Net 3.12 -0.74 1.86 8.91 8.35 9.96 5.94 8.06 17.36 13.20 2.12 12.76
Judges' Benchmark 2.63 -1.38 1.40 9.26 8.77 10.22 6.09 9.08 17.92 14.84 1.64 12.39
Difference 0.49 0.64 0.46 -0.35 -0.42 -0.26 -0.15 -1.02 -0.56 -1.64 0.48 0.37
Judges' Retirement - Gross 3.22 -0.55 2.32 9.43 8.89 10.53 6.44 8.60 17.94 13.79 2.66 13.42
All Public Plans > $3B Total Fund Median 2.23 -2.48 0.17 6.78 6.91 9.75 5.88 6.76 15.03 13.34 0.96 12.82
Rank 13 6 8 1 1 9 6 9 10 35 27 41
Volunteer Firefighters' Retirement - Net 3.11 -0.76 1.91 8.95 8.37 9.96 5.94 8.09 17.42 13.18 2.09 12.99
Volunteer Firefighters' Benchmark 2.63 -1.39 1.42 9.29 8.79 10.20 6.08 9.11 17.97 14.79 1.70 12.50
Difference 0.48 0.63 0.49 -0.34 -0.42 -0.24 -0.14 -1.02 -0.55 -1.61 0.39 0.49
Volunteer Firefighters' Retirement - Gross 3.22 -0.56 2.36 9.47 8.91 10.53 6.44 8.63 18.00 13.77 2.63 13.66
All Public Plans > $3B Total Fund Median 2.23 -2.48 0.17 6.78 6.91 9.75 5.88 6.76 15.03 13.34 0.96 12.82
Rank 13 7 8 1 1 9 6 9 10 36 28 36
Net performance shown is net of all manager fees and expenses (Net-All). All Public Plans > $3B Total Fund Median is reported gross of fees.Benchmark returns reflect unmanaged indices which are not impacted by management fees.
Page 3

Domestic Equity International Equity Domestic Fixed Income Real Estate Private Equity Cash Equivalent Total Fund
($) % ($) % ($) % ($) % ($) % ($) % ($) %
Public Employees' Retirement 1,957,574,949 39.59 783,762,137 15.85 1,109,904,176 22.44 473,940,147 9.58 561,696,129 11.36 58,209,690 1.18 4,945,087,228 50.07
Teachers' Retirement 1,422,793,489 39.63 569,625,429 15.87 806,698,019 22.47 344,482,298 9.60 408,242,120 11.37 37,983,235 1.06 3,589,824,589 36.34
Police Retirement 129,313,232 39.66 51,772,096 15.88 73,317,861 22.48 31,307,038 9.60 37,133,614 11.39 3,234,011 0.99 326,077,852 3.30
Firefighters' Retirement 131,684,295 39.57 52,722,061 15.84 74,662,191 22.44 31,882,550 9.58 37,816,008 11.36 4,005,068 1.20 332,772,173 3.37
Sheriffs' Retirement 115,034,681 39.45 46,057,913 15.80 65,222,163 22.37 27,849,671 9.55 33,013,484 11.32 4,382,367 1.50 291,560,279 2.95
Highway Patrol Retirement 50,053,502 39.73 20,040,178 15.90 28,379,368 22.52 12,118,301 9.62 14,361,050 11.40 1,047,471 0.83 125,999,870 1.28
Game Wardens' Retirement 58,496,621 39.48 23,421,514 15.81 33,166,158 22.39 14,162,314 9.56 16,792,999 11.33 2,116,198 1.43 148,155,802 1.50
Judges' Retirement 33,790,277 39.56 13,528,797 15.84 19,158,335 22.43 8,180,243 9.58 9,696,036 11.35 1,056,890 1.24 85,410,578 0.86
Volunteer Firefighters' Retirement 12,826,497 39.75 5,135,180 15.91 7,272,480 22.54 3,105,303 9.62 3,682,297 11.41 247,540 0.77 32,269,298 0.33
Retirement Plans Total Fund Composite 3,911,567,544 39.60 1,566,065,305 15.86 2,217,780,751 22.45 947,027,863 9.59 1,122,433,737 11.36 112,282,470 1.14 9,877,157,670 100.00
December 31, 2015 : $9,877,157,670 SegmentsMarket Value
($)Allocation
(%)
Domestic Equity 3,911,567,544 39.60
International Equity 1,566,065,305 15.86
Domestic Fixed Income 2,217,780,751 22.45
Real Estate 947,027,863 9.59
Private Equity 1,122,433,737 11.36
Cash Equivalent 112,282,470 1.14
Montana Board of InvestmentsAsset Allocation by SegmentRetirement Plans
As of December 31, 2015
Allocations shown may not sum up to 100% exactly due to rounding. Retirement Plan market values may differ from State Street due to univested amounts not included in segment totals.
Page 4

December 31, 2015 : $4,945,087,228
SegmentsMarket Value
($)Allocation
(%)
Domestic Equity 1,957,574,949 39.59
International Equity 783,762,137 15.85
Domestic Fixed Income 1,109,904,176 22.44
Real Estate 473,940,147 9.58
Private Equity 561,696,129 11.36
Cash Equivalent 58,209,690 1.18
Montana Board of InvestmentsPublic Employees' RetirementAsset Allocation by Segment
As of December 31, 2015
Allocations shown may not sum up to 100% exactly due to rounding.
Page 5

December 31, 2015 : $3,589,824,589
SegmentsMarket Value
($)Allocation
(%)
Domestic Equity 1,422,793,489 39.63
International Equity 569,625,429 15.87
Domestic Fixed Income 806,698,019 22.47
Real Estate 344,482,298 9.60
Private Equity 408,242,120 11.37
Cash Equivalent 37,983,235 1.06
Montana Board of InvestmentsTeachers' RetirementAsset Allocation by Segment
As of December 31, 2015
Allocations shown may not sum up to 100% exactly due to rounding.
Page 6

December 31, 2015 : $326,077,852
SegmentsMarket Value
($)Allocation
(%)
Domestic Equity 129,313,232 39.66
International Equity 51,772,096 15.88
Domestic Fixed Income 73,317,861 22.48
Real Estate 31,307,038 9.60
Private Equity 37,133,614 11.39
Cash Equivalent 3,234,011 0.99
Montana Board of InvestmentsPolice RetirementAsset Allocation by Segment
As of December 31, 2015
Allocations shown may not sum up to 100% exactly due to rounding.
Page 7

December 31, 2015 : $332,772,173
SegmentsMarket Value
($)Allocation
(%)
Domestic Equity 131,684,295 39.57
International Equity 52,722,061 15.84
Domestic Fixed Income 74,662,191 22.44
Real Estate 31,882,550 9.58
Private Equity 37,816,008 11.36
Cash Equivalent 4,005,068 1.20
Montana Board of InvestmentsFirefighters' RetirementAsset Allocation by Segment
As of December 31, 2015
Allocations shown may not sum up to 100% exactly due to rounding.
Page 8
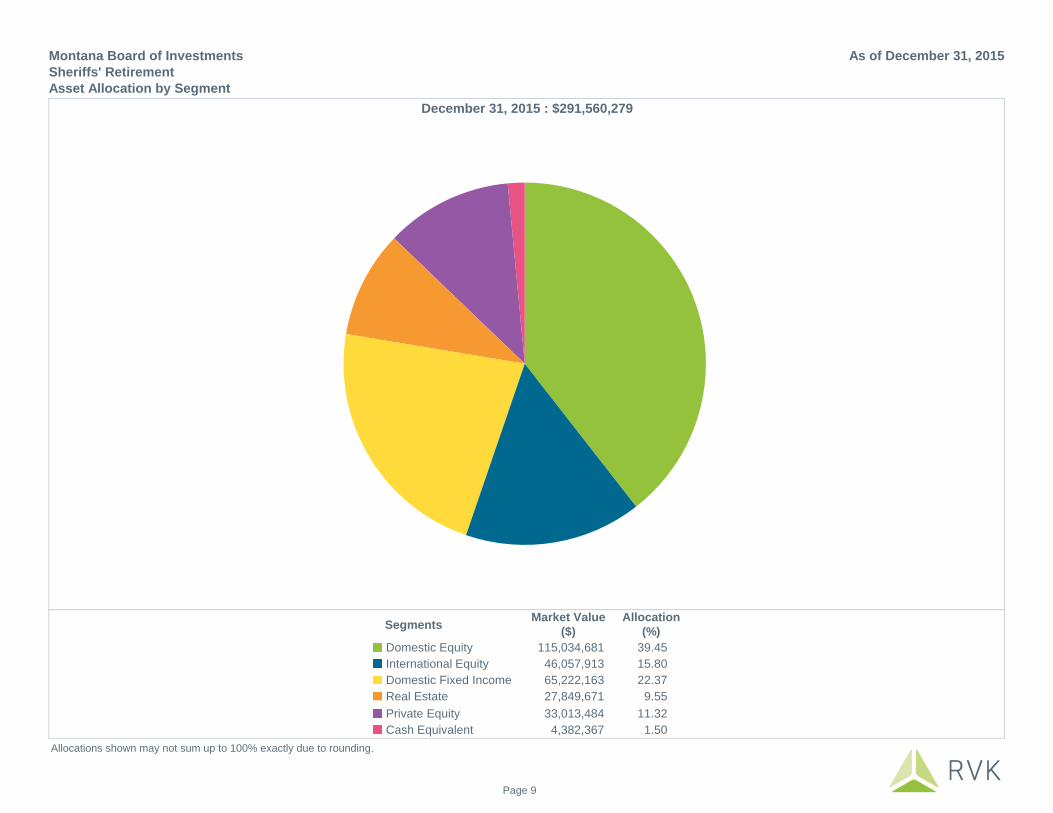
December 31, 2015 : $291,560,279
SegmentsMarket Value
($)Allocation
(%)
Domestic Equity 115,034,681 39.45
International Equity 46,057,913 15.80
Domestic Fixed Income 65,222,163 22.37
Real Estate 27,849,671 9.55
Private Equity 33,013,484 11.32
Cash Equivalent 4,382,367 1.50
Montana Board of InvestmentsSheriffs' RetirementAsset Allocation by Segment
As of December 31, 2015
Allocations shown may not sum up to 100% exactly due to rounding.
Page 9

December 31, 2015 : $125,999,870
SegmentsMarket Value
($)Allocation
(%)
Domestic Equity 50,053,502 39.73
International Equity 20,040,178 15.90
Domestic Fixed Income 28,379,368 22.52
Real Estate 12,118,301 9.62
Private Equity 14,361,050 11.40
Cash Equivalent 1,047,471 0.83
Montana Board of InvestmentsHighway Patrol RetirementAsset Allocation by Segment
As of December 31, 2015
Allocations shown may not sum up to 100% exactly due to rounding.
Page 10

December 31, 2015 : $148,155,802
SegmentsMarket Value
($)Allocation
(%)
Domestic Equity 58,496,621 39.48
International Equity 23,421,514 15.81
Domestic Fixed Income 33,166,158 22.39
Real Estate 14,162,314 9.56
Private Equity 16,792,999 11.33
Cash Equivalent 2,116,198 1.43
Montana Board of InvestmentsGame Wardens' RetirementAsset Allocation by Segment
As of December 31, 2015
Allocations shown may not sum up to 100% exactly due to rounding.
Page 11

December 31, 2015 : $85,410,578
SegmentsMarket Value
($)Allocation
(%)
Domestic Equity 33,790,277 39.56
International Equity 13,528,797 15.84
Domestic Fixed Income 19,158,335 22.43
Real Estate 8,180,243 9.58
Private Equity 9,696,036 11.35
Cash Equivalent 1,056,890 1.24
Montana Board of InvestmentsJudges' RetirementAsset Allocation by Segment
As of December 31, 2015
Allocations shown may not sum up to 100% exactly due to rounding.
Page 12

December 31, 2015 : $32,269,298
SegmentsMarket Value
($)Allocation
(%)
Domestic Equity 12,826,497 39.75
International Equity 5,135,180 15.91
Domestic Fixed Income 7,272,480 22.54
Real Estate 3,105,303 9.62
Private Equity 3,682,297 11.41
Cash Equivalent 247,540 0.77
Montana Board of InvestmentsVolunteer Firefighters' RetirementAsset Allocation by Segment
As of December 31, 2015
Allocations shown may not sum up to 100% exactly due to rounding.
Page 13

QTD FYTD1
Year3
Years5
Years7
Years10
Years2014 2013 2012 2011 2010
Montana Domestic Equity Pool 6.34 -1.20 0.86 14.97 12.19 15.05 7.01 12.28 34.19 16.44 0.44 16.37
S&P 1500 Comp Index 6.59 -0.54 1.01 14.90 12.39 14.97 7.41 13.08 32.80 16.17 1.75 16.38
Difference -0.25 -0.66 -0.15 0.07 -0.20 0.08 -0.40 -0.80 1.39 0.27 -1.31 -0.01
Montana International Equity Pool 3.79 -8.25 -3.57 2.52 1.50 7.32 2.40 -4.00 16.39 17.11 -14.63 11.57
International Custom Benchmark 3.40 -8.89 -4.71 1.87 1.22 7.91 3.14 -4.03 15.62 16.96 -14.07 12.16
Difference 0.39 0.64 1.14 0.65 0.28 -0.59 -0.74 0.03 0.77 0.15 -0.56 -0.59
Retirement Funds Bond Pool -0.94 0.11 0.48 1.86 4.08 6.07 5.28 6.19 -0.95 7.31 7.69 10.32
Barclays US Agg Bond Index -0.57 0.65 0.55 1.44 3.25 4.09 4.52 5.97 -2.02 4.21 7.84 6.54
Difference -0.37 -0.54 -0.07 0.42 0.83 1.98 0.76 0.22 1.07 3.10 -0.15 3.78
Trust Funds Investment Pool -0.51 0.97 1.83 2.80 4.69 6.03 5.59 6.96 -0.25 6.99 8.20 8.50
Barclays US Agg Bond Index -0.57 0.65 0.55 1.44 3.25 4.09 4.52 5.97 -2.02 4.21 7.84 6.54
Difference 0.06 0.32 1.28 1.36 1.44 1.94 1.07 0.99 1.77 2.78 0.36 1.96
Real Estate Pool* 3.03 6.94 14.27 12.17 12.11 2.37 N/A 12.13 10.16 9.90 14.19 0.25
NCREIF ODCE Index (Net) (Qtr Lag) 3.43 7.14 13.86 12.39 12.94 3.27 5.72 11.36 11.97 10.47 17.18 6.01
Difference -0.40 -0.20 0.41 -0.22 -0.83 -0.90 N/A 0.77 -1.81 -0.57 -2.99 -5.76
Short Term Investment Pool 0.08 0.14 0.22 0.17 0.22 0.30 1.52 0.10 0.19 0.30 0.28 0.30
1 Month LIBOR Index 0.07 0.12 0.21 0.18 0.20 0.23 1.45 0.16 0.19 0.23 0.24 0.27
Difference 0.01 0.02 0.01 -0.01 0.02 0.07 0.07 -0.06 0.00 0.07 0.04 0.03
iMoneynet Money Fund (Gross) Median 0.08 0.14 0.25 0.22 0.24 0.32 1.57 0.17 0.22 0.30 0.27 0.34
Difference 0.00 0.00 -0.03 -0.05 -0.02 -0.02 -0.05 -0.07 -0.03 0.00 0.01 -0.04
Montana Board of Investments
Investment PoolsComparative Performance
As of December 31, 2015
Performance shown is net of all manager fees and expenses (Net-All). The NCREIF ODCE Index (Net) performance is lagged by one quarter.*Performance is based on prior quarter's fair market value adjusted for cash flows during the most recent quarterly period.Benchmark returns reflect unmanaged indices which are not impacted by management fees.
Page 14
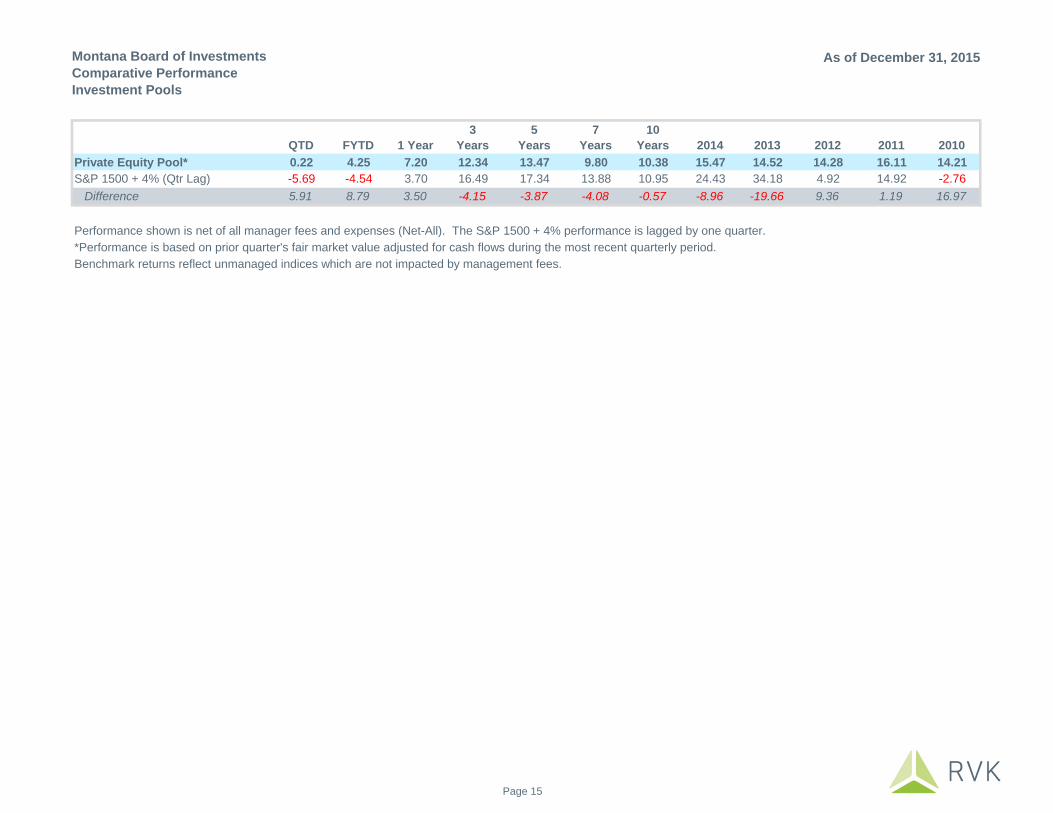
Montana Board of InvestmentsComparative PerformanceInvestment Pools
As of December 31, 2015
QTD FYTD 1 Year3
Years5
Years7
Years10
Years 2014 2013 2012 2011 2010Private Equity Pool* 0.22 4.25 7.20 12.34 13.47 9.80 10.38 15.47 14.52 14.28 16.11 14.21S&P 1500 + 4% (Qtr Lag) -5.69 -4.54 3.70 16.49 17.34 13.88 10.95 24.43 34.18 4.92 14.92 -2.76 Difference 5.91 8.79 3.50 -4.15 -3.87 -4.08 -0.57 -8.96 -19.66 9.36 1.19 16.97
Performance shown is net of all manager fees and expenses (Net-All). The S&P 1500 + 4% performance is lagged by one quarter.*Performance is based on prior quarter's fair market value adjusted for cash flows during the most recent quarterly period. Benchmark returns reflect unmanaged indices which are not impacted by management fees.
Page 15

QTD FYTD1
Year3
Years5
Years7
Years10
Years2014 2013 2012 2011 2010
Montana Domestic Equity Pool 6.41 -1.07 1.14 15.30 12.54 15.45 7.34 12.59 34.61 16.77 0.85 16.88
All Public Plans-US Equity Segment Median 5.62 -2.30 0.18 14.33 11.69 14.93 7.27 11.41 34.03 16.57 0.52 18.09
Rank 17 22 23 12 13 37 45 18 39 40 42 71
Population 97 97 94 84 74 65 45 67 79 84 90 84
Montana International Equity Pool 3.85 -8.13 -3.35 2.80 1.80 7.69 2.77 -3.77 16.80 17.45 -14.32 12.05
All Public Plans-Intl. Equity Segment Median 4.08 -7.69 -2.48 3.87 3.14 8.67 3.81 -3.00 18.47 18.80 -12.65 12.33
Rank 56 63 69 76 83 81 90 77 72 80 84 59
Population 92 92 88 79 69 59 42 63 74 73 78 73
Retirement Funds Bond Pool -0.92 0.16 0.59 1.98 4.20 6.19 5.37 6.30 -0.83 7.44 7.82 10.44
All Public Plans-US Fixed Income Segment Median -0.53 -0.31 0.30 1.45 3.97 5.50 4.84 5.74 -1.40 7.23 7.76 8.05
Rank 85 33 36 33 42 32 21 33 39 48 48 18
Population 86 86 82 74 66 57 40 64 76 83 87 80
Trust Funds Investment Pool -0.50 1.00 1.89 2.90 4.79 6.11 5.66 7.08 -0.14 7.11 8.30 8.58
All Public Plans-US Fixed Income Segment Median -0.53 -0.31 0.30 1.45 3.97 5.50 4.84 5.74 -1.40 7.23 7.76 8.05
Rank 48 7 4 14 20 33 17 22 25 52 31 45
Population 86 86 82 74 66 57 40 64 76 83 87 80
Real Estate Pool 3.20 7.26 15.68 13.63 13.65 3.84 N/A 13.51 11.73 11.44 15.96 2.70
All Public Plans-Real Estate Segment Median 2.76 6.30 13.42 13.78 13.74 5.95 6.16 14.67 13.28 12.17 14.05 11.04
Rank 41 26 7 52 51 85 N/A 61 71 65 24 86
Population 43 42 35 27 23 18 11 26 27 20 15 19
Montana Board of Investments
Investment PoolsComparative Performance
As of December 31, 2015
Performance shown is gross of fees.
Page 16

QTD FYTD1
Year3
Years5
Years7
Years10
Years2014 2013 2012 2011 2010
Domestic Large Cap Equity - Net 7.18 0.26 1.76 15.53 12.48 15.05 N/A 13.82 33.14 16.14 0.54 15.67
S&P 500 Index (Cap Wtd) 7.04 0.15 1.38 15.13 12.57 14.82 7.31 13.69 32.39 16.00 2.11 15.06
Difference 0.14 0.11 0.38 0.40 -0.09 0.23 N/A 0.13 0.75 0.14 -1.57 0.61
Domestic Large Cap Equity - Gross 7.22 0.33 1.91 15.70 12.71 15.32 N/A 13.99 33.34 16.39 0.87 16.07
IM U.S. Large Cap Equity (SA+CF) Median 6.15 -1.06 0.96 15.15 12.44 15.02 7.71 12.89 33.55 15.87 1.18 15.11
Rank 24 31 40 40 42 42 N/A 32 54 43 55 38
Domestic Large Cap Active - Net 7.51 0.43 2.40 16.35 12.79 15.36 N/A 14.01 34.90 16.03 -0.10 15.70
S&P 500 Index (Cap Wtd) 7.04 0.15 1.38 15.13 12.57 14.82 7.31 13.69 32.39 16.00 2.11 15.06
Difference 0.47 0.28 1.02 1.22 0.22 0.54 N/A 0.32 2.51 0.03 -2.21 0.64
Domestic Large Cap Active - Gross 7.63 0.67 2.88 16.90 13.32 15.89 N/A 14.56 35.55 16.56 0.35 16.23
IM U.S. Large Cap Equity (SA+CF) Median 6.15 -1.06 0.96 15.15 12.44 15.02 7.71 12.89 33.55 15.87 1.18 15.11
Rank 17 28 33 23 30 31 N/A 25 34 39 59 36
Domestic Mid Cap Equity - Net 2.44 -6.74 -3.31 12.45 10.86 15.41 7.23 6.45 38.18 16.27 1.28 18.15
Russell Mid Cap Index 3.62 -4.68 -2.44 14.18 11.44 17.16 8.00 13.22 34.76 17.28 -1.55 25.47
Difference -1.18 -2.06 -0.87 -1.73 -0.58 -1.75 -0.77 -6.77 3.42 -1.01 2.83 -7.32
Domestic Mid Cap Equity - Gross 2.59 -6.46 -2.74 13.11 11.47 16.06 7.78 7.07 38.95 16.83 1.79 18.85
IM U.S. Mid Cap Equity (SA+CF) Median 3.25 -5.64 -1.06 14.07 11.39 16.77 8.68 9.74 36.35 16.41 -1.10 24.80
Rank 67 68 70 64 47 72 78 73 33 47 25 92
Domestic Small Cap Equity - Net 3.10 -8.00 -1.61 13.42 10.49 15.30 7.27 5.44 40.65 15.76 -2.50 24.56
Russell 2000 Index 3.59 -8.75 -4.41 11.65 9.18 14.01 6.80 4.89 38.82 16.34 -4.18 26.86
Difference -0.49 0.75 2.80 1.77 1.31 1.29 0.47 0.55 1.83 -0.58 1.68 -2.30
Domestic Small Cap Equity - Gross 3.27 -7.68 -0.93 14.18 11.25 16.07 7.95 6.16 41.54 16.40 -1.64 25.33
IM U.S. Small Cap Equity (SA+CF) Median 3.07 -7.39 -2.46 13.42 10.79 16.15 8.05 5.41 41.29 16.51 -1.85 27.95
Rank 46 55 34 37 42 53 56 44 49 52 48 71
Montana Board of Investments
Equity CompositesComparative Performance
As of December 31, 2015
Net performance shown is net of all manager fees and expenses (Net-All). Gross returns are compared to median performance of similar managers. A peer group of similar managers may not exist for all composites.
Page 17

Montana Board of Investments
Equity CompositesComparative Performance
As of December 31, 2015
QTD FYTD1
Year3
Years5
Years7
Years10
Years2014 2013 2012 2011 2010
International Large Cap Passive - Net 4.24 -8.54 -4.71 1.80 1.29 N/A N/A -3.70 14.95 16.92 -13.55 10.84
MSCI ACW Ex US Index (Net) 3.24 -9.32 -5.66 1.50 1.06 7.48 2.92 -3.87 15.29 16.83 -13.71 11.15
Difference 1.00 0.78 0.95 0.30 0.23 N/A N/A 0.17 -0.34 0.09 0.16 -0.31
International Large Cap Passive - Gross 4.26 -8.50 -4.63 1.88 1.38 N/A N/A -3.62 15.05 17.02 -13.48 10.92
International Equity Active - Net 5.23 -6.11 -0.31 4.39 2.55 8.22 2.14 -4.30 19.23 17.87 -15.39 11.99
MSCI ACW Ex US Index (Net) 3.24 -9.32 -5.66 1.50 1.06 7.48 2.92 -3.87 15.29 16.83 -13.71 11.15
Difference 1.99 3.21 5.35 2.89 1.49 0.74 -0.78 -0.43 3.94 1.04 -1.68 0.84
International Equity Active - Gross 5.35 -5.89 0.12 4.84 3.00 8.72 2.60 -3.90 19.75 18.36 -14.98 12.59
IM International Large Cap Core Equity (SA+CF) Median 4.73 -5.49 0.34 6.09 4.70 9.31 4.30 -3.73 23.26 19.47 -12.25 11.24
Rank 30 56 55 65 77 63 100 51 75 67 82 33
International Value - Net 3.62 -8.11 -5.94 2.77 1.24 7.48 N/A -1.49 17.15 15.88 -15.46 9.91
MSCI ACW Ex US Val Index (Net) 1.43 -12.36 -10.06 -0.61 -0.06 6.47 2.11 -5.10 15.04 16.97 -13.20 7.84
Difference 2.19 4.25 4.12 3.38 1.30 1.01 N/A 3.61 2.11 -1.09 -2.26 2.07
International Value - Gross 3.75 -7.87 -5.46 3.33 1.80 8.11 N/A -0.94 17.82 16.55 -14.96 10.60
IM International Large Cap Value Equity (SA+CF) Median 3.92 -7.04 -1.66 5.19 3.92 8.49 4.14 -4.04 23.24 17.91 -10.80 10.81
Rank 53 60 86 76 83 55 N/A 16 78 65 77 53
International Growth - Net 7.00 -5.25 1.69 4.20 2.63 8.75 N/A -6.15 18.55 18.37 -14.99 10.86
MSCI ACW Ex US Grth Index (Net) 5.00 -6.31 -1.25 3.55 2.13 8.44 3.68 -2.65 15.49 16.67 -14.21 14.45
Difference 2.00 1.06 2.94 0.65 0.50 0.31 N/A -3.50 3.06 1.70 -0.78 -3.59
International Growth - Gross 7.15 -4.96 2.21 4.69 3.11 9.31 N/A -5.72 19.09 18.89 -14.56 11.56
IM International Large Cap Growth Equity (SA+CF) Median 5.55 -4.54 2.12 6.14 4.81 10.19 5.13 -3.38 21.08 19.68 -11.39 13.17
Rank 13 62 49 79 87 68 N/A 78 71 59 79 62
International Small Cap - Net 4.75 -3.76 5.16 7.83 4.71 11.50 N/A -4.87 25.30 18.64 -15.36 24.34
MSCI ACWI Ex US Sm Cap Index IMI (Net) 5.28 -5.27 2.60 5.64 2.63 12.79 4.97 -4.03 19.73 18.52 -18.50 25.21
Difference -0.53 1.51 2.56 2.19 2.08 -1.29 N/A -0.84 5.57 0.12 3.14 -0.87
International Small Cap - Gross N/A N/A N/A N/A N/A N/A N/A N/A N/A N/A N/A N/A
IM International Small Cap Equity (SA+CF) Median 5.99 -1.03 10.46 11.56 8.05 15.29 6.90 -3.14 31.05 23.44 -13.67 23.75
Rank N/A N/A N/A N/A N/A N/A N/A N/A N/A N/A N/A N/A
Gross of fees performance is not available (N/A) for the International Small Cap composite which currently consists of DFA Intl Sm Co;I (DFISX), BlackRock ACWI Ex-US Small Cap(CF), Templeton Investment Counsel (SA), and American Century Investment Mgmt (SA).
Net performance shown is net of all manager fees and expenses (Net-All). Gross returns are compared to median performance of similar managers. A peer group of similar managers may not exist for all composites.
Page 18

QTD FYTD1
Year3
Years5
Years7
Years10
Years2014 2013 2012 2011 2010
Domestic Large Cap Passive - Net 6.38 -0.45 0.83 14.94 12.49 14.83 7.27 13.73 32.41 16.06 2.20 15.22
S&P 500 Index (Cap Wtd) 7.04 0.15 1.38 15.13 12.57 14.82 7.31 13.69 32.39 16.00 2.11 15.06
Difference -0.66 -0.60 -0.55 -0.19 -0.08 0.01 -0.04 0.04 0.02 0.06 0.09 0.16
Domestic Large Cap Passive - Gross 6.38 -0.45 0.84 14.95 12.50 14.83 7.34 13.74 32.42 16.07 2.21 15.23
IM U.S. Large Cap Index Equity (SA+CF) Median 6.52 -0.74 0.95 15.02 12.45 14.90 7.40 13.29 32.54 16.20 1.56 15.58
Rank 61 48 56 57 41 60 64 18 64 56 22 60
Domestic Large Cap Enhanced - Net 7.31 1.14 3.18 15.78 13.08 16.03 N/A 13.19 32.89 16.87 1.94 17.19
S&P 500 Index (Cap Wtd) 7.04 0.15 1.38 15.13 12.57 14.82 7.31 13.69 32.39 16.00 2.11 15.06
Difference 0.27 0.99 1.80 0.65 0.51 1.21 N/A -0.50 0.50 0.87 -0.17 2.13
Domestic Large Cap Enhanced - Gross 7.39 1.29 3.50 16.14 13.43 16.38 N/A 13.54 33.31 17.21 2.25 17.55
IM U.S. Large Cap Core Equity (SA+CF) Median 5.94 -1.05 1.39 15.26 12.63 14.94 7.75 13.41 33.21 15.66 1.98 14.80
Rank 15 19 23 33 29 16 N/A 48 49 31 47 18
Domestic Large Cap 130/30 - Net 7.70 -0.27 1.61 16.91 13.21 15.54 N/A 14.84 36.94 18.42 -1.74 13.68
S&P 500 Index (Cap Wtd) 7.04 0.15 1.38 15.13 12.57 14.82 7.31 13.69 32.39 16.00 2.11 15.06
Difference 0.66 -0.42 0.23 1.78 0.64 0.72 N/A 1.15 4.55 2.42 -3.85 -1.38
Domestic Large Cap 130/30 - Gross 7.87 0.04 2.26 17.67 13.95 16.30 N/A 15.59 37.83 19.18 -1.05 14.44
IM U.S. Large Cap Core Equity (SA+CF) Median 5.94 -1.05 1.39 15.26 12.63 14.94 7.75 13.41 33.21 15.66 1.98 14.80
Rank 8 36 37 15 19 17 N/A 22 13 14 78 57
Montana Board of Investments
Equity Sub CompositesComparative Performance
As of December 31, 2015
Net performance shown is net of all manager fees and expenses (Net-All). Gross returns are compared to median performance of similar managers. A peer group of similar managers may not exist for all composites.
Page 19
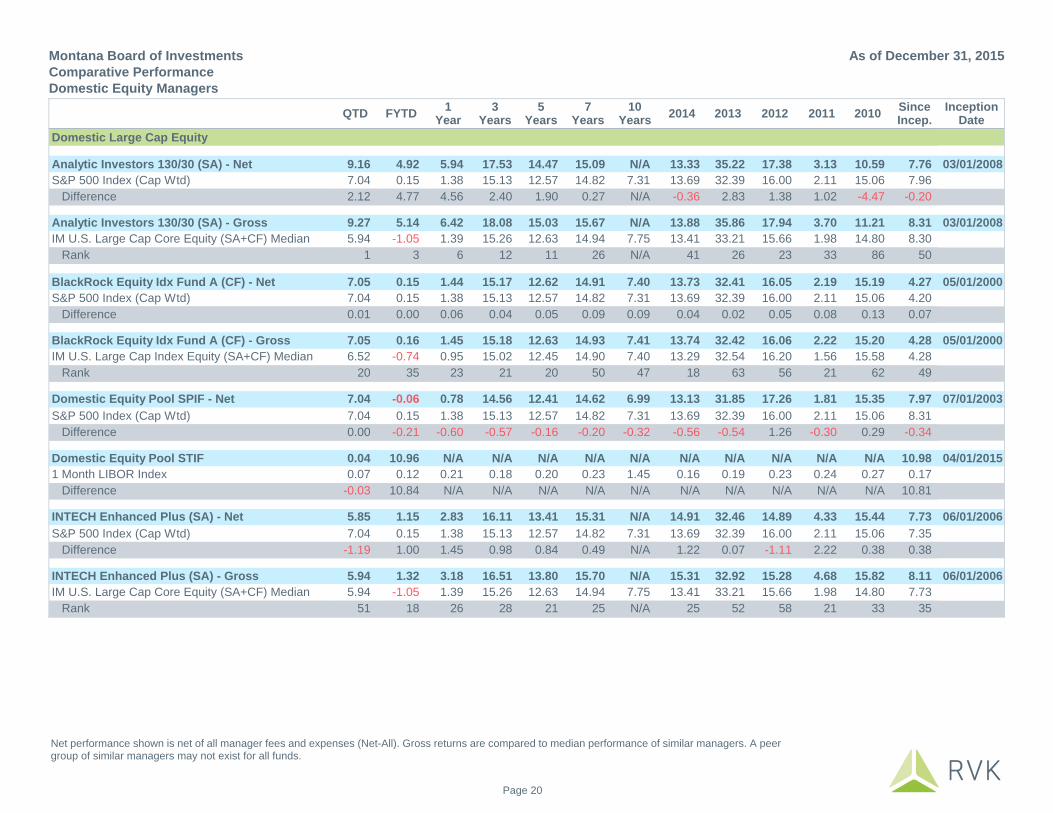
QTD FYTD1
Year3
Years5
Years7
Years10
Years2014 2013 2012 2011 2010
SinceIncep.
InceptionDate
Domestic Large Cap Equity
Analytic Investors 130/30 (SA) - Net 9.16 4.92 5.94 17.53 14.47 15.09 N/A 13.33 35.22 17.38 3.13 10.59 7.76 03/01/2008
S&P 500 Index (Cap Wtd) 7.04 0.15 1.38 15.13 12.57 14.82 7.31 13.69 32.39 16.00 2.11 15.06 7.96
Difference 2.12 4.77 4.56 2.40 1.90 0.27 N/A -0.36 2.83 1.38 1.02 -4.47 -0.20
Analytic Investors 130/30 (SA) - Gross 9.27 5.14 6.42 18.08 15.03 15.67 N/A 13.88 35.86 17.94 3.70 11.21 8.31 03/01/2008
IM U.S. Large Cap Core Equity (SA+CF) Median 5.94 -1.05 1.39 15.26 12.63 14.94 7.75 13.41 33.21 15.66 1.98 14.80 8.30
Rank 1 3 6 12 11 26 N/A 41 26 23 33 86 50
BlackRock Equity Idx Fund A (CF) - Net 7.05 0.15 1.44 15.17 12.62 14.91 7.40 13.73 32.41 16.05 2.19 15.19 4.27 05/01/2000
S&P 500 Index (Cap Wtd) 7.04 0.15 1.38 15.13 12.57 14.82 7.31 13.69 32.39 16.00 2.11 15.06 4.20
Difference 0.01 0.00 0.06 0.04 0.05 0.09 0.09 0.04 0.02 0.05 0.08 0.13 0.07
BlackRock Equity Idx Fund A (CF) - Gross 7.05 0.16 1.45 15.18 12.63 14.93 7.41 13.74 32.42 16.06 2.22 15.20 4.28 05/01/2000
IM U.S. Large Cap Index Equity (SA+CF) Median 6.52 -0.74 0.95 15.02 12.45 14.90 7.40 13.29 32.54 16.20 1.56 15.58 4.28
Rank 20 35 23 21 20 50 47 18 63 56 21 62 49
Domestic Equity Pool SPIF - Net 7.04 -0.06 0.78 14.56 12.41 14.62 6.99 13.13 31.85 17.26 1.81 15.35 7.97 07/01/2003
S&P 500 Index (Cap Wtd) 7.04 0.15 1.38 15.13 12.57 14.82 7.31 13.69 32.39 16.00 2.11 15.06 8.31
Difference 0.00 -0.21 -0.60 -0.57 -0.16 -0.20 -0.32 -0.56 -0.54 1.26 -0.30 0.29 -0.34
Domestic Equity Pool STIF 0.04 10.96 N/A N/A N/A N/A N/A N/A N/A N/A N/A N/A 10.98 04/01/2015
1 Month LIBOR Index 0.07 0.12 0.21 0.18 0.20 0.23 1.45 0.16 0.19 0.23 0.24 0.27 0.17
Difference -0.03 10.84 N/A N/A N/A N/A N/A N/A N/A N/A N/A N/A 10.81
INTECH Enhanced Plus (SA) - Net 5.85 1.15 2.83 16.11 13.41 15.31 N/A 14.91 32.46 14.89 4.33 15.44 7.73 06/01/2006
S&P 500 Index (Cap Wtd) 7.04 0.15 1.38 15.13 12.57 14.82 7.31 13.69 32.39 16.00 2.11 15.06 7.35
Difference -1.19 1.00 1.45 0.98 0.84 0.49 N/A 1.22 0.07 -1.11 2.22 0.38 0.38
INTECH Enhanced Plus (SA) - Gross 5.94 1.32 3.18 16.51 13.80 15.70 N/A 15.31 32.92 15.28 4.68 15.82 8.11 06/01/2006
IM U.S. Large Cap Core Equity (SA+CF) Median 5.94 -1.05 1.39 15.26 12.63 14.94 7.75 13.41 33.21 15.66 1.98 14.80 7.73
Rank 51 18 26 28 21 25 N/A 25 52 58 21 33 35
Montana Board of Investments
Domestic Equity ManagersComparative Performance
As of December 31, 2015
Net performance shown is net of all manager fees and expenses (Net-All). Gross returns are compared to median performance of similar managers. A peer group of similar managers may not exist for all funds.
Page 20

Montana Board of Investments
Domestic Equity ManagersComparative Performance
As of December 31, 2015
QTD FYTD1
Year3
Years5
Years7
Years10
Years2014 2013 2012 2011 2010
SinceIncep.
InceptionDate
T. Rowe U.S. Structured Research (SA) - Net 7.86 1.13 3.30 15.71 12.90 15.34 N/A 12.58 33.23 16.42 1.67 13.90 7.91 06/01/2006
S&P 500 Index (Cap Wtd) 7.04 0.15 1.38 15.13 12.57 14.82 7.31 13.69 32.39 16.00 2.11 15.06 7.35
Difference 0.82 0.98 1.92 0.58 0.33 0.52 N/A -1.11 0.84 0.42 -0.44 -1.16 0.56
T. Rowe U.S. Structured Research (SA) - Gross 7.94 1.28 3.61 16.06 13.24 15.70 N/A 12.92 33.63 16.77 1.98 14.25 8.24 06/01/2006
IM U.S. Large Cap Core Equity (SA+CF) Median 5.94 -1.05 1.39 15.26 12.63 14.94 7.75 13.41 33.21 15.66 1.98 14.80 7.73
Rank 8 19 23 34 36 25 N/A 59 45 36 51 58 30
J.P. Morgan 130/30 (SA) - Net 7.15 -2.16 0.01 16.65 12.72 16.24 N/A 15.38 37.55 18.64 -3.38 14.73 9.58 03/01/2008
S&P 500 Index (Cap Wtd) 7.04 0.15 1.38 15.13 12.57 14.82 7.31 13.69 32.39 16.00 2.11 15.06 7.96
Difference 0.11 -2.31 -1.37 1.52 0.15 1.42 N/A 1.69 5.16 2.64 -5.49 -0.33 1.62
J.P. Morgan 130/30 (SA) - Gross 7.33 -1.82 0.72 17.48 13.53 17.07 N/A 16.21 38.53 19.48 -2.65 15.55 10.37 03/01/2008
IM U.S. Large Cap Core Equity (SA+CF) Median 5.94 -1.05 1.39 15.26 12.63 14.94 7.75 13.41 33.21 15.66 1.98 14.80 8.30
Rank 15 65 59 16 27 11 N/A 15 11 12 86 36 7
Domestic Mid Cap Equity
Artisan Partners (SA) - Net 0.02 -10.15 -9.68 8.16 8.68 13.67 N/A 2.12 37.20 12.02 6.93 14.99 6.38 03/01/2007
Russell Mid Cap Val Index 3.12 -5.17 -4.78 13.40 11.25 16.16 7.61 14.75 33.46 18.51 -1.38 24.75 5.98
Difference -3.10 -4.98 -4.90 -5.24 -2.57 -2.49 N/A -12.63 3.74 -6.49 8.31 -9.76 0.40
Artisan Partners (SA) - Gross 0.18 -9.85 -9.09 8.88 9.41 14.45 N/A 2.79 38.11 12.79 7.69 15.82 7.13 03/01/2007
IM U.S. Mid Cap Value Equity (SA+CF) Median 3.03 -6.01 -3.35 13.52 11.34 16.49 8.58 11.90 36.06 17.15 -0.96 22.53 7.26
Rank 93 84 88 97 86 86 N/A 97 40 88 2 94 56
BlackRock Mid Cap Eq Idx A (CF) - Net 2.62 -6.11 -2.17 12.75 10.68 16.39 8.22 9.75 33.51 17.90 -1.72 26.65 8.62 01/01/2005
S&P Mid Cap 400 Index (Cap Wtd) 2.60 -6.11 -2.18 12.75 10.68 16.36 8.18 9.77 33.50 17.88 -1.73 26.64 8.57
Difference 0.02 0.00 0.01 0.00 0.00 0.03 0.04 -0.02 0.01 0.02 0.01 0.01 0.05
BlackRock Mid Cap Eq Idx A (CF) - Gross 2.64 -6.07 -2.09 12.85 10.77 16.47 8.29 9.85 33.62 18.00 -1.65 26.72 8.69 01/01/2005
Net performance shown is net of all manager fees and expenses (Net-All). Gross returns are compared to median performance of similar managers. A peer group of similar managers may not exist for all funds.
Page 21

Montana Board of Investments
Domestic Equity ManagersComparative Performance
As of December 31, 2015
QTD FYTD1
Year3
Years5
Years7
Years10
Years2014 2013 2012 2011 2010
SinceIncep.
InceptionDate
Iridian Asset Management (SA) - Net 6.21 -4.46 -1.62 N/A N/A N/A N/A 12.84 N/A N/A N/A N/A 13.70 05/01/2013
Russell Mid Cap Val Index 3.12 -5.17 -4.78 13.40 11.25 16.16 7.61 14.75 33.46 18.51 -1.38 24.75 9.14
Difference 3.09 0.71 3.16 N/A N/A N/A N/A -1.91 N/A N/A N/A N/A 4.56
Iridian Asset Management (SA) - Gross 6.41 -4.09 -0.87 N/A N/A N/A N/A 13.73 N/A N/A N/A N/A 14.59 05/01/2013
IM U.S. Mid Cap Value Equity (SA+CF) Median 3.03 -6.01 -3.35 13.52 11.34 16.49 8.58 11.90 36.06 17.15 -0.96 22.53 9.83
Rank 1 24 20 N/A N/A N/A N/A 24 N/A N/A N/A N/A 2
Nicholas Investment Partners (SA) - Net 2.27 -7.79 -2.74 N/A N/A N/A N/A 8.01 N/A N/A N/A N/A 10.77 05/01/2013
Russell Mid Cap Grth Index 4.12 -4.20 -0.20 14.88 11.54 18.04 8.16 11.90 35.74 15.81 -1.65 26.38 11.59
Difference -1.85 -3.59 -2.54 N/A N/A N/A N/A -3.89 N/A N/A N/A N/A -0.82
Nicholas Investment Partners (SA) - Gross 2.45 -7.45 -2.03 N/A N/A N/A N/A 8.82 N/A N/A N/A N/A 11.59 05/01/2013
IM U.S. Mid Cap Growth Equity (SA+CF) Median 3.26 -5.39 1.22 14.12 11.25 16.92 8.81 8.42 36.35 15.06 -1.27 26.65 11.54
Rank 70 72 78 N/A N/A N/A N/A 44 N/A N/A N/A N/A 50
TimesSquare Capital Mgmt. (SA) - Net 2.82 -4.61 0.96 13.71 11.57 15.95 N/A 5.69 37.79 19.19 -1.37 18.48 8.25 03/01/2007
Russell Mid Cap Grth Index 4.12 -4.20 -0.20 14.88 11.54 18.04 8.16 11.90 35.74 15.81 -1.65 26.38 7.63
Difference -1.30 -0.41 1.16 -1.17 0.03 -2.09 N/A -6.21 2.05 3.38 0.28 -7.90 0.62
TimesSquare Capital Mgmt. (SA) - Gross 3.00 -4.29 1.65 14.50 12.35 16.77 N/A 6.42 38.75 20.03 -0.64 19.33 9.03 03/01/2007
IM U.S. Mid Cap Growth Equity (SA+CF) Median 3.26 -5.39 1.22 14.12 11.25 16.92 8.81 8.42 36.35 15.06 -1.27 26.65 8.56
Rank 56 36 44 43 26 54 N/A 71 35 15 44 90 32
Net performance shown is net of all manager fees and expenses (Net-All). Gross returns are compared to median performance of similar managers. A peer group of similar managers may not exist for all funds.
Page 22

Montana Board of Investments
Domestic Equity ManagersComparative Performance
As of December 31, 2015
QTD FYTD1
Year3
Years5
Years7
Years10
Years2014 2013 2012 2011 2010
SinceIncep.
InceptionDate
Domestic Small Cap Equity
Alliance Bernstein (SA) - Net 5.39 -10.12 -0.84 12.32 N/A N/A N/A -1.61 45.22 N/A N/A N/A 9.02 04/01/2012
Russell 2000 Grth Index 4.32 -9.31 -1.38 14.28 10.67 16.33 7.95 5.60 43.30 14.59 -2.91 29.09 11.61
Difference 1.07 -0.81 0.54 -1.96 N/A N/A N/A -7.21 1.92 N/A N/A N/A -2.59
Alliance Bernstein (SA) - Gross 5.62 -9.72 0.05 13.33 N/A N/A N/A -0.71 46.52 N/A N/A N/A 10.00 04/01/2012
IM U.S. Small Cap Growth Equity (SA+CF) Median 3.41 -8.71 -0.74 14.39 11.42 17.14 8.30 4.00 45.17 14.75 -1.21 28.78 11.88
Rank 20 62 41 70 N/A N/A N/A 82 44 N/A N/A N/A 78
DFA US Small Cap Trust (CF) - Net 2.84 -6.86 -2.64 13.25 10.95 16.07 7.73 4.75 42.42 18.20 -2.07 29.73 12.14 03/01/2003
Russell 2000 Index 3.59 -8.75 -4.41 11.65 9.18 14.01 6.80 4.89 38.82 16.34 -4.18 26.86 10.81
Difference -0.75 1.89 1.77 1.60 1.77 2.06 0.93 -0.14 3.60 1.86 2.11 2.87 1.33
DFA US Small Cap Trust (CF) - Gross 2.92 -6.70 -2.29 13.64 11.34 16.47 8.11 5.12 42.90 18.59 -1.70 30.17 12.45 03/01/2003
IM U.S. Small Cap Core Equity (SA+CF) Median 3.31 -6.68 -1.62 13.99 11.42 16.08 8.31 6.65 40.96 16.86 -1.38 28.10 12.21
Rank 63 51 62 58 54 42 54 64 38 33 54 33 41
iShares S&P SC 600 Index ETF (IJR) - Net 3.79 -5.85 -2.06 13.52 11.41 N/A N/A 5.77 41.21 16.49 0.74 N/A 14.10 10/01/2010
S&P Sm Cap 600 Index (Cap Wtd) 3.72 -5.89 -1.97 13.57 11.48 15.43 8.01 5.76 41.31 16.33 1.02 26.31 14.13
Difference 0.07 0.04 -0.09 -0.05 -0.07 N/A N/A 0.01 -0.10 0.16 -0.28 N/A -0.03
Voya Investment Management (SA) - Net 5.50 -8.09 -1.01 N/A N/A N/A N/A 5.41 N/A N/A N/A N/A 10.34 05/01/2013
Russell 2000 Grth Index 4.32 -9.31 -1.38 14.28 10.67 16.33 7.95 5.60 43.30 14.59 -2.91 29.09 11.19
Difference 1.18 1.22 0.37 N/A N/A N/A N/A -0.19 N/A N/A N/A N/A -0.85
Voya Investment Management (SA) - Gross 5.73 -7.69 -0.15 N/A N/A N/A N/A 6.35 N/A N/A N/A N/A 11.31 05/01/2013
IM U.S. Small Cap Growth Equity (SA+CF) Median 3.41 -8.71 -0.74 14.39 11.42 17.14 8.30 4.00 45.17 14.75 -1.21 28.78 11.50
Rank 18 45 44 N/A N/A N/A N/A 32 N/A N/A N/A N/A 55
Net performance shown is net of all manager fees and expenses (Net-All). Gross returns are compared to median performance of similar managers. A peer group of similar managers may not exist for all funds.
Page 23

Montana Board of Investments
Domestic Equity ManagersComparative Performance
As of December 31, 2015
QTD FYTD1
Year3
Years5
Years7
Years10
Years2014 2013 2012 2011 2010
SinceIncep.
InceptionDate
Metropolitan West Capital Mgmt (SA) - Net 2.01 -9.85 -5.70 N/A N/A N/A N/A 7.45 N/A N/A N/A N/A 7.85 05/01/2013
Russell 2000 Val Index 2.88 -8.17 -7.47 9.06 7.67 11.72 5.57 4.22 34.52 18.05 -5.50 24.50 5.83
Difference -0.87 -1.68 1.77 N/A N/A N/A N/A 3.23 N/A N/A N/A N/A 2.02
Metropolitan West Capital Mgmt (SA) - Gross 2.23 -9.45 -4.85 N/A N/A N/A N/A 8.43 N/A N/A N/A N/A 8.82 05/01/2013
IM U.S. Small Cap Value Equity (SA+CF) Median 2.45 -7.13 -4.33 12.02 9.98 15.27 7.97 5.71 38.10 17.48 -3.20 27.38 8.81
Rank 56 73 57 N/A N/A N/A N/A 20 N/A N/A N/A N/A 50
Vaughan Nelson Mgmt. (SA) - Net 1.70 -7.62 0.16 15.03 11.10 15.31 N/A 9.09 39.30 15.36 -3.61 24.21 9.35 03/01/2007
Russell 2000 Val Index 2.88 -8.17 -7.47 9.06 7.67 11.72 5.57 4.22 34.52 18.05 -5.50 24.50 3.80
Difference -1.18 0.55 7.63 5.97 3.43 3.59 N/A 4.87 4.78 -2.69 1.89 -0.29 5.55
Vaughan Nelson Mgmt. (SA) - Gross 1.90 -7.24 0.98 15.98 12.03 16.28 N/A 10.00 40.47 16.32 -2.77 25.27 10.28 03/01/2007
IM U.S. Small Cap Value Equity (SA+CF) Median 2.45 -7.13 -4.33 12.02 9.98 15.27 7.97 5.71 38.10 17.48 -3.20 27.38 6.79
Rank 65 52 7 4 17 38 N/A 10 36 60 48 64 4
Gross of fees performance is not available (N/A) for the following funds: Domestic Equity Pool SPIF and iShares S&P SC 600 Index ETF (IJR).The current annual expense ratios for the Domestic Equity Pool SPIF and the iShares S&P SC 600 Index ETF (IJR) are 0.15% and 0.12%, respectively.
Net performance shown is net of all manager fees and expenses (Net-All). Gross returns are compared to median performance of similar managers. A peer group of similar managers may not exist for all funds.
Page 24

QTD FYTD1
Year3
Years5
Years7
Years10
Years2014 2013 2012 2011 2010
SinceIncep.
InceptionDate
International Developed Large Cap Equity
Acadian Asset Non-US Equity (SA) - Net 2.90 -8.73 -7.75 2.75 2.85 8.36 N/A 0.00 17.60 18.66 -10.60 13.90 0.10 11/01/2006
MSCI ACW Ex US Val Index (Net) 1.43 -12.36 -10.06 -0.61 -0.06 6.47 2.11 -5.10 15.04 16.97 -13.20 7.84 0.19
Difference 1.47 3.63 2.31 3.36 2.91 1.89 N/A 5.10 2.56 1.69 2.60 6.06 -0.09
Acadian Asset Non-US Equity (SA) - Gross 3.03 -8.48 -7.26 3.29 3.41 8.97 N/A 0.52 18.22 19.37 -10.10 14.57 0.67 11/01/2006
IM International Large Cap Value Equity (SA+CF) Median 3.92 -7.04 -1.66 5.19 3.92 8.49 4.14 -4.04 23.24 17.91 -10.80 10.81 2.33
Rank 67 69 91 76 60 45 N/A 12 77 34 38 33 92
Baillie Gifford (SA) - Net 7.86 -4.91 N/A N/A N/A N/A N/A N/A N/A N/A N/A N/A -7.15 06/01/2015
MSCI ACW Ex US Grth Index (Net) 5.00 -6.31 -1.25 3.55 2.13 8.44 3.68 -2.65 15.49 16.67 -14.21 14.45 -8.76
Difference 2.86 1.40 N/A N/A N/A N/A N/A N/A N/A N/A N/A N/A 1.61
Baillie Gifford (SA) - Gross 8.00 -4.66 N/A N/A N/A N/A N/A N/A N/A N/A N/A N/A -6.86 06/01/2015
IM International Large Cap Growth Equity (SA+CF) Median 5.55 -4.54 2.12 6.14 4.81 10.19 5.13 -3.38 21.08 19.68 -11.39 13.17 -6.86
Rank 5 57 N/A N/A N/A N/A N/A N/A N/A N/A N/A N/A 51
BlackRock ACWI Ex-US SuperFund A (CF) - Net 3.24 -9.30 -5.49 1.67 1.24 N/A N/A -3.73 15.51 17.07 -13.54 11.36 5.87 06/01/2009
MSCI ACW Ex US Index (Net) 3.24 -9.32 -5.66 1.50 1.06 7.48 2.92 -3.87 15.29 16.83 -13.71 11.15 5.68
Difference 0.00 0.02 0.17 0.17 0.18 N/A N/A 0.14 0.22 0.24 0.17 0.21 0.19
BlackRock ACWI Ex-US SuperFund A (CF) - Gross 3.26 -9.27 -5.42 1.75 1.33 N/A N/A -3.65 15.61 17.17 -13.46 11.44 5.95 06/01/2009
International Equity Pool SPIF - Net 3.41 -6.40 -1.48 3.93 2.82 6.74 2.43 -5.66 20.79 17.97 -13.22 5.93 2.83 12/01/2005
MSCI EAFE Index (Net) 4.71 -6.01 -0.81 5.01 3.60 7.83 3.03 -4.90 22.78 17.32 -12.14 7.75 3.47
Difference -1.30 -0.39 -0.67 -1.08 -0.78 -1.09 -0.60 -0.76 -1.99 0.65 -1.08 -1.82 -0.64
Invesco (SA) - Net 6.16 -5.56 N/A N/A N/A N/A N/A N/A N/A N/A N/A N/A -8.42 06/01/2015
MSCI ACW Ex US Grth Index (Net) 5.00 -6.31 -1.25 3.55 2.13 8.44 3.68 -2.65 15.49 16.67 -14.21 14.45 -8.76
Difference 1.16 0.75 N/A N/A N/A N/A N/A N/A N/A N/A N/A N/A 0.34
Invesco (SA) - Gross 6.34 -5.23 N/A N/A N/A N/A N/A N/A N/A N/A N/A N/A -8.05 06/01/2015
IM International Large Cap Growth Equity (SA+CF) Median 5.55 -4.54 2.12 6.14 4.81 10.19 5.13 -3.38 21.08 19.68 -11.39 13.17 -6.86
Rank 22 69 N/A N/A N/A N/A N/A N/A N/A N/A N/A N/A 72
Montana Board of Investments
International Equity ManagersComparative Performance
As of December 31, 2015
Net performance shown is net of all manager fees and expenses (Net-All). Gross returns are compared to median performance of similar managers. A peer group of similar managers may not exist for all funds.
Page 25

Montana Board of Investments
International Equity ManagersComparative Performance
As of December 31, 2015
QTD FYTD1
Year3
Years5
Years7
Years10
Years2014 2013 2012 2011 2010
SinceIncep.
InceptionDate
Lazard Asset Management (SA) - Net 4.40 -7.36 N/A N/A N/A N/A N/A N/A N/A N/A N/A N/A -8.93 06/01/2015
MSCI ACW Ex US Val Index (Net) 1.43 -12.36 -10.06 -0.61 -0.06 6.47 2.11 -5.10 15.04 16.97 -13.20 7.84 -14.96
Difference 2.97 5.00 N/A N/A N/A N/A N/A N/A N/A N/A N/A N/A 6.03
Lazard Asset Management (SA) - Gross 4.54 -7.11 N/A N/A N/A N/A N/A N/A N/A N/A N/A N/A -8.64 06/01/2015
IM International Large Cap Value Equity (SA+CF) Median 3.92 -7.04 -1.66 5.19 3.92 8.49 4.14 -4.04 23.24 17.91 -10.80 10.81 -9.32
Rank 37 51 N/A N/A N/A N/A N/A N/A N/A N/A N/A N/A 40
International Developed Small Cap Equity
American Century Investment Mgmt (SA) - Net 5.89 0.17 11.32 N/A N/A N/A N/A N/A N/A N/A N/A N/A 0.04 03/01/2014
MSCI ACW Ex US Sm Cap Grth Index (Net) 6.90 -3.16 6.50 6.76 3.16 13.31 4.86 -3.59 18.52 16.87 -17.86 27.30 -0.46
Difference -1.01 3.33 4.82 N/A N/A N/A N/A N/A N/A N/A N/A N/A 0.50
American Century Investment Mgmt (SA) - Gross 6.12 0.60 12.25 N/A N/A N/A N/A N/A N/A N/A N/A N/A 0.89 03/01/2014
IM International Small Cap Growth Equity (SA+CF) Median 7.26 0.36 11.85 11.99 7.79 15.82 7.45 -3.37 31.09 23.38 -14.53 23.86 2.26
Rank 59 47 49 N/A N/A N/A N/A N/A N/A N/A N/A N/A 67
BlackRock ACWI Ex-US Small Cap (CF) - Net 5.29 -5.31 2.87 5.84 N/A N/A N/A -3.84 19.87 N/A N/A N/A 6.77 02/01/2012
MSCI ACWI Ex US Sm Cap Index IMI (Net) 5.28 -5.27 2.60 5.64 2.63 12.79 4.97 -4.03 19.73 18.52 -18.50 25.21 6.59
Difference 0.01 -0.04 0.27 0.20 N/A N/A N/A 0.19 0.14 N/A N/A N/A 0.18
BlackRock ACWI Ex-US Small Cap (CF) - Gross 5.34 -5.23 3.04 6.03 N/A N/A N/A -3.67 20.08 N/A N/A N/A 6.95 02/01/2012
DFA Intl Sm Co;I (DFISX) - Net 5.24 -3.15 5.89 8.15 4.92 12.19 5.17 -6.29 27.49 18.75 -15.36 23.91 7.62 11/01/2004
MSCI Wrld Ex US Sm Cap Index (Net) 5.82 -2.68 5.46 7.82 4.39 12.83 4.09 -5.35 25.55 17.48 -15.81 24.51 6.91
Difference -0.58 -0.47 0.43 0.33 0.53 -0.64 1.08 -0.94 1.94 1.27 0.45 -0.60 0.71
Net performance shown is net of all manager fees and expenses (Net-All). Gross returns are compared to median performance of similar managers. A peer group of similar managers may not exist for all funds.
Page 26
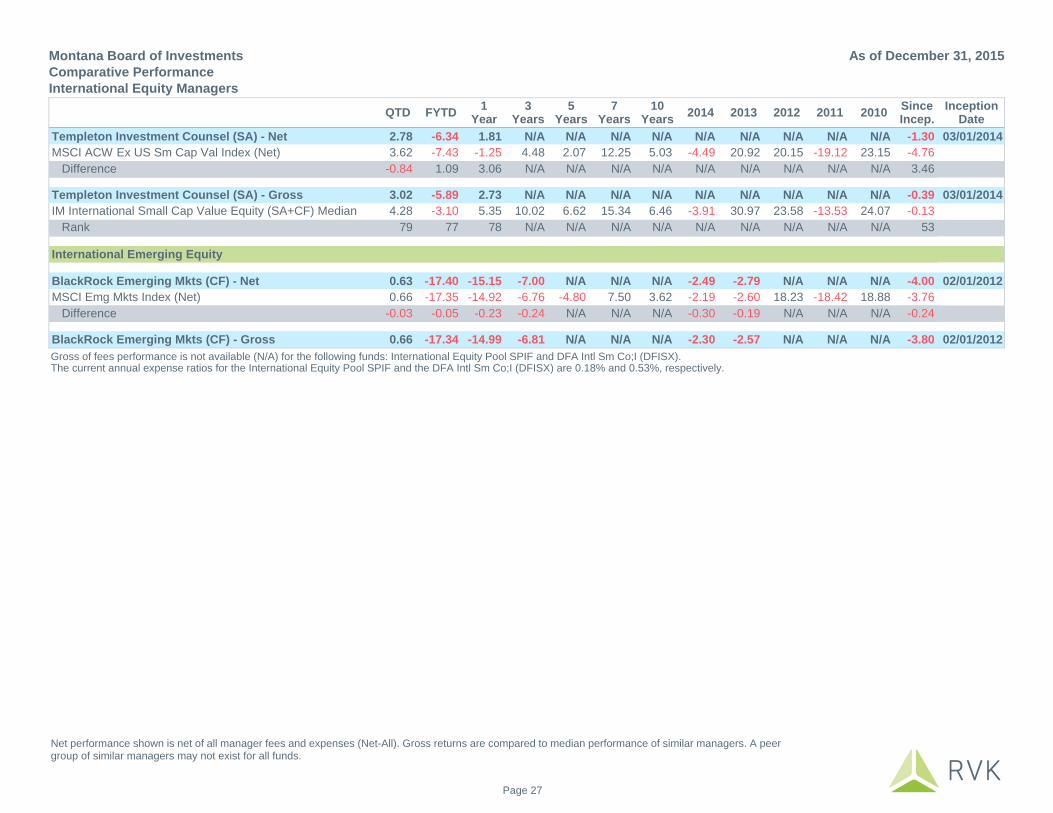
Montana Board of Investments
International Equity ManagersComparative Performance
As of December 31, 2015
QTD FYTD1
Year3
Years5
Years7
Years10
Years2014 2013 2012 2011 2010
SinceIncep.
InceptionDate
Templeton Investment Counsel (SA) - Net 2.78 -6.34 1.81 N/A N/A N/A N/A N/A N/A N/A N/A N/A -1.30 03/01/2014
MSCI ACW Ex US Sm Cap Val Index (Net) 3.62 -7.43 -1.25 4.48 2.07 12.25 5.03 -4.49 20.92 20.15 -19.12 23.15 -4.76
Difference -0.84 1.09 3.06 N/A N/A N/A N/A N/A N/A N/A N/A N/A 3.46
Templeton Investment Counsel (SA) - Gross 3.02 -5.89 2.73 N/A N/A N/A N/A N/A N/A N/A N/A N/A -0.39 03/01/2014
IM International Small Cap Value Equity (SA+CF) Median 4.28 -3.10 5.35 10.02 6.62 15.34 6.46 -3.91 30.97 23.58 -13.53 24.07 -0.13
Rank 79 77 78 N/A N/A N/A N/A N/A N/A N/A N/A N/A 53
International Emerging Equity
BlackRock Emerging Mkts (CF) - Net 0.63 -17.40 -15.15 -7.00 N/A N/A N/A -2.49 -2.79 N/A N/A N/A -4.00 02/01/2012
MSCI Emg Mkts Index (Net) 0.66 -17.35 -14.92 -6.76 -4.80 7.50 3.62 -2.19 -2.60 18.23 -18.42 18.88 -3.76
Difference -0.03 -0.05 -0.23 -0.24 N/A N/A N/A -0.30 -0.19 N/A N/A N/A -0.24
BlackRock Emerging Mkts (CF) - Gross 0.66 -17.34 -14.99 -6.81 N/A N/A N/A -2.30 -2.57 N/A N/A N/A -3.80 02/01/2012
Gross of fees performance is not available (N/A) for the following funds: International Equity Pool SPIF and DFA Intl Sm Co;I (DFISX).The current annual expense ratios for the International Equity Pool SPIF and the DFA Intl Sm Co;I (DFISX) are 0.18% and 0.53%, respectively.
Net performance shown is net of all manager fees and expenses (Net-All). Gross returns are compared to median performance of similar managers. A peer group of similar managers may not exist for all funds.
Page 27

QTD FYTD1
Year3
Years5
Years7
Years10
Years2014 2013 2012 2011 2010
SinceIncep.
InceptionDate
Core Internal Bond Portfolio -0.89 0.62 0.83 1.81 3.91 5.74 5.15 6.82 -2.02 6.07 8.20 9.97 6.59 04/01/1995
Barclays US Agg Bond Index -0.57 0.65 0.55 1.44 3.25 4.09 4.52 5.97 -2.02 4.21 7.84 6.54 5.75
Difference -0.32 -0.03 0.28 0.37 0.66 1.65 0.63 0.85 0.00 1.86 0.36 3.43 0.84
Core Internal Bond Portfolio -0.89 0.62 0.83 1.81 3.91 5.74 5.15 6.82 -2.02 6.07 8.20 9.97 6.59 04/01/1995
IM U.S. Broad Market Core FI (SA+CF) -0.45 0.66 0.80 1.70 3.68 5.16 4.93 6.16 -1.56 5.73 7.83 7.22 6.09
Rank 100 59 47 35 36 28 31 23 73 45 24 7 6
Trust Funds Bond Portfolio -0.83 0.73 1.03 2.07 4.07 5.49 5.20 6.79 -1.43 6.15 8.16 8.07 6.27 10/01/1995
Barclays US Agg Bond Index -0.57 0.65 0.55 1.44 3.25 4.09 4.52 5.97 -2.02 4.21 7.84 6.54 5.49
Difference -0.26 0.08 0.48 0.63 0.82 1.40 0.68 0.82 0.59 1.94 0.32 1.53 0.78
Trust Funds Bond Portfolio -0.83 0.73 1.03 2.07 4.07 5.49 5.20 6.79 -1.43 6.15 8.16 8.07 6.27 10/01/1995
IM U.S. Broad Market Core FI (SA+CF) -0.45 0.66 0.80 1.70 3.68 5.16 4.93 6.16 -1.56 5.73 7.83 7.22 5.83
Rank 98 45 27 21 25 35 28 25 41 42 25 26 8
Neuberger Berman High Yield (SA) - Net -1.52 -6.31 -4.32 1.67 4.86 N/A N/A 1.93 7.78 15.90 4.07 16.27 6.68 01/01/2010
Barclays US Hi Yld - 2% Issuer Cap Index -2.06 -6.79 -4.43 1.70 5.03 12.86 6.95 2.46 7.44 15.78 4.96 14.94 6.62
Difference 0.54 0.48 0.11 -0.03 -0.17 N/A N/A -0.53 0.34 0.12 -0.89 1.33 0.06
Neuberger Berman High Yield (SA) - Gross -1.41 -6.10 -3.89 2.13 5.33 N/A N/A 2.38 8.26 16.42 4.54 16.83 7.17 01/01/2010
IM U.S. High Yield Bonds (SA+CF) Median -1.35 -5.58 -2.59 2.52 5.36 11.77 6.87 2.73 7.52 15.38 5.27 15.03 6.97
Rank 52 63 74 64 52 N/A N/A 57 31 30 64 22 41
Montana Board of Investments
Fixed Income ManagersComparative Performance
As of December 31, 2015
Net performance shown is net of all manager fees and expenses (Net-All).Gross returns are compared to median performance of similar managers.
Page 28

Montana Board of Investments
Fixed Income ManagersComparative Performance
As of December 31, 2015
QTD FYTD1
Year3
Years5
Years7
Years10
Years2014 2013 2012 2011 2010
SinceIncep.
InceptionDate
Reams Asset Core Plus (SA) - Net -1.40 -0.36 0.07 1.20 3.90 7.37 N/A 4.47 -0.85 8.64 7.54 9.27 6.27 10/01/2008
Barclays US Unv Bond Index -0.55 0.13 0.43 1.51 3.46 4.70 4.67 5.56 -1.35 5.53 7.40 7.16 4.93
Difference -0.85 -0.49 -0.36 -0.31 0.44 2.67 N/A -1.09 0.50 3.11 0.14 2.11 1.34
Reams Asset Core Plus (SA) - Gross -1.36 -0.27 0.24 1.38 4.08 7.56 N/A 4.65 -0.68 8.83 7.72 9.47 6.45 10/01/2008
IM U.S. Broad Market Core+ FI (SA+CF) -0.48 -0.04 0.26 1.85 4.21 6.75 5.31 6.20 -0.58 8.04 7.43 8.99 6.33
Rank 94 58 51 88 61 26 N/A 90 55 41 39 41 47
Post High Yield Plus (SA) - Net -0.12 -2.37 0.82 5.26 6.96 N/A N/A 4.99 10.19 16.97 2.60 14.96 9.96 06/01/2009
Barclays US Hi Yld - 2% Issuer Cap Index -2.06 -6.79 -4.43 1.70 5.03 12.86 6.95 2.46 7.44 15.78 4.96 14.94 9.65
Difference 1.94 4.42 5.25 3.56 1.93 N/A N/A 2.53 2.75 1.19 -2.36 0.02 0.31
Post High Yield Plus (SA) - Gross 0.03 -2.07 1.43 5.90 7.60 N/A N/A 5.62 10.85 17.67 3.22 15.65 10.63 06/01/2009
IM U.S. High Yield Bonds (SA+CF) Median -1.35 -5.58 -2.59 2.52 5.36 11.77 6.87 2.73 7.52 15.38 5.27 15.03 9.54
Rank 9 13 6 1 2 N/A N/A 3 11 14 82 37 18
Post Trad'l High Yield LP (CF) - Gross -0.04 -2.22 1.42 5.74 7.65 N/A N/A 6.01 9.98 18.62 3.08 14.48 9.75 09/01/2009
IM U.S. High Yield Bonds (SA+CF) Median -1.35 -5.58 -2.59 2.52 5.36 11.77 6.87 2.73 7.52 15.38 5.27 15.03 8.26
Rank 11 13 6 1 2 N/A N/A 3 13 10 83 67 9
Trust Funds Bond Portfolio and Post Trad'l High Yield LP (CF) are part of the Trust Fund Investment Pool.
Net performance shown is net of all manager fees and expenses (Net-All).Gross returns are compared to median performance of similar managers.
Page 29

QTD FYTD1
Year3
Years5
Years7
Years10
Years2014 2013 2012 2011 2010
Abandoned Mine Trust -0.12 0.25 0.90 1.01 1.46 3.04 3.02 1.49 0.63 2.82 1.49 3.31
Big Sky Economic Development Fund -0.50 0.97 1.82 2.75 4.59 5.96 5.47 6.77 -0.22 6.72 8.13 8.48
Butte Area One Restoration -0.32 0.56 1.20 1.55 2.58 3.44 N/A 3.57 -0.08 3.68 4.61 5.13
Clark Fork River Restoration -0.35 0.64 1.37 1.82 3.02 3.98 N/A 4.26 -0.12 4.36 5.33 5.78
Coal Tax Cultural Trust Fund -0.49 0.97 1.79 2.74 4.59 5.95 5.47 6.79 -0.23 6.76 8.09 8.42
Coal Tax Park Acquisition -0.49 0.96 1.78 2.69 4.56 5.93 5.45 6.66 -0.25 6.78 8.10 8.43
East Helena Compensation Fund -0.17 0.50 0.91 1.26 N/A N/A N/A 3.01 -0.13 N/A N/A N/A
Endowment for Children -0.46 0.92 1.70 2.65 4.50 5.82 N/A 6.66 -0.28 6.69 8.00 8.26
FWP License Account 0.05 0.26 0.61 0.54 0.87 1.21 2.39 0.59 0.42 1.64 1.08 2.01
FWP Mitigation Trust Fund -0.04 0.30 0.87 0.95 1.43 2.94 2.89 1.37 0.61 2.85 1.46 3.21
FWP Real Property Trust -0.48 0.92 1.73 2.61 4.40 5.70 5.29 6.47 -0.24 6.51 7.76 8.06
Group Benefits -0.20 0.27 1.06 0.85 1.24 2.15 2.92 1.17 0.32 2.22 1.43 3.13
Montana Pole -0.35 0.87 1.56 2.25 3.76 4.95 4.78 5.44 -0.17 5.50 6.61 7.07
Montana Tech-UM Agency Funds 0.06 0.17 0.27 0.26 0.41 0.59 1.72 0.35 0.17 0.57 0.66 0.75
Montana State University 0.01 0.24 0.39 0.46 0.73 1.02 2.03 0.85 0.12 1.07 1.23 1.40
MT BOI - Clark Fork Site -0.47 0.83 1.56 2.25 3.63 4.67 N/A 5.37 -0.09 5.23 6.23 6.68
MT BOI UOFM Other -0.37 0.34 1.13 1.19 1.66 2.07 2.81 2.57 -0.12 2.54 2.21 2.79
MUS Group Insurance -0.15 0.33 1.26 0.91 N/A N/A N/A 1.30 0.17 1.56 N/A N/A
Older Montanans Trust -0.48 0.95 1.72 2.65 3.95 5.48 N/A 6.57 -0.23 6.01 5.85 8.45
Permanent Coal Trust Excl Crp -0.17 1.11 2.23 3.10 4.53 5.42 5.22 6.14 0.99 6.29 7.16 7.09
PERS Defined Cont Disability 0.08 N/A N/A N/A N/A N/A N/A N/A N/A N/A N/A N/A
Resource Indemnity Trust -0.51 0.97 1.82 2.79 4.65 5.96 5.48 6.94 -0.27 6.86 8.18 8.12
Smelter Hill Up Restorative -0.21 0.39 0.92 1.14 1.74 2.11 N/A 2.49 0.01 2.47 2.83 2.80
State Fund Insurance 0.62 0.88 2.21 3.43 4.55 6.07 5.20 5.00 3.11 7.25 5.26 8.63
Streamside Tailings Operable Unit -0.44 0.91 1.69 2.53 4.17 5.29 5.11 6.22 -0.21 6.14 7.20 7.35
Tobacco Trust Fund -0.51 0.97 1.82 2.77 4.61 5.98 5.51 6.89 -0.27 6.77 8.12 8.45
Treasurers 0.01 0.10 0.27 0.23 0.26 0.34 1.56 0.19 0.23 0.31 0.31 0.34
Treasure State Endowment -0.50 0.97 1.82 2.77 4.62 5.98 5.51 6.84 -0.21 6.76 8.14 8.48
Treasure State Reg. Water System -0.50 0.97 1.82 2.76 4.60 5.96 5.47 6.80 -0.22 6.73 8.13 8.48
Trust and Legacy Account -0.51 0.97 1.82 2.79 4.61 5.96 5.49 6.92 -0.26 6.78 8.04 8.42
UCFRB Assess/Litig Cost Rec -0.48 0.94 1.65 2.56 4.18 5.40 5.29 6.40 -0.24 6.45 6.87 7.47
UCFRB Restoration Fund -0.47 0.92 1.70 2.56 4.33 5.65 5.25 6.28 -0.20 6.43 7.66 8.22
Upper Blackfoot Response -0.21 0.36 0.84 0.85 1.29 N/A N/A 1.59 0.13 1.60 2.30 N/A
Weed Control Trust -0.51 0.97 1.82 2.80 4.48 5.91 5.19 6.94 -0.23 6.69 7.42 7.71
Wildlife Habitat Trust -0.47 0.91 1.73 2.62 4.39 5.69 5.30 6.49 -0.24 6.46 7.74 8.07
Zortman/Landusky LT H20 -0.48 -0.10 0.84 0.70 3.67 3.79 5.62 1.78 -0.51 5.47 11.21 12.62
Z/L Long Term H20 Trust Fund -0.41 -0.06 1.15 0.65 3.41 3.31 5.52 1.76 -0.96 3.91 11.64 10.79
Montana Board of Investments
Trust AccountsComparative Performance
As of December 31, 2015
Performance shown is gross of fees.
Page 30

Performance Notes:
All gross and net performance data is provided by State Street Analytics (SSA). Reported gross returns for the retirement plans prior to July 1, 2002 are net of all fees.
Gross performance for the retirement plans is calculated with fee accruals provided by Montana's Accounting department.
Retirement Plan Custom Benchmarks are provided by State Street Bank and are calculated daily using actual allocations.
Effective May 2014, ING rebranded to Voya. The ING Investment Management (SA) has been updated to Voya Investment Management (SA) to reflect the change.
Index Notes:
The Montana International Custom Benchmark consists of 100% MSCI EAFE Index (Net) through 10/31/2006, 100% MSCI ACW Ex US Index (Net) through 6/30/2007, 92.5%MSCI ACW Ex US Index (Net) and 7.5% MSCI ACW Ex US SC IM Index (Net) through 2/28/2014, and 100% MSCI ACWI ex-US IMI thereafter.
Gross of fees performance is not available (N/A) for the following funds: Domestic Equity Pool SPIF, iShares S&P SC 600 Index ETF (IJR), International Equity Pool SPIF, and DFAIntl Sm Co;I (DFISX). The current annual expense ratios are 0.15%, 0.14%, 0.18%, and 0.53%, respectively.
Montana Board of InvestmentsAddendum
As of December 31, 2015
Page 31

Disclaimer of Warranties and Limitation of Liability - This document was prepared by RVK, Inc. (RVK) and may include information and data from some or all of the following sources: client staff; custodian banks; investment managers; specialty investment consultants; actuaries; plan administrators/record-keepers; index providers; as well as other third-party sources as directed by the client or as we believe necessary or appropriate. RVK has taken reasonable care to ensure the accuracy of the information or data, but makes no warranties and disclaims responsibility for the accuracy or completeness of information or data provided or methodologies employed by any external source. This document is provided for the client’s internal use only and does not constitute a recommendation by RVK or an offer of, or a solicitation for, any particular security and it is not intended to convey any guarantees as to the future performance of the investment products, asset classes, or capital markets.

Return to Agenda
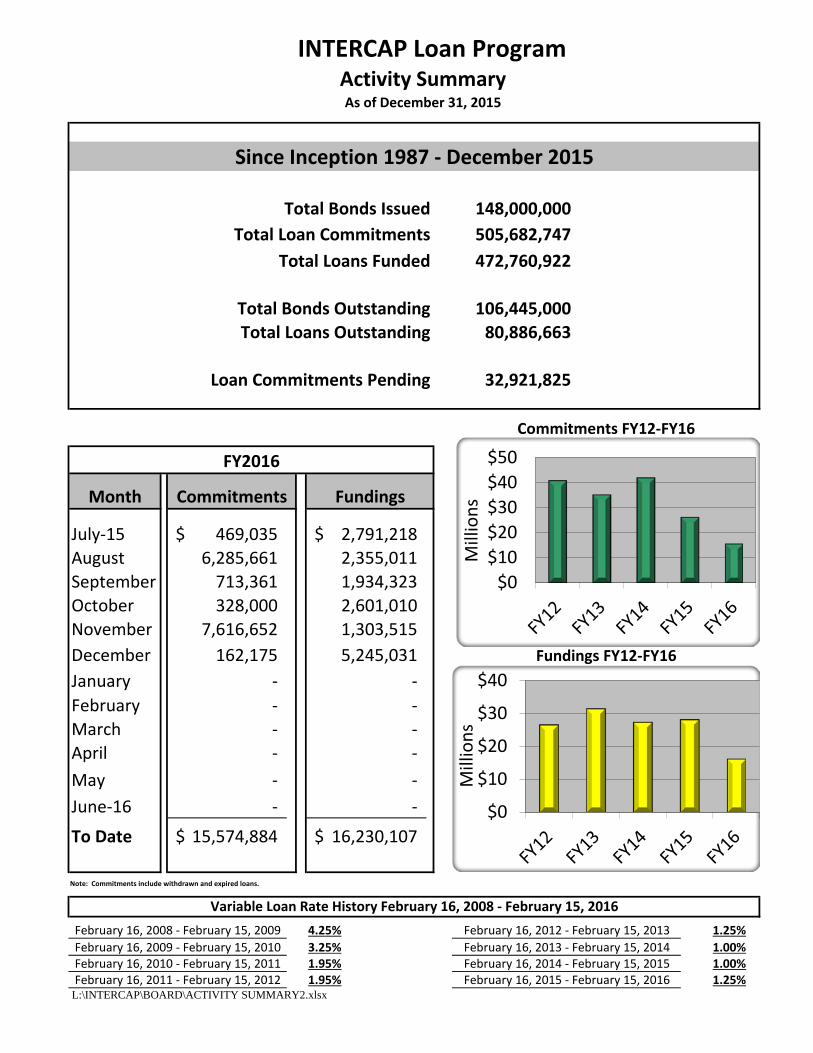
L:\INTERCAP\BOARD\ACTIVITY SUMMARY2.xlsx
Total Bonds IssuedTotal Loan Commitments
Total Loans Funded
Total Bonds OutstandingTotal Loans Outstanding
Loan Commitments Pending
Month
July-15 469,035$ 2,791,218$ August 6,285,661 2,355,011 September 713,361 1,934,323 October 328,000 2,601,010 November 7,616,652 1,303,515 December 162,175 5,245,031 January - -February - -March - -April - -May - -June-16 - -
To Date 15,574,884$ 16,230,107$
Note: Commitments include withdrawn and expired loans.
February 16, 2008 - February 15, 2009 4.25%February 16, 2009 - February 15, 2010 3.25%February 16, 2010 - February 15, 2011 1.95%February 16, 2011 - February 15, 2012 1.95%
Commitments Fundings
Variable Loan Rate History February 16, 2008 - February 15, 2016
Fundings FY12-FY16
1.00%1.00%
1.25%
February 16, 2015 - February 15, 2016 1.25%
February 16, 2012 - February 15, 2013February 16, 2013 - February 15, 2014February 16, 2014 - February 15, 2015
INTERCAP Loan ProgramActivity SummaryAs of December 31, 2015
FY2016
Since Inception 1987 - December 2015
148,000,000 505,682,747 472,760,922
106,445,000 80,886,663
32,921,825
Commitments FY12-FY16
$0$10$20$30$40$50M
illio
ns
$0
$10
$20
$30
$40
Mill
ions


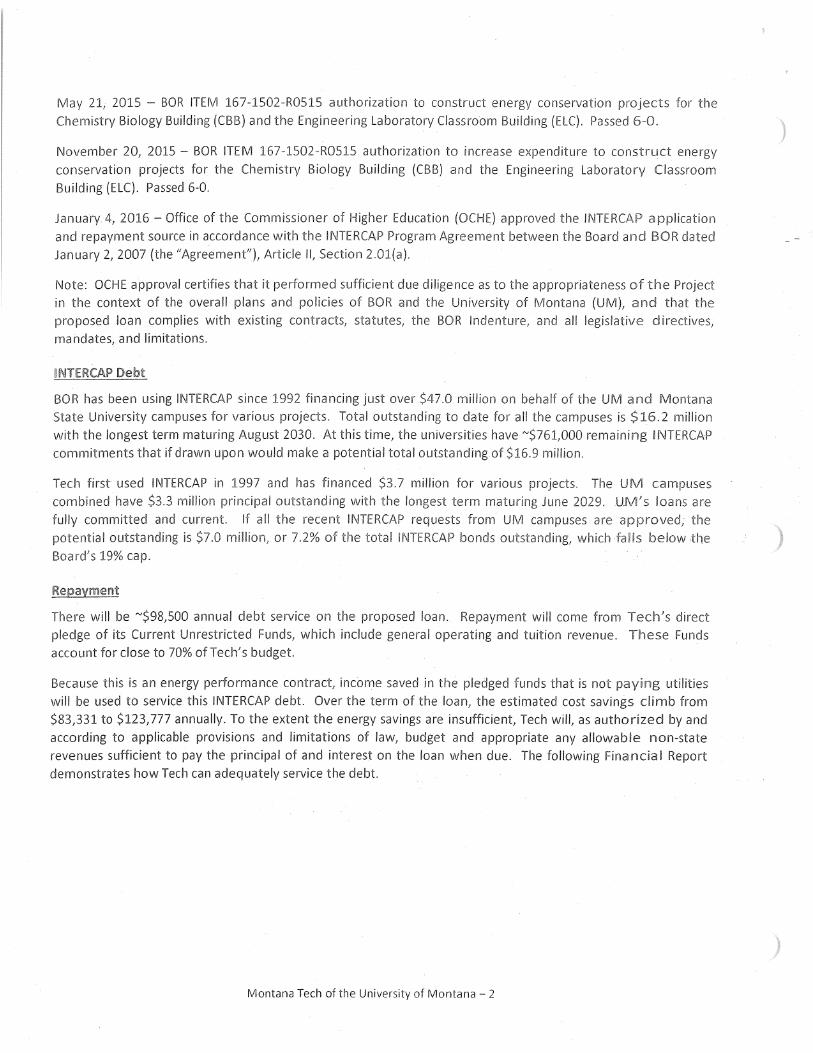


Staff Approved Loans - 1
MEMORANDUM Montana Board of Investments Department of Commerce 2401 Colonial Drive, 3rd Floor (406) 444-0001 To: Members of the Board From: Louise Welsh, Senior Bond Program Officer Date: February 23, 2016 Subject: INTERCAP Staff Approved Loans Committed Staff approved the following loans between October 1, 2015 and December 31, 2015.
Borrower: Valley County Purpose: Purchase landfill scraper Staff Approval Date: October 5, 2015 Board Loan Amount: $ 100,000 Other Funding Sources: $ 104,000 Total Project Cost: $ 204,000 Term: 10 years
Borrower: Town of Geraldine Purpose: Upgrade accounting software Staff Approval Date: October 6, 2015 Board Loan Amount: $ 18,000 Other Funding Sources: $ 375 Total Project Cost: $ 18,375 Term: 5 years
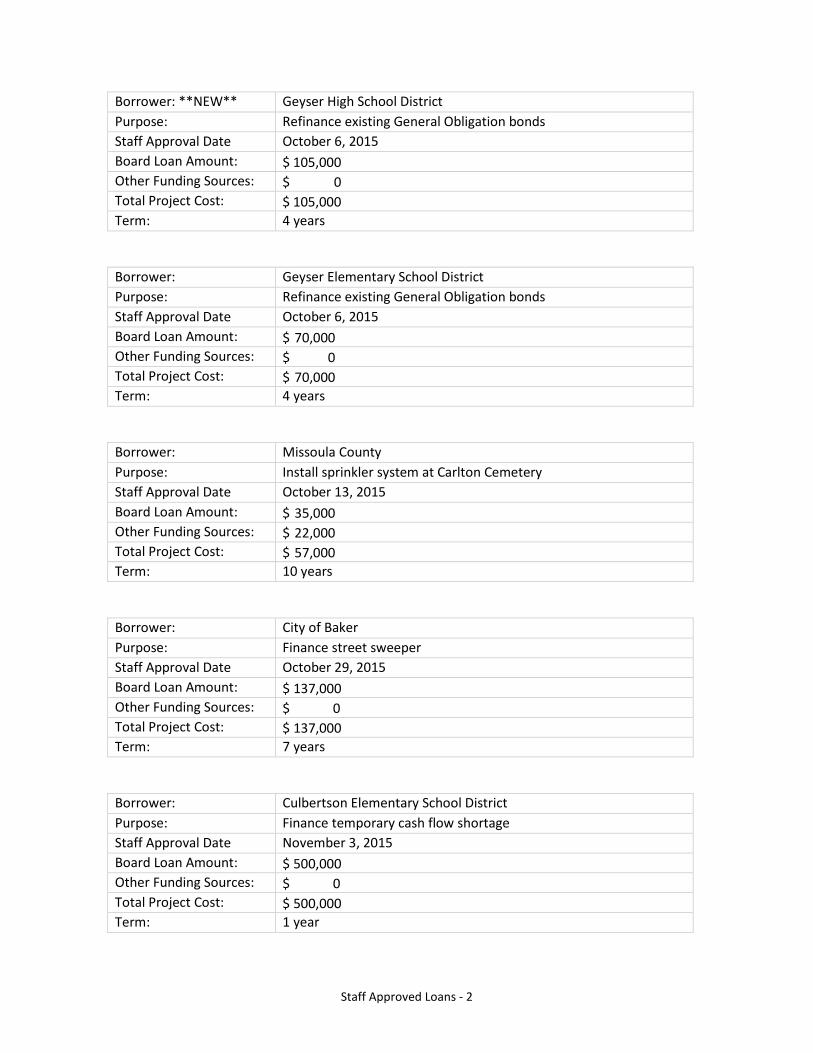
Staff Approved Loans - 2
Borrower: **NEW** Geyser High School District Purpose: Refinance existing General Obligation bonds Staff Approval Date October 6, 2015 Board Loan Amount: $ 105,000 Other Funding Sources: $ 0 Total Project Cost: $ 105,000 Term: 4 years
Borrower: Geyser Elementary School District Purpose: Refinance existing General Obligation bonds Staff Approval Date October 6, 2015 Board Loan Amount: $ 70,000 Other Funding Sources: $ 0 Total Project Cost: $ 70,000 Term: 4 years
Borrower: Missoula County Purpose: Install sprinkler system at Carlton Cemetery Staff Approval Date October 13, 2015 Board Loan Amount: $ 35,000 Other Funding Sources: $ 22,000 Total Project Cost: $ 57,000 Term: 10 years
Borrower: City of Baker Purpose: Finance street sweeper Staff Approval Date October 29, 2015 Board Loan Amount: $ 137,000 Other Funding Sources: $ 0 Total Project Cost: $ 137,000 Term: 7 years
Borrower: Culbertson Elementary School District Purpose: Finance temporary cash flow shortage Staff Approval Date November 3, 2015 Board Loan Amount: $ 500,000 Other Funding Sources: $ 0 Total Project Cost: $ 500,000 Term: 1 year

Staff Approved Loans - 3
Borrower: Blaine County Purpose: Purchase National Guard Armory to use for County purposes Staff Approval Date November 5, 2015 Board Loan Amount: $ 85,000 Other Funding Sources: $ 300,000 Total Project Cost: $ 385,000 Term: 3 years
Borrower: **NEW** Dixon Rural Fire District Purpose: Purchase and upgrade an existing building to house fire equipment Staff Approval Date November 5, 2015 Board Loan Amount: $ 28,000 Other Funding Sources: $ 0 Total Project Cost: $ 28,000 Term: 15 years
Borrower: City of Great Falls Purpose: Purchase two new Fire Pumpers Staff Approval Date November 6, 2015 Board Loan Amount: $ 801,098 Other Funding Sources: $ 0 Total Project Cost: $ 801,098 Term: 10 years
Borrower: City of Polson Purpose: Finance dump truck with snow plow attachment Staff Approval Date November 6, 2015 Board Loan Amount: $ 65,000 Other Funding Sources: $ 0 Total Project Cost: $ 65,000 Term: 5 years
Borrower: City of Kalispell Purpose: Finance chip truck for urban forestry program Staff Approval Date November 10, 2015 Board Loan Amount: $ 45,000 Other Funding Sources: $ 0 Total Project Cost: $ 45,000 Term: 5 years

Staff Approved Loans - 4
Borrower: Town of Kevin Purpose: Purchase and upgrade existing building to house Town offices Staff Approval Date November 12, 2015 Board Loan Amount: $ 65,000 Other Funding Sources: $ 0 Total Project Cost: $ 65,000 Term: 10 years
Borrower: **NEW** Broadwater Hospital District (Townsend) Purpose: Finance building improvements Staff Approval Date November 16, 2015 Board Loan Amount: $ 163,000 Other Funding Sources: $ 0 Total Project Cost: $ 163,000 Term: 10 years
Borrower: **NEW** Broadwater Hospital District (Townsend) Purpose: Finance potential Medicaid reimbursement Staff Approval Date November 16, 2015 Board Loan Amount: $ 474,000 Other Funding Sources: $ 0 Total Project Cost: $ 474,000 Term: 3 years
Borrower: Park City Rural Fire District Purpose: Finance replacement fire apparatus Staff Approval Date November 25, 2015 Board Loan Amount: $ 35,000 Other Funding Sources: $ 0 Total Project Cost: $ 35,000 Term: 7 years
Borrower: **NEW** Red Lodge Rural Fire District Purpose: Finance new fire truck Staff Approval Date November 25, 2015 Board Loan Amount: $ 378,554 Other Funding Sources: $ 0 Total Project Cost: $ 378,554 Term: 10 years

Staff Approved Loans - 5
Borrower: Thompson Falls Purpose: Finance two police vehicles Staff Approval Date December 1, 2015 Board Loan Amount: $ 13,590 Other Funding Sources: $ 50,000 Total Project Cost: $ 63,590 Term: 5 years
Borrower: Toole County Purpose: Finance a new road grader Staff Approval Date December 17, 2015 Board Loan Amount: $ 148,585 Other Funding Sources: $ 0 Total Project Cost: $ 148,585 Term: 5 years

1
Louise Welsh Senior Bond Program Officer February 23, 2016

2
Since 1987, INTERCAP has been a valuable low interest loan resource for over 500 Montana governments.
Contents: Legal Authorization Program Statistics Board’s Guaranty Bonds that fund INTERCAP Bond Finance Team INTERCAP Program Use
INTERCAP

Legal, Policy and Governance
3
Montana Code Annotated, Title 17, Chapter 5, Part 16 Municipal Finance Consolidation Act (MFCA)
17-5-1602 (1)(2) Lend to eligible government units 17-5-1606 (5)(b) Sell MFCA bonds at a public or private sale to fund INTERCAP loans 17-5-1611 (11) Independently hire underwriters, attorneys, trustees, and related parties 17-5-1630 (5) Board guaranty for MFCA bond repayment 17-5-1608 Board guaranty (credit enhancement) capped at $190 million 17-5-1611 (6) Board may charge a fee for its services INTERCAP

Legal, Policy and Governance Next Level of Governance
Board Governance Manual, Section III (12) ◦ Delegates Executive Director to implement credit enhancement.
Resolution 219 ◦ Board credit enhancement is to purchase tendered bonds not
remarketed and loan to INTERCAP’s reserve fund to cover bond debt service.
Designated Credit Enhancement Funds’ Policies ◦ Permanent Coal Trust Fund ◦ Treasurer’s Fund ◦ Short Term Investment Pool (STIP)
4 INTERCAP

5
Program Snapshot As of 2nd Quarter FY16
Overall Total Outstanding Rate* INTERCAP Bonds $148,000,000 $106,445,000 0.23% 1,569 Loans Funded $472,760,922 $ 80,886,663 1.25% Loan Commitments $505,682,747 $ 32,921,825 *The Bonds are currently in the remarketing process. Staff will provide the new Bond rate during the presentation.
$0$10$20$30$40$50
Mill
ions
$0
$10
$20
$30
$40
Mill
ions
Committed Funded
INTERCAP

BOI Guaranty (Credit Enhancement)
6
Designated Investment Funds for Enhancement FY16 – 2nd Qtr. Balances Treasurer’s Fund $ 842,528,128 Coal Severance Tax: Permanent Corpus STIP 7,130,343 Permanent Corpus TFIP 366,138,713 Treasure State Endowment Corpus TFIP 257,683,300 Total $ 1,473,480,484 Program’s Enhanced INTERCAP Bonds $ 106,445,000** Montana Facility Finance Authority (MFFA)* 84,993,453 Total $ 191,438,453
Designated Funds nearly 8 times the coverage
*MFFA enhancement under separate law 90-7-320 MCA and individually capped at $190 million. ** INTERCAP Bonds outstanding will reduce to $97,340,000 after March 1.
INTERCAP

7
How much time does investment staff have to prepare for a potential call on the guaranty? ◦ 20 days before the March 1st closing date - notified of the amount to be tendered and remarketed
◦ Five (5) days before March 1st - notified of the amount not remarketed yet and the sale continues
◦ March 1st - notified of final amount not remarketed that the Board is required to purchase.
Bonds purchased by the Board may be subsequently remarketed or redeemed.
Is BOI paid a fee for this service?
◦ Current fee: One-time 1.30% of the principal amount of a new bond issue
0.25% of the principal amount of tendered Bonds actually purchased
Example: If all the bonds were tendered and not remarketed, the fee would be ~$243K
How often does a call on the guaranty occur? ◦ To date, no loans to reserve accounts have been required to be made by the Board, no tendered
Bonds have been required to be purchased by the Board and all of the loans made to eligible governmental units under the Municipal Finance Consolidation Act and to eligible facilities under the Montana Facility Finance Authority Act are current in payment.
BOI Guaranty (Credit Enhancement)
INTERCAP
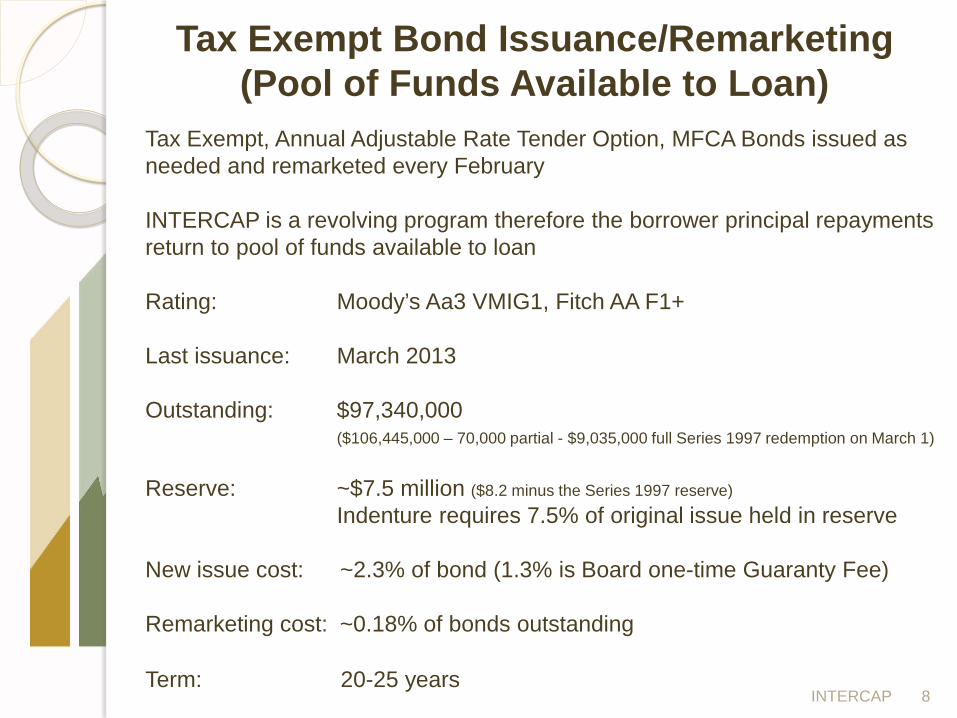
Tax Exempt Bond Issuance/Remarketing (Pool of Funds Available to Loan)
8
Tax Exempt, Annual Adjustable Rate Tender Option, MFCA Bonds issued as needed and remarketed every February INTERCAP is a revolving program therefore the borrower principal repayments return to pool of funds available to loan Rating: Moody’s Aa3 VMIG1, Fitch AA F1+ Last issuance: March 2013 Outstanding: $97,340,000 ($106,445,000 – 70,000 partial - $9,035,000 full Series 1997 redemption on March 1) Reserve: ~$7.5 million ($8.2 minus the Series 1997 reserve)
Indenture requires 7.5% of original issue held in reserve New issue cost: ~2.3% of bond (1.3% is Board one-time Guaranty Fee) Remarketing cost: ~0.18% of bonds outstanding Term: 20-25 years INTERCAP
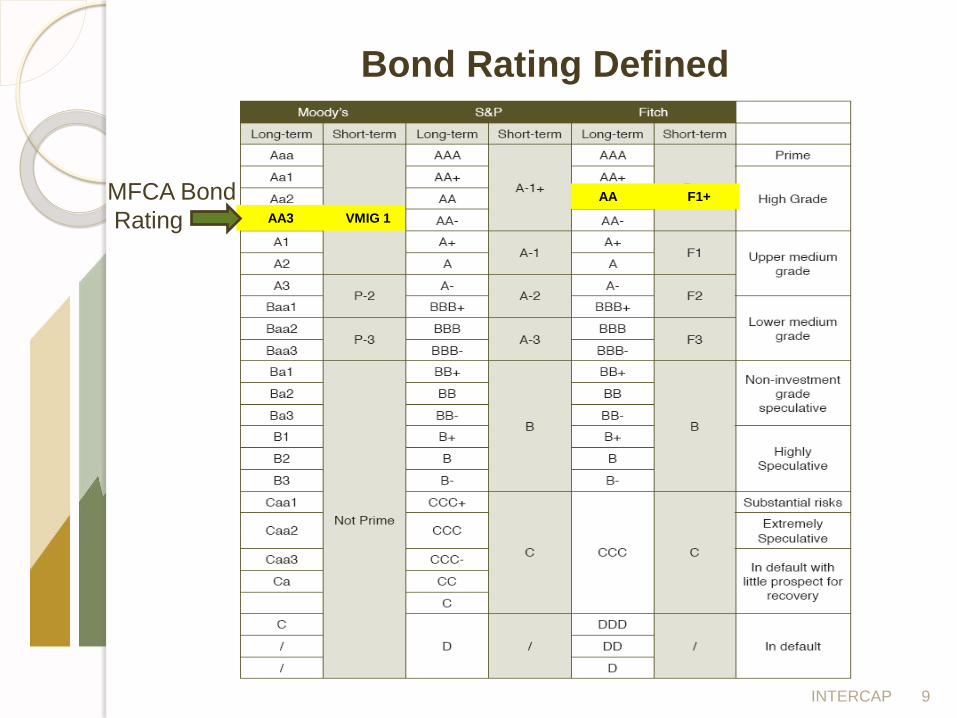
Bond Rating Defined
9 INTERCAP
MFCA Bond Rating AA3 VMIG 1
AA F1+

10
Bond vs. Loan Rate
2015 2014 2013 2012 2011 2010 2009 2008 MMD GO AAA: 0.14% 0.17% 0.20% 0.18% 0.23% 0.25% 0.59% 2.10% Minimum Rate: 0.10% 0.15% 0.18% 0.22% 0.40% 0.50% 0.50% 1.50% Bond Rate: 0.23% 0.16% 0.22% 0.22% 0.48% 0.50% 2.15% 3.25% Loan Rate: 1.25% 1.00% 1.00% 1.25% 1.95% 1.95% 3.25% 4.25%
Loan Rate changes every February 16
Loan Rate Average* (in years) 5 10 15 20 25 overall 1.29% 2.55% 2.85% 3.36% 3.75% 4.18% *Peaked at 7.95% in 1989. Lowest was 1.00% in 2013 and 2014.
INTERCAP
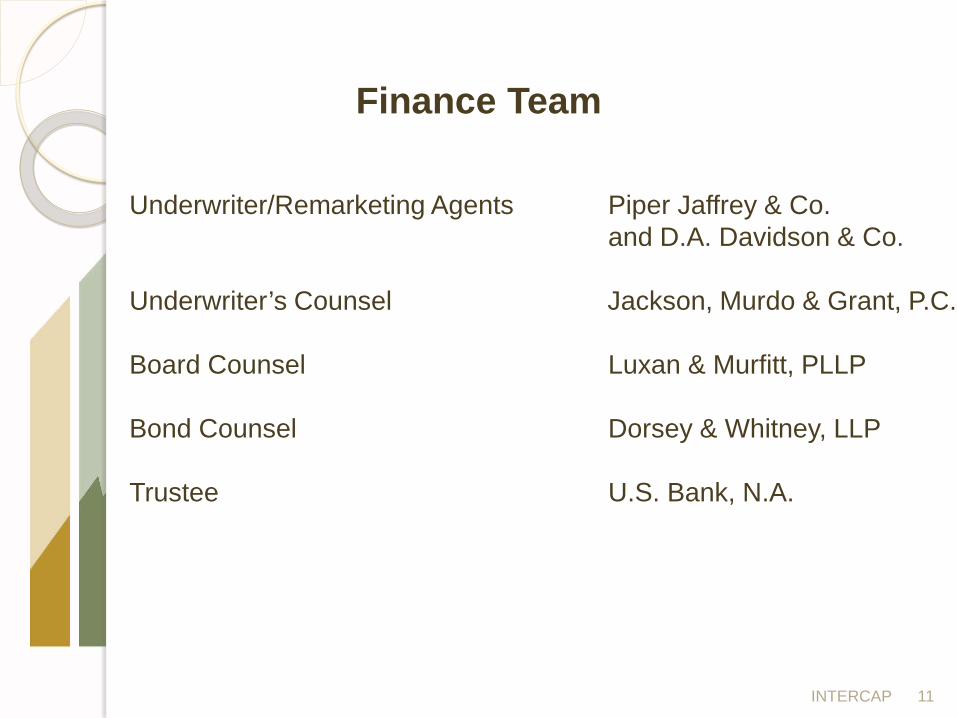
Finance Team
11
Underwriter/Remarketing Agents Piper Jaffrey & Co. and D.A. Davidson & Co. Underwriter’s Counsel Jackson, Murdo & Grant, P.C. Board Counsel Luxan & Murfitt, PLLP Bond Counsel Dorsey & Whitney, LLP Trustee U.S. Bank, N.A.
INTERCAP

Borrower & Loan Types
12 INTERCAP
Montana Local Governments, State Agencies, and Universities
• Promissory Note – general promise to pay with vehicle/equipment security (if applicable)
• General Obligation Bonds – entity’s full faith and credit pledged • Revenue Bonds – enterprise fund revenue pledged • Rural and Special Improvement Bonds – assessments pledged

13
City/Town $118.6
County $91.3
State Agency $90.0 Dept of Justice $23.5
University $47.0
School District $41.9
Fire $17.4
Water & Sewer District $15.5 Other $10.8
Community College $6.6 Solid Waste District $5.5
Water District $4.6
Borrower Type through December 31, 2015
Total $472.8 Dollar Figures in Millions
INTERCAP

14 INTERCAP
Bond/Grant/Revenue Anticipation $124.1
Building Construction and Renovation
$97.4 Vehicles $80.3
Computers/Printers $45.6
Land and Road Improvements $31.3
Equipment $31.1
Heating, Cooling, Lighting $25.6
Water/Waste Water $16.3 Other $11.5
Solid Waste $8.5 Preliminary
Engineering $1.2
Project Type through December 31, 2015
Total $472.8 Dollar Figures in Millions

Back to Agenda
APPENDIX

2016 CALENDAR
Board Dates Board Packet Mailing
01 New Year’s Day 18 M.L. King Day
JANUARY S M T W Th F S 1 2
3 4 5 6 7 8 9 10 11 12 13 14 15 16 17 18 19 20 21 22 23 24 25 26 27 28 29 30 31
FEBRUARY S M T W Th F S 1 2 3 4 5 6
7 8 9 10 11 12 13 14 15 16 17 18 19 20 21 22 23 24 25 26 27 28 29
15 Presidents Day
25 Good Friday 27 Easter Sunday
MARCH S M T W Th F S
1 2 3 4 5 6 7 8 9 10 11 12 13 14 15 16 17 18 19 20 21 22 23 24 25 26 27 28 29 30 31
APRIL S M T W Th F S
1 2 3 4 5 6 7 8 9 10 11 12 13 14 15 16 17 18 19 20 21 22 23 24 25 26 27 28 29 30
08 Mother’s Day 30 Memorial Day
MAY S M T W Th F S
1 2 3 4 5 6 7 8 9 10 11 12 13 14 15 16 17 18 19 20 21 22 23 24 25 26 27 28 29 30 31
JUNE S M T W Th F S
1 2 3 4 5 6 7 8 9 10 11 12 13 14 15 16 17 18 19 20 21 22 23 24 25 26 27 28 29 30
19 Father’s Day
04 Independence Day
JULY S M T W Th F S 1 2
3 4 5 6 7 8 9 10 11 12 13 14 15 16 17 18 19 20 21 22 23 24 25 26 27 28 29 30 31
AUGUST S M T W Th F S 1 2 3 4 5 6
7 8 9 10 11 12 13 14 15 16 17 18 19 20 21 22 23 24 25 26 27 28 29 30 31
05 Labor Day
SEPTEMBER S M T W Th F S 1 2 3
4 5 6 7 8 9 10 11 12 13 14 15 16 17 18 19 20 21 22 23 24 25 26 27 28 29 30
OCTOBER S M T W Th F S 1
2 3 4 5 6 7 8 9 10 11 12 13 14 15 16 17 18 19 20 21 22 23 24 25 26 27 28 29 30 31
10 Columbus Day 31 Halloween
08 Election Day 11 Veterans Day 24 Thanksgiving Day
NOVEMBER S M T W Th F S 1 2 3 4 5
6 7 8 9 10 11 12 13 14 15 16 17 18 19 20 21 22 23 24 25 26 27 28 29 30
DECEMBER S M T W Th F S 1 2 3
4 5 6 7 8 9 10 11 12 13 14 15 16 17 18 19 20 21 22 23 24 25 26 27 28 29 30 31
25 Christmas Day

MONTANA BOARD OF INVESTMENTS ACRONYM INDEX
Page 1 M:\Boardmtg\Acronym Index.docx – Rev 10/9/12
ACH ........................................................................................ Automated Clearing House ADR ................................................................................... American Depository Receipts AOF .......................................................................................................... All Other Funds ARC ............................................................................... Actuarially Required Contribution BOI .................................................................................................. Board of Investments CFA ....................................................................................... Chartered Financial Analyst EM .......................................................................................................... Emerging Market FOIA ....................................................................................... Freedom of Information Act FWP .............................................................................................. Fish Wildlife and Parks FX......................................................................................................... Foreign Exchange IPS ....................................................................................... Investment Policy Statement LDI...............................................................................................Liability-Driven Investing MBOH ..................................................................................... Montana Board of Housing MBOI ................................................................................. Montana Board of Investments MDEP ............................................................................... Montana Domestic Equity Pool MFFA ......................................................................... Montana Facility Finance Authority MPEP ................................................................................... Montana Private Equity Pool MPT ............................................................................................. Modern Portfolio Theory MSTA ............................................................. Montana Science and Technology Alliance MTIP ........................................................................................ Montana International Pool MTRP ....................................................................................... Montana Real Estate Pool MTSBA ..................................................................... Montana School Boards Association MVO ..................................................................................... Mean-Variance Optimization

MONTANA BOARD OF INVESTMENTS ACRONYM INDEX
Page 2 M:\Boardmtg\Acronym Index.docx – Rev 10/9/12
NAV .......................................................................................................... Net Asset Value PERS .................................................................... Public Employees’ Retirement System PFL ................................................................................................. Partnership Focus List QZAB .............................................................................. Qualified Zone Academy Bonds QSCB ...................................................................... Qualified School Construction Bonds RFBP ................................................................................... Retirement Funds Bond Pool RFP .................................................................................................. Request for Proposal SABHRS ....................... Statewide Accounting Budgeting and Human Resource System SLQT ............................................................................... Securities Lending Quality Trust SSBCI ..................................................................... State Small Business Credit Initiative STIP ...................................................................................... Short Term Investment Pool TFBP ............................................................................................. Trust Funds Bond Pool TFIP ..................................................................................... Trust Funds Investment Pool TIF .............................................................................................. Tax Increment Financing TIFD ............................................................................... Tax Increment Financing District TRS .................................................................................... Teachers’ Retirement System TUCS ........................................................................ Trust Universe Comparison Service VIX ............................................................................................................. Volatility Index
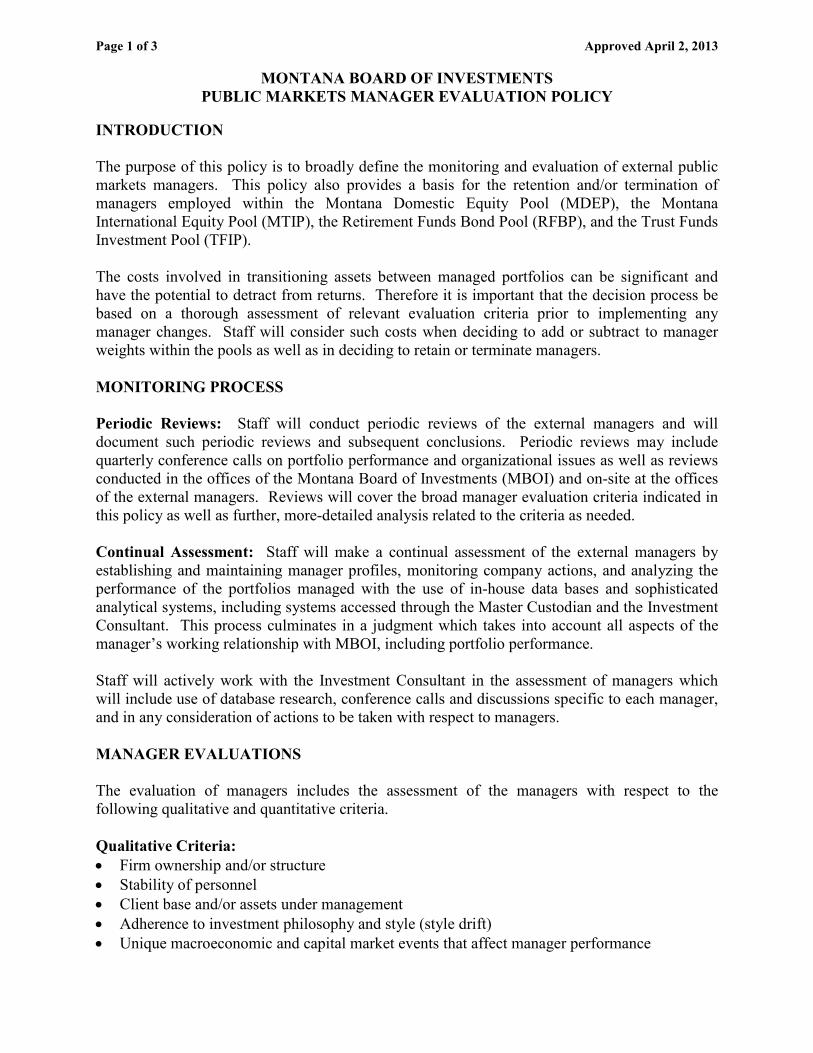
Page 1 of 3 Approved April 2, 2013
MONTANA BOARD OF INVESTMENTS PUBLIC MARKETS MANAGER EVALUATION POLICY
INTRODUCTION The purpose of this policy is to broadly define the monitoring and evaluation of external public markets managers. This policy also provides a basis for the retention and/or termination of managers employed within the Montana Domestic Equity Pool (MDEP), the Montana International Equity Pool (MTIP), the Retirement Funds Bond Pool (RFBP), and the Trust Funds Investment Pool (TFIP). The costs involved in transitioning assets between managed portfolios can be significant and have the potential to detract from returns. Therefore it is important that the decision process be based on a thorough assessment of relevant evaluation criteria prior to implementing any manager changes. Staff will consider such costs when deciding to add or subtract to manager weights within the pools as well as in deciding to retain or terminate managers. MONITORING PROCESS Periodic Reviews: Staff will conduct periodic reviews of the external managers and will document such periodic reviews and subsequent conclusions. Periodic reviews may include quarterly conference calls on portfolio performance and organizational issues as well as reviews conducted in the offices of the Montana Board of Investments (MBOI) and on-site at the offices of the external managers. Reviews will cover the broad manager evaluation criteria indicated in this policy as well as further, more-detailed analysis related to the criteria as needed. Continual Assessment: Staff will make a continual assessment of the external managers by establishing and maintaining manager profiles, monitoring company actions, and analyzing the performance of the portfolios managed with the use of in-house data bases and sophisticated analytical systems, including systems accessed through the Master Custodian and the Investment Consultant. This process culminates in a judgment which takes into account all aspects of the manager’s working relationship with MBOI, including portfolio performance. Staff will actively work with the Investment Consultant in the assessment of managers which will include use of database research, conference calls and discussions specific to each manager, and in any consideration of actions to be taken with respect to managers. MANAGER EVALUATIONS The evaluation of managers includes the assessment of the managers with respect to the following qualitative and quantitative criteria. Qualitative Criteria: • Firm ownership and/or structure • Stability of personnel • Client base and/or assets under management • Adherence to investment philosophy and style (style drift) • Unique macroeconomic and capital market events that affect manager performance
Page 2 of 3 Approved April 2, 2013
MONTANA BOARD OF INVESTMENTS PUBLIC MARKETS MANAGER EVALUATION POLICY
• Client service, reporting, and reconciliation issues • Ethics and regulatory issues • Compliance with respect to contract and investment guidelines • Asset allocation strategy changes that affect manager funding levels Quantitative Criteria: • Performance versus benchmark – Performance of managers is evaluated on a three-year
rolling period after fees. • Performance versus peer group – Performance of managers is evaluated on a three-year
rolling period before fees. • Performance attribution versus benchmark – Performance of managers is evaluated on a
quarterly and annual basis. • Other measures of performance, including the following statistical measures:
o Tracking error o Information ratio o Sharpe ratio o Alpha and Beta
PERFORMANCE MEASUREMENT Performance calculations and relative performance measurement compared to the relevant benchmark(s) and peer groups are based on a daily time-weighted rate of return. The official book of record for performance measurement is the Master Custodian. The performance periods relevant to the manager review process will depend in part on market conditions and whether any unique circumstances are apparent that may impact a manager’s performance strength or weakness. Generally, however, a measurement period should be sufficiently long to enable observation across a variety of different market conditions. This would suggest a normal evaluation period of three to five years. ACTIONS Watch List Status: Staff will maintain a “Watch List” of external managers that have been noted to have deficiencies in one or more evaluation criteria. An external manager may be put on the “Watch List” for deficiencies in any of the above mentioned criteria or for any other reason deemed necessary by the Chief Investment Officer (CIO). A manager may be removed from the “Watch List” if the CIO is satisfied that the concerns which led to such status have been remedied and/or no longer apply. Termination: The CIO may terminate a manager at any time for any reason deemed to be prudent and necessary and consistent with the terms of the appropriate contract.
Page 3 of 3 Approved April 2, 2013
MONTANA BOARD OF INVESTMENTS PUBLIC MARKETS MANAGER EVALUATION POLICY
ROLES AND RESPONSIBILITIES CIO: The CIO is responsible for the final decision regarding retention of managers, placement on and removal of “Watch List” status, and termination of managers. Staff: Staff is responsible for monitoring external managers, portfolio allocations and recommending allocation changes to the CIO, and recommending retention or termination of external managers to the CIO. Investment Consultant: The consultant is responsible for assisting staff in monitoring and evaluating managers and for reporting independently to the Board on a quarterly basis. External Managers: The external managers are responsible for all aspects of portfolio management as set forth in their respective contracts and investment guidelines. Managers also must communicate with staff as needed regarding investment strategies and results in a consistent manner. Managers must cooperate fully with staff regarding administrative, accounting, and reconciliation issues as well as any requests from the Investment Consultant and the Custodian.
RECOMMENDED EDUCATIONAL RESOURCES FOR MEMBERS OF THE MONTANA BOARD OF INVESTMENTS
August 2015

RECOMMENDED EDUCATIONAL RESOURCES
2
RVK Resources Publication Cost Link Description
RVK Quarterly Commentary Free www.rvkuhns.com
Each quarter, RVK publishes a brief commentary that provides a high level overview of key macroeconomic events, as well as a performance summary for major asset classes. The commentary provides a quick reference for Board members, who wish to better understand the most important market events prior to each quarterly meeting.
RVK Investment Perspectives Free www.rvkuhns.com
Each quarter, RVK publishes a white paper covering topics of common concern for our clients. If Board members wish to receive future issues proactively, RVK can add their email addresses to a distribution list. Alternatively, the white papers can be downloaded from the RVK site.
Investment Committee Best PracticesNEW
Free for RVK
Clients Only
Copies Provided on Request
This 60-page study is the culmination of a one-year research effort, which involved an exhaustive literature review, completion of several surveys of investment professionals, and interviews with more than 30 investment committee chairs, staff, and industry thought leaders. The primary reason for producing this study was to address the fact that many investment committees face similar operational and strategic challenges, but are unable to address them collectively because they tend to operate in silos. This study is intended to accelerate improvement efforts by revealing these common challenges and sharing key insights, tactics, and case studies that may help resolve them.
Electronic Newsletters Newsletter Cost Link Description
CFA Financial Briefs Free https://www.smartbrief.com/cfa/index.jsp
Each day, this newsletter compiles the most notable headlines relating to economics, investment management, and major geopolitical events. Each headline has a link to the underlying article. This email serves as the daily newspaper for many in the investing community.
JPMorgan Eye on the Market Free Send Email Request to
Eye on the Market is released 2-3 times per week and provides in depth analysis on events shaping the global economy. The content is typically more balanced than John Mauldin’s letter, but should be viewed with some skepticism given the role of JPMorgan as an asset manager.

RECOMMENDED EDUCATIONAL RESOURCES
3
Periodicals Periodical Cost Link Description
Pensions & Investments $325/Year www.pionline.com
Pensions and Investments is a bi-weekly publication that covers current events impacting defined benefit plans. The PI Online web site also provides a variety of research reports and databases to support the decision-making of defined benefit plan staff and board members.
The Economist $134/Year www.economist.com
The Economist is perhaps the most respected source of reporting and analysis on current events shaping the global economy. The Economist can help staff and board members stay familiar with the key factors and events that impact the performance of the portfolio.
Institutional Investor $575/Year https://www.institutionalinvestor.com
Institutional Investor provides a monthly magazine that serves as both a source of news and proprietary research. A subscription also provides varying degrees of access to proprietary data and research online. Subscriptions range from $575/year to $1,680/year depending on the desired level of access to online resources. We believe that the online research capabilities are most relevant to staff, and therefore would only recommend the $575 “silver” package for Board Members.
FundFire MBOI
already subscribed
http://www.fundfire.com/
FundFire is a source of competitive intelligence for the separately managed account industry. A subscription provides access to original articles and summaries of industry news which helps investors, managers and consultants stay abreast of the changes in their industry. Investment managers read FundFire to find out what competitors and prospective clients are doing and thinking. Financial advisors, investment consultants, pension plans, endowments and foundations rely on FundFire to power their money management IQ.
Books Book Cost Link Description
Pioneering Portfolio Management $24 http://tinyurl.com/3sa4
c4u
This book was written by David Swensen, the Chief Investment Officer of the Yale Endowment. The book provides a blue print for Mr. Swensen’s investing strategy, which has resulted in superior long term returns for decades. While the book is especially applicable to university endowments, many of the insights are relevant to public pension funds.

RECOMMENDED EDUCATIONAL RESOURCES
4
Book Cost Link Description
The Little Book of Behavioral Investing $16 http://tinyurl.com/3dya
98f
This book was written by a senior investment professional at GMO, a global asset management firm led by renowned investor Jeremy Grantham. The book provides a comprehensive overview of common behavioral biases that can negatively impact the investment decision-making process. The lessons are easily comprehensible to both expert and novice investors.
Cambridge Handbook of Institutional Investment and Fiduciary Duty
$135 http://tinyurl.com/nwegkvq
This book provides commentary and guidance on the evolving standards governing institutional investment. It features a wide range of contributors who share their perspectives on the forces that drive the current emphasis on short-term investment returns. This book is not yet available, and appears to be more academic in focus. However, it covers fiduciary duty in great detail, and may be a great resource for new and existing board members.
1
Terminology Commonly Used and Generally Understood at the Montana Board of Investments (And most typical context used at BOI)
Active management (typically with respect to stocks) Investment method which involves hiring a manager to research securities and actively make investment decisions to buy and sell securities in an effort to outperform an assigned index, rather than purchasing a portfolio of securities that would simply replicate the index holdings (‘passive’ investing). Actuarial assumed rate (pension concept) The investment return rate used by actuaries that enables them to project the investment growth of retirement system assets into the future (typically perpetual). Actuarial funding status (pension concept) A measurement made by actuaries to measure a pension system’s financial soundness (ratio of actuarial liabilities to the actuarial value of the assets available to pay the liabilities). Alpha (investment term) Return on an investment portfolio in excess of the market return or benchmark return; generally used in the context of ‘active’ management (as passive management, by definition, does not seek excess returns, or ‘alpha’). Alternative Investments A wide range of investments, other than traditional assets such as publically traded stocks and bonds. The most common nontraditional or alternative investments are private equity, real estate, commodities, and hedge funds. Arbitrage (bond program) A structural or systematic difference between investment types which may allow profiting from the ‘difference,’ i.e., arbitrage. The most common context for the use of ‘arbitrage’ at the BOI is the federal law that prevents ‘arbitrage,’ i.e., the profiting of investing tax-exempt securities (e.g. INTERCAP) into taxable yields investments (such as U.S. Treasuries). Asset Allocation and Asset Allocation Range (general investment principle) The Board’s invested assets are divided or allocated into various asset classes such as stocks and bonds, each with its own characteristics, with the objective of attaining an optimal mix of risk and return. The total expected return of a portfolio is primarily determined by the mix or allocation to its underlying assets classes. Given the importance of ‘asset allocation,’ the BOI Board sets the asset allocation ‘range’ for each broad investment type or asset class. Average life (fixed income, particularly bonds) The average time period the debt is expected to be outstanding. This is typically the maturity date for a traditional bond structure, however it will be shorter for bonds having a sinking fund or amortizing payment structure. Barclay’s Aggregate Index (fixed income) A composite of outstanding bond issues, including corporate, structured, and government bonds whose overall investment features such as return and investment type are tracked over many years. This is the most common benchmark used for comparing the performance of a portfolio that invests in U.S. investment grade fixed income securities. Formerly known as the Lehman Aggregate bond index. Basis points (investment jargon) A basis point is 1 100th of a percentage. Ten basis points is one tenth of a percent, typically written as 10 bps.
2
Benchmark (standard investment concept) The concept of employing a particular independent or market investment return as a measurement to judge an investment portfolio’s return; typically chosen investment benchmarks have the following attributes: they are investible, quantifiable, chosen in advance, easily understandable, and have a long history; common examples are the S & P 500 Index and the Barclay’s Aggregate Index. Beta (investment jargon) A measure of the risk (or volatility) of a security or a portfolio in comparison to the market as a whole. If the stock or portfolio moves identically to that market, its beta value is 1; if its price volatility (or movement) is greater than that market’s price volatility, it is said to have beta greater than 1. Cap, as in large ‘cap’ (generally for stocks, i.e., public equities) ‘Cap’ is short for capitalization, as a reference to the market value of a publically-traded company. The current stock price times the total shares outstanding of the company equals its market capitalization or market ‘cap’; often used contextually such as ‘large-cap,’ ‘mid-cap,’ and ‘small-cap’ for different sized public companies. Clawback (private equity) A clause in the agreement between the general partner and the limited partners of a private equity fund. The clawback gives limited partners the right to reclaim a portion of distributions to a general partner for profitable investments based on significant losses from later investments in a portfolio which ultimately resulted in the general partner receiving more distributions than it was legally entitled to. Core (context varies for equity, fixed income, real estate) In equity and fixed income, ‘core’ refers to investments that are generally always found in the portfolio and normally expect to hold for a very long time e.g. ‘core’ holdings of the largest U.S. companies, or U.S. treasuries; in real estate, ‘core’ generally refers to the best quality of real estate holdings such as prime commercial property in major metropolitan cities that have low leverage and low levels of vacancy. Correlation (common statistical concept) A measure of how two or more investment values or two asset classes move relative to each other during the same time period. A central concept in portfolio construction is to seek investments whose values do not move together at the same time, i.e., are uncorrelated. A correlation of 1 means that two or more investments ‘move’ precisely together. Custom benchmark (or sometimes custom index) A way to measure investment performance using a tailor-made measurement versus a generic industry-standard benchmark. At the BOI, total pension performance is measured against the Board’s ‘custom index’ or ‘custom benchmark’ which is a weighted blend of all the underlying asset class benchmarks used to measure the asset class returns. Derivatives (investment jargon) Investment securities whose performance itself depends (or is ‘derived’) from another underlying investment return. Examples include stock options, puts/calls, and forward currency contracts whose returns are based on the underlying stock or currency. Developed markets (equity) Countries having a long period of stable industrialization; or are the most economically developed. Discount (fixed income, generally) Used most often with respect to bonds, the price paid that is less than face (or ‘par’) value. A $1 million face-value of a bond purchased for less than a million is bought at a ‘discount.’ Described as the difference between a bond’s current market price and its face or redemption value.

3
Diversification (standard investment concept) The concept of spreading risk by putting assets in several investment categories, each having different attributes with respect to type, expected return, risk, and correlation, to best protect against the risk of loss. Duration (bonds) Almost exclusively used when discussing fixed income bonds, a measurement of how sensitive a bonds’ change in price is to a change in general market interest rates, expressed in years (specifically calculated as a weighted average term to maturity of the bond’s cash flows). The greater the duration of a bond, the greater the volatility of price for changes in market interest rates. Efficiency (usually when discussing various stock markets) Used to describe markets where it is very difficult to achieve return in excess of that of the overall market from individual stock selection. When information is widely available on a company and its securities are traded regularly the market is considered ‘efficient.’ Emerging Markets (most often for public equities) Certain international securities markets that are typically small, new, have low turnover, and are located in countries where below-average income prevails and is developing in response to the spread of capitalism. Enhanced (pertaining to stocks) Generally linked with ‘index’ as in enhanced index, an indexed investment management style that has been modified to include the portfolio manager’s idea of how to outperform the index by omitting some stocks in the index and overweighting others in a limited manner designed to enhance returns but at minimal risk. Enhancement (bond program) At BOI, the term generally refers to credit support or a bond or loan guarantee. For example the Board’s INTERCAP bonds are ‘enhanced’ by the BOI’s performance guarantee bringing down the yearly interest rate. Excess returns (standard investment concept) Returns are ‘excess’ if they are more than the market or more than the benchmark they are measured against. Exempt staff vs. classified staff (specific to Montana state government) “Exempt” refers to the Board’s seven employees who, under state law, do not fall under the state’s standard employment rules (the ‘classified’ staff). Fiduciary (from the Latin verb, fidere, to trust) The concept of trust and watchfulness; a fiduciary is charged with the responsibility of investing the money wisely for the beneficiary’s benefit. Board members are the ultimate ‘fiduciaries’ for the Board’s assets and are obligated to be a good agent. FTE (state government jargon) An acronym in state government: “full time equivalent” as in full time employee. The concept is a slot or position, not the actual individuals. The BOI is currently authorized for 32 FTE’s. Fund of funds (private equity) A concept used in alternative investments referring to using an investment manager to invest in other managers or funds, as opposed to making direct investments in funds. GAAP/GASB (accounting terminology) GAAP…Generally Accepted Accounting Principles; Montana state law uses GAAP accounting principles unless specifically allowed otherwise. GASB…Government Accounting Standards Board, the board that sets GAAP

4
standards for U.S. governments (FASB…Financial Accounting Standards Board, the entity for commercial and business accounting standards). General obligation (municipal finance term) Used to describe the promise that a government makes to bond holders, backed by taxing and further borrowing power, it is generally considered the highest level of commitment to bondholders. At the local government level, general obligation bonds typically require a vote of the residents. General partner vs. limited partner (private equity) In private equity, the general partner is responsible for the operations of the partnership and makes the actual underlying investment decisions; the limited partner is the investor, and therefore has limited liability for investment decisions; the BOI is the ‘limited’ partner in its private equity fund investments (and real estate funds as well). Growth (as to style public equities) An investment style that more heavily invests in companies whose earnings are expected to grow at an above average rate to the market. A growth stock usually does not pay a dividend, as the company would prefer to reinvest retained earnings in capital projects to grow the company (vs. ‘value,’ which considers buying established companies they feel are trading at bargain prices to the fundamental analysis of the company’s financial statements and internal competitive factors). Indenture (bond and loan programs) The central document describing the contract between investors and the borrower or user of the proceeds. The Board’s INTERCAP program is structured around a bond indenture.
Hedge fund (as defined by Investopedia) An aggressively managed portfolio of investments that uses advanced investment strategies such as leverage, long, short and derivative positions in both domestic and international markets with the goal of generating high returns (either in an absolute sense or over a specified market benchmark). Hurdle Rate (private equity) a minimum return per annum that must be generated for limited partners of a private equity fund before the general partner can begin receiving a percentage of profits from investments. Index (investment concept) Typically a single measure of a broadly-based group of investments that can be used to judge, or be compared to the return performance of an individual investment or manager. Indexing (investment concept) Typically refers to investing in a portfolio to match a broad range of investments that are set within a pre-determined grouping, such as the S&P 500, so as to match its performance; such investing is generally labeled ‘passive’ or indexed investing; or buying shares in an Index Fund. In-state loan program (Montana-specific) Programs that are funded by the state’s coal severance tax monies. Internal service vs. enterprise fund (state accounting concept) Within Montana state government: a program whose funding is dependent on mandatory participation by another state government program is labeled an ‘internal’ service fund; a program whose funding is dependent on voluntary participation is labeled an enterprise fund. At BOI, the investment program is an internal service fund because participation is not voluntary; the Board’s bond and loan programs, because their use is voluntary, are accounted for as an enterprise.

5
Investment grade (bonds) Bond ratings from Moody’s, Standard and Poor’s, and Fitch high enough to be considered secure enough for most investors (bonds rated AAA – BBB). Below investment-grade bonds (below BBB) are generally considered to have a more speculative outlook and carry more risk of default. IRR (private equity) A measure of investment performance, short for ‘internal rate of return,’ expressed as a percentage (the ‘internal rate of return’ number, or discount rate) that mathematically will equalize the total future cash flows of an investment to the initial cash outflow of the investment; the concept accounts for the time value of money. Leverage (investment concept) As an investment concept, a way to increase a return on an investment through a combination of one’s own money and also by borrowing additional money to enhance such an investment; high ‘leverage’ is also associated with high risk. Mean Variance Optimization Model (‘Modern Portfolio Theory’) A theory that it is possible to construct a portfolio to maximize the return for the least amount of risk or volatility. This theory is based on various asset types and their level of expected return, risk (volatility) and their correlation with each other or how the asset values move with each other. The central idea of the model is to blend investments so that in total, they provide both the best expected return and optimal amount of diversification to minimize deep performance swings (volatility); a central tenant is that long term historical returns are indicative of future returns. Mezzanine finance (private equity) Subordinated debt with an equity ‘kicker’ or ability to share in the equity value of the company. It is typically lower quality because it is generally subordinated to debt provided by senior lenders such as banks, thus is considered higher risk. Multiple (as in “multiple” of invested capital, private equity) The ratio of total cash returned over the life of the investment plus the investment’s residual value over the total cash expended in making the investment. A multiple of 2 means, regardless of the total investment time period, that total cash returned was twice the cash invested. 130/30 Strategy (public equities) Also called ‘partial long short,’ this strategy involves the establishment of a short position in select stocks while taking the proceeds of those shorts and buying additional long positions in stocks. The net effect is an overall market position that is 100% long, but the active decisions on individual stock selections are amplified by this ability to short. If the stock selections are successful, the strategy enables the portfolio to profit more than if a stock had simply not been owned, as with traditional long-only portfolios. Opportunistic (real estate) In real estate, a euphemism for the most risky real estate investments, typically distressed, raw land, newly developed buildings or other high risk investments in the real estate sector, (versus, ‘core,’ which are the best quality fully leased commercial properties). Overweight or underweight (investment concept) Generally the level of holdings of a certain type of investment that is above or below either a benchmark’s weight (portion of total investment), or the percentage held of a particular asset class compared to the Board’s asset allocation policy weight. Also used to describe an external investment manager’s decision to have more (or less) of a particular investment than the percentage or weighting found in the benchmark.

6
Passive management or passive investment (most often in public equities, but not exclusively) An investment style where a fund’s portfolio mirrors a market index, such as the S&P 500, with limited selection decisions by the manager, resulting in market returns. Passive management is the opposite of active management in which a fund’s manager attempts to beat the market with various investment strategies and buy/sell decisions of a portfolio of securities to enhance returns. P/E ratio (equity) The price of a publically traded stock divided by its estimated or actual earnings is the price/earnings or P/E ratio. This can also be calculated for a stock index or portfolio of stocks. Over the last 100 years, the S&P 500 has had an overall P/E ratio of about 15, or a total index price of about 15 times the annual earnings of its underlying companies. Pacing study (private equity) An analysis of the likely timing and amount of the drawdown of committed but yet uninvested monies and the estimated distributions or returns from the funds held in an alternative investment portfolio, generally used to judge the future size of the portfolio and its potential liquidity needs, i.e., cash funding demands. Par (fixed income) The initial principal amount designated by the issuer of the bond, or face value of a bond. Passive For investments, generally not materially participating in an investment decision, meaning an investment portfolio whose returns follows that of a broad market index, such as an investable stock index, i.e. the S & P 500. Passive weight (generally equities) The percentage of a stock held in a particular index portfolio, or percentage of an overall asset class that is held in passive portfolios. Policy Portfolio A fixed-target asset allocation, as opposed to asset allocation ranges, which theoretically allows gauging whether deviations from the target portfolio had a positive or negative impact on overall performance. Portable alpha (public equities) An investment strategy which involves the active selection of securities while neutralizing overall beta or market risk. This often involves the use of derivative investments such as futures to replicate the market return, either taking a short or long position, while then selecting securities which are expected to add return in an absolute sense or in addition to the market return. As an example, this strategy can be found with certain hedge funds where a market exposure is shorted while individual securities such as specific stocks are purchased that are expected to outperform the general market. The concept of portable applies when the ability to generate positive alpha can be overlaid or ported onto a portfolio. This is not a strategy employed by any of MBOI’s existing managers. Premium (fixed income) Most often the amount paid over the stated face amount (often called ‘par’) of a bond, but also used in other contexts, typically paying more (the premium) than a market price (as in a take-over bid for a company). Proxy (publically traded companies) An agent legally authorized to act on behalf of another party. Shareholders not attending a company’s annual meeting may choose to vote their shares by proxy by allowing someone else to cast votes on their behalf, but the word ‘proxy’ is used more frequently colloquially as a ‘close approximation.’
7
Prudent expert, prudent person (a central fiduciary concept) These legal terms have long histories of court-determined standards of care, deriving originally under English common law. The BOI is empowered to operate under the ‘prudent expert rule,’ which states that the Board shall manage a portfolio: a) with the care, skill, prudence, and diligence, under the circumstances then prevailing, that a prudent man acting in a like capacity and familiar with such matters would use in the conduct of an enterprise of a like character and with like aims; b) diversify the holdings of each fund within the unified investment program to minimize the risk of loss and to maximize the rate of return unless, under the circumstances, it is clearly prudent not to do so; and (c) discharge the duties solely in the interest of and for the benefit of the funds forming the unified investment program. At an ‘expert’ level; there is more room for accepting risk under the prudent expert rule than the prudent person rule. Rebalancing (general investment term) The process of realigning the weightings of the portfolio of assets. Rebalancing involves periodically buying or selling assets in the portfolio to maintain the original desired level of asset allocation and/or to stay within predetermined asset category range; it is part of a disciplined investment approach within modern portfolio theory. Resolution (government term) Generally a formal and written action by a governmental (or corporate) body that has long term significance and requiring a vote of the governing body. BOI uses ‘resolutions’ generally only for its most significant and long term actions and/or policies. Securities lending (general investment) Investments that are temporally borrowed by other investors for a fee; the BOI allows most of its publically traded investments to be loaned for additional marginal income. Standard deviation (common statistical concept) A specific statistic that measures the dispersion of returns from the mean over a specific time period to determine the “historical volatility” of returns for a stock, or portfolio, or asset class; more specifically a single unit (i.e., one standard deviation) of dispersion that accounts for approximately 66% of all data around a mean using a ‘normal’ (or ‘uniform’ or ‘bell-shaped’ curve; as opposed to a skewed or asymmetrical) distribution. The standard deviation is used as a gauge for the amount of expected future volatility. SABHRS (accounting jargon) Montana state government’s State Accounting, Budgeting and Human Resource System; the State’s central information management system. BOI investment and other financial data must tie and be reported on this system, which is the official book of record and includes the state’s financial statements. Style drift (often in reference to public equity managers, but applicable to other managers, too) As the name implies, a divergence from an investor’s professed investment bias or style or objective. Tracking error (statistical concept in investments) A measurement of the standard deviation of a portfolio’s return versus the return of the benchmark it was attempting to outperform. The concept is often used when discussing investment managers. For example some styles are expected to have high ‘tracking errors,’ (e.g., deep ‘value’ investors who buy companies that may be dogs for years), versus passive managers, whose stock volatility is expected to be very close to their benchmark. Tracking error can either be intentional or unintentional; it can also be regarded as an accepted deviation or contrary to the management agreement. High unexpected tracking error is generally a serious concern to be examined and understood.

8
Underwriter (bond program) In investments, the agent who buys investments to be resold to the public; at BOI, the investment firms that buy the Board’s bonds to be resold to the public. Unified Investment Program (Montana Constitution) The Program in the State’s constitution requiring a central investment program which the legislature has assigned to the BOI. Value (as to style when discussing public equities) An investment style that focuses on buying established companies that investors believe are undervalued and trading at bargain prices to the fundamental analysis of the company’s financial statements and internal competitive factors. Venture capital (private equity) A higher-risk/high-return type of investing in startup firms and small businesses with perceived long-term growth potential. Sometimes these are already existing business ventures with limited operating history that need additional management expertise and access to capital. (For start-ups, ‘seed capital,’ or ‘angel investor’ are terms differentiating this even higher risk type of investment.) Volatility (investment jargon) A statistical measure of the dispersion of returns for a given security or market index. Volatility is typically measured by using the standard deviation of returns from the security or market index. Commonly, the higher the volatility, the riskier the security. Yield (general investment, but most often within fixed income) The amount returned to the investor above the original investment generally expressed as a percentage. Yield can be thought of as the expected return from the combination of interest and price accrual or amortization to maturity (in the case of a bond trading at a discount or premium to par). Yield curve (fixed income) A line that plots the prevailing interest rates at a given time for bonds ranging in maturity from as short as three months out to 30 years. When plotted across these various maturities (typically 2, 5, 7, 10 and 30 years), the resultant line is shaped like a curve with generally low interest rates (the yield) for shorter maturities and gradually higher interest rates for longer maturities, because generally investors demand higher interest rates for longer term investments. The yield curve for U.S. Treasury debt is the most common when referring to the prevailing level of interest rates.

Systematic Work and Education Plan 2016
Feb. 23-24 Quarterly Meeting Quarterly reports and subcommittee meetings Annual Report and Financial Statements - reception and status Financial Audit Ethics INTERCAP program Outreach efforts – loan and municipal programs
April 5 Non-Quarterly Meeting All policy review, scrub and revise Cash management of state monies Disaster recovery Capital market/asset allocation overview RVK presentation (TBD)
May 24-25 Quarterly Meeting Quarterly reports and subcommittee meetings Exempt pay compensation review Domestic equities International equities Staffing level review Custodial banking relationship
August 16-17 Quarterly Meeting Quarterly reports and subcommittee meetings CEM Benchmarking MBOI Budget and legislative-related action-decision Internal Controls Private Equity Fiscal Year performance through June 30th
RVK presentation (TBD)
October 4 Non-Quarterly Meeting TBD
Nov. 15-16 Quarterly Meeting Quarterly reports and subcommittee meetings Annual report and Financial Statements Submission for FY 2016 Affirm or Reset Asset Allocation Real Estate and Timber Resolution 217 Resolution 218 PERS/TRS annual update 2017 Legislative Session issues Securities litigation status Proxy voting public equities Exempt staff annual performance review

Completed Completed Completed In Process
2013 2014 2015 2016X X Accounting Review
X X X X Annual report and financial statements X X X X Asset Allocation Range Approval (Board must review/approve annually as per policy)X X X Capital Market/Asset AllocationX X X X Audit (Financial)X X Benchmarks used by BoardX X Board as a rated investment credit, a bond issuer and a credit enhancer X X X X Board member education X X X X Board’s budget X X Board as landlord/tenant holdingsX X Board’s website
X X Cash Management of state moniesX X X X Cost reporting including CEM, Inc. analysis
X X Custodial bank relationship, performance, continuityX X Customer relationships (State government)X X X Disaster Recovery and other emergency preparednessX X X X Exempt staff performance and raises (HR policy requires annual consideration)X X X X Ethics policy – (Board policy requires annual affirmations)X X Fixed IncomeX X In-state Loan program
X X INTERCAP programX X X X Internal controlsX X X X Policy Statements Review (Governance policy requires annual investment policy review)X X X X Legislative session and interim mattersX X X Outreach efforts for Board - loan and municipal programsX X X X PERS and TRS relationship
X X Private EquityX X Proxy voting public equitiesX X Public Domestic EquitiesX X Public International EquitiesX X Real Estate and timberland
X X X X Resolution 217 update of current Investment Firms (Board policy requires annual update)X X X X Resolution 218 role of deputy director to serve as acting executive if necessaryX X Securities LendingX X X X Securities LitigationX X X X Staffing levels (required biannually in board policy)X X State Fund as major client
24 Month Systematic Work and Education Plan 2016