REGULAR Meeting Location: Agenda · Kennision, Julian Freund, David Reyes, Bill Plummer . I. Call...
113
STATE OF CONNECTICUT MUNICIPAL ACCOUNTABILITY REVIEW BOARD REGULAR MEETING NOTICE AND AGENDA Meeting Date and Time: Thursday, September 19, 2019 10:00 AM –12:00 PM Meeting Location: Legislative Office Building, Hearing Room 1A, 300 Capitol Ave, Hartford, CT Agenda I. Call to Order & Opening Remarks by Secretary Melissa McCaw and Treasurer Shawn Wooden II. Public Comment* Period III. Approval of Minutes: a. August 1, 2019 Regular Meeting b. August 29,2019 Special Meeting IV. City of Hartford Issues and Items a. Subcommittee update b. Review and discussion: Monthly Financial Report July 2019 c. Review, discussion and possible action: Labor contracts: i. Support Supervisors Association (Board of Education) d. Review and discussion: Non-labor contracts i. Cybersecurity V. City of West Haven Issues and Items a. Subcommittee update b. Review and discussion: October BAN issue c. Review and discussion: Monthly Financial Report July 2019 d. Review and discussion: Non-Labor contracts i. Special Ed Transportation (BOE) ii. Revaluation e. Update: MOA compliance f. Update: State Partnership Plan VI. Town of Sprague Issues and Items a. Review and discussion: Monthly Financial Report July 2019 b. Update: MOA
Transcript of REGULAR Meeting Location: Agenda · Kennision, Julian Freund, David Reyes, Bill Plummer . I. Call...

STATE OF CONNECTICUT
MUNICIPAL ACCOUNTABILITY REVIEW BOARD
REGULAR MEETING NOTICE AND AGENDA
Meeting Date and Time: Thursday, September 19, 2019 10:00 AM –12:00 PM
Meeting Location: Legislative Office Building, Hearing Room 1A, 300 Capitol Ave, Hartford, CT
Agenda
I. Call to Order & Opening Remarks by Secretary Melissa McCaw and Treasurer Shawn Wooden
II. Public Comment* Period
III. Approval of Minutes:
a. August 1, 2019 Regular Meeting
b. August 29,2019 Special Meeting
IV. City of Hartford Issues and Items
a. Subcommittee update
b. Review and discussion: Monthly Financial Report July 2019
c. Review, discussion and possible action: Labor contracts:
i. Support Supervisors Association (Board of Education)
d. Review and discussion: Non-labor contracts
i. Cybersecurity
V. City of West Haven Issues and Items
a. Subcommittee update
b. Review and discussion: October BAN issue
c. Review and discussion: Monthly Financial Report July 2019
d. Review and discussion: Non-Labor contracts
i. Special Ed Transportation (BOE)
ii. Revaluation
e. Update: MOA compliance
f. Update: State Partnership Plan
VI. Town of Sprague Issues and Items
a. Review and discussion: Monthly Financial Report July 2019
b. Update: MOA
c. Update: September BAN issue
d. Update: Audit and corrective action plan
e. Update: Vacant positions
VII. Adjourn
*Public Comment (from Board’s Adopted Policies and Procedures): The MARB may provide for a public
comment period on its board meeting agendas. When a public comment item is on the agenda, there
shall be sign-up sheet provided at least 15 minutes prior to the meeting. The speakers will be called in
the order that they signed up, but the MARB may reserve the first 10 minutes of the public comment
period for state and local elected officials. Each speaker may be limited to no more than three minutes.
In the interest in enabling members of the public to attend board meetings for their full duration, the
Chairperson may limit the public comment agenda item to 30 minutes.
1
DRAFT STATE OF CONNECTICUT
MUNICIPAL ACCOUNTABILITY REVIEW BOARD (MARB)
REGULAR MEETING MINUTES
Meeting Date and Time: Thursday, August 1, 2019 10:00 AM – 1:00 PM
Meeting Location: Board of Regents Conference Room, 61 Woodland Street, Hartford, CT
Members in Attendance: Secretary Melissa McCaw, Deputy State Treasurer Linda Savitsky (for Treasurer via telephone attendance at 10:15 a.m.), Mathew Brokman, Patrick Egan, Stephen Falcigno, Scott Jackson, Sal Luciano, Mark Wzxenberg, Bob White, and David Wright-Biller
Staff and Others Present: Luke Bronin (Mayor of Hartford) and staff, Cathy Osten (First Selectman of Sprague) and staff, Nancy Rossi (Mayor of West Haven) and staff, Michael Milone (OPM liaison), OPM Staff – Kim Kennision, Julian Freund, David Reyes, Bill Plummer
I. Call to Order & Opening Remarks The meeting was called to order by Secretary McCaw at 10:01 AM. She welcomed the attendance in today’s meeting of Mr. David Wright-Miller, who had been appointed by Senator Fasano to replace Mr. David Walker on the MARB.
II. Public Comment Melissa Ziobron introduced herself as the budget director of the senate republican caucus. She had the following requests for the Board: (1) In regard to the July 5th Sprague subcommittee report, it was indicated that a legal review had occurred but there was no mention as to who prepared or provided the legal review. She is seeking additional information in regard to the legal review. (2) Ms. Ziobron would like the MARB meetings to be listed on the Connecticut General Assembly calendar. (3) In reviewing the minutes of an earlier meeting regarding the Town of Sprague, Item number C - Conditions for Funding, there was a response from Mr. Bye in regard to a question regarding funding. My Bye indicated that the OPM Secretary had wide discretion in providing funding that relates to a specific statute. She is requesting that the specific statute be provided. III. Approval of minutes July 12, 2019 minutes: Secretary McCaw remarked that Mayor Rossi had previously requested that the minutes of the July 12th meeting reflect her attendance at the meeting by phone and that this adjustment was reflected in the July 12th minutes provided in today’s meeting packets. The minutes to the July 12th meeting with the noted adjustment was unanimously approved.
IV. Subcommittee Membership Mr. Freund referred Board members to the handout in today’s meeting with the three tables identifying
the current membership of the 3 subcommittees. He commented that the bylaws do not directly address the process of appointments or changes to membership of the subcommittees. Upon discussion with Gareth Bye, it was decided to have an open enrollment period over the November and December time

2
period for board members to seek a change or be appointed to a new subcommittee effective on January 1st of 2020 for that calendar year and use that process going forward on an annual basis. He indicated that Mr. Falcigno would be filling the vacant opening on the West Haven subcommittee.
V. City of Hartford issues and Items a. Review and Discussion of Monthly Financial Report – June, 2019 Mayor Bronin introduced himself and budget director, Jolita Lazauskas. He indicated that the fiscal year 2018-19 records of the City have not been closed and that certain accruals for fiscal year 2018-19 are still being done, but he believes that the City is on course to set aside the funding for FY 2018-19 for capital expenditures and vehicle replacements that was indicated in the City’s plan. Ms. Lazauskas proceeded to provide a summary of the City’s General Fund budget vs. actual results through June 30, 2019. She indicated that actual revenues equaled or exceeded the amounts budgeted except in the area of property taxes. With the estimated $1 million in anticipated accruals, property taxes are estimated to approximate $279 million for June. (Note: the document provided by the City indicated that the City had estimated approximately $284 million in property tax collections.) She went on to describe a number of areas where actual revenues exceeded the amounts budgeted. She also described several expenditure categories where actual expenditures were less than budgeted amounts and the areas of expenditures where actual expenditures exceeded the amounts budgeted. Overall, the City is projecting on a budget basis, a General Fund surplus of $3.5 million for FY 2018-19 after accruals have been recorded. Secretary McCaw indicated that in previous meetings Ms. Lazuskas had indicated that one of the reasons for the favorable surplus variance in full-time salaries was as a result of vacancies currently being carried by the City. She inquired with Mayor Bronin if the City had a recruitment strategy in filling those critical areas where there were a significant amount of vacant positions. Mayor Bronin confirmed that the City has been implementing its recruitment strategy and described the areas of vacancies which were of the highest priority and what the City was currently doing to fill those positions. He also indicated that in regard to the police force, there are anticipated vacancies from retirements and therefore the City is implementing recruitment and training strategy of new police officers in a responsible way by planning for three classes of recruits by the upcoming year. Secretary McCaw inquired whether she could assume that the over-expenditure reflected in the City’s overtime payroll was as a result of the staffing shortages in the police and public works department. Mayor Bronin indicated that her assumptions were correct. Mayor Bronin answered various questions from Board members regarding economic development projects and capital projects. Mr. White requested that a discussion of economic development be put on the Hartford subcommittee agenda. Secretary McCaw indicated that it would be done. Mr. Jackson remarked that CRDA would have a role in different economic development projects and therefore it may be useful for that organization to attend the subcommittee meeting. Mr. Egan remarked that it would be beneficial to the subcommittee and committee that any multi-year economic development plan that the City currently has be submitted to both committees. Secretary McCaw indicated that she was pleased with the projected FY 2018-19 results. The report indicates the City’s ability to comply with the 5-year plan approved by the Board and the goal that was set to build upon fund balance. It appears that the City will meet its capital plan without borrowing and build upon its reserves. She commended the City for its 2019 results. b. Review and Discussion of Non-Labor Contracts
i. Aetna Parking Agreement - Renewal
3
ii. Blue Hills Civic Association – Renewal (North End Senior and Wellness Center)
iii. Catholic Charities Archdiocese – Renewal (South End Senior Wellness Center)
iv. Community Renewal Team – Renewal (McKinney Homeless Shelter)
v. DATTCO – Renewal (Dial-a-Ride program)
vi. Hispanic Health Council – Renewal (Maternal Infant Outreach Program)
vii. Purchase of Fire Apparatus Mayor Bronin and his staff described a list of non-labor contracts that are currently up for renewal and the contract regarding the purchase of fire apparatus. He and his staff answered a number of questions on those contracts posed by board members. Mr. Waxenberg requested that the City provide to the subcommittee trend data on the usage of services under the various contracts. The Mayor indicated he would be glad to assemble that data for the subcommittee.
VI. Town of Sprague Issues and Items Senator Osten and her staff introduced themselves to the Board.
a. Review and discussion: Monthly Financial Report June 2019 Mr. Freund provided a summary of the FY 2018-19 budget results through June of 2019. The Town is projecting a budget surplus of approximately $300 thousand due in large part to the sale of scrap metal derived from property foreclosed upon by the Town.
b. Review, discussion and possible action: FY 2020 Budget Senator Osten answered various questions posed by Board members regarding the FY 2019-20 budget. The Board unanimously approved the budget assumptions in the Town of Sprague’s FY 2019-20 budget contingent upon successful adoption at the budget referendum on August 6, 2019.
c. Review, discussion and possible action: 5-Year Plan Secretary McCaw commented that the base year assumptions in the 5-year plan would be consistent with the assumptions in the FY2019-20 budget that the Town would be voting on at the August 6, 2019 referendum. The Board has had several discussions at earlier Board meetings on the 5-year plan and she requested that Mr. Freund provide a summary of the highlights of the plan. Mr. Freund provided a summary including the assumed changes in the mill rate for each year of the plan, that the cumulative fund balance deficit in the General Fund would be eliminated by fiscal year end 2020 with the assistance from the State, and that fund balance is anticipated to rise to at least 5% of expenditures by fiscal year end 2022. He indicated that fund balance would rise to 14% of expenditures by fiscal year end 2024 (the final year of the 5-year plan), before taking into account any plan for the repayment of the State loan. Mr. White inquired about the details regarding the proposed loan agreement that the State and the Town of Sprague could potentially enter into and as to whether the proposal was part of today’s discussion. Secretary McCaw indicated that it was not part of today’s discussion but that it was germane and appropriate relative to the approval of the 5-year plan. She indicated that based upon the cumulative deficit reported by the Town as of June 30, 2018 and the surplus projected by the Town for FY 2018-19, the Town would be facing a cumulative General Fund deficit of approximately $800,000 as of June 30, 2019. For FY 2019-20, the Town indicates that proceeds from the sale of Town property would be used to
4
lower the deficit to approximately $500,000 but it is Secretary McCaw’s intent to write a contract proposal that would provide flexibility for a State loan of up to $900,000 in case the property sales are not completed in the time manner anticipated by the Town. The Town has delayed paying certain bills that are outstanding and therefore time is of the essence in completing the loan agreement between the State and Sprague so that those bills that have been delayed in paying can soon be paid. Mr. White indicated his support of the loan but would prefer that a time limit with flexibility built in to extend the loan repayment time period be part of the loan agreement. Mr. Falcigno indicated his agreement with Mr. White’s desire for a flexible timeline to be included in the loan agreement for loan repayment. Mr. Waxeberg inquired with the Town whether it was the Town and Board of Education’s belief that the proposed board of education expenditures in the 5-year plan would meet the needs for the education of pupils. The Town affirmed that the spending levels included in the plan for the board of education would meet those needs. The motion to approve the 5-year plan was unanimously approved. Senator Osten stated that she was in agreement with the thoughts of several of the Board members that wanted a time period to be included for the repayment of the loan and she had built the loan repayment in as part of the 5-year plan. She updated Board members on the status of the property sales as well as several other sales and lease agreements that the Town was currently working on to generate additional revenues. Secretary McCaw indicated that she and staff had done some preliminary modeling for the loan repayment. The structure that had been drafted would provide for the Town to repay the loan based upon the level of fund balance reported at the end of each fiscal year. For each year that the Town achieved a fund balance of over 5% but below 7.5%, the Town would use 40% of any surplus achieved for that year to repay the loan, For each year that the Town achieved a fund balance of 7.5% but below 10%, the Town would use 50% of any surplus incurred for that year to repay the loan, and for each year that the Town achieved a fund balance of 10% or higher, the Town would use 60% of the surplus incurred for that year to repay the loan. The intent of this repayment structure was to ensure that there was an incentive for the Town to continue to build upon its fund balance. Based upon the 5-year plan Sprague will reach the 5% fund balance mark by fiscal year end 2022 and that assuming that the loan needed by Sprague is for $500,000, the Town is projected to repay the loan in full by 2025, while still having a robust fund balance in excess of 15%.
d. Update: Vacant positions
Senator Osten and her staff described the key vacancies in the principal and superintendent positions at the Board of Education and the progress made to date in filling the positions. They provided answers to the questions posed by Board members. Secretary McCaw expressed her appreciation to Senator Osten and her staff in cooperation with the Board’s request for documents and information and their willingness to provide answers to the Board.
VII. City of West Haven Issues and Items
a. Update and Possible Action: State Partnership Plan Secretary McCaw welcomed Mayor Rossi and her team to today’s meeting. Updated presentation materials on the Partnership Plan was distributed to Board members by Mr. Freund. Mr. Milone indicated that he wanted to acknowledge the assistance that Mr. Freund provided him in preparing today’s presentation for the Board. He provided a summary of events that has taken place over the past 6 months regarding the plan. From

5
the recent analysis that he and Mr. Freund has done, moving to the Partnership Plan will reduce cost to the City but the savings will not be close to the $2.3 million that Segal had estimated in January. The savings that he is projecting for the City will be slightly over $1 million. A key factor for the cost saving differential is that it appears that the Segal analysis built in a 20 to 21 percent increase in cost for the Anthem Plan and there were no cost increase assumed for the State Partnership Plan. The rate of increase in the Anthem Plan ended up being in the 6 to 7 percent range and the State Partnership Plan increased by 3%. It was also noted that Segal appeared to not have done an in-depth review of the various labor contracts. Certain of these contracts would prevent the City from transitioning current employees working under those contracts and retirees that retired under the provisions of these contracts to be moved immediately to the State Partnership Plan. Mr. Freund provided a narrative of the material he had distributed earlier on the update for the transition to the Partnership Plan. Secretary McCaw indicated that from today’s meeting it was her understanding that based upon the analysis done to date by Mr. Milone and Mr. Freund: (a) When comparing the cost to the City from continuing with the Anthem Plan vs. joining the Partnership Plan, there is projected to be a savings to the City (exclusive of the Board of Education) of approximately $1 million annually by fiscal year end 2021. The original estimates by Segal was thought to have been approximately $2.3 million. (b) In regard to budgetary savings, the savings to the City (exclusive of the Board of Education) are expected to be higher because of the inflation increases built into the assumptions and claims margin reserves that will not be utilized. Therefore, on a budgetary perspective, the savings could be closer to $2 million. Mr. Waxenberg indicated his belief that a movement to the Partnership Plan will be beneficial in the short term and even more over the long term as the rate of cost increase has trended lower in the Partnership Plan. Mr. Milone answered a number of inquiries from Board members. b. Presentation of Fire Study Mr. Freund distributed to the Board, written copies of the Fire Consolidation Study conducted by Emergency Services Consulting International. Stewart McCutcheon and Mike Walsh from the consulting firm introduced themselves to the Board. Mr. Walsh provided a narrative through certain sections of the Report. He referenced the recommendations made in the report for the consolidation of the three fire districts under one Fire Commission while maintaining the 3 districts. (A sample organizational chart from the Fire Study report was referenced by Mr. Walsh.) Once the districts have agreed to such a consolidation, they would be provided an opportunity to gain control of their pension and OPEB liabilities through absorbing the additional costs needed in their annual budgets in regard to amortization of the pension and OPEB liabilities. However, MARB legislation should be in place whereby the MARB can gain oversight over the districts and take the necessary actions needed should the districts not agree to consolidate under one fire commission or should they not make the necessary spending and tax levy increases necessary in their adopted budgets. Board members made a number of inquiries answered by Mr. Walsh and Mr. McCutcheon. According to Mr. Walsh, even modest increases proposed in the budgets of these districts have been rejected by its residents in the pas which would cause the Fire Chief to adjust down the budget in areas such as pension/OPEB in order for the budget to be adopted. In at least one of the districts, there are provisions in the charter indicating that if the budget is not approved, then the previous year’s budget would be considered the adopted budget, even though the budget being proposed included new contractual increases. He indicated that it was his belief that the process of amending a fire district’s charter is arduous. Secretary McCaw indicated it was her observation that at some point, the districts will be unable to make the necessary benefit payments to their retirees. The funding ratios presented are alarming and that it would be her desire to obtain information on the amount of time the districts will have before they are unable to make the benefit payments. She also believes that the District officials should appear before the Board so that Board members can obtain what plan if any, the districts have developed to reign in these liabilities and to continue in making benefit payments to their retirees. A number of other questions were posed to Mr. Walsh and Mr. McCutcheon and they answered the questions accordingly.

6
c. Review and Discussion: Monthly Financial Report – June 2019 Mr. Cieplinski went over the revenues and expenditures results for FY 2018-19 through June of 2019. He referred to the additional Board of Education details provided in today’s presentation that was previously requested by Ms. Kennison. Secretary McCaw requested that the City provide additional details on the lien sale. The City provided additional information and expects lien sale proceeds to be less than prior years due to additional tax collection efforts. Mr. Egan requested that Board of Education officials appear before the Board to provide information on the FY 2018-19 results. Secretary McCaw indicated her agreement with that request. Additional questions were posed that was answered by City officials. Secretary McCaw described the updated outlook from Moody’s regarding the City and noted that the outlook had changed from negative to stable. d. Action: Final Approval of FY 2020 Budget and Amendment to MARB 6/12/19 Resolution regarding FY 2020
Budget Secretary McCaw summarized the actions taken to date regarding the City’s FY 2019-2020 budget. She made a motion to amend the June 12th motion to accommodate the City council action on July 22nd. The motion was unanimously approved. Non-labor contracts up for renewal were described by West Haven officials. e. Review and discussion: Non-Labor contracts
i. Delray Contracting – Wastewater Pump Station
Mr. Tiernan provided an overview of the proposed contract for upgrades to wastewater pump stations.
Secretary McCaw noted that the board packets also included an updated MOA compliance status report. With the previous distribution of the Fire Study and the presentation at today’s meeting, the City has now complied with the required deliverables related to the April 30 payment. The $2 million restructuring funds payment related to the April 30 deliverables will now be processed by OPM.
VIII. Adjourn The meeting adjourned at 1:34 PM

1
STATE OF CONNECTICUT MUNICIPAL ACCOUNTABILITY REVIEW BOARD
SPECIAL MEETING TELEPHONIC MEETING
DRAFT MINUTES
Meeting Date and Time: Thursday, August 29, 2019, 9:30 AM –10:00 AM
Meeting Call-In Instructions: Telephone (605) 313-4443 Code: 714751
Meeting Location: Office of Policy and Management, 450 Capitol Avenue, 5th Floor, Hartford, CT
Members in Attendance: Secretary McCaw, Deputy Treasurer Savitsky, Commissioner Jackson,
Matthew Brokman, Stephen Falcigno, Thomas Hamilton, David Biller, Mark Waxenberg, Robert White
OPM Staff in Attendance: Gareth Bye, Dave Reyes, Julian Freund
Others in Attendance: West Haven Mayor Rossi, Superintendent Cavallaro, Matt Cavallaro, Floyd Dugas,
Natasha Banks, Melinda Kaufmann, Lonnie Burt
I. Call to Order & Opening Remarks
The meeting was called to order at 9:33 AM. Secretary McCaw noted that both contracts being considered at this meeting are board of education contracts for non-certified employees. Previously, these contracts had been excluded from MARB review because there are not subject to approval by their local legislative bodies. Clarifying legislation passed was passed in the last legislative session that adds these contracts to those that come under MARB review for approval or rejection. II. City of West Haven Issues and Items
a. Review, discussion and possible action: Labor contracts
i. Non-Certified School Employees AFSCME Local 2706 (Board of Education)
Mr. Freund provided an overview of the contract which covers just under 100 employees in food service, clerical and maintenance positions. The tentative agreement has been approved by both the union membership and the Board of Education. The subcommittee reviewed the contract at its August meeting and recommended advancing the contract for consideration by the full MARB. The contract provides for two years of hard freezes with a 1% general wage increase in the third year. This follows a contract that also included two years of 0% increases and a 2% increase in the final year. The contract shifts employees to a high deductible health plan and maintains the employee premium share at 17%. The Board of Education provided additional backup information and analysis in advance of the meeting, including financial projections, estimated step savings, health insurance savings, and the impact of the high deductible shift on OPEB. Comparables with settlements in other districts was also included. Superintendent Cavallaro pointed out that the agreement is identical to the agreement previously reached with the teachers union. Mr. White noted that the provision that preserves the district’s ability to transition to the State Partnership is a good idea. Mr. Hamilton and Secretary McCaw commended the district on the considerable backup data that was provided regarding this item. Secretary McCaw further recognized the significance of this contract and the support of the union in finding solutions to mitigate costs. A motion to approve the contract was made by Commissioner Jackson and seconded by Mr. Hamilton. The motion passed unanimously.

2
III. City of Hartford Issues and Items
a. Review, discussion and possible action: Labor contracts
i. Hartford School Support Supervisors (Board of Education)
Mr. Freund explained that this contract covers 39 employees and that the tentative agreement has been
approved by both the union membership and the Board of Education. The Hartford subcommittee
reviewed the tentative agreement at its August meeting. At the time, the contract had not yet been
acted upon by the Board of Education, so the subcommittee briefing was provided in executive session
and the subcommittee did not vote on the agreement. The major changes in the contract are described
in materials provided by the Board of Education. The MARB could act on the agreement at its
September meeting and still be within the required timeline. However, the Board of Education
requested including the item on this special meeting agenda because the agreement involves a shift to a
high deductible plan. Acting on the plan now would allow for moving employees into the high
deductible plan as soon as possible. Ms. Kaufmann provided an overview of the agreement. In addition
to transitioning members to a high deductible health plan, the agreement provides for increases of 2%,
1%, 1.5% and 1.0% over the four-year contact. This follows a contract that provided general wage
increases of 3% in year one followed by 0% in years two and three. This contract does not include step
increases. Employee health premium shares increase by 1% in each year of the contract. Secretary
McCaw noted that the transition to the high deductible health plan and the increases in employee
premium shares are consistent with other labor agreements reached while under MARB oversight.
However, the wage increases in each year of the contract are atypical of contracts coming before the
MARB. The Hartford 5-Year Plan does not build in significant increases in funding for Education, which
will make absorbing the costs of this contract a challenge for the Board of Education. Mr. Waxenberg
shared the Secretary’s concerns, and also questioned the consistency among various salary and position
tables in the prior contract and how they relate to the proposed contract. Ms. Kaufmann noted that the
district is working on aligning the various position tables in the documentation. (Deputy Treasurer leaves
call at 10:00 AM) Mr. Falcigno asked about opportunities for revisiting job descriptions or merging
positions. Ms. Kaufmann noted that the membership of this bargaining unit had historically been
around 80 members. Mr. White asked for the district to provide the MARB with suggestions for
offsetting the increases in this agreement. Mr. Biller and other members agreed that additional
supporting information from the district would be helpful to the board in making a decision in
September. Secretary McCaw requested a table that projects out the costs, savings and net impact of
the agreement’s provisions over the four year contract. Mr. Waxenberg also requested additional detail
concerning positions in the bargaining unit and their salaries in each year of the contract. Mr. Hamilton
made a motion to table this item, with a second by Mr. Falcigno. The motion carried unanimously.
IV. Adjourn
A motion to adjourn was made by Mr. Waxenberg at 10:13 AM with a second by Mr. Hamilton. The
motion carried unanimously.

MEMORANDUM MUNICIPAL ACCOUNTABILITY REVIEW BOARD
To: Municipal Accountability Review Board
From: Julian Freund
Subject: Update on Hartford Subcommittee
Date: September 6, 2019 At its most recent meeting on September 15, the Hartford Subcommittee was provided with an overview of a proposed labor agreement between the Board of Education and the Support Supervisors Association. At the time of the meeting, the union had approved the tentative agreement, but the Board of Education had not yet taken action. The briefing on the proposed agreement was provided in executive session and the Subcommittee took no action on the agreement. The Board of Education subsequently approved the agreement. At the special meeting on August 29, the full MARB tabled the agreement, requesting additional financial information. The Subcommittee also reviewed the City’s updated multi-year financial plan. As part of the Contract for Financial Assistance, the City is required to annually submit to OPM and the Office of the Treasurer an updated 3-year financial plan. The updated plan covering FY 2020 – FY 2023 was presented by the Mayor and Budget Director and is included as an attachment to this update. The plan is based on the same major assumptions that formed the basis of the original recovery plan with some updates based on actual tax collections and revenues and expenditures. The administration and staff are analyzing and reviewing the City finances beyond the time horizon presented in the 3-year plan. Attachments:
City of Hartford 3-Year Financial Plan FY 2020-2023

1
MEMORANDUM MUNICIPAL ACCOUNTABILITY REVIEW BOARD
To: Members of Municipal Accountability Review Board
From: Julian Freund, OPM
Date: August 9, 2019
Subject: City of Hartford 3-Year Financial Plan FY 2020 – FY 2023
Background
The contract for financial assistance between the City of Hartford, OPM and the Treasurer’s Office requires that the City annually submit to the agencies an updated three-year financial plan. The City included, as part of the FY 2020 budget document, a three year projection of revenues and expenditures. Those projections have been expanded to provide detailed revenue and departmental projections in the attached updated 3-Year Plan.
Analysis of Assumptions
For the most part, the updated plan carries forward the same assumptions as were incorporated into the original 5-Year Plan with some adjustments to the baseline year to reflect budget results for FY 2018 and projected revenues and expenditures for FY 2019. Property Taxes
Flat mill rates of 74.29 mills for real estate and personal property (RE/PP) and 45.00 mills for motor vehicles (MV) are used throughout the forecast period. Grand list assumptions are updated to reflect the October 2018 grand list as the basis for FY 2020. Annual grand list increases of 1.5% in the remaining years, except for the revaluation year in FY 2023, is consistent with the prior plan. The tax collection rate is also updated to 96.05% consistent with the City’s charter requirement to use the average of the three prior years. Licenses and Permits
One adjustment to the baseline to reflect changes in the fee schedule is followed by projected increases of 1% per year for Licenses and Permits. The prior plan projected flat revenues from this category. Fines, Forfeits and Penalties
These revenues are based on the same assumptions as the prior plan. Intergovernmental Revenue
Revenue from the State is updated to reflect the adopted State budget and then held flat throughout the forecast period. Charges for Services and Reimbursements
For both of these revenue categories, a resetting of the baseline revenues is built in to reflect recent actuals, followed by flat revenues in the out years.

2
Other Revenue
Other Revenues are based on the same assumptions as the original plan after resetting the baseline to reflect recent actuals. Other Financing Sources
Other Financing Sources have been adjusted to include the annual $10 million corporate contributions, but otherwise are consistent with the revenues in the original plan. Payroll/Personal Services
The baseline for Payroll costs is reset to reflect a higher head count of 1,403 compared to 1,361 in the original plan, with a level head count assumed for the forecast period. Costs increase at a slower pace at 1.2% compared to 1.5% in the original plan. Health Benefits
Health benefits reflect the City’s shift away from PPO plans to high deductible plans which the City has accomplished through collective bargaining processes. An annual health cost inflation factor of 7% per year is used throughout the forecast period. Pension
Baseline pension costs for the MERF plan are based on the City’s July 2018 pension valuation and reflect a reduction in the investment rate of return in the pension fund to 7.375% in FY 2020 and to 7.25% in the out years (as presented at the February subcommittee meeting). Contributions to CMERS are based on a 3% escalation rate, consistent with the prior 5-year plan. Pension contributions to the City’s closed plans are held flat, also consistent with the prior plan. Debt Service
Debt Service projections are consistent with the prior plan and reflects a continuation of payments for Hartford Stadium debt service, grants-in-lieu-of-taxes debt service and brownfield redevelopment debt service only. No new debt service is incorporated into the plan. Education
The City’s contributions to Education are held flat throughout the planning period, consistent with the prior plan. Library
The plan does not make any changes to the funding model for the Hartford Public Library. Utilities
Utility costs are forecasted with the same methodology as the prior plan.

3
Impact on Fund Balance
While the updated forecast projects balanced budgets with no projected changes in fund balance during the planning period, balance in the out years relies on labor savings and other mitigation measures yet to be determined. Modest operating gaps of between $1.26 million to $2.26 million are shown for the out years which will need to be closed through a combination of labor and other savings (or revenue enhancements). The opening narrative of the plan indicates that the City Council is required by Charter to adopt balanced budgets and that budget adjustments will be made to address gaps prior to adoption. The most recent financial report from the City projected a budget surplus of about $3.5 million for FY 2019. This projection takes into account (is net of) additional investments out of the FY 2019 operating budget for pay-as-you-go capital improvements ($10.5 million) and vehicles and equipment ($4.6 million).
City of Hartford
FY2020‐FY2023 Out‐Year Outlook to the
Municipal Accountability Review Board
August 15, 2019

City of Hartford
FY2020‐FY2023 Outlook
to the Municipal Accountability Review Board
General Fund Expenditure and Revenue Forecast Assumptions 1
FY2020‐FY2023 Outlook Summary 4
Revenue Summary ‐ Major Category 5
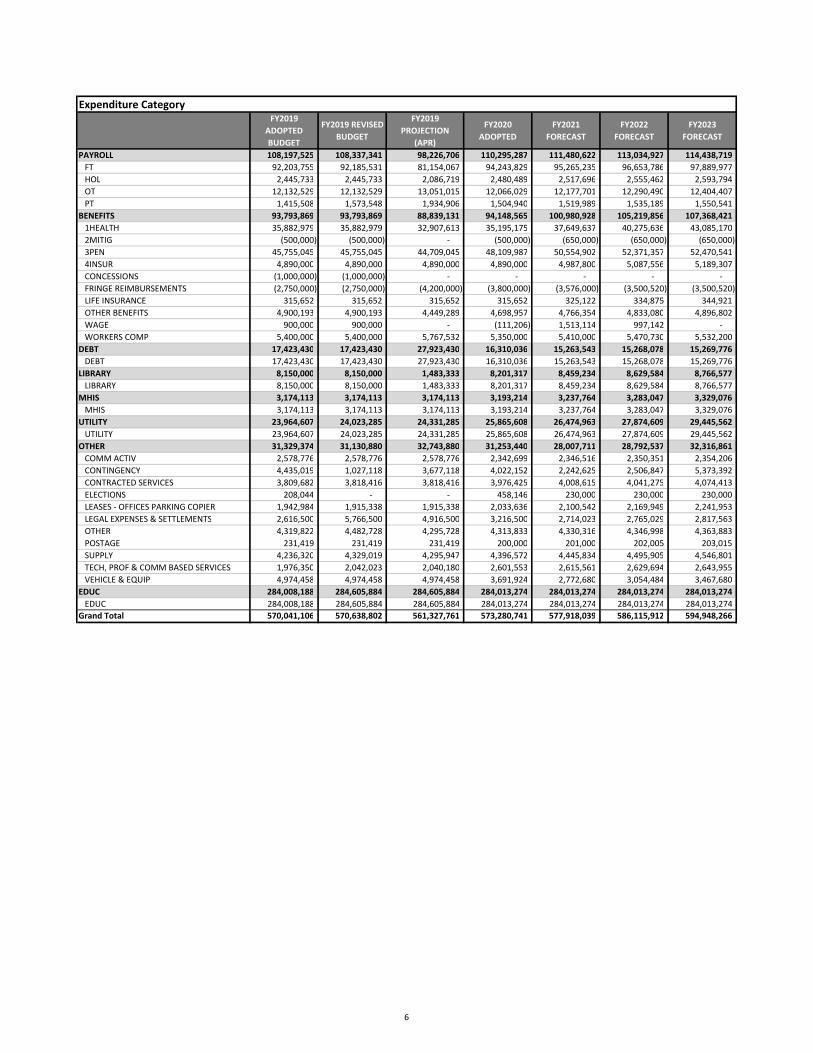
Expenditure Summary ‐ Major Category 6

1
GENERAL FUND EXPENDITURE AND REVENUE FORECAST ASSUMPTIONS FISCAL YEARS 2020 THROUGH 2023
The Financial Forecast (Forecast) for the City of Hartford (City) spans from Fiscal Years (FY) 2020 to FY2023. The purpose of the Forecast is to help make informed budgetary and operational decisions by anticipating the future of the City’s General Fund revenues and expenditures, and highlighting anticipated fiscal risks and opportunities. The Forecast surfaces major known fiscal conditions and projected future conditions to support informed long‐term planning and decision‐making regarding operational and capital improvement resources. As such, this Forecast should be used as a management and planning tool and amended annually. It is also important to note that the Court of Common Council is mandated by Charter to adopt a balanced budget. Therefore, any out‐year projections indicating a budget deficit will require adjustments prior to budget adoption. General Property Taxes are a major source of revenue for the City. The tax revenue projection for the FY2020‐2023 budget contains the following assumptions:
• Flat mill rate of 74.29 for all property types, except for Motor Vehicles at 45 mills effective in FY2020 through FY2023 consistent with current State law
• Grand List decrease of 1.17% in the 2018 grand list for FY2020, 1.5% annual growth in fiscal years 2021 and 2022, and 2% growth in fiscal year 2023
• Tax collection rate is 96.05% based on the average of 3 prior years (FY2016, FY2017, and FY2018 from CAFR) • Relatively static level of tax abatements • Revenues associated with contractual subsequent lien sales only. As the level of subsequent liens to lien holders
decreases over this time period, it is assumed the City’s collection of prior year taxes and interest will increase Licenses and Permits revenues reflects an increase of 6.5% in FY2020 based upon adjustments implemented to housing, licenses, inspections, land use, and other fees. While there are no known large‐scale property developments, the aforementioned adjustments to revenues from licensing and inspection are projected to annually increase by 1% in FY2021 and beyond. Fines, Forfeits and Penalties, primarily comprised of False Alarm Fine revenue, are expected to remain relatively level. This category is relatively small; while all revenues are vital, it is not a major source of revenue. Revenue from the Use of Money and Property primarily consist of rental/lease and short‐term investment income. It is projected that this category will increase due to an improvement in interest rates, which should contribute to an increase in short‐term investment income in the future. Intergovernmental Revenue is a major source of revenue to the City. The City’s revenue forecast assumes municipal aid revenues from the State of Connecticut are flat at the FY2020 Governor’s Proposed level. The City relies heavily on State assistance since a significant portion of tax‐exempt properties are within the Capital City's boundaries. The State payment in lieu of taxes (PILOT) revenue continues to be funded at amounts below the State statutory level. Level funding of the municipal aid from the State of Connecticut is a major assumption and element of the City's Recovery Plan and long‐term forecast. Charges for Services include revenue from conveyance tax, filing of legal documents and all other charges for general government services. FY2020 reflects a 1.31% increase over the FY2019 Adopted Budget consistent with historical actuals. Out‐years are projected flat since many of the revenue items in this category are variable in nature. Reimbursements include miscellaneous reimbursement amounts and prior‐year expenditure refunds. A slight decrease is projected in FY2020 for this revenue category based on historical trend.

2
Other Revenue includes the sale of development properties and other miscellaneous revenues. To reduce the City's reliance on one‐time revenue sources, FY2020 and all the years to come have no anticipated sale of City properties. In principle, the City does not sell assets that generate annual revenue to the City. There is an increase in FY2021 due to the historical trend. Other Financing Sources include transfers from other funds. The Hartford Parking Facilities Enterprise Fund, which passes the net revenue generated by the Hartford Parking Authority to the General Fund, reflects an increase of from FY2019 levels and remains flat for future years at that level. The Special Police Services Fund, which accounts for all police private duty activity, is held flat at the FY2019 level of $2.750 million. Reimbursement for expenses incurred at the XL Center will impact the City’s ability to meet this revenue target. Any unfavorable net position in the Special Private Duty jobs internal service fund will require funding from the General Fund to rectify. Revenues for Downtown North associated with the baseball stadium have been reduced from $1.2 million to $1 million due to the State budget shifting the admission tax revenues from the City to the State. Other Financing Sources also includes the new $10 million corporate contribution to the City of Hartford. Assumptions for Expenditure Forecast: Payroll/Personal Services Payroll is a broad expenditure line item that includes salary expenses for full‐time, part‐time, and seasonal workers, as well as other associated costs including, but not limited to, overtime, holiday pay, and shift differential. For FY2020 to FY2023, Payroll/Personal Services in operating departments is projected to increase annually by 1.2% on average. The FY2020 Adopted Budget includes a headcount of 1,403. The expenditure forecast assumes a level headcount. Benefits and Insurances In the FY2020 Adopted Budget, Benefits and Insurances, which includes Health, Pension, Concessions, Property and Liability Insurances, Workers' Compensation and Other Benefits, are projected to increase by 0.4%, or $354,696 primarily due to an increase in Pensions offset by Fringe Benefit Reimbursements to the City. Health The City has a self‐insured health model and the Health Benefits budget reflects the net medical, pharmacy and dental costs after employee contributions for approximately 2,934 active members and 1,978 retirees. Health costs, including medical, prescription and dental, reflect the claim trend experience adjusted for industry standard annual medical and pharmacy inflation of approximately 7% and and a 2% Claims Margin. The City’s Municipal Recovery Plan captures landmark concessions achieved through negotiated collective bargaining agreements with Police, CHPEA, 1716, HMEA, MLA (and previously Fire). Under these agreements, City employees will shift from a Deferred Provider Organization Plan (PPO) to a High Deductible Health Plan (HDHP) with Health Savings Account (HSA) and partially employer‐funded deductible. In addition, Medicare retirees over age 65 moved to the Medicare Advantage plan consistent with the State effective 7/1/2018. The savings associated with the HDHP and Medicare Advantage Plan were captured in the FY2019 Adopted Budget. Major concessions include, but are not limited to, multiple years of wage freezes, plan design changes to health, increased health cost share and pension contributions, pension plan design changes primarily for new hires, and modifications to sick leave provisions. Health Benefits reflect a decrease of approximately $0.68 million compared to the FY2019 Adopted Budget due to favorable claim trend and labor savings. Annual escalation is consistently forecasted at 7% throughout FY2021‐FY2023. Pension In total, the City's pension budget increased by $2.35 million from the FY2019 Adopted to the FY2020 Adopted Budget. The City's Municipal Employees Retirement Plan (MERF) accounts of this increase and is budgeted based on actuarial valuation as of July 1st, 2018 prepared by Hooker and Holcomb as approved entirely by the City’s Pension Commission.

3
The actuarially determined employer contribution (ADEC) for FY2020 is $47.24 million, comprised of $40.87 million for the City's Police, Fire and Municipal employees, $0.95 million for the Hartford Public Library (funded within the HPL appropriation) and $5.43 million for the Board of Education. The FY2020 Adopted Budget fully funds the ADEC, consistent with historical practice and in line with the contract assistance agreement executed with the State of Connecticut. The City's FY2020 MERF contribution of $40.87 million, budgeted within Benefits and Insurances, is an increase of approximately $2.36 million from the FY2019 Adopted Budget. This is primarily due to higher payroll as the actuarial valuation has been updated to reflect City estimated payrolls as of July 1, 2018. The FY2020 Adopted Budget reflects a 7.375% rate of return and outyear forecasts currently assume a reduction in the rate of return to 7.25% in FY2021‐FY2023. The FY2020‐FY2023 Forecast Municipal Budget (excluding Education) fully funds the municipal portion of the ADEC, which is estimated at $44 million for FY2021. Full funding of the pension ADEC is a requirement of the City's Contract Assistance agreement with the State. The City's Connecticut Municipal Employees Retirement System (CMERS) plan for the Local 1716 bargaining unit is level funded at $1.68 million with 3% escalation in the outyears. Funding for the City's closed pension plans for Fire and Police decrease by $50,000 from FY2019 Adopted to the FY2020 Adopted Budget. Pension expenses for these two closed plans, which have declining numbers of members, are forecasted to remain flat in out‐years. In addition, payouts associated with vacation and sick exchange are projected to remain consistent with the FY2020 Adopted Budget. In FY2021 and beyond, total Benefits and Insurances expenses stabilize at approximately 4% annual growth for the remaining years. Debt Service and Other Capital Under the contract assistance agreement between the City and the State of Connecticut, principal and interest payments for existing acquired and restructured general obligation (GO) bonds will be paid by the State of CT. The FY2020‐FY2023 forecast does not include the debt service for the City's general obligation bonded debt. The City will continue to service the Hartford Stadium Authority Revenue Bonds and therefore this debt service is appropriately budgeted within the debt service forecast at $4.6 million annually with an additional $6,000 of maintenance fees. This debt service line item also includes the GILOT (Grant in Lieu of Taxes) debt service related to a past CBRA (Connecticut Brownfields Redevelopment Authority) project with the University of Hartford. The Debt Service and Other Capital line item does not include any funding for new debt issuance. The City will manage its Capital Improvement Program to meet basic City infrastructure on a pay‐go (pay‐as‐you‐go) basis for fiscal years 2020‐2023. Education The City’s education contribution to the Hartford Public Schools is projected to be flat in the out‐year forecast. The Hartford Public School System continues to receive additional funding directly from the State of Connecticut in the form of Alliance Grants and other Special Funds. Hartford Public Library The out‐year forecast for the Hartford Public Library assumes no changes in the current service model and adjusts for increases in healthcare costs and pension consistent with the City's pension actuarial consultant projections. Utilities The City uses data from multiple sources in projecting future utilities expenses. Expenses incurred in the current and prior fiscal years are analyzed, and are provided to an energy consultant for its reference in developing expense projections for specific accounts including electricity and piped gas. Energy pricing data from the U.S. Energy Information Administration (EIA) Web site are reviewed and used to estimate escalation in utility costs. Estimated changes in consumption and existing contracts are among the additional information considered when projecting expenses.

OUTLOOK
Revenue CategoryFY2019 ADOPTED
BUDGET
FY2019 REVISED
BUDGET
FY2019 PROJECTION
(APR)
FY2020
ADOPTED
FY2021
FORECAST
FY2022
FORECAST
FY2023
FORECAST
41‐TAXES (284,111,323) (284,111,323) (281,611,323) (283,570,266) (287,833,362) (294,952,897) (303,709,926)
42‐LICENSES AND PERMITS (5,671,406) (5,671,406) (5,907,406) (6,040,406) (6,263,616) (6,326,252) (6,389,515)
43‐FINES FORFEITS AND PENALTIES (190,000) (190,000) (190,000) (190,000) (190,000) (190,000) (190,000)
44‐INTEREST AND RENTAL INCOME (1,313,149) (1,313,149) (4,563,149) (4,003,465) (2,514,216) (2,514,216) (2,514,216)
45‐INTERGOVERNMENTAL (258,950,890) (259,548,586) (259,772,509) (259,580,413) (259,630,963) (259,642,767) (259,654,831)
46‐CHARGES FOR SERVICES (2,929,483) (2,929,483) (3,229,483) (2,967,964) (3,182,444) (3,182,444) (3,182,444)
47‐REIMBURSEMENTS (152,840) (152,840) (132,840) (135,440) (144,340) (144,340) (144,340)
48‐OTHER REVENUES (238,650) (238,650) (468,650) (238,650) (345,650) (345,650) (345,650)
53‐OTHER FINANCING SOURCES (16,483,365) (16,483,365) (9,513,125) (16,554,137) (16,554,137) (16,554,137) (16,554,137)
Grand Total (570,041,106) (570,638,802) (565,388,485) (573,280,741) (576,658,728) (583,852,704) (592,685,059)
Expenditure CategoryFY2019 ADOPTED
BUDGET
FY2019 REVISED
BUDGET
FY2019 PROJECTION
(APR)
FY2020
ADOPTED
FY2021
FORECAST
FY2022
FORECAST
FY2023
FORECAST
PAYROLL 108,197,525 108,337,341 98,226,706 110,295,287 111,480,622 113,034,927 114,438,719
BENEFITS 93,793,869 93,793,869 88,839,131 94,148,565 100,980,928 105,219,856 107,368,421
DEBT 17,423,430 17,423,430 27,923,430 16,310,036 15,263,543 15,268,078 15,269,776
LIBRARY 8,150,000 8,150,000 1,483,333 8,201,317 8,459,234 8,629,584 8,766,577
MHIS 3,174,113 3,174,113 3,174,113 3,193,214 3,237,764 3,283,047 3,329,076
UTILITY 23,964,607 24,023,285 24,331,285 25,865,608 26,474,963 27,874,609 29,445,562
OTHER 31,329,374 31,130,880 32,743,880 31,253,440 28,007,711 28,792,537 32,316,861
EDUC 284,008,188 284,605,884 284,605,884 284,013,274 284,013,274 284,013,274 284,013,274
Grand Total 570,041,106 570,638,802 561,327,761 573,280,741 577,918,039 586,115,912 594,948,266
Revenues and Expenditures, Net ‐ ‐ (4,060,724) (0) 1,259,311 2,263,208 2,263,208
Surplus (Deficit), Including Contract
Assistance, Labor & Other Savings ‐ ‐ 4,060,724 0 (1,259,311) (2,263,208) (2,263,208)
Efficiencies and Other Mitigation 0 0 0 ‐ 1,259,311 2,263,208 2,263,208
Revised Gap 0 0 0 0 0 0 0
4

Revenue Category
FY2019 ADOPTED
BUDGET
FY2019 REVISED
BUDGET
FY2019 PROJECTION
(APR)FY2020 ADOPTED FY2021 FORECAST FY2022 FORECAST FY2023 FORECAST
41‐TAXES (284,111,323) (284,111,323) (281,611,323) (283,570,266) (287,833,362) (294,952,897) (303,709,926)
CURRENT YEAR TAX LEVY (273,861,323) (273,861,323) (271,961,323) (272,220,266) (276,483,362) (283,602,897) (292,359,926)
INTEREST AND LIENS (3,900,000) (3,900,000) (4,300,000) (4,500,000) (4,500,000) (4,500,000) (4,500,000)
PRIOR YEAR LEVIES (5,500,000) (5,500,000) (4,500,000) (6,250,000) (6,250,000) (6,250,000) (6,250,000)
TAX LIEN SALES (750,000) (750,000) (750,000) (500,000) (500,000) (500,000) (500,000)
OTHER (100,000) (100,000) (100,000) (100,000) (100,000) (100,000) (100,000)
42‐LICENSES AND PERMITS (5,671,406) (5,671,406) (5,907,406) (6,040,406) (6,263,616) (6,326,252) (6,389,515)
BUILDING PERMITS (3,442,000) (3,442,000) (3,242,000) (3,442,000) (3,600,000) (3,636,000) (3,672,360)
ELECTRICAL PERMITS (627,000) (627,000) (827,000) (775,000) (775,000) (782,750) (790,578)
FOOD & MILK DEALER LICENSES (312,000) (312,000) (312,000) (312,000) (312,000) (315,120) (318,271)
MECHANICAL PERMITS (639,000) (639,000) (700,000) (800,000) (800,000) (808,000) (816,080)
PLUMBING PERMITS (265,000) (265,000) (340,000) (325,000) (325,000) (328,250) (331,533)
OTHER (386,406) (386,406) (486,406) (386,406) (451,616) (456,132) (460,693)
43‐FINES FORFEITS AND PENALTIES (190,000) (190,000) (190,000) (190,000) (190,000) (190,000) (190,000)
FALSE ALARM CITATIONS‐POL&FIRE (185,000) (185,000) (185,000) (185,000) (185,000) (185,000) (185,000)
HEALTH SANITATION CITATION ‐ ‐
LAPSED LICENSE/LATE FEE (5,000) (5,000) (5,000) (5,000) (5,000) (5,000) (5,000)
OTHER ‐ ‐
44‐INTEREST AND RENTAL INCOME (1,313,149) (1,313,149) (4,563,149) (4,003,465) (2,514,216) (2,514,216) (2,514,216)
BILLINGS FORGE (20,000) (20,000) (20,000) (20,428) (20,428) (20,428) (20,428)
CT CENTER FOR PERFORM ART (50,000) (50,000) (47,228) (50,000) (50,000) (50,000) (50,000)
DELTAPRO ‐ LANDFILL GAS (90,294) (90,294) (10,202) (90,294) (90,294) (90,294) (90,294)
INTEREST (252,000) (252,000) (3,502,000) (2,905,249) (1,400,000) (1,400,000) (1,400,000)
MIRA SOLAR REVENUE (50,000) (50,000) ‐ (50,000) (50,000) (50,000) (50,000)
RENT OF PROP‐ALL OTHER (79,600) (79,600) (79,600) (112,839) (112,839) (112,839) (112,839)
RENTAL OF PARK PROPERTY (54,000) (54,000) (54,000) (54,000) (70,000) (70,000) (70,000)
RENTAL OF PARKING LOTS (600) (600) (600) (600) (600) (600) (600)
RENTAL OF PROP‐FLOOD COMM (148,560) (148,560) (148,560) (148,560) (148,560) (148,560) (148,560)
RENTAL‐525 MAIN STREET (17,694) (17,694) (17,694) (21,094) (21,094) (21,094) (21,094)
RENTS FROM TENANTS (161,257) (161,257) (161,257) (161,257) (161,257) (161,257) (161,257)
SHEPHERD PARK (118,000) (118,000) (241,289) (118,000) (118,000) (118,000) (118,000)
THE RICHARDSON BUILDING (235,000) (235,000) (244,000) (235,000) (235,000) (235,000) (235,000)
UNDERWOOD TOWER PILOT (36,144) (36,144) (36,144) (36,144) (36,144) (36,144) (36,144)
OTHER ‐ ‐ (575) ‐ ‐ ‐ ‐
45‐INTERGOVERNMENTAL (258,950,890) (259,548,586) (259,772,509) (259,580,413) (259,630,963) (259,642,767) (259,654,831)
MUNICIPAL AID (253,763,984) (254,361,680) (254,361,680) (254,285,642) (254,285,642) (254,285,642) (254,285,642)
CAR TAX SUPPL MRSF REV SHARING (11,078,328) (11,078,328) (11,078,328) (11,597,120) (11,597,120) (11,597,120) (11,597,120)
EDUCATION ‐ STIMULUS ‐ ‐ ‐ ‐ ‐
EDUCATION COST SHARING (187,969,804) (188,567,500) (188,567,500) (187,974,890) (187,974,890) (187,974,890) (187,974,890)
HIGHWAY GRANT (1,194,825) (1,194,825) (1,194,825) (1,192,605) (1,192,605) (1,192,605) (1,192,605)
MASHANTUCKET PEQUOT FUND (6,136,523) (6,136,523) (6,136,523) (6,136,523) (6,136,523) (6,136,523) (6,136,523)
MRSA BONDED DISTRIBUTION GRANT (1,419,161) (1,419,161) (1,419,161) (1,419,161) (1,419,161) (1,419,161) (1,419,161)
MRSA SALES TAX SHARING ‐ ‐ ‐ ‐ ‐ ‐
MRSF MV PROPERTY TAX GRANT ‐ ‐ ‐ ‐ ‐ ‐
MRSF SELECT PILOT (12,422,113) (12,422,113) (12,422,113) (12,422,113) (12,422,113) (12,422,113) (12,422,113)
MUNICIPAL STABILIZATION GRANT (3,370,519) (3,370,519) (3,370,519) (3,370,519) (3,370,519) (3,370,519) (3,370,519)
PRIV TAX EXEMPT PROPERTY (20,009,758) (20,009,758) (20,009,758) (20,009,758) (20,009,758) (20,009,758) (20,009,758)
STATE OWNED PROPERTY (10,162,953) (10,162,953) (10,162,953) (10,162,953) (10,162,953) (10,162,953) (10,162,953)
OTHER MUNICIPAL AID ‐ ‐ ‐ ‐ ‐ ‐
MUNICIPAL RESTRUCTURING FUNDS ‐ ‐ ‐ ‐ ‐ ‐
STATE CONTRACT ASSISTANCE ‐ ‐ ‐ ‐ ‐ ‐
OTHER STATE REVENUES (879,617) (879,617) (830,774) (830,774) (830,774) (830,774) (830,774)
BOND INT SUB ON SCH PROJ (46,613) (46,613) (46,613) (46,613) (46,613) (46,613) (46,613)
EDUCATION OTHER ‐ ‐ ‐ ‐ ‐ ‐
JUDICIAL BRANCH REV DISTRIB. (76,000) (76,000) (76,000) (76,000) (76,000) (76,000) (76,000)
MANUFACTURERS' FACILITIES (48,843) (48,843) ‐ ‐ ‐ ‐
SCH BUILD GRT‐SERIAL (661,445) (661,445) (661,445) (661,445) (661,445) (661,445) (661,445)
TAX EXEMP FOR THE ELDERLY ‐ ‐ ‐ ‐ ‐ ‐
TAX EXEMPT FOR THE ELDERLY ‐ ‐ ‐ ‐ ‐ ‐
VETERANS EXEMPTIONS (46,716) (46,716) (46,716) (46,716) (46,716) (46,716) (46,716)
PILOTS, MIRA & OTHER INTERGOVERNMENTAL (4,302,289) (4,302,289) (4,575,055) (4,458,997) (4,509,547) (4,521,351) (4,533,415)
DISABIL EXEMPT‐SOC SEC (7,755) (7,755) (7,755) (7,755) (7,755) (7,755) (7,755)
GR REC TAX‐PARI MUTUAL ‐ ‐ ‐ ‐ ‐ ‐
GR REC TAX‐PARI MUTUEL (250,000) (250,000) (250,000) (250,000) (250,000) (250,000) (250,000)
GRANTS FROM STATE OF CONNECTIC ‐ ‐ ‐ ‐ ‐ ‐
HEALTH&WELFARE‐PRIV SCH (61,366) (61,366) (61,366) (61,366) (61,366) (61,366) (61,366)
MATERIALS INNOVATION RECYCLING (1,500,000) (1,500,000) (1,500,000) (1,500,000) (1,500,000) (1,500,000) (1,500,000)
PHONE ACCESS LN TAX SH (550,000) (550,000) (550,000) (550,000) (550,000) (550,000) (550,000)
PILOT BILLINGS FORGE APT ‐ ‐ ‐ ‐ ‐ ‐
PILOT CHURCH HOMES INC (131,112) (131,112) (131,112) (131,112) (131,112) (131,112) (131,112)
PILOT EL MERCADO ‐ ‐ ‐ ‐ ‐ ‐
PILOT FOR CT CTR FOR PERF (357,056) (357,056) (477,059) (361,000) (400,000) (400,000) (400,000)
PILOT FOR HARTFORD 21 (500,000) (500,000) (500,000) (500,000) (500,000) (500,000) (500,000)
PILOT FOR NEW MFG EQUIP ‐ ‐ ‐ ‐ ‐ ‐
PILOT FOR ROOM OCCUPANCY ‐ ‐ ‐ ‐ ‐ ‐
PILOT FOR VOLUNTARY PAYMENTS ‐ ‐ ‐ ‐ ‐ ‐
PILOT HARTFORD HILTON (525,000) (525,000) (525,000) (525,000) (536,550) (548,354) (560,418)
PILOT HARTFORD MARRIOTT (400,000) (400,000) (552,763) (552,764) (552,764) (552,764) (552,764)
PILOT SIGOURNEY MEWS ‐ ‐ ‐ ‐ ‐ ‐
PILOT TRINITY COLLEGE (20,000) (20,000) (20,000) (20,000) (20,000) (20,000) (20,000)
OTHER (5,000) (5,000) (5,000) (5,000) (5,000) (5,000) (5,000)
STATE REIMBURSEMENTS (5,000) (5,000) (5,000) (5,000) (5,000) (5,000) (5,000)
46‐CHARGES FOR SERVICES (2,929,483) (2,929,483) (3,229,483) (2,967,964) (3,182,444) (3,182,444) (3,182,444)
CONVEYANCE TAX (1,155,519) (1,155,519) (1,455,519) (1,200,000) (1,300,000) (1,300,000) (1,300,000)
FILING RECORD‐CERTIF FEES (300,000) (300,000) (300,000) (300,000) (300,000) (300,000) (300,000)
TRANSCRIPT OF RECORDS (839,250) (839,250) (839,250) (839,250) (839,250) (839,250) (839,250)
OTHER (634,714) (634,714) (634,714) (628,714) (743,194) (743,194) (743,194)
47‐REIMBURSEMENTS (152,840) (152,840) (132,841) (135,440) (144,340) (144,340) (144,340)
ADVERTISING LOST DOGS (220) (220) (220) (220) (220) (220) (220)
ATM REIMBURSEMENT (1,475) (1,475) (1,475) (1,475) (1,475) (1,475) (1,475)
DOG ACCT‐SALARY OF WARDEN (2,600) (2,600) (2,600) (2,600) (2,600) (2,600) (2,600)
OTHER REIMBURSEMENTS (17,900) (17,900) (17,900) (20,500) (20,500) (20,500) (20,500)
PRIOR YEAR EXPEND REFUNDS (17,000) (17,000) (5,917) (17,000) (17,000) (17,000) (17,000)
REIMB FOR MEDICAID SERVICES (22,000) (22,000) (22,000) (22,000) (22,000) (22,000) (22,000)
SECTION 8 MONITORING (85,545) (85,545) (65,545) (65,545) (65,545) (65,545) (65,545)
WORK COMP NORM TAX APPLIC ‐ ‐ ‐ ‐ ‐ ‐ ‐
OTHER (6,100) (6,100) (17,184) (6,100) (15,000) (15,000) (15,000)
48‐OTHER REVENUES (238,650) (238,650) (468,650) (238,650) (345,650) (345,650) (345,650)
MISCELLANEOUS REVENUE (169,150) (169,150) (169,150) (169,150) (169,150) (169,150) (169,150)
OVER & SHORT ACCOUNT (1,500) (1,500) (1,500) (1,500) (1,500) (1,500) (1,500)
SALE CITY SURPLUS EQUIP (60,000) (60,000) (3,002) (60,000) (60,000) (60,000) (60,000)
SALE OF DOGS (5,000) (5,000) (5,000) (5,000) (5,000) (5,000) (5,000)
SETTLEMENTS ‐ OTHER (3,000) (3,000) (213,998) (3,000) (100,000) (100,000) (100,000)
OTHER ‐ ‐ (76,000) ‐ (10,000) (10,000) (10,000)
53‐OTHER FINANCING SOURCES (16,483,365) (16,483,365) (9,513,125) (16,554,137) (16,554,137) (16,554,137) (16,554,137)
CORPORATE CONTRIBUTION (10,000,000) (10,000,000) (3,333,333) (10,000,000) (10,000,000) (10,000,000) (10,000,000)
DOWNTOWN NORTH (DONO) (1,193,500) (1,193,500) (993,500) (993,500) (993,500) (993,500) (993,500)
REVENUE FROM HTFD PKG AUTHY (2,424,865) (2,424,865) (2,424,865) (2,695,637) (2,695,637) (2,695,637) (2,695,637)
SPECIAL POLICE SERVICES (2,750,000) (2,750,000) (2,646,427) (2,750,000) (2,750,000) (2,750,000) (2,750,000)
OTHER (115,000) (115,000) (115,000) (115,000) (115,000) (115,000) (115,000)
Grand Total (570,041,106) (570,638,802) (565,388,485) (573,280,741) (576,658,728) (583,852,704) (592,685,059)
5
Expenditure CategoryFY2019
ADOPTED
BUDGET
FY2019 REVISED
BUDGET
FY2019
PROJECTION
(APR)
FY2020
ADOPTED
FY2021
FORECAST
FY2022
FORECAST
FY2023
FORECAST
PAYROLL 108,197,525 108,337,341 98,226,706 110,295,287 111,480,622 113,034,927 114,438,719
FT 92,203,755 92,185,531 81,154,067 94,243,829 95,265,235 96,653,786 97,889,977
HOL 2,445,733 2,445,733 2,086,719 2,480,489 2,517,696 2,555,462 2,593,794
OT 12,132,529 12,132,529 13,051,015 12,066,029 12,177,701 12,290,490 12,404,407
PT 1,415,508 1,573,548 1,934,906 1,504,940 1,519,989 1,535,189 1,550,541
BENEFITS 93,793,869 93,793,869 88,839,131 94,148,565 100,980,928 105,219,856 107,368,421
1HEALTH 35,882,979 35,882,979 32,907,613 35,195,175 37,649,637 40,275,636 43,085,170
2MITIG (500,000) (500,000) ‐ (500,000) (650,000) (650,000) (650,000)
3PEN 45,755,045 45,755,045 44,709,045 48,109,987 50,554,902 52,371,357 52,470,541
4INSUR 4,890,000 4,890,000 4,890,000 4,890,000 4,987,800 5,087,556 5,189,307
CONCESSIONS (1,000,000) (1,000,000) ‐ ‐ ‐ ‐ ‐
FRINGE REIMBURSEMENTS (2,750,000) (2,750,000) (4,200,000) (3,800,000) (3,576,000) (3,500,520) (3,500,520)
LIFE INSURANCE 315,652 315,652 315,652 315,652 325,122 334,875 344,921
OTHER BENEFITS 4,900,193 4,900,193 4,449,289 4,698,957 4,766,354 4,833,080 4,896,802
WAGE 900,000 900,000 ‐ (111,206) 1,513,114 997,142 ‐
WORKERS COMP 5,400,000 5,400,000 5,767,532 5,350,000 5,410,000 5,470,730 5,532,200
DEBT 17,423,430 17,423,430 27,923,430 16,310,036 15,263,543 15,268,078 15,269,776
DEBT 17,423,430 17,423,430 27,923,430 16,310,036 15,263,543 15,268,078 15,269,776
LIBRARY 8,150,000 8,150,000 1,483,333 8,201,317 8,459,234 8,629,584 8,766,577
LIBRARY 8,150,000 8,150,000 1,483,333 8,201,317 8,459,234 8,629,584 8,766,577
MHIS 3,174,113 3,174,113 3,174,113 3,193,214 3,237,764 3,283,047 3,329,076
MHIS 3,174,113 3,174,113 3,174,113 3,193,214 3,237,764 3,283,047 3,329,076
UTILITY 23,964,607 24,023,285 24,331,285 25,865,608 26,474,963 27,874,609 29,445,562
UTILITY 23,964,607 24,023,285 24,331,285 25,865,608 26,474,963 27,874,609 29,445,562
OTHER 31,329,374 31,130,880 32,743,880 31,253,440 28,007,711 28,792,537 32,316,861
COMM ACTIV 2,578,776 2,578,776 2,578,776 2,342,699 2,346,516 2,350,351 2,354,206
CONTINGENCY 4,435,019 1,027,118 3,677,118 4,022,152 2,242,625 2,506,847 5,373,392
CONTRACTED SERVICES 3,809,682 3,818,416 3,818,416 3,976,425 4,008,615 4,041,275 4,074,413
ELECTIONS 208,044 ‐ ‐ 458,146 230,000 230,000 230,000
LEASES ‐ OFFICES PARKING COPIER 1,942,984 1,915,338 1,915,338 2,033,636 2,100,542 2,169,949 2,241,953
LEGAL EXPENSES & SETTLEMENTS 2,616,500 5,766,500 4,916,500 3,216,500 2,714,023 2,765,029 2,817,563
OTHER 4,319,822 4,482,728 4,295,728 4,313,833 4,330,316 4,346,998 4,363,883
POSTAGE 231,419 231,419 231,419 200,000 201,000 202,005 203,015
SUPPLY 4,236,320 4,329,019 4,295,947 4,396,572 4,445,834 4,495,905 4,546,801
TECH, PROF & COMM BASED SERVICES 1,976,350 2,042,023 2,040,180 2,601,553 2,615,561 2,629,694 2,643,955
VEHICLE & EQUIP 4,974,458 4,974,458 4,974,458 3,691,924 2,772,680 3,054,484 3,467,680
EDUC 284,008,188 284,605,884 284,605,884 284,013,274 284,013,274 284,013,274 284,013,274
EDUC 284,008,188 284,605,884 284,605,884 284,013,274 284,013,274 284,013,274 284,013,274
Grand Total 570,041,106 570,638,802 561,327,761 573,280,741 577,918,039 586,115,912 594,948,266
6

Non Major
Governmental
Funds
Workers
Compensation
Liability and
Property Damage
Deficit 6/30/18 (3,220)$ (20,356)$ (5,520)$
Non Major Govermental Funds - This deficit is caused by 7 different miscellaneous grant funds. The deficit for 6 funds is related
to the timing of grant reimbursements. Total deficit fund balance at 6/30 was $2.9m and $2.8m was received to date.
The remaining amount of $100k is anticipated to be received by end of FY19.
The Health fund deficit of $249K is related to the timing of grant reimbursements. All reimbursements that caused the
deficit in the Health fund have been received in FY19.
This deficit does not need to be addressed in the recovery plan as the deficit is due to timing of reimbursements.
Workers Compensation - This deficit is due to the IBNR - Incurred but not reported. The IBNR for 6/30/17 = $24,400 and the deficit
fund balance is $20,356.
This deficit does not need to be addressed in the recovery plan as the net position reflects timing of estimated expenses.
When these expenses are actually incurred, these expenditures are budgeted and accounted for in the General Fund.
Liability and Property Damage - This deficit is due to the IBNR - Incurred but not reported. The IBNR for 6/30/17 = $5,500 and the deficit
is $5,520.
This deficit does not need to be addressed in the recovery plan as the net position reflects timing of estimated expenses.
When these expenses are actually incurred, these expenditures are budgeted and accounted for in the General Fund.
City of Hartford
Funds with Deficit Fund Balance
As of June 30, 2018
in 000's

City of Hartford
FY2020 Monthly Financial Report to the Municipal Accountability Review
Board
July 2019 (FY2020 P1)
Meeting date: September 19, 2019

City of Hartford
Budget and Financial Report
to the Municipal Accountability Review Board
FY2020 General Fund Summary 1
Revenue and Expenditure Footnotes 2
Revenue Summary ‐ Major Category 3
Tax Collections 4
Expenditure Summary ‐ Departments 5
Expenditure Summary ‐ Major Category 6
Appendix ‐ Full‐time payroll 7

City of Hartford ‐ FY2020 General Fund Financial Report & Projection
MARB 9/19/19
Revenue Category
FY2020 ADOPTED
BUDGET
FY2020 REVISED
BUDGET
FY2019 ACTUAL
(JULY)
FY2020 ACTUAL
(JULY)
FY2020
PROJECTION VARIANCE % COLL.
41 General Property Taxes1 (283,570,266) (283,570,266) (96,363,266) (83,695,602) (283,570,266) ‐ 30%
42 Licenses & Permits2 (6,040,406) (6,040,406) (492,644) (527,459) (6,040,406) ‐ 9%
43 Fines Forfeits & Penalties3 (190,000) (190,000) (18,845) (25,260) (190,000) ‐ 13%
44 Revenue from Money & Property4 (4,003,465) (4,003,465) (264,750) (290,259) (4,003,465) ‐ 7%
45 Intergovernmental Revenues5 16 (259,580,413) (259,580,413) (372,639) (11,665,437) (259,580,413) ‐ 4%
46 Charges For Services6 (2,967,964) (2,967,964) (337,482) (346,226) (2,967,964) ‐ 12%
47 Reimbursements7 (135,440) (135,440) (1,125) (59) (135,440) ‐ 0%
48 Other Revenues8 (238,650) (238,650) (3,030) (23,774) (238,650) ‐ 10%
53 Other Financing Sources9 (16,554,137) (16,554,137) (2,811) ‐ (9,887,471) 6,666,666 0%
Total Revenues17 (573,280,741) (573,280,741) (97,856,592) (96,574,076) (566,614,075) 6,666,666 17%
MARB 9/19/19
Expenditure Category
FY2020 ADOPTED
BUDGET
FY2020 REVISED
BUDGET
FY2019 ACTUAL
(JULY)
FY2020 ACTUAL
(JULY)
FY2020
PROJECTION VARIANCE % EXP.
Payroll10 110,295,287 110,431,957 6,004,838 6,222,484 110,431,957 ‐ 6%
Benefits 94,148,565 94,148,565 9,350,527 8,512,702 94,148,565 ‐ 9%
Debt & Other Capital11 14 16,310,036 16,310,036 9,632 9,632 16,310,036 ‐ 0%
Library12 8,201,317 8,201,317 123,611 127,888 1,534,651 6,666,666 2%
Metro Hartford Innovation Services 3,193,214 3,193,214 264,509 266,101 3,193,214 ‐ 8%
Utilities17 25,865,608 25,865,608 3,034,715 3,302,550 25,865,608 ‐ 13%
Other Non‐Personnel15 31,253,440 31,116,770 1,391,429 1,356,169 31,116,770 ‐ 4%
Education13 284,013,274 284,013,274 8,002,775 8,003,199 284,013,274 ‐ 3%
Total Expenditures15 573,280,741 573,280,741 28,182,037 27,800,724 566,614,075 6,666,666 5%
Revenues and Expenditures, Net ‐ ‐ (69,674,556) (68,773,352) ‐
Council Approved Use of Fund Balance ‐
Net Surplus/(Deficit) ‐ ‐ 69,674,556 68,773,352 0
See footnotes on page 2.
1

REVENUE FOOTNOTES
EXPENDITURE FOOTNOTES
1 FY2020 General Property Tax revenues are tracking lower comparing to the FY2019 Period 1 (July) due to timming.2 The Licenses and Permits revenue category is primarily comprised of building, electrical, mechanical, plumbing permits, and food and milk
dealer licenses. This revenue category is in a line with the FY2020 budget and tracking favorable comparing to the FY2019 Period 1 (July).
3 The Fines, Forfeits and Penalties revenue line item is primarily comprised of false alarms fines.
4 Revenue from Money and Property contains lease/rental and short‐term investment income. FY2020 actuals tracking favorable comparing
to the FY2019 Period 1 (July) due to a more favorable interest rate environment for short‐term investment income.5 FY2020 Intergovernmental Revenues YTD primarily reflect the receipt of the car tax revenues from the state.
13 Education YTD actuals reflect 1 month of the City's tax supported payment of $96.0M. The $188.0M ECS will be recorded as received by the
State.
12 The Library is projected to be favorable due to $6.667M of the Corporate Contribution being provided directly to the Hartford Public
15 The City's financial system (Munis) reflects revenues as negative values (credits) and expenditures as positive values. A negative variance
for revenues is favorable. A positive variance for revenue is unfavorable.
6 Charges for Services contains revenues associated with the conveyance tax, transcript/filing of records and special events. This revenue line
item varies each year with historical actuals ranging from $2.8M to $4.2M.7 Reimbursements (primarily Section 8) primarily occur at fiscal year end.
8 Other Revenues will vary year to year based on unanticipated items such as settlements.
9 Other Financing Sources reflects revenues from Corporate Contribution, DoNo Stadium Fund, the Parking Authority Fund, Special Police
Service Fund and other (interest from CIP Investment account). Corporate Contribution of $10M, of which $3.333M will be provided directly
to the City of Hartford General Fund and $6.667M has been provided directly to the Hartford Public Library. A corresponding appropriation
reduction has been noted to reflect this arrangement.
10 Payroll will be monitored throughout the fiscal year for the impacts of attrition and overtime.
14 Under the executed Contract Assistance agreement, $45.67M of General Obligation debt service payments are maded on the City's behalf
by the State of Connecticut in FY2020. Consistent with GAAP rules, the contract assistance payments are recorded as donated capital revenue.
The debt service expenditures are recorded in the ledger in the Debt Service line item to properly reflect the retirement of debt. This
unbudgeted debt expense is offset by contract assistance revenue, together of which nets to zero.
11 The FY2020 Adopted Budget for Debt & Other Capital actuals are comprised of $4.65M for Downtown North principal and interest, $95K for
a Grant in Lieu of Taxes payment, and $116K for Clean Water loan principal and interest for a total of $4.86M. The budget for Pay GO CAPEX of
$11.45M will be reaclocated to the CIP fund in August. The combined total is $16.31M.
2
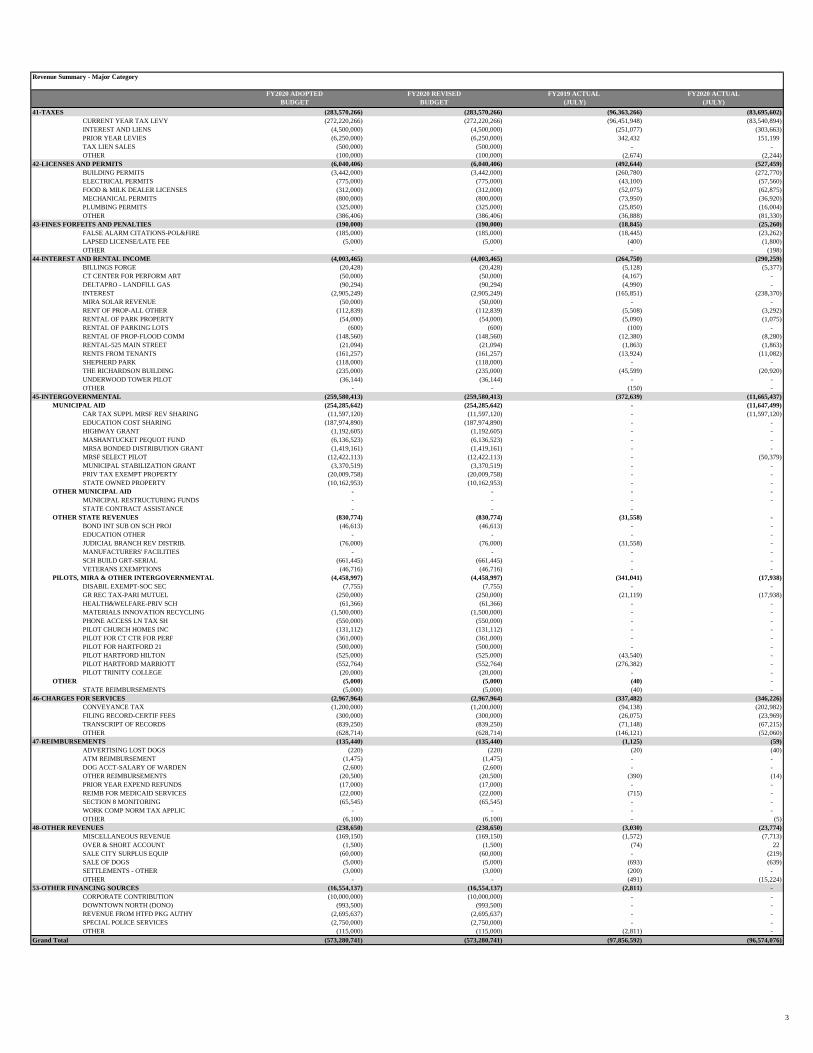
Revenue Summary - Major Category
FY2020 ADOPTED
BUDGET
FY2020 REVISED
BUDGET
FY2019 ACTUAL
(JULY)
FY2020 ACTUAL
(JULY)
41-TAXES (283,570,266) (283,570,266) (96,363,266) (83,695,602)
CURRENT YEAR TAX LEVY (272,220,266) (272,220,266) (96,451,948) (83,540,894)
INTEREST AND LIENS (4,500,000) (4,500,000) (251,077) (303,663)
PRIOR YEAR LEVIES (6,250,000) (6,250,000) 342,432 151,199
TAX LIEN SALES (500,000) (500,000) - -
OTHER (100,000) (100,000) (2,674) (2,244)
42-LICENSES AND PERMITS (6,040,406) (6,040,406) (492,644) (527,459)
BUILDING PERMITS (3,442,000) (3,442,000) (260,780) (272,770)
ELECTRICAL PERMITS (775,000) (775,000) (43,100) (57,560)
FOOD & MILK DEALER LICENSES (312,000) (312,000) (52,075) (62,875)
MECHANICAL PERMITS (800,000) (800,000) (73,950) (36,920)
PLUMBING PERMITS (325,000) (325,000) (25,850) (16,004)
OTHER (386,406) (386,406) (36,888) (81,330)
43-FINES FORFEITS AND PENALTIES (190,000) (190,000) (18,845) (25,260)
FALSE ALARM CITATIONS-POL&FIRE (185,000) (185,000) (18,445) (23,262)
LAPSED LICENSE/LATE FEE (5,000) (5,000) (400) (1,800)
OTHER - - - (198)
44-INTEREST AND RENTAL INCOME (4,003,465) (4,003,465) (264,750) (290,259)
BILLINGS FORGE (20,428) (20,428) (5,128) (5,377)
CT CENTER FOR PERFORM ART (50,000) (50,000) (4,167) -
DELTAPRO - LANDFILL GAS (90,294) (90,294) (4,990) -
INTEREST (2,905,249) (2,905,249) (165,851) (238,370)
MIRA SOLAR REVENUE (50,000) (50,000) - -
RENT OF PROP-ALL OTHER (112,839) (112,839) (5,508) (3,292)
RENTAL OF PARK PROPERTY (54,000) (54,000) (5,090) (1,075)
RENTAL OF PARKING LOTS (600) (600) (100) -
RENTAL OF PROP-FLOOD COMM (148,560) (148,560) (12,380) (8,280)
RENTAL-525 MAIN STREET (21,094) (21,094) (1,863) (1,863)
RENTS FROM TENANTS (161,257) (161,257) (13,924) (11,082)
SHEPHERD PARK (118,000) (118,000) - -
THE RICHARDSON BUILDING (235,000) (235,000) (45,599) (20,920)
UNDERWOOD TOWER PILOT (36,144) (36,144) - -
OTHER - - (150) -
45-INTERGOVERNMENTAL (259,580,413) (259,580,413) (372,639) (11,665,437)
MUNICIPAL AID (254,285,642) (254,285,642) - (11,647,499)
CAR TAX SUPPL MRSF REV SHARING (11,597,120) (11,597,120) - (11,597,120)
EDUCATION COST SHARING (187,974,890) (187,974,890) - -
HIGHWAY GRANT (1,192,605) (1,192,605) - -
MASHANTUCKET PEQUOT FUND (6,136,523) (6,136,523) - -
MRSA BONDED DISTRIBUTION GRANT (1,419,161) (1,419,161) - -
MRSF SELECT PILOT (12,422,113) (12,422,113) - (50,379)
MUNICIPAL STABILIZATION GRANT (3,370,519) (3,370,519) - -
PRIV TAX EXEMPT PROPERTY (20,009,758) (20,009,758) - -
STATE OWNED PROPERTY (10,162,953) (10,162,953) - -
OTHER MUNICIPAL AID - - - -
MUNICIPAL RESTRUCTURING FUNDS - - - -
STATE CONTRACT ASSISTANCE - - -
OTHER STATE REVENUES (830,774) (830,774) (31,558) -
BOND INT SUB ON SCH PROJ (46,613) (46,613) - -
EDUCATION OTHER - - - -
JUDICIAL BRANCH REV DISTRIB. (76,000) (76,000) (31,558) -
MANUFACTURERS' FACILITIES - - - -
SCH BUILD GRT-SERIAL (661,445) (661,445) - -
VETERANS EXEMPTIONS (46,716) (46,716) - -
PILOTS, MIRA & OTHER INTERGOVERNMENTAL (4,458,997) (4,458,997) (341,041) (17,938)
DISABIL EXEMPT-SOC SEC (7,755) (7,755) - -
GR REC TAX-PARI MUTUEL (250,000) (250,000) (21,119) (17,938)
HEALTH&WELFARE-PRIV SCH (61,366) (61,366) - -
MATERIALS INNOVATION RECYCLING (1,500,000) (1,500,000) - -
PHONE ACCESS LN TAX SH (550,000) (550,000) - -
PILOT CHURCH HOMES INC (131,112) (131,112) - -
PILOT FOR CT CTR FOR PERF (361,000) (361,000) - -
PILOT FOR HARTFORD 21 (500,000) (500,000) - -
PILOT HARTFORD HILTON (525,000) (525,000) (43,540) -
PILOT HARTFORD MARRIOTT (552,764) (552,764) (276,382) -
PILOT TRINITY COLLEGE (20,000) (20,000) - -
OTHER (5,000) (5,000) (40) -
STATE REIMBURSEMENTS (5,000) (5,000) (40) -
46-CHARGES FOR SERVICES (2,967,964) (2,967,964) (337,482) (346,226)
CONVEYANCE TAX (1,200,000) (1,200,000) (94,138) (202,982)
FILING RECORD-CERTIF FEES (300,000) (300,000) (26,075) (23,969)
TRANSCRIPT OF RECORDS (839,250) (839,250) (71,148) (67,215)
OTHER (628,714) (628,714) (146,121) (52,060)
47-REIMBURSEMENTS (135,440) (135,440) (1,125) (59)
ADVERTISING LOST DOGS (220) (220) (20) (40)
ATM REIMBURSEMENT (1,475) (1,475) - -
DOG ACCT-SALARY OF WARDEN (2,600) (2,600) - -
OTHER REIMBURSEMENTS (20,500) (20,500) (390) (14)
PRIOR YEAR EXPEND REFUNDS (17,000) (17,000) - -
REIMB FOR MEDICAID SERVICES (22,000) (22,000) (715) -
SECTION 8 MONITORING (65,545) (65,545) - -
WORK COMP NORM TAX APPLIC - - - -
OTHER (6,100) (6,100) - (5)
48-OTHER REVENUES (238,650) (238,650) (3,030) (23,774)
MISCELLANEOUS REVENUE (169,150) (169,150) (1,572) (7,713)
OVER & SHORT ACCOUNT (1,500) (1,500) (74) 22
SALE CITY SURPLUS EQUIP (60,000) (60,000) - (219)
SALE OF DOGS (5,000) (5,000) (693) (639)
SETTLEMENTS - OTHER (3,000) (3,000) (200) -
OTHER - - (491) (15,224)
53-OTHER FINANCING SOURCES (16,554,137) (16,554,137) (2,811) -
CORPORATE CONTRIBUTION (10,000,000) (10,000,000) - -
DOWNTOWN NORTH (DONO) (993,500) (993,500) - -
REVENUE FROM HTFD PKG AUTHY (2,695,637) (2,695,637) - -
SPECIAL POLICE SERVICES (2,750,000) (2,750,000) - -
OTHER (115,000) (115,000) (2,811) -
Grand Total (573,280,741) (573,280,741) (97,856,592) (96,574,076)
3
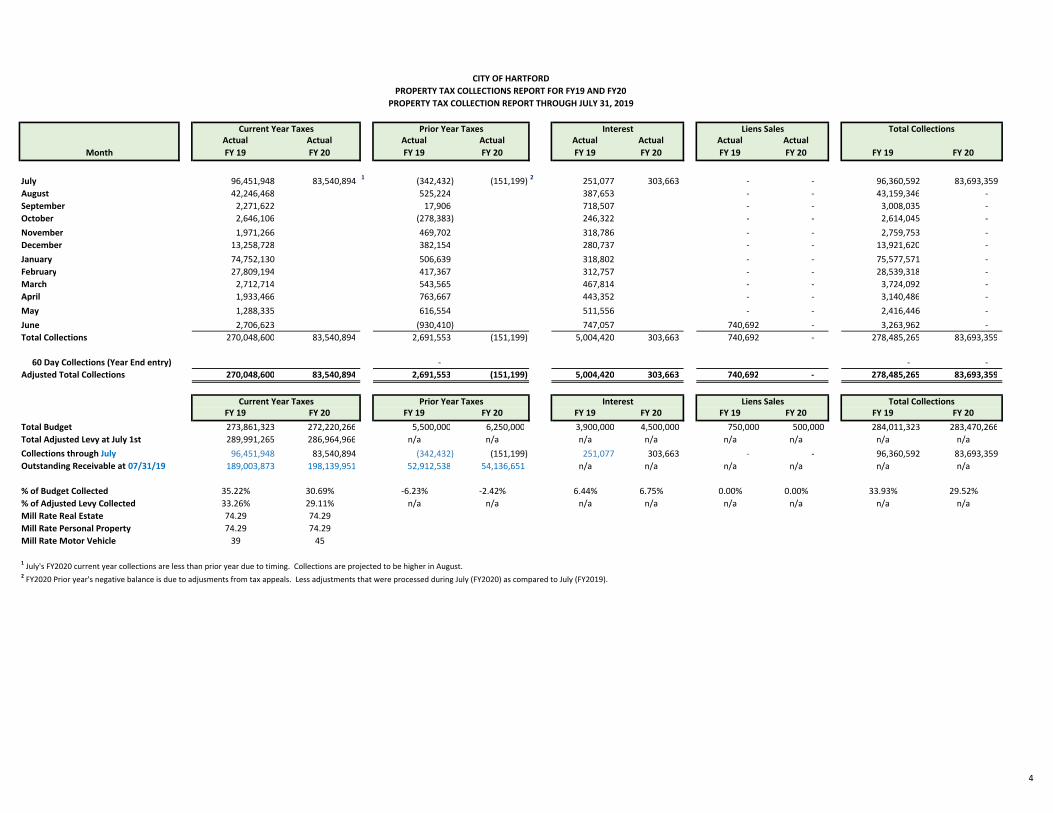
Month
Actual
FY 19
Actual
FY 20
Actual
FY 19
Actual
FY 20
Actual
FY 19
Actual
FY 20
Actual
FY 19
Actual
FY 20 FY 19 FY 20
July 96,451,948 83,540,894 1 (342,432) (151,199) 2 251,077 303,663 ‐ ‐ 96,360,592 83,693,359
August 42,246,468 525,224 387,653 ‐ ‐ 43,159,346 ‐
September 2,271,622 17,906 718,507 ‐ ‐ 3,008,035 ‐
October 2,646,106 (278,383) 246,322 ‐ ‐ 2,614,045 ‐
November 1,971,266 469,702 318,786 ‐ ‐ 2,759,753 ‐
December 13,258,728 382,154 280,737 ‐ ‐ 13,921,620 ‐
January 74,752,130 506,639 318,802 ‐ ‐ 75,577,571 ‐
February 27,809,194 417,367 312,757 ‐ ‐ 28,539,318 ‐
March 2,712,714 543,565 467,814 ‐ ‐ 3,724,092 ‐
April 1,933,466 763,667 443,352 ‐ ‐ 3,140,486 ‐
May 1,288,335 616,554 511,556 ‐ ‐ 2,416,446 ‐
June 2,706,623 (930,410) 747,057 740,692 ‐ 3,263,962 ‐
Total Collections 270,048,600 83,540,894 2,691,553 (151,199) 5,004,420 303,663 740,692 ‐ 278,485,265 83,693,359
60 Day Collections (Year End entry) ‐ ‐ ‐
Adjusted Total Collections 270,048,600 83,540,894 2,691,553 (151,199) 5,004,420 303,663 740,692 ‐ 278,485,265 83,693,359
FY 19 FY 20 FY 19 FY 20 FY 19 FY 20 FY 19 FY 20 FY 19 FY 20
Total Budget 273,861,323 272,220,266 5,500,000 6,250,000 3,900,000 4,500,000 750,000 500,000 284,011,323 283,470,266
Total Adjusted Levy at July 1st 289,991,265 286,964,966 n/a n/a n/a n/a n/a n/a n/a n/a
Collections through July 96,451,948 83,540,894 (342,432) (151,199) 251,077 303,663 ‐ ‐ 96,360,592 83,693,359
Outstanding Receivable at 07/31/19 189,003,873 198,139,951 52,912,538 54,136,651 n/a n/a n/a n/a n/a n/a
% of Budget Collected 35.22% 30.69% ‐6.23% ‐2.42% 6.44% 6.75% 0.00% 0.00% 33.93% 29.52%
% of Adjusted Levy Collected 33.26% 29.11% n/a n/a n/a n/a n/a n/a n/a n/a
Mill Rate Real Estate 74.29 74.29
Mill Rate Personal Property 74.29 74.29
Mill Rate Motor Vehicle 39 45
1 July's FY2020 current year collections are less than prior year due to timing. Collections are projected to be higher in August.2 FY2020 Prior year's negative balance is due to adjusments from tax appeals. Less adjustments that were processed during July (FY2020) as compared to July (FY2019).
CITY OF HARTFORD
PROPERTY TAX COLLECTIONS REPORT FOR FY19 AND FY20
PROPERTY TAX COLLECTION REPORT THROUGH JULY 31, 2019
Current Year Taxes Prior Year Taxes Interest Liens Sales Total Collections
Current Year Taxes Prior Year Taxes Interest Liens Sales Total Collections
4

FY2020 ADOPTED
BUDGET
FY2020 REVISED
BUDGET
FY2019 ACTUAL
(JULY)
FY2020 ACTUAL
(JULY)
FY2020
PROJECTION VARIANCE
00111 MAYOR'S OFFICE 802,661 802,661 43,006 61,879 802,661 0
00112 COURT OF COMMON COUNCIL 510,147 510,147 29,817 31,322 510,147 0
00113 TREASURER 470,860 470,860 26,376 26,302 470,860 0
00114 REGISTRARS OF VOTERS 470,367 629,044 23,316 19,151 629,044 0
00116 CORPORATION COUNSEL 1,551,808 1,551,808 83,660 75,141 1,551,808 0
00117 TOWN & CITY CLERK 800,095 800,095 36,656 31,734 800,095 0
00118 INTERNAL AUDIT 513,779 513,779 30,005 29,915 513,779 0
00119 CHIEF OPERATING OFFICER 818,222 818,222 53,734 70,785 818,222 0
00122 METRO HARTFORD INNOVATION SERV 3,193,214 3,193,214 264,509 266,101 3,193,214 0
00123 FINANCE 3,803,175 3,803,175 185,343 194,555 3,803,175 0
00125 HUMAN RESOURCES 1,257,176 1,257,176 61,803 56,757 1,257,176 0
00128 OFFICE OF MANAGEMENT & BUDGET 1,187,960 1,187,960 47,113 51,175 1,187,960 0
00132 CHILDREN FAMILY RECREATION 3,407,296 3,407,296 1,019,925 1,071,672 3,407,296 0
00211 FIRE 34,285,229 34,285,229 1,923,884 1,942,328 34,285,229 0
00212 POLICE 46,627,694 46,627,694 2,316,685 2,387,944 46,627,694 0
00213 EMERGENCY SERVICES & TELECOMM. 3,799,883 3,799,883 311,233 203,122 3,799,883 0
00311 PUBLIC WORKS 15,595,312 15,595,312 479,943 637,644 15,595,312 0
00420 DEVELOPMENT SERVICES 4,020,079 4,020,079 192,954 206,875 4,020,079 0
00520 HEALTH AND HUMAN SERVICES 5,063,719 5,063,719 102,248 149,118 5,063,719 0
00711 EDUCATION 284,013,274 284,013,274 8,002,775 8,003,199 284,013,274 0
00721 HARTFORD PUBLIC LIBRARY1 8,201,317 8,201,317 123,611 127,888 1,534,651 6,666,666
00820 BENEFITS & INSURANCES 94,148,565 94,148,565 9,350,527 8,512,702 94,148,565 0
00821 DEBT SERVICE 16,310,036 16,310,036 9,632 9,632 16,310,036 0
00822 NON OP DEPT EXPENDITURES 42,428,873 42,270,196 3,463,282 3,633,784 42,270,196 0
Grand Total 573,280,741 573,280,741 28,182,037 27,800,724 566,614,075 6,666,666
1 The Library is projected to be favorable due to $6.667M of the Corporate Contribution being provided directly to the Hartford Public Library.
Expenditure Summary ‐ Departments
5

Expenditure Summary ‐ Major Expenditure Category
FY2020 ADOPTED
BUDGET
FY2020 REVISED
BUDGET
FY2019 ACTUAL
(JULY)
FY2020 ACTUAL
(JULY)
FY2020
PROJECTION VARIANCE
PAYROLL 110,295,287 110,431,957 6,004,838 6,222,484 110,431,957 0
FT 94,243,829 94,243,829 4,660,311 4,817,065 94,243,829 0
HOL 2,480,489 2,480,489 179,593 178,394 2,480,489 0
OT 12,066,029 12,066,029 956,089 1,010,909 12,066,029 0
PT 1,504,940 1,641,610 208,846 216,116 1,641,610 0
BENEFITS 94,148,565 94,148,565 9,350,527 8,512,702 94,148,565 0
HEALTH 35,195,175 35,195,175 2,340,626 2,076,066 35,195,175 0
MITIGATION (500,000) (500,000) 0 0 (500,000) 0
PENSION 48,109,987 48,109,987 3,973,296 3,326,142 48,109,987 0
INSURANCE 4,890,000 4,890,000 2,268,650 2,350,725 4,890,000 0
CONCESSIONS 0 0 0 0 0 0
FRINGE REIMBURSEMENTS (3,800,000) (3,800,000) (82,413) (88,138) (3,800,000) 0
LIFE INSURANCE 315,652 315,652 21,145 19,373 315,652 0
OTHER BENEFITS 4,698,957 4,698,957 329,224 332,702 4,698,957 0
WAGE (111,206) (111,206) 0 0 (111,206) 0
WORKERS COMP 5,350,000 5,350,000 500,000 495,833 5,350,000 0
DEBT 16,310,036 16,310,036 9,632 9,632 16,310,036 0
DEBT 16,310,036 16,310,036 9,632 9,632 16,310,036 0
LIBRARY 8,201,317 8,201,317 123,611 127,888 1,534,651 6,666,666
LIBRARY1 8,201,317 8,201,317 123,611 127,888 1,534,651 6,666,666
MHIS 3,193,214 3,193,214 264,509 266,101 3,193,214 0
MHIS 3,193,214 3,193,214 264,509 266,101 3,193,214 0
UTILITY 25,865,608 25,865,608 3,034,715 3,302,550 25,865,608 0
UTILITY 25,865,608 25,865,608 3,034,715 3,302,550 25,865,608 0
OTHER 31,253,440 31,116,770 1,391,429 1,356,169 31,116,770 0
COMMUNITY ACTIVITIES 2,342,699 2,342,699 801,547 851,591 2,342,699 0
CONTINGENCY 4,022,152 4,022,152 45,155 0 4,022,152 0
CONTRACTED SERVICES 4,071,425 4,078,895 87,834 18,557 4,078,895 0
ELECTIONS 458,146 299,469 0 0 299,469 0
GOVT AGENCY & OTHER 0 0 0 0 0 0
LEASES ‐ OFFICES PARKING COPIER 2,033,636 2,033,636 111,671 122,752 2,033,636 0
LEGAL EXPENSES & SETTLEMENTS 3,216,500 3,216,500 67,850 0 3,216,500 0
OTHER 4,313,833 4,313,833 176,663 265,823 4,313,833 0
OUT AGENCY 0 0 0 0 0 0
POSTAGE 200,000 200,000 25,000 50,000 200,000 0
SUPPLY 4,396,572 4,420,572 17,992 15,034 4,420,572 0
TECH, PROF & COMM BASED SERVICES 2,506,553 2,497,090 53,139 32,411 2,497,090 0
VEHICLE & EQUIP 3,691,924 3,691,924 4,578 0 3,691,924 0
EDUCATION 284,013,274 284,013,274 8,002,775 8,003,199 284,013,274 0
EDUCATION 284,013,274 284,013,274 8,002,775 8,003,199 284,013,274 0
Grand Total 573,280,741 573,280,741 28,182,037 27,800,724 566,614,075 6,666,666
1 The Library is projected to be favorable due to $6.667M of the Corporate Contribution being provided directly to the Hartford Public Library.
6

Appendix

FY2020 Full‐time (FT) Payroll Projection (July)
DEPARTMENTS BUDGETED HC BUDGETED ANNUAL AMOUNT
(REV)Projection
VARIANCE (BUDGETED
ANNUAL AMOUNT (REV) ‐
YTD ACTUALS)
111‐Mayor 11 748,913 748,913 0
112‐CCC 7 354,851 354,851 0
113‐ Treas 9 393,548 393,548 0
114‐ ROV 7 333,236 333,236 0
116‐Corp Counsel 16 1,493,753 1,493,753 0
117‐ Clerk 10 662,701 662,701 0
118‐Audit 5 509,901 509,901 0
119‐COO 6 498,868 498,868 0
123‐ FIN 45 3,448,056 3,448,056 0
125‐ HR 13 936,431 936,431 0
128‐OMBG 13 1,080,130 1,080,130 0
132‐FCYR 11 792,033 792,033 0
211‐ Fire 368 27,117,637 27,117,637 0
212‐ Police 537 38,289,832 38,289,832 0
213‐ EST 49 3,002,483 3,002,483 0
311‐ DPW 197 10,261,421 10,261,421 0
420‐ Devel Serv 52 3,863,440 3,863,440 0
520‐ HHS 33 2,152,369 2,152,369 0
Grand Total 1,389 95,939,603 95,939,603 0
FT‐ Fire Attrition (510,000)
FT‐ Police Attrition (1,252,299)
FT‐ Development Services Attrition (20,000)
FT‐ Net other payroll (stand‐by & longevity) 86,525
FT‐ Total Revised Budget 94,243,829
Assumptions
1) Future Police FY2020 classes are planned for the Fall (32 hires) and Spring (32 hires)
2) No future Fire FY2020 classes planned
3) Adopted head count is 1403 with 14 MHIS positions funded in the MHIS internal service fund
7

City of Hartford
FY2019 Monthly Financial Report to the Municipal Accountability Review
Board
June 2019 (FY2019 P13)
Meeting date: September 19, 2019
City of Hartford
Budget and Financial Report
to the Municipal Accountability Review Board
FY2019 General Fund Summary 1
Revenue and Expenditure Footnotes 2
Revenue Summary ‐ Major Category 3
Tax Collections 4
Expenditure Summary ‐ Departments 5
Expenditure Summary ‐ Major Category 6
Appendix ‐ Full‐time payroll 7

City of Hartford ‐ FY2019 General Fund Financial Report & Projection
MARB 9/19/19
Revenue Category
FY2018
ACTUAL
FY2019 ADOPTED
BUDGET
FY2019 REVISED
BUDGET
FY2018
ACTUAL
FY2019 ACTUAL
(YTD)
FY2019
PROJECTION O VARIANCE % COLL.
41 General Property Taxes1 (282,456,413) (284,111,323) (284,111,323) (282,456,413) (278,544,159) (277,177,942) 6,933,381 98%
42 Licenses & Permits2
(6,065,824) (5,671,406) (5,671,406) (6,065,824) (6,378,386) (6,378,386) (706,980) 112%
43 Fines Forfeits & Penalties3
(149,601) (190,000) (190,000) (149,601) (249,446) (249,446) (59,446) 131%
44 Revenue from Money & Property4
(2,382,396) (1,313,149) (1,313,149) (2,382,396) (4,274,741) (4,274,741) (2,961,592) 326%
45 Intergovernmental Revenues5 16
(292,903,825) (258,950,890) (259,548,586) (292,903,825) (258,453,346) (258,453,346) 1,095,240 100%
46 Charges For Services6
(3,647,518) (2,929,483) (2,929,483) (3,647,518) (4,167,254) (4,167,254) (1,237,771) 142%
47 Reimbursements7
(134,317) (152,840) (152,840) (134,317) (122,833) (122,833) 30,007 80%
48 Other Revenues8
(1,313,009) (238,650) (238,650) (1,313,009) (452,839) (452,839) (214,189) 190%
53 Other Financing Sources9 (5,543,864) (16,483,365) (16,483,365) (5,543,864) (10,466,382) (10,466,382) 6,016,983 63%
Total Revenues17 (594,596,768) (570,041,106) (570,638,802) (594,596,768) (563,109,386) (561,743,169) 8,895,633 99%
MARB 9/19/19
Expenditure Category
FY2018
ACTUAL
FY2019 ADOPTED
BUDGET
FY2019 REVISED
BUDGET
FY2018
ACTUAL
FY2019 ACTUAL
(YTD)
FY2019
PROJECTION O VARIANCE % EXP.
Payroll10 102,266,638 108,197,525 108,070,867 102,266,638 97,663,355 97,663,355 10,407,512 90%
Benefits11
90,369,281 93,793,869 93,793,869 90,369,281 83,783,519 85,804,740 7,989,129 89%
Debt & Other Capital12 16
58,011,334 17,423,430 17,423,430 58,011,334 17,333,583 27,911,468 (10,488,038) 99%
Library13
8,100,000 8,150,000 8,150,000 8,100,000 1,483,334 1,483,334 6,666,666 18%
Metro Hartford Innovation Services 2,996,431 3,174,113 3,174,113 2,996,431 3,174,113 3,174,113 ‐ 100%
Utilities17
22,079,682 23,964,607 23,994,285 22,079,682 23,414,737 23,414,737 579,548 98%
Other Non‐Personnel15
26,467,959 31,329,374 31,426,354 26,467,959 27,954,173 32,587,706 (1,161,352) 89%
Education14
283,943,410 284,008,188 284,605,884 283,943,410 284,076,929 284,076,929 528,955 100%
Total Expenditures18 594,234,736 570,041,106 570,638,802 594,234,736 538,883,742 556,116,381 14,522,421 94%
Revenues and Expenditures, Net (362,032) ‐ ‐ (362,032) (24,225,644) (5,626,787)
Council Approved Use of Fund Balance ‐ ‐
Net Surplus/(Deficit) 362,032 ‐ ‐ 362,032 24,225,644 5,626,787
Post June/P13 actuals do not reflect the completed FY2019 outside audit.
See footnotes on page 2.
1

REVENUE FOOTNOTES
EXPENDITURE FOOTNOTES
1 The General Property Tax revenue category projection includes 60‐Day Collection GAAP rule estimated adjustment of $1.37M reduction in revenue and the
actual adjustment will be recorded in the end of September. 1) Current year tax levy actual revenues of $270.02M are lower than the Adopted Budget by
$3.81M due to court appeals and tax abatement adjustments. 2) Interest and liens actuals of $5.00M have exceeded the Adopted Budget by $1.10M; 3) Prior
year levy actual revenues of $2.69M are lower than the Adopted Budget by $2.81M due to adjustments for any appeals settled through the Board of
Assessment or the court process.
2 The Licenses and Permits revenue category is primarily comprised of building, electrical, mechanical, plumbing permits, and food and milk dealer licenses.
FY2019 actuals of $6.38M have exceeded the Adopted Budget by $707K.3 The Fines, Forfeits and Penalties revenue line item is primarily comprised of false alarms fines. FY2019 actuals of $249K have exceeded the Adopted Budget by
$59K.4 Revenue from Money and Property contains lease/rental and short‐term investment income. FY2019 actuals of $4.27M exceeded the Adopted Budget by
$2.96M due to a more favorable interest rate environment for short‐term investment income.5 The Intergovernmental Revenues actuals of $258.50M, which is lower by $1.04M than the Revised Budget. This shortfall is attributed to $529K in ECS due to
the year end, reconciling adjustment for the State Special Education Fund. With $708K due to a delay in the receipt from the State for the School Building Grant
and the Bond Interest Subsidy on School Projects. Offset by higher levy of PILOT Payments from Hartford Businesses.
14 Education YTD actuals reflect 12 months of the City's tax supported payment of $96.0M and the $188.0M the State ECS allocation transfer. The Education
Revised Budget and actual have increased by $598K due to the State Department of Education providing additional funding for the educational support of
displaced students from Puerto Rico and offset by a reduction of $529K, due to the year end, reconciling adjustment for the State Special Education Fund.
13 Due to $6.667M of the Corporate Contribution provided directly to the Hartford Public Library (has been received), the annual Library appropriation has been
adjusted accordingly.
18 The City's financial system (Munis) reflects revenues as negative values (credits) and expenditures as positive values. A negative variance for revenues is
favorable. A positive variance for revenue is unfavorable.
6 Charges for Services contains revenues associated with the conveyance tax, transcript/filing of records and special events. FY2019 Revenue totals of $4.17M,
approximately $1.24M in excess of the Adopted Budget. The major driver of this increase is unanticipated conveyance tax revenues.7 Reimbursements (primarily Section 8) primarily occur at fiscal year end and reflect revenues of $123K for FY2019.8 Other Revenues exceeded the Adopted Budget by $214K due to one‐time revenues associated with various settlements.9 Other Financing Sources reflects revenues from Corporate Contribution, DoNo Stadium Fund, the Parking Authority Fund, Special Police Service Fund and
other (interest from CIP Investment account). 1) Corporate Contribution of $10.0M, of which $3.141M has been received by the City of Hartford and placed in
the General Fund, and $6.667M received by the Hartford Public Library posted in FY2019. A corresponding appropriation reduction has been noted to reflect
this arrangement; 2) Actuals from DoNo stadium are lower due to a delay in DoNo PILOT revenues offset by revenue sharing from non‐game events and HPA
parking; 3) Actuals from the HPA of $2.99M exceeded the Adopted Budget by $571K; 4) Special Police Private Duty actuals of $2.95M have exceeded the
Adopted Budget by $205K; 5) Actuals from the CIP investment account of $215K have exceeded the Adopted Budget by $100K.
10 Net favorable variance of $10.40M in Payroll is due to a delay in refilling vacancies of $11.42M (see page 7) and holiday pay (HOL) of $301K, offset by $1.03M
in Public Safety and DPW overtime (OT) and by $279K in part‐time (PT).
16 Under the executed Contract Assistance agreement, $48.56M of General Obligation debt service payments are maded on the City's behalf by the State of
Connecticut in FY2019. Consistent with GAAP rules, the contract assistance payments are recorded as donated capital revenue. The debt service expenditures
are recorded in the ledger in the Debt Service line item to properly reflect the retirement of debt. This unbudgeted debt expense is offset by contract assistance
revenue, together of which nets to zero.
11 The primary drivers of favorability in Benefits are favorable health care expenditures, vacation/sick payouts, other benefits, and fringe reimbursements from
grants. IBNR adjustments for Workers Comp & Insurance will be recorded in October.
17 Utilities are net favorable by $580K, with favorabilty coming from electricity and fuels.
15 Other Non‐Personnel is net unfavorable by $1.16M. Vehicles and Equipment expenditures are $4.60M unfavorable due to equipment and technology critical
needs for public safety functions; offset by legal services and settlements that are $267K favorable, plus net favorability in other non‐personnel line items city‐
wide.
12 The FY2019 Adopted Budget for Debt & Other Capital actuals are comprised of $4.64M for Downtown North, $103K for a Grant in Lieu of Taxes payment, and
$116K for Clean Water loan principal and interest for a total of $4.85M. Pay‐As‐You‐Go CapEx of $12.48M has been expended by the City of Hartford. In
addition, $10.50M of needed capital expenditures are projected, which is offset by $12K of interest earned in the escrow account that was applied to DONO
interest payment.
2

Revenue Summary - Major Category
FY2018 AUDITED
ACTUAL
FY2019 ADOPTED
BUDGET
FY2019 REVISED
BUDGET
FY2018 ACTUAL
(JUNE)
FY2019 ACTUAL
(JUNE)
41-TAXES (282,456,413) (284,111,323) (284,111,323) (282,456,413) (278,544,159)
CURRENT YEAR TAX LEVY (270,362,368) (273,861,323) (273,861,323) (270,362,368) (270,024,993)
INTEREST AND LIENS (3,709,011) (3,900,000) (3,900,000) (3,709,011) (5,004,287)
PRIOR YEAR LEVIES (6,748,683) (5,500,000) (5,500,000) (6,748,683) (2,690,993)
TAX LIEN SALES (1,576,115) (750,000) (750,000) (1,576,115) (740,692)
OTHER (60,237) (100,000) (100,000) (60,237) (83,194)
42-LICENSES AND PERMITS (6,065,824) (5,671,406) (5,671,406) (6,065,824) (6,378,386)
BUILDING PERMITS (3,669,844) (3,442,000) (3,442,000) (3,669,844) (3,248,523)
ELECTRICAL PERMITS (795,555) (627,000) (627,000) (795,555) (972,254)
FOOD & MILK DEALER LICENSES (440,293) (312,000) (312,000) (440,293) (289,194)
MECHANICAL PERMITS (385,025) (639,000) (639,000) (385,025) (830,946)
PLUMBING PERMITS (328,075) (265,000) (265,000) (328,075) (399,136)
OTHER (447,032) (386,406) (386,406) (447,032) (638,333)
43-FINES FORFEITS AND PENALTIES (149,601) (190,000) (190,000) (149,601) (249,446)
FALSE ALARM CITATIONS-POL&FIRE (138,718) (185,000) (185,000) (138,718) (239,289)
LAPSED LICENSE/LATE FEE (9,200) (5,000) (5,000) (9,200) (4,700)
OTHER (1,683) - - (1,683) (5,458)
44-INTEREST AND RENTAL INCOME (2,382,396) (1,313,149) (1,313,149) (2,382,396) (4,274,741)
BILLINGS FORGE (19,784) (20,000) (20,000) (19,784) (20,308)
CT CENTER FOR PERFORM ART (82,193) (50,000) (50,000) (82,193) (50,000)
DELTAPRO - LANDFILL GAS (79,146) (90,294) (90,294) (79,146) (10,202)
INTEREST (1,403,467) (252,000) (252,000) (1,403,467) (3,121,304)
MIRA SOLAR REVENUE (23,787) (50,000) (50,000) (23,787) -
RENT OF PROP-ALL OTHER (112,839) (79,600) (79,600) (112,839) (109,809)
RENTAL OF PARK PROPERTY (70,869) (54,000) (54,000) (70,869) (60,021)
RENTAL OF PARKING LOTS (7,800) (600) (600) (7,800) (300)
RENTAL OF PROP-FLOOD COMM (147,320) (148,560) (148,560) (147,320) (107,880)
RENTAL-525 MAIN STREET (27,009) (17,694) (17,694) (27,009) (22,456)
RENTS FROM TENANTS (151,060) (161,257) (161,257) (151,060) (180,426)
SHEPHERD PARK - (118,000) (118,000) - (241,289)
THE RICHARDSON BUILDING (220,979) (235,000) (235,000) (220,979) (313,952)
UNDERWOOD TOWER PILOT (36,144) (36,144) (36,144) (36,144) (36,144)
OTHER - - - - (650)
45-INTERGOVERNMENTAL (292,903,825) (258,950,890) (259,548,586) (292,903,825) (258,453,346)
MUNICIPAL AID (254,258,371) (253,763,984) (254,361,680) (254,258,371) (253,863,415)
CAR TAX SUPPL MRSF REV SHARING (12,177,213) (11,078,328) (11,078,328) (12,177,213) (11,078,328)
EDUCATION COST SHARING (186,667,434) (187,969,804) (188,567,500) (186,667,434) (188,043,631)
HIGHWAY GRANT (1,194,825) (1,194,825) (1,194,825) (1,194,825) (1,192,605)
MASHANTUCKET PEQUOT FUND (6,263,314) (6,136,523) (6,136,523) (6,263,314) (6,136,523)
MRSA BONDED DISTRIBUTION GRANT (1,443,052) (1,419,161) (1,419,161) (1,443,052) (1,446,985)
MRSF SELECT PILOT (11,883,205) (12,422,113) (12,422,113) (11,883,205) (12,422,113)
MUNICIPAL STABILIZATION GRANT (4,456,568) (3,370,519) (3,370,519) (4,456,568) (3,370,519)
PRIV TAX EXEMPT PROPERTY (20,009,758) (20,009,758) (20,009,758) (20,009,758) (20,009,758)
STATE OWNED PROPERTY (10,163,003) (10,162,953) (10,162,953) (10,163,003) (10,162,953)
OTHER MUNICIPAL AID (31,888,917) - - (31,888,917) -
MUNICIPAL RESTRUCTURING FUNDS (20,000,000) - - (20,000,000) -
STATE CONTRACT ASSISTANCE (11,888,917) - - (11,888,917) -
OTHER STATE REVENUES (2,515,219) (879,617) (879,617) (2,515,219) (111,786)
BOND INT SUB ON SCH PROJ (46,620) (46,613) (46,613) (46,620) -
EDUCATION OTHER (1,307,456) - - (1,307,456) -
JUDICIAL BRANCH REV DISTRIB. (44,931) (76,000) (76,000) (44,931) (89,972)
MANUFACTURERS' FACILITIES - (48,843) (48,843) - -
SCH BUILD GRT-SERIAL (1,077,079) (661,445) (661,445) (1,077,079) -
VETERANS EXEMPTIONS (39,133) (46,716) (46,716) (39,133) (21,814)
PILOTS, MIRA & OTHER INTERGOVERNMENTAL (4,238,518) (4,302,289) (4,302,289) (4,238,518) (4,473,045)
DISABIL EXEMPT-SOC SEC (6,813) (7,755) (7,755) (6,813) (6,223)
GR REC TAX-PARI MUTUEL (215,473) (250,000) (250,000) (215,473) (206,810)
HEALTH&WELFARE-PRIV SCH (48,772) (61,366) (61,366) (48,772) (54,629)
MATERIALS INNOVATION RECYCLING (1,500,000) (1,500,000) (1,500,000) (1,500,000) (1,500,000)
PHONE ACCESS LN TAX SH (447,477) (550,000) (550,000) (447,477) (447,838)
PILOT CHURCH HOMES INC (131,112) (131,112) (131,112) (131,112) (131,112)
PILOT FOR CT CTR FOR PERF (361,859) (357,056) (357,056) (361,859) (513,422)
PILOT FOR HARTFORD 21 (500,000) (500,000) (500,000) (500,000) (500,000)
PILOT HARTFORD HILTON (522,483) (525,000) (525,000) (522,483) (540,247)
PILOT HARTFORD MARRIOTT (484,529) (400,000) (400,000) (484,529) (552,763)
PILOT TRINITY COLLEGE (20,000) (20,000) (20,000) (20,000) (20,000)
OTHER (2,800) (5,000) (5,000) (2,800) (5,100)
STATE REIMBURSEMENTS (2,800) (5,000) (5,000) (2,800) (5,100)
46-CHARGES FOR SERVICES (3,647,518) (2,929,483) (2,929,483) (3,647,518) (4,167,254)
CONVEYANCE TAX (1,301,512) (1,155,519) (1,155,519) (1,301,512) (1,913,349)
FILING RECORD-CERTIF FEES (327,904) (300,000) (300,000) (327,904) (280,062)
TRANSCRIPT OF RECORDS (811,703) (839,250) (839,250) (811,703) (829,705)
OTHER (1,206,399) (634,714) (634,714) (1,206,399) (1,144,137)
47-REIMBURSEMENTS (134,317) (152,840) (152,840) (134,317) (122,833)
ADVERTISING LOST DOGS (155) (220) (220) (155) (980)
ATM REIMBURSEMENT (527) (1,475) (1,475) (527) (399)
DOG ACCT-SALARY OF WARDEN (1,992) (2,600) (2,600) (1,992) (2,291)
OTHER REIMBURSEMENTS (7,274) (17,900) (17,900) (7,274) (4,438)
PRIOR YEAR EXPEND REFUNDS (10,796) (17,000) (17,000) (10,796) -
REIMB FOR MEDICAID SERVICES (20,933) (22,000) (22,000) (20,933) (9,945)
SECTION 8 MONITORING (78,778) (85,545) (85,545) (78,778) (87,497)
WORK COMP NORM TAX APPLIC - - - - -
OTHER (13,863) (6,100) (6,100) (13,863) (17,284)
48-OTHER REVENUES (1,313,009) (238,650) (238,650) (1,313,009) (452,839)
MISCELLANEOUS REVENUE (139,033) (169,150) (169,150) (139,033) (155,122)
OVER & SHORT ACCOUNT (375) (1,500) (1,500) (375) (1,007)
SALE CITY SURPLUS EQUIP (22) (60,000) (60,000) (22) (783)
SALE OF DOGS (3,609) (5,000) (5,000) (3,609) (7,152)
SETTLEMENTS - OTHER (870,008) (3,000) (3,000) (870,008) (215,998)
OTHER (299,962) - - (299,962) (72,777)
53-OTHER FINANCING SOURCES (5,543,864) (16,483,365) (16,483,365) (5,543,864) (10,466,382)
CORPORATE CONTRIBUTION - (10,000,000) (10,000,000) - (3,141,333)
DOWNTOWN NORTH (DONO) (933,953) (1,193,500) (1,193,500) (933,953) (1,134,590)
REVENUE FROM HTFD PKG AUTHY (2,366,924) (2,424,865) (2,424,865) (2,366,924) (2,995,732)
SPECIAL POLICE SERVICES (2,153,090) (2,750,000) (2,750,000) (2,153,090) (2,955,127)
OTHER (89,896) (115,000) (115,000) (89,896) (239,599)
Grand Total (594,596,768) (570,041,106) (570,638,802) (594,596,768) (563,109,386)
3
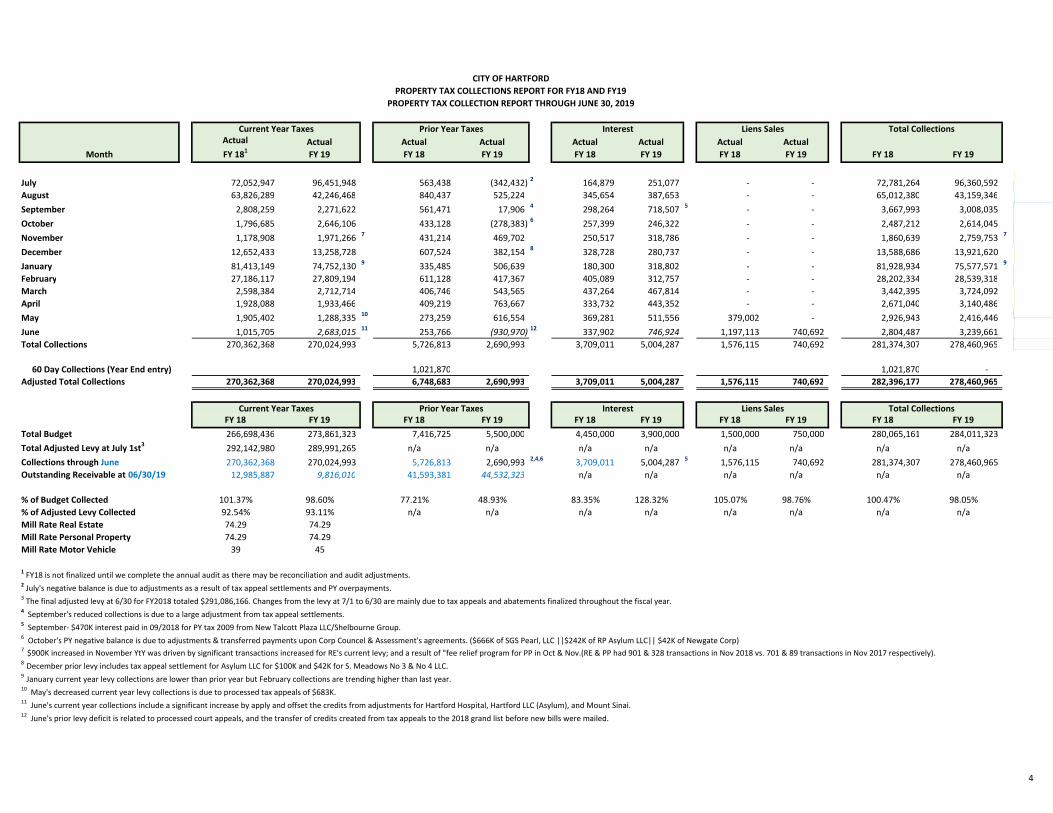
Month
Actual
FY 181
Actual
FY 19
Actual
FY 18
Actual
FY 19
Actual
FY 18
Actual
FY 19
Actual
FY 18
Actual
FY 19 FY 18 FY 19
July 72,052,947 96,451,948 563,438 (342,432) 2 164,879 251,077 ‐ ‐ 72,781,264 96,360,592
August 63,826,289 42,246,468 840,437 525,224 345,654 387,653 ‐ ‐ 65,012,380 43,159,346
September 2,808,259 2,271,622 561,471 17,906 4 298,264 718,507 5 ‐ ‐ 3,667,993 3,008,035
October 1,796,685 2,646,106 433,128 (278,383) 6 257,399 246,322 ‐ ‐ 2,487,212 2,614,045
November 1,178,908 1,971,266 7431,214 469,702 250,517 318,786 ‐ ‐ 1,860,639 2,759,753
7
December 12,652,433 13,258,728 607,524 382,154 8 328,728 280,737 ‐ ‐ 13,588,686 13,921,620
January 81,413,149 74,752,130 9 335,485 506,639 180,300 318,802 ‐ ‐ 81,928,934 75,577,571 9
February 27,186,117 27,809,194 611,128 417,367 405,089 312,757 ‐ ‐ 28,202,334 28,539,318
March 2,598,384 2,712,714 406,746 543,565 437,264 467,814 ‐ ‐ 3,442,395 3,724,092
April 1,928,088 1,933,466 409,219 763,667 333,732 443,352 ‐ ‐ 2,671,040 3,140,486
May 1,905,402 1,288,335 10 273,259 616,554 369,281 511,556 379,002 ‐ 2,926,943 2,416,446
June 1,015,705 2,683,015 11 253,766 (930,970) 12 337,902 746,924 1,197,113 740,692 2,804,487 3,239,661
Total Collections 270,362,368 270,024,993 5,726,813 2,690,993 3,709,011 5,004,287 1,576,115 740,692 281,374,307 278,460,965
60 Day Collections (Year End entry) 1,021,870 1,021,870 ‐
Adjusted Total Collections 270,362,368 270,024,993 6,748,683 2,690,993 3,709,011 5,004,287 1,576,115 740,692 282,396,177 278,460,965
FY 18 FY 19 FY 18 FY 19 FY 18 FY 19 FY 18 FY 19 FY 18 FY 19
Total Budget 266,698,436 273,861,323 7,416,725 5,500,000 4,450,000 3,900,000 1,500,000 750,000 280,065,161 284,011,323
Total Adjusted Levy at July 1st3
292,142,980 289,991,265 n/a n/a n/a n/a n/a n/a n/a n/a
Collections through June 270,362,368 270,024,993 5,726,813 2,690,993 2,4,6 3,709,011 5,004,287 5 1,576,115 740,692 281,374,307 278,460,965
Outstanding Receivable at 06/30/19 12,985,887 9,816,010 41,593,381 44,532,323 n/a n/a n/a n/a n/a n/a
% of Budget Collected 101.37% 98.60% 77.21% 48.93% 83.35% 128.32% 105.07% 98.76% 100.47% 98.05%
% of Adjusted Levy Collected 92.54% 93.11% n/a n/a n/a n/a n/a n/a n/a n/a
Mill Rate Real Estate 74.29 74.29
Mill Rate Personal Property 74.29 74.29
Mill Rate Motor Vehicle 39 45
1 FY18 is not finalized until we complete the annual audit as there may be reconciliation and audit adjustments.2 July's negative balance is due to adjustments as a result of tax appeal settlements and PY overpayments.3 The final adjusted levy at 6/30 for FY2018 totaled $291,086,166. Changes from the levy at 7/1 to 6/30 are mainly due to tax appeals and abatements finalized throughout the fiscal year.4 September's reduced collections is due to a large adjustment from tax appeal settlements.5 September‐ $470K interest paid in 09/2018 for PY tax 2009 from New Talcott Plaza LLC/Shelbourne Group.6 October's PY negative balance is due to adjustments & transferred payments upon Corp Councel & Assessment's agreements. ($666K of SGS Pearl, LLC ||$242K of RP Asylum LLC|| $42K of Newgate Corp)7 $900K increased in November YtY was driven by significant transactions increased for RE's current levy; and a result of "fee relief program for PP in Oct & Nov.(RE & PP had 901 & 328 transactions in Nov 2018 vs. 701 & 89 transactions in Nov 2017 respectively). 8 December prior levy includes tax appeal settlement for Asylum LLC for $100K and $42K for S. Meadows No 3 & No 4 LLC.9 January current year levy collections are lower than prior year but February collections are trending higher than last year.
10 May's decreased current year levy collections is due to processed tax appeals of $683K.
11 June's current year collections include a significant increase by apply and offset the credits from adjustments for Hartford Hospital, Hartford LLC (Asylum), and Mount Sinai.12 June's prior levy deficit is related to processed court appeals, and the transfer of credits created from tax appeals to the 2018 grand list before new bills were mailed.
Current Year Taxes Prior Year Taxes Interest Liens Sales Total Collections
CITY OF HARTFORD
PROPERTY TAX COLLECTIONS REPORT FOR FY18 AND FY19
PROPERTY TAX COLLECTION REPORT THROUGH JUNE 30, 2019
Current Year Taxes Prior Year Taxes Interest Liens Sales Total Collections
4

FY2018
ACTUAL
FY2019 ADOPTED
BUDGET
FY2019 REVISED
BUDGET
FY2018
ACTUAL
FY2019 ACTUAL
(YTD)
FY2019
PROJECTION VARIANCE
00111 MAYOR'S OFFICE 690,350 797,134 797,134 690,350 700,632 700,632 96,502
00112 COURT OF COMMON COUNCIL 481,167 506,800 506,800 481,167 503,577 503,577 3,223
00113 TREASURER 397,500 558,509 558,509 397,500 454,715 454,715 103,794
00114 REGISTRARS OF VOTERS 457,848 377,365 627,694 457,848 581,934 581,934 45,760
00116 CORPORATION COUNSEL 1,439,951 1,544,801 1,544,801 1,439,951 1,335,850 1,335,850 208,951
00117 TOWN & CITY CLERK 708,047 794,739 794,739 708,047 698,287 698,287 96,452
00118 INTERNAL AUDIT 464,197 507,132 507,132 464,197 501,016 501,016 6,116
00119 CHIEF OPERATING OFFICER 774,567 811,006 811,006 774,567 613,541 613,541 197,465
00122 METRO HARTFORD INNOVATION SERV 2,996,431 3,174,113 3,174,113 2,996,431 3,174,113 3,174,113 0
00123 FINANCE 3,283,736 3,866,529 3,866,529 3,283,736 3,301,651 3,301,651 564,878
00125 HUMAN RESOURCES 1,008,374 1,246,526 1,246,526 1,008,374 1,231,032 1,231,032 15,494
00128 OFFICE OF MANAGEMENT & BUDGET 666,029 1,013,945 1,013,945 666,029 856,745 856,745 157,200
00132 CHILDREN FAMILY RECREATION 3,079,173 3,392,778 3,392,778 3,079,173 3,349,647 3,349,647 43,131
00211 FIRE 38,443,976 33,267,580 33,267,580 38,443,976 32,098,043 32,098,043 1,169,537
00212 POLICE 39,178,526 46,473,493 46,473,493 39,178,526 39,968,625 39,968,625 6,504,868
00213 EMERGENCY SERVICES & TELECOMM. 3,614,141 3,824,904 3,824,904 3,614,141 3,656,913 3,656,913 167,991
00311 PUBLIC WORKS 12,501,725 13,922,330 13,922,330 12,501,725 13,161,628 13,161,628 760,702
00420 DEVELOPMENT SERVICES 3,379,633 4,157,700 4,157,700 3,379,633 3,287,845 3,287,845 869,855
00520 HEALTH AND HUMAN SERVICES 4,103,079 5,028,529 5,028,529 4,103,079 3,345,125 3,345,125 1,683,404
00711 EDUCATION 283,943,410 284,008,188 284,605,884 283,943,410 284,076,929 284,076,929 528,955
00721 HARTFORD PUBLIC LIBRARY 8,100,000 8,150,000 8,150,000 8,100,000 1,483,334 1,483,334 6,666,666
00820 BENEFITS & INSURANCES 90,369,281 93,793,869 93,793,869 90,369,281 83,783,519 85,804,740 7,989,129
00821 DEBT SERVICE1 58,011,334 17,423,430 17,423,430 58,011,334 17,333,583 27,911,468 (10,488,038)
00822 NON OP DEPT EXPENDITURES2 36,142,260 41,399,706 41,149,377 36,142,260 39,385,461 44,018,993 (2,869,616)
Grand Total 594,234,736 570,041,106 570,638,802 594,234,736 538,883,742 556,116,381 14,522,421
Expenditure Summary ‐ Departments
1 The FY2019 Adopted Budget for Debt & Other Capital actuals are comprised of $4.64M for Downtown North, $103K for a Grant in Lieu of Taxes payment, and $116K for Clean Water
loan principal and interest for a total of $4.85M. Pay‐As‐You‐Go CapEx of $12.48M has been expended by the City of Hartford. In addition, $10.50M of needed capital expenditures
are projected, which is offset by $12K of interest earned in the escrow account that was applied to DONO interest payment.2 Non‐Operating expenditures are currently unfavorable by $2.87M. The driver of unfavorability is costs for vehicle, equipment and technology critical needs, offset by favorability
across expenditures in Non‐Operating.
5

Expenditure Summary ‐ Major Expenditure Category
FY2018
ACTUAL
FY2019 ADOPTED
BUDGET
FY2019 REVISED
BUDGET
FY2018
ACTUAL
FY2019 ACTUAL
(YTD)
FY2019
PROJECTION VARIANCE
PAYROLL 102,266,638 108,197,525 108,070,867 102,266,638 97,663,355 97,663,355 10,407,512
FT1
78,881,011 92,203,755 91,919,057 78,881,011 80,502,710 80,502,710 11,416,347
HOL1
2,519,149 2,445,733 2,445,733 2,519,149 2,144,726 2,144,726 301,007
OT1
19,235,767 12,132,529 12,132,529 19,235,767 13,163,217 13,163,217 (1,030,688)
PT1
1,630,712 1,415,508 1,573,548 1,630,712 1,852,702 1,852,702 (279,154)
BENEFITS 90,369,281 93,793,869 93,793,869 90,369,281 83,783,519 85,804,740 7,989,129
HEALTH14 16
34,536,346 35,882,979 35,882,979 34,536,346 31,260,540 31,260,540 4,622,439
MITIGATION2
0 (500,000) (500,000) 0 0 0 (500,000)
PENSION3
45,565,981 45,755,045 45,755,045 45,565,981 43,406,819 43,406,819 2,348,226
INSURANCE 16
4,589,297 4,890,000 4,890,000 4,589,297 4,551,833 4,951,833 (61,833)
CONCESSIONS4
464,076 (1,000,000) (1,000,000) 464,076 0 0 (1,000,000)
FRINGE REIMBURSEMENTS5
(4,094,152) (2,750,000) (2,750,000) (4,094,152) (5,333,789) (5,333,789) 2,583,789
LIFE INSURANCE 252,536 315,652 315,652 252,536 262,106 262,106 53,546
OTHER BENEFITS6
4,254,156 4,900,193 4,900,193 4,254,156 4,236,010 4,236,010 664,183
WAGE7
0 900,000 900,000 0 0 0 900,000
WORKERS COMP8 16
4,801,040 5,400,000 5,400,000 4,801,040 5,400,000 7,021,222 (1,621,222)
DEBT 58,011,334 17,423,430 17,423,430 58,011,334 17,333,583 27,911,468 (10,488,038)
DEBT9
58,011,334 17,423,430 17,423,430 58,011,334 17,333,583 27,911,468 (10,488,038)
LIBRARY 8,100,000 8,150,000 8,150,000 8,100,000 1,483,334 1,483,334 6,666,666
LIBRARY10
8,100,000 8,150,000 8,150,000 8,100,000 1,483,334 1,483,334 6,666,666
MHIS 2,996,431 3,174,113 3,174,113 2,996,431 3,174,113 3,174,113 0
MHIS 2,996,431 3,174,113 3,174,113 2,996,431 3,174,113 3,174,113 0
UTILITY 22,079,682 23,964,607 23,994,285 22,079,682 23,414,737 23,414,737 579,548
UTILITY13
22,079,682 23,964,607 23,994,285 22,079,682 23,414,737 23,414,737 579,548
OTHER 26,467,959 31,329,374 31,426,354 26,467,959 27,954,173 32,587,706 (1,161,352)
COMMUNITY ACTIVITIES 2,672,623 2,578,776 2,549,131 2,672,623 2,109,406 2,109,406 439,725
CONTINGENCY11
329,799 4,435,019 950,591 329,799 555,751 555,751 394,841
CONTRACTED SERVICES 3,416,930 3,809,682 3,768,371 3,416,930 3,281,395 3,281,395 486,976
ELECTIONS 71,296 208,044 0 71,296 0 0 0
GOVT AGENCY & OTHER 750,000 0 0 750,000 0 0 0
LEASES ‐ OFFICES PARKING COPIER 976,678 1,942,984 1,885,245 976,678 1,524,840 1,545,560 339,685
LEGAL EXPENSES & SETTLEMENTS11
6,489,996 2,616,500 6,665,539 6,489,996 6,398,742 6,398,742 266,797
OTHER 3,139,123 4,319,822 3,921,514 3,139,123 3,274,816 3,274,816 646,698
OUT AGENCY 0 0 0 0 0 0 0
POSTAGE 193,625 231,419 205,419 193,625 163,630 163,630 41,789
SUPPLY 3,534,279 4,236,320 4,543,767 3,534,279 3,996,107 3,996,107 547,660
TECH, PROF & COMM BASED SERVICES 1,425,931 1,976,350 1,922,319 1,425,931 1,650,223 1,650,223 272,096
VEHICLE & EQUIP15
3,467,680 4,974,458 5,014,458 3,467,680 4,999,264 9,612,076 (4,597,618)
EDUCATION 283,943,410 284,008,188 284,605,884 283,943,410 284,076,929 284,076,929 528,955
EDUCATION12
283,943,410 284,008,188 284,605,884 283,943,410 284,076,929 284,076,929 528,955
Grand Total 594,234,736 570,041,106 570,638,802 594,234,736 538,883,742 556,116,381 14,522,421
11 Legal Expenses and Settlements are unfavorable due to Stadium and Master Development Plan outside legal services.
1 Net favorable variance of $10.40M in Payroll is due to a delay in refilling vacancies of $11.42M (see page 7) and holiday pay (HOL) of $301K, offset by $1.03M in Public Safety and DPW
overtime (OT) and by $279K part‐time (PT).2 Mitigation of $500K reflects non‐Public Safety budgeted attrition and vacancy savings. The Police and Fire departments respectively include $1.17M and $1.56M in budgeted attrition
and vacancy savings. In total, $3.23M is budgeted for attrition city‐wide. 3 The total MERF Pension Actuarial Defined Employer Contribution (ADEC) for the City of Hartford is $44.22M. This includes the BOE and Library ADEC of $4.78M and $925K
respectively, which are separately budgeted in the BOE and Library line items. The City's total ADEC for Police, Fire and Municipal workers of $38.50M is fully budgeted and has been
trued‐up in full compliance with the contract assistance agreement. In addition, the primary driver of favorability in Pension is vacation/sick payouts. 4 Concessions savings have been adjusted for HMEA arbitration and the MLA contract. 5 Fringe reimbursements for grant funded employees are favorable due to Police and Fire grants. 6 Other Benefits is favorable due to in Social Security and Unemployment compensation.7 Wage reserve has been adjusted for HMEA arbitration and the MLA contract. 8 Workers' Compensation is net unfavorable due to the actuals in claims experience. IBNR adjustment will be recorded in October. 9 The FY2019 Adopted Budget for Debt & Other Capital actuals are comprised of $4.64M for Downtown North, $103K for a Grant in Lieu of Taxes payment, and $116K for Clean Water
loan principal and interest for a total of $4.85M. Pay‐As‐You‐Go CapEx of $12.48M has been expended by the City of Hartford. In addition, $10.50M of needed capital expenditures are
projected, which is offset by $12K of interest earned in the escrow account that was applied to DONO interest payment. 10 Due to $6.667M of the Corporate Contribution provided directly to the Hartford Public Library (has been received), the annual Library appropriation has been adjusted accordingly.
12 Education YTD actuals reflect 12 months of the City's tax supported payment of $96.0M and the $188.0M the State ECS allocation transfer. The Education Revised Budget and actual
have increased by $598K due to the State Department of Education providing additional funding for the educational support of displaced students from Puerto Rico and offset by a
reduction of $529K, due to the year end, reconciling adjustment for the State Special Education Fund.13 Utilities are net favorable by $580K, with favorabilty coming from electricity and fuels. 14 Health care expenditures were favorable in FY2019. 15 Vehicles and Equipment expenditures are $4.60M unfavorable due to equipment and technology critical needs for public safety functions. 16 IBNR adjustment will be recorded in October.
6

Appendix
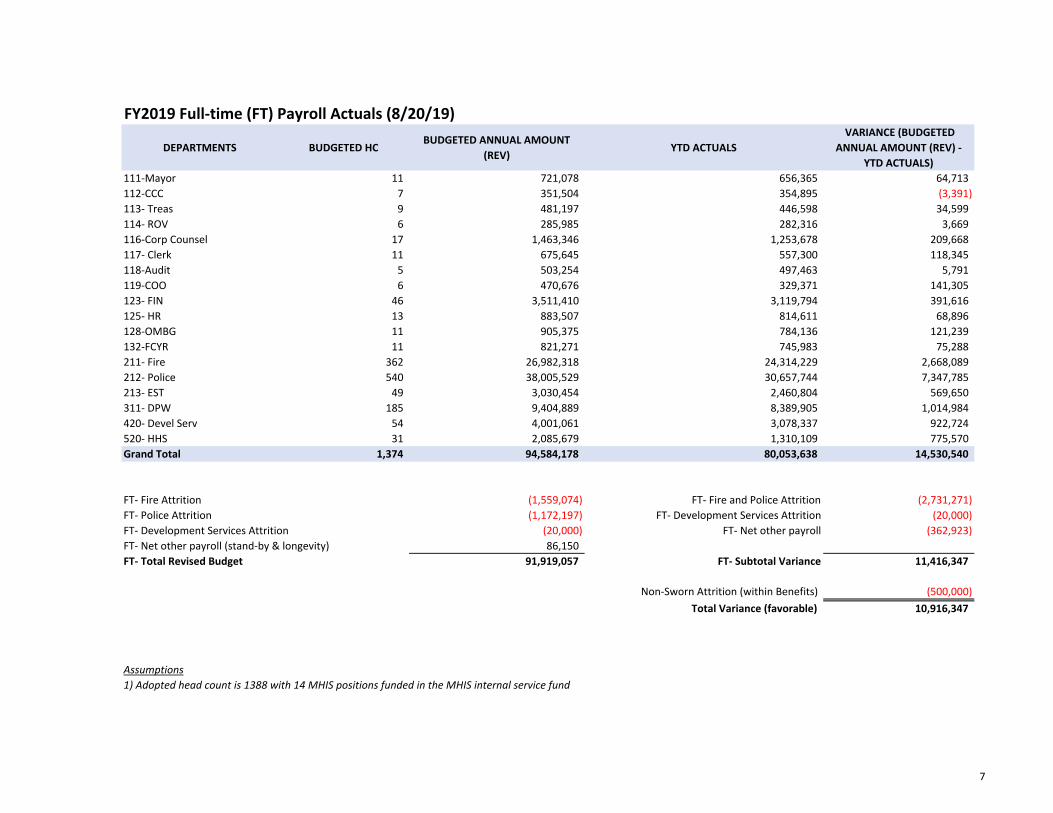
FY2019 Full‐time (FT) Payroll Actuals (8/20/19)
DEPARTMENTS BUDGETED HC BUDGETED ANNUAL AMOUNT
(REV)YTD ACTUALS
VARIANCE (BUDGETED
ANNUAL AMOUNT (REV) ‐
YTD ACTUALS)
111‐Mayor 11 721,078 656,365 64,713
112‐CCC 7 351,504 354,895 (3,391)
113‐ Treas 9 481,197 446,598 34,599
114‐ ROV 6 285,985 282,316 3,669
116‐Corp Counsel 17 1,463,346 1,253,678 209,668
117‐ Clerk 11 675,645 557,300 118,345
118‐Audit 5 503,254 497,463 5,791
119‐COO 6 470,676 329,371 141,305
123‐ FIN 46 3,511,410 3,119,794 391,616
125‐ HR 13 883,507 814,611 68,896
128‐OMBG 11 905,375 784,136 121,239
132‐FCYR 11 821,271 745,983 75,288
211‐ Fire 362 26,982,318 24,314,229 2,668,089
212‐ Police 540 38,005,529 30,657,744 7,347,785
213‐ EST 49 3,030,454 2,460,804 569,650
311‐ DPW 185 9,404,889 8,389,905 1,014,984
420‐ Devel Serv 54 4,001,061 3,078,337 922,724
520‐ HHS 31 2,085,679 1,310,109 775,570
Grand Total 1,374 94,584,178 80,053,638 14,530,540
FT‐ Fire Attrition (1,559,074) FT‐ Fire and Police Attrition (2,731,271)
FT‐ Police Attrition (1,172,197) FT‐ Development Services Attrition (20,000)
FT‐ Development Services Attrition (20,000) FT‐ Net other payroll (362,923)
FT‐ Net other payroll (stand‐by & longevity) 86,150
FT‐ Total Revised Budget 91,919,057 FT‐ Subtotal Variance 11,416,347
Non‐Sworn Attrition (within Benefits) (500,000)
Total Variance (favorable) 10,916,347
Assumptions
1) Adopted head count is 1388 with 14 MHIS positions funded in the MHIS internal service fund
7
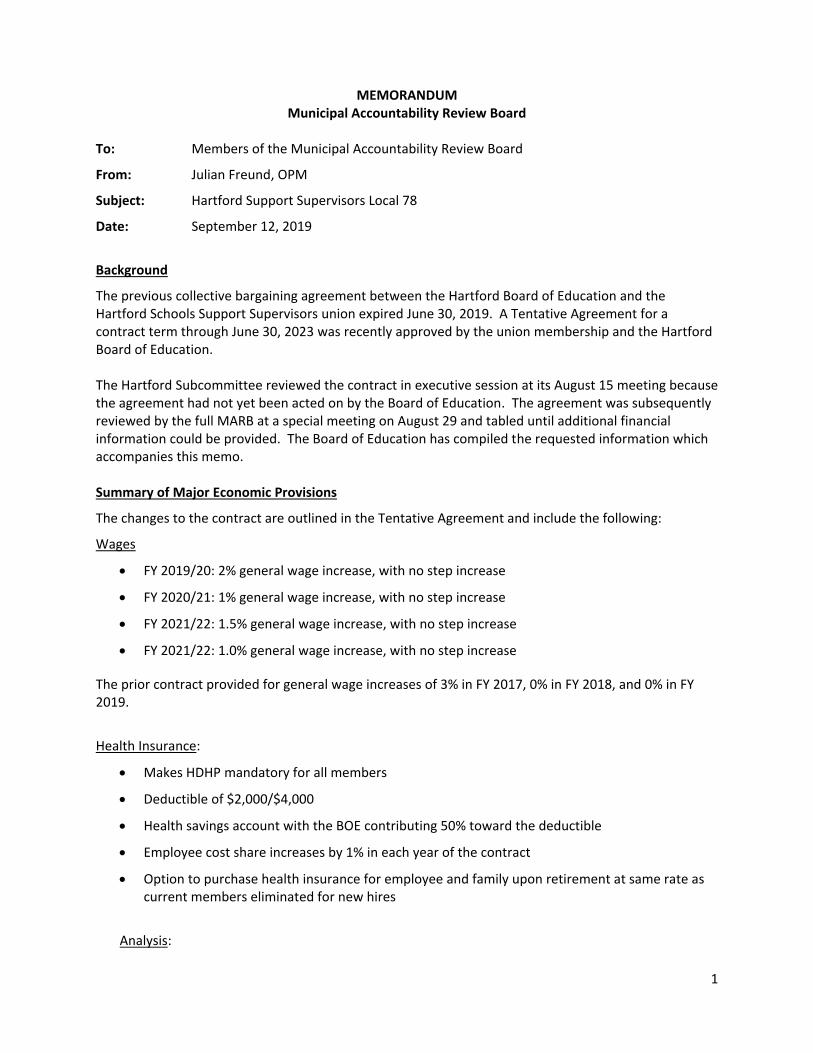
1
MEMORANDUM Municipal Accountability Review Board
To: Members of the Municipal Accountability Review Board
From: Julian Freund, OPM
Subject: Hartford Support Supervisors Local 78
Date: September 12, 2019
Background
The previous collective bargaining agreement between the Hartford Board of Education and the Hartford Schools Support Supervisors union expired June 30, 2019. A Tentative Agreement for a contract term through June 30, 2023 was recently approved by the union membership and the Hartford Board of Education. The Hartford Subcommittee reviewed the contract in executive session at its August 15 meeting because the agreement had not yet been acted on by the Board of Education. The agreement was subsequently reviewed by the full MARB at a special meeting on August 29 and tabled until additional financial information could be provided. The Board of Education has compiled the requested information which accompanies this memo. Summary of Major Economic Provisions
The changes to the contract are outlined in the Tentative Agreement and include the following:
Wages
FY 2019/20: 2% general wage increase, with no step increase
FY 2020/21: 1% general wage increase, with no step increase
FY 2021/22: 1.5% general wage increase, with no step increase
FY 2021/22: 1.0% general wage increase, with no step increase
The prior contract provided for general wage increases of 3% in FY 2017, 0% in FY 2018, and 0% in FY 2019.
Health Insurance:
Makes HDHP mandatory for all members
Deductible of $2,000/$4,000
Health savings account with the BOE contributing 50% toward the deductible
Employee cost share increases by 1% in each year of the contract
Option to purchase health insurance for employee and family upon retirement at same rate as current members eliminated for new hires
Analysis:

2
The Board of Education has provided several exhibits analyzing the impact of the proposed agreement. The Summary of Savings indicates that much of the compounded cost of the wage increases is offset by the savings related to the transition to the HDHP and increases in the employee cost share. As suggested by MARB members at the special meeting, the BOE noted other measures that may offset the cost of wage increases. Additional attachments provide detail regarding the cost of the general wage increases and savings from the health insurance changes. A schedule of salaries by position, with minimum/maximum salary by year is also provided. A set of job descriptions has also been submitted by the BOE for background information and is being distributed under separate cover. Attachments:
Tentative Agreement
Brief Summary of Hartford School Support Supervisors Tentative Agreement
History of Hartford School Support Supervisors Contract
Salary Comparisons
Summary of Savings
Cost Calculations of general wage increases
Segal analysis of impact of HDHP
Salary schedule by year
Prior contract with HSSSA 2017-2019

THE HARTFORD BOARD OF EDUCATION
AND
THE HARTFORD SCHOOLS SUPPORT SUPERVISORS ASSOCIATION,LOCAL 78, AFSA, AFL-CIO
The Hartford Board of Education (“HBOE”) and the Hartford Schools Support Supervisors Association, Local 78, AFSA, AFL-CIO (“HSSSA”) tentatively agree to a Collective Bargaining Agreement to be in full force and effect for the period commencing July 1, 2019 through June 30, 2023 subject to the ratification by HSSSA, and approval by both the HBOE and the Municipal Accountability Review Board of the State of Connecticut. The July 1, 2017 through June 30, 2019 Collective Bargaining Agreement currently in effect shall remain unchanged except as specifically outlined in this Tentative Agreement provided further that the Collective Bargaining Agreement shall be modified to reflect these changes.
Deletions of existing language are shown struck-out.. New language is shown in [bold] and enclosed in brackets.
HARTFORD BOARD OF EDUCATION HARTFORD SCHOOLS SUPPORTSUPERVISORS, LOCAL 78,AFSA, AFL-CIO
BY ------Melinda B. Kautmann Chief Negotiator
flyujl &Date: IfityrS, 2019
BY 'V(
I Yolanda BurtfHSSSA President
Chief Negotiator
l

Article V(C)fl) - Grievance Procedure/Time Limits
Original Lanaua&e
A. Time Limits
1. Since it is important that a grievance be processed as rapidly as possible, the number of days indicated at each level should be considered a maximum. The time limits specified, however, may be extended by mutual agreement or extenuating circumstances and must be in writing, between the Union President and the Chief Labor and Legal Officer.
Agreed Language
A. Time Limits
2. Since it is important that a grievance be processed as rapidly as possible, the number of days indicated at each level should be considered a maximum. The time limits specified, however, may be extended by mutual agreement er extenuating circumstances and must be in writing, between the Union President and the Chief Labor and Legal Officer [Executive Director of Human Resources or his/her designee].
Article VII Union Sccurity/Rights
Original Language
A. The Board agrees to deduct via payroll dues for all members of the bargaining unit, unless an individual member gives notice to the Chief Talent Officer, in writing, that he or she wishes to have deducted the service fee only.
B. The deduction for any month shall be made on a bi-wcckly basis and shall be remitted to the Union, together with a list of names of employees from whose wages such deductions have been made, not later than the fifteenth day of the following month.
Agreed Language
A. The Board agrees to deduct via payroll dues for all members of the bargaining unit [who give express written permission to the Executive Director of Human Resources for such fee to be deducted via payroll. The Board agrees to deduct via payroll a service fee for all non-members who given written permission to the Executive Director of Human Resources for such fee to be deducted via payroll.] unless an individual member gives notice to the Chief Talent Officer—irnwriting-,-that he-or she-wishes to-have-deducted the service-feeenlyy
2

B. The deduction for any month shall be made on a bi-weekly basis and shall be remitted to the Union, together with a list of names of employees from whose wages such deductions have been made, not later than the fifteenth day of the following month.
[H. The Union shall hold the Board and City harmless against any and all claims, demands, liabilities, lawsuits, counsel fees or other costs which may arise out of, or by reason of, actions taken against the Board and/or the City as a result of the administration of the provisions of this article.]
Article XXIV(G) Assumption of Liability for Damages Caused byBaruaininu Unit Member
Original Language
G. Assumption of Liability for Damage Caused by Bargaining Unit Member:
1. Employees in the bargaining unit shall be protected in accordance with section 7-465 of the Connecticut General Statutes, as it is amended from time to time.
2. Solely for the purpose of informing employees in the bargaining unit, the following language is offered as a paraphrase of the provisions of Section 7-465:
a. The Board shall pay on behalf of any bargaining unit member all sums which such bargaining unit member becomes obligated to pay by reason of the liability imposed upon such bargaining unit member by law for physical damages to person or property if the bargaining unit member at the time of the occurrence, accident, physical injury or damages complained of, was acting in the performance of his/her duties and within the scope of his/her employment, and if such occurrence, accident, physical injury or damage was not the result of any willful or wanton act of such bargaining unit member in the discharge of such duty.
Agreed Language
G. Assumption of Liability for Damage Caused by Bargaining Unit Member:
3. Employees in the bargaining unit shall be protected in accordance with section 7 465 [10-235] of the Connecticut General Statutes, as it is amended from time to time.
4. Solely for the purpose of informing employees in the bargaining unit, the following language is offered as a paraphrase of the provisions of Section 7-465 [10-235]:
3

a. The Board shall pay on behalf of any bargaining unit member all sums which such bargaining unit member becomes obligated to pay by reason of the liability imposed upon such bargaining unit member by law for physieal damages to person or property if the bargaining unit member at the time of the occurrence, accident, physical injury or damages complained of, was acting in the performance of his/her duties and within the scope of his/her employment, and if such occurrence, accident, physical injury or damage was not the result of any willful or wanton act of such bargaining unit member in the discharge of such duty.
Appendix B
2019- 2020 2% general wage increase
2020- 2021 1% general wage increase
2021 -2022 1.5% general wage increase
2022-2023 1% general wage increase
Appendix C
Original Language
1. Health Insurance
Employee health contributions shall have a pre-tax status under Section 125 Plan.
A. PPO
Participating employees shall contribute the following percentages toward the annual premium or fully insured premium equivalent costs for individual or family coverage:
2017-2019: 20°/o (not to exceed the amount listed in side letter)
All employees starting work in HSSSA on or after July 1,2015, may only enroll in the HDHP with HSA and not have access to the PPO plan. If an employee is hired into the unit while already enrolled in the district PPO plan, he/she shall be permitted to remain in such plan. Any member who elects the High Deductible Health Plan with the HSA shall not thereafter return to the PPO.
4

Employees enrolled in the Board's PPO Plan are eligible for the Board's managed three-tier drug rider as follows:
$10 generic$25 formulary brand$40 non-formulary brandMail Order - 2X co-payments for a 90-day supply.
High Deductible Health Plan with a Health Savings Account ("HSA"1
Members shall contribute the following percentages toward the annual premium or fully insured premium equivalent costs for individual or family coverage on the HDHP with HSA:
2017-2019: 17% (not to exceed the amount listed in side letter)
In-Network services shall be subject to a $2,000 deductible for an individual plan and $4,000 per family . The plan pays 100% in network services after the deductible, except for prescription drugs (Rx).
Out-of-Network services shall be subject to a 20% coinsurance for an individual plan up to a yearly maximum of $2,000 individual and $4,000 per family. Out of network out of pocket maximum is $4,000 per individual and $8,000 per family (including the deductible)
Upon reaching the deductibles, there shall be a Rx co-payment applied as follows:Generic: $5Brand (formulary): $15 Brand (non-formulary): $30
Up to an out of pocket maximum of $1,000 per individual and $2,000 per family.
B. HSA Plan:
Effective July 1, 2016, the Board shall contribute fifty percent (50%) of the applicable HSA deductible amount. The Board's contribution toward the HSA deductible will be deposited into the HSA accounts in two equal installments, the first during the week of July and the second during the week of January 1. The Board's contribution will be pro-rated for members hired after July 1st in any year.
HSSSA agrees that any portion of the health, dental, or prescription drug plan may be self- insured or insured at the sole discretion of the Board. This provision shall not be subject to the grievance procedure.
5

Agreed Language
1. Health Insurance
Employee health contributions shall have a pre-tax status under Section 125 Plan.
A. PPO
Participating employees shaH-eontribute the following percentages toward the-annutd-premium or fully insured premium equivalent costs for individual or family coverage;
2017-2QI9:-20% (not-to exceed the amount listed in side letter-)
All employees starting work in HSSSA on or after July 1, 2015, may only enroll-in-the HDHP with HSA and not have access to the PPO plan. If an employee is hired-into the unitwhile alfead^enroHed-in-the district PPO-plam-he/she-shall be-permitted-to remain in suchplan. Any member who electe4he High-Dedee4ible Health Plan with the HSA shall notthereafter return to the PPO.
Employeesenroiled-in-the-Board's PPOPlan-areeiigible for the Board's managedthree-tier drug- rider-as follows
$10 generic$25 formulary brand$/l 0 non formulary brandMail Order- - 2X co- payments for a-90-day supply.
High Deductible Health Plan with a Health Savings Account ("HSA")
[All bargaining unit members will move to the High Deductible Health Plan with a Health Savings Account (“HSA”). This will commence the start of the month after the contract is approved by the MARB and the HBOE. Any member who is enrolled in Medicare may not participate in the HSA and must participate in a health retirement account (HRA).J
Members shall contribute the following percentages toward the annual premium or fully insured premium equivalent costs for individual or family coverage on the HDHP with HSA:
2017 2019: 17% (not to-e-xoeed-the amount listed in side letter)
[2019-2020 17%2020-2021 18%2021- 2022 19%2022- 2023 20%]
In-Network services shall be subject to a $2,000 deductible for an individual plan and $4,000 per family . The plan pays 100% in network services after the deductible, except for prescription drugs (Rx).
6
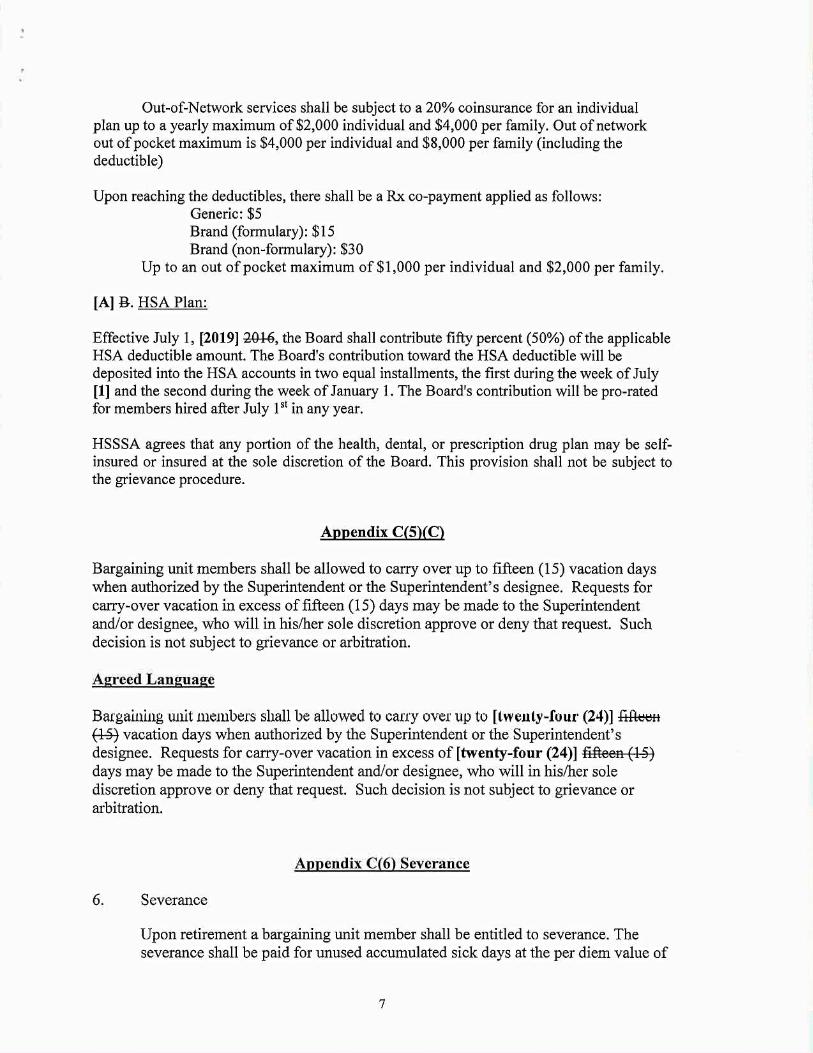
Out-of-Network services shall be subject to a 20% coinsurance for an individual plan up to a yearly maximum of $2,000 individual and $4,000 per family. Out of network out of pocket maximum is $4,000 per individual and $8,000 per family (including the deductible)
Upon reaching the deductibles, there shall be a Rx co-payment applied as follows:Generic: $5Brand (formulary): $15 Brand (non-formulary): $30
Up to an out of pocket maximum of $1,000 per individual and $2,000 per family.
[A] B. HSA Plan:
Effective July 1, [2019] 201-6, the Board shall contribute fifty percent (50%) of the applicable HSA deductible amount. The Board's contribution toward the HSA deductible will be deposited into the HSA accounts in two equal installments, the first during the week of July [1] and the second during the week of January 1. The Board's contribution will be pro-rated for members hired after July 1st in any year.
HSSSA agrees that any portion of the health, dental, or prescription drug plan may be self- insured or insured at the sole discretion of the Board. This provision shall not be subject to the grievance procedure.
Appendix C(5)(C)
Bargaining unit members shall be allowed to carry over up to fifteen (15) vacation days when authorized by the Superintendent or the Superintendent’s designee. Requests for carry-over vacation in excess of fifteen (15) days may be made to the Superintendent and/or designee, who will in his/her sole discretion approve or deny that request. Such decision is not subject to grievance or arbitration.
Agreed Language
Bargaining unit members shall be allowed to carry over up to [twenty-four (24)] fifteen (fS) vacation days when authorized by the Superintendent or the Superintendent’s designee. Requests for carry-over vacation in excess of [twenty-four (24)] fifteen (15) days may be made to the Superintendent and/or designee, who will in his/her sole discretion approve or deny that request. Such decision is not subject to grievance or arbitration.
Appendix C(6) Severance
6. Severance
Upon retirement a bargaining unit member shall be entitled to severance. The severance shall be paid for unused accumulated sick days at the per diem value of
7

the bargaining unit member's annual salary at the time of retirement and shall be calculated according to the following formula:
a. the number of unused accumulated sick days not to exceed sixty (60) days; or
b. thirty percent (30%) of the unused accumulated sick days, whichever is greater.
For bargaining unit members who work a twelve (12) month work year, the per diem rate shall be calculated using 224 workdays.
Retirees and their legally dependent survivors (including spouse) shall be entitled to purchase group health insurance benefits at the same rate as current working bargaining unit members.
Agreed Language
6. Severance
Upon retirement a bargaining unit member shall be entitled to severance. The severance shall be paid for unused accumulated sick days at the per diem value of the bargaining unit member's annual salary at the time of retirement and shall be calculated according to the following formula:
a. the number of unused accumulated sick days not to exceed sixty (60) days; or
b. thirty percent (30%) of the unused accumulated sick days, whichever is greater.
For bargaining unit members who work a twelve (12) month work year, the per diem rate shall be calculated using 224 workdays.
Retirees and their legally dependent survivors (including spouse) shall be entitled to purchase group health insurance benefits at the same rate as current working bargaining unit members. [This provision regarding retiree health insurance will not apply to bargaining unit members who are hired after the date of execution of this Agreement.]
Appendix C(7) Life Insurance
7. Life Insurance
Upon retirement a bargaining unit member shall receive paid-up life insurance coverage in the amount of five thousand dollars ($5,000) for bargaining unit members below Grid 710 and fifteen thousand dollars ($15,000) for bargaining unit members at or above Grid 710.
8

Agreed Language
7. Life Insurance
Upon retirement a bargaining unit member shall receive paid-up life insurance coverage in the amount of five thousand dollars ($5,000) for bargaining unit members below Grid 710 and fifteen thousand dollars ($15,000) for bargaining unit members at or above Grid 710.
[Bargaining Unit Members who are hired after the date of execution of this Agreement will not be eligible for paid-up life insurance upon retirement.]
Global Changes
Replace “Chief Labor and Legal Officer” with “Executive Director of Human Resources or his/her designee”
ACTIVE/78402.17/MKAUFMANN/8319010vl9

CONFIDENTIALBrief Summary of Hartford School Support Supervisors Tentative Agreement
The current contract expired on June 30, 2019. The Union ratified the tentative agreement onAugust 8, 2019 at which time it was signed by both parties. The new contract would be effectiveJuly 1, 2019 – June 30, 2023. This group is currently comprised of 39 employees.
Salary
2019-2020 2% GWI for eligible members ($70,517 new money)2020-2021 1% GWI for eligible members ($35,963.75 new money)2021-2022 1.5% GWI for eligible members ($54,485.08 new money)2022-2023 1% GWI for eligible members ($36,868.24 new money)
Total change over the life of the contract: 5.5%
Insurance
It will become mandatory for all bargaining unit members to be on the High DeductibleHealth Plan with a Health Savings Account (HSA) at the start of the month after thecontract is approved by the MARB and HBOE
• Premium Cost Shareo Upon transfer into the HDHP 17%o July 1, 2020 18%o July 1, 2021 19%o July 1, 2022 20%
• In-Network services shall be subject to a $2,000 deductible for anindividual plan and $4,000 per family. The plan pays 100% in networkservices after the deductible, except for prescription drugs (Rx).
• Out-of-Network services shall be subject to a 20% coinsurance for anindividual plan up to a yearly maximum of $2,000 individual and $4,000per family. Out of network out of pocket maximum is $4,000 perindividual and $8,000 per family (including the deductible)
• Upon reaching the deductibles, there shall be a Rx co-payment applied asfollows:
o Generic: $5o Brand (formulary): $15o Brand (non-formulary): $30o Up to an out of pocket maximum of $1,000 per individual and
$2,000 per family.
• For the duration of the contract, the Board shall contribute fifty percent(50%) of the applicable HSA deductible amount.
Estimated cost savings of all employees switching to the HDHP for 2019-2020 is $100,491(which will be prorated depending on what month the plan goes into effect).

Other Cost Saving Measures
• For new members hired after the contract is executed, eliminates theprovision of paid up life insurance at time of retirement
• For new members hired after the contract is executed, eliminates theability to purchase health insurance for the employee and family at thesame rates as the current members.
Language Changes
• The Board agrees to deduct via payroll dues or a representation fee for all membersof the bargaining unit who give express written permission to the ExecutiveDirector of Human Resources for such fee to be deducted via payroll. Addedlanguage that the union will hold the district harmless against claims, demands,liabilities, lawsuits, counsel fees and other costs for any action taken against theBoard because of this section.
• Removed “extenuating circumstances” as a reason to extend time limits for filinggrievances.
• Increased from 15 to 24 the number of vacation days the member may carry overwithout permission of the Superintendent
• Global replacement of “Chief Labor and Legal Officer” with “Executive Director ofHuman Resources or his/her designee”
ACTIVE/78402.17/MKAUFMANN/8321636v1

History of Hartford School Support Supervisors Contract
This is a bargaining unit made up of 39 non-certified supervisors. This unit encompasses aneclectic group of supervisory positions such as food service supervisors, occupational therapyand physical therapy supervisor, medical director, Medicaid coordinator, supervisor printing &duplicating center, transportation manager, clinic nursing and support supervisor, lead securityofficers and various other non-certified supervisory positions. The current salaries range from$55,000 to $146,349 depending on the position. This is a bargaining unit that over past contractnegotiations has been the leader in agreeing to changes that are fiscally advantageous for thedistrict. Some of these changes are highlighted below.
1. History of Pension Changes
As of the January 1, 2012, this unit agreed that all new hires who were not already in the CityMERF were not eligible to participate in the MERF and were only eligible for a 403b plan with a5% employer match. They are the only union to have agreed to this.
2. History of Wage Increases
This group agreed many years ago to eliminate all steps within their wage categories. For theprior two years, this group agreed to a true wage freeze. The GWIs for the past three years wereas follows:
2016-2017 3% GWI2017-2018 0% GWI2018-2019 0% GWI
3. Health Insurance
As of July 1, 2015, all new employees in the bargaining unit were eligible for a High DeductibleHealth Plan with a Health Savings Account only and were not able to participate in the PPOplan.
4. Some other highlights
This unit previously gave up any longevity pay within the contract.
Pay out of vacation at termination is limited to a maximum of 24 days.
ACTIVE/78402.17/MKAUFMANN/8321889v1

Hartford Board of Education2019-2020 School Support Supervisors Negotiations
Salary Comparisons
Per the request of the Hartford Committee, below are comparisons for three HSSSA positions.As we have been unable to get the comparison information from New Haven and Bridgeport asof this date, I have included comparisons from other nearby school districts. These districts,however, are much smaller and the positions do not always correlate well.
Hartford 2018-2019 Actual Salary: Director of Security: $107,458
District Year in Effect Minimum Maximum NotesWest Hartford 2019-2020 $96,900 Director of SecurityEast Hartford 2019-2020 $84,473 Director of SecurityGlastonbury 2019-2020 $83,477 Director of SecurityWaterbury 2019-2020 $78,020 Security and School Safety
Coordinator (current salary)SouthWindsor
2019-2020 $71,750 Director of Security
Berlin 2019-2020 $65,000 Director of Security
Hartford 2018-2019 Actual Salary: Manager Food Services: $95,481.00
District Year in Effect Minimum Maximum NotesWest Hartford 2019-2020 $97,688 Director of Food ServicesGlastonbury 2019-2020 $77,491 Director of School FoodsWaterbury 2019-2020 $65,000 $75,000 Food Service Facilities
ManagerBerlin 2019-2020 $61,280 Director – Food Services – 10
month position
Hartford 2018-2019 Actual Salary: Transportation Coordinator: $60,000
District Year in Effect Minimum Maximum NotesEast Granby 2019-2020 $134,366 High School Asst. Vice PrincipalWaterbury 2019-2020 $99,000 Pupil Transportation CoordinatorWestHartford
2019-2020 $67,557 $87,283 Transportation Coordinator
Glastonbury 2019-2020 $87,126 Transportation CoordinatorFarmington 2019-2020 $60,485 Transportation CoordinatorSouthWindsor
2019-2020 $58,126 Transportation Coordinator
East Hartford 2019-2020 $38.31 per hour Transportation Coordinator
ACTIVE/78402.17/MKAUFMANN/8363187v1
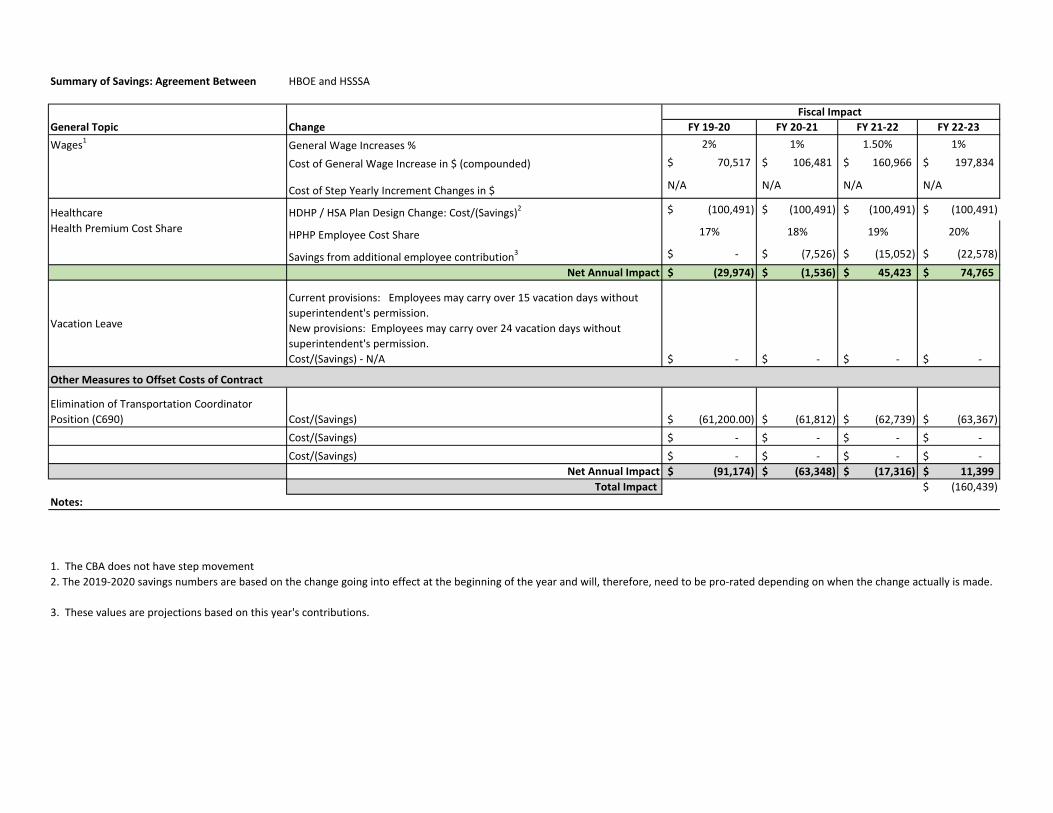
Summary of Savings: Agreement Between HBOE and HSSSA
General Topic Change FY 19-20 FY 20-21 FY 21-22 FY 22-23
Wages1
General Wage Increases % 2% 1% 1.50% 1%
Cost of General Wage Increase in $ (compounded) 70,517$ 106,481$ 160,966$ 197,834$
Cost of Step Yearly Increment Changes in $ N/A N/A N/A N/A
Healthcare HDHP / HSA Plan Design Change: Cost/(Savings)2 (100,491)$ (100,491)$ (100,491)$ (100,491)$
Health Premium Cost ShareHPHP Employee Cost Share 17% 18% 19% 20%
Savings from additional employee contribution3 -$ (7,526)$ (15,052)$ (22,578)$
Net Annual Impact (29,974)$ (1,536)$ 45,423$ 74,765$
Vacation Leave
Current provisions: Employees may carry over 15 vacation days without
superintendent's permission.
New provisions: Employees may carry over 24 vacation days without
superintendent's permission.
Cost/(Savings) - N/A -$ -$ -$ -$
Elimination of Transportation Coordinator
Position (C690) Cost/(Savings) (61,200.00)$ (61,812)$ (62,739)$ (63,367)$
Cost/(Savings) -$ -$ -$ -$
Cost/(Savings) -$ -$ -$ -$
Net Annual Impact (91,174)$ (63,348)$ (17,316)$ 11,399$
Total Impact (160,439)$
Notes:
1. The CBA does not have step movement
3. These values are projections based on this year's contributions.
Fiscal Impact
2. The 2019-2020 savings numbers are based on the change going into effect at the beginning of the year and will, therefore, need to be pro-rated depending on when the change actually is made.
Other Measures to Offset Costs of Contract

HSSSA Costs Calculation 2%, 1%,1.5%, 1% Each year of Contract
2019-2023
Position Location Grade 2018-2019 2019-2020 2020-2021 2021-2022 2022-2023 ASSIGNMENTDIRECTOR BUILDINGS AND GROUNDS C750 108,116.00$ 110,278.32$ 111,381.10$ 113,051.82$ 114,182.34$ ASST DIRECTOR OF FACILITIESOPER TRANSPORTATION COORD TRANSPORTATION OFFICE C690 60,000.00$ 61,200.00$ 61,812.00$ 62,739.18$ 63,366.57$ OPER TRANSPORTATION COORD
COORDINATOR FOOD SERVICE C755 106,090.00$ 108,211.80$ 109,293.92$ 110,933.33$ 112,042.66$ ASST DIRECTOR OF NUTRTN SUPPTMANAGER CHOICE OFFICE C710 73,438.00$ 74,906.76$ 75,655.83$ 76,790.67$ 77,558.57$ PROG MGR OF TECH DATA & ACCOUNMANAGER SPECIAL EDUCATION C740 94,028.00$ 95,908.56$ 96,867.65$ 98,320.66$ 99,303.87$ COMPLIANCE MANAGERMANAGER FOOD SERVICE C720 80,592.00$ 82,203.84$ 83,025.88$ 84,271.27$ 85,113.98$ CHILD & NUTRITION FIELD MNGRMANAGER FOOD SERVICE C720 80,592.00$ 82,203.84$ 83,025.88$ 84,271.27$ 85,113.98$ OPERATIONS MNGR FOR FOOD SERVMANAGER FOOD SERVICE C720 80,592.00$ 82,203.84$ 83,025.88$ 84,271.27$ 85,113.98$ OPERATIONS MNGR FOR FOOD SERVMANAGER OFFICE OF FINANCE C735 94,600.00$ 96,492.00$ 97,456.92$ 98,918.77$ 99,907.96$ PAYROLL MANAGERMANAGER FOOD SERVICE C720 80,592.00$ 82,203.84$ 83,025.88$ 84,271.27$ 85,113.98$ OPERATIONS MNGR FOR FOOD SERVMANAGER FOOD SERVICE C720 80,592.00$ 82,203.84$ 83,025.88$ 84,271.27$ 85,113.98$ OPERATIONS MNGR FOR FOOD SERVLEAD SCHOOL SAFETY OFFICER SECURITY 6B6 55,000.00$ 56,100.00$ 56,661.00$ 57,510.92$ 58,086.02$ LEAD SCHOOL SAFETY OFFICERCOORDINATOR SECURITY A710 65,000.00$ 66,300.00$ 66,963.00$ 67,967.45$ 68,647.12$ RESIDENCY COORDINATORMANAGER FOOD SERVICE C720 80,592.00$ 82,203.84$ 83,025.88$ 84,271.27$ 85,113.98$ CHILD & NUTRITION FIELD MNGRCOORDINATOR FOOD SERVICE C720 87,000.00$ 88,740.00$ 89,627.40$ 90,971.81$ 91,881.53$ CHILD & NUTRITION FIELD MNGRDIRECTOR SECURITY C760 107,458.00$ 109,607.16$ 110,703.23$ 112,363.78$ 113,487.42$ SECURITY DIRECTOR (CENTRAL)MANAGER TRANSPORTATION OFFICE C720 89,000.00$ 90,780.00$ 91,687.80$ 93,063.12$ 93,993.75$ TRANSPORTATION MANAGERCOORDINATOR OFFICE DATA & ACCOUNTABILITY B746 112,323.00$ 114,569.46$ 115,715.15$ 117,450.88$ 118,625.39$ COORDINATOR OF ASSESSMENT PROGDIRECTOR WELCOME CENTER C765 110,818.00$ 113,034.36$ 114,164.70$ 115,877.17$ 117,035.95$ DIRECTOR OF WELCOME CENTERDIRECTOR HEALTH SERVICES A796 90,929.00$ 92,747.58$ 93,675.06$ 95,080.18$ 96,030.98$ DIRECTOR OF HEALTH SERVICESMANAGER FOOD SERVICE C740 95,481.00$ 97,390.62$ 98,364.53$ 99,839.99$ 100,838.39$ ORGANIZATION MANAGERPROGRAM ADMINISTRATOR LANG SPEECH AND HEARING A726 52,899.00$ 53,956.98$ 54,496.55$ 55,314.00$ 55,867.14$ PROGRAM ADMINSTRATORDIRECTOR FOOD SERVICE C765 128,097.00$ 130,658.94$ 131,965.53$ 133,945.01$ 135,284.46$ DIRECTOR OF OPERATIONSCOORDINATOR FOOD SERVICE C720 80,592.00$ 82,203.84$ 83,025.88$ 84,271.27$ 85,113.98$ CHILD & NUTRITION FIELD MNGRMANAGER FOOD SERVICE C720 80,592.00$ 82,203.84$ 83,025.88$ 84,271.27$ 85,113.98$ SATELLITE MANAGERDIRECTOR OFFICE OF FINANCE C765 117,603.00$ 119,955.06$ 121,154.61$ 122,971.93$ 124,201.65$ DIR FIN PLANNING & GRANTS MGMTMANAGER FOOD SERVICE C720 80,592.00$ 82,203.84$ 83,025.88$ 84,271.27$ 85,113.98$ CHILD & NUTRITION FIELD MNGRSUPERVISOR PRINTING AND DUPLICATING C710 88,596.00$ 90,367.92$ 91,271.60$ 92,640.67$ 93,567.08$ SUPERVISOR OF PRINTING & DUPLCOORDINATOR FOOD SERVICE C725 90,030.00$ 91,830.60$ 92,748.91$ 94,140.14$ 95,081.54$ CHILD & NUTRITION SR FIELD MGRDIRECTOR OFFICE DATA & ACCOUNTABILITY C780 121,442.00$ 123,870.84$ 125,109.55$ 126,986.19$ 128,256.05$ SR DIR OF DATA AND ACCOUNTBLTYCOORDINATOR SPECIAL EDUCATION C745 102,254.00$ 104,299.08$ 105,342.07$ 106,922.20$ 107,991.42$ STUDENT BASED COORDINATORCOORDINATOR SPECIAL EDUCATION C710 88,596.00$ 90,367.92$ 91,271.60$ 92,640.67$ 93,567.08$ MEDICAID COORDINATORDIRECTOR FOOD SERVICE C780 146,349.00$ 149,275.98$ 150,768.74$ 153,030.27$ 154,560.57$ SR DIR OF FOOD & CHLD NUTR SERMANAGER MHIS C755 125,482.00$ 127,991.64$ 129,271.56$ 131,210.63$ 132,522.74$ NETWORK MANAGERCOORDINATOR HEALTH SERVICES C760 107,457.00$ 109,606.14$ 110,702.20$ 112,362.73$ 113,486.36$ COORDINATORLEAD SCHOOL SAFETY OFFICER SECURITY 6B6 55,000.00$ 56,100.00$ 56,661.00$ 57,510.92$ 58,086.02$ LEAD SCHOOL SAFETY OFFICERLEAD SCHOOL SAFETY OFFICER SECURITY 6B6 55,000.00$ 56,100.00$ 56,661.00$ 57,510.92$ 58,086.02$ LEAD SCHOOL SAFETY OFFICERSUPERVISOR BUILDINGS AND GROUNDS C715 77,240.00$ 78,784.80$ 79,572.65$ 80,766.24$ 81,573.90$ ORGANIZATION SUPERVISORMANAGER MHIS C735 95,204.00$ 97,108.08$ 98,079.16$ 99,550.35$ 100,545.85$ FINANCIAL SYSTEM MANAGER(MHIS)
3,525,858.00$ 3,596,375.16$ 3,632,338.91$ 3,686,824.00$ 3,723,692.24$Total Dollar Increase 70,517.16$ 35,963.75$ 54,485.08$ 36,868.24$Overall Cost of Increases 70,517.16$ 106,480.91$ 160,966.00$ 197,834.24$
Total Cost 535,798.30$

Fully-Insured Equivalent Rate
Employee Contribution
BOE HSA Contribution BOE Total
EE % of Premium
Fully-Insured Equivalent Rate
Employee Contribution
BOE HSA Contribution BOE Total
EE % of Premium
Contribution Change
HDHP W/ HEALTH SAVINGS ACCOUNT
Enrollment Tier Count CountEmployee Only 4 $974.68 $165.70 $83.33 $892.31 17% 8 $974.68 $165.70 $83.33 $892.31 17% 0%Employee + 1 2 $1,968.99 $334.73 $166.67 $1,800.93 17% 8 $1,968.99 $334.73 $166.67 $1,800.93 17% 0%Employee + Family 3 $2,610.95 $443.86 $166.67 $2,333.76 17% 15 $2,610.95 $443.86 $166.67 $2,333.76 17% 0%Total Annual Premium 9 $188,035 $31,966 $14,000 $170,069 17% 31 $752,563 $127,936 $54,001 $678,628 17% 0%
PPO PLAN
Enrollment Tier Count CountEmployee Only 4 $1,291.31 $258.26 $1,033.05 20% 0 $1,291.31 $258.26 $892.31 20% 0%Employee + 1 6 $2,629.97 $525.99 $2,103.98 20% 0 $2,629.97 $525.99 $1,800.93 20% 0%Employee + Family 12 $3,541.48 $708.30 $2,833.18 20% 0 $3,541.48 $708.30 $2,333.76 20% 0%Total Annual Premium 22 $761,313 $152,263 $609,050 20% 0 $0 $0 $0 0%
Estimated Total $949,348 $184,229 $14,000 $779,119 19.4% $752,563 $127,936 $54,001 $678,628 17.0% -30.6%
CHANGE IN BOE REVENUEESTIMATED EXPENSE SAVINGSCHANGE IN BOE NET COST
N/A ($56,293)
N/A $100,491N/A $156,784
Hartford Board of Education - Active HSSSA Example
Medical, Prescription Drug, and Dental Employee Contributions
July 1, 2019 to June 30, 2020 Scenario 2 - Full Conversion to HSA
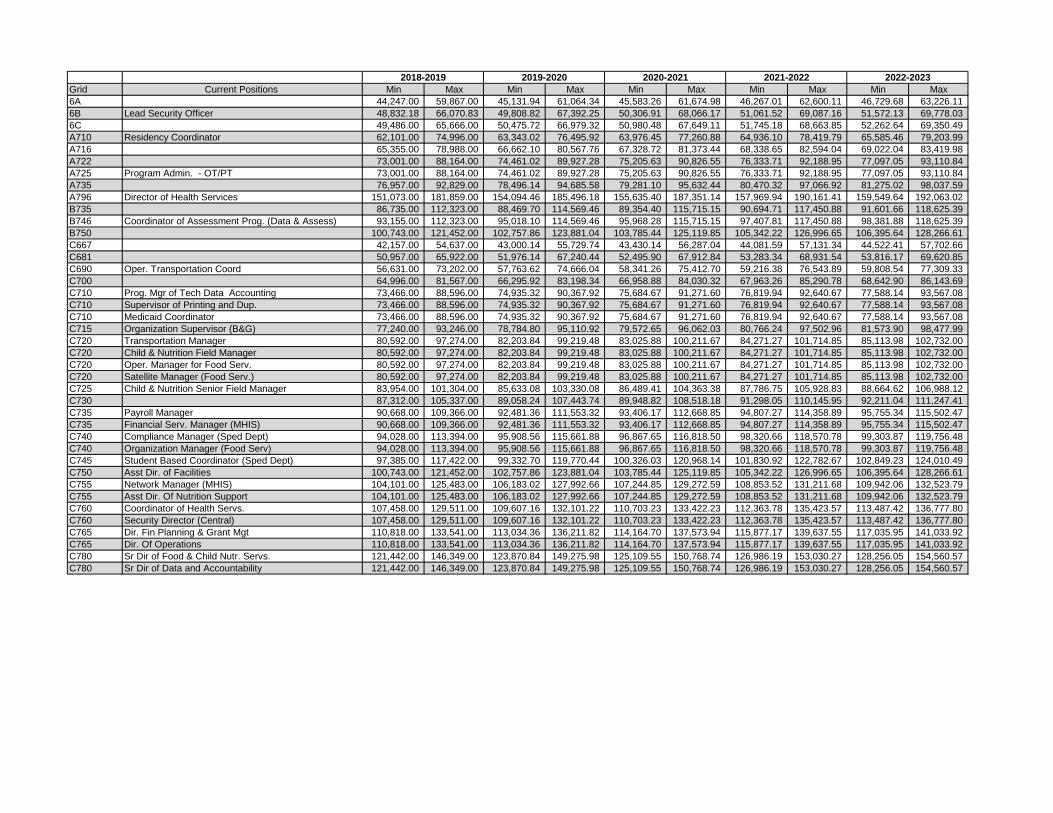
Grid Current Positions Min Max Min Max Min Max Min Max Min Max
6A 44,247.00 59,867.00 45,131.94 61,064.34 45,583.26 61,674.98 46,267.01 62,600.11 46,729.68 63,226.11
6B Lead Security Officer 48,832.18 66,070.83 49,808.82 67,392.25 50,306.91 68,066.17 51,061.52 69,087.16 51,572.13 69,778.03
6C 49,486.00 65,666.00 50,475.72 66,979.32 50,980.48 67,649.11 51,745.18 68,663.85 52,262.64 69,350.49
A710 Residency Coordinator 62,101.00 74,996.00 63,343.02 76,495.92 63,976.45 77,260.88 64,936.10 78,419.79 65,585.46 79,203.99
A716 65,355.00 78,988.00 66,662.10 80,567.76 67,328.72 81,373.44 68,338.65 82,594.04 69,022.04 83,419.98
A722 73,001.00 88,164.00 74,461.02 89,927.28 75,205.63 90,826.55 76,333.71 92,188.95 77,097.05 93,110.84
A725 Program Admin. - OT/PT 73,001.00 88,164.00 74,461.02 89,927.28 75,205.63 90,826.55 76,333.71 92,188.95 77,097.05 93,110.84
A735 76,957.00 92,829.00 78,496.14 94,685.58 79,281.10 95,632.44 80,470.32 97,066.92 81,275.02 98,037.59
A796 Director of Health Services 151,073.00 181,859.00 154,094.46 185,496.18 155,635.40 187,351.14 157,969.94 190,161.41 159,549.64 192,063.02
B735 86,735.00 112,323.00 88,469.70 114,569.46 89,354.40 115,715.15 90,694.71 117,450.88 91,601.66 118,625.39
B746 Coordinator of Assessment Prog. (Data & Assess) 93,155.00 112,323.00 95,018.10 114,569.46 95,968.28 115,715.15 97,407.81 117,450.88 98,381.88 118,625.39
B750 100,743.00 121,452.00 102,757.86 123,881.04 103,785.44 125,119.85 105,342.22 126,996.65 106,395.64 128,266.61
C667 42,157.00 54,637.00 43,000.14 55,729.74 43,430.14 56,287.04 44,081.59 57,131.34 44,522.41 57,702.66
C681 50,957.00 65,922.00 51,976.14 67,240.44 52,495.90 67,912.84 53,283.34 68,931.54 53,816.17 69,620.85
C690 Oper. Transportation Coord 56,631.00 73,202.00 57,763.62 74,666.04 58,341.26 75,412.70 59,216.38 76,543.89 59,808.54 77,309.33
C700 64,996.00 81,567.00 66,295.92 83,198.34 66,958.88 84,030.32 67,963.26 85,290.78 68,642.90 86,143.69
C710 Prog. Mgr of Tech Data Accounting 73,466.00 88,596.00 74,935.32 90,367.92 75,684.67 91,271.60 76,819.94 92,640.67 77,588.14 93,567.08
C710 Supervisor of Printing and Dup. 73,466.00 88,596.00 74,935.32 90,367.92 75,684.67 91,271.60 76,819.94 92,640.67 77,588.14 93,567.08
C710 Medicaid Coordinator 73,466.00 88,596.00 74,935.32 90,367.92 75,684.67 91,271.60 76,819.94 92,640.67 77,588.14 93,567.08
C715 Organization Supervisor (B&G) 77,240.00 93,246.00 78,784.80 95,110.92 79,572.65 96,062.03 80,766.24 97,502.96 81,573.90 98,477.99
C720 Transportation Manager 80,592.00 97,274.00 82,203.84 99,219.48 83,025.88 100,211.67 84,271.27 101,714.85 85,113.98 102,732.00
C720 Child & Nutrition Field Manager 80,592.00 97,274.00 82,203.84 99,219.48 83,025.88 100,211.67 84,271.27 101,714.85 85,113.98 102,732.00
C720 Oper. Manager for Food Serv. 80,592.00 97,274.00 82,203.84 99,219.48 83,025.88 100,211.67 84,271.27 101,714.85 85,113.98 102,732.00
C720 Satellite Manager (Food Serv.) 80,592.00 97,274.00 82,203.84 99,219.48 83,025.88 100,211.67 84,271.27 101,714.85 85,113.98 102,732.00
C725 Child & Nutrition Senior Field Manager 83,954.00 101,304.00 85,633.08 103,330.08 86,489.41 104,363.38 87,786.75 105,928.83 88,664.62 106,988.12
C730 87,312.00 105,337.00 89,058.24 107,443.74 89,948.82 108,518.18 91,298.05 110,145.95 92,211.04 111,247.41
C735 Payroll Manager 90,668.00 109,366.00 92,481.36 111,553.32 93,406.17 112,668.85 94,807.27 114,358.89 95,755.34 115,502.47
C735 Financial Serv. Manager (MHIS) 90,668.00 109,366.00 92,481.36 111,553.32 93,406.17 112,668.85 94,807.27 114,358.89 95,755.34 115,502.47
C740 Compliance Manager (Sped Dept) 94,028.00 113,394.00 95,908.56 115,661.88 96,867.65 116,818.50 98,320.66 118,570.78 99,303.87 119,756.48
C740 Organization Manager (Food Serv) 94,028.00 113,394.00 95,908.56 115,661.88 96,867.65 116,818.50 98,320.66 118,570.78 99,303.87 119,756.48
C745 Student Based Coordinator (Sped Dept) 97,385.00 117,422.00 99,332.70 119,770.44 100,326.03 120,968.14 101,830.92 122,782.67 102,849.23 124,010.49
C750 Asst Dir. of Facilities 100,743.00 121,452.00 102,757.86 123,881.04 103,785.44 125,119.85 105,342.22 126,996.65 106,395.64 128,266.61
C755 Network Manager (MHIS) 104,101.00 125,483.00 106,183.02 127,992.66 107,244.85 129,272.59 108,853.52 131,211.68 109,942.06 132,523.79
C755 Asst Dir. Of Nutrition Support 104,101.00 125,483.00 106,183.02 127,992.66 107,244.85 129,272.59 108,853.52 131,211.68 109,942.06 132,523.79
C760 Coordinator of Health Servs. 107,458.00 129,511.00 109,607.16 132,101.22 110,703.23 133,422.23 112,363.78 135,423.57 113,487.42 136,777.80
C760 Security Director (Central) 107,458.00 129,511.00 109,607.16 132,101.22 110,703.23 133,422.23 112,363.78 135,423.57 113,487.42 136,777.80
C765 Dir. Fin Planning & Grant Mgt 110,818.00 133,541.00 113,034.36 136,211.82 114,164.70 137,573.94 115,877.17 139,637.55 117,035.95 141,033.92
C765 Dir. Of Operations 110,818.00 133,541.00 113,034.36 136,211.82 114,164.70 137,573.94 115,877.17 139,637.55 117,035.95 141,033.92
C780 Sr Dir of Food & Child Nutr. Servs. 121,442.00 146,349.00 123,870.84 149,275.98 125,109.55 150,768.74 126,986.19 153,030.27 128,256.05 154,560.57
C780 Sr Dir of Data and Accountability 121,442.00 146,349.00 123,870.84 149,275.98 125,109.55 150,768.74 126,986.19 153,030.27 128,256.05 154,560.57
2018-2019 2019-2020 2020-2021 2021-2022 2022-2023

City of Hartford - Cyber Risk Assessment
1. Determine how vulnerable we are as a target.
2. Identify:
Cyber threats to the City
Internal and External Threats
Adverse impacts (harm) that may occur
Finding weak points
3. Once the potential threats are identified, we can determine
how they would impact the actual city’s network infrastructure
and defenses.
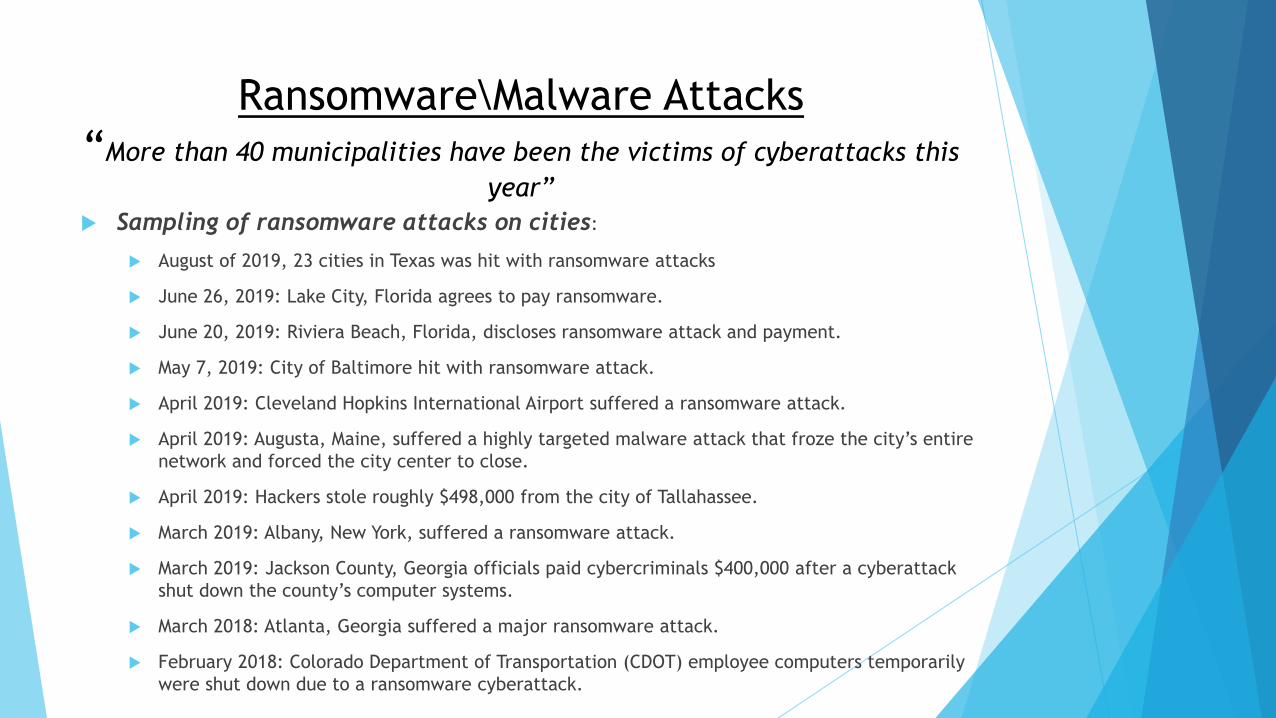
Ransomware\Malware Attacks
“More than 40 municipalities have been the victims of cyberattacks this
year”
Sampling of ransomware attacks on cities:
August of 2019, 23 cities in Texas was hit with ransomware attacks
June 26, 2019: Lake City, Florida agrees to pay ransomware.
June 20, 2019: Riviera Beach, Florida, discloses ransomware attack and payment.
May 7, 2019: City of Baltimore hit with ransomware attack.
April 2019: Cleveland Hopkins International Airport suffered a ransomware attack.
April 2019: Augusta, Maine, suffered a highly targeted malware attack that froze the city’s entire
network and forced the city center to close.
April 2019: Hackers stole roughly $498,000 from the city of Tallahassee.
March 2019: Albany, New York, suffered a ransomware attack.
March 2019: Jackson County, Georgia officials paid cybercriminals $400,000 after a cyberattack
shut down the county’s computer systems.
March 2018: Atlanta, Georgia suffered a major ransomware attack.
February 2018: Colorado Department of Transportation (CDOT) employee computers temporarily
were shut down due to a ransomware cyberattack.

Ransomware\Malware Attacks
“Schools Districts have also become the victims of cyberattacks this
year as well”
Sampling of ransomware attacks on school districts in 2019:
Lake County, Indiana
Rockville Center School District in Rockville Center, New York
Moses Lake School District in Moses Lake, Washington
Mineola Public Schools in Mineola, New York
The Stevens Institute of Technology in Hoboken, New Jersey
New Kent County Public Schools in New Kent, Virginia
Nampa Idaho School District, Nampa, Idaho
Middletown School District, Middletown, Connecticut
Wolcott Public Schools, Wolcott, Connecticut
Wallingford School District, Wallingford, Connecticut
New Haven Public Schools, New Haven, Connecticut
Louisiana's governor declared a state of emergency after a wave of ransomware attacks hits
school districts within the state.

Reported Ransomware Attacks reported in the US in 2019
Protecting ourselves against supercharged threats will only grow more complicated, unfortunately localities are on the front line.”


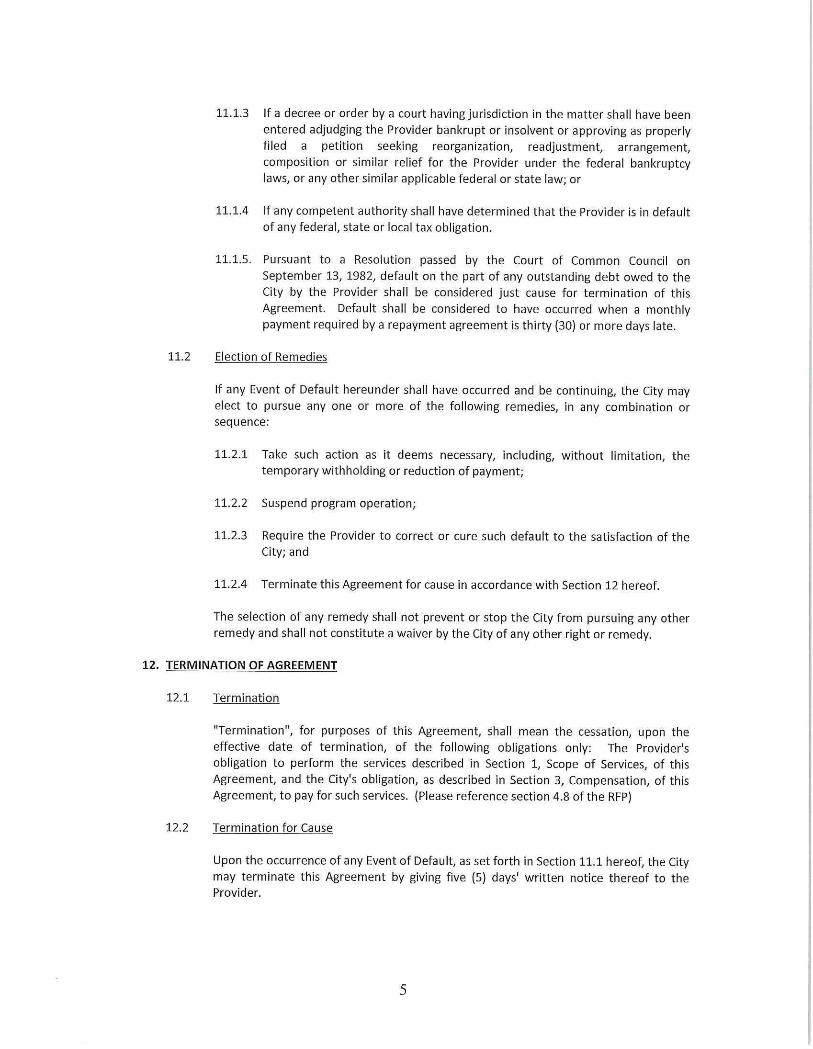
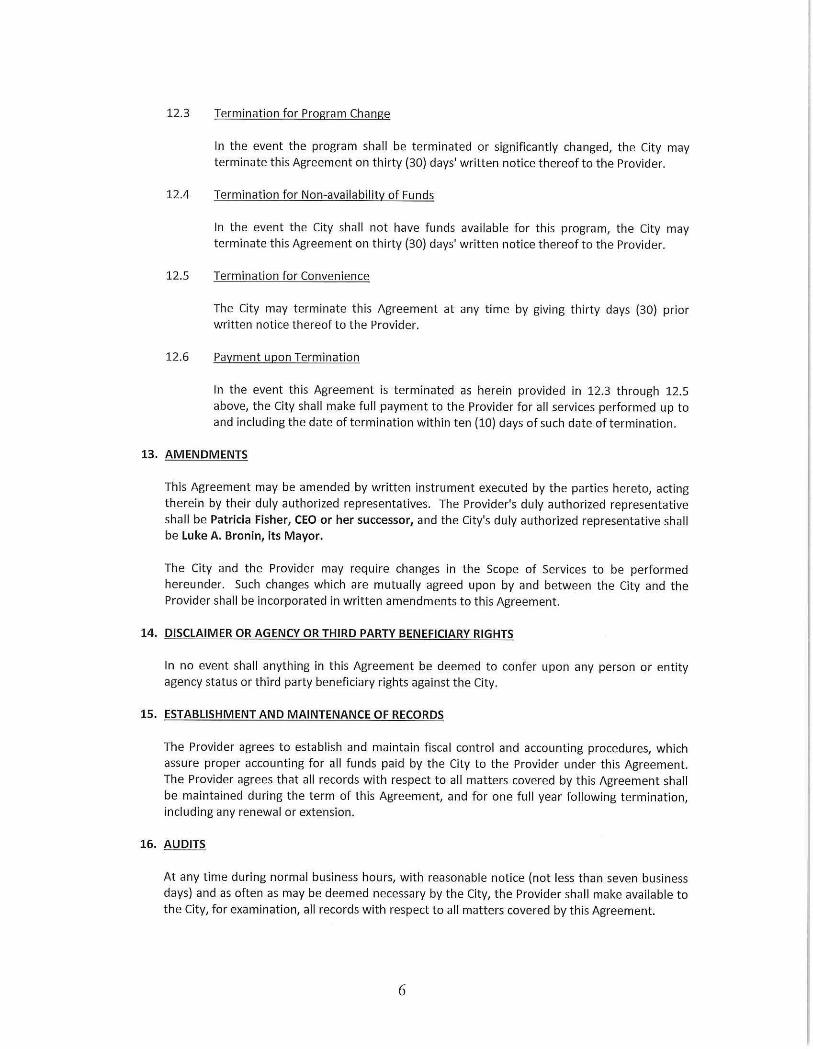


MEMORANDUM MUNICIPAL ACCOUNTABILITY REVIEW BOARD
To: Municipal Accountability Review Board
From: Julian Freund
Subject: Update on West Haven Subcommittee
Date: September 6, 2019 At its most recent meeting on September 13, the West Haven Subcommittee reviewed and discussed the proposed AFSCME Local 2706 contract which covers just under 100 non-certified employees of the West Haven Board of Education. The contract is consistent with others that have come before the MARB with regard to general wage increases (two years of hard 0% followed by a 1% increase) and transition to a high deductible health plan. The contract also contains language preserving the board’s option of transitioning to the State Partnership plan. The subcommittee voted to advance the contract to the full MARB and requested additional financial impact information be provided. The requested information was submitted by the Board of Education and the contract was approved by the full MARB at a special meeting on August 29. The Subcommittee also reviewed the City’s plan for completing the FY 2019 financial audit. The Finance Director provided an itemization of reports and information required to complete the audit and assignment of responsibility for completion of each item. In the discussion with Subcommittee members, a suggestion was made to add a date for each item indicating the target deadline for getting information to the auditor. The Finance Director also reviewed the status of the corrective action plan related to the FY 2018 audit findings. Members expressed interest in obtaining responses to audit findings concerning the Board of Education. The City’s authority to enforce City policy and controls related to City owned assets in any department was also discussed. The Finance Director provided updates on the progress of various budgetary efficiency measures and the status of the anticipated fall bond issue. The bond issue is an item for review and discussion on the September MARB agenda. The City’s bond advisor is expected to attend to provide a description of the planned issue.

1
As requested, the following is summary of the City’s proposal to issue short‐term Bond Anticipation Notes (BANs) to fund its on‐going high school renovation project.
Plan of Finance
The City currently has $22,000,000 in outstanding BANs that mature on October 2, 2019. The notes were originally issued on October 3, 2017 in the amount of $9,000,000 and were rolled over and increased on October 2, 2018, and April 2, 2019. The current plan of finance calls for the City to roll over the existing BANs and add approximately $10,500,000 in new money to cover forward project costs as well as the cost of issuance, including capitalized interest. At maturity of the BANs in April 2020, the City would bond approximately $13,000,000 of the maturing BANs and roll over the balance. Ultimately, the BANs will be retired through the issuance of bonds in roughly equal installments over the following two years. The plan of finance was intentionally structured to phase‐in the debt impact of the project over multiple fiscal years, targeting the drop‐off in existing debt in fiscal year ending 2023.
Project Expenditure and Revenue Summary
City Council Appropriation/Authorization Approval Date June 26, 2017
Anticipated total project cost: $130,446,000
Total authorization including capitalized issuance costs: $133,250,000
Anticipated State reimbursement: $ 95,673,000
City net share of project costs: $ 37,577,000
City bonds issued to date: $ 0
Detail of Historic and Projected Project Expenditures and Revenues
The following represents the City’s net cash needs over the next 6 months:
Total spending through August 2019: $61,442,269
Projected spending through April 2020: $26,080,000
Total capitalized note interest and cost of issuance (proposed & prior notes) $1,274,204
Total spending $88,796,473
Less:
Historic reimbursement to date $38,453,916
Projected reimbursement through April 2020 $17,903,487
Net City cash needs $32,439,070
Proposed BAN issuance (Roll‐over + new money) $32,500,000
To: Julian Freund, Office of Policy and Management
From: Bill Lindsay, Hilltop Securities
CC: Mayor Nancy Rossi, City of West Haven Frank Cieplinski, Director of Finance, City of West Haven Michael Malone, MARB Liaison John Stafstrom, Pullman & Comley Michael Andreana, Pullman & Comley
Date: 9/12/2019
Re: City of West Haven Bond Anticipation Notes October 2019

City of West Haven Proposed Bond Anticipation Notes, October 2019 September 12, 2019
2
Comparison with prior Plan of Finance
The proposed note issuance is consistent with the prior plan of finance provided in April 2019 except that the current plan delays the first bond series by six months, from October 2019 until April 2020. The current plan of finance will maintain a declining debt profile for the City, maintaining a key element of the original plan while providing the City flexibility to issue additional debt in the future. Additionally, given the reduction in interest rates over the last five months and the change in the City’s bond rating outlook, the current plan projects to the save the city roughly $3M in interest expense over the next ten (10) fiscal years. The projected change in debt service over the next ten (10) fiscal years is as follows:
Fiscal Debt Service April 2019 Plan Sept. 2019
Plan Resulting
Year In 5 year Plan High School High School Change Debt Service
2019‐20 $18,873,827 $312,500 $0 ($312,500) $18,561,327
2020‐21 $18,451,492 $1,559,375 $1,077,500 ($481,875) $17,969,617
2021‐22 $17,195,829 $2,162,547 $1,604,500 ($558,047) $16,637,782
2022‐23 $9,927,855 $3,756,578 $3,259,500 ($497,078) $9,430,777
2023‐24 $10,688,339 $3,242,797 $3,017,500 ($225,297) $10,463,042
2024‐25 $10,303,511 $3,213,484 $2,943,500 ($269,984) $10,033,527
2025‐26 $7,630,406 $3,205,969 $3,139,500 ($66,469) $7,563,937
2026‐27 $5,404,513 $3,292,125 $3,127,000 ($165,125) $5,239,388
2027‐28 $4,874,700 $3,296,375 $3,035,750 ($260,625) $4,614,075
2028‐29 $2,809,491 $3,222,484 $3,019,500 ($202,984) $2,606,507
Budgetary Impact of Proposed Note Issue
There is no immediate budget impact from the proposed BAN issue as both cost of issuance and short‐term note interest is being capitalized into the project rather than being paid from the City’s General Fund. The budgetary impact of the proposed bond issue in April 2020 is consistent with the prior plan of finance submitted in April 2019 in the that the first principal payment on the first bond series will begin in fiscal year 2020‐21.
Anticipated Schedule of Permanent Financing the Notes
The current plan of finance calls for the City to permanently finance a portion of the notes by April 2020 or earlier if the City’s fiscal year ending 2019 audit is completed by December 31, 2019. The City has asked Webster Bank for the option to pre‐pay the BANs prior to maturity without penalty and Webster has agreed, subject to final credit approval. At this time, there is no foreseeable reason that the City will not meet the proposed schedule. We believe that the City’s credit profile has improved with the receipt of the Restructuring Funds which contributed to the City achieving a positive cumulative General Fund Balance as of June 30, 2018. Moody’s Investor Service recently removed its negative outlook on the City. We fully expect the City to have market access in April 2020 to permanently finance the maturing BANs. Delaying the first bond issue until the fiscal year ending 2019 audit is complete will only help to strengthen the City’s market access.

9/11/2019 12:29 PM WHHS_Financing.Plan_rev.9-11-19.xlsx
City of West Haven
Pro Forma Debt Service Impact
West Haven High School
Phase‐in borrowing
BANs 2017 BANs 2018 BANs 2019A BANs 2019B BANs 2019C Bonds 2020 BANs 2020 Bonds 2021 BANs 2021 Bonds 2022 BANs 2022 BANs 2023 BANs 2024
$9,000,000 $9,157,000 $9,350,000 $12,650,000 $32,500,000 $13,000,000 $35,100,000 $12,500,000 $22,600,000 $12,075,000 $10,525,000 $10,525,000 $10,525,000
Dated: 10/3/17 Dated: 10/3/18 Dated: 4/2/19 Dated: 4/2/19 Dated: 10/2/19 Dated: 4/2/20 Dated: 4/2/20 Dated: 4/1/21 Dated: 4/1/21 Dated: 4/1/22 Dated: 4/1/22 Dated: 4/1/23 Dated: 4/1/24 Total
Fiscal Due: 10/3/18 Due: 4/2/19 Due: 10/2/19 Due: 10/2/19 Due: 4/2/20 Due: 4/1/21‐40 Due: 4/1/21 Due: 4/1/23‐41 Due: 4/1/22 Due: 4/1/24‐42 Due: 4/1/23 Due: 4/1/24 Due: 4/1/25 WHHS Project 1 Fiscal
Year Interest @ 1.75% Interest @ 3.25% Interest @ 3.17% Interest @ 3.17% Interest @ 2.60% Interest @ 2.89% Interest @ 2.00% Interest @ 2.89% Interest @ 2.00% Interest @ 2.89% Interest @ 2.00% Interest @ 2.25% Interest @ 2.5% Year
Ending Interest Interest Interest Interest Interest P&I Interest P&I Interest P&I Interest Interest Interest P&I Ending
2019 157,422$ 148,772$ ‐$ ‐$ ‐$ ‐$ ‐$ ‐$ ‐$ ‐$ ‐$ ‐$ ‐$ ‐$ 2019
2020 ‐ ‐ 148,104 200,376 422,500 ‐ ‐ ‐ ‐ ‐ ‐ ‐ ‐ ‐ 2020
2021 ‐ ‐ 1,077,500 702,000 ‐ ‐ ‐ ‐ ‐ ‐ 1,077,500 2021
2022 ‐ ‐ 1,052,500 ‐ 552,000 452,000 ‐ ‐ ‐ ‐ 1,604,500 2022
2023 ‐ ‐ 1,027,500 ‐ 1,052,000 ‐ 1,180,000 210,500 ‐ ‐ 3,259,500 2023
2024 ‐ ‐ 1,052,500 ‐ 1,027,000 ‐ 938,000 ‐ 236,813 ‐ 3,017,500 2024
2025 ‐ ‐ 1,025,000 ‐ 1,002,000 ‐ 916,500 ‐ ‐ 263,125 2,943,500 2025
2026 ‐ ‐ 1,047,500 ‐ 1,027,000 ‐ 1,065,000 ‐ ‐ ‐ 3,139,500 2026
2027 ‐ ‐ 1,042,500 ‐ 1,049,500 ‐ 1,035,000 ‐ ‐ ‐ 3,127,000 2027
2028 ‐ ‐ 1,011,250 ‐ 1,019,500 ‐ 1,005,000 ‐ ‐ ‐ 3,035,750 2028
2029 ‐ ‐ 1,005,000 ‐ 1,039,500 ‐ 975,000 ‐ ‐ ‐ 3,019,500 2029
2030 ‐ ‐ 972,500 ‐ 1,007,000 ‐ 945,000 ‐ ‐ ‐ 2,924,500 2030
2031 ‐ ‐ 940,000 ‐ 974,500 ‐ 915,000 ‐ ‐ ‐ 2,829,500 2031
2032 ‐ ‐ 964,000 ‐ 992,000 ‐ 885,000 ‐ ‐ ‐ 2,841,000 2032
2033 ‐ ‐ 936,000 ‐ 964,000 ‐ 870,000 ‐ ‐ ‐ 2,770,000 2033
2034 ‐ ‐ 908,000 ‐ 936,000 ‐ 870,400 ‐ ‐ ‐ 2,714,400 2034
2035 ‐ ‐ 930,000 ‐ 908,000 ‐ 844,800 ‐ ‐ ‐ 2,682,800 2035
2036 ‐ ‐ 900,000 ‐ 930,000 ‐ 819,200 ‐ ‐ ‐ 2,649,200 2036
2037 ‐ ‐ 870,000 ‐ 900,000 ‐ 793,600 ‐ ‐ ‐ 2,563,600 2037
2038 ‐ ‐ 840,000 ‐ 870,000 ‐ 768,000 ‐ ‐ ‐ 2,478,000 2038
2039 ‐ ‐ 810,000 ‐ 840,000 ‐ 742,400 ‐ ‐ ‐ 2,392,400 2039
2040 ‐ ‐ 780,000 ‐ 810,000 ‐ 716,800 ‐ ‐ ‐ 2,306,800 2040
2041 ‐ ‐ ‐ ‐ 780,000 ‐ 691,200 ‐ ‐ ‐ 1,471,200 2041
2042 ‐ ‐ ‐ ‐ ‐ ‐ 665,600 ‐ ‐ ‐ 665,600 2042
157,422$ 148,772$ 148,104$ 200,376$ 422,500$ 19,191,750$ 702,000$ 18,680,000$ 452,000$ 17,641,500$ 195,050$ 236,813$ 263,125$ 55,513,250$ 1
New West Haven High School
Projected WHHS Debt service cashflow does not include $2,792,839 in short‐term BAN interest that will be charged to the project (i.e. capitalized interest).
Phased‐in Borrowing for WHHS
Prepared by Hilltop Securities Inc. Page 1 of 1 WHHS.Debt.Impact

City of West Haven July FY2020 Monthly Financial Report to the
Municipal Accountability Review Board
September 19, 2020

Page 1
City of West Haven
Budget and Financial Report to the
Municipal Accountability Review Board
Contents …………………………………………………………… 1
Memorandum – West Haven Financial Report……………… 2
FY20 Expenditure Summary - Departments………...……... 3
FY20 Revenue Summary - Subcategories………...……….… 4
FY19 and FY20 Property Tax Collections Report……….….. 5
FY20 Expenditure Summary - Subcategories..………….…. 6
FY20 Expenditure Summary – Board of Education…….…. 7
FY20 Category of Revenues & Expenditures Summary….. 8
FY20 Expenditure Summary – Sewer………………..………. 9
FY20 Expenditure Summary – Allingtown Fire Dept……... 10

Page 2
Interoffice Memorandum-Office of Mayor Nancy Rossi
To: Municipal Accountability Review Board
From: Frank M. Cieplinski
Date: 9/11/2019
Subject: City of West Haven Monthly Financial Report July of FY20
I) Introduction
I am transmitting the City’s monthly financial report for the period ended June 30, 2019 which
includes the General Fund. The Sewer Fund, and the Allingtown Fire Department are included
as well.
Please note that in prior years West Haven has not done a solid July close, instead truing up
August results to acurately reflect the first two months of the year. As part of the process
improvements in place, July entries have been booked this year which makes a year over year
analysis impossible.
As we move forward the normal comparative narrative should be able to be provided.

CITY OF WEST HAVEN Variances favorable/(unfavorable)
DEPARTMENT EXPENDITURES
July 2019
A C T U A L F O R E C A S T
Department
FY20
Budget
Jul YTD
Actual
Jul YTD
FY19
Jul YTD %
Budget
FY19 YTD
% Actual
FY20
Projected
Jul YTD %
Fcst ∆ to Budget
100 City Council 162,672 7,208 6,226 4.4% 7.1% 162,672 4.4% -
105 Mayor 317,111 71,496 17,641 22.5% 5.8% 317,111 22.5% -
110 Corporation Counsel 466,368 12,318 18,115 2.6% 4.1% 466,368 2.6% -
115 Personnel Department 170,585 12,489 10,826 7.3% 6.4% 170,585 7.3% -
120 Telephone Administration 320,000 158 - 0.0% 0.0% 320,000 0.0% -
125 City Clerk 266,278 16,292 15,990 6.1% 5.3% 266,278 6.1% -
130 Registrar Of Voters 137,002 11,854 14,079 8.7% 9.7% 137,002 8.7% -
165 Probate Court 8,020 376 - 4.7% 0.0% 8,020 4.7% -
190 Planning & Development 968,935 64,408 55,673 6.6% 6.1% 968,935 6.6% -
Central Government Total 2,816,971 196,598 138,551 7.0% 5.0% 2,816,971 7.0% -
200 Treasurer 7,600 633 633 8.3% 8.3% 7,600 8.3% -
210 Comptroller 1,134,370 619,542 44,879 54.6% 4.1% 1,134,370 54.6% -
220 Central Services 750,933 59,548 18,526 7.9% 2.4% 750,933 7.9% -
230 Assessment 447,888 32,659 24,389 7.3% 5.5% 447,888 7.3% -
240 Tax Collector 429,004 28,890 22,529 6.7% 5.5% 429,004 6.7% -
Finance Total 2,769,795 741,273 110,957 26.8% 4.1% 2,769,795 26.8% -
300 Emergency Report System D 1,906,271 122,902 122,994 6.4% 6.8% 1,906,271 6.4% -
310 Police Department 13,491,535 1,224,690 1,172,108 9.1% 8.9% 13,491,535 9.1% -
320 Animal Control 283,566 19,537 20,676 6.9% 7.8% 283,566 6.9% -
330 Civil Preparedness 14,198 3,000 - 21.1% 0.0% 14,198 21.1% -
Public Service Total 15,695,570 1,370,128 1,315,778 8.7% 8.6% 15,695,570 8.7% -
400 Public Works Administration 604,341 32,573 24,726 5.4% 4.4% 604,341 5.4% -
410 Engineering 339,311 8,886 7,379 2.6% 3.9% 339,311 2.6% -
440 Central Garage 1,323,141 45,484 28,253 3.4% 2.6% 1,323,141 3.4% -
450 Solid Waste 3,215,901 143,875 179,274 4.5% 5.4% 3,215,901 4.5% -
460 Building & Ground Maintenance1,243,881 43,412 25,085 3.5% 2.0% 1,243,881 3.5% -
470 Highways & Parks 4,038,581 267,807 152,453 6.6% 3.8% 4,038,581 6.6% -
Public Works Total 10,765,156 542,037 417,170 5.0% 4.0% 10,765,156 5.0% -
500 Human Resources 279,237 21,508 17,449 7.7% 6.9% 279,237 7.7% -
510 Elderly Services 441,772 12,883 9,461 2.9% 1.9% 441,772 2.9% -
520 Parks & Recreation 878,548 146,020 133,243 16.6% 15.8% 878,548 16.6% -
530 Health Department 344,438 27,583 17,418 8.0% 5.7% 344,438 8.0% -
Health & Human Services Total 1,943,995 207,993 177,572 10.7% 9.3% 1,943,995 10.7% -
600 Library 1,421,000 126,750 126,750 8.9% 8.2% 1,421,000 8.9% -
800 City Insurance 800,977 420,353 - 52.5% 0.0% 800,977 52.5% -
810 Employee Benefits 17,999,404 1,032,121 324,158 5.7% 2.0% 17,999,404 5.7% -
820 Debt Service 18,873,827 6,660,680 8,311,586 35.3% 43.9% 18,873,827 35.3% -
830 C-Med 42,179 - - 0.0% 0.0% 42,179 0.0% -
900 Unallocated Expenses (168,460) 45,921 3,212 -27.3% 0.4% (168,460) -27.3% -
Other Total 38,968,927 8,285,825 8,765,706 21.3% 22.7% 38,968,927 21.3% -
Total City Departments 72,960,414 11,343,855 10,925,734 15.5% 15.3% 72,960,414 15.5% -
Board of Education 89,960,421 4,754,916 2,507,673 5.3% 2.8% 89,960,421 5.3% -
Total General Fund Expenses 162,920,835 16,098,771 13,433,407 9.9% 8.3% 162,920,835 9.9% 0
Note : YTD actuals exclude encumbrances
Page 3
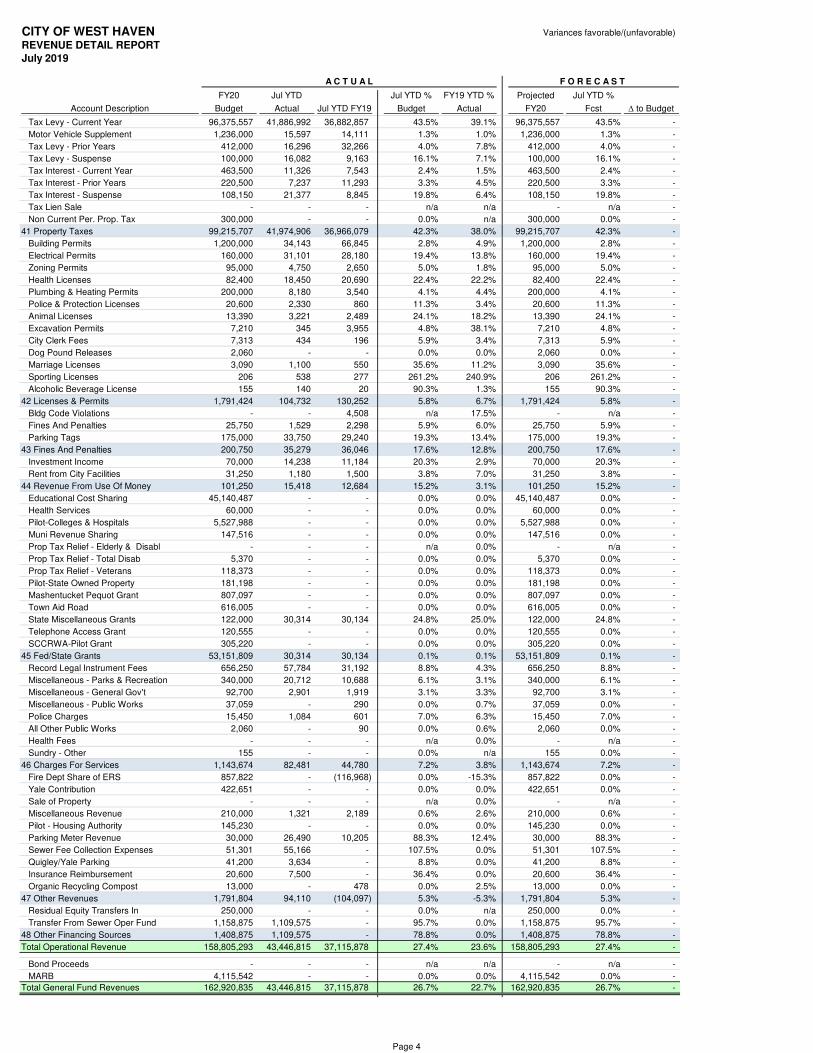
CITY OF WEST HAVEN Variances favorable/(unfavorable)
REVENUE DETAIL REPORT
July 2019
A C T U A L F O R E C A S T
Account Description
FY20
Budget
Jul YTD
Actual Jul YTD FY19
Jul YTD %
Budget
FY19 YTD %
Actual
Projected
FY20
Jul YTD %
Fcst ∆ to Budget
Tax Levy - Current Year 96,375,557 41,886,992 36,882,857 43.5% 39.1% 96,375,557 43.5% -
Motor Vehicle Supplement 1,236,000 15,597 14,111 1.3% 1.0% 1,236,000 1.3% -
Tax Levy - Prior Years 412,000 16,296 32,266 4.0% 7.8% 412,000 4.0% -
Tax Levy - Suspense 100,000 16,082 9,163 16.1% 7.1% 100,000 16.1% -
Tax Interest - Current Year 463,500 11,326 7,543 2.4% 1.5% 463,500 2.4% -
Tax Interest - Prior Years 220,500 7,237 11,293 3.3% 4.5% 220,500 3.3% -
Tax Interest - Suspense 108,150 21,377 8,845 19.8% 6.4% 108,150 19.8% -
Tax Lien Sale - - - n/a n/a - n/a -
Non Current Per. Prop. Tax 300,000 - - 0.0% n/a 300,000 0.0% -
41 Property Taxes 99,215,707 41,974,906 36,966,079 42.3% 38.0% 99,215,707 42.3% -
Building Permits 1,200,000 34,143 66,845 2.8% 4.9% 1,200,000 2.8% -
Electrical Permits 160,000 31,101 28,180 19.4% 13.8% 160,000 19.4% -
Zoning Permits 95,000 4,750 2,650 5.0% 1.8% 95,000 5.0% -
Health Licenses 82,400 18,450 20,690 22.4% 22.2% 82,400 22.4% -
Plumbing & Heating Permits 200,000 8,180 3,540 4.1% 4.4% 200,000 4.1% -
Police & Protection Licenses 20,600 2,330 860 11.3% 3.4% 20,600 11.3% -
Animal Licenses 13,390 3,221 2,489 24.1% 18.2% 13,390 24.1% -
Excavation Permits 7,210 345 3,955 4.8% 38.1% 7,210 4.8% -
City Clerk Fees 7,313 434 196 5.9% 3.4% 7,313 5.9% -
Dog Pound Releases 2,060 - - 0.0% 0.0% 2,060 0.0% -
Marriage Licenses 3,090 1,100 550 35.6% 11.2% 3,090 35.6% -
Sporting Licenses 206 538 277 261.2% 240.9% 206 261.2% -
Alcoholic Beverage License 155 140 20 90.3% 1.3% 155 90.3% -
42 Licenses & Permits 1,791,424 104,732 130,252 5.8% 6.7% 1,791,424 5.8% -
Bldg Code Violations - - 4,508 n/a 17.5% - n/a -
Fines And Penalties 25,750 1,529 2,298 5.9% 6.0% 25,750 5.9% -
Parking Tags 175,000 33,750 29,240 19.3% 13.4% 175,000 19.3% -
43 Fines And Penalties 200,750 35,279 36,046 17.6% 12.8% 200,750 17.6% -
Investment Income 70,000 14,238 11,184 20.3% 2.9% 70,000 20.3% -
Rent from City Facilities 31,250 1,180 1,500 3.8% 7.0% 31,250 3.8% -
44 Revenue From Use Of Money 101,250 15,418 12,684 15.2% 3.1% 101,250 15.2% -
Educational Cost Sharing 45,140,487 - - 0.0% 0.0% 45,140,487 0.0% -
Health Services 60,000 - - 0.0% 0.0% 60,000 0.0% -
Pilot-Colleges & Hospitals 5,527,988 - - 0.0% 0.0% 5,527,988 0.0% -
Muni Revenue Sharing 147,516 - - 0.0% 0.0% 147,516 0.0% -
Prop Tax Relief - Elderly & Disabl - - - n/a 0.0% - n/a -
Prop Tax Relief - Total Disab 5,370 - - 0.0% 0.0% 5,370 0.0% -
Prop Tax Relief - Veterans 118,373 - - 0.0% 0.0% 118,373 0.0% -
Pilot-State Owned Property 181,198 - - 0.0% 0.0% 181,198 0.0% -
Mashentucket Pequot Grant 807,097 - - 0.0% 0.0% 807,097 0.0% -
Town Aid Road 616,005 - - 0.0% 0.0% 616,005 0.0% -
State Miscellaneous Grants 122,000 30,314 30,134 24.8% 25.0% 122,000 24.8% -
Telephone Access Grant 120,555 - - 0.0% 0.0% 120,555 0.0% -
SCCRWA-Pilot Grant 305,220 - - 0.0% 0.0% 305,220 0.0% -
45 Fed/State Grants 53,151,809 30,314 30,134 0.1% 0.1% 53,151,809 0.1% -
Record Legal Instrument Fees 656,250 57,784 31,192 8.8% 4.3% 656,250 8.8% -
Miscellaneous - Parks & Recreation 340,000 20,712 10,688 6.1% 3.1% 340,000 6.1% -
Miscellaneous - General Gov't 92,700 2,901 1,919 3.1% 3.3% 92,700 3.1% -
Miscellaneous - Public Works 37,059 - 290 0.0% 0.7% 37,059 0.0% -
Police Charges 15,450 1,084 601 7.0% 6.3% 15,450 7.0% -
All Other Public Works 2,060 - 90 0.0% 0.6% 2,060 0.0% -
Health Fees - - - n/a 0.0% - n/a -
Sundry - Other 155 - - 0.0% n/a 155 0.0% -
46 Charges For Services 1,143,674 82,481 44,780 7.2% 3.8% 1,143,674 7.2% -
Fire Dept Share of ERS 857,822 - (116,968) 0.0% -15.3% 857,822 0.0% -
Yale Contribution 422,651 - - 0.0% 0.0% 422,651 0.0% -
Sale of Property - - - n/a 0.0% - n/a -
Miscellaneous Revenue 210,000 1,321 2,189 0.6% 2.6% 210,000 0.6% -
Pilot - Housing Authority 145,230 - - 0.0% 0.0% 145,230 0.0% -
Parking Meter Revenue 30,000 26,490 10,205 88.3% 12.4% 30,000 88.3% -
Sewer Fee Collection Expenses 51,301 55,166 - 107.5% 0.0% 51,301 107.5% -
Quigley/Yale Parking 41,200 3,634 - 8.8% 0.0% 41,200 8.8% -
Insurance Reimbursement 20,600 7,500 - 36.4% 0.0% 20,600 36.4% -
Organic Recycling Compost 13,000 - 478 0.0% 2.5% 13,000 0.0% -
47 Other Revenues 1,791,804 94,110 (104,097) 5.3% -5.3% 1,791,804 5.3% -
Residual Equity Transfers In 250,000 - - 0.0% n/a 250,000 0.0% -
Transfer From Sewer Oper Fund 1,158,875 1,109,575 - 95.7% 0.0% 1,158,875 95.7% -
48 Other Financing Sources 1,408,875 1,109,575 - 78.8% 0.0% 1,408,875 78.8% -
Total Operational Revenue 158,805,293 43,446,815 37,115,878 27.4% 23.6% 158,805,293 27.4% -
Bond Proceeds - - - n/a n/a - n/a -
MARB 4,115,542 - - 0.0% 0.0% 4,115,542 0.0% -
Total General Fund Revenues 162,920,835 43,446,815 37,115,878 26.7% 22.7% 162,920,835 26.7% -
Page 4

CITY OF WEST HAVENPROPERTY TAX COLLECTIONS REPORT
July 2019
Tax Levy - Current Year Tax Levy - Prior Years Interest Tax Lien Sale Total Collections
Month FY19 FY20 FY19 FY20 FY19 FY20 FY19 FY20 FY19 FY20
July 36,896,969 41,902,588 32,266 16,296 36,845 56,022 - - 36,966,079 41,974,906
August 11,747,612 - 6,353 - 79,005 - - - 11,832,970 -
September 883,587 - 24,425 - 72,392 - - - 980,404 -
October 493,826 - 59,260 - 42,923 - - - 596,009 -
November 548,481 - 11,266 - 33,487 - - - 593,235 -
December 5,353,068 - 37,588 - 56,452 - - - 5,447,108 -
January 29,647,432 - 19,029 - 51,888 - - - 29,718,350 -
February 6,655,587 - (26,904) - 122,514 - - - 6,751,198 -
March 1,695,458 - 141,603 - 177,402 - - - 2,014,463 -
April 991,489 - 56,756 - 150,806 - - - 1,199,050 -
May 332,013 - 43,455 - 84,243 - - - 459,710 -
June 610,376 - 8,841 - 110,937 - - - 730,153 -
Total Collections 95,855,899 41,902,588 413,937 16,296 1,018,894 56,022 - - 97,288,729 41,974,906
Jul YTD 36,896,969 41,902,588 32,266 16,296 36,845 56,022 - - 36,966,079 41,974,906
Projected 95,855,899 97,911,557 413,937 412,000 1,018,894 892,150 - - 97,288,729 99,215,707
% Total 38.49% 42.80% 7.79% 3.96% 3.62% 6.28% #DIV/0! 38.00% 42.31%
Excl. Lien Sales 38.00% 42.31%
Page 5

CITY OF WEST HAVEN Variances favorable/(unfavorable)
SUB CATEGORY EXPENDITURE REPORT
July 2019
A C T U A L F O R E C A S T
FY20
Budget
Jul YTD
Actual
Jul YTD
FY19
Jul YTD %
Budget
FY19 YTD
% Actual
FY20
Projected
Jul YTD %
Fcst ∆ to Budget
Regular Wages 20,522,254 1,523,538 1,333,092 7.4% 6.8% 20,522,254 7.4% -
Part Time 915,626 161,835 128,004 17.7% 16.1% 915,626 17.7% -
Overtime 1,879,682 183,476 173,031 9.8% 9.1% 1,879,682 9.8% -
Longevity 654,950 107,154 133,224 16.4% 18.1% 654,950 16.4% -
Fringe Reimbursements 1,138,200 143,479 97,526 12.6% 8.3% 1,138,200 12.6% -
Other Personnel Services 334,871 37,251 44,185 11.1% 21.4% 334,871 11.1% -
51 Personnel Services 25,445,583 2,156,731 1,909,062 8.5% 7.8% 25,445,583 8.5% -
Advertising 48,875 - - 0.0% 0.0% 48,875 0.0% -
Building Maintenance 56,350 (2,917) - -5.2% 0.0% 56,350 -5.2% -
Copier Machine & Rental 49,000 227 - 0.5% 0.0% 49,000 0.5% -
Electricity 1,242,000 (1,207) - -0.1% 0.0% 1,242,000 -0.1% -
Equipment Repair and Maintenance 56,250 6,301 5,200 11.2% 6.8% 56,250 11.2% -
Financial Services 195,000 - 10,450 0.0% 3.5% 195,000 0.0% -
Legal Services 153,000 (10,194) - -6.7% 0.0% 153,000 -6.7% -
Maintenance Services 653,097 22,698 - 3.5% 0.0% 653,097 3.5% -
Town Aid Road & Tree Manitenance 484,000 19,318 8,200 4.0% 1.8% 484,000 4.0% -
Training 36,730 3,062 1,350 8.3% 2.6% 36,730 8.3% -
Trash Pickup, Tip Fees & Recycling 3,195,800 143,875 179,274 4.5% 5.4% 3,195,800 4.5% -
Travel 28,600 65 - 0.2% 0.0% 28,600 0.2% -
Uniforms 185,832 136,209 138,095 73.3% 78.5% 185,832 73.3% -
Other Contractual Services 1,144,754 88,419 3,707 7.7% 0.3% 1,144,754 7.7% -
52 Contractual Services 7,529,288 405,856 346,275 5.4% 4.6% 7,529,288 5.4% -
Motor Vehicle Parts 245,000 7,243 5,129 3.0% 2.0% 245,000 3.0% -
Construction Supplies 65,000 10,746 - 16.5% 0.0% 65,000 16.5% -
Office Supplies 64,868 376 - 0.6% 0.0% 64,868 0.6% -
Other Supplies & Materials 263,243 14,699 10,117 5.6% 5.8% 263,243 5.6% -
53 Supplies & Materials 638,111 33,064 15,246 5.2% 2.7% 638,111 5.2% -
Health & General Liability Insurance 12,279,949 1,161,140 130,369 9.5% 1.1% 12,279,949 9.5% -
FICA 1,408,018 124,049 118,172 8.8% 9.1% 1,408,018 8.8% -
Pension 3,679,203 92,705 87,596 2.5% 2.8% 3,679,203 2.5% -
Workers Compensation 1,500,000 73,163 - 4.9% 0.0% 1,500,000 4.9% -
Debt Service 18,214,952 6,601,002 8,251,822 36.2% 45.3% 18,214,952 36.2% -
Debt Service (Water Purification) 658,875 59,679 59,764 9.1% 8.3% 658,875 9.1% -
Other Fixed Charges 248,879 569,777 150 228.9% 0.1% 248,879 228.9% -
54 Fixed Charges 37,989,876 8,681,514 8,647,872 22.9% 23.6% 37,989,876 22.9% -
Capital Outlay 99,266 14,596 4,066 14.7% 7.8% 99,266 14.7% -
55 Capital Outlay 99,266 14,596 4,066 14.7% 7.8% 99,266 14.7% -
Contingency Services 225,000 - - 0.0% 0.0% 225,000 0.0% -
Other Contingency (4,660) 47,506 3,212 -1019.4% 0.6% (4,660) -1019.4% -
56 Other/Contingency 220,340 47,506 3,212 21.6% 0.4% 220,340 21.6% -
Fuel 450,000 (1,255) - -0.3% 0.0% 450,000 -0.3% -
Telephone 464,150 5,844 - 1.3% 0.0% 464,150 1.3% -
Gas Heat 123,800 - - 0.0% 0.0% 123,800 0.0% -
Total City Departments 72,960,414 11,343,855 10,925,734 15.5% 15.3% 72,960,414 15.5% -
Salaries 52,370,421 1,375,333 674,138 2.6% 1.3% 52,370,421 2.6% -
Health Insurance 14,105,092 959,261 419,810 6.8% 3.1% 14,105,092 6.8% -
Benefits & Fixed Charges 4,110,714 629,333 112,067 15.3% 3.0% 4,110,714 15.3% -
Tuition 7,939,386 441,676 484,473 5.6% 5.9% 7,939,386 5.6% -
Student Transportation 5,006,320 434,911 309,320 8.7% 5.4% 5,006,320 8.7% -
Operation of Plant 3,847,829 463,417 265,552 12.0% 7.6% 3,847,829 12.0% -
Purchased Services 1,161,159 241,688 183,072 20.8% 12.9% 1,161,159 20.8% -
Instruction 1,419,500 209,297 59,240 14.7% 4.3% 1,419,500 14.7% -
Board of Education 89,960,421 4,754,916 2,507,673 5.3% 2.8% 89,960,421 5.3% -
Total General Fund Expenses 162,920,835 16,098,771 13,433,407 9.9% 8.3% 162,920,835 9.9% 0
Note : YTD actuals exclude encumbrances
Page 6

CITY OF WEST HAVEN Variances favorable/(unfavorable)
BOARD OF EDUCATION EXPENDITURE REPORT
July 2019
A C T U A L F O R E C A S T
FY20
Budget
Jul YTD
Actual
Jul YTD
FY19
Jul YTD %
Budget
FY19 YTD
% Actual
FY20
Projected
Jul YTD %
Fcst ∆ to Budget
Superintendent / Principals / Asst. 2,350,120 58,780 48,985 2.5% 2.2% 2,350,120 2.5% -
Teachers - Classroom 27,356,996 371,661 110,420 1.4% 0.4% 27,356,996 1.4% -
Teachers - Special Education 5,922,487 34,420 23,454 0.6% 0.4% 5,922,487 0.6% -
Teachers - Special Area 3,405,682 8,155 16,328 0.2% 0.4% 3,405,682 0.2% -
Teachers - Substitutes/Interns 689,815 14,242 31,071 2.1% 5.2% 689,815 2.1% -
Teacher Aides 2,992,839 54,208 17,400 1.8% 0.6% 2,992,839 1.8% -
Pupil Services 1,565,854 3,698 1,050 0.2% 0.1% 1,565,854 0.2% -
Clerical 1,551,638 127,325 146,068 8.2% 9.0% 1,551,638 8.2% -
School Nurses 1,030,163 3,175 600 0.3% 0.1% 1,030,163 0.3% -
Coordinators/Directors 1,064,632 31,755 9,899 3.0% 0.9% 1,064,632 3.0% -
Custodial / Maintenance 3,006,539 250,665 193,337 8.3% 7.5% 3,006,539 8.3% -
Lunch Aides 300,000 5,800 11,547 1.9% 3.8% 300,000 1.9% -
Para Subs-Instructional Aides 105,000 4,543 12,064 4.3% 5.6% 105,000 4.3% -
Homebound 125,000 750 30 0.6% 0.0% 125,000 0.6% -
Detached Worker 98,261 926 39,558 0.9% 29.7% 98,261 0.9% -
Athletic Coaches 200,417 - - 0.0% 0.0% 200,417 0.0% -
Adult Education 150,000 - 12,328 0.0% 16.0% 150,000 0.0% -
Severance Pay 300,000 405,230 - 135.1% 0.0% 300,000 135.1% -
Student Activity Advisors 154,978 - - 0.0% 0.0% 154,978 0.0% -
Salaries 52,370,421 1,375,333 674,138 2.6% 1.3% 52,370,421 2.6% -
Health Insurance 14,105,092 959,261 419,810 6.8% 3.1% 14,105,092 6.8% -
Medicare Only - Taxes 881,908 19,642 8,456 2.2% 1.0% 881,908 2.2% -
Social Security 764,786 36,523 25,962 4.8% 3.6% 764,786 4.8% -
Property & Liability Insurance 525,000 397,802 - 75.8% 0.0% 525,000 75.8% -
Worker's Compensation 1,050,000 102,055 - 9.7% 0.0% 1,050,000 9.7% -
Retirement Contributions 477,407 20,562 15,884 4.3% 4.3% 477,407 4.3% -
Life Insurance 187,913 - 56,897 0.0% 22.9% 187,913 0.0% -
Travel / Convention / Dues 77,200 52,342 - 67.8% 0.0% 77,200 67.8% -
Other Benefits & Fixed Charges 146,500 408 4,869 0.3% 8.6% 146,500 0.3% -
Benefits & Fixed Charges 18,215,806 1,588,595 531,877 8.7% 3.0% 18,215,806 8.7% -
Tuition 7,939,386 441,676 484,473 5.6% 5.9% 7,939,386 5.6% -
Bus Service 3,257,312 382,312 191,669 11.7% 5.7% 3,257,312 11.7% -
Transportation - Phys. Handicapped 1,341,539 4,084 74,029 0.3% 3.8% 1,341,539 0.3% -
Transportation - Regional VOC 302,012 28,840 28,840 9.5% 10.0% 302,012 9.5% -
Transportation - Student Activities 105,457 19,675 14,782 18.7% 12.3% 105,457 18.7% -
Student Transportation 5,006,320 434,911 309,320 8.7% 5.4% 5,006,320 8.7% -
Site Repairs & Improvements 675,000 210,045 104,001 31.1% 10.6% 675,000 31.1% -
Electricity 1,058,733 102,648 99,098 9.7% 9.1% 1,058,733 9.7% -
Heating 664,487 20,132 13,829 3.0% 2.8% 664,487 3.0% -
Water 103,919 16,883 - 16.2% 0.0% 103,919 16.2% -
Telephone & Communications 364,178 17,759 18,549 4.9% 9.7% 364,178 4.9% -
Building Security 388,740 70,071 34,442 18.0% 8.3% 388,740 18.0% -
Solid Waste / Recycling 220,833 23,482 - 10.6% 0.0% 220,833 10.6% -
Supplies & Equipment 321,939 2,397 (4,367) 0.7% -14.7% 321,939 0.7% -
Other Expenses 50,000 - - 0.0% 0.0% 50,000 0.0% -
Operation of Plant 3,847,829 463,417 265,552 12.0% 7.6% 3,847,829 12.0% -
Photocopy Services 269,809 85,406 93,308 31.7% 18.9% 269,809 31.7% -
Consultant Services 260,000 122,105 61,140 47.0% 22.2% 260,000 47.0% -
Police And Fire 370,000 277 (231) 0.1% -0.1% 370,000 0.1% -
Printing / Postage / Supplies 119,300 5,955 7,864 5.0% 6.5% 119,300 5.0% -
Other Services 142,050 27,946 20,990 19.7% 13.3% 142,050 19.7% -
Purchased Services 1,161,159 241,688 183,072 20.8% 12.9% 1,161,159 20.8% -
Instruction 1,419,500 209,297 59,240 14.7% 4.3% 1,419,500 14.7% -
Board of Education 89,960,421 4,754,916 2,507,673 5.3% 2.8% 89,960,421 5.3% -
Note : YTD actuals exclude encumbrances
Page 7

CITY OF WEST HAVEN Variances favorable/(unfavorable)
Summary of Revenues and Expenditures
July 2019
A C T U A L F O R E C A S T
FY20 Budget
Jul YTD
Actual FY19 Actual Jul YTD FY19
Jul YTD %
Budget
FY19 YTD
% Actual
Projected
FY20
Jul YTD %
Fcst ∆ to Budget
REVENUE
41 Property Taxes 99,215,707 41,974,906 97,288,729 36,966,079 42.3% 38.0% 99,215,707 42.3% -
41 Property Taxes (Lien Sale) - - - - - -
42 Licenses & Permits 1,791,424 104,732 1,946,258 130,252 5.8% 6.7% 1,791,424 5.8% -
43 Fines And Penalties 200,750 35,279 281,372 36,046 17.6% 12.8% 200,750 17.6% -
44 Revenue From Use Of Money 101,250 15,418 402,924 12,684 15.2% 3.1% 101,250 15.2% -
45 Fed/State Grants - Non MARB 53,151,809 30,314 53,239,827 30,134 0.1% 0.1% 53,151,809 0.1% -
46 Charges For Services 1,143,674 82,481 1,188,847 44,780 7.2% 3.8% 1,143,674 7.2% -
47 Other Revenues 1,791,804 94,110 1,976,188 (104,097) 5.3% -5.3% 1,791,804 5.3% -
48 Other Financing Sources 1,408,875 1,109,575 1,217,060 - 78.8% 0.0% 1,408,875 78.8% -
Total Operational Revenues 158,805,293 43,446,815 157,541,205 37,115,878 27.4% 23.6% 158,805,293 27.4% -
48 Bond Proceeds - - - - - -
45 Fed/State Grants - MARB 4,115,542 - 6,250,000 - 0.0% 0.0% 4,115,542 0.0% -
Total Revenue 162,920,835 43,446,815 163,791,205 37,115,878 26.7% 22.7% 162,920,835 26.7% -
EXPENDITURES
Central Government 2,816,971 196,598 2,755,446 138,551 7.0% 5.0% 2,816,971 7.0% -
Finance 2,769,795 741,273 2,709,386 110,957 26.8% 4.1% 2,769,795 26.8% -
Public Service 15,695,570 1,370,128 15,228,377 1,315,778 8.7% 8.6% 15,695,570 8.7% -
Public Works 10,765,156 542,037 10,396,354 417,170 5.0% 4.0% 10,765,156 5.0% -
Health & Human Services 1,943,995 207,993 1,909,698 177,572 10.7% 9.3% 1,943,995 10.7% -
City Insurance 800,977 420,353 845,676 - 52.5% 0.0% 800,977 52.5% -
Employee Benefits 17,999,404 1,032,121 16,494,520 324,158 5.7% 2.0% 17,999,404 5.7% -
Debt Service 18,873,827 6,660,680 18,926,611 8,311,586 35.3% 43.9% 18,873,827 35.3% -
Library / Other 1,463,179 126,750 1,588,179 126,750 8.7% 8.0% 1,463,179 8.7% -
Contingency Services 225,000 - 250,000 - 0.0% 0.0% 225,000 0.0% -
Other Contingency (393,460) 45,921 503,358 3,212 -11.7% 0.6% (393,460) -11.7% -
Deficit Reduction - - - - - -
Total City Departments 72,960,414 11,343,855 71,607,607 10,925,734 15.5% 15.3% 72,960,414 15.5% -
Board of Education 89,960,421 4,754,916 89,960,421 2,507,673 5.3% 2.8% 89,960,421 5.3% -
Total Expenditures 162,920,835 16,098,771 161,568,028 13,433,407 9.9% 8.3% 162,920,835 9.9% -
Surplus / (Deficit) - 27,348,043 2,223,177 23,682,471 1065.3% - 0
Page 8

WEST HAVEN SEWERSUB CATEGORY EXPENDITURE REPORT
July 2019
FY20 Budget Jul YTD Actual % Budget FY18 Actual Jul YTD Actual % Actual
Regular Wages 1,918,711 132,922 6.9% 1,651,252 92,811 5.6%
Part Time - - 0.0% - - 0.0%
Overtime 490,000 44,714 9.1% 529,012 34,807 6.6%
Longevity - - 0.0% - - 0.0%
Fringe Reimbursements - - 0.0% - - 0.0%
Other Personnel Services 1,500 - 0.0% 4,020 - 0.0%
51 Personnel Services 2,410,211 177,636 7.4% 2,184,284 127,618 5.8%
Advertising - - 0.0% - - 0.0%
Building Maintenance - - 0.0% - - 0.0%
Copier Machine & Rental - - 0.0% - - 0.0%
Electricity 1,200,000 - 0.0% 1,138,444 - 0.0%
Equipment Repair and Maintenance 220,000 - 0.0% 322,963 - 0.0%
Financial Services 55,166 55,166 100.0% 55,166 - 0.0%
Legal Services - - 0.0% - - 0.0%
Maintenance Services 80,000 - 0.0% 67,022 - 0.0%
Town Aid Road & Tree Manitenance - - 0.0% - - 0.0%
Training - - 0.0% - - 0.0%
Trash Pickup, Tip Fees & Recycling 15,000 - 0.0% 12,286 - 0.0%
Travel - - 0.0% - - 0.0%
Uniforms - - 0.0% - - 0.0%
Other Contractual Services 864,000 - 0.0% 885,233 500 0.1%
52 Contractual Services 2,434,166 55,166 2.3% 2,481,113 500 0.0%
Motor Vehicle Parts - - 0.0% - - 0.0%
Construction Supplies - - 0.0% - - 0.0%
Office Supplies - - 0.0% - - 0.0%
Other Supplies & Materials 1,168,000 - 0.0% 934,047 1,750 0.2%
53 Supplies & Materials 1,168,000 - 0.0% 934,047 1,750 0.2%
Health & General Liability Insurance 200,000 308 0.2% 112,419 - 0.0%
FICA 175,374 16,008 9.1% 160,167 12,950 8.1%
Pension - - 0.0% - - 0.0%
Workers Compensation 50,000 331 0.7% 245,604 - 0.0%
Debt Service - - 0.0% - - 0.0%
Debt Service (Water Purification) 658,876 658,875 100.0% 815,136 - 0.0%
Other Fixed Charges 665,318 43,044 6.5% 581,357 691 0.1%
54 Fixed Charges 1,749,568 718,565 41.1% 1,914,683 13,641 0.7%
Capital Outlay 2,857,987 299,664 10.5% 2,417,704 299,264 12.4%
55 Capital Outlay 2,857,987 299,664 10.5% 2,417,704 299,264 12.4%
Contingency Services - - 0.0% - - 0.0%
Other Contingency 1,075,000 450,700 41.9% 558,485 - 0.0%
56 Other/Contingency 1,075,000 450,700 41.9% 558,485 - 0.0%
Fuel 25,000 - 0.0% 17,841 - 0.0%
Telephone 12,000 - 0.0% 7,230 - 0.0%
Gas Heat 66,000 - 0.0% 32,185 - 0.0%
Deficit Reduction - - 0.0% - - 0.0%
Total City Departments 11,797,932 1,701,732 14.4% 10,547,573 442,773 4.2%
Note : YTD actuals exclude encumbrances
Page 9

ALLINGTOWN FIRE DEPARTMENTSUB CATEGORY EXPENDITURE REPORT
July 2019
FY20 Budget Jul YTD Actual % Budget FY19 Actual Jul YTD Actual % Actual
Regular Wages 1,683,170 128,152 7.6% 1,709,364 87,141 5.1%
Part Time - - 0.0% - - 0.0%
Overtime 450,000 33,829 7.5% 503,781 24,763 4.9%
Longevity - - 0.0% - - 0.0%
Fringe Reimbursements 4,000 - 0.0% 46,939 5,173 11.0%
Other Personnel Services - - 0.0% - - 0.0%
51 Personnel Services 2,137,170 161,981 7.6% 2,260,084 117,077 5.2%
Advertising - - 0.0% - - 0.0%
Building Maintenance 10,205 - 0.0% 18,567 - 0.0%
Copier Machine & Rental - - 0.0% - - 0.0%
Electricity 19,000 - 0.0% 18,430 - 0.0%
Equipment Repair and Maintenance 27,552 - 0.0% 24,923 - 0.0%
Financial Services 13,000 - 0.0% 9,750 - 0.0%
Legal Services - - 0.0% - - 0.0%
Maintenance Services - - 0.0% - - 0.0%
Town Aid Road & Tree Manitenance - - 0.0% - - 0.0%
Training 25,000 - 0.0% 21,292 - 0.0%
Trash Pickup, Tip Fees & Recycling - - 0.0% - - 0.0%
Travel - - 0.0% - - 0.0%
Uniforms 16,000 7,600 47.5% 15,103 7,200 47.7%
Other Contractual Services 204,569 - 0.0% 174,637 - 0.0%
52 Contractual Services 315,326 7,600 2.4% 282,703 7,200 2.5%
Motor Vehicle Parts - - 0.0% - - 0.0%
Construction Supplies - - 0.0% - - 0.0%
Office Supplies 4,000 - 0.0% 5,131 - 0.0%
Other Supplies & Materials 33,000 - 0.0% 31,854 - 0.0%
53 Supplies & Materials 37,000 - 0.0% 36,985 - 0.0%
Health & General Liability Insurance 1,780,273 105,509 5.9% 1,184,078 - 0.0%
FICA 65,000 5,315 8.2% 47,519 4,235 8.9%
Pension 2,251,000 520,417 23.1% 1,918,832 602,846 31.4%
Workers Compensation 150,000 35,195 23.5% 84,066 - 0.0%
Debt Service - - 0.0% - - 0.0%
Debt Service (Water Purification) - - 0.0% - - 0.0%
Other Fixed Charges - - 0.0% - - 0.0%
54 Fixed Charges 4,246,273 666,436 15.7% 3,234,495 607,081 18.8%
Capital Outlay 103,511 - 0.0% 95,962 - 0.0%
55 Capital Outlay 103,511 - 0.0% 95,962 - 0.0%
Contingency Services - - 0.0% - - 0.0%
Other Contingency 232,000 - 0.0% 53,061 - 0.0%
56 Other/Contingency 232,000 - 0.0% 53,061 - 0.0%
Fuel 18,000 - 0.0% 17,173 - 0.0%
Telephone 307,239 - 0.0% 255,569 - 0.0%
Gas Heat 11,000 - 0.0% 8,412 - 0.0%
Deficit Reduction 25,000 - 0.0% - - 0.0%
Total City Departments 7,432,518 836,017 11.2% 6,244,444 731,358 11.7%
Note : YTD actuals exclude encumbrances
Page 10
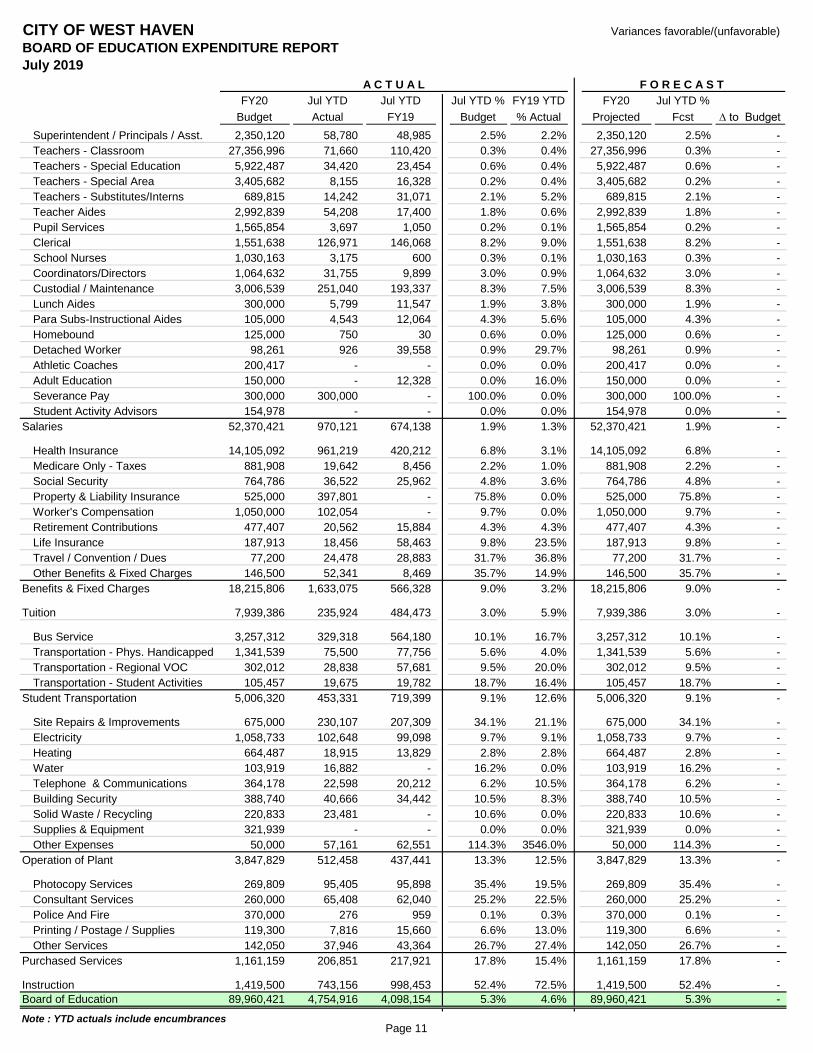
CITY OF WEST HAVEN Variances favorable/(unfavorable)
BOARD OF EDUCATION EXPENDITURE REPORT
July 2019
A C T U A L F O R E C A S T
FY20
Budget
Jul YTD
Actual
Jul YTD
FY19
Jul YTD %
Budget
FY19 YTD
% Actual
FY20
Projected
Jul YTD %
Fcst ∆ to Budget
Superintendent / Principals / Asst. 2,350,120 58,780 48,985 2.5% 2.2% 2,350,120 2.5% -
Teachers - Classroom 27,356,996 71,660 110,420 0.3% 0.4% 27,356,996 0.3% -
Teachers - Special Education 5,922,487 34,420 23,454 0.6% 0.4% 5,922,487 0.6% -
Teachers - Special Area 3,405,682 8,155 16,328 0.2% 0.4% 3,405,682 0.2% -
Teachers - Substitutes/Interns 689,815 14,242 31,071 2.1% 5.2% 689,815 2.1% -
Teacher Aides 2,992,839 54,208 17,400 1.8% 0.6% 2,992,839 1.8% -
Pupil Services 1,565,854 3,697 1,050 0.2% 0.1% 1,565,854 0.2% -
Clerical 1,551,638 126,971 146,068 8.2% 9.0% 1,551,638 8.2% -
School Nurses 1,030,163 3,175 600 0.3% 0.1% 1,030,163 0.3% -
Coordinators/Directors 1,064,632 31,755 9,899 3.0% 0.9% 1,064,632 3.0% -
Custodial / Maintenance 3,006,539 251,040 193,337 8.3% 7.5% 3,006,539 8.3% -
Lunch Aides 300,000 5,799 11,547 1.9% 3.8% 300,000 1.9% -
Para Subs-Instructional Aides 105,000 4,543 12,064 4.3% 5.6% 105,000 4.3% -
Homebound 125,000 750 30 0.6% 0.0% 125,000 0.6% -
Detached Worker 98,261 926 39,558 0.9% 29.7% 98,261 0.9% -
Athletic Coaches 200,417 - - 0.0% 0.0% 200,417 0.0% -
Adult Education 150,000 - 12,328 0.0% 16.0% 150,000 0.0% -
Severance Pay 300,000 300,000 - 100.0% 0.0% 300,000 100.0% -
Student Activity Advisors 154,978 - - 0.0% 0.0% 154,978 0.0% -
Salaries 52,370,421 970,121 674,138 1.9% 1.3% 52,370,421 1.9% -
Health Insurance 14,105,092 961,219 420,212 6.8% 3.1% 14,105,092 6.8% -
Medicare Only - Taxes 881,908 19,642 8,456 2.2% 1.0% 881,908 2.2% -
Social Security 764,786 36,522 25,962 4.8% 3.6% 764,786 4.8% -
Property & Liability Insurance 525,000 397,801 - 75.8% 0.0% 525,000 75.8% -
Worker's Compensation 1,050,000 102,054 - 9.7% 0.0% 1,050,000 9.7% -
Retirement Contributions 477,407 20,562 15,884 4.3% 4.3% 477,407 4.3% -
Life Insurance 187,913 18,456 58,463 9.8% 23.5% 187,913 9.8% -
Travel / Convention / Dues 77,200 24,478 28,883 31.7% 36.8% 77,200 31.7% -
Other Benefits & Fixed Charges 146,500 52,341 8,469 35.7% 14.9% 146,500 35.7% -
Benefits & Fixed Charges 18,215,806 1,633,075 566,328 9.0% 3.2% 18,215,806 9.0% -
Tuition 7,939,386 235,924 484,473 3.0% 5.9% 7,939,386 3.0% -
Bus Service 3,257,312 329,318 564,180 10.1% 16.7% 3,257,312 10.1% -
Transportation - Phys. Handicapped 1,341,539 75,500 77,756 5.6% 4.0% 1,341,539 5.6% -
Transportation - Regional VOC 302,012 28,838 57,681 9.5% 20.0% 302,012 9.5% -
Transportation - Student Activities 105,457 19,675 19,782 18.7% 16.4% 105,457 18.7% -
Student Transportation 5,006,320 453,331 719,399 9.1% 12.6% 5,006,320 9.1% -
Site Repairs & Improvements 675,000 230,107 207,309 34.1% 21.1% 675,000 34.1% -
Electricity 1,058,733 102,648 99,098 9.7% 9.1% 1,058,733 9.7% -
Heating 664,487 18,915 13,829 2.8% 2.8% 664,487 2.8% -
Water 103,919 16,882 - 16.2% 0.0% 103,919 16.2% -
Telephone & Communications 364,178 22,598 20,212 6.2% 10.5% 364,178 6.2% -
Building Security 388,740 40,666 34,442 10.5% 8.3% 388,740 10.5% -
Solid Waste / Recycling 220,833 23,481 - 10.6% 0.0% 220,833 10.6% -
Supplies & Equipment 321,939 - - 0.0% 0.0% 321,939 0.0% -
Other Expenses 50,000 57,161 62,551 114.3% 3546.0% 50,000 114.3% -
Operation of Plant 3,847,829 512,458 437,441 13.3% 12.5% 3,847,829 13.3% -
Photocopy Services 269,809 95,405 95,898 35.4% 19.5% 269,809 35.4% -
Consultant Services 260,000 65,408 62,040 25.2% 22.5% 260,000 25.2% -
Police And Fire 370,000 276 959 0.1% 0.3% 370,000 0.1% -
Printing / Postage / Supplies 119,300 7,816 15,660 6.6% 13.0% 119,300 6.6% -
Other Services 142,050 37,946 43,364 26.7% 27.4% 142,050 26.7% -
Purchased Services 1,161,159 206,851 217,921 17.8% 15.4% 1,161,159 17.8% -
Instruction 1,419,500 743,156 998,453 52.4% 72.5% 1,419,500 52.4% -
Board of Education 89,960,421 4,754,916 4,098,154 5.3% 4.6% 89,960,421 5.3% -
Note : YTD actuals include encumbrancesPage 11

1
Freund, Julian
From: Matthew Cavallaro <[email protected]>Sent: Friday, September 13, 2019 3:42 PMTo: Freund, JulianCc: Lee Tiernan; Frank Cieplinski; Neil CavallaroSubject: RE: Send data from MFP12194587 08/21/2019 10:00
Good afternoon Julian,
For this year’s special education transportation bid, we had 4 companies respond with competitive bids. Of those 4 companies, 3 of them bid on all 6 runs and the remaining company only bid on 1 of them. Contracts for this service are for the term of one year as this is bid annually. Each bid that was accepted was the lowest bid for that particular school since we are familiar and confident with each company that responded. Two of the runs (Adelbrook Transitional and St Vincent’s) are new runs for this school year so I am unable to compare to the prior contract. The run for the American School for the deaf went up $100 a day as compared to last year, but the company who had the work last year decided not to enter any bids for this school year. As I said earlier, the bid that was selected was the lowest in this category. The remaining 3 runs came in at reduced cost from last year. Benhaven is now $129.00 per day as compared to $135.00 per day last year, Gateway is now $85.00 per day as compared to $89.00 per day last year, and Pathways is now $250.00 per day as compared to $265.00 last year. The student counts are also the same for this year to last year for each of these runs.
Besides the schools that we bid annually, we have entered into the ACES consortium for special education regional transportation. ACES is transporting 72 students to 10 different locations at 4 different levels of pricing depending on student need. With our students being transported, our price will be $972,000. We also have 2 other students who attend a different Adelbrook location that are extremely high need and don’t react to change well, so we decided to keep their transportation with the same company that they are comfortable with. The cost of the school year for these students $50,400 ($280.00 per day)
In terms of overall budget, for fiscal year 2020 the West Haven Board of Education has budget $1,341,539 for special education transportation. With all three cost center we are projecting an expenditure of $1,230,120 for the school year. This leaves us $111,419 under budget that will allow us to handle additional students who may come in during the year or if the current students require additional services during the ride to their school.
Thanks, Matt


1
Freund, Julian
From: Lee Tiernan <[email protected]>Sent: Wednesday, September 11, 2019 5:01 PMTo: Freund, JulianSubject: Revaluation
This is for distribution. Pursuant to Conn. Gen. Stat. Sec. 12‐62 the assessor of each community is required to “revalue” real estate in their respective community every five years. 70 percent of this value of real estate is the basis for determining the property tax the owner must pay to the city. The City of West Haven had a revaluation in 2010 and 2015 and is now required to complete one in 2020. Property owners have the right to challenge the assessment which is the “market value” or “the most probable price which a property should bring in a competitive and open market…” Obviously an accurate appraisal results in fewer tax appeals. The leading Municipal vendor in New England for this revaluation service is Vision Appraisal. They performed the last revaluation for the City of West Haven and currently work with the City of West Haven. All property appraisal and assessment software used by the City of West Haven is Vision Appraisal software. The selected appraiser for revaluation purposes must necessarily use Vision Appraisal software at a cost of $20,000 for the duration of the re‐valuation. The relevant bids are Muinval or (Municipal Value Service) at $214,000 plus $20,000 for software from Vision or $275,000. The software is called Vision 8. The assessor rates Vision’s service as exceptional. Moreover, the individuals assigned by Vision also performed the 2015 revaluation. The idea is to go with the Vision bid because we will significantly reduce the possibility of error and number of tax appeals and save money in the long run. Given the fragile nature of the City finances, it was thought there was little margin for error in awarding this bid. The Revaluation is paid for out of a Capital Recurring account which is sufficiently funded to cover the cost of this project. I will make the Assessor available for comment if requested. Let me know if there are any other questions.

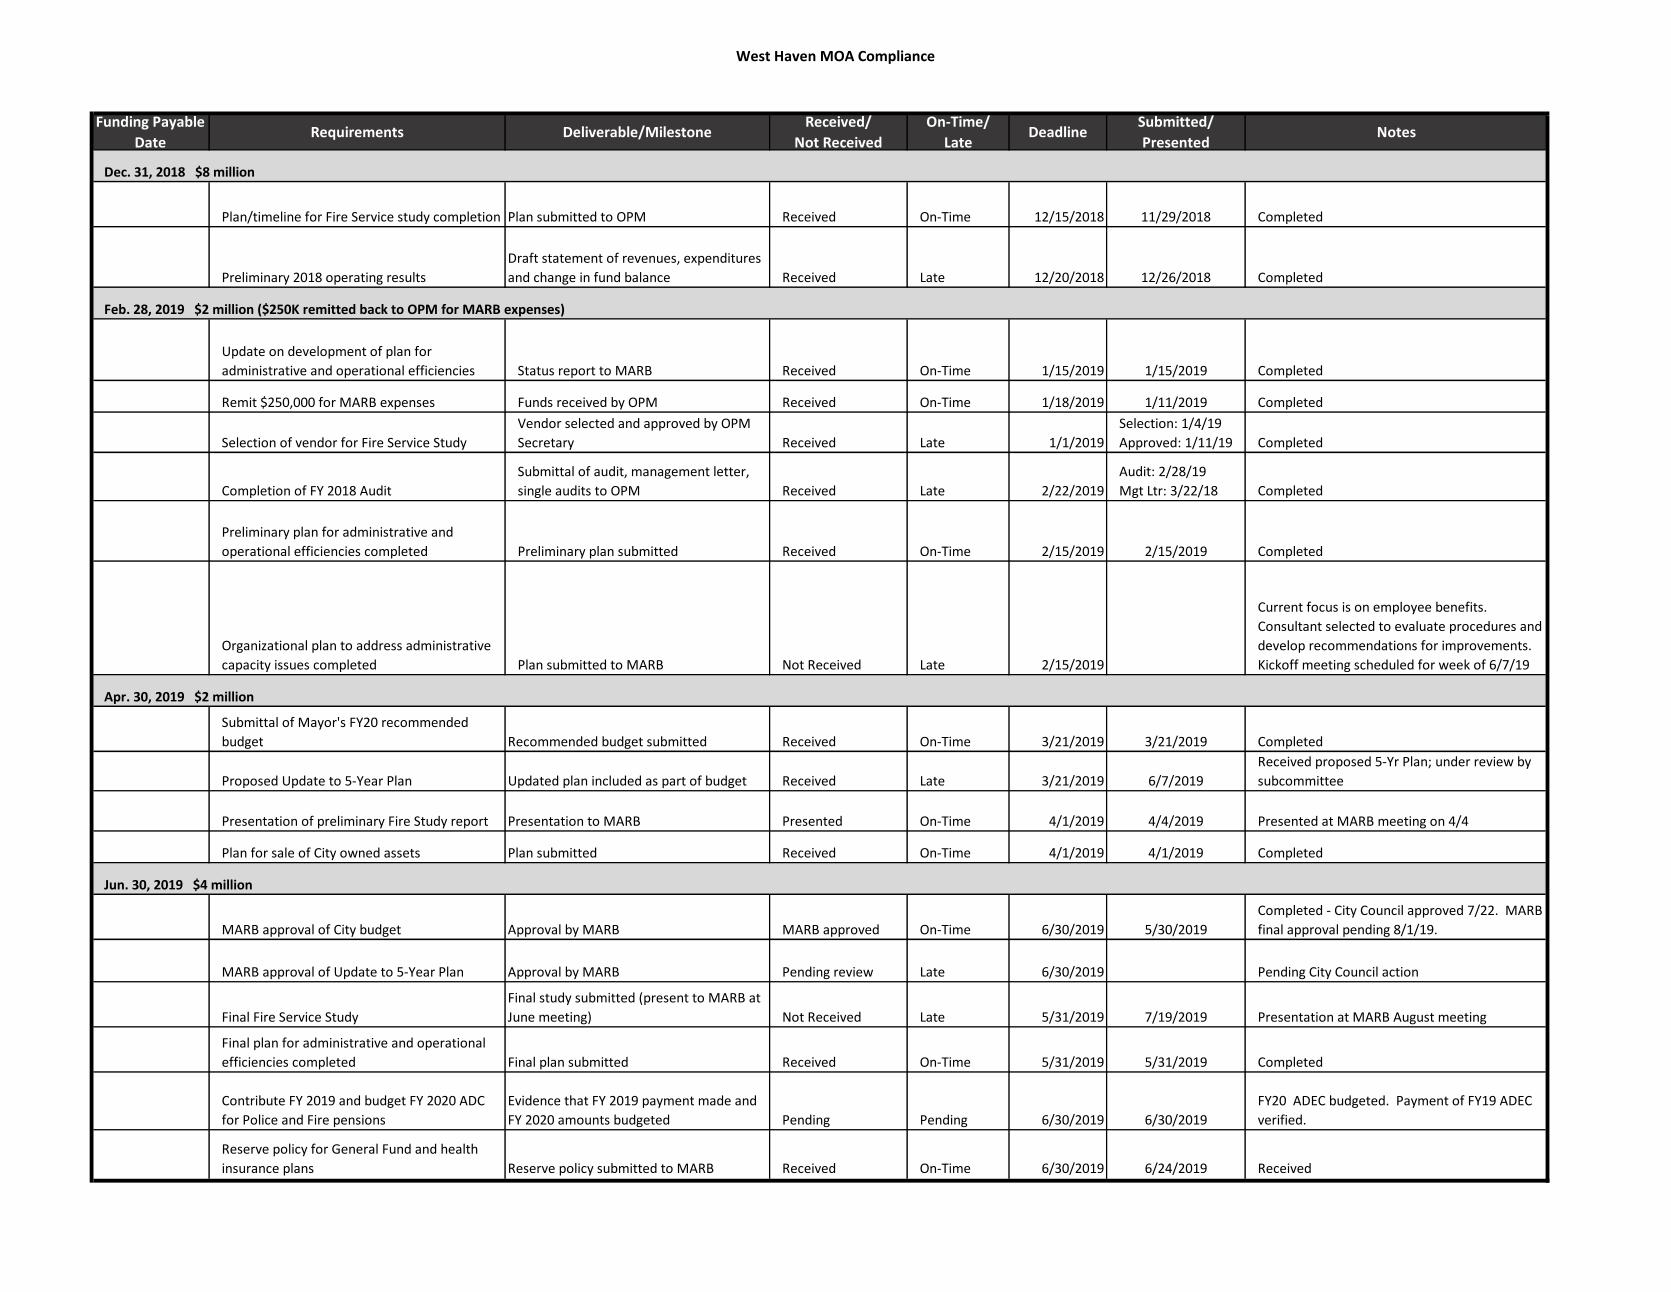
West Haven MOA Compliance
Funding Payable
DateRequirements Deliverable/Milestone
Received/
Not Received
On-Time/
LateDeadline
Submitted/
PresentedNotes
Plan/timeline for Fire Service study completion Plan submitted to OPM Received On-Time 12/15/2018 11/29/2018 Completed
Preliminary 2018 operating results
Draft statement of revenues, expenditures
and change in fund balance Received Late 12/20/2018 12/26/2018 Completed
Update on development of plan for
administrative and operational efficiencies Status report to MARB Received On-Time 1/15/2019 1/15/2019 Completed
Remit $250,000 for MARB expenses Funds received by OPM Received On-Time 1/18/2019 1/11/2019 Completed
Selection of vendor for Fire Service Study
Vendor selected and approved by OPM
Secretary Received Late 1/1/2019
Selection: 1/4/19
Approved: 1/11/19 Completed
Completion of FY 2018 Audit
Submittal of audit, management letter,
single audits to OPM Received Late 2/22/2019
Audit: 2/28/19
Mgt Ltr: 3/22/18 Completed
Preliminary plan for administrative and
operational efficiencies completed Preliminary plan submitted Received On-Time 2/15/2019 2/15/2019 Completed
Organizational plan to address administrative
capacity issues completed Plan submitted to MARB Not Received Late 2/15/2019
Current focus is on employee benefits.
Consultant selected to evaluate procedures and
develop recommendations for improvements.
Kickoff meeting scheduled for week of 6/7/19
Submittal of Mayor's FY20 recommended
budget Recommended budget submitted Received On-Time 3/21/2019 3/21/2019 Completed
Proposed Update to 5-Year Plan Updated plan included as part of budget Received Late 3/21/2019 6/7/2019
Received proposed 5-Yr Plan; under review by
subcommittee
Presentation of preliminary Fire Study report Presentation to MARB Presented On-Time 4/1/2019 4/4/2019 Presented at MARB meeting on 4/4
Plan for sale of City owned assets Plan submitted Received On-Time 4/1/2019 4/1/2019 Completed
MARB approval of City budget Approval by MARB MARB approved On-Time 6/30/2019 5/30/2019
Completed - City Council approved 7/22. MARB
final approval pending 8/1/19.
MARB approval of Update to 5-Year Plan Approval by MARB Pending review Late 6/30/2019 Pending City Council action
Final Fire Service Study
Final study submitted (present to MARB at
June meeting) Not Received Late 5/31/2019 7/19/2019 Presentation at MARB August meeting
Final plan for administrative and operational
efficiencies completed Final plan submitted Received On-Time 5/31/2019 5/31/2019 Completed
Contribute FY 2019 and budget FY 2020 ADC
for Police and Fire pensions
Evidence that FY 2019 payment made and
FY 2020 amounts budgeted Pending Pending 6/30/2019 6/30/2019
FY20 ADEC budgeted. Payment of FY19 ADEC
verified.
Reserve policy for General Fund and health
insurance plans Reserve policy submitted to MARB Received On-Time 6/30/2019 6/24/2019 Received
Dec. 31, 2018 $8 million
Feb. 28, 2019 $2 million ($250K remitted back to OPM for MARB expenses)
Apr. 30, 2019 $2 million
Jun. 30, 2019 $4 million

1
Freund, Julian
From: Michael Milone <[email protected]>Sent: Wednesday, September 11, 2019 7:21 PMTo: Kennison, Kimberly; Freund, JulianCc: 'Nancy R. Rossi'; 'Frank Cieplinski'; 'Beth Sabo'; 'Chris Hodgson'Subject: State Partnership Plan-Transition Report
Dear Kim & Julian, I am transmitting the City’s S.P.P. transition report for the MARB meeting on Sept. 19,2019. I will be attending the meeting should they have any questions about this information. As you know, on Sept. 10 West Haven was formally notified by our S.P.P. contact, Bernie Slowik, informing us that the medical rates for West Haven will not change from the earlier rates provided to us about 10 weeks ago. Consequently, the cost and savings analysis that we collaborated on and presented to the MARB remain the same. Also it now provides the BOE with specific rates to use in pursuing this change and not have to work with estimated rates. Since the last status report issued to MARB ,the City has completed the presentations to each of the five City bargaining unit representatives and this City presentation team will now be conducting similar presentations to all active eligible employees scheduled for this change. These presentations are scheduled for three sessions, one on Sept. 18 and two on19. These sessions will be followed up , shortly after, with a joint meeting among the representatives of the five bargaining unions and out City team of presenters. This was requested by the union representatives to allow them to have a meeting among their union counterparts and City representatives to review any remaining questions, issues, etc. they still might have and also have the benefit of hearing the concerns raised by other union groups. The City is beginning the development of the formal application to the S.P.P. for membership on Jan. 1, which has to be submitted to the State by Sept. 30. As part of this process our Labor Attorneys’ are preparing the documents necessary to formalize this change in coverage with the respective bargaining units. Our Labor Attorney believes that the two AFSCME unions will accept this change in coverage. The Police Union has refused to agree, alleging the plans are not substantially equivalent. The issue regarding equivalency will proceed to arbitration ASAP, and hopefully we will have a decision prior to the January 1 implementation date. We are not sure whether the CWA Local 1103 or the CILU dispatchers group will agree to the change or demand arbitration. In the event that any of the unions do not agree to the change the City has bargained for the right to implement the change in coverage even if the arbitration, regarding whether the plan is substantially equivalent, is not completed, but our goal remains to work with the unions to implement the change with their cooperation and assistance. We are also still pursuing efforts to mitigate the coverage differences between the group of individuals who are post 65 retirees since the two plans are not equivalent, as the law requires. We have an upcoming meeting scheduled at the beginning of October with our benefit consultants; Zenith, the third party administrator for this program; and relevant staff and our Labor Attorney in an effort to address these coverage differences. Michael A. Milone OPM/MARB West Haven Liaison [email protected] 203‐537‐7593

Town of Sprague
Budget vs. Actual July 2019
Current Month July 2019 Jul '19 - Jun '20 Budget $ Over Budget % of Budget Jul '19 - Jun '20 Budget $ Over Budget % of Budget
Ordinary Income/ExpenseIncome
5000 ∙ Taxes5000‐1 ∙ Current Taxes 2,983,912 2,983,912 5,488,354 (2,504,442) 54% 2,983,912 5,488,354 (2,504,442) 54%
5000‐2 ∙ Current Interest & Lien Fees 115 115 20,000 (19,885) 1% 115 20,000 (19,885) 1%
5000‐3 ∙ Prior Year Tax 13,896 13,896 125,000 (111,104) 11% 13,896 125,000 (111,104) 11%
5000‐4 ∙ Prior Year Interest/Lien Fees 3,783 3,783 35,000 (31,217) 11% 3,783 35,000 (31,217) 11%
5000‐5 ∙ Current Supp MV Tax 1,240 1,240 72,000 (70,760) 2% 1,240 72,000 (70,760) 2%
5000‐6 ∙ Firefighter Tax Abatement ‐ ‐ (8,750) 8,750 0% ‐ (8,750) 8,750 0%
5000‐7 ∙ PILOT Solar Farm 200,000 200,000 200,000 ‐ 100% 200,000 200,000 ‐ 100%
Total 5000 ∙ Taxes 3,202,946 3,202,946 5,931,604 (2,728,658) 54% 3,202,946 5,931,604 (2,728,658) 54%
5100 ∙ State Grants‐School5100‐1 ∙ ECS ‐ Assis. to Towns for Educ. ‐ ‐ 2,690,078 (2,690,078) 0% ‐ 2,690,078 (2,690,078) 0%
Total 5100 ∙ State Grants‐School ‐ ‐ 2,690,078 (2,690,078) 0% ‐ 2,690,078 (2,690,078) 0%
5200 ∙ State Grants‐Local5200‐1 ∙ Telecomm. Property Tax Grant ‐ ‐ 5,416 (5,416) 0% ‐ 5,416 (5,416) 0%
5200‐10 ∙ Judicial 10th Circuit Court ‐ ‐ 1,000 (1,000) 0% ‐ 1,000 (1,000) 0%
5200‐11 ∙ SLA ‐ Emergency Mgmt. Agency ‐ ‐ 2,800 (2,800) 0% ‐ 2,800 (2,800) 0%
5200‐13 ∙ St. Police O/T ‐ ‐ 15,000 (15,000) 0% ‐ 15,000 (15,000) 0%
5200‐14 ∙ Town Aid Roads ‐ ‐ 151,064 (151,064) 0% ‐ 151,064 (151,064) 0%
5200‐16 ∙ Elderly & Disabled Transp Grant ‐ ‐ 8,800 (8,800) 0% ‐ 8,800 (8,800) 0%
5200‐2 ∙ Municipal Rev Sharing‐Muni Proj ‐ ‐ 386,528 (386,528) 0% ‐ 386,528 (386,528) 0%
5200‐4 ∙ PILOT ‐ State Property ‐ ‐ 6,156 (6,156) 0% ‐ 6,156 (6,156) 0%
5200‐5 ∙ Mashantucket Pequot Grant ‐ ‐ 17,749 (17,749) 0% ‐ 17,749 (17,749) 0%
5200‐6 ∙ Veterans Tax Relief ‐ ‐ 2,518 (2,518) 0% ‐ 2,518 (2,518) 0%
5200‐7 ∙ Disability Exemption Reimb. ‐ ‐ 695 (695) 0% ‐ 695 (695) 0%
Total 5200 ∙ State Grants‐Local ‐ ‐ 597,726 (597,726) 0% ‐ 597,726 (597,726) 0%
5300 ∙ Local Revenues5300‐1 ∙ Interest Income 0 0 4,000 (4,000) 0% 0 4,000 (4,000) 0%
5300‐10 ∙ Permit Fees, P&Z, Inland & Wetl 84 84 4,000 (3,916) 2% 84 4,000 (3,916) 2%
5300‐13 ∙ Landfill Receipts 1,207 1,207 25,000 (23,793) 5% 1,207 25,000 (23,793) 5%
5300‐14 ∙ Newsletter Ads 21 21 3,000 (2,979) 1% 21 3,000 (2,979) 1%
5300‐15 ∙ Marriage Licenses 48 48 150 (102) 32% 48 150 (102) 32%
5300‐16 ∙ Sportsmans Licenses 1 1 150 (149) 1% 1 150 (149) 1%
5300‐17 ∙ Farmland Preservation 99 99 950 (851) 10% 99 950 (851) 10%
5300‐2 ∙ Licenses,Burial, Crem, Pis, Liq 65 65 1,000 (935) 7% 65 1,000 (935) 7%
5300‐3 ∙ Building Inspector Fees ‐ ‐ 25,000 (25,000) 0% ‐ 25,000 (25,000) 0%
5300‐4 ∙ Dog License Fees 213 213 2,750 (2,537) 8% 213 2,750 (2,537) 8%
5300‐5 ∙ Sundry Receipts, faxes, etc 20 20 400 (380) 5% 20 400 (380) 5%
5300‐6 ∙ Recording Land Rec,maps, trade 1,551 1,551 10,000 (8,449) 16% 1,551 10,000 (8,449) 16%
5300‐8 ∙ Conveyance Tax 2,302 2,302 17,000 (14,698) 14% 2,302 17,000 (14,698) 14%
5300‐9 ∙ Copies 541 541 5,000 (4,459) 11% 541 5,000 (4,459) 11%
Total 5300 ∙ Local Revenues 6,152 6,152 98,400 (92,248) 6% 6,152 98,400 (92,248) 6%
5400 ∙ Misc Revenues5400‐1 ∙ Trans. Subsidy from SCRRRA ‐ ‐ 2,000 (2,000) 0% ‐ 2,000 (2,000) 0%
5400‐5 ∙ Other Revenues 225 225 ‐ 225 100% 225 ‐ 225 100%
5400‐6 ∙ Waste Management ‐ ‐ 52,000 (52,000) 0% ‐ 52,000 (52,000) 0%
Total 5400 ∙ Misc Revenues 225 225 54,000 (53,775) 0% 225 54,000 (53,775) 0%
5500‐3 ∙ Resv. Dam Proj. ‐ Prinp. S&W ‐ ‐ 45,000 (45,000) 0% ‐ 45,000 (45,000) 0%
5500‐4 ∙ Resv. Dam Proj. ‐ Int. W & S ‐ ‐ 25,371 (25,371) 0% ‐ 25,371 (25,371) 0%
Total Income 3,209,323 3,209,323 9,442,179 (6,232,856) 34% 3,209,323 9,442,179 (6,232,856) 34%
Gross Profit 3,209,323 3,209,323 9,442,179 (6,232,856) 34% 3,209,323 9,442,179 (6,232,856) 34%
Expense6000 ∙ Board of Selectmen
6000‐1 ∙ First Selectman 3,077 3,077 40,000 (36,923) 8% 3,077 40,000 (36,923) 8%
6000‐2 ∙ Selectman 2 100 100 1,200 (1,100) 8% 100 1,200 (1,100) 8%
6000‐3 ∙ Selectman 3 100 100 1,200 (1,100) 8% 100 1,200 (1,100) 8%
6000‐4 ∙ Selectman office Sup, Misc. 50 50 1,260 (1,210) 4% 50 1,260 (1,210) 4%
6000‐5 ∙ Selectman ‐ Mileage ‐ ‐ 3,150 (3,150) 0% ‐ 3,150 (3,150) 0%
6000‐6 ∙ Selectman Executive Assistant 3,452 3,452 45,215 (41,763) 8% 3,452 45,215 (41,763) 8%
Current Year Totals Estimated Year‐End Totals
Page 1 of 6

Town of Sprague
Budget vs. Actual July 2019
Current Month July 2019 Jul '19 - Jun '20 Budget $ Over Budget % of Budget Jul '19 - Jun '20 Budget $ Over Budget % of Budget
Current Year Totals Estimated Year‐End Totals
6000‐7 ∙ Stipend Add'l Brd Participation ‐ ‐ 1,000 (1,000) 0% ‐ 1,000 (1,000) 0%
Total 6000 ∙ Board of Selectmen 6,779 6,779 93,025 (86,246) 7% 6,779 93,025 (86,246) 7%
6005 ∙ Elections6005‐1 ∙ Election Salaries 442 442 6,000 (5,558) 7% 442 6,000 (5,558) 7%
6005‐2 ∙ Election Misc. 15 15 14,103 (14,088) 0% 15 14,103 (14,088) 0%
Total 6005 ∙ Elections 457 457 20,103 (19,646) 2% 457 20,103 (19,646) 2%
6010 ∙ Board of Finance6010‐2 ∙ BOF ‐ Town Rpt, Sup. ‐ ‐ 250 (250) 0% ‐ 250 (250) 0%
Total 6010 ∙ Board of Finance ‐ ‐ 250 (250) 0% ‐ 250 (250) 0%
6011 ∙ Auditing ‐ ‐ 22,650 (22,650) 0% ‐ 22,650 (22,650) 0%
6012 ∙ Bookkeeper6012‐1 ∙ Bookkeeper ‐ Salary 2,023 2,023 28,210 (26,187) 7% 2,023 28,210 (26,187) 7%
6012‐2 ∙ Bookkeeper‐Support ‐ ‐ 900 (900) 0% ‐ 900 (900) 0%
Total 6012 ∙ Bookkeeper 2,023 2,023 29,110 (27,087) 7% 2,023 29,110 (27,087) 7%
6015 ∙ Assessors6015‐1 ∙ Assessors, Salary 1,692 1,692 22,165 (20,473) 8% 1,692 22,165 (20,473) 8%
6015‐4 ∙ Assessors, Travel Expense ‐ ‐ 300 (300) 0% ‐ 300 (300) 0%
6015‐5 ∙ Assessors, Sch,Wrkshp, Seminars ‐ ‐ 280 (280) 0% ‐ 280 (280) 0%
6015‐6 ∙ Assess. Misc. Supplies, Postage ‐ ‐ 1,680 (1,680) 0% ‐ 1,680 (1,680) 0%
6015‐7 ∙ Assess. Map updts, Pric.Manuls ‐ ‐ 1,000 (1,000) 0% ‐ 1,000 (1,000) 0%
Total 6015 ∙ Assessors 1,692 1,692 25,425 (23,733) 7% 1,692 25,425 (23,733) 7%
6025 ∙ Tax Collector6025‐1 ∙ Tax Collector, Salary 2,041 2,041 26,532 (24,491) 8% 2,041 26,532 (24,491) 8%
6025‐4 ∙ Tax Collector Misc. Sup. Sch. ‐ ‐ 700 (700) 0% ‐ 700 (700) 0%
6025‐5 ∙ Tax Collector, Postage ‐ ‐ 3,030 (3,030) 0% ‐ 3,030 (3,030) 0%
Total 6025 ∙ Tax Collector 2,041 2,041 30,262 (28,221) 7% 2,041 30,262 (28,221) 7%
6030 ∙ Town Treasurer 200 200 2,400 (2,200) 8% 200 2,400 (2,200) 8%
6035 ∙ Town Counsel & Financial Advisr6035‐1 ∙ Town Counsel ‐ ‐ 20,000 (20,000) 0% ‐ 20,000 (20,000) 0%
6035‐2 ∙ Financial Advisor ‐ ‐ 7,000 (7,000) 0% ‐ 7,000 (7,000) 0%
Total 6035 ∙ Town Counsel & Financial Advisr ‐ ‐ 27,000 (27,000) 0% ‐ 27,000 (27,000) 0%
6040 ∙ Town Clerk6040‐1 ∙ Town Clerk, Salary 3,812 3,812 49,562 (45,750) 8% 3,812 49,562 (45,750) 8%
6040‐2 ∙ Town Clerk, Office Sup, Misc. 75 75 1,463 (1,388) 5% 75 1,463 (1,388) 5%
6040‐3 ∙ Town Clerk, Dog Licenses ‐ ‐ 350 (350) 0% ‐ 350 (350) 0%
6040‐4 ∙ Town Clerk, School ‐ ‐ 900 (900) 0% ‐ 900 (900) 0%
6040‐5 ∙ Town Clerk, Microfm(Security) ‐ ‐ 400 (400) 0% ‐ 400 (400) 0%
Total 6040 ∙ Town Clerk 3,887 3,887 52,675 (48,788) 7% 3,887 52,675 (48,788) 7%
6045 ∙ Telephone Services/DSL/Website 533 533 11,700 (11,167) 5% 533 11,700 (11,167) 5%
6050 ∙ Pool Secretaries6050‐1 ∙ Pool Sec,Salary‐Asst Town Clerk 1,605 1,605 23,378 (21,773) 7% 1,605 23,378 (21,773) 7%
6050‐2 ∙ Pool Sec, Salary‐Land Use Clerk 2,663 2,663 34,820 (32,157) 8% 2,663 34,820 (32,157) 8%
Total 6050 ∙ Pool Secretaries 4,268 4,268 58,198 (53,930) 7% 4,268 58,198 (53,930) 7%
6055 ∙ Town Off. Bldg.6055‐1 ∙ Town Off. Bldg.Janitorial Serv 756 756 9,897 (9,141) 8% 756 9,897 (9,141) 8%
6055‐2 ∙ Town Off. Bldg. Sup. Maint. 72 72 2,000 (1,928) 4% 72 2,000 (1,928) 4%
6055‐3 ∙ Town Off/Sen.Ctr.‐ Bldg.Heat ‐ ‐ 11,500 (11,500) 0% ‐ 11,500 (11,500) 0%
6055‐4 ∙ Town Off Bldg/Sen Ctr ‐ Lights ‐ ‐ 9,000 (9,000) 0% ‐ 9,000 (9,000) 0%
6055‐5 ∙ Town Off. Bldg. rpr & renov. ‐ ‐ 5,000 (5,000) 0% ‐ 5,000 (5,000) 0%
Total 6055 ∙ Town Off. Bldg. 828 828 37,397 (36,569) 2% 828 37,397 (36,569) 2%
6060 ∙ Grants/Contracts Manager6060‐1 ∙ Grants/Cont Mgr‐Salary 2,394 2,394 31,507 (29,113) 8% 2,394 31,507 (29,113) 8%
6060‐2 ∙ Grants/Co Mg‐Workshops,Seminars ‐ ‐ 700 (700) 0% ‐ 700 (700) 0%
6060‐3 ∙ Grants/ConMgr‐Supp,Subs,Postage ‐ ‐ 1,200 (1,200) 0% ‐ 1,200 (1,200) 0%
6060‐4 ∙ Grants/Contracts Mgr‐Mileage ‐ ‐ 650 (650) 0% ‐ 650 (650) 0%
Total 6060 ∙ Grants/Contracts Manager 2,394 2,394 34,057 (31,663) 7% 2,394 34,057 (31,663) 7%
6100 ∙ P & Z Comm.6100‐1 ∙ P & Z Comm. Enfc. Off. 552 552 7,225 (6,673) 8% 552 7,225 (6,673) 8%
6100‐2 ∙ P & Z Comm. Planner ‐ ‐ 12,000 (12,000) 0% ‐ 12,000 (12,000) 0%
Total 6100 ∙ P & Z Comm. 552 552 19,225 (18,673) 3% 552 19,225 (18,673) 3%
Page 2 of 6

Town of Sprague
Budget vs. Actual July 2019
Current Month July 2019 Jul '19 - Jun '20 Budget $ Over Budget % of Budget Jul '19 - Jun '20 Budget $ Over Budget % of Budget
Current Year Totals Estimated Year‐End Totals
6111 ∙ Land Use Miscellaneous 65 65 800 (735) 8% 65 800 (735) 8%
6115 ∙ Ec. Devel. ‐ ‐ 900 (900) 0% ‐ 900 (900) 0%
6120 ∙ Conservation Commission6120‐2 ∙ Training workshop ‐ ‐ 100 (100) 0% ‐ 100 (100) 0%
6120‐4 ∙ Miscellaneous ‐ ‐ 1,000 (1,000) 0% ‐ 1,000 (1,000) 0%
Total 6120 ∙ Conservation Commission ‐ ‐ 1,100 (1,100) 0% ‐ 1,100 (1,100) 0%
6150 ∙ Conservation Wetlands Enf Off ‐ ‐ 6,500 (6,500) 0% ‐ 6,500 (6,500) 0%
6200 ∙ Highways6200‐1 ∙ Highways, General Maintenance ‐ ‐ 45,000 (45,000) 0% ‐ 45,000 (45,000) 0%
6200‐10 ∙ Drug & Alcohol Testing ‐ ‐ 500 (500) 0% ‐ 500 (500) 0%
6200‐2 ∙ Highways, Public Works Salary 19,103 19,103 250,235 (231,132) 8% 19,103 250,235 (231,132) 8%
6200‐3 ∙ Highways, Misc. o/t labor. 114 114 26,200 (26,086) 0% 114 26,200 (26,086) 0%
6200‐4 ∙ Boots ‐ Highways 153 153 2,000 (1,847) 8% 153 2,000 (1,847) 8%
6200‐5 ∙ Storm Materials ‐ ‐ 27,500 (27,500) 0% ‐ 27,500 (27,500) 0%
6200‐6 ∙ Highways, Roadway Mgmt. 8,386 8,386 40,000 (31,614) 21% 8,386 40,000 (31,614) 21%
6200‐7 ∙ Highways, Town Garage ‐ ‐ 8,000 (8,000) 0% ‐ 8,000 (8,000) 0%
6200‐8 ∙ Stormwater Permit Fees(PhaseII) ‐ ‐ 8,500 (8,500) 0% ‐ 8,500 (8,500) 0%
Total 6200 ∙ Highways 27,756 27,756 407,935 (380,179) 7% 27,756 407,935 (380,179) 7%
6202 ∙ Tree Maintenance6202‐1 ∙ Tree Warden ‐ ‐ 2,250 (2,250) 0% ‐ 2,250 (2,250) 0%
6202‐2 ∙ Tree Warden‐ Training Seminars ‐ ‐ 350 (350) 0% ‐ 350 (350) 0%
6202‐3 ∙ Tree Pruning, Removal, Replacme ‐ ‐ 12,300 (12,300) 0% ‐ 12,300 (12,300) 0%
6202‐4 ∙ Tree Warden Mileage ‐ ‐ 400 (400) 0% ‐ 400 (400) 0%
Total 6202 ∙ Tree Maintenance ‐ ‐ 15,300 (15,300) 0% ‐ 15,300 (15,300) 0%
6205 ∙ Street Lighting 732 732 14,000 (13,268) 5% 732 14,000 (13,268) 5%
6300 ∙ Social Security 4,898 4,898 63,586 (58,688) 8% 4,898 63,586 (58,688) 8%
6310 ∙ Deferred Compensation 1,256 1,256 16,274 (15,018) 8% 1,256 16,274 (15,018) 8%
6400 ∙ Regional Agencies6400‐1 ∙ Reg. Agency ‐ TVCCA ‐ ‐ 1,000 (1,000) 0% ‐ 1,000 (1,000) 0%
6400‐10 ∙ RegAgency‐SSAC of Eastern CT ‐ ‐ 300 (300) 0% ‐ 300 (300) 0%
6400‐11 ∙ RegAg‐SE CT Enterpr Reg 375 375 1,540 (1,165) 24% 375 1,540 (1,165) 24%
6400‐12 ∙ RegAgcy‐Regional Animal Control 9,179 9,179 9,179 0 100% 9,179 9,179 0 100%
6400‐2 ∙ Reg. Agency ‐ Cncl. of Gvnt 1,641 1,641 1,641 ‐ 100% 1,641 1,641 ‐ 100%
6400‐3 ∙ Reg. Agency ‐ Soil/Wtr. Con. ‐ ‐ 300 (300) 0% ‐ 300 (300) 0%
6400‐4 ∙ Reg. Agency ‐ Women's Center ‐ ‐ 250 (250) 0% ‐ 250 (250) 0%
6400‐5 ∙ Uncas Health District 4,815 4,815 19,262 (14,447) 25% 4,815 19,262 (14,447) 25%
6400‐6 ∙ Reg. Agency ‐ CCM 2,032 2,032 2,032 ‐ 100% 2,032 2,032 ‐ 100%
6400‐7 ∙ Reg. Agency ‐ Norwich PrbCrt 531 531 2,124 (1,593) 25% 531 2,124 (1,593) 25%
6400‐8 ∙ Council of Small Towns (COST) 725 725 725 ‐ 100% 725 725 ‐ 100%
6400‐9 ∙ Quinebaug Walking Weekends ‐ ‐ 175 (175) 0% ‐ 175 (175) 0%
Total 6400 ∙ Regional Agencies 19,299 19,299 38,528 (19,229) 50% 19,299 38,528 (19,229) 50%
6500 ∙ Insurance6500‐1 ∙ Insurance, General Town 6,859 6,859 29,290 (22,431) 23% 6,859 29,290 (22,431) 23%
6500‐2 ∙ Insurance, Fire Department ‐ ‐ 15,890 (15,890) 0% ‐ 15,890 (15,890) 0%
6500‐4 ∙ Insurance, Water & Sewer Plants 1,892 1,892 7,532 (5,640) 25% 1,892 7,532 (5,640) 25%
6500‐5 ∙ Insurance,CIRMA (Workers Comp) 2,834 2,834 40,560 (37,726) 7% 2,834 40,560 (37,726) 7%
6500‐6 ∙ Insurance, Empl. Medical Ins. 8,423 8,423 100,344 (91,921) 8% 8,423 100,344 (91,921) 8%
6500‐7 ∙ Employee Insurance Waiver 329 329 3,950 (3,621) 8% 329 3,950 (3,621) 8%
Total 6500 ∙ Insurance 20,337 20,337 197,566 (177,229) 10% 20,337 197,566 (177,229) 10%
6600 ∙ Police Department6600‐1 ∙ Police Dept. Resident Trooper ‐ ‐ 169,220 (169,220) 0% ‐ 169,220 (169,220) 0%
6600‐2 ∙ Police Dept., O/T 50% contra ‐ ‐ 5,000 (5,000) 0% ‐ 5,000 (5,000) 0%
6600‐3 ∙ Police Dept. DARE Program ‐ ‐ 300 (300) 0% ‐ 300 (300) 0%
6600‐4 ∙ Police Dept., Supplies, Misc. ‐ ‐ 500 (500) 0% ‐ 500 (500) 0%
6600‐5 ∙ Police Dept.‐ Sch. Crs. Guard ‐ ‐ 3,883 (3,883) 0% ‐ 3,883 (3,883) 0%
Total 6600 ∙ Police Department ‐ ‐ 178,903 (178,903) 0% ‐ 178,903 (178,903) 0%
6605 ∙ Fire Dept.6605‐1 ∙ Fire Dept., Vehicle Maint. ‐ ‐ 20,904 (20,904) 0% ‐ 20,904 (20,904) 0%
6605‐2 ∙ Fire Dept, Fixed Expenses 5,847 5,847 36,700 (30,853) 16% 5,847 36,700 (30,853) 16%
6605‐3 ∙ Fire Dept. Truck Supplies ‐ ‐ 7,400 (7,400) 0% ‐ 7,400 (7,400) 0%
6605‐4 ∙ Fire Dept., Firehouse Maint. 289 289 9,325 (9,036) 3% 289 9,325 (9,036) 3%
Page 3 of 6

Town of Sprague
Budget vs. Actual July 2019
Current Month July 2019 Jul '19 - Jun '20 Budget $ Over Budget % of Budget Jul '19 - Jun '20 Budget $ Over Budget % of Budget
Current Year Totals Estimated Year‐End Totals
6605‐5 ∙ Fire Dept., Training ‐ ‐ 13,000 (13,000) 0% ‐ 13,000 (13,000) 0%
6605‐6 ∙ Fire Dept., Business Exp. 80 80 13,000 (12,920) 1% 80 13,000 (12,920) 1%
6605‐7 ∙ Fire Dept., Equip. Maint. 450 450 10,000 (9,550) 5% 450 10,000 (9,550) 5%
Total 6605 ∙ Fire Dept. 6,666 6,666 110,329 (103,663) 6% 6,666 110,329 (103,663) 6%
6610 ∙ Emergency6610‐1 ∙ Salary Director ‐ ‐ 2,200 (2,200) 0% ‐ 2,200 (2,200) 0%
6610‐5 ∙ Training Expense ‐ ‐ 500 (500) 0% ‐ 500 (500) 0%
6610‐6 ∙ Equipment Maintenance ‐ ‐ 830 (830) 0% ‐ 830 (830) 0%
6610‐8 ∙ Local Emerg. Plan Chair.(LEPC) ‐ ‐ 500 (500) 0% ‐ 500 (500) 0%
Total 6610 ∙ Emergency ‐ ‐ 4,030 (4,030) 0% ‐ 4,030 (4,030) 0%
6615 ∙ Fire Marshal/Burning Official6615‐1 ∙ Fire Marshal/Salary 725 725 8,767 (8,042) 8% 725 8,767 (8,042) 8%
6615‐2 ∙ Fire Marshal/Off.Exp.Ed.Misc ‐ ‐ 2,050 (2,050) 0% ‐ 2,050 (2,050) 0%
6615‐4 ∙ Burning Official ‐ Salary ‐ ‐ 625 (625) 0% ‐ 625 (625) 0%
Total 6615 ∙ Fire Marshal/Burning Official 725 725 11,442 (10,717) 6% 725 11,442 (10,717) 6%
6620 ∙ Enf. Off‐Bldg.Code6620‐1 ∙ Enf.Off‐Bldg Code ‐ Salary 1,487 1,487 19,471 (17,984) 8% 1,487 19,471 (17,984) 8%
6620‐2 ∙ Enf. Off‐Bldg.Code ‐ Mileage ‐ ‐ 800 (800) 0% ‐ 800 (800) 0%
6620‐3 ∙ Enf.Off‐Bldg.Code ‐ Mbrshp.Fee ‐ ‐ 120 (120) 0% ‐ 120 (120) 0%
6620‐6 ∙ Enf.Off‐Bldg.Code.‐ Ed.Training ‐ ‐ 250 (250) 0% ‐ 250 (250) 0%
6620‐7 ∙ Enf.Off‐Bldg,Code‐ Code Vol,Sup ‐ ‐ 500 (500) 0% ‐ 500 (500) 0%
Total 6620 ∙ Enf. Off‐Bldg.Code 1,487 1,487 21,141 (19,654) 7% 1,487 21,141 (19,654) 7%
6625 ∙ Blight Enforcement Officer6625‐1 ∙ Blight Enforce. Officer‐Salary 294 294 3,556 (3,262) 8% 294 3,556 (3,262) 8%
6625‐2 ∙ Blight Enforce.Officer‐Mileage ‐ ‐ 150 (150) 0% ‐ 150 (150) 0%
6625‐3 ∙ Blight Enforce.Officer‐Postage ‐ ‐ 150 (150) 0% ‐ 150 (150) 0%
Total 6625 ∙ Blight Enforcement Officer 294 294 3,856 (3,562) 8% 294 3,856 (3,562) 8%
6700 ∙ Sanit/Wst Rem.6700‐2 ∙ Sanit/Wst.Rem,Matls.Misc 1,396 1,396 5,000 (3,604) 28% 1,396 5,000 (3,604) 28%
6700‐3 ∙ Sanit/Wst.Rem., Recycling 1,988 1,988 66,000 (64,012) 3% 1,988 66,000 (64,012) 3%
Total 6700 ∙ Sanit/Wst Rem. 3,384 3,384 71,000 (67,616) 5% 3,384 71,000 (67,616) 5%
6702 ∙ Waste Management Exp. (Waste Management) ‐ ‐ 63,000 (63,000) 0% ‐ 63,000 (63,000) 0%
6810 ∙ Comm. of Aging6810‐1 ∙ Comm. on Aging ‐ Salary 1,571 1,571 19,143 (17,572) 8% 1,571 19,143 (17,572) 8%
6810‐2 ∙ Commission on Aging‐Munic Agent 10 10 500 (490) 2% 10 500 (490) 2%
6810‐4 ∙ Comm. on Aging ‐ Off sup/misc. 83 83 1,740 (1,657) 5% 83 1,740 (1,657) 5%
6810‐5 ∙ Comm. of Aging ‐ Elevator Contr 200 200 2,437 (2,237) 8% 200 2,437 (2,237) 8%
6810‐6 ∙ Comm. of Aging ‐ Programs ‐ ‐ 3,000 (3,000) 0% ‐ 3,000 (3,000) 0%
6810‐7 ∙ Comm. of Aging ‐ Van Driver 1,202 1,202 25,110 (23,908) 5% 1,202 25,110 (23,908) 5%
6810‐7a ∙ Comm of Aging‐Van Dr 1,600 1,600 16,612 (15,012) 10% 1,600 16,612 (15,012) 10%
6810‐8 ∙ Comm. on Aging ‐Senior Ctr Aide 1,165 1,165 16,225 (15,060) 7% 1,165 16,225 (15,060) 7%
6810‐9 ∙ Van Expense, Comm. on Aging ‐ ‐ 7,000 (7,000) 0% ‐ 7,000 (7,000) 0%
Total 6810 ∙ Comm. of Aging 5,832 5,832 91,767 (85,935) 6% 5,832 91,767 (85,935) 6%
6950 ∙ Capital Project6950‐1 ∙ Capital Project,Rpr Centrl Plnt ‐ ‐ 6,000 (6,000) 0% ‐ 6,000 (6,000) 0%
6950‐2 ∙ Engineering Fees, Cap. Proj. ‐ ‐ 5,000 (5,000) 0% ‐ 5,000 (5,000) 0%
Total 6950 ∙ Capital Project ‐ ‐ 11,000 (11,000) 0% ‐ 11,000 (11,000) 0%
7000 ∙ Parks & Playgrounds 90 90 1,500 (1,410) 6% 90 1,500 (1,410) 6%
7002 ∙ Summer Recreation(SPARC)7002‐1 ∙ Summer Recreation Salaries 5,448 5,448 14,594 (9,146) 37% 5,448 14,594 (9,146) 37%
7002‐2 ∙ Summer Recreation Supplies ‐ ‐ 1,500 (1,500) 0% ‐ 1,500 (1,500) 0%
Total 7002 ∙ Summer Recreation(SPARC) 5,448 5,448 16,094 (10,646) 34% 5,448 16,094 (10,646) 34%
7003 ∙ Recreation Facilities (BoS)7003‐2 ∙ Electricity ‐ ‐ 1,900 (1,900) 0% ‐ 1,900 (1,900) 0%
Total 7003 ∙ Recreation Facilities (BoS) ‐ ‐ 1,900 (1,900) 0% ‐ 1,900 (1,900) 0%
7004 ∙ Recreation Events(SPARC)7004‐1 ∙ RecEvent‐3 Villages Fall Fest ‐ ‐ 5,912 (5,912) 0% ‐ 5,912 (5,912) 0%
7004‐2 ∙ Rec Event‐Earth Day ‐ ‐ 400 (400) 0% ‐ 400 (400) 0%
7004‐3 ∙ Rec Event‐Youth Yr Lng Activity ‐ ‐ 500 (500) 0% ‐ 500 (500) 0%
7004‐4 ∙ Rec Event‐Shetucket River Fest 133 133 521 (388) 25% 133 521 (388) 25%
Page 4 of 6

Town of Sprague
Budget vs. Actual July 2019
Current Month July 2019 Jul '19 - Jun '20 Budget $ Over Budget % of Budget Jul '19 - Jun '20 Budget $ Over Budget % of Budget
Current Year Totals Estimated Year‐End Totals
7004‐8 ∙ Rec Event‐Other ‐ ‐ 500 (500) 0% ‐ 500 (500) 0%
Total 7004 ∙ Recreation Events(SPARC) 133 133 7,833 (7,700) 2% 133 7,833 (7,700) 2%
7005 ∙ Other Recreation Programs7005‐1 ∙ Sprague/Franklin/Canterbury LL ‐ ‐ 1,250 (1,250) 0% ‐ 1,250 (1,250) 0%
Total 7005 ∙ Other Recreation Programs ‐ ‐ 1,250 (1,250) 0% ‐ 1,250 (1,250) 0%
7010 ∙ Grist Mill7010‐1 ∙ Grist Mill ‐ Supplies, Maint. ‐ ‐ 850 (850) 0% ‐ 850 (850) 0%
7010‐2 ∙ Grist Mill‐Elevator Maintenance 182 182 2,218 (2,036) 8% 182 2,218 (2,036) 8%
7010‐3 ∙ Grist Mill ‐ Heat, Light ‐ ‐ 9,300 (9,300) 0% ‐ 9,300 (9,300) 0%
7010‐5 ∙ Grist Mill ‐ Janitor‐ Salaries 540 540 7,020 (6,480) 8% 540 7,020 (6,480) 8%
Total 7010 ∙ Grist Mill 722 722 19,388 (18,666) 4% 722 19,388 (18,666) 4%
7012 ∙ Historical Museum7012‐1 ∙ Salary 276 276 5,000 (4,724) 6% 276 5,000 (4,724) 6%
7012‐14 ∙ Sprague Historical Society ‐ ‐ 200 (200) 0% ‐ 200 (200) 0%
Total 7012 ∙ Historical Museum 276 276 5,200 (4,924) 5% 276 5,200 (4,924) 5%
7015 ∙ Library7015‐1 ∙ Library ‐ Librarian Assistant‐1 467 467 12,872 (12,405) 4% 467 12,872 (12,405) 4%
7015‐10 ∙ Library ‐ Director 1,817 1,817 28,160 (26,343) 6% 1,817 28,160 (26,343) 6%
7015‐11 ∙ Library ‐ Programs ‐ ‐ 2,000 (2,000) 0% ‐ 2,000 (2,000) 0%
7015‐12 ∙ Professional Fees ‐ ‐ 500 (500) 0% ‐ 500 (500) 0%
7015‐13 ∙ Library‐St Lib CT Membership ‐ ‐ 550 (550) 0% ‐ 550 (550) 0%
7015‐2 ∙ Library ‐ Books ‐ ‐ 5,500 (5,500) 0% ‐ 5,500 (5,500) 0%
7015‐3 ∙ Library ‐ Sup./Misc. ‐ ‐ 2,250 (2,250) 0% ‐ 2,250 (2,250) 0%
7015‐4 ∙ Library ‐ Library Assistant ‐ 3 356 356 12,872 (12,516) 3% 356 12,872 (12,516) 3%
7015‐5 ∙ Librarian Assistant ‐ 5 ‐ ‐ 12,872 (12,872) 0% ‐ 12,872 (12,872) 0%
7015‐6 ∙ Library ‐ Librarian Assistant‐2 2,020 2,020 12,872 (10,852) 16% 2,020 12,872 (10,852) 16%
Total 7015 ∙ Library 4,660 4,660 90,448 (85,788) 5% 4,660 90,448 (85,788) 5%
7100 ∙ Miscellaneous7100‐10 ∙ Newsletter‐ Salary 247 247 3,056 (2,809) 8% 247 3,056 (2,809) 8%
7100‐11 ∙ Bank Fees 4 4 ‐ 4 100% 4 ‐ 4 100%
7100‐12 ∙ Newsletter ‐ Misc. 257 257 4,000 (3,743) 6% 257 4,000 (3,743) 6%
7100‐2 ∙ War Mem./Lords Bridge Gazebo ‐ ‐ 600 (600) 0% ‐ 600 (600) 0%
7100‐3 ∙ Cemeteries, Vets Graves ‐ ‐ 700 (700) 0% ‐ 700 (700) 0%
7100‐4 ∙ Contingent Fund 60 60 3,000 (2,940) 2% 60 3,000 (2,940) 2%
7100‐5 ∙ Memorial Day Celebration ‐ ‐ 1,200 (1,200) 0% ‐ 1,200 (1,200) 0%
7100‐6 ∙ Legal Ads ‐ ‐ 9,000 (9,000) 0% ‐ 9,000 (9,000) 0%
Total 7100 ∙ Miscellaneous 569 569 21,556 (20,987) 3% 569 21,556 (20,987) 3%
7150 ∙ Sewer & Water Dept.7150‐1 ∙ Water & Sewer Public Services ‐ ‐ 8,500 (8,500) 0% ‐ 8,500 (8,500) 0%
Total 7150 ∙ Sewer & Water Dept. ‐ ‐ 8,500 (8,500) 0% ‐ 8,500 (8,500) 0%
7200 ∙ Office Machines/Sup/Mnt.7200‐1 ∙ Office Mach/Sup/Mnt ‐Town Clerk 1,434 1,434 9,850 (8,416) 15% 1,434 9,850 (8,416) 15%
7200‐10 ∙ Fixed Asset Inventory 1,203 1,203 1,040 163 116% 1,203 1,040 163 116%
7200‐2 ∙ Office Mach/Sup/Mnt.‐ Tax Coll. 4,930 4,930 7,100 (2,170) 69% 4,930 7,100 (2,170) 69%
7200‐3 ∙ Office Mach/Sup/Mnt..‐ Assessor 12,317 12,317 12,317 ‐ 100% 12,317 12,317 ‐ 100%
7200‐4 ∙ Office Mach/Sup/Mnt‐Select/Trea ‐ ‐ 1,000 (1,000) 0% ‐ 1,000 (1,000) 0%
7200‐5 ∙ Office Machines ‐ Equip.Mnt. 1,813 1,813 7,000 (5,188) 26% 1,813 7,000 (5,188) 26%
7200‐6 ∙ Office MachSupp‐ServSupp ‐ ‐ 5,000 (5,000) 0% ‐ 5,000 (5,000) 0%
7200‐7 ∙ Paychex Services 231 231 3,500 (3,269) 7% 231 3,500 (3,269) 7%
7200‐8 ∙ Off.Mach/Sup/Mnt‐Library Suppor ‐ ‐ 3,262 (3,262) 0% ‐ 3,262 (3,262) 0%
7200‐9 ∙ Off.Mach/Sup/Mnt.‐Mail System ‐ ‐ 708 (708) 0% ‐ 708 (708) 0%
Total 7200 ∙ Office Machines/Sup/Mnt. 21,927 21,927 50,777 (28,850) 43% 21,927 50,777 (28,850) 43%
7300 ∙ Interest Payments ‐ Bonds7300‐14 ∙ 2005 Bonds, Land Purchase, Rds ‐ ‐ 24,750 (24,750) 0% ‐ 24,750 (24,750) 0%
7300‐15 ∙ 2009 Bond‐Roads,Roof,Fire App,A ‐ ‐ 23,900 (23,900) 0% ‐ 23,900 (23,900) 0%
7300‐16 ∙ 2013 Bonds‐Various Purposes ‐ ‐ 129,675 (129,675) 0% ‐ 129,675 (129,675) 0%
Total 7300 ∙ Interest Payments ‐ Bonds ‐ ‐ 178,325 (178,325) 0% ‐ 178,325 (178,325) 0%
7305 ∙ Redemption of Debt‐Principal7305‐14 ∙ 2005 Bonds, Land Purchase, Rds ‐ ‐ 85,000 (85,000) 0% ‐ 85,000 (85,000) 0%
7305‐15 ∙ 2009 Bond‐Roads,Roof,FireApp,AD ‐ ‐ 125,000 (125,000) 0% ‐ 125,000 (125,000) 0%
Page 5 of 6
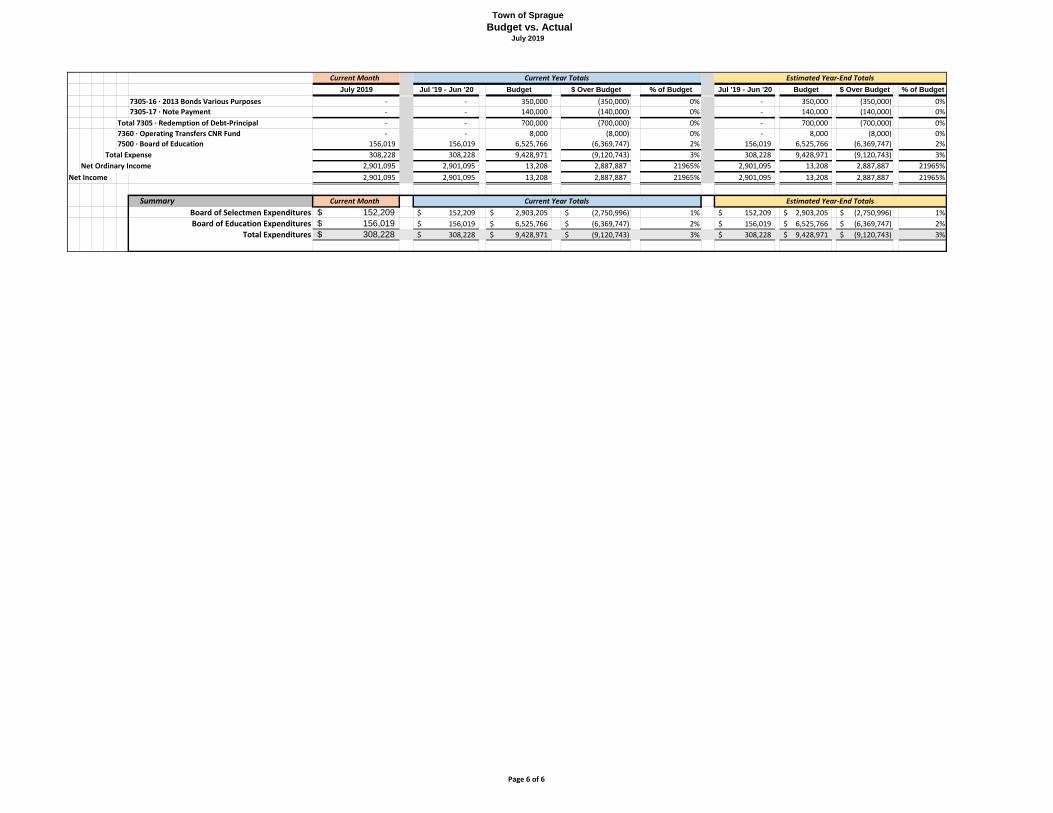
Town of Sprague
Budget vs. Actual July 2019
Current Month July 2019 Jul '19 - Jun '20 Budget $ Over Budget % of Budget Jul '19 - Jun '20 Budget $ Over Budget % of Budget
Current Year Totals Estimated Year‐End Totals
7305‐16 ∙ 2013 Bonds Various Purposes ‐ ‐ 350,000 (350,000) 0% ‐ 350,000 (350,000) 0%
7305‐17 ∙ Note Payment ‐ ‐ 140,000 (140,000) 0% ‐ 140,000 (140,000) 0%
Total 7305 ∙ Redemption of Debt‐Principal ‐ ‐ 700,000 (700,000) 0% ‐ 700,000 (700,000) 0%
7360 ∙ Operating Transfers CNR Fund ‐ ‐ 8,000 (8,000) 0% ‐ 8,000 (8,000) 0%
7500 ∙ Board of Education 156,019 156,019 6,525,766 (6,369,747) 2% 156,019 6,525,766 (6,369,747) 2%
Total Expense 308,228 308,228 9,428,971 (9,120,743) 3% 308,228 9,428,971 (9,120,743) 3%
Net Ordinary Income 2,901,095 2,901,095 13,208 2,887,887 21965% 2,901,095 13,208 2,887,887 21965%
Net Income 2,901,095 2,901,095 13,208 2,887,887 21965% 2,901,095 13,208 2,887,887 21965%
Summary Current Month Board of Selectmen Expenditures 152,209$ 152,209$ 2,903,205$ (2,750,996)$ 1% 152,209$ 2,903,205$ (2,750,996)$ 1%
Board of Education Expenditures 156,019$ 156,019$ 6,525,766$ (6,369,747)$ 2% 156,019$ 6,525,766$ (6,369,747)$ 2%
Total Expenditures 308,228$ 308,228$ 9,428,971$ (9,120,743)$ 3% 308,228$ 9,428,971$ (9,120,743)$ 3%
Current Year Totals Estimated Year‐End Totals
Page 6 of 6

TOWN OF SPRAGUESTATEMENT OF CASH BALANCES
(See note below)7/31/19
GENERAL FUND General Fund Checking Account Reconciliation:
Balance Prior Month.............................. 34,516.31 Revenues:
Deposits-Chelsea Groton 2,834,039.06 Less Expenditures:
Cleared-Chelsea Groton 1,079,993.66 Bank Balance-General Fund Accounts 1,788,561.71
GENERAL FUND Annual Beginning Bal. Increase in Decrease in Ending BalanceYield General Fund General Fund General Fund General Fund
Checking Account:Chelsea Groton-General Fund (NEW ACCOUNT) 34,516.31 2,834,039.06 1,079,993.66 1,788,561.71$ Total General Fund Checking Accounts………. 34,516.31 1,788,561.71$
Savings Accounts:STIF 0.16% 6,591.14 0.26 6,500.00 91.40$ Chelsea Groton Tax Collector Account 0.10% 188.12 2,587,857.72 2,587,857.70 188.14$ Dime Bank-Investment Fund 0.20% 107.18 - 107.18 -$ Chelsea Lovett Cemetery 0.05% 1,205.90 3.05 - 1,208.95$
8,092.34 1,488.49$ Capital Non Recurring Annual Beginning Bal. Increase in Decrease in Ending Balance
YieldChelsea Groton - Capital Non-Recurring non interest 4,820.37 106,334.05 101,802.74 9,351.68$
Total Capital Non Recurring Funds 4,820.37 9,351.68$ CURRENT GENERAL FUND & CNR CASH BALANCE 1,799,401.88$
Prior Year GF & CNR Cash Balance 7/31/18 2,480,012.26$ Prior Year GF & CNR Cash Balance 7/31/17 2,144,442.91$
Prior Year GF & CNR Cash Balance 7/31/16 2,433,271.86$
Budgeted Interest Income 2019-2020 4,000.00$ Actual Year to Date Interest Income 0.28$ Percent of Interest Received to Date 0.0%
Miscellaneous Accounts
SMALL CITIES PROGRAM INCOME 0.02% 791.72 0.01 - 791.73$ SMALL CITIES RIVER ST. RECONSTRUCTION non interest 0.02 - - 0.02$ SMALL CITIES RIVER ST RECONSTRUCTION PHII non interest 0.01 - - 0.01$
REGIONAL ANIMAL CONTROL non interest 49,805.30 - - 49,805.30$
SPRAGUE PUBLIC LIBRARY 0.01% 2,931.25 5.04 - 2,936.29$
Received Expended
FUNDS EXPECTED TO BE RECEIVED 370,477.70 32,031.35 11,568.64 350,014.99$
FUNDS EXPENDED-APPROVED FOR BONDING -$
Melissa A. Sevigny - Bookkeeper JoAnn Lynch - Treasurer
NOTE: This report reflects the cash balances of the Town of Sprague at the specific date noted above. This report does not include, nordoes it report on, the Fund Balance of the Town. The Fund Balance of the Town is a financial number which takes into account all of theassets and liabilities of the Town and represents the surpluses and/or deficits the Town has experienced over its history. The Town's cashbalances, an asset of the Town, is only one of the many pieces of financial information included in the Fund Balance.
Page 1

FY 19-20 Sprague BOE
Budget vs Actual
8/28/19
Sprague BOE September Financials 8/28/19
Approved
Budget
Current Mo.
Budget Trf
Prior YTD
Budget Trfs
Revised
Budget
Year to
Date
Actual Encumbered Total Exp Variance
% Spent
(EXP +
ENC)
% Spent
(EXP Only)
Forecasted
Exp
Forecasted
Balance
1000-Regular Instruction
1000.51110. Wages Paid to Teachers - Regular Ed $992,900 $0 $0 $992,900 $0 $0 $0 $992,900 0.00% 0.00% $1,021,942 ($29,042)
1000.51120. Wages Paid to Instructional Aides - Regular Ed $43,149 $0 $0 $43,149 $108 $0 $108 $43,041 0.25% 0.25% $42,831 $210
1000.52100. Group Life Insurance - Regular $705 $0 $0 $705 $145 $0 $145 $560 20.53% 20.53% $554 $6
1000.52200. FICA/Medicare Employer - Regular Ed $19,203 $0 $0 $19,203 $8 $0 $8 $19,195 0.04% 0.04% $19,592 ($397)
1000.52500. Tuition Reimbursement $10,000 $0 $0 $10,000 $1,968 $0 $1,968 $8,032 19.68% 19.68% $8,032
1000.52800. Health Insurance - Regular $233,886 $0 $0 $233,886 $37,950 $0 $37,950 $195,936 16.23% 16.23% $191,729 $4,207
1000.53200. Substitutes - Regular Education $17,000 $0 $0 $17,000 $0 $0 $0 $17,000 0.00% 0.00% $17,000
1000.53230. Purchased Pupil Services $1,250 $0 $0 $1,250 $0 $0 $0 $1,250 0.00% 0.00% $1,250
1000.54420. Equipment Leasing $24,549 $0 $0 $24,549 $2,689 $7,647 $10,336 $14,213 42.11% 10.96% $14,213
1000.56100. General Supplies - Regular Education $7,000 $0 $0 $7,000 $114 $0 $114 $6,886 1.63% 1.63% $6,886
1000.56110. Instructional Supplies - Regular Education $3,000 $0 $0 $3,000 $259 $0 $259 $2,741 8.63% 8.63% $2,741
1000.56400. Workbooks/Disposables $10,000 $0 $0 $10,000 $999 $72 $1,071 $8,929 10.71% 9.99% $8,929
1000.56410. Textbooks $3,000 $0 $0 $3,000 $326 $3,334 $3,659 ($659) 121.97% 10.85% ($659)
1000.56501. Ink and Toner $8,000 $0 $0 $8,000 $0 $0 $0 $8,000 0.00% 0.00% $8,000
1000.58100. Dues & Fees $9,053 $0 $0 $9,053 $7,498 $0 $7,498 $1,555 82.82% 82.82% $1,555
Total $1,382,695 $0 $0 $1,382,695 $52,064 $11,053 $63,117 $1,319,578 4.56% 3.77% $1,276,648 $42,931
1200-Special Education
1200.51110. Wages Paid to Teachers - SPED $320,900 $0 $0 $320,900 $10,385 $0 $10,385 $310,515 3.24% 3.24% $258,428 $52,087
1200.51120. Wages Paid to Instructional Aides - SPED $219,977 $0 $0 $219,977 $0 $0 $0 $219,977 0.00% 0.00% $236,484 ($16,507)
1200.51901. Wages Paid - Other Non Certified Staff - SPED $80,600 $0 $0 $80,600 $5,476 $0 $5,476 $75,124 6.79% 6.79% $75,124 $0
1200.52100. Group Life Insurance - SPED $867 $0 $0 $867 $204 $0 $204 $663 23.55% 23.55% $691 ($28)
1200.52200. FICA/Medicare Employer - SPED $31,091 $0 $0 $31,091 $569 $0 $569 $30,521 1.83% 1.83% $31,029 ($508)
1200.52300. Pension Contributions $3,219 $0 $0 $3,219 $620 $0 $620 $2,599 19.26% 19.26% $2,604 ($5)
1200.52800. Health Insurance $189,109 $0 $0 $189,109 $33,846 $0 $33,846 $155,262 17.90% 17.90% $143,435 $11,828
1200.53200. Substitutes - SPED $10,000 $0 $0 $10,000 $0 $0 $0 $10,000 0.00% 0.00% $10,000
1200.53230. Purchased Pupil Services $39,000 $0 $0 $39,000 ($1,130) $78 ($1,052) $40,052 -2.70% -2.90% $40,052
1200.53300. Other Prof/Tech Services $2,500 $0 $0 $2,500 $0 $645 $645 $1,855 25.80% 0.00% $1,855
1200.55800. Travel Reimbursement $1,200 $0 $0 $1,200 $0 $0 $0 $1,200 0.00% 0.00% $1,200
1200.56100. General Supplies - Special Education $1,000 $0 $0 $1,000 $0 $0 $0 $1,000 0.00% 0.00% $1,000
1200.56110. Instructional Supplies - SPED $1,000 $0 $0 $1,000 $1,274 $0 $1,274 ($274) 127.40% 127.40% ($274)
1200.56400. Workbooks/Disposables $500 $0 $0 $500 $0 $0 $0 $500 0.00% 0.00% $500
1200.58100. Dues & Fees $760 $0 $0 $760 $0 $0 $0 $760 0.00% 0.00% $760
Total $901,722 $0 $0 $901,722 $51,244 $723 $51,967 $849,754 5.76% 5.68% $747,795 $101,959
1300-Adult Education - Cooperative
1300.55690. Tuition - Adult Cooperative $17,368 $0 $0 $17,368 $31,733 $0 $31,733 ($14,365) 182.71% 182.71% ($15,000) $635
Total $17,368 $0 $0 $17,368 $31,733 $0 $31,733 ($14,365) 182.71% 182.71% ($15,000) $635
1500-Stipends - Extra Curricular
1500.51930. Extra Curricular Stipends Paid $10,152 $0 $0 $10,152 $0 $0 $0 $10,152 0.00% 0.00% $10,752 ($600)
Total $10,152 $0 $0 $10,152 $0 $0 $0 $10,152 0.00% 0.00% $10,752 ($600)
1600-Summer School
1600.51110. Wages Paid to Teachers - Summer School $5,000 $0 $0 $5,000 $1,310 $0 $1,310 $3,690 26.20% 26.20% $3,690
1600.51120. Wages Paid to Inst Aides - Summer School $2,250 $0 $0 $2,250 $471 $0 $471 $1,779 20.92% 20.92% $1,779
1600.51901. Wages Paid - Other Non-Cert - Summer School $2,400 $0 $0 $2,400 $1,214 $0 $1,214 $1,186 50.60% 50.60% $1,186
1600.52200. FICA/Medicare Employer - Summer School $309 $0 $0 $309 $148 $0 $148 $161 47.87% 47.87% $161
Total $9,959 $0 $0 $9,959 $3,143 $0 $3,143 $6,816 31.55% 31.55% $0 $6,816
1700-Tutoring
1700.000100.51110. Wages Paid to Teacher Tutors - Reg Ed $4,000 $0 $0 $4,000 $0 $0 $0 $4,000 0.00% 0.00% $4,000
1700.000100.52200. FICA/Medicare Employer - Reg Ed $700 $0 $0 $700 $0 $0 $0 $700 0.00% 0.00% $700
1700.000200.51120. Wages Paid to Inst Aide Tutors - Spec Ed $8,000 $0 $0 $8,000 $0 $0 $0 $8,000 0.00% 0.00% $8,000
1700.000200.53230. Purchased Pupil Services - Spec Ed $6,000 $0 $0 $6,000 $496 $4,960 $5,456 $544 90.93% 8.27% $544
Total $18,700 $0 $0 $18,700 $496 $4,960 $5,456 $13,244 29.18% 2.65% $0 $13,244
1800-Stipends - Sports Teams
2110-Social Work Services
2110.51900. Wages Paid - Social Worker $62,428 $0 $0 $62,428 $0 $0 $0 $62,428 0.00% 0.00% $62,428 $0
2110.52100. Group Life Insurance - Social Worker $38 $0 $0 $38 $6 $0 $6 $32 16.19% 16.19% $32 $0
2110.52200. FICA/Medicare Employer - Social Worker $905 $0 $0 $905 $0 $0 $0 $905 0.00% 0.00% $905 $0
Page 1 of 4

FY 19-20 Sprague BOE
Budget vs Actual
8/28/19
Sprague BOE September Financials 8/28/19
Approved
Budget
Current Mo.
Budget Trf
Prior YTD
Budget Trfs
Revised
Budget
Year to
Date
Actual Encumbered Total Exp Variance
% Spent
(EXP +
ENC)
% Spent
(EXP Only)
Forecasted
Exp
Forecasted
Balance
2110.52800. Health Insurance - Social Worker $1,410 $0 $0 $1,410 $0 $0 $0 $1,410 0.00% 0.00% $1,410 $0
2110.56100. Supplies $200 $0 $0 $200 $0 $0 $0 $200 0.00% 0.00% $200
Total $64,981 $0 $0 $64,981 $6 $0 $6 $64,975 0.01% 0.01% $64,775 $200
2130-Health Office
2130.51901. Wages Paid - School Nurse $72,391 $0 $0 $72,391 $0 $0 $0 $72,391 0.00% 0.00% $72,391 $0
2130.51910. Wages Paid - Nurse Substitutes $4,000 $0 $0 $4,000 $0 $0 $0 $4,000 0.00% 0.00% $4,000
2130.51930. Nursing Stipends Paid $2,000 $0 $0 $2,000 $0 $0 $0 $2,000 0.00% 0.00% $2,000 $0
2130.52100. Group Life Insurance - Health Office $76 $0 $0 $76 $19 $0 $19 $57 25.00% 25.00% $57 $0
2130.52200. FICA/Medicare Employer - Health $7,798 $0 $0 $7,798 $0 $0 $0 $7,798 0.00% 0.00% $7,798 $0
2130.52800. Health Insurance - Health Office $10,238 $0 $0 $10,238 $1,750 $0 $1,750 $8,488 17.09% 17.09% $8,488 $0
2130.54300. Repairs & Maint Equipment $200 $0 $0 $200 $0 $0 $0 $200 0.00% 0.00% $200
2130.55800. Conference/Travel - Health Office $700 $0 $0 $700 $0 $0 $0 $700 0.00% 0.00% $700
2130.56100. Supplies $2,400 $0 $0 $2,400 $683 $0 $683 $1,717 28.45% 28.45% $1,717
2130.56430. Professional Periodicals $100 $0 $0 $100 $0 $0 $0 $100 0.00% 0.00% $100
2130.58100. Dues & Fees $600 $0 $0 $600 $0 $0 $0 $600 0.00% 0.00% $600 $0
Total $100,503 $0 $0 $100,503 $2,452 $0 $2,452 $98,051 2.44% 2.44% $91,334 $6,717
2140-Psychological Services
2140.51900. Wages Paid - School Psychologist $49,155 $0 $0 $49,155 $0 $0 $0 $49,155 0.00% 0.00% $49,155 $0
2140.52100. Group Life Insurance - Psychologist $38 $0 $0 $38 $3 $0 $3 $35 8.33% 8.33% $35 $0
2140.52200. FICA/Medicare Employer - Psychologist $713 $0 $0 $713 $0 $0 $0 $713 0.00% 0.00% $713 $0
2140.52800. Health Insurance $9,096 $0 $0 $9,096 $1,533 $0 $1,533 $7,563 16.86% 16.86% $7,810 ($247)
2140.53230. Purchased Pupil Services $2,000 $0 $0 $2,000 $0 $0 $0 $2,000 0.00% 0.00% $2,000
2140.56100. Assessment Supplies $2,000 $0 $0 $2,000 $0 $0 $0 $2,000 0.00% 0.00% $2,000
2140.56110. Instructional Supplies - Psychologist $200 $0 $0 $200 $0 $0 $0 $200 0.00% 0.00% $200
Total $63,201 $0 $0 $63,201 $1,536 $0 $1,536 $61,665 2.43% 2.43% $57,712 $3,953
2150-Speech & Audiology Services
2150.53230. Purchased Pupil Services $63,389 $0 $0 $63,389 $0 $0 $0 $63,389 0.00% 0.00% $63,389
2150.56100. Supplies $775 $0 $0 $775 $0 $431 $431 $344 55.63% 0.00% $344
Total $64,164 $0 $0 $64,164 $0 $431 $431 $63,733 0.67% 0.00% $0 $63,733
2160-PT/OT Services
2210-Improvement of Instruction
2210.53220. In Service $4,000 $0 $0 $4,000 $6,259 $0 $6,259 ($2,259) 156.47% 156.47% ($2,259)
2210.55800. Conference/Travel - Professional Development $8,000 $0 $0 $8,000 $22 $0 $22 $7,978 0.28% 0.28% $7,978
2210.56100. Supplies $2,000 $0 $0 $2,000 $0 $0 $0 $2,000 0.00% 0.00% $2,000
Total $14,000 $0 $0 $14,000 $6,281 $0 $6,281 $7,719 44.87% 44.87% $0 $7,719
2220-Library/Media Services
2230-Technology
2230.51901. Wages Paid - Technology Staff $11,739 $0 $0 $11,739 $905 $0 $905 $10,834 7.71% 7.71% $10,834 $0
2230.52100. Group Life Insurance - Technology $8 $0 $0 $8 $2 $0 $2 $6 25.00% 25.00% $6 $0
2230.52200. FICA/Medicare Employer - Technology $898 $0 $0 $898 $69 $0 $69 $829 7.71% 7.71% $829 $0
2230.52300. Pension Contributions - Technology $470 $0 $0 $470 $90 $0 $90 $379 19.23% 19.23% $379 $0
2230.52800. Health Insurance - Technology $2,048 $0 $0 $2,048 $350 $0 $350 $1,698 17.09% 17.09% $1,698 $0
2230.53520. Other Technical Services $72,000 $0 $0 $72,000 $19,070 $52,930 $72,000 $0 100.00% 26.49% $0
2230.56100. Supplies $500 $0 $0 $500 $0 $0 $0 $500 0.00% 0.00% $500
2230.56500. Technology Supplies $2,000 $0 $0 $2,000 $0 $0 $0 $2,000 0.00% 0.00% $2,000
2230.57340. Technology Hardware - Instructional $1,000 $0 $0 $1,000 $0 $0 $0 $1,000 0.00% 0.00% $1,000
2230.57341. Technology Hardware - Non-Instructional $3,000 $0 $0 $3,000 $0 $0 $0 $3,000 0.00% 0.00% $3,000
2230.57350. Software - Instructional $11,689 $0 $0 $11,689 $520 $0 $520 $11,169 4.45% 4.45% $11,169
2230.57351. Software - Non-Instructional $29,877 $0 $0 $29,877 $10,356 $5,085 $15,441 $14,436 51.68% 34.66% $14,436
Total $135,228 $0 $0 $135,228 $31,362 $58,015 $89,377 $45,851 66.09% 23.19% $13,746 $32,105
2310-Board of Education
2310.51901. Wages Paid - Non-Certified - BOE Admin Office $11,440 $0 $0 $11,440 $876 $0 $876 $10,564 7.66% 7.66% $10,564 $0
2310.52100. Group Life Insurance - BOE Office $8 $0 $0 $8 $2 $0 $2 $6 25.00% 25.00% $6 $0
2310.52200. FICA/Medicare Employer - BOE Office $875 $0 $0 $875 $67 $0 $67 $808 7.66% 7.66% $808 $0
2310.52300. Pension Contributions - BOE Office $458 $0 $0 $458 $88 $0 $88 $370 19.23% 19.23% $370 $0
2310.52600. Unemployment Compensation - BOE Office $3,000 $0 $0 $3,000 $493 $0 $493 $2,507 16.43% 16.43% $2,507
2310.52700. Workers' Compensation - BOE Office $23,573 $0 $0 $23,573 $5,549 $16,648 $22,198 $1,375 94.17% 23.54% $1,375
Page 2 of 4

FY 19-20 Sprague BOE
Budget vs Actual
8/28/19
Sprague BOE September Financials 8/28/19
Approved
Budget
Current Mo.
Budget Trf
Prior YTD
Budget Trfs
Revised
Budget
Year to
Date
Actual Encumbered Total Exp Variance
% Spent
(EXP +
ENC)
% Spent
(EXP Only)
Forecasted
Exp
Forecasted
Balance
2310.52800. Health Insurance - BOE Office $4,378 $0 $0 $4,378 $746 $0 $746 $3,632 17.05% 17.05% $3,632 $0
2310.53020. Legal Services - BOE Office $35,000 $0 $0 $35,000 $0 $35,000 $35,000 $0 100.00% 0.00% $0
2310.55200. Property/Liability Insurance - BOE Office $19,414 $0 $0 $19,414 $4,463 $13,388 $17,850 $1,563 91.95% 22.99% $1,563
2310.55400. Advertising - BOE Office $500 $0 $0 $500 $0 $0 $0 $500 0.00% 0.00% $500
2310.55800. Conference/Travel - BOE Office $300 $0 $0 $300 $0 $0 $0 $300 0.00% 0.00% $300
2310.56100. Supplies - BOE Office $1,400 $0 $0 $1,400 $9 $0 $9 $1,391 0.65% 0.65% $1,391
2310.58100. Dues & Fees - BOE Office $2,700 $0 $0 $2,700 $2,416 $0 $2,416 $284 89.48% 89.48% $284
2310.58900. Graduation Costs - BOE Office $500 $0 $0 $500 $0 $0 $0 $500 0.00% 0.00% $500
Total $103,545 $0 $0 $103,545 $14,709 $65,036 $79,746 $23,799 77.02% 14.21% $15,379 $8,420
2320-Superintendents Office
2320.51900. Wages Paid - Superintendent $64,000 $0 $0 $64,000 $5,495 $0 $5,495 $58,505 8.59% 8.59% $57,035 $1,470
2320.51901. Wages Paid - Non-Certified - Supt Admin Office $11,440 $0 $0 $11,440 $876 $0 $876 $10,564 7.66% 7.66% $10,564 $0
2320.52100. Group Life Insurance - Superintendent Office $134 $0 $0 $134 $82 $0 $82 $52 61.22% 61.22% $10 $42
2320.52200. FICA/Medicare Employer - Superintendent $1,803 $0 $0 $1,803 $147 $0 $147 $1,656 8.14% 8.14% $1,635 $21
2320.52300. Pension Contributions - Superintendent's Office $458 $0 $0 $458 $88 $0 $88 $370 19.23% 19.23% $370 $0
2320.52800. Health Insurance - Superintendent's Office $4,378 $0 $0 $4,378 $746 $0 $746 $3,632 17.05% 17.05% $3,632 $0
2320.55800. Conference/Travel - Superintendent's Office $1,000 $0 $0 $1,000 $125 $0 $125 $875 12.50% 12.50% $875
2320.56100. Supplies - Superintendent's Office $300 $0 $0 $300 $0 $0 $0 $300 0.00% 0.00% $300
2320.58100. Dues & Fees - Superintendent's Office $4,000 $0 $0 $4,000 $3,128 $0 $3,128 $872 78.20% 78.20% $872
Total $87,512 $0 $0 $87,512 $10,687 $0 $10,687 $76,825 12.21% 12.21% $73,245 $3,580
2400-School Administration Office
2400.51900. Wages Paid - Principal $110,000 $0 $0 $110,000 $12,058 $0 $12,058 $97,942 10.96% 10.96% $109,662 ($11,720)
2400.51901. Wages Paid - Non-Certified - School Administration $43,680 $0 $0 $43,680 $1,781 $0 $1,781 $41,899 4.08% 4.08% $41,379 $520
2400.52100. Group Life Insurance - School Administration Office $164 $0 $0 $164 $38 $0 $38 $126 23.08% 23.08% $123 $3
2400.52200. FICA/Medicare Employer - School Administration $4,937 $0 $0 $4,937 $311 $0 $311 $4,625 6.30% 6.30% $4,756 ($130)
2400.52300. Pension Contributions - School Admin Office $1,747 $0 $0 $1,747 $332 $0 $332 $1,415 19.00% 19.00% $1,394 $21
2400.52800. Health Insurance - School Administration Office $13,238 $0 $0 $13,238 $270 $0 $270 $12,967 2.04% 2.04% $27,587 ($14,619)
2400.53300. Other Prof/Tech Services $2,000 $0 $0 $2,000 $0 $0 $0 $2,000 0.00% 0.00% $2,000
2400.55301. Postage $3,500 $0 $0 $3,500 $1,277 $0 $1,277 $2,223 36.49% 36.49% $2,223
2400.55800. Conference/Travel - School Administration Office $750 $0 $0 $750 $0 $0 $0 $750 0.00% 0.00% $750
2400.56100. Supplies $2,500 $0 $0 $2,500 $70 $0 $70 $2,430 2.82% 2.82% $2,430
2400.58100. Dues & Fees - School Administration $1,100 $0 $0 $1,100 $0 $0 $0 $1,100 0.00% 0.00% $1,100
Total $183,615 $0 $0 $183,615 $16,137 $0 $16,137 $167,478 8.79% 8.79% $184,901 ($17,423)
2510-Business Office
2510.51901. Wages Paid - Non Certified - Business Office $104,676 $0 $0 $104,676 $6,256 $0 $6,256 $98,420 5.98% 5.98% $86,950 $11,470
2510.52100. Group Life Insurance - Business Office $68 $0 $0 $68 $8 $0 $8 $60 11.11% 11.11% $60 $0
2510.52200. FICA/Medicare Employer - Business Office $8,008 $0 $0 $8,008 $479 $0 $479 $7,529 5.98% 5.98% $6,652 $877
2510.52300. Pension Contributions - Business Office $1,878 $0 $0 $1,878 $361 $0 $361 $1,517 19.23% 19.23% $1,517 $0
2510.52800. Health Insurance - Business Office $11,190 $0 $0 $11,190 $1,400 $0 $1,400 $9,790 12.51% 12.51% $6,790 $3,000
2510.53300. Other Prof/Tech Services - Business Office $2,000 $0 $0 $2,000 $416 $0 $416 $1,584 20.79% 20.79% $1,584
2510.53410. Audit/Accounting Services - Business Office $25,750 $0 $0 $25,750 $368 $0 $368 $25,382 1.43% 1.43% $25,382
2510.55800. Conference/Travel - Business Office $300 $0 $0 $300 $0 $0 $0 $300 0.00% 0.00% $300
2510.56100. Supplies - Business Office $1,000 $0 $0 $1,000 $80 $0 $80 $920 8.00% 8.00% $920
Total $154,870 $0 $0 $154,870 $9,366 $0 $9,366 $145,504 6.05% 6.05% $101,970 $43,534
2600-Building & Grounds
2600.51901. Wages Paid - Buiding Maintenance $96,533 $0 $0 $96,533 $9,697 $0 $9,697 $86,836 10.05% 10.05% $87,629 ($794)
2600.52100. Group Life Insurance - Maintenance Department $76 $0 $0 $76 $19 $0 $19 $57 25.00% 25.00% $57 $0
2600.52200. FICA/Medicare Employer - Maintenance $7,385 $0 $0 $7,385 $742 $0 $742 $6,643 10.05% 10.05% $6,704 ($61)
2600.52300. Pension Contributions - Maintenance Office $2,882 $0 $0 $2,882 $554 $0 $554 $2,328 19.23% 19.23% $2,328 $0
2600.52800. Health Insurance - Maintenance $20,475 $0 $0 $20,475 $3,705 $0 $3,705 $16,771 18.09% 18.09% $16,771 $0
2600.54010. Purchased Property Services $23,695 $0 $0 $23,695 $5,153 $15,415 $20,568 $3,127 86.81% 21.75% $3,127
2600.54101. Rubbish Removal $5,768 $0 $0 $5,768 $1,951 $4,326 $6,277 ($509) 108.82% 33.82% ($509)
2600.54300. Equipment Repairs & Maint $4,000 $0 $0 $4,000 $737 $0 $737 $3,263 18.43% 18.43% $3,263
2600.54301. Building Repairs & Maint $4,000 $0 $0 $4,000 $4,830 $3,400 $8,230 ($4,230) 205.75% 120.75% ($4,230)
2600.54411. Water $2,781 $0 $0 $2,781 $0 $2,781 $2,781 $0 100.00% 0.00% $0
2600.54412. Sewer $1,957 $0 $0 $1,957 $17 $1,957 $1,974 ($17) 100.85% 0.85% ($17)
2600.55300. Communications - Telephone & Internet $11,224 $0 $0 $11,224 $3,030 $3,720 $6,750 $4,474 60.14% 26.99% $4,474
Page 3 of 4
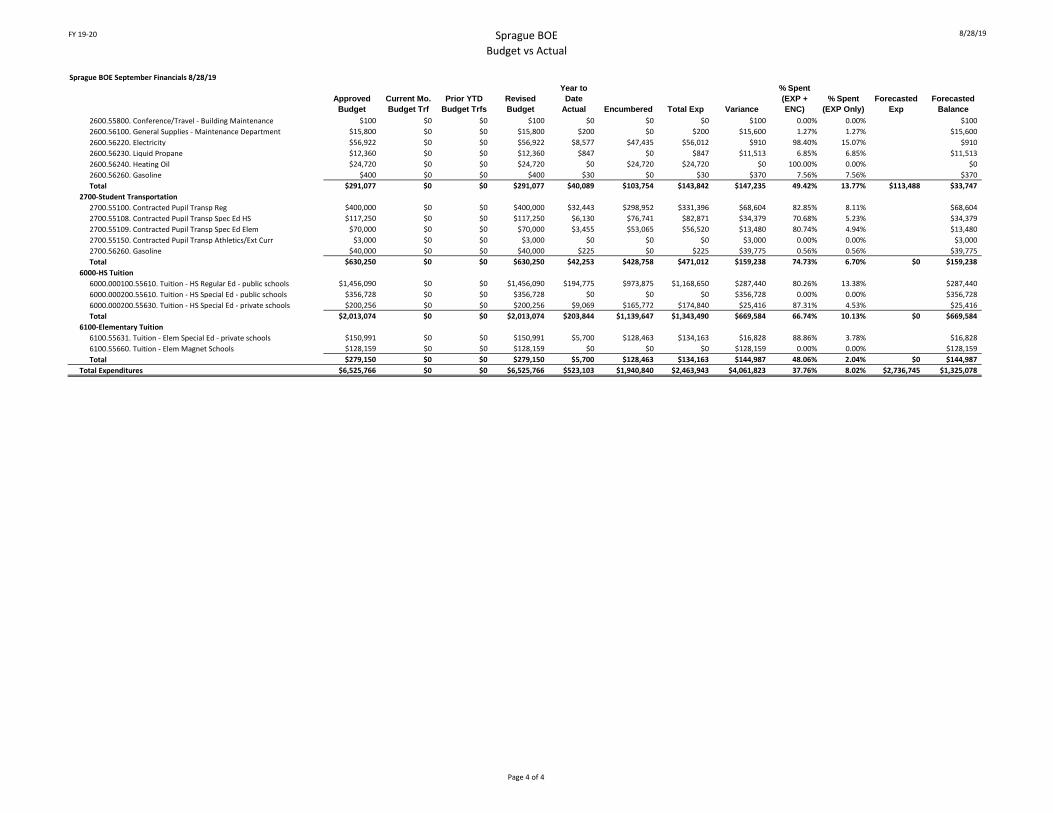
FY 19-20 Sprague BOE
Budget vs Actual
8/28/19
Sprague BOE September Financials 8/28/19
Approved
Budget
Current Mo.
Budget Trf
Prior YTD
Budget Trfs
Revised
Budget
Year to
Date
Actual Encumbered Total Exp Variance
% Spent
(EXP +
ENC)
% Spent
(EXP Only)
Forecasted
Exp
Forecasted
Balance
2600.55800. Conference/Travel - Building Maintenance $100 $0 $0 $100 $0 $0 $0 $100 0.00% 0.00% $100
2600.56100. General Supplies - Maintenance Department $15,800 $0 $0 $15,800 $200 $0 $200 $15,600 1.27% 1.27% $15,600
2600.56220. Electricity $56,922 $0 $0 $56,922 $8,577 $47,435 $56,012 $910 98.40% 15.07% $910
2600.56230. Liquid Propane $12,360 $0 $0 $12,360 $847 $0 $847 $11,513 6.85% 6.85% $11,513
2600.56240. Heating Oil $24,720 $0 $0 $24,720 $0 $24,720 $24,720 $0 100.00% 0.00% $0
2600.56260. Gasoline $400 $0 $0 $400 $30 $0 $30 $370 7.56% 7.56% $370
Total $291,077 $0 $0 $291,077 $40,089 $103,754 $143,842 $147,235 49.42% 13.77% $113,488 $33,747
2700-Student Transportation
2700.55100. Contracted Pupil Transp Reg $400,000 $0 $0 $400,000 $32,443 $298,952 $331,396 $68,604 82.85% 8.11% $68,604
2700.55108. Contracted Pupil Transp Spec Ed HS $117,250 $0 $0 $117,250 $6,130 $76,741 $82,871 $34,379 70.68% 5.23% $34,379
2700.55109. Contracted Pupil Transp Spec Ed Elem $70,000 $0 $0 $70,000 $3,455 $53,065 $56,520 $13,480 80.74% 4.94% $13,480
2700.55150. Contracted Pupil Transp Athletics/Ext Curr $3,000 $0 $0 $3,000 $0 $0 $0 $3,000 0.00% 0.00% $3,000
2700.56260. Gasoline $40,000 $0 $0 $40,000 $225 $0 $225 $39,775 0.56% 0.56% $39,775
Total $630,250 $0 $0 $630,250 $42,253 $428,758 $471,012 $159,238 74.73% 6.70% $0 $159,238
6000-HS Tuition
6000.000100.55610. Tuition - HS Regular Ed - public schools $1,456,090 $0 $0 $1,456,090 $194,775 $973,875 $1,168,650 $287,440 80.26% 13.38% $287,440
6000.000200.55610. Tuition - HS Special Ed - public schools $356,728 $0 $0 $356,728 $0 $0 $0 $356,728 0.00% 0.00% $356,728
6000.000200.55630. Tuition - HS Special Ed - private schools $200,256 $0 $0 $200,256 $9,069 $165,772 $174,840 $25,416 87.31% 4.53% $25,416
Total $2,013,074 $0 $0 $2,013,074 $203,844 $1,139,647 $1,343,490 $669,584 66.74% 10.13% $0 $669,584
6100-Elementary Tuition
6100.55631. Tuition - Elem Special Ed - private schools $150,991 $0 $0 $150,991 $5,700 $128,463 $134,163 $16,828 88.86% 3.78% $16,828
6100.55660. Tuition - Elem Magnet Schools $128,159 $0 $0 $128,159 $0 $0 $0 $128,159 0.00% 0.00% $128,159
Total $279,150 $0 $0 $279,150 $5,700 $128,463 $134,163 $144,987 48.06% 2.04% $0 $144,987
Total Expenditures $6,525,766 $0 $0 $6,525,766 $523,103 $1,940,840 $2,463,943 $4,061,823 37.76% 8.02% $2,736,745 $1,325,078
Page 4 of 4