Regular Expression ^ beginning of string $ end of string. any character except newline * match 0 or...
105
Regular Expression • ^ beginning of string • $ end of string • . any character except newline • * match 0 or more times • + match 1 or more times • ? match 0 or 1 times; • | alternative • ( ) grouping; “storing” • [ ] set of characters • { } repetition modifier • \ quote or special
-
Upload
ethel-elliott -
Category
Documents
-
view
234 -
download
4
Transcript of Regular Expression ^ beginning of string $ end of string. any character except newline * match 0 or...

Regular Expression• ^ beginning of string • $ end of string • . any character except newline • * match 0 or more times • + match 1 or more times • ? match 0 or 1 times; • | alternative • ( ) grouping; “storing” • [ ] set of characters • { } repetition modifier • \ quote or special

Repeats
• a*zero or more a’s • a+one or more a’s • a?zero or one a’s (i.e., optional a) • a{m}exactly m a’s • a{m,}at least m a’s • a{m,n}at least m but at most n a’s
\

[]


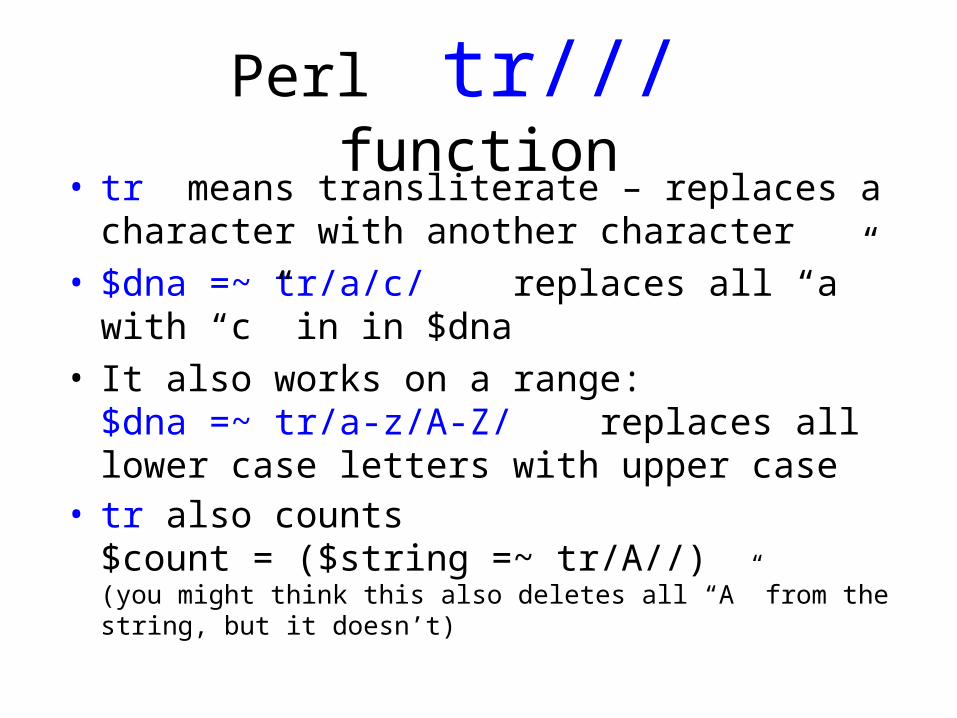
Perl tr/// function• tr means transliterate – replaces a character with
another character• $dna =~ tr/a/c/ replaces all “a” with “c” in in $dna• It also works on a range:
$dna =~ tr/a-z/A-Z/ replaces all lower case letters with upper case
• tr also counts$count = ($string =~ tr/A//)(you might think this also deletes all “A” from the string, but it doesn’t)

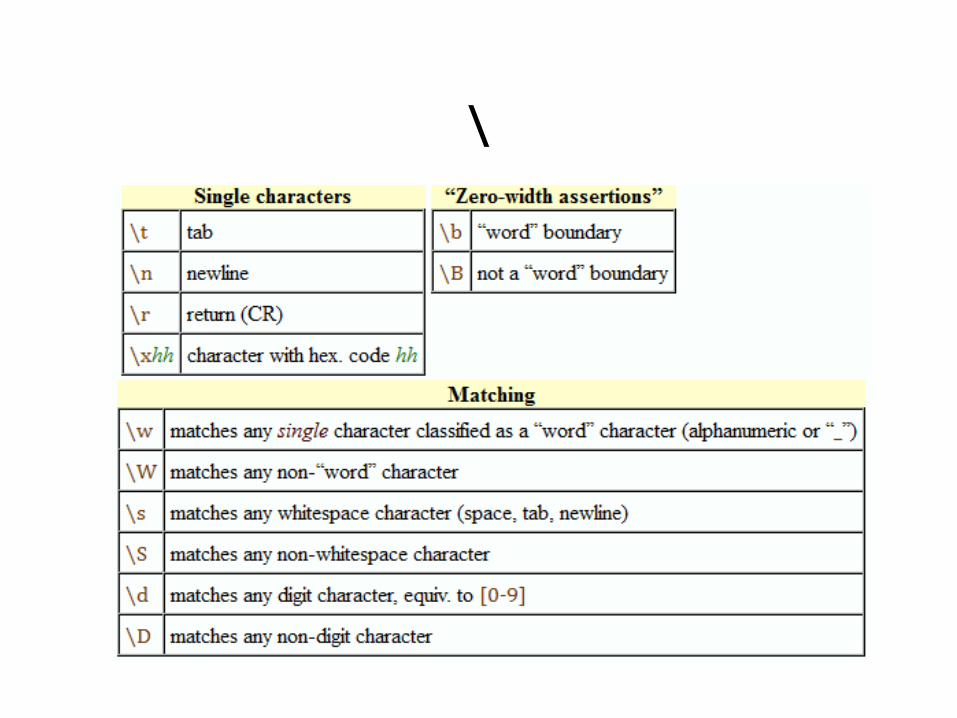
Wildcards• Perl has a set of wildcard characters for Reg. Exps.
that are completely different than the ones used by Unix • the dot (.) matches any character• \d matches any digit (a number from 0-9)• \w matches any text character
(a letter or number, not punctuation or space)
• \s matches white space (any amount)• ^ matches the beginning of a line• $ matches the end of a line
(Yes, this is very confusing!)

Repeat for a count
• Use curly brackets to show that a character repeats a specific number (or range) of times:
• find an EcoRI fragment of 100-500 bp length (two EcoRI sites with any other sequence between):
if $ecofrag =~ /GAATTC[GATC]{100,500}GAATTC/
• The + sign is used to indicate an unlimited number of repeats (occurs 1 or more times)

my $mystring; $mystring = "Hello world!";
if($mystring =~ m/World/) { print "Yes"; }
if($mystring =~ m/World/i) { print "Yes"; }

Grabbing parts of a string• Regular expressions can do more than just ask ‘if”
questions• They can be used to extract parts of a line of text
into variables; Check this out:/^>(\w+)\s(. +)$/;
Complete gibberish, right?• It means:
-look for the > sign at the beginning of a FASTA formatted sequence file
-dump the first word (\w+) into variable $1 (the sequence ID) -after a space, dump the rest of the line (.+), until you
reach the end of line $, into variable $2 (the description)

$mystring = "[2004/04/13] The date of this article.";
if($mystring =~ m/(\d)/) { print "The first digit is $1.";}
if($mystring =~ m/(\d+)/) { print "The first number is $1.";}
if($mystring =~ m/(\d+)\/(\d+)\/(\d+)/) { print "The date is $1-$2-$3";}
while($mystring =~ m/(\d+)/g) { print "Found number $1."; }
@myarray = ($mystring =~ m/(\d+)/g); print join(",", @myarray);

Download and install programs
• Unzip or untar• unzip• If file.tar.gz, tar xvfz file.tar.gz
• Go to the directory and “./configure”• Then “make”

System subroutine
system ("ls –ltr");

Gene Prediction:Statistical Approaches
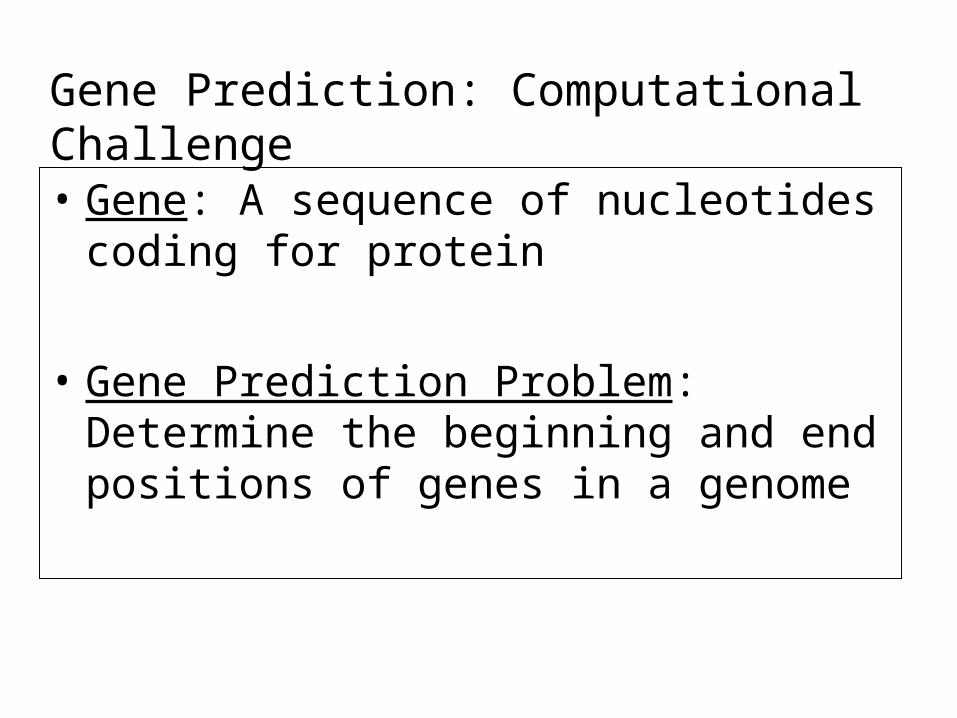
• Gene: A sequence of nucleotides coding for protein
• Gene Prediction Problem: Determine the beginning and end positions of genes in a genome
Gene Prediction: Computational Challenge

Gene Prediction: Computational Challenge
aatgcatgcggctatgctaatgcatgcggctatgctaagctgggatccgatgacaatgcatgcggctatgctaatgcatgcggctatgcaagctgggatccgatgactatgctaagctgggatccgatgacaatgcatgcggctatgctaatgaatggtcttgggatttaccttggaatgctaagctgggatccgatgacaatgcatgcggctatgctaatgaatggtcttgggatttaccttggaatatgctaatgcatgcggctatgctaagctgggatccgatgacaatgcatgcggctatgctaatgcatgcggctatgcaagctgggatccgatgactatgctaagctgcggctatgctaatgcatgcggctatgctaagctgggatccgatgacaatgcatgcggctatgctaatgcatgcggctatgcaagctgggatcctgcggctatgctaatgaatggtcttgggatttaccttggaatgctaagctgggatccgatgacaatgcatgcggctatgctaatgaatggtcttgggatttaccttggaatatgctaatgcatgcggctatgctaagctgggaatgcatgcggctatgctaagctgggatccgatgacaatgcatgcggctatgctaatgcatgcggctatgcaagctgggatccgatgactatgctaagctgcggctatgctaatgcatgcggctatgctaagctcatgcggctatgctaagctgggaatgcatgcggctatgctaagctgggatccgatgacaatgcatgcggctatgctaatgcatgcggctatgcaagctgggatccgatgactatgctaagctgcggctatgctaatgcatgcggctatgctaagctcggctatgctaatgaatggtcttgggatttaccttggaatgctaagctgggatccgatgacaatgcatgcggctatgctaatgaatggtcttgggatttaccttggaatatgctaatgcatgcggctatgctaagctgggaatgcatgcggctatgctaagctgggatccgatgacaatgcatgcggctatgctaatgcatgcggctatgcaagctgggatccgatgactatgctaagctgcggctatgctaatgcatgcggctatgctaagctcatgcgg
Gene!

Protein
RNA
DNA
transcription
translation
CCTGAGCCAACTATTGATGAA
PEPTIDE
CCUGAGCCAACUAUUGAUGAA
Central Dogma: DNA -> RNA -> Protein

Exons and Introns
• In eukaryotes, the gene is a combination of coding segments (exons) that are interrupted by non-coding segments (introns)
• This makes computational gene prediction in eukaryotes even more difficult
• Prokaryotes don’t have introns - Genes in prokaryotes are continuous

Central Dogma and Splicingexon1 exon2 exon3
intron1 intron2
transcription
translation
splicing
exon = codingintron = non-coding
Batzoglou

Gene Structure

Splicing Signals
Exons are interspersed with introns and typically flanked by GT and AG

Splice site detection
5’ 3’Donor site
Position
% -8 … -2 -1 0 1 2 … 17
A 26 … 60 9 0 1 54 … 21C 26 … 15 5 0 1 2 … 27G 25 … 12 78 99 0 41 … 27T 23 … 13 8 1 98 3 … 25
From lectures by Serafim Batzoglou (Stanford)

Consensus splice sites
Donor: 7.9 bitsAcceptor: 9.4 bits

Promoters• Promoters are DNA segments upstream
of transcripts that initiate transcription
• Promoter attracts RNA Polymerase to the transcription start site
5’Promoter 3’

Splicing mechanism
(http://genes.mit.edu/chris/)

• Newspaper written in unknown language• Certain pages contain encoded message, say 99
letters on page 7, 30 on page 12 and 63 on page 15.
• How do you recognize the message? You could probably distinguish between the ads and the story (ads contain the “$” sign often)
• Statistics-based approach to Gene Prediction tries to make similar distinctions between exons and introns.
Gene Prediction Analogy

Noting the differing frequencies of symbols (e.g. ‘%’, ‘.’, ‘-’) and numerical symbols could you distinguish between a story and the stock report in a foreign newspaper?
Statistical Approach: Metaphor in Unknown Language

• Statistical: coding segments (exons) have typical sequences on either end and use different subwords than non-coding segments (introns).
• Similarity-based: many human genes are similar to genes in mice, chicken, or even bacteria. Therefore, already known mouse, chicken, and bacterial genes may help to find human genes.
Two Approaches to Gene Prediction

If you could compare the day’s news in English, side-by-side to the same news in a foreign language, some similarities may become apparent
Similarity-Based Approach: Metaphor in Different Languages

UAA, UAG and UGA correspond to 3 Stop codons that (together with Start codon ATG) delineate Open Reading Frames
Genetic Code and Stop Codons
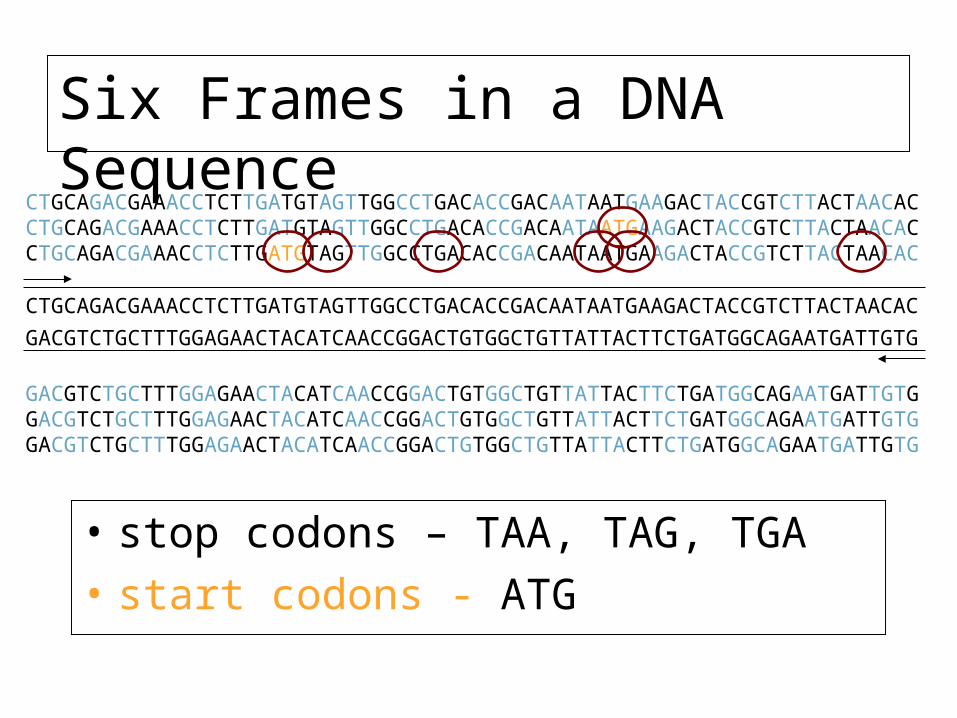
Six Frames in a DNA Sequence
• stop codons – TAA, TAG, TGA• start codons - ATG
GACGTCTGCTTTGGAGAACTACATCAACCGGACTGTGGCTGTTATTACTTCTGATGGCAGAATGATTGTG
CTGCAGACGAAACCTCTTGATGTAGTTGGCCTGACACCGACAATAATGAAGACTACCGTCTTACTAACAC
GACGTCTGCTTTGGAGAACTACATCAACCGGACTGTGGCTGTTATTACTTCTGATGGCAGAATGATTGTGGACGTCTGCTTTGGAGAACTACATCAACCGGACTGTGGCTGTTATTACTTCTGATGGCAGAATGATTGTGGACGTCTGCTTTGGAGAACTACATCAACCGGACTGTGGCTGTTATTACTTCTGATGGCAGAATGATTGTG
CTGCAGACGAAACCTCTTGATGTAGTTGGCCTGACACCGACAATAATGAAGACTACCGTCTTACTAACACCTGCAGACGAAACCTCTTGATGTAGTTGGCCTGACACCGACAATAATGAAGACTACCGTCTTACTAACACCTGCAGACGAAACCTCTTGATGTAGTTGGCCTGACACCGACAATAATGAAGACTACCGTCTTACTAACAC
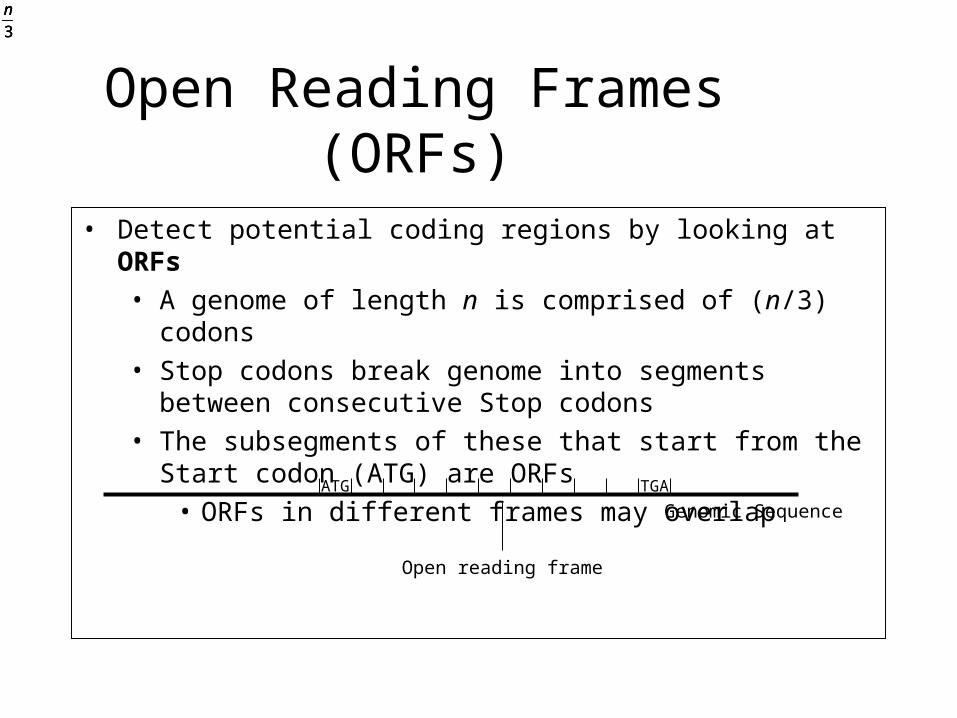
• Detect potential coding regions by looking at ORFs• A genome of length n is comprised of (n/3) codons• Stop codons break genome into segments between consecutive
Stop codons• The subsegments of these that start from the Start codon (ATG)
are ORFs• ORFs in different frames may overlap
3
n
3
n
3
n
Genomic Sequence
Open reading frame
ATG TGA
Open Reading Frames (ORFs)
• Long open reading frames may be a gene• At random, we should expect one stop codon
every (64/3) ~= 21 codons• However, genes are usually much longer
than this• A basic approach is to scan for ORFs whose
length exceeds certain threshold• This is naïve because some genes (e.g. some
neural and immune system genes) are relatively short
Long vs.Short ORFs
Testing ORFs: Codon Usage• Create a 64-element hash table and count the frequencies of codons in an ORF
• Amino acids typically have more than one codon, but in nature certain codons are more in use
• Uneven use of the codons may characterize a real gene
• This compensate for pitfalls of the ORF length test

Codon Usage in Human Genome
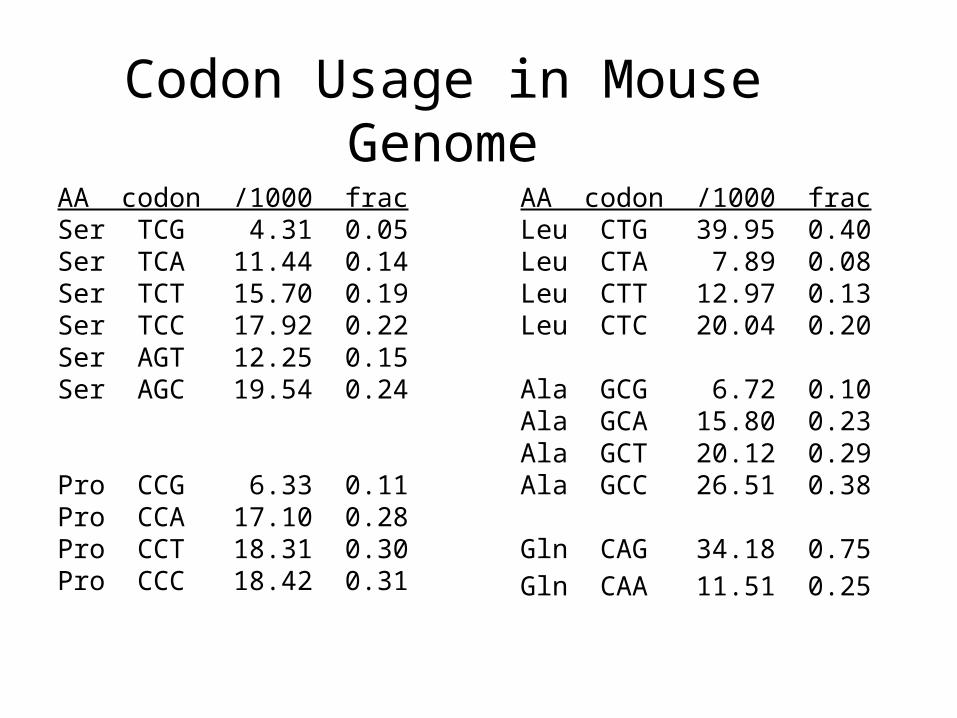
AA codon /1000 frac Ser TCG 4.31 0.05Ser TCA 11.44 0.14Ser TCT 15.70 0.19Ser TCC 17.92 0.22Ser AGT 12.25 0.15Ser AGC 19.54 0.24
Pro CCG 6.33 0.11Pro CCA 17.10 0.28Pro CCT 18.31 0.30Pro CCC 18.42 0.31
AA codon /1000 frac Leu CTG 39.95 0.40Leu CTA 7.89 0.08Leu CTT 12.97 0.13Leu CTC 20.04 0.20
Ala GCG 6.72 0.10Ala GCA 15.80 0.23Ala GCT 20.12 0.29Ala GCC 26.51 0.38
Gln CAG 34.18 0.75Gln CAA 11.51 0.25
Codon Usage in Mouse Genome

Codon Usage and Likelihood Ratio• An ORF is more “believable” than another if it has more
“likely” codons • Do sliding window calculations to find ORFs that have
the “likely” codon usage• Allows for higher precision in identifying true ORFs;
much better than merely testing for length. • However, average vertebrate exon length is 130
nucleotides, which is often too small to produce reliable peaks in the likelihood ratio
• Further improvement: in-frame hexamer count (frequencies of pairs of consecutive codons)

Gene Prediction and Motifs • Upstream regions of genes often contain
motifs that can be used for gene prediction
-10
STOP
0 10-35
ATG
TATACTPribnow Box
TTCCAA GGAGGRibosomal binding site
Transcription start site

Promoter Structure in Prokaryotes (E.Coli)
Transcription starts at offset 0.
• Pribnow Box (-10)
• Gilbert Box (-30)
• Ribosomal Binding Site (+10)

Ribosomal Binding Site

Splicing Signals
• Try to recognize location of splicing signals at exon-intron junctions• This has yielded a weakly conserved donor
splice site and acceptor splice site• Profiles for sites are still weak, and lends the
problem to the Hidden Markov Model (HMM) approaches, which capture the statistical dependencies between sites

Donor and Acceptor Sites: GT and AG dinucleotides• The beginning and end of exons are signaled by donor
and acceptor sites that usually have GT and AC dinucleotides
• Detecting these sites is difficult, because GT and AC appear very often
exon 1 exon 2GT AC
AcceptorSite
DonorSite

(http://www-lmmb.ncifcrf.gov/~toms/sequencelogo.html)
Donor: 7.9 bitsAcceptor: 9.4 bits(Stephens & Schneider, 1996)
Donor and Acceptor Sites: Motif Logos

TestCode• Statistical test described by James Fickett in
1982: tendency for nucleotides in coding regions to be repeated with periodicity of 3
• Judges randomness instead of codon frequency
• Finds “putative” coding regions, not introns, exons, or splice sites
• TestCode finds ORFs based on compositional bias with a periodicity of three

TestCode Statistics
• Define a window size no less than 200 bp, slide the window the sequence down 3 bases. In each window:
• Calculate for each base {A, T, G, C}
• max (n3k+1, n3k+2, n3k) / min ( n3k+1, n3k+2, n3k)
• Use these values to obtain a probability from a lookup table (which was a previously defined and determined experimentally with known coding and noncoding sequences

TestCode Statistics (cont’d)
• Probabilities can be classified as indicative of " coding” or “noncoding” regions, or “no opinion” when it is unclear what level of randomization tolerance a sequence carries
• The resulting sequence of probabilities can be plotted

Distribution of Each Base

Position Parameter

Statistics
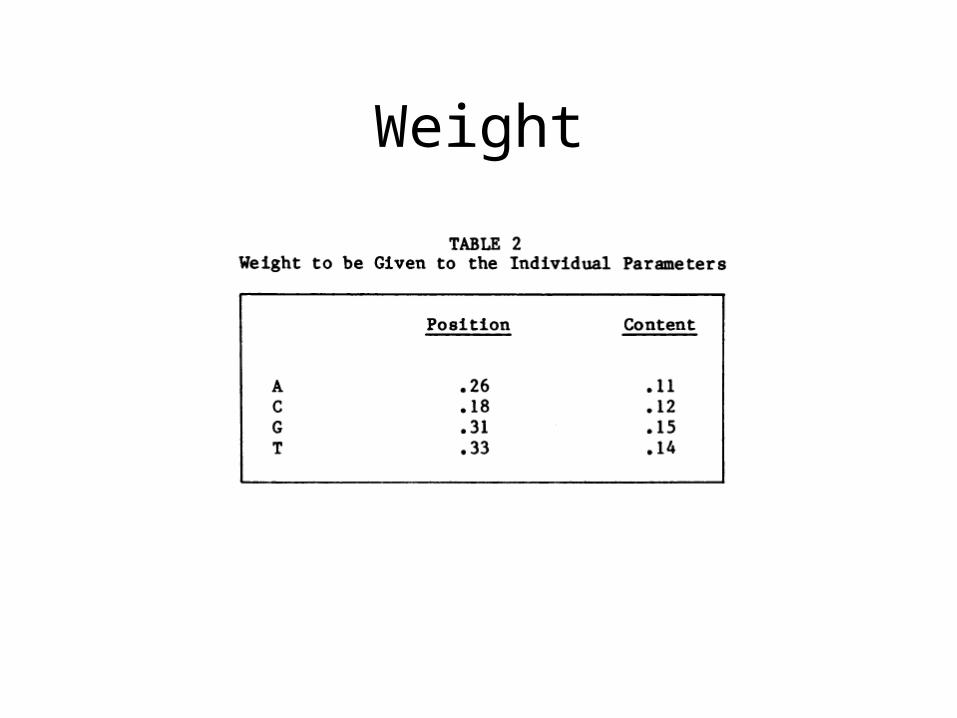
Weight

TestCode Method
• Compute A,C,G,T position and content parameters
• Look up from probability of coding value and get p1, p2, …p8
• Get corresponding weights w1, w2, …w8
• Compute p1 w1+ p2 w2 +…+p8 w8
• This is the indicator of coding function

TestCode Sample Output
Coding
No opinion
Non-coding

Popular Gene Prediction Algorithms
• GENSCAN: uses Hidden Markov Models (HMMs)
• TWINSCAN
• Uses both HMM and similarity (e.g., between human and mouse genomes)

Gene Prediction:Similarity-Based
Approaches

Using Known Genes to Predict New Genes
• Some genomes may be very well-studied, with many genes having been experimentally verified.
• Closely-related organisms may have similar genes
• Unknown genes in one species may be compared to genes in some closely-related species
Similarity-Based Approach to Gene Prediction
• Genes in different organisms are similar• The similarity-based approach uses
known genes in one genome to predict (unknown) genes in another genome
• Problem: Given a known gene and an unannotated genome sequence, find a set of substrings of the genomic sequence whose concatenation best fits the gene
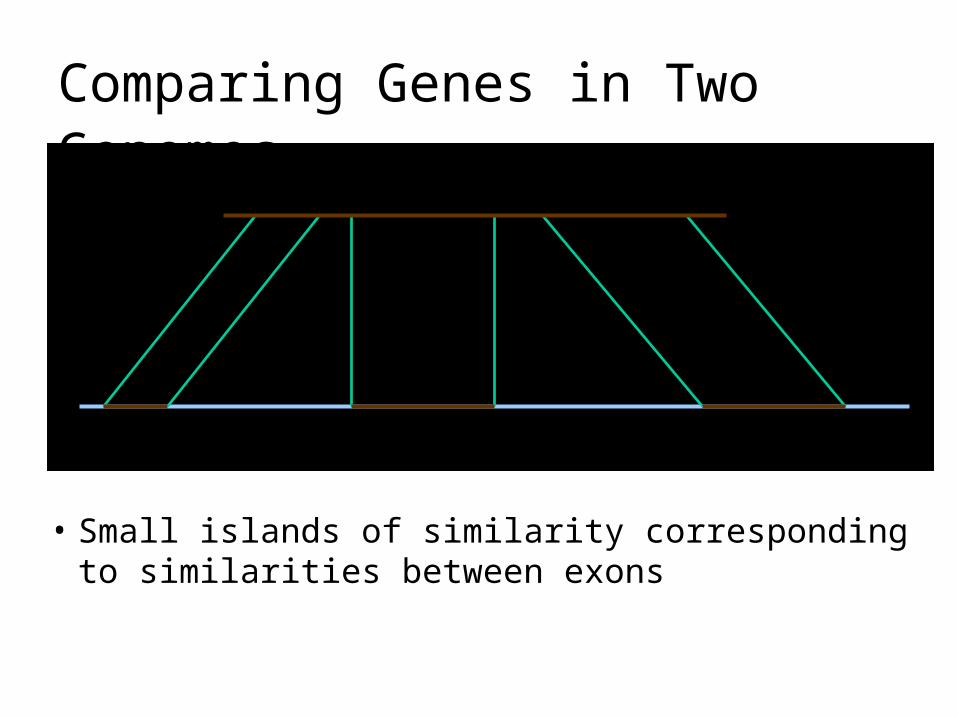
Comparing Genes in Two Genomes
• Small islands of similarity corresponding to similarities between exons
Reverse Translation• Given a known protein, find a gene in the
genome which codes for it
• One might infer the coding DNA of the given protein by reversing the translation process• Inexact: amino acids map to > 1 codon
• This problem is essentially reduced to an alignment problem

Reverse Translation (cont’d)
• This reverse translation problem can be modeled as traveling in Manhattan grid with free horizontal jumps• Complexity of Manhattan is n3
• Every horizontal jump models an insertion of an intron
• Problem with this approach: would match nucleotides pointwise and use horizontal jumps at every opportunity
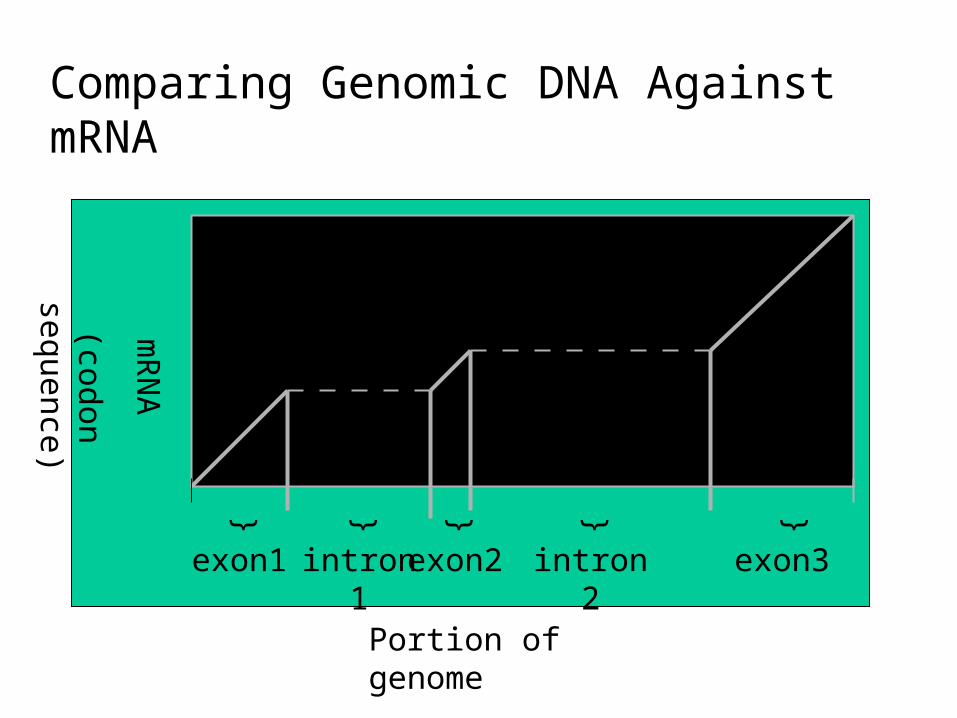
Comparing Genomic DNA Against mRNA
Portion of genome
mR
NA
(cod
on
se
quen
ce)
exon3exon1 exon2
{{ {
intron1 intron2{{

Using Similarities to Find the Exon Structure• The known frog gene is aligned to different locations in the
human genome• Find the “best” path to reveal the exon structure of human
gene
Frog G
ene (know
n)
Human Genome

Finding Local AlignmentsUse local alignments to find all islands of similarity
Human Genome
Frog G
enes (know
n)

Chaining Local Alignments• Find substrings that match a given gene sequence
(candidate exons)
• Define a candidate exons as
(l, r, w)
(left, right, weight defined as score of local alignment)
• Look for a maximum chain of substrings
• Chain: a set of non-overlapping nonadjacent intervals.

Exon Chaining Problem
• Locate the beginning and end of each interval (2n points)
• Find the “best” path
34
119
155
5
0 2 3 5 6 11 13 16 20 25 27 28 30 32

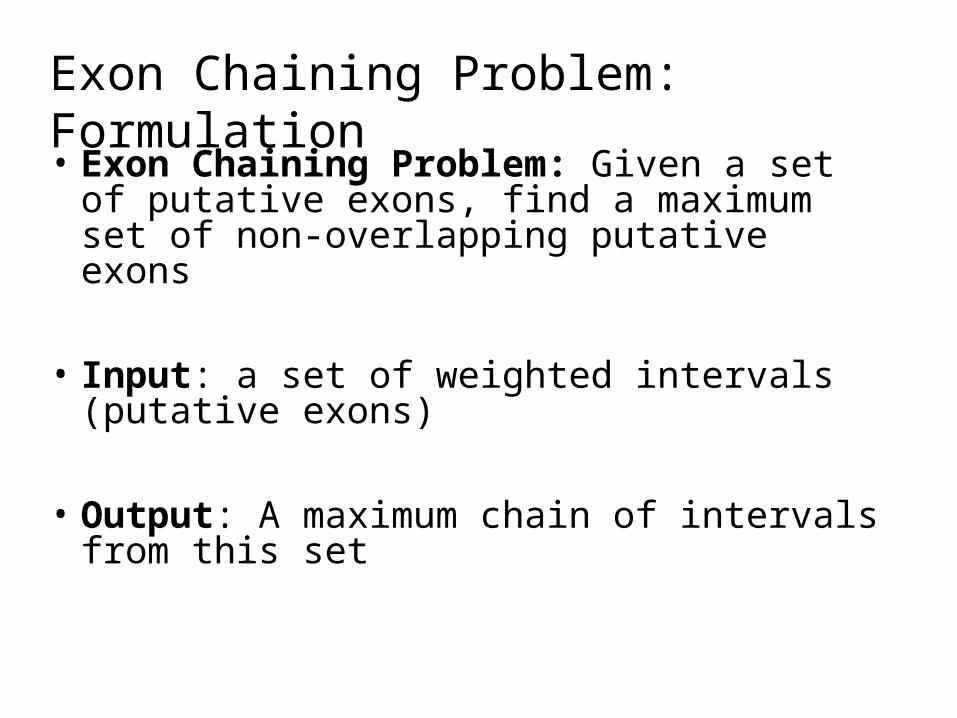
Exon Chaining Problem: Formulation• Exon Chaining Problem: Given a set of
putative exons, find a maximum set of non-overlapping putative exons
• Input: a set of weighted intervals (putative exons)
• Output: A maximum chain of intervals from this set
Exon Chaining Problem: Formulation• Exon Chaining Problem: Given a set of
putative exons, find a maximum set of non-overlapping putative exons
• Input: a set of weighted intervals (putative exons)
• Output: A maximum chain of intervals from this set
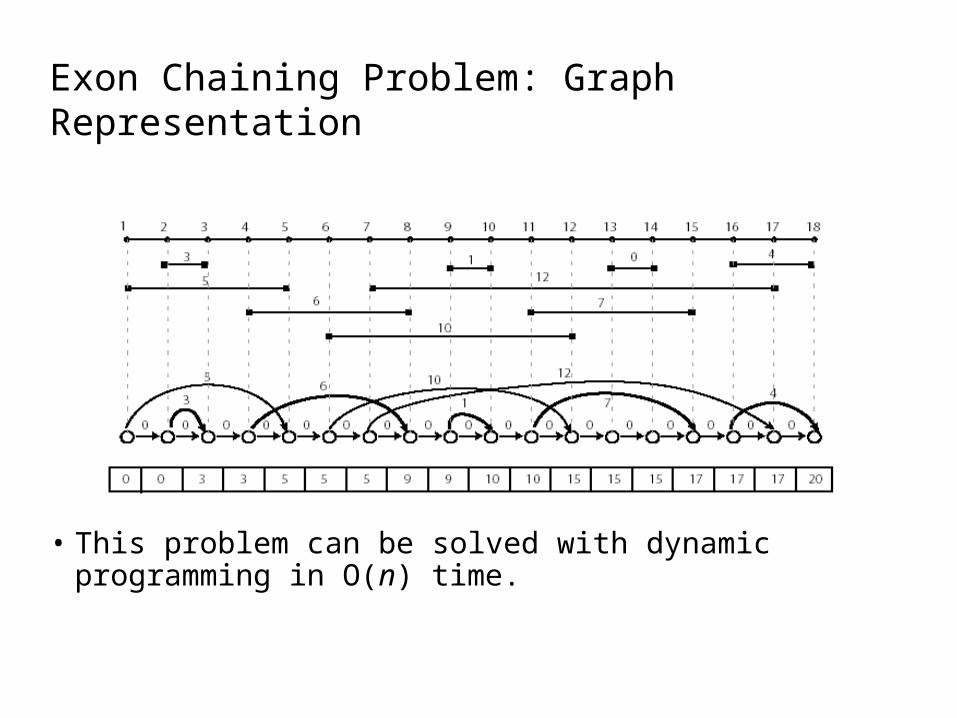
Exon Chaining Problem: Graph Representation
• This problem can be solved with dynamic programming in O(n) time.

Exon Chaining AlgorithmExonChaining (G, n) //Graph, number of intervals1 for i ← to 2n2 si ← 03 for i ← 1 to 2n4 if vertex vi in G corresponds to right end of the interval
I5 j ← index of vertex for left end of the interval I6 w ← weight of the interval I7 sj ← max {sj + w, si-1}8 else9 si ← si-1
10 return s2n

Exon Chaining: Deficiencies
• Poor definition of the putative exon endpoints• Optimal chain of intervals may not correspond to any valid
alignment• First interval may correspond to a suffix, whereas second
interval may correspond to a prefix• Combination of such intervals is not a valid alignment
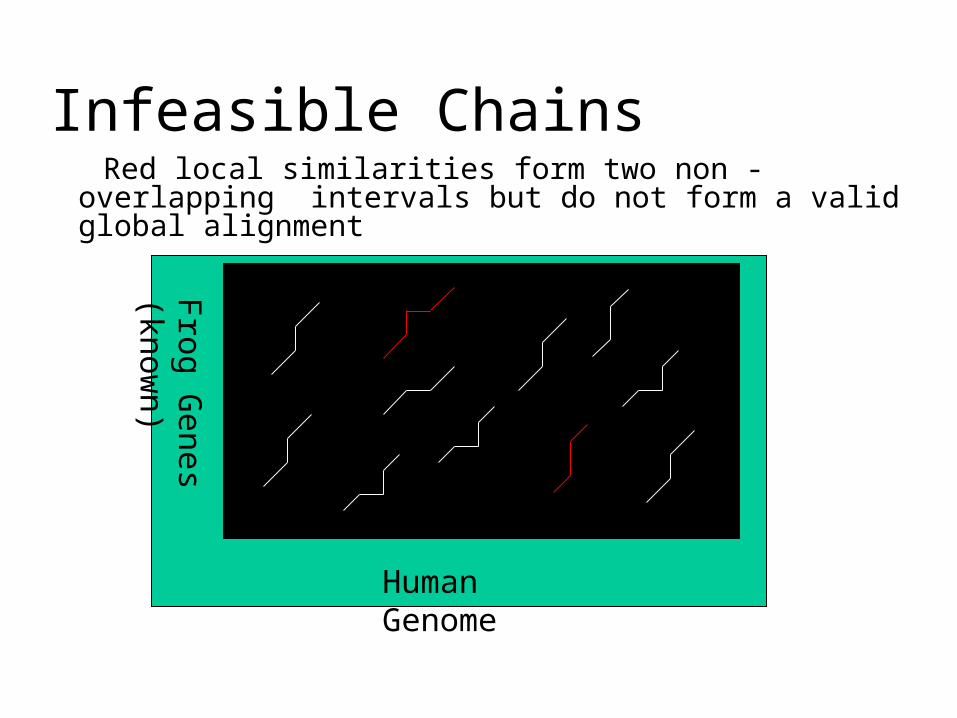
Infeasible Chains Red local similarities form two non -overlapping
intervals but do not form a valid global alignment
Human Genome
Frog G
enes (know
n)

Gene Prediction: Aligning Genome vs. Genome
• Align entire human and mouse genomes
• Predict genes in both sequences simultaneously as chains of aligned blocks (exons)
• This approach does not assume any annotation of either human or mouse genes.

Gene Prediction Tools
• GENSCAN/Genome Scan
• TwinScan
• Glimmer
• GenMark

The GENSCAN Algorithm• Algorithm is based on probabilistic model of gene structure
similar to Hidden Markov Models (HMMs). • GENSCAN uses a training set in order to estimate the
HMM parameters, then the algorithm returns the exon structure using maximum likelihood approach standard to many HMM algorithms (Viterbi algorithm). • Biological input: Codon bias in coding regions, gene
structure (start and stop codons, typical exon and intron length, presence of promoters, presence of genes on both strands, etc)
• Covers cases where input sequence contains no gene, partial gene, complete gene, multiple genes.

GENSCAN Limitations• Does not use similarity search to predict
genes.
• Does not address alternative splicing.
• Could combine two exons from consecutive genes together

Hidden Markov Model (HMM)• Can be viewed as an abstract machine with k hidden states
that emits symbols from an alphabet Σ.
• Each state has its own probability distribution, and the machine switches between states according to this probability distribution.
• While in a certain state, the machine makes 2 decisions:
• What state should I move to next?
• What symbol - from the alphabet Σ - should I emit?

HMM for Fair Bet Casino (cont’d)
HMM model for the HMM model for the Fair Bet Casino Fair Bet Casino ProblemProblem

The “Fair Bet Casino” (cont’d)
• Thus, we define the probabilities:• P(H|F) = P(T|F) = ½• P(H|B) = ¾, P(T|B) = ¼• The crooked dealer changes between Fair
and Biased coins with probability 10%
The Fair Bet Casino Problem• Input: A sequence x = x1x2x3…xn of coin tosses
made by two possible coins (F or B). • Output: A sequence π = π1 π2 π3… πn, with each
πi being either F or B indicating that xi is the result of tossing the Fair or Biased coin respectively.

Why “Hidden”?
• Observers can see the emitted symbols of an HMM but have no ability to know which state the HMM is currently in.
• Thus, the goal is to infer the most likely hidden states of an HMM based on the given sequence of emitted symbols.

HMM Parameters
Σ: set of emission characters.Ex.: Σ = {H, T} for coin tossing
Σ = {1, 2, 3, 4, 5, 6} for dice tossing
Q: set of hidden states, each emitting symbols from Σ.
Q={F,B} for coin tossing

HMM Parameters (cont’d)
A = (akl): a |Q| x |Q| matrix of probability of changing from state k to state l.
aFF = 0.9 aFB = 0.1
aBF = 0.1 aBB = 0.9
E = (ek(b)): a |Q| x |Σ| matrix of probability of emitting symbol b while being in state k.
eF(0) = ½ eF(1) = ½
eB(0) = ¼ eB(1) = ¾

HMM for Fair Bet Casino• The Fair Bet Casino in HMM terms:
Σ = {0, 1} (0 for Tails and 1 Heads)Q = {F,B} – F for Fair & B for Biased coin.
• Transition Probabilities A *** Emission Probabilities E
Fair Biased
Fair aFF = 0.9 aFB = 0.1
Biased aBF = 0.1 aBB = 0.9
Tails(0) Heads(1)
Fair eF(0) = ½ eF(1) = ½
Biased eB(0) = ¼ eB(1) = ¾

HMM for Fair Bet Casino (cont’d)
HMM model for the HMM model for the Fair Bet Casino Fair Bet Casino ProblemProblem

Hidden Paths• A path π = π1… πn in the HMM is defined as a sequence of
states.• Consider path π = FFFBBBBBFFF and sequence x =
01011101001
x 0 1 0 1 1 1 0 1 0 0 1
π = F F F B B B B B F F FP(xi|πi) ½ ½ ½ ¾ ¾ ¾ ¼ ¾ ½ ½ ½
P(πi-1 πi) ½ 9/10 9/10 1/10
9/10 9/10
9/10 9/10
1/10 9/10
9/10 Transition probability from state πi-1 to state πi
Probability that xi was emitted from state πi

P(x|π) Calculation
• P(x|π): Probability that sequence x was generated by the path π: n
P(x|π) = P(π0→ π1) · Π P(xi| πi) · P(πi → πi+1)
i=1
= a π0, π1 · Π e πi (xi) · a πi, πi+1

P(x|π) Calculation
• P(x|π): Probability that sequence x was generated by the path π: n
P(x|π) = P(π0→ π1) · Π P(xi| πi) · P(πi → πi+1)
i=1
= a π0, π1 · Π e πi (xi) · a πi, πi+1
= Π e πi+1 (xi+1) · a πi, πi+1
if we count from i=0 instead of i=1

Decoding Problem
• Goal: Find an optimal hidden path of states given observations.
• Input: Sequence of observations x = x1…xn generated by an HMM M(Σ, Q, A, E)
• Output: A path that maximizes P(x|π) over all possible paths π.
Building Manhattan for Decoding Problem
• Andrew Viterbi used the Manhattan grid model to solve the Decoding Problem.
• Every choice of π = π1… πn corresponds to a path in the graph.
• The only valid direction in the graph is eastward.
• This graph has |Q|2(n-1) edges.

Edit Graph for Decoding Problem

Decoding Problem vs. Alignment Problem
Valid directions in the alignment problem.
Valid directions in the decoding problem.

Decoding Problem as Finding a Longest Path in a DAG
• The Decoding Problem is reduced to finding a longest path in the directed acyclic graph (DAG) above.
• Notes: the length of the path is defined as the product of its edges’ weights, not the sum.

Decoding Problem (cont’d)
• Every path in the graph has the probability P(x|π).
• The Viterbi algorithm finds the path that maximizes P(x|π) among all possible paths.
• The Viterbi algorithm runs in O(n|Q|2) time.

Decoding Problem: weights of edges
w
The weight w is given by:
???
(k, i) (l, i+1)

Decoding Problem: weights of edges
w
The weight w is given by:
??
(k, i) (l, i+1)
n
P(x|π) = Π e πi+1 (xi+1) . a πi, πi+1
i=0

Decoding Problem: weights of edges
w
The weight w is given by:
?
(k, i) (l, i+1)
i-th term = e πi+1 (xi+1) . a πi, πi+1

Decoding Problem: weights of edges
w
The weight w=el(xi+1). akl
(k, i) (l, i+1)
i-th term = e πi (xi) . a πi, πi+1
= el(xi+1). akl for πi =k, πi+1=l

• Incorporates similarity information into GENSCAN: predicts gene structure which corresponds to maximum probability conditional on similarity information
• Algorithm is a combination of two sources of information• Probabilistic models of exons-introns• Sequence similarity information
GenomeScan

TwinScan
• Aligns two sequences and marks each base as gap ( - ), mismatch (:), match (|), resulting in a new alphabet of 12 letters: Σ {A-, A:, A |, C-, C:, C |, G-, G:, G |, T-, T:, T|}.
• Run Viterbi algorithm using emissions ek(b) where b {A-, A:, A|, …, T|}.∊
http://www.standford.edu/class/cs262/Spring2003/Notes/ln10.pdf
TwinScan (cont’d)
• The emission probabilities are estimated from from human/mouse gene pairs.
• Ex. eI(x|) < eE(x|) since matches are favored in exons, and eI(x-) > eE(x-) since gaps (as well as mismatches) are favored in introns.
• Compensates for dominant occurrence of poly-A region in introns
Glimmer
• Gene Locator and Interpolated Markov ModelER
• Finds genes in bacterial DNA
• Uses interpolated Markov Models

The Glimmer Algorithm
• Made of 2 programs• BuildIMM
• Takes sequences as input and outputs the Interpolated Markov Models (IMMs)
• Glimmer• Takes IMMs and outputs all candidate genes• Automatically resolves overlapping genes by
choosing one, hence limited• Marks “suspected to truly overlap” genes for
closer inspection by user
GenMark
• Based on non-stationary Markov chain models
• Results displayed graphically with coding vs. noncoding probability dependent on position in nucleotide sequence


![PHP, Reg Exp - Kesavan match all() Perform a global regular expression match int preg match all (string pattern, string subject, array matches [, int order]) Searches subject for all](https://static.fdocuments.us/doc/165x107/5b0c64b87f8b9abc0a8c20a7/php-reg-exp-kesavan-match-all-perform-a-global-regular-expression-match-int.jpg)