Registered/ Head Office Saudi Pak Tower, 61-A,Jinnah … “K”, Gulberg II, Lahore Saudi Pak...
174
Regional Offices: Regional Office, Karachi Lakson Square Building No. 1, 9th Floor 265-R.A. Line Karachi Regional Office, Lahore 2nd Floor, MM Tower, 28-A, Block “K”, Gulberg II, Lahore Saudi Pak Industrial and Agricultural Investment Company Limited Annual Report 2012 Registered/ Head Office Saudi Pak Tower, 61-A, Jinnah Avenue, Islamabad www.saudipak.com E-mail: [email protected] Phone: UAN 111 222 003 Fax : UAN 111 222 004 Annual Report 2012 Saudi Pak
Transcript of Registered/ Head Office Saudi Pak Tower, 61-A,Jinnah … “K”, Gulberg II, Lahore Saudi Pak...

Regional Offices:
Regional Office, Karachi Lakson Square Building No. 1, 9th Floor265-R.A. Line Karachi
Regional Office, Lahore2nd Floor, MM Tower, 28-A, Block “K”, Gulberg II, Lahore
Saudi Pak Industrial and Agricultural Investment
Company Limited
A n n u a l R e p o r t 2 0 1 2
Registered/ Head OfficeSaudi Pak Tower, 61-A, Jinnah Avenue, Islamabadwww.saudipak.comE-mail: [email protected]: UAN 111 222 003Fax : UAN 111 222 004
An
nu
al
R
ep
or
t
20
12
Saudi Pak

Saudi Pak Industrial and Agricultural Investment
Company Limited
E-mail: [email protected]: UAN 111 222 003
Fax: UAN 111 222 004
Registered/ Head OfficeSaudi Pak Tower, 61-A,
Jinnah Avenue, Islamabad
Regional Office, KarachiLakson Square Building No. 1, 9th
Floor 265-R.A. Line Karachi
Regional Office, Lahore2nd Floor, MM Tower, 28-A,Block “K”, Gulberg II, Lahore

In the name of Allah, most Gracious,most Compassionate

investing in progerss

contentsCorporate Information
Mission Statement
Corporate Vision
Corporate Objectives
Core Values
Corporate Profile
Board of Directors
Management
Operational Highlights
Financial Highlights
Chairman’s Message
Directors’ Report
Statistical Information
Statement of Compliance With Code of Corporate Governance
Statement on Internal Controls
Review Report to the Members on Statements of
Compliance With Best Practices of Code of Corporate Governance
Financial Statements
Auditors’ Report to the Members
Consolidated Financial Statements
05
07
07
07
07
09
10
12
14
15
19
21
36
38
40
41
42
43
102
commited to economic growth of the country
04
w w w . s a u d i p a k . c o m
Human Resource and Remuneration CommitteeMr. Mohammed W. Al-Harby ChairmanMr. Manzoor Ali Khan MemberMr. Shafqut Ur-Rehman Ranjha MemberMr. Kamal Uddin Khan MemberMr. Mohammad Nayeem Akhtar Secretary
05
Corporate InformationMr. Mohammed W. Al-Harby ChairmanMr. Manzoor Ali Khan Deputy ChairmanMr. Musaad A. Al-Fakhri DirectorMr. Abdul Ghaffar Soomro* DirectorMr. Mohammed A. Al-Jarbou DirectorMr. Shafqut Ur-Rehman Ranjha Director
GM/Chief Executive Mr. Kamal Uddin Khan
Company SecretaryMr. Mohammad Nayeem Akhtar
Risk Management CommitteeMr. Mohammed W. Al-Harby ChairmanMr. Abdul Ghaffar Soomro* MemberMr. Musaad A. Al-Fakhri MemberMr. Mohammad Nayeem Akhtar Secretary
Audit CommitteeMr. Mohammed A. Al-Jarbou ChairmanMr. Manzoor Ali Khan MemberMr. Shafqut Ur-Rehman Ranjha MemberMr. Atif Islam Secretary
Chief Financial OfficerMr. Rohail Ajmal
AuditorsKPMG Taseer Hadi & Co.Chartered Accountants
Legal AdvisorsHassan Kaunain Nafees**
* Was replaced with Mr. Jahanzeb I. Gill, whose clearance of fit and proper test is pending.**Mr. Muhammad Bilal was replaced as legal advisor on January 01, 2013.
Saudi Pak Industrial & Agricultural Investment Company Limited

our values areconcreteour support isabsolute
06
w w w . s a u d i p a k . c o m
07
Mission StatementSaudi Pak Industrial and Agricultural Investment Company Limited aims at strengthening economic cooperation between the brotherly people of Saudi Arabia and Pakistan. To achieve this objective, we are committed to add value for our stakeholders through capital formation and investment related activities in Pakistan and abroad.
Corporate VisionTo excel and play a leading role in the financial sector in Pakistan.
Corporate ObjectivesPromote investment in industrial projects with high value addition, export potential, and maximum utilization of indigenous resources
Build and manage a diversified equity portfolio promising optimum return
Mobilize funds in a cost effective manner to meet our financing needs
Achieve sustainable growth and be competitive in our commercial operations
Undertake investment advisory services and formation/participation in financing syndicates
Core ValuesProfessionalism in our conduct
Competitiveness in our business
Transparency in our operations
Ethics in our dealings
Saudi Pak Industrial & Agricultural Investment Company Limited
08
w w w . s a u d i p a k . c o m

09
Corporate ProfileSaudi Pak Industrial and Agricultural Investment Company Limited was incorporated in 1981 under a
joint venture agreement between the Kingdom of Saudi Arabia and the Government of Islamic Repub-
lic of Pakistan. The initial authorized capital of the Company was Rs.1,000 million. As of December
31, 2012 paid up capital of the Company is Rs.6,000 million. It is held as under:
Saudi Pak has a diverse product range to cater the growing needs of its corporate customers in the private and public sectors. The product mix and services comprise of:
Kingdom of Saudi Arabia 50%(Through Public Investment Fund)
Government of Islamic Republic of Pakistan 50%(Through State Bank of Pakistan)
Project Finance
Medium to long term loans
Lease financing
Term Finance Certificates (TFCs)
Long Term Finance for Export Oriented Projects (LTF-EOP)
Short term loans to meet the working capital requirements
Direct equity investments
Underwriting of public issues of shares and Term Finance Certificates
Non-funded commitments in the form of Letter of Comfort etc.
Syndication, Trusteeship, Acting as Financial Arranger/ Advisor and Consultancy services
Saudi Pak Industrial & Agricultural Investment Company Limited

10
Board of Directors
Standing Left to right
Mr. Mohammed A. Al-JarbouDirectorFinancial Advisor Public Investment Fund Ministry of Finance Kingdom of Saudi Arabia
Mr. Musaad A. Al-FakhriDirectorChief, Infrastructure Sector Budget and Organization Affairs, Ministry of Finance Kingdom of Saudi Arabia
Mr. Shafqut Ur Rehman RanjhaDirectorAdditional Secretary (Internal Finance)Ministry of FinanceGovernment of Pakistan
Mr. Mohammed W. Al-HarbyChairmanGeneral Manager (Rtd.) Real Estate Development Fund Kingdom of Saudi Arabia
Mr. Manzoor Ali KhanDeputy ChairmanSecretary Parliamentary Affairs DivisionMinistry of Parliamentary AffairsGovernment of Pakistan
Sitting Left to right
w w w . s a u d i p a k . c o m

11
Saudi Pak Industrial & Agricultural Investment Company Limited
12
appearance
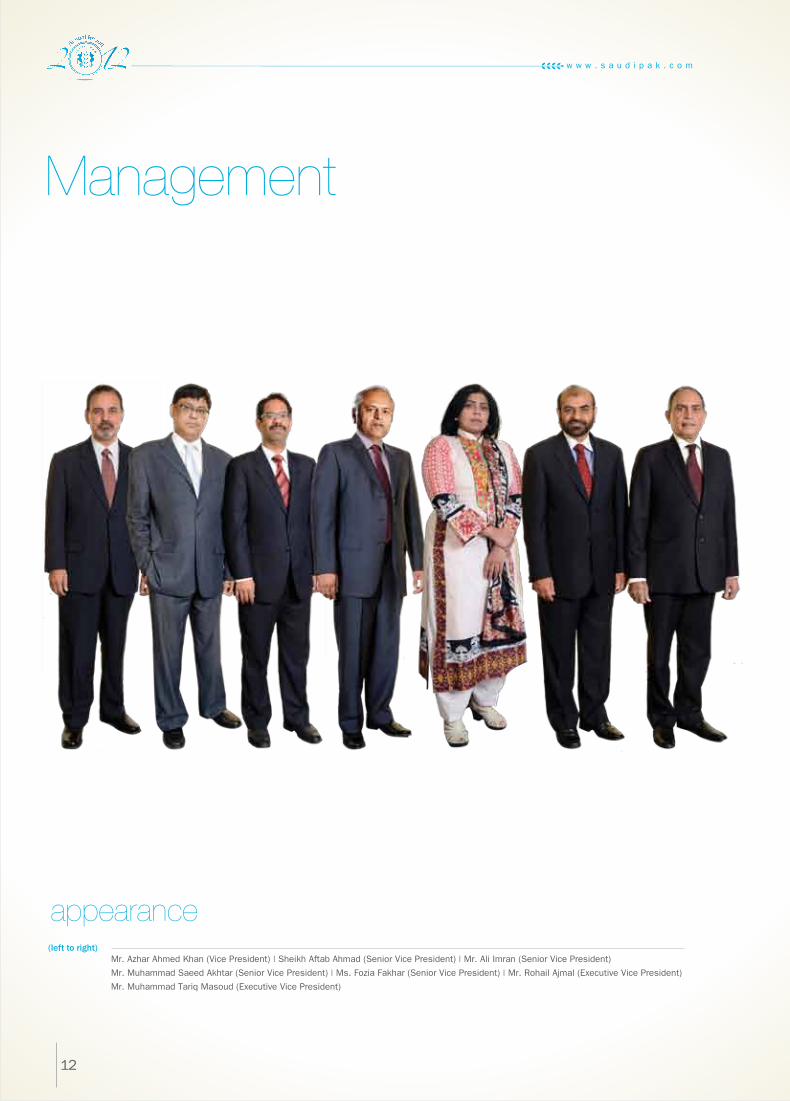
Management
(left to right)Mr. Azhar Ahmed Khan (Vice President) | Sheikh Aftab Ahmad (Senior Vice President) | Mr. Ali Imran (Senior Vice President)
Mr. Muhammad Saeed Akhtar (Senior Vice President) | Ms. Fozia Fakhar (Senior Vice President) | Mr. Rohail Ajmal (Executive Vice President)
Mr. Muhammad Tariq Masoud (Executive Vice President)
w w w . s a u d i p a k . c o m
13
Mr. Azhar Ahmed Khan (Vice President) | Sheikh Aftab Ahmad (Senior Vice President) | Mr. Ali Imran (Senior Vice President)
Mr. Muhammad Saeed Akhtar (Senior Vice President) | Ms. Fozia Fakhar (Senior Vice President) | Mr. Rohail Ajmal (Executive Vice President)
Mr. Muhammad Tariq Masoud (Executive Vice President)
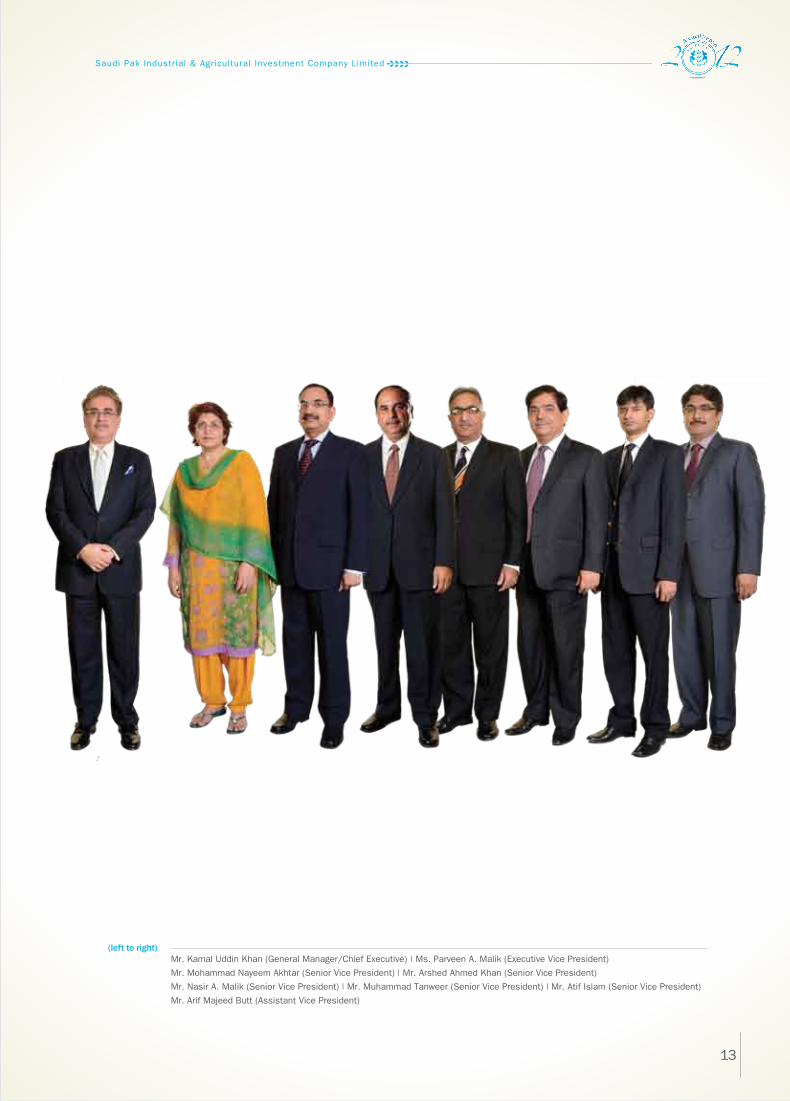
(left to right)Mr. Kamal Uddin Khan (General Manager/Chief Executive) | Ms. Parveen A. Malik (Executive Vice President)
Mr. Mohammad Nayeem Akhtar (Senior Vice President) | Mr. Arshed Ahmed Khan (Senior Vice President)
Mr. Nasir A. Malik (Senior Vice President) | Mr. Muhammad Tanweer (Senior Vice President) | Mr. Atif Islam (Senior Vice President)
Mr. Arif Majeed Butt (Assistant Vice President)
Saudi Pak Industrial & Agricultural Investment Company Limited

14
Operational Highlights
Approval of Financing and InvestmentLong Term Finance/TFCs
Lease Finance
Equity Investment
Strategic Investments
Short Term Finance
Guarantees and Underwriting
Gross ApprovalsWithdrawals
Net Approvals
Gross Cumulative Approvals
Cumulative Withdrawals
Net Cumulative Approvals
Disbursement of FundsLong Term Finance/TFCs
Lease Finance
Short Term Finance
Direct Equity & Underwriting Take-ups
Strategic Investment
Total Disbursements
Cumulative Disbursements
RecoveriesTotal Amount
Current Dues Collection Ratio (%)
389.9
80.0
-
-
601.1
35.1
1,106.1
497.9
608.2
53,007.4
1,033.8
51,973.6
208.2
-
448.0
-
-
656.2
46,885.6
2,625.2
80.67
1,724.1
-
-
-
970.0
10.8
2,704.9
360.9
2,344.0
51,901.3
535.9
51,365.4
1,980.3
92.0
605.5
19.3
-
2,697.1
46,229.4
2,992.9
83.12
1,211.5
92.0
15.0
250.0
600.0
35.0
2,203.5
100.0
2,103.5
49,196.4
175.0
49,021.4
1,338.5
-
544.4
15.0
250.0
2,147.9
43,532.3
3,185.8
78.99
2,027.9
-
168.8
225.0
330.0
484.6
3,236.3
75.0
3,161.3
46,992.9
75.0
46,917.9
3,536.7
46.1
707.3
112.2
225.0
4,627.3
41,384.4
4,298.3
82.99
2012 2011 2010 2009 2008
2012 2011 2010 2009 2008 2012 2011 2010 2009 2008 2012 2011 2010 2009 2008
30%21%
6%
23%
20%
11%
41%
6%
19%
24%
Disbursement of Funds
Approval of Financing Investment
(Net)Recoveries
2,432
4,298
3,185
2,9922,625
980.0
-
-
-
979.8
200.0
2,159.8
-
2,159.8
55,167.2
1,033.8
54,133.4
609.0
-
624.9
-
-
1,233.9
48,119.5
2,432.4
81.40
w w w . s a u d i p a k . c o m
15
Financial Highlights2012 2011 2010 2009 2008
1,217.7
267.0
(1,001.6)
(1,468.1)
-
-
6,100.5
14,377.7
(21.6)
(9.0)
2.4
1,356.6
242.3
24.3
(503.8)
-
-
7,513.2
18,273.1
(6.5)
(2.5)
2.4
2,601.2
1,173.1
976.8
418.9
-
1000.0®
7,992.3
21,211.1
5.8
2.0
2.6
8,897.2
7,186.2
5,051.8
4,426.6
6,000.0
1000.0®
6,487.3
21,133.6
65.6
19.2
3.3
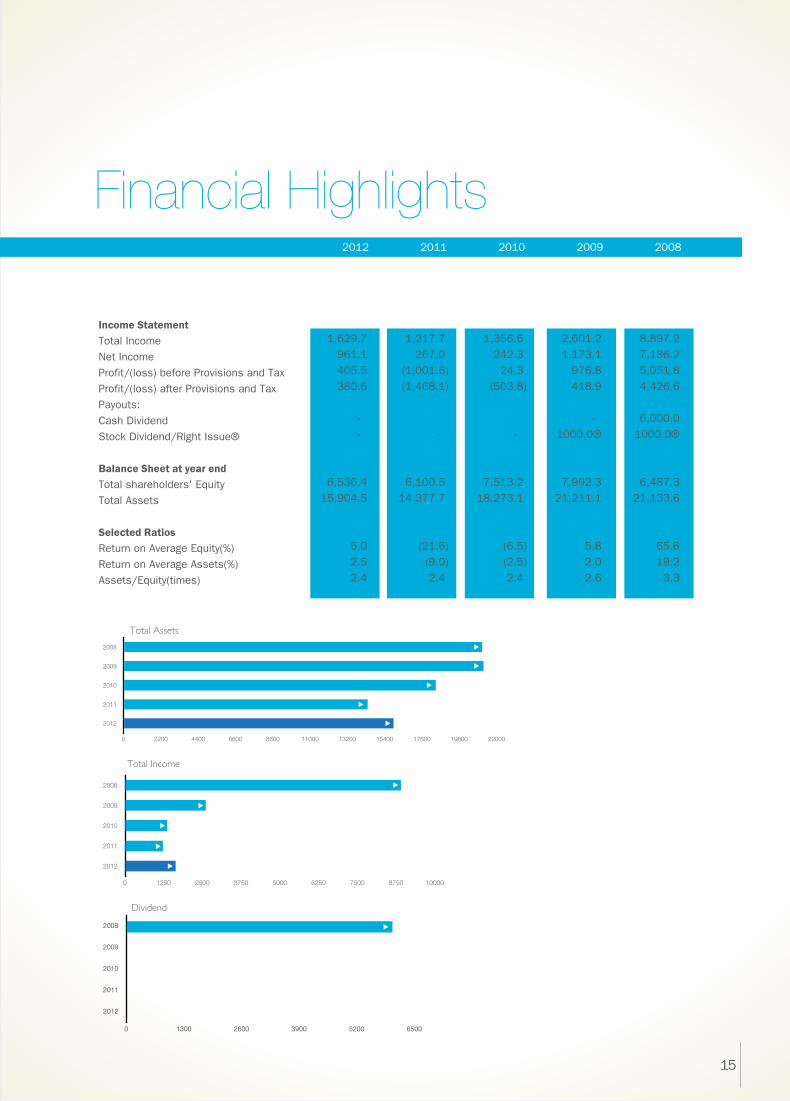
1,629.7
961.1
405.5
380.6
-
-
6,536.4
15,904.5
6.0
2.5
2.4
Income StatementTotal Income
Net Income
Profit/(loss) before Provisions and Tax
Profit/(loss) after Provisions and Tax
Payouts:
Cash Dividend
Stock Dividend/Right Issue®
Balance Sheet at year endTotal shareholders' Equity
Total Assets
Selected RatiosReturn on Average Equity(%)
Return on Average Assets(%)
Assets/Equity(times)
Total Assets
2008
2009
2010
2011
2012
0 2200 4400 6600 8800 11000 13200 15400 17600 19800 22000
Total Income
2008
2009
2010
2011
2012
0 1250 2500 3750 5000 6250 7500 8750 10000
Dividend
2008
2009
2010
2011
2012
0 1300 2600 3900 5200 6500

16
w w w . s a u d i p a k . c o m

Summary of ConsolidatedAccounts
17
---------------------------------------(Rs. in million)---------------------------------------
2012 2011 2010 2009 2008
Income Statement
Total Income
Interest/Markup Income
Profit/(Loss) before Tax
Profit/(Loss) after Tax
Balance Sheet at year end
Total Shareholders' Equity
Total Assets
1,616.7
1,479.9
(1,747.7)
(2,042.6)
7,062.5
17,324.7
1,707.8
1,728.2
(274.1)
(434.0)
8,804.4
21,982.9
3,117.7
2,315.6
33.1
237.9
10,202.1
26,292.6
10,849.1
3,764.2
3,904.4
4,125.6
8,581.8
27,633.0
1,892.7
1,246.9
268.6
247.0
7,661.6
17,708.6
2008
2009
2010
2011
2012
0 2000 4000 6000 8000 10000 12000
Total Income(Rs. in million) Total Assets
(Rs. in million)
2008
2009
2010
2011
2012
0 5000 10000 15000 20000 25000 30000
Saudi Pak Industrial & Agricultural Investment Company Limited

18
Mohammed W. Al-HarbyChairman
w w w . s a u d i p a k . c o m
19
Chairman’s MessageOn behalf of the Board of Directors, I am pleased to present the 31st audited financial statements of Saudi Pak Industrial and Agricultural Investment Company Limited as well as consolidated accounts with Auditors’ Report to Members and the Directors’ Report for the year ended December 31, 2012.
Pakistan’s economy recovered modestly from severe floods a year earlier to grow by 3.7% in FY 12. Agricul-tural growth picked up to 3.1% easing inflation to 11% - better than 12.7% projected earlier. Inspite of these developments, the economy was unable to move away from a low-growth and high-inflation environ-ment for the fifth year running. Crippling energy short-ages, security issues, burgeoning fiscal deficit and persistently high inflation are the major factors contributing to this low growth. While sustained double-digit inflation reflects government’s heavy borrowing from State Bank of Pakistan to finance large budgetary spending and excessive deficits. This has squeezed the availability of credit for the private sector and increased the pressure on liquidity. As a result private sector credit grew only by 3.3% in FY12.
To revive private sector borrowing and provide a boost to the economy, Central Bank reduced the policy rate by 250 bps during the year. Equity market responded favourably to this move with KSE-100 index register-ing an increase of 50.1% during 2012.
Within this challenging environment your company continued to maintain a cautious approach. Management’s focus remained on recoveries, balance sheet re-profiling, organizational restructur-ing and processes improvements. This strategy proved to be extremely successful enabling the company to reduce its risk profile, improve liquidity and turnaround its operating results.
During the period under review, overall balance sheet footing increased by 11% to Rs 15.9 billion. Net interest margin increased by 13.2% to Rs 426 million despite 250bps reduction in discount rate. This impressive achievement was a result of balance
sheet re-profiling and consequent 29.6% reduction in interest cost. Capitalizing on favorable market condi-tions and strategy to rationalize stock market invest-ments enabled the company to book a gain of Rs 365 million as against Rs 40.7 million in 2011 in addition to liquidity generation of Rs 832 million.
Further, focused and concerted recovery efforts bore results with 88% increase in recoveries from non-performing loans compared to the same period last year. Forex SWAP’s transactions were settled with a gain of Rs 25.6 million as against a loss of Rs 223 million in the corresponding period.
Overall taking into consideration the above and despite company’s prudent additional provisioning of Rs 451.6 million against NPLs carried forward from the past, it reported a post tax profit of Rs 380.5 million as against a loss of Rs 1,468 million last year.
Going forward the company plans to continue with its strategy to strengthen Risk Management Framework, processes improvements and increase efficiencies to rebuild attractive shareholders value while capitaliz-ing on available business opportunities. Efforts continue to resolve issues relating to strategic invest-ment i.e. Saudi Pak Leasing Company Limited and Saudi Pak Real Estate Limited to reduce up-scaling risk for the parent company. The Board firmly supports the management to pursue its plans.
In the end, I would like to express on my behalf and on behalf of the Board our sincere gratitude to the joint venture partners, the Kingdom of Saudi Arabia and the Islamic Republic of Pakistan for their unstinted support and State Bank of Pakistan and Securities and Exchange Commission of Pakistan for their professional guidance. I am also thankful to the Board Members for their valuable contributions. Further, I would like to communicate my apprecia-tion to the entire team of Saudi Pak for their excel-lent performance during the current challenging environment.
Saudi Pak Industrial & Agricultural Investment Company Limited

20
w w w . s a u d i p a k . c o m

21
Director’s Report
Pakistan's economy recovered modestly from severe floods a year earlier to grow by 3.7% in Fiscal Year 2012 (ended 30 June 2012). Agricultural growth picked up to 3.1%, markedly easing inflation. While the expansion of the service sector slowed slightly, its size meant it continued to account for most of GDP growth. Energy shortages intensified during the second half of the fiscal year, seriously crippling large-scale manufacturing, which expanded by only 1.2%. Unpredictable and severe load shedding is estimated to knock at least 2 percentage points off GDP growth annually. Investment declined for the fifth year in a row, dropping to 12.5% of GDP, compared with 22.5% in FY2007.
The country’s sustained double-digit inflation reflects the government’s heavy borrowing from the State Bank of Pakistan to finance large budgetary spending and excessive deficits. In FY2012 the deficit was estimated at 8.5% of GDP, including government financing of power sector arrears. As of June 2012 deficit financing by commercial banks (i.e. their holding of government securities) accounted for 34.4% (16.4% in 2008) of their aggregate balance sheet, while total private sector lending was 39.0% (52.4% in 2008) reflecting a major shift in their balance sheet. During FY 12 lending to private sector businesses was only Rs.18.3 billion against Rs. 692.3 billion commercial banks lent to finance budget deficit.
Economic Overview
Gross Domestic Product(Rs. in billion) at constant factor of 1999-2000
2007-08
2008-09
2009-10
2010-11
2011-12
0 1000 2000 3000 4000 5000 6000 7000
Import - Export(US $ in Million)
10000 15000 20000 25000 30000 35000 40000 45000
Exports
Imports
07-08 08-09 09-10 10-11 11-12
Saudi Pak Industrial & Agricultural Investment Company Limited

On the positive note, food prices remained relatively stable during FY 12 which helped to bring down overall inflation to 11.1 %, better than 12% projected earlier. This, along with a modest improve-ment in economic activities, is amongst the key positives for the year. In spite of these develop-ments, the economy was unable to move away from a low-growth, high-inflation environment.
Concerned with the shift in commercial bank’s lending strategy and sluggish economy SBP cut its policy rate by 250 bps during 2012. Despite the reduction in interest rates, overall monetary expan-sion decelerated in FY12. This was largely due to the deterioration in the external account. The result-ing depletion of FX reserves absorbed Rupee liquid-ity from the money market. This, along with increas-ing government borrowing from commercial banks, underlines the need for liquidity injections into the system to ensure that money market conditions remained calm.
Equity markets on the other hand responded favora-bly at the back of declining interest rate and resolu-tion of capital gain tax issues with KSE 100-Index registering an increase of 50.1 % during 2012.
Macroeconomic imbalances and structural issues are expected to hold growth to 3.7% in FY2013, in line with the FY2012 outcome, as the energy short-age is expected to continue as a binding constraint throughout the year. Inflation is expected to remain at 10.0%, reflecting likely budget spillovers. Contin-ued strong growth in remittances is expected to rein in the current account deficit to equal 1.3% of GDP.
Improving Pakistan’s economic performance depends on taking difficult steps to address struc-tural problems. Breaking out of recent doldrums crucially depends on the power sector becoming a reliable supplier of electricity so that there is incen-tive to substantially increase private investment. Most important for the breakout is to fundamentally improve the country’s fiscal position by both elimi-nating subsidies and the drain on public finances imposed by loss-making state-owned enterprises, and to broaden the tax base to raise one of the lowest tax participation rates in the region, promote equity, and provide the revenues needed to fund necessary government functions. A key concern for the economy is the on-going decline in domestic investment.
Operational ReviewCorporate FinancingDuring 2012, Corporate Finance Division continued with its strategy of financing, commercially sound business propositions, with the aim to enhance mark-up income while building high quality assets. The targeted projects were in the sector of Textile, Energy, Oil & Gas, and Agriculture etc.
Approvals and disbursements during 2012 have surpassed the 2011 figures by 99.6 % and 88.0% respectively. Approvals of Rs.2, 160 million have been made during 2012 as compared to approvals of Rs.1, 082 million during 2011. Total approvals during the year 2012 include long term financing of Rs.480 million to export oriented textile projects under Refinance Scheme of State Bank of Pakistan. Similarly, disbursements of Rs.1, 234 million have been made during 2012 as compared to disbursements of Rs.656 million during 2011.
The fee income earned during 2012 increased to Rs. 14.4 million reflecting an increase of 402%.
It is envisaged that during 2013, the energy short-age would continue to restrain the industrial growth and the industry dependent on gas resource would pose higher than normal risk because of the prevail-ing shortage of Gas. However, the decrease in interest rates would help credit off- take in private sector. The leading corporate groups in the perform-ing sectors might initiate BMR and Expansion for their projects. Renewable and Alternate energy would be the potential sector for investment and financing in coming years.
The Corporate Finance Division would remain focused on building the Credit Portfolio by taking exposures in key potential sectors which are resilient to economic and business environment adversities.
22
w w w . s a u d i p a k . c o m

Credit AdministrationThe Credit Administration Division (CAD) and its Regional Offices at Karachi and Lahore are respon-sible for credit disbursement and their monitoring till the maturity for all types of financing facilities extended by Saudi Pak.
Focused management efforts on problem accounts produced positive results and enabled the Company to recover Rs. 523 million against NPLs as compared to recovery of Rs. 278 million in 2011 i.e.
an increase of Rs. 245 million or 88% besides arresting the NPL growth trend experienced in previ-ous years.
Recovery against current maturities of regular accounts also improved to 81.4% during the year 2012 as compared to 80.7 % in the year 2011. The Company recovered Rs.2, 549 million against the budgeted amount of Rs.2, 678 million (95 percent) during the review period.
Capital Market OperationsIn the back drop of 250 bps reduction in policy rate by SBP coupled with resolution of capital gains tax related issues, and good corporate earnings Kara-chi Stock Exchange’s benchmark KSE-100 Index
performed extremely well touching a record high of 17,031 points during trading hours on December 31, 2012 as compared to 11,347 points at begin-ning of the year.
The cement and textile sectors dominated the market providing an outstanding return of 152 per cent and 99 per cent respectively, while the large cap stocks such as those in the oil and gas explora-tion and banking sector also posted good growth.At close of the year 2012, foreign investors held $3.1 billion worth Pakistan equities, which repre-sent 30 per cent of the stock market’s free-float and accounts for 7 per cent of KSE’s aggregate market capitalization of Rs. 4.2 trillion. During the outgoing year, foreign portfolio net inflow amounted to $125 million, with the market recovering almost the entire net outflow of $127 million in 2011.
Saudi Pak’s Portfolio Management Division capital-ized on improved market conditions to offload its non strategic portfolio realizing a gain of Rs.419 million including dividend income of Rs. 53 million. Further, efficient Portfolio Management resulted in Rs. 285 million appreciation in the value of invest-ments held.
23
Saudi Pak Industrial & Agricultural Investment Company Limited
24
In the back drop of 250 bps reduction in policy rate by SBP coupled with resolution of capital gains tax related issues, and good corporate earnings Kara-chi Stock Exchange’s benchmark KSE-100 Index
performed extremely well touching a record high of 17,031 points during trading hours on December 31, 2012 as compared to 11,347 points at begin-ning of the year.
The cement and textile sectors dominated the market providing an outstanding return of 152 per cent and 99 per cent respectively, while the large cap stocks such as those in the oil and gas explora-tion and banking sector also posted good growth.At close of the year 2012, foreign investors held $3.1 billion worth Pakistan equities, which repre-sent 30 per cent of the stock market’s free-float and accounts for 7 per cent of KSE’s aggregate market capitalization of Rs. 4.2 trillion. During the outgoing year, foreign portfolio net inflow amounted to $125 million, with the market recovering almost the entire net outflow of $127 million in 2011.
Saudi Pak’s Portfolio Management Division capital-ized on improved market conditions to offload its non strategic portfolio realizing a gain of Rs.419 million including dividend income of Rs. 53 million. Further, efficient Portfolio Management resulted in Rs. 285 million appreciation in the value of invest-ments held.
Fixed Income Investment portfolio managed by Treasury Division was diversified with addition of risk free government securities. An effective mix of liquid assets resulted in improving income spread and bringing down the market and liquidity risks. These strategies translated into reduction in mark-up cost of the Company.
During 2013 Treasury Division intends to diversify avenues of resource mobilization, particularly long term credit lines will be pursued to achieve optimum gap management. Deployment and spread transac-tions will continue to follow the policy gauged on the parameter of risk-reward tradeoff.
Treasury OperationsDuring the year 2012, the economy remained sluggish and liquidity remained tight. Treasury Division positioned itself pro-actively to pursue the objectives of smooth resource mobilization, manag-ing liquidity and interest rate risks and effective portfolio management. In line with the Company’s strategy to re-profile the balance sheet, Treasury Division built up a portfolio of fixed income invest-ments comprising of government securities, which resulted in risk-free returns as well as lowering of balance sheet risks. Selective approach was adopted in year 2012 to avoid high cost deposits and the benefit of daily market fluctuations was materialized to bring down the cost of borrowing through focused money market operations. Conse-quently total cost of fund mobilization reduced by Rs. 530.9 million (45 percent) during 2012.
Risk Management FrameworkEfforts are continuing to base Risk Manage-ment Framework in Saudi Pak on sound organi-zational structure, policies and procedures, risk assessment techniques, monitoring tools and reporting mechanism closely aligned with
the company’s strategy. Risk Management activities broadly take place simultaneously at different hierarchy levels i.e. strategic, macro and micro levels.
The overall responsibility of risk management rests with the Board of Directors and it has constituted Risk Management Committee comprising of Board members with clear terms of reference. Under the guidance of the Board, the scope of Risk Manage-ment Division (RMD) has been widened, focusing on
capacity building, development of new policies, procedures, and increase in awareness about risk management concepts and practices. These improvements are in line with the regulatory require-ments including Basel II, and best industry practices.
w w w . s a u d i p a k . c o m

25
Efforts are continuing to base Risk Manage-ment Framework in Saudi Pak on sound organi-zational structure, policies and procedures, risk assessment techniques, monitoring tools and reporting mechanism closely aligned with
the company’s strategy. Risk Management activities broadly take place simultaneously at different hierarchy levels i.e. strategic, macro and micro levels.
The overall responsibility of risk management rests with the Board of Directors and it has constituted Risk Management Committee comprising of Board members with clear terms of reference. Under the guidance of the Board, the scope of Risk Manage-ment Division (RMD) has been widened, focusing on
capacity building, development of new policies, procedures, and increase in awareness about risk management concepts and practices. These improvements are in line with the regulatory require-ments including Basel II, and best industry practices.
Information TechnologyThe Information Technology function focuses on strategic initiative to make advancement in technol-ogy for business growth. Saudi Pak’s IT strategy provides direction to strengthen its existing IT facili-ties, re-engineering of the legacy systems, integrated management information systems, decision support systems and building capacity for growth.
To cope with the localized or global disasters, Business Continuity /Disaster Recovery Site has been set up with complete IT infrastructure for the
availability of critical data which is being tested on regular basis for ensuring its authenticity. It also provides reliability, trust and strengthens the confi-dence of our valued clients.
The latest trends of technology pave the path to new innovations and betterment. Various initiatives have been taken to improve the IT infrastructure by adopt-ing evolving technologies along with successful deployment of core business solutions for the company.
Saudi Pak Industrial & Agricultural Investment Company Limited

26
Human Resource DevelopmentHuman Capital is the real wealth of Saudi Pak. All out efforts are made for its growth and development. The basic objective of human resource development is to create high performance corporate culture and to retain capable employees. Employee friendly HR policies are designed and implemented to motivate employees for optimum level of performance through team building. HR function contributes to Company’s performance by aligning people and practices in line with the Saudi Pak strategic goals.
The Company provides its employees a fair market based compensation package; merit based corporate culture and capacity building programs for their personal and professional growth. Training is considered
as continued investment to develop the requisite skills and competencies of employees. Based on individual as well as divisional need basis, 48 man days training was provided to employees on various topics during the year 2012.
w w w . s a u d i p a k . c o m

27
Human Capital is the real wealth of Saudi Pak. All out efforts are made for its growth and development. The basic objective of human resource development is to create high performance corporate culture and to retain capable employees. Employee friendly HR policies are designed and implemented to motivate employees for optimum level of performance through team building. HR function contributes to Company’s performance by aligning people and practices in line with the Saudi Pak strategic goals.
The Company provides its employees a fair market based compensation package; merit based corporate culture and capacity building programs for their personal and professional growth. Training is considered
as continued investment to develop the requisite skills and competencies of employees. Based on individual as well as divisional need basis, 48 man days training was provided to employees on various topics during the year 2012.
Saudi Pak Industrial & Agricultural Investment Company Limited

28
29
Internal Audit The Internal Audit Function of the company is currently under a restructuring and capacity building phase and new measures are being initiated to enhance the capacity and improve the performance of the Internal Audit Division.
A plan for operational restructuring & capacity build-ing has been developed which is presently under review. Also new Internal Audit Manual is in the
process of preparation. Training of new staff is also planned to enhance the capacity, efficiency and value addition for the Internal Audit Division as well as for the whole Company.
It is expected that implementation of these initia-tives with the coordination of other Divisions, related risks shall be reduced which in turn shall enhance the audit controls & efficiency.
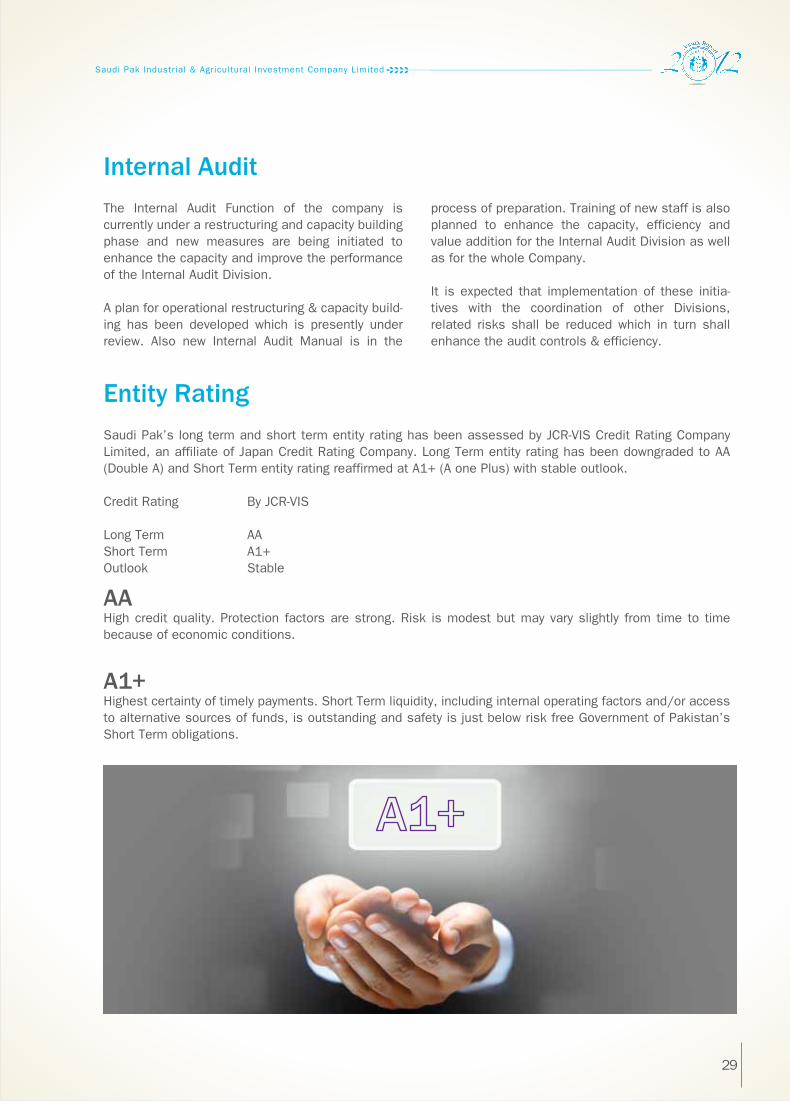
Entity RatingSaudi Pak’s long term and short term entity rating has been assessed by JCR-VIS Credit Rating Company Limited, an affiliate of Japan Credit Rating Company. Long Term entity rating has been downgraded to AA (Double A) and Short Term entity rating reaffirmed at A1+ (A one Plus) with stable outlook.
Credit Rating By JCR-VIS
Long Term AAShort Term A1+Outlook Stable
AAHigh credit quality. Protection factors are strong. Risk is modest but may vary slightly from time to time because of economic conditions.
A1+Highest certainty of timely payments. Short Term liquidity, including internal operating factors and/or access to alternative sources of funds, is outstanding and safety is just below risk free Government of Pakistan’s Short Term obligations.
Saudi Pak Industrial & Agricultural Investment Company Limited

30
w w w . s a u d i p a k . c o m

31
Corporate and Financial Reporting Framework
The Directors are pleased to certify that:
The financial statements, prepared by the management of the Company, present fairly its state of affairs, the result of its operations, cash flows and changes in equity.
Proper books of accounts of the Company have been maintained.
Appropriate accounting policies have consistently been applied in preparation of financial statements and accounting estimates are based on reasonable and prudent judgment.
International Accounting Standards, as applicable in Pakistan, have been followed in preparation of financial statements and any departure there from has adequately been disclosed.
The system of internal control is sound in design and has been effectively implemented and monitored. An audit committee, composed of three non-executive directors, has been formed for the purpose. The Committee meets periodically and independently throughout the year.
There are no significant doubts upon the Company’s ability to continue as a going concern.
There has been no material departure from the best practices of corporate governance.
Transactions undertaken with related parties during the year have been ratified by the Audit Committee and have been properly disclosed in the financial statements.
Key operating and financial data for the last five years, in summarized form, is included in this annual report.
There are no statutory payments on account of taxes, duties, levies and charges which are outstanding as of December 31, 2012, except as disclosed in the financial statements.
The value of investment of Provident Fund as at December 31, 2012 according to their audited financial statement is approximately Rs.66.98 million (2011: Rs.64.98 million).
a:
b:
c:
d:
e:
f:
g:
h:
i:
j:
k:
Saudi Pak Industrial & Agricultural Investment Company Limited
32
AuditorsThe Auditors, M/s KPMG Taseer Hadi & Co., Chartered Accountants have completed their assignment for the year ended December 31, 2012 and also indicated their willingness to continue in office as Auditors. The Board, on the proposal of the Audit Committee, recommends the appointment of M/s KPMG Taseer Hadi & Co., Char-tered Accountants as Auditors for the year 2013.
The categories and pattern of shareholding as required by the Companies Ordinance, 1984 are included in this Report. The Government of Pakistan and the Kingdom of Saudi Arabia hold the shares of the company in equal proportion.
Saudi Pak will continue to capitalize on available business opportunities. For this purpose the risk manage-ment framework will be further strengthened. A prudent way of financing and investment will be adopted in the context of prevailing economic condition of the country. Efforts will be continued to add value for our stakeholders through capital formation and investment related activities.
Future Outlook
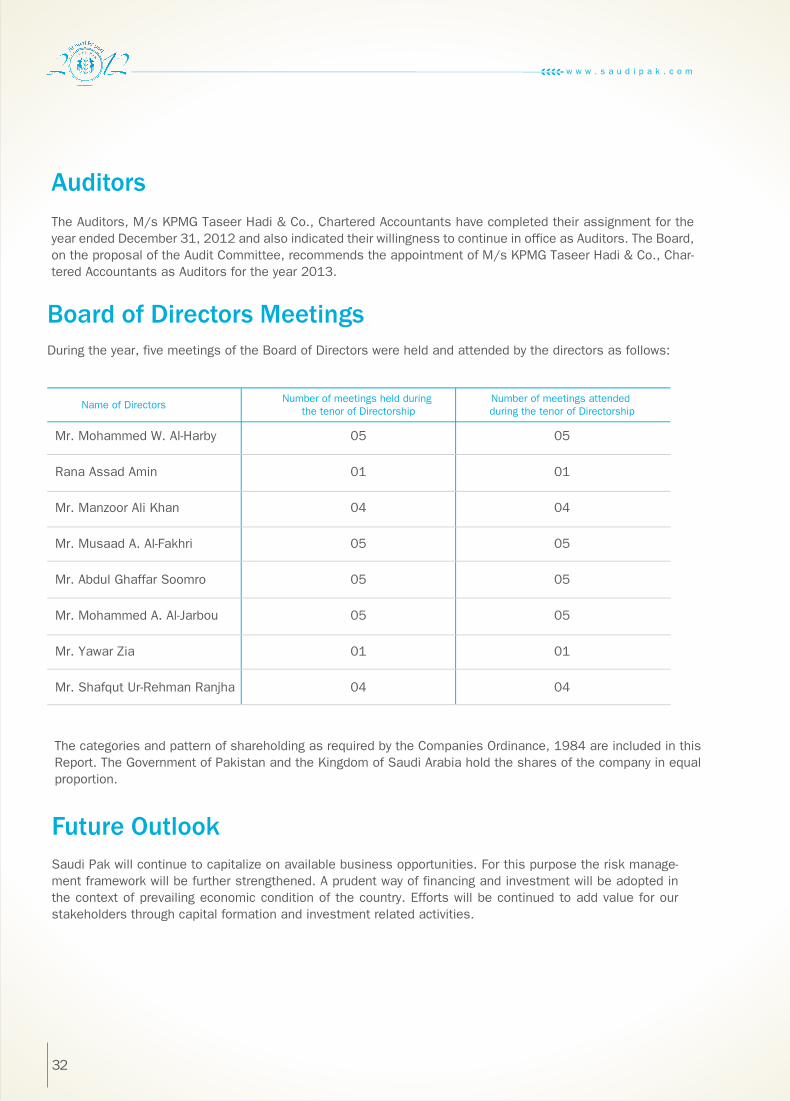
During the year, five meetings of the Board of Directors were held and attended by the directors as follows:
Board of Directors Meetings
Name of DirectorsNumber of meetings held during
the tenor of DirectorshipNumber of meetings attended during the tenor of Directorship
Mr. Mohammed W. Al-Harby
Rana Assad Amin
Mr. Manzoor Ali Khan
Mr. Musaad A. Al-Fakhri
Mr. Abdul Ghaffar Soomro
Mr. Mohammed A. Al-Jarbou
Mr. Yawar Zia
Mr. Shafqut Ur-Rehman Ranjha
05
01
04
05
05
05
01
04
05
01
04
05
05
05
01
04
w w w . s a u d i p a k . c o m

3333
Strategic InvestmentsSaudi Pak’s associates include Saudi Pak Real Estate Limited and Saudi Pak Leasing Company Ltd. Saudi Pak Insurance is no longer amongst Saudi Pak subsidiaries as major stake in the Company has been disposed off. The title ‘Saudi Pak’ will be removed from the Company name in year 2013.
Saudi Pak Real Estate LimitedThe company was established in 2007 and is wholly owned subsidiary of Saudi Pak with initial paid-up capital of Rs. 500 million. As at year end, net equity of the company stood at Rs. 596 million and break-up value of its shares stands at Rs 11.92 per share.
The company has participated in a housing project at a prime location in Lahore and plans to expand its core business through undertaking new projects. It also plans to strengthen its capital base through induction of strategic partner.
Saudi Pak Leasing Company LimitedSaudi Pak Leasing Company was incorporated in January 1991 and is listed on all three stock exchanges in Pakistan. Saudi Pak Industrial and Agricultural Investment Company Limited is the parent company (by virtue of management rights) and as of June 30, 2012 hold 35.06 per cent of issued share capital. Investment of Saudi Pak’s in Saudi Pak Leasing is Rs. 576.676 million by way of equity investment and sub-ordinate debt.
The leasing sector is facing serious challenges for last five years i.e. after the financial meltdown of 2008. Saudi Pak Leasing has also been hit hard by this financial meltdown. However, the Company is striving for its revival through settlements with creditors, reduction in expenses and hectic recovery drive of stuck up loans/leases. For the six month period ended Dec. 31 2012, Saudi Pak Leasing earned after tax profit of Rs. 35 million as against loss of Rs. 657.2 million incurred during same period last year. Financial condition of the company is expected to improve in coming years.
Saudi Pak Industrial & Agricultural Investment Company Limited
SaudiPak
Tower
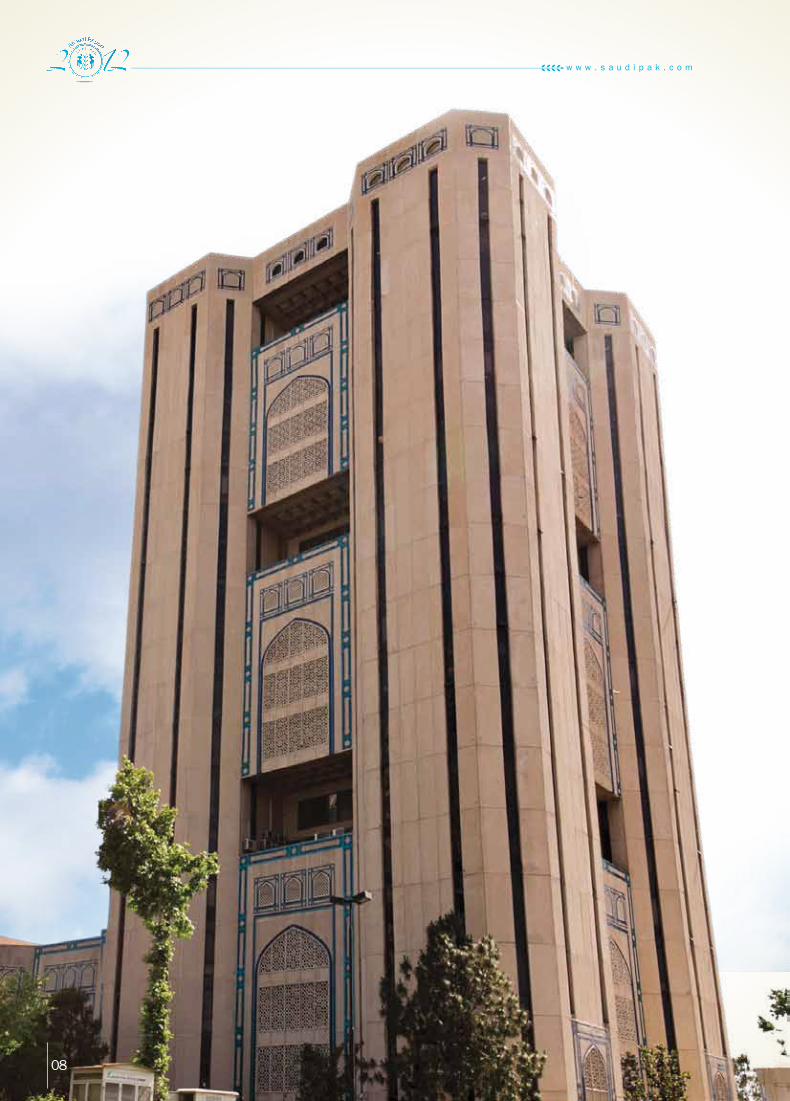
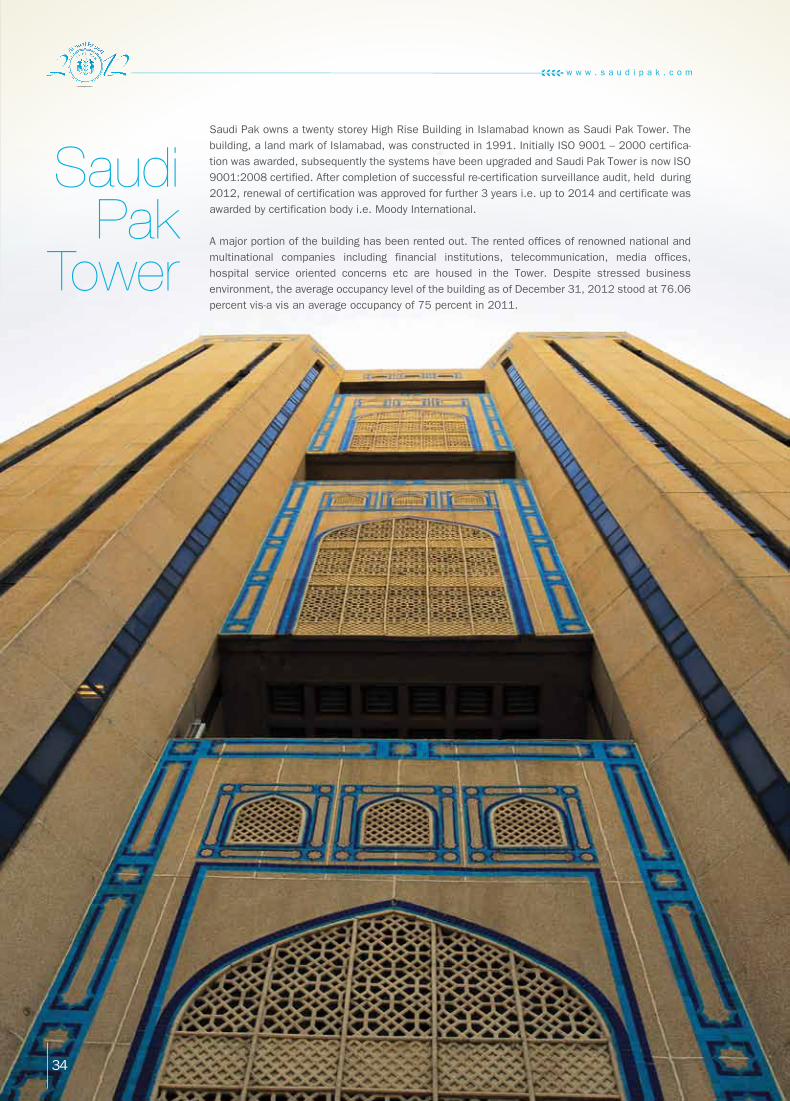
Saudi Pak owns a twenty storey High Rise Building in Islamabad known as Saudi Pak Tower. The
building, a land mark of Islamabad, was constructed in 1991. Initially ISO 9001 – 2000 certifica-
tion was awarded, subsequently the systems have been upgraded and Saudi Pak Tower is now ISO
9001:2008 certified. After completion of successful re-certification surveillance audit, held during
2012, renewal of certification was approved for further 3 years i.e. up to 2014 and certificate was
awarded by certification body i.e. Moody International.
A major portion of the building has been rented out. The rented offices of renowned national and
multinational companies including financial institutions, telecommunication, media offices,
hospital service oriented concerns etc are housed in the Tower. Despite stressed business
environment, the average occupancy level of the building as of December 31, 2012 stood at 76.06
percent vis-a vis an average occupancy of 75 percent in 2011.
34
w w w . s a u d i p a k . c o m

35
Financial Results – 2012Total mark up / interest income decreased by 17.5 percent to Rs 1,095 million from Rs 1,327 million as compared to the previous year. Mark up expense declined by 29.6 percent to Rs 669 million from Rs 951 million. Resultantly, net spread increased to Rs 426 million in the current year from Rs 376 million in the previous year.
Total non-mark up / interest income in the current year increased to Rs 534 million as against the loss of Rs 109 million in the last year 2011. The provision against non-performing loans decreased by Rs 269 million and diminution in the value of investment increased by Rs 71 million over last year.
Net profit after taxation amounted to Rs 381 million as compared to loss of Rs 1,468 million in the corre-sponding period of the previous year.
The paid up capital was Rs 6,000 million at the end of year 2012. The shareholders equity increased to Rs 6,536 million as at December 31, 2012 from Rs 6,100 million as at December 31, 2011. Total assets of the company amounted to Rs 15,904 million as on December 31, 2012 against Rs 14,378 million as on December 31, 2011.
The return on average shareholders’ equity figured at 6.0 percent and return on average assets 2.5 percent in the year 2012.
The Board wishes to place on record its appreciation of the hard work and dedication of the management, officers and staff of the company.
Islamabad | Dated: April 08, 2013 Chairman
The summarized financial results and recommendation for appropriations are as under:
Appropriations:
Acknowledgement
For and on behalf of the Board of Directors
Un-appropriated loss brought forward
Appropriation from reserve fund
Profit/(loss) after tax for the year
Incremental depreciation on revalued fixed assets
Profit available for appropriations
(1,412,718,297)
1,412,718,297
380,584,782
55,391,880
435,976,662
(448,458,943)
448,458,943
(1,468,109,784)
55,391,487
(1,412,718,297)
2011(Rupees)
2012(Rupees)
Transfer to reserve funds
Transfer to general reserve
Total appropriations
76,116,956
359,859,706
435,976,662
_
_
_
Saudi Pak Industrial & Agricultural Investment Company Limited
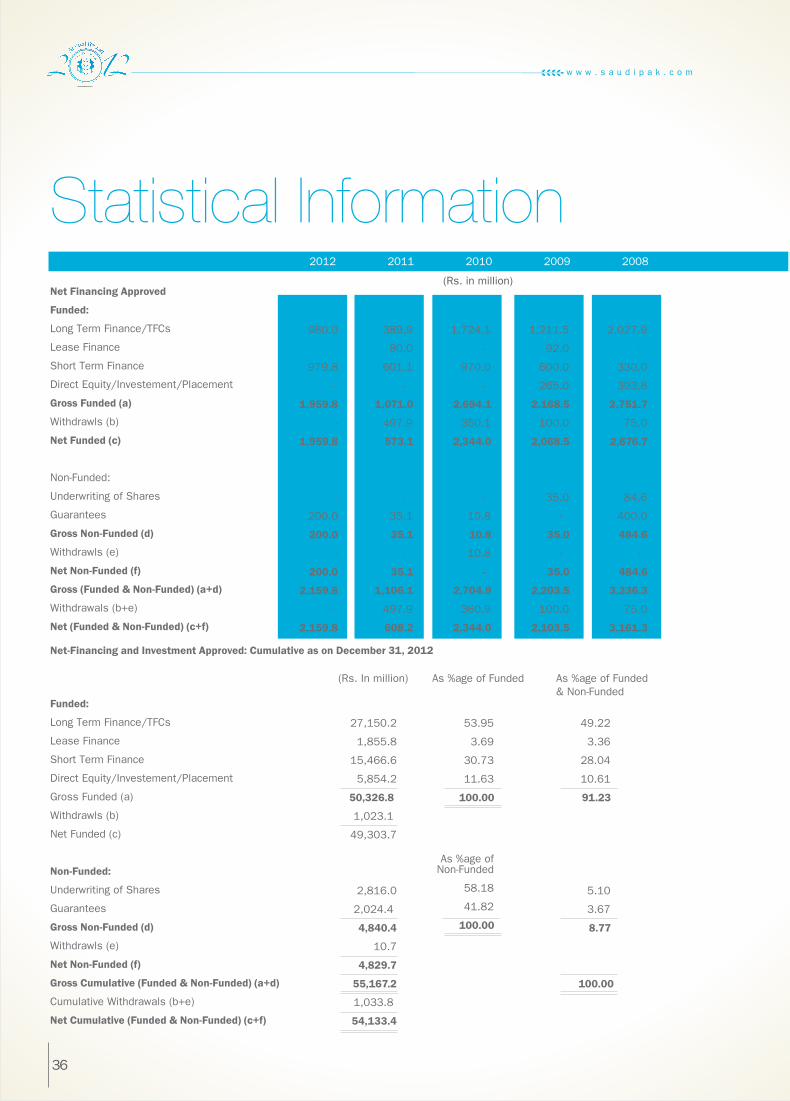
Statistical InformationNet Financing Approved
Funded:
Long Term Finance/TFCs
Lease Finance
Short Term Finance
Direct Equity/Investement/Placement
Gross Funded (a)
Withdrawls (b)
Net Funded (c)
Non-Funded:
Underwriting of Shares
Guarantees
Gross Non-Funded (d)
Withdrawls (e)
Net Non-Funded (f)
Gross (Funded & Non-Funded) (a+d)
Withdrawals (b+e)
Net (Funded & Non-Funded) (c+f)
Net-Financing and Investment Approved: Cumulative as on December 31, 2012
Funded:
Long Term Finance/TFCs
Lease Finance
Short Term Finance
Direct Equity/Investement/Placement
Gross Funded (a)
Withdrawls (b)
Net Funded (c)
Non-Funded:
Underwriting of Shares
Guarantees
Gross Non-Funded (d)
Withdrawls (e)
Net Non-Funded (f)
Gross Cumulative (Funded & Non-Funded) (a+d)
Cumulative Withdrawals (b+e)
Net Cumulative (Funded & Non-Funded) (c+f)
27,150.2
1,855.8
15,466.6
5,854.2
50,326.8
1,023.1
49,303.7
2,816.0
2,024.4
4,840.4
10.7
4,829.7
55,167.2
1,033.8
54,133.4
53.95
3.69
30.73
11.63
100.00
As %age of Non-Funded
58.18
41.82
100.00
49.22
3.36
28.04
10.61
91.23
5.10
3.67
8.77
100.00
389.9
80.0
601.1
-
1,071.0
497.9
573.1
-
35.1
35.1
-
35.1
1,106.1
497.9
608.2
1,724.1
-
970.0
-
2,694.1
350.1
2,344.0
-
10.8
10.8
10.8
-
2,704.9
360.9
2,344.0
1,211.5
92.0
600.0
265.0
2,168.5
100.0
2,068.5
35.0
-
35.0
-
35.0
2,203.5
100.0
2,103.5
2,027.9
-
330.0
393.8
2,751.7
75.0
2,676.7
84.6
400.0
484.6
-
484.6
3,236.3
75.0
3,161.3
980.0
-
979.8
-
1,959.8
-
1,959.8
-
200.0
200.0
-
200.0
2,159.8
-
2,159.8
2012 2011 2010 2009 2008
(Rs. in million)
36
(Rs. In million) As %age of Funded As %age of Funded & Non-Funded
w w w . s a u d i p a k . c o m

Disbursement: By type of assistance
Long Term Finance/FTCs
Lease Finance
Short Term Finance
Direct Equity/Investment/Placement
Investment in Associated Company
Share taken up against underwriting
Total
Sector
Financial Services
Power/Oil & Gas
Agro Based
Manufacturing
Services
Total
*Excluding underwriting and guarantees
208.2
-
448.0
-
-
-
656.2
1,980.3
92.0
605.5
-
-
19.3
2,697.1
1,338.5
-
544.4
15.0
250.0
-
2,147.9
3,536.7
46.1
707.3
93.8
225.0
18.4
4,627.3
609.0
-
624.9
-
-
-
1,233.9
2
1
-
3
2
8
400.0
500.0
-
509.8
550.0
1,959.8
20.41
25.51
-
26.01
28.07
100.00
160
66
16
534
58
834
8,996.5
5,658.3
724.2
29,260.6
4,664.1
49,303.7
18.25
11.48
1.47
59.34
9.46
100.00
2012
No.
2012(Rs. in million)
(Rs. in million)
Since inception to 31-12-2012
Amount % No. Amount %
2011 2010 2009 2008
26,075.1
1,743.3
14,079.7
1,827.4
4,030.6
363.4
48,119.5
Since Inception
to 31-12-2012
37
Net Financing and Investment Approved*: Sector Exposure
Sector Exposure Mode-wise-Financing
4%
14%
7%
5%
6%
3%
2%
3%
22%
9%
5%
20%
Sugar/ AlliedMisc.Textile Tourism/ HospitalityBank/ Lease/Mod.Automobile CementChem./Fert./ Pharma.Construction Real EstateBasic & Metal ProductsEnergy/Oil/ Gas/PowerTelecom
2%9%22%3%7%3%6%14%5%5%20%4%
Short Term Lease FinancingTFCsLong Term
12%2%20%66%
12%
2%
20%
66%
Position as of December 31, 2012
Saudi Pak Industrial & Agricultural Investment Company Limited
38
The statement is being presented to comply with the Code of Corporate Governance framed by the Securities and Exchange Commission of Pakistan, and made applicable to the Company through Regulation G-1 of the Prudential Regulations for Corporate/Commercial Banking issued by the State Bank of Pakistan.
The Company has applied the principles contained in the Code in the following manner:
1. The Board of Directors of the Company is appointed by the Governments of Islamic Republic of Pakistan and Kingdom of Saudi Arabia. At December 31, 2012 the Board has six non-executive directors.
2. The directors have confirmed that none of them is serving as a director in more than seven listed companies, including this Company.
3. All the resident directors of the Company are registered as taxpayers and none of them has defaulted in payment of any loan to a banking company, a DFI or NBFI or, being a member of a stock exchange, has been declared as a defaulter by that stock exchange.
4. No causal vacancy occurred on the Board during the year ended December 31, 2012. Government of Pakistan replaced two directors during the year 2012 and one director was replaced in March 2013.
5. The business of the Company is conducted in accordance with the “Code of Conduct” approved by the Board of Directors. The same has been circulated to all the Directors and employees. It has been placed on the intranet.
6. The Board has developed a vision / mission statement, overall corporate strategy and significant policies of the Company. A complete record of particulars of significant policies has been maintained.
7. All the powers of the Board have been duly exercised and decisions on material transactions, including appointment and determination of remuneration and terms and conditions of employment of the General Manager/Chief Executive, have been taken by the Board.
8. The meetings of the Board were presided over by the Chairman and the Board met at least once in every quarter. Written notices of the Board meetings, along with agenda and working papers, were circulated at least seven days before the meetings. The minutes of the meetings were appropriately recorded and circulated.
9. The Directors are conversant of the relevant laws applicable to the Company, its policies and procedures and provisions of memorandum and articles of association and are aware of their duties and responsibilities. The Company has also carried out orientation course for the Directors.
10. The meetings of the Audit Committee were held in every quarter prior to approval of interim and final results as required by the Code. The Terms of Reference of the Committee were fully complied with.
Statement of Compliance withCode of Corporate Governance
11. The Directors’ Report for this year has been prepared in compliance with the requirements of the Code of Corporate Governance and fully describes the salient matters required to be disclosed.
12. During the year Board appointed Head of Internal Audit and approved his remuneration.
13. General Manager/Chief Executive and CFO duly endorsed the financial statements of the Company before approval of the Board.
14. The Directors, General Manager/Chief Executive and executives do not hold any interest in the shares of the Company except for 1,250 shares held by the Chairman.
15. The Company has complied with all the corporate and financial reporting requirements of the Code of Corporate Governance.
16. The Board has formed an Audit Committee comprising of three members all of whom are non-executive directors.
17. The Board has formed Human Resource and Remuneration Committee comprising of three directors and GM/CE.
18. The Board has set-up an effective internal audit function on full time basis.
19. The statutory auditors of the Company have confirmed that they have been given a satisfactory rating under Quality Control Review program of the Institute of Chartered Accountants of Pakistan, that they or any of the partners of the firm, their spouses and minor children do not hold shares of the company and that the firm and all its partners are in compliance with International Federation of Accountants (IFAC) guidelines on code of ethics, as adopted by Institute of Chartered Accountants of Pakistan.
20. The statutory auditors or the persons associated with them have not been appointed to provide other services and the auditors have confirmed that they have observed IFAC guidelines in this regard.
21. The related party transactions have been placed before the audit committee and approved by the Board of Directors to comply with requirements of Code of Corporate Governance.
22. We confirm that all other material principles contained in the Code have been complied with.
For and on behalf of the Board of Directors
ChairmanIslamabadDated: April 08, 2013
w w w . s a u d i p a k . c o m
39
1. The Board of Directors of the Company is appointed by the Governments of Islamic Republic of Pakistan and Kingdom of Saudi Arabia. At December 31, 2012 the Board has six non-executive directors.
2. The directors have confirmed that none of them is serving as a director in more than seven listed companies, including this Company.
3. All the resident directors of the Company are registered as taxpayers and none of them has defaulted in payment of any loan to a banking company, a DFI or NBFI or, being a member of a stock exchange, has been declared as a defaulter by that stock exchange.
4. No causal vacancy occurred on the Board during the year ended December 31, 2012. Government of Pakistan replaced two directors during the year 2012 and one director was replaced in March 2013.
5. The business of the Company is conducted in accordance with the “Code of Conduct” approved by the Board of Directors. The same has been circulated to all the Directors and employees. It has been placed on the intranet.
6. The Board has developed a vision / mission statement, overall corporate strategy and significant policies of the Company. A complete record of particulars of significant policies has been maintained.
7. All the powers of the Board have been duly exercised and decisions on material transactions, including appointment and determination of remuneration and terms and conditions of employment of the General Manager/Chief Executive, have been taken by the Board.
8. The meetings of the Board were presided over by the Chairman and the Board met at least once in every quarter. Written notices of the Board meetings, along with agenda and working papers, were circulated at least seven days before the meetings. The minutes of the meetings were appropriately recorded and circulated.
9. The Directors are conversant of the relevant laws applicable to the Company, its policies and procedures and provisions of memorandum and articles of association and are aware of their duties and responsibilities. The Company has also carried out orientation course for the Directors.
10. The meetings of the Audit Committee were held in every quarter prior to approval of interim and final results as required by the Code. The Terms of Reference of the Committee were fully complied with.
11. The Directors’ Report for this year has been prepared in compliance with the requirements of the Code of Corporate Governance and fully describes the salient matters required to be disclosed.
12. During the year Board appointed Head of Internal Audit and approved his remuneration.
13. General Manager/Chief Executive and CFO duly endorsed the financial statements of the Company before approval of the Board.
14. The Directors, General Manager/Chief Executive and executives do not hold any interest in the shares of the Company except for 1,250 shares held by the Chairman.
15. The Company has complied with all the corporate and financial reporting requirements of the Code of Corporate Governance.
16. The Board has formed an Audit Committee comprising of three members all of whom are non-executive directors.
17. The Board has formed Human Resource and Remuneration Committee comprising of three directors and GM/CE.
18. The Board has set-up an effective internal audit function on full time basis.
19. The statutory auditors of the Company have confirmed that they have been given a satisfactory rating under Quality Control Review program of the Institute of Chartered Accountants of Pakistan, that they or any of the partners of the firm, their spouses and minor children do not hold shares of the company and that the firm and all its partners are in compliance with International Federation of Accountants (IFAC) guidelines on code of ethics, as adopted by Institute of Chartered Accountants of Pakistan.
20. The statutory auditors or the persons associated with them have not been appointed to provide other services and the auditors have confirmed that they have observed IFAC guidelines in this regard.
21. The related party transactions have been placed before the audit committee and approved by the Board of Directors to comply with requirements of Code of Corporate Governance.
22. We confirm that all other material principles contained in the Code have been complied with.
For and on behalf of the Board of Directors
ChairmanIslamabadDated: April 08, 2013
Saudi Pak Industrial & Agricultural Investment Company Limited

40
Statement on Internal ControlsThe guidelines on Internal Controls issued by State Bank of Pakistan vide their BSD Circular No. 7 of May 07, 2004 require that all Banks / DFIs shall include a Statement on Internal Controls in their Annual Report which would also include Board of Directors’ endorsement. The statement on Internal Controls is presented as under:
“The Company’s management is responsible to establish and maintain an adequate and effective system of internal controls and procedures. The management is also responsible for evaluating the effectiveness of the Company’s internal control system that encompasses material matters by identifying control objective and reviewing significant policies and procedures.
The control activities are being closely monitored across the Company through Audit Department, working independent of line management. In addition, Compliance Department is also in place to monitor control activi-ties related to regulatory compliance. The Audit Committee of the Board regularly reviews audit reports both internal and external where significant violations to the local regulations, prescribed policies and procedures have occurred. Regular follow up reporting upon the audit reports is done by Compliance Department which ensures timely implementations of audit/inspection reports to mitigate identified risks to safeguard the interest of the Company.
The Company’s internal control system has been designed to provide reasonable assurance to the Company’s management and Board of Directors. All internal control systems, no matter how well designed, have inherent limitations that they may not prevent or detect misstatements. Also, projections of any evaluation of effective-ness to future periods are subject to the risk that controls may become inadequate because of changes in condi-tions or that the degree of compliance with the policies or procedures may deteriorate. However, control activities are ongoing process that includes identification, evaluation and management of significant risks faced by the Company.
During the year 2012 the Company endeavored to follow the guidelines on Internal Controls.
The Board is periodically briefed on the Internal Controls working in the Company. The Board endorses the efficacy of the Company’s Internal Controls.”
For and on behalf of the Board of Directors
Chairman
IslamabadDated: April 08, 2013
w w w . s a u d i p a k . c o m
41
We have reviewed the Statement of Compliance with the best practices contained in the Code of Corporate Governance prepared by the Board of Directors of Saudi Pak Industrial and Agricultural Investment Company Limited (“the Company”) to comply with the Regulation G-I of the Prudential Regulations for Corporate/ Commercial Banking issued by the State Bank of Pakistan.
The responsibility for compliance with the Code of Corporate Governance is that of the Board of Directors of the Company. Our responsibility is to review, to the extent where such compliance can be objectively verified, whether the Statement of Compliance reflects the status of the Company’s compliance with the provisions of the Code of Corporate Governance and report if it does not. A review is limited primarily to inquiries of the Company personnel and review of various documents prepared by the Company to comply with the Code.
As per of our audit of financial statement we are required to obtain an understanding of the accounting and internal control systems sufficient to plan the audit and develop an effective audit approach. We are not required to consider whether the Board’s statement on internal control covers all risks and controls, or to form an opinion on the effectiveness of such internal controls, the Company’s corporate governance procedures and risks.
Further, Code of Corporate Governance requires the Company to place before the board of directors for their consideration and approval related party transactions distinguishing between transactions carried out on terms equivalent to those that prevail in arm’s length transactions and transactions which are not executed at arm’s length prices recording proper justification for using such alternate pricing mechanism. Further, all such trans-actions are also required to be separately placed before the audit committee. We are only required and have ensured compliance of requirement to the extent of approval of related party transactions by the board of direc-tors and placement of such transactions before the audit committee. We have not carried out any procedures to determine whether the related party transactions were undertaken at arm’s length price or not.
Based on our review, nothing has come to our attention, which causes us to believe that the Statement of Compliance does not appropriately reflect the Company’s compliance, in all material respects, with the best practices contained in the Code of Corporate Governance as applicable to the Company for the year ended 31 December 2012.
Islamabad
Date: April 08, 2013 KPMG Taseer Hadi & Co. Chartered Accountants Engagement Partner: Riaz Pesnani
Review Report to the MembersOn Statement of Compliance With The Best Practices of Code of Corporate Governance
Saudi Pak Industrial & Agricultural Investment Company Limited

42
FinancialStatements2012
w w w . s a u d i p a k . c o m
43
Auditors’ Report to the MembersWe have audited the annexed unconsolidated statement of financial position of Saudi Pak Industrial and Agricultural Invest-ment Company Limited (“the Company”) as at December 31, 2012 and the related unconsolidated profit and loss account, unconsolidated statement of comprehensive income, unconsolidated cash flow statement and unconsolidated statement of changes in equity together with the notes forming part thereof (here-in-after-referred to as the ‘unconsolidated financial statements’) for the year then ended, and we state that we have obtained all the information and explanations which, to the best of our knowledge and belied, were necessary for the purposes of our audit.
It is the responsibility of the Company’s management to establish and maintain a system of internal control, and prepare and present the above said statements in conformity with the approved accounting standards and the requirements of the Companies Ordinance 1984. Our responsibility is to express an opinion on these statements based on out audit.
We conducted our audit in accordance with the auditing standards as applicable in Pakistan. These standards require that we plan and perform the audit to obtain reasonable assurance about whether the above said statements are free of any material misstatement. An audit includes examining, on a test basis, evidence supporting the amounts and disclosures in the above said statements. An audit also includes assessing the accounting policies and significant estimates made by management, as well as, evaluating the overall presentation of the above said statements. We believe that our audit provides a reasonable basis for our opinion and, after due verification, we report that:
a) In our opinion, proper books of account have been kept by the Company as required by the Companies Ordinance, 1984;
b) In our opinion –
i) The unconsolidated statement of financial position and unconsolidated profit and loss account together with the notes thereon have been drawn up in conformity with the Companies Ordinance, 1984 and are in agreement with books of account and are further in accordance with accounting policies consistently applied;
ii) The expenditure incurred during the year was for the purpose of the Company’s business; and
iii) The business conducted, investments made and the expenditure incurred during the year were in accord-ance with the objects of the Company;
c) In our opinion and to the best of our information and according to the explanations given to us, the unconsolidated statement of financial position, unconsolidated profit and loss account, unconsolidated statement of comprehen-sive income, unconsolidated cash flow statement and unconsolidated statement of changes in equity together with the notes forming part thereof conform with approved accounting standards as applicable in Pakistan, and give the information required by the Companies Ordinance, 1984 in the manner so required and respectively given a true and fair view of the state of the Company’s affairs as at December 31,2012 and of the profit, its and cash flows and changes in equity for the year then ended; and
d) In our opinion no zakat was deductible at source under the Zakat and Ushr Ordinance, 1980 (XVIII of 1980).
We draw attention to note 10.5 to the unconsolidated financial statements wherein it is stated that the Board of Directors decided to convert the interest free subordinated loan to a related party into preference shares. The approval of State Bank of Pakistan (SBP) for conversion of subordinated loan into equity expired on December 31, 2012. The Company vide its letter dated May 22, 2012 has applied to SBP for extension for conversion of subordi-nated loan into equity till December 31, 2012.
Our opinion is not qualified on this matter.
Islamabad
Date: April 08, 2013 KPMG Taseer Hadi & Co. Chartered Accountants Engagement Partner: Riaz Pesnani
Saudi Pak Industrial & Agricultural Investment Company Limited
44
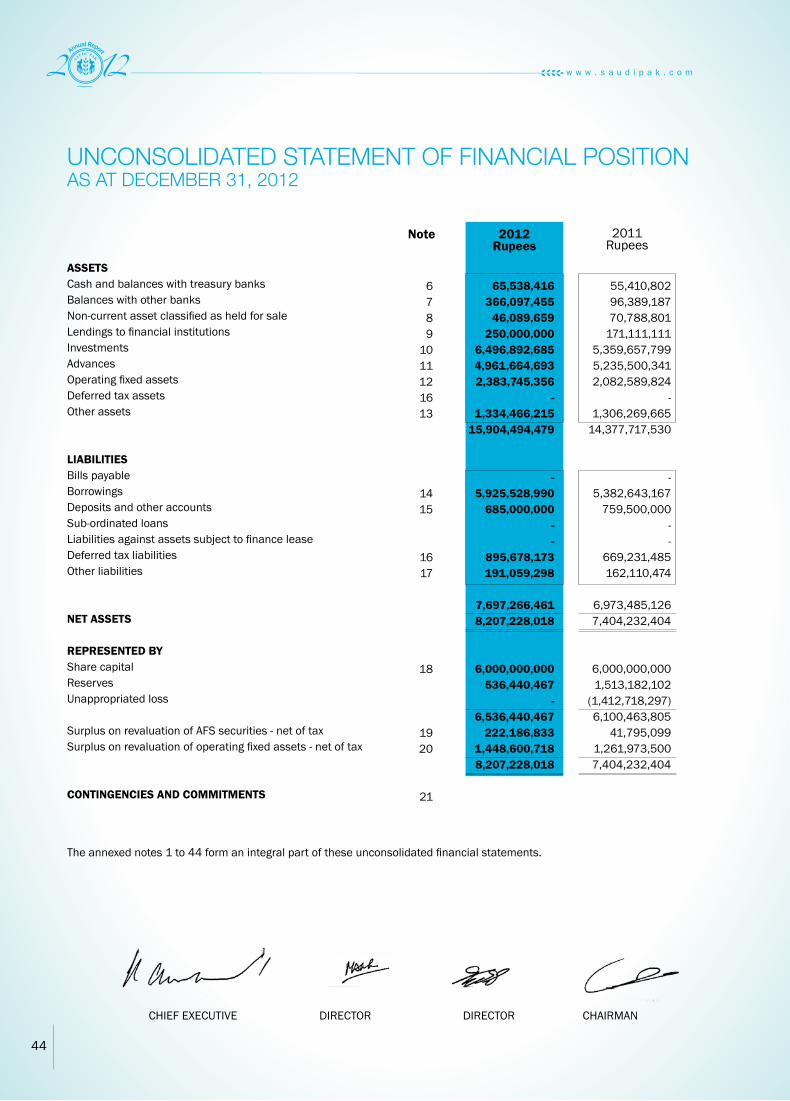
UNCONSOLIDATED STATEMENT OF FINANCIAL POSITION AS AT DECEMBER 31, 2012
ASSETSCash and balances with treasury banksBalances with other banksNon-current asset classified as held for saleLendings to financial institutionsInvestments Advances Operating fixed assetsDeferred tax assets Other assets
LIABILITIESBills payableBorrowingsDeposits and other accountsSub-ordinated loansLiabilities against assets subject to finance leaseDeferred tax liabilitiesOther liabilities
NET ASSETS
REPRESENTED BYShare capitalReservesUnappropriated loss
Surplus on revaluation of AFS securities - net of taxSurplus on revaluation of operating fixed assets - net of tax
CONTINGENCIES AND COMMITMENTS
6789
1011121613
1415
1617
18
1920
21
65,538,416 366,097,455
46,089,659 250,000,000
6,496,892,685 4,961,664,693 2,383,745,356
- 1,334,466,215
15,904,494,479
- 5,925,528,990
685,000,000 - -
895,678,173 191,059,298
7,697,266,461 8,207,228,018
6,000,000,000 536,440,467
- 6,536,440,467
222,186,833 1,448,600,718 8,207,228,018
55,410,802 96,389,187 70,788,801
171,111,111 5,359,657,799 5,235,500,341 2,082,589,824
- 1,306,269,665
14,377,717,530
- 5,382,643,167
759,500,000 - -
669,231,485 162,110,474
6,973,485,126 7,404,232,404
6,000,000,000 1,513,182,102
(1,412,718,297) 6,100,463,805
41,795,099 1,261,973,500 7,404,232,404
2012Rupees
2011Rupees
Note
The annexed notes 1 to 44 form an integral part of these unconsolidated financial statements.
CHIEF EXECUTIVE DIRECTOR DIRECTOR CHAIRMAN
45
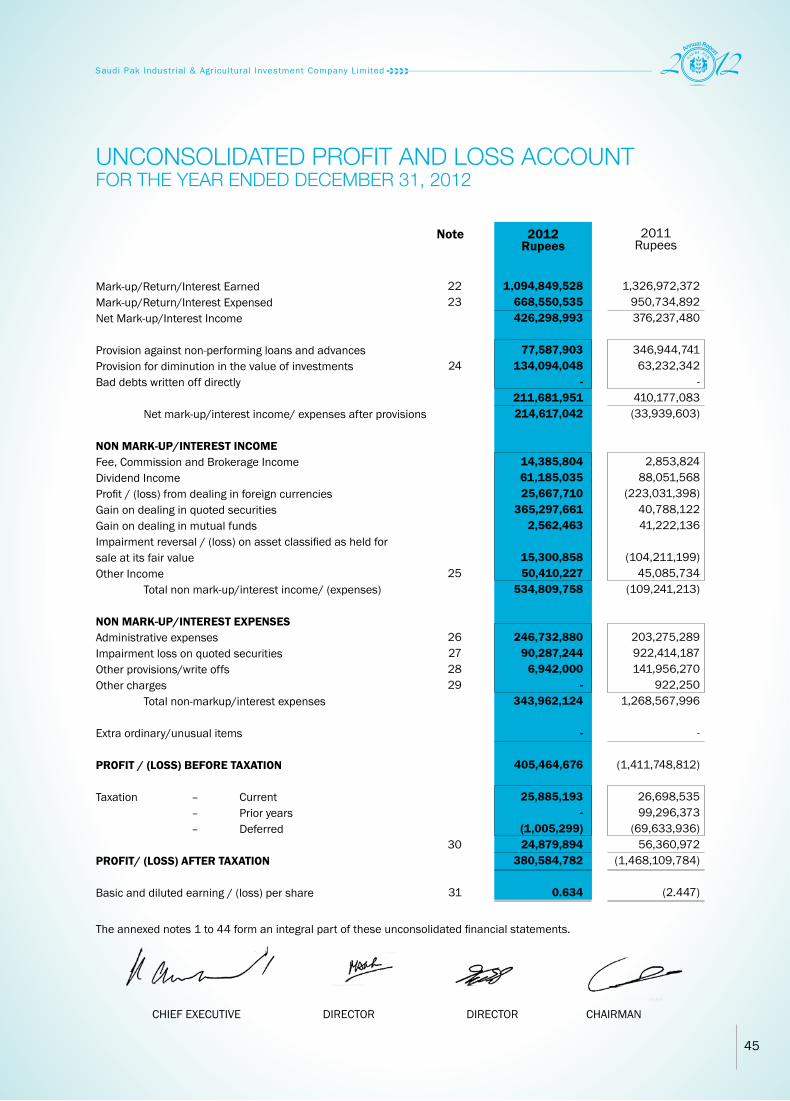
UNCONSOLIDATED PROFIT AND LOSS ACCOUNT FOR THE YEAR ENDED DECEMBER 31, 2012
Mark-up/Return/Interest EarnedMark-up/Return/Interest Expensed Net Mark-up/Interest Income Provision against non-performing loans and advancesProvision for diminution in the value of investmentsBad debts written off directly Net mark-up/interest income/ expenses after provisions NON MARK-UP/INTEREST INCOME Fee, Commission and Brokerage IncomeDividend IncomeProfit / (loss) from dealing in foreign currenciesGain on dealing in quoted securitiesGain on dealing in mutual fundsImpairment reversal / (loss) on asset classified as held for sale at its fair value Other Income Total non mark-up/interest income/ (expenses) NON MARK-UP/INTEREST EXPENSES Administrative expensesImpairment loss on quoted securitiesOther provisions/write offsOther charges Total non-markup/interest expenses Extra ordinary/unusual items PROFIT / (LOSS) BEFORE TAXATION Taxation – Current – Prior years – Deferred PROFIT/ (LOSS) AFTER TAXATION Basic and diluted earning / (loss) per share
2223
24
25
26272829
30
31
1,094,849,528 668,550,535 426,298,993
77,587,903 134,094,048
- 211,681,951 214,617,042
14,385,804 61,185,035 25,667,710
365,297,661 2,562,463
15,300,858 50,410,227
534,809,758
246,732,880 90,287,244
6,942,000 -
343,962,124
-
405,464,676
25,885,193 -
(1,005,299) 24,879,894
380,584,782
0.634
1,326,972,372 950,734,892 376,237,480
346,944,741 63,232,342
- 410,177,083 (33,939,603)
2,853,824 88,051,568
(223,031,398) 40,788,122 41,222,136
(104,211,199)
45,085,734 (109,241,213)
203,275,289 922,414,187 141,956,270
922,250 1,268,567,996
-
(1,411,748,812)
26,698,535 99,296,373
(69,633,936) 56,360,972
(1,468,109,784)
(2.447)
2012Rupees
2011Rupees
Note
The annexed notes 1 to 44 form an integral part of these unconsolidated financial statements.
CHIEF EXECUTIVE DIRECTOR DIRECTOR CHAIRMAN

46
UNCONSOLIDATED STATEMENT OF COMPREHENSIVE INCOMEFOR THE YEAR ENDED DECEMBER 31, 2012
Profit/ (Loss) after taxation
Other comprehensive income
Reversal of capital reserves relating to rescheduling benefits
Comprehensive income transferred to equity
Components of comprehensive income not reflected in equity
Surplus on revaluation of available-for-sale securitiesDeferred tax
Total comprehensive income/ (loss)
380,584,782
-
380,584,782
277,525,745 (97,134,011)
180,391,734
560,976,516
(1,468,109,784)
-
(1,468,109,784)
434,097,119 (151,933,992)
282,163,127
(1,185,946,657)
2012Rupees
2011Rupees
The annexed notes 1 to 44 form an integral part of these unconsolidated financial statements.
CHIEF EXECUTIVE DIRECTOR DIRECTOR CHAIRMAN

47
UNCONSOLIDATED CASH FLOW STATEMENTFOR THE YEAR ENDED DECEMBER 31, 2012
CASH FLOW FROM OPERATING ACTIVITIES Profit/ (Loss) before taxation Less: dividend income Adjustments:Depreciation / AmortizationProvision against non-performing loans and advancesProvision for diminution in the value of investmentsOther provisions/write offsAdvances written offImpairment loss on quoted securitiesReversal of impairment on AFS securities Net gain on disposal of operating fixed assets - property and equipment Provision for gratuityProvision for compensated absencesImpairment (reversal) / loss on asset classified as held for sale at its fair value
Decrease / (increase) in operating assets Lendings to financial institutionsAdvances Other assets Increase / (decrease) in operating liabilities Borrowings from financial institutionsDeposits Other liabilitiesDeferred liabilities - advance rental income
Gratuity paidCompensated absences paidIncome tax paid Net cash generated from/ (used in) operating activities CASH FLOW FROM INVESTING ACTIVITIES Investment in Available-For-Sale (AFS) securities Investment in Held-To-Maturity (HTM) securities Receipt against sale of shares in Saudi Pak Insurance Company Limited Dividend received Investment in operating fixed assets Sale proceeds on disposal of operating fixed assets - property and equipment Net cash (used in) / generated from investing activities CASH FLOW FROM FINANCING ACTIVITIES Increase/ (decrease) in cash and cash equivalents Cash and cash equivalents at beginning of the year Cash and cash equivalents at end of the year 32
405,464,676 (61,185,035) 344,279,641
109,195,536 77,587,903 71,244,908
6,942,000 (115,161,874)
90,287,244 (941,489,815)
(8,581,204) 6,393,547 1,207,343
(15,300,858) (717,675,270) (373,395,629)
(78,888,889) 311,409,619
28,188,002 260,708,732
542,885,823 (74,500,000)
(1,097,987) 29,072,437
496,360,273 383,673,376
(5,431,250) (1,195,269)
(88,906,742) (95,533,261) 288,140,115
(659,917,213) 582,665,735
40,000,000 60,880,035
(40,758,556) 8,825,766
(8,304,233)
- 279,835,882 151,799,989 431,635,871
(1,411,748,812) (88,051,568)
(1,499,800,380)
112,763,022 346,944,741 63,232,342
141,956,270 -
922,414,187 (129,362,821)
(4,152,110) 5,629,355 2,771,365
104,211,199 1,566,407,550
66,607,170
283,671,639 761,558,944 (57,759,572) 987,471,011
(1,755,290,927) (895,402,252)
(58,421,362) (2,327,984)
(2,711,442,525) (1,657,364,344)
(6,194,153) (1,132,659)
(86,837,300) (94,164,112)
(1,751,528,456)
1,391,114,003 129,530,327
50,000,000 88,051,568
(19,367,412) 4,821,111
1,644,149,597
- (107,378,859)
259,178,848 151,799,989
2012Rupees
2011Rupees
Note
The annexed notes 1 to 44 form an integral part of these unconsolidated financial statements.
CHIEF EXECUTIVE DIRECTOR DIRECTOR CHAIRMAN

48
UNCONSOLIDATED STATEMENT OF CHANGES IN EQUITY FOR THE YEAR ENDED DECEMBER 31, 2012
Balance as at January 01, 2011
Loss for the year
Total comprehensive loss
Appropriation from reserve fund
Transferred from surplus on revaluation of
operating fixed assets - net of deferred tax
Balance as at December 31, 2011
Balance as at January 01, 2012
Profit for the year
Total comprehensive income
Appropriation from reserve fund
Transfer to reserve fund *
Transfer to general reserve
Transferred from surplus on revaluation of
operating fixed assets - net of deferred tax
Balance as at December 31, 2012
6,000,000,000
-
-
-
-
6,000,000,000
6,000,000,000
-
-
-
-
6,000,000,000
1,961,641,045
-
-
(448,458,943)
-
1,513,182,102
1,513,182,102
-
-
(1,412,718,297)
76,116,956
-
176,580,761
-
-
-
-
-
-
-
-
-
-
359,859,706
-
359,859,706
(448,458,943)
(1,468,109,784)
(1,468,109,784)
448,458,943
55,391,487
(1,412,718,297)
(1,412,718,297)
380,584,782
380,584,782
1,412,718,297
(76,116,956)
(359,859,706)
55,391,880
-
7,513,182,102
(1,468,109,784)
(1,468,109,784)
-
55,391,487
6,100,463,805
6,100,463,805
380,584,782
380,584,782
-
-
-
55,391,880
6,536,440,467
Share Capital Rupees
Reserve Fund
Rupees
General Reserve Rupees
Unappropriated (Loss) / Profit
Rupees
Total Rupees
* Under Circular No 1 dated December 05, 1991 issued by the State Bank of Pakistan for Non-Banking Financial Institutions, an amount not less than 20% of the profit shall be transferred to create a reserve fund till such time the reserve fund equals the amount of paid up capital and thereafter 10% of the balance of profit of the company are to be transferred to this reserve.
The annexed notes 1 to 44 form an integral part of these unconsolidated financial statements.
CHIEF EXECUTIVE DIRECTOR DIRECTOR CHAIRMAN
49
NOTES TO THE UNCONSOLIDATED FINANCIAL STATEMENTS FOR THE YEAR ENDED DECEMBER 31, 2012
1 LEGAL STATUS AND OPERATIONS Saudi Pak Industrial and Agricultural Investment Company Limited (the “Company”) was incorporated in Pakistan
as a private limited company on December 23, 1981 and subsequently converted as a public limited company on April 30, 2008. The Company is jointly sponsored by the Governments of Kingdom of Saudi Arabia and the Islamic Republic of Pakistan. The principal activity of the Company is to invest in the industrial and agro-based industrial projects in Pakistan on commercial basis and market their products in Pakistan and abroad. The Company has been setup for a period of fifty years which may be extended with approval of both of the Governments.
The registered office of the Company is situated at Saudi Pak Tower, Jinnah Avenue, Islamabad.
2 BASIS OF PRESENTATION These unconsolidated financial statements have been presented in accordance with the requirements of format
prescribed by the State Bank of Pakistan’s BSD Circular No.4 dated February 17, 2006. These unconsolidated financial statements are separate financial statements of the Company in which the
investments in subsidiaries and associate are stated at cost less impairment, if any and have not been accounted for on the basis of reported results and net assets of the investees which is done in consolidated financial statements.
2.1 Functional and presentation currency Items included in the unconsolidated financial statements are measured using the currency of the primary economic
environment in which the Company operates. The unconsolidated financial statements are presented in Pak. Rupees, which is the Company’s functional currency.
3 STATEMENT OF COMPLIANCE
3.1 These unconsolidated financial statements have been prepared in accordance with approved accounting standards as applicable in Pakistan and the requirements of the Companies Ordinance, 1984 and the Banking Companies Ordinance, 1962. Approved accounting standards comprise of such International Financial Reporting Standards (IFRS) issued by the International Accounting Standard Board as are notified under the Companies Ordinance, 1984, provisions of and directives issued under the Companies Ordinance, 1984 or directives issued by the Securities and Exchange Commission of Pakistan and the State Bank of Pakistan (SBP). In case the requirements differ, the provisions of and directives issued under the Companies Ordinance, 1984 and the Banking Companies Ordinance, 1962 and the directives issued by SBP shall prevail.
3.2 The SBP through its BSD Circular Letter No. 11 dated September 11, 2002 has deferred the implementation of International Accounting Standard (IAS) 39, “Financial Instruments: Recognition and Measurement” and IAS 40, “Investment Property” for Development Financial Institutions (DFIs) till further instructions. According to the notification of SECP dated April 28, 2008, the IFRS 7 “Financial Instruments’ Disclosures” has not been made applicable for DFIs. In view of above, the requirements of these standards have not been considered in the preparation of these unconsolidated financial statements. The investments have been classified and valued in accordance with the requirements prescribed by the State Bank of Pakistan through various circulars.
4 BASIS OF MEASUREMENT These unconsolidated financial statements have been prepared under the historical cost convention except for:
– revaluation of certain items of operating fixed assets; – revaluation of certain investments in accordance with directives of State Bank of Pakistan; and – recognition of certain employee benefits at present value.
Use of critical accounting estimates and judgments
The preparation of unconsolidated financial statements in conformity with the approved accounting standards requires the use of certain critical accounting estimates. It also requires the management to exercise its judgment
50
in the process of applying the Company’s accounting policies. The Company uses estimates and assumptions concerning the future. The resulting accounting estimate will, by definition, seldom equal the related actual results. Estimates and judgments are continually evaluated and are based on historical experience and other factors, including expectations of future events that are believed to be reasonable under the circumstances. The areas involving a higher degree of judgment or complexity, or areas where assumptions and estimates are significant to these unconsolidated financial statements are as follows:
(a) Classification of investments – Held-For-Trading (HFT) In classifying investments as ‘held-for-trading’, the Company has determined securities which are acquired
with an intention to trade by taking advantage of short term market / interest rate movements and are to be sold within 90 days.
– Held-To-Maturity (HTM) In classifying investments as ‘held-to-maturity’, the Company follows the guidance provided in SBP circulars
on classifying non-derivative financial assets with fixed or determinable payments and fixed maturity. In making this judgment, the Company evaluates its intention and ability to hold such investment to maturity.
– Available-For-Sale (AFS) The investments which are not classified as ‘held-for-trading’ or ‘held-to-maturity’ are classified as ‘available-
for-sale’.
(b) Provision against non performing loans and advances The Company reviews its loan portfolio to assess amount of non-performing advances and provisions
required there against on regular basis. While assessing this requirement various factors including the delinquency in the account, financial position of the borrowers and the requirements of the Prudential Regulations are considered. The amount of general provision is determined in accordance with the management’s judgment.
(c) Valuation and impairment of ‘available-for-sale’ equity investments The Company determines that ‘available-for-sale’ equity investments are impaired when there has been a significant or prolonged decline in the fair value below its cost. The determination of what is significant or prolonged requires judgment. In making this judgment, the Company evaluates among other factors, the normal volatility in share price. In addition, the impairment may be appropriate when there is an evidence of deterioration in the financial health of the invested industry and sector performance, changes in technology and operational/financial cash flows.
(d) Taxation In making the estimates for income taxes currently payable by the Company, the management considers
the current income tax laws and the decisions of appellate authorities on certain issues in the past.
(e) Fair value of derivatives The fair values of derivatives which are not quoted in active markets are determined by using valuation
techniques. The valuation techniques take into account the relevant interest rates at the date of unconsolidated statement of financial position and the rates contracted.
(f) Depreciation, amortization and revaluation of operating fixed assets / intangible assets In making estimates of the depreciation / amortization method, the management uses the method which reflects the pattern in which economic benefits are expected to be consumed by the Company. The method applied is reviewed at each financial year end and if there is a change in the expected pattern of consumption of the future economic benefits embodied in the assets, the method is changed to reflect the changed pattern. Such change is accounted for as change in accounting estimates in accordance with International Accounting Standard (IAS) 8 “Accounting Policies, Changes in Accounting Estimates and Errors”. Further, the Company estimates the revalued amount of land and buildings on a regular basis. The estimates are based

51
on valuations carried out by independent professional valuers under the market conditions.
(g) Staff retirement benefits Certain actuarial assumptions have been adopted as disclosed in these unconsolidated financial statements
(refer note 34) for the actuarial valuation of staff retirement benefit plans. Actuarial assumptions are entity’s best estimates of the variables that will determine the ultimate cost of providing post employment benefits. Changes in these assumptions in future years may affect the liability / asset under these plans in those years.
(h) Impairment of investments in subsidiaries The Company determines that a significant or prolonged decline in the fair value of its investments in subsidiaries below their cost is an objective evidence of impairment. The impairment loss is recognised when higher of fair value less cost to sell and value in use exceeds the carrying value.
(i) Provision against other assets and receivables The Company reviews other assets and receivables to assess any amount of provision / bad debts required
there against on regular basis.
5 SUMMARY OF SIGNIFICANT ACCOUNTING POLICIES
5.1 Cash and cash equivalents Cash and cash equivalents comprise of cash and balances with treasury banks and balances with other banks in current and deposit accounts.
5.2 Sale and repurchase agreements Securities sold under repurchase agreement (repo) are retained in the unconsolidated financial statements as investments and a liability for consideration received is included in borrowings. Conversely, consideration for securities purchased under resale agreement (reverse repo) are included in lendings to financial institutions. The difference between sale and repurchase / purchase and resale price is recognised as mark-up / return expensed and earned on a time proportion basis as the case may be. Repo and reverse repo balances are reflected under borrowings from and lendings to financial institutions respectively.
5.3 Investments Investments are classified as follows:
(a) Held-For-Trading (HFT)
These represent securities acquired with the intention to trade by taking advantage of short-term market / interest rate movements. These are marked to market and surplus / deficit arising on revaluation of ‘held for trading’ investments is taken to unconsolidated profit and loss account in accordance with the requirements prescribed by the State Bank of Pakistan through various circulars.
(b) Held-To-Maturity (HTM) These represent securities acquired with the intention and ability to hold them upto maturity. These are carried at amortized cost less impairment, if any, in accordance with the requirements prescribed by the State Bank of Pakistan through various circulars.
(c) Available-For-Sale (AFS) These represent securities which do not fall under ‘held for trading’ or ‘held to maturity’ categories. In accordance with the requirements of the State Bank of Pakistan’s BSD Circular No. 20 dated August 04, 2000, available for sale securities for which ready quotations are available on Reuters Page (PKRV) or Stock Exchanges are valued at market value and the resulting surplus / deficit on revaluation net of deferred tax is kept in a separate account and is shown below the shareholders’ equity in the unconsolidated statement of financial position. Where the decline in prices of available for sale securities is significant or prolonged, it is considered impaired and included in unconsolidated profit and loss account.
Unquoted equity securities are valued at the lower of cost and break-up value. Break-up value of equity securities is calculated with reference to the net assets of the investee companies as per their latest available
52
financial statements. Investments in other unquoted securities are valued at cost less impairment losses, if any.
(d) Investments in subsidiaries Investments in subsidiaries are carried at cost less impairment, if any.
All purchases and sale of investment that require delivery within the time frame established by regulations or market convention are recognized at the trade date, which is the date the Company commits to purchase or sell the investments.
5.4 Advances Advances are stated net of provision for non-performing advances. Provision for non-performing advances is
determined in accordance with the requirements of the Prudential Regulations issued by State Bank of Pakistan from time to time.
The provision against non-performing advances is charged to the unconsolidated profit and loss account. Advances
are written off when there is no realistic prospect of recovery.
The SBP amended the Prudential Regulations in relation to provision for loans and advances thereby allowing further forced sale value (“FSV”) benefit. This change has been applied prospectively as required under International Accounting Standard IAS 8 “Accounting Policies, Changes in Accounting Estimates and Errors”. Related impact and disclosure is given in note 11.1.6.1.
5.5 Net investment in finance lease These are stated at present value of minimum lease payments under the agreements. The allowance for potential
lease losses is maintained at a level which in the opinion of management, is adequate to provide for potential lease losses on lease portfolio that can be reasonably anticipated. The allowance is increased by the provisions charged to income and decreased by write offs, net of recoveries. The Company maintains provision for potential lease losses in accordance with the Prudential Regulations applicable on the Company.
5.6 Operating fixed assets and depreciation/ amortization (a) Tangibles assets Tangible operating fixed assets are stated at cost less accumulated depreciation and impairment loss, if any,
except for freehold land which is stated at cost and lease hold land, buildings and certain other items which are carried at revalued amount less depreciation.
Certain items of tangible operating fixed assets are revalued by professionally qualified valuers with sufficient regularity to ensure that the net carrying amount does not differ materially from their fair value. Surplus / (deficit) arising on revaluation of fixed assets is credited/ (debited) to the surplus on revaluation of assets account and is shown below the shareholders’ equity in the unconsolidated statement of financial position.
Depreciation is provided on straight line method at rates specified in note 12.1 to the unconsolidated financial statements so as to write off the cost of the assets over their estimated useful lives. Depreciation of an asset begins when it is available for use. Depreciation of an asset ceases at the earlier of the date that the asset is classified as held for sale and the date that the asset is derecognized. Therefore, depreciation does not cease when the asset becomes idle or is retired from active use unless the asset is fully depreciated.
Maintenance and normal repairs are charged to unconsolidated profit and loss account as and when incurred. Major renewals and improvements are capitalized. Gains and losses on disposal of operating fixed assets are taken to the unconsolidated profit and loss account.
(b) Intangibles Intangible assets are stated at cost less accumulated amortization. Impairment losses, if any, is charged
to unconsolidated profit and loss account. Amortization is computed from the date of purchase to date of disposal / write off using the straight line method in accordance with the rates specified in note 12.2 to these unconsolidated financial statements to write off cost of the assets over their estimated useful lives.

53
(c) Capital work in progress
Capital work in progress is stated at cost less accumulated impairment losses, if any, and is transferred to the respective item of operating fixed assets when available for intended use.
5.7 Deposits Deposits are recorded at the fair value of proceeds received. Markup accrued on deposits is recognised separately
as part of other liabilities and is charged to profit and loss account on a time proportion basis.
5.8 Taxation Income tax on the profit or loss for the year comprises current and deferred tax. Income tax is recognised in the
unconsolidated profit and loss account, except to the extent that it relates to items recognised directly in equity or below equity / other comprehensive income, in which case it is recognised in equity or below equity / other comprehensive income.
(a) Current Provision for current taxation is the expected tax payable on the taxable income for the year using tax rates
applicable at the date of unconsolidated statement of financial position. The charge for the current tax also includes adjustments, where considered necessary relating to prior years, arising from assessments made during the year for such years.
(b) Deferred Deferred tax is provided for by using the balance sheet liability method, providing for temporary differences
between the carrying amounts of assets and liabilities for financial reporting purposes and the amount used for taxation purposes. The amount of deferred tax provided is based on the expected manner of realization or settlement of the carrying amount of assets and liabilities using tax rates enacted or substantially enacted at the date of unconsolidated statement of financial position, expected to be applicable at the time of its reversal. A deferred tax asset is recognised only to the extent that it is probable that the future taxable profit will be available and credits can be utilized. Deferred tax assets are reduced to the extent it is no longer probable that the related tax benefit will be realised.
The Company recognizes deferred tax asset/liability on (deficit)/surplus on revaluation of securities and revaluation of operating fixed assets in accordance with the requirement of International Accounting Standard (IAS) 12 “Income Taxes” which is adjusted against the related surplus / (deficit).
5.9 Provisions Provisions are recognised when there are present, legal or constructive obligations as a result of past events and
it is probable that an out flow of resources embodying economic benefits will be required to settle the obligation and a reliable estimate of the amounts can be made. Provision for guarantee claims and other off balance sheet obligations is recognized when intimated and reasonable certainty exists to settle the obligations. Expected recoveries are recognized by debiting customer accounts. Charge to unconsolidated profit and loss account is stated net off expected recoveries.
5.10 Staff retirement benefits
(a) Defined benefit plan
The Company operates an unfunded gratuity scheme for all of its permanent employees who have put in three years of continuous service with the Company. The actuarial valuation is carried out periodically using “Projected Unit Credit Method” as allowed under the International Accounting Standard (IAS) 19 “Employee Benefits”. A portion of the actuarial gains or losses is recognized over the expected remaining working life of its employees if the net cumulative unrecognized actuarial gains or losses at the end of the previous year exceeds the “corridor limit” which is defined as the greater of:
– 10% of the present value of the defined benefit obligation at that date (before deducting plan assets); and
54
– 10% of the fair value of any plan assets at that date. (b) Defined contribution plan
The Company also operates a recognized funded provident fund scheme for all of its permanent employees.
Equal monthly contributions at the rate of 10% of basic salary are made both by the Company and the employees, which are transferred to the provident fund.
(c) Compensated absences
As per its service rules, the Company grants compensated absences to all of its permanent employees. The provision for compensated absences is made on the basis of last drawn basic salary.
5.11 Revenue recognition – Mark-up/ interest on loans and advances and return on investments is recognized on accrual basis except on
classified advances which is recognized on receipt basis in compliance with Prudential Regulations issued by the SBP.
– Markup/interest on rescheduled/ restructured loans and advances and return on investment is recognized in
accordance with the directives of the SBP. – Unrealized income is held in suspense account, where necessary, in accordance with the requirements of
SBP guidelines and recognized as income on receipt basis. – Fees, commission and brokerage income is recognised at the time of performance of service. – Dividend income is recognized when the Company’s right to receive income is established.
– The Company follows the finance method to recognize income from lease financing. Under this method, the unearned lease income (excess of the sum of total lease rentals and estimated residual value over the cost of the leased assets) is deferred and taken to income over the term of lease period so as to produce a constant periodic rate of return on the outstanding net investment in lease. Gains/ losses on termination of lease contracts are recognized as income/expense when these are realized.
– Gains and losses on sale of investments are included in income currently.
– Gains and losses on disposal of operating fixed assets are taken to the unconsolidated profit and loss account.
5.12 Foreign currency transactions
Foreign currency transactions are translated into Pak. Rupee at the exchange rates prevailing on the date of
transaction. Monetary assets and liabilities in foreign currencies are translated to Pak. Rupee at the exchange rates prevailing at the date of unconsolidated statement of financial position. Exchange gains and losses are included in unconsolidated profit and loss account currently.
5.13 Impairment The carrying amount of the Company’s assets are reviewed at the date of unconsolidated statement of financial
position to determine whether there is any indication of impairment. If such indications exist, the asset’s recoverable amount is estimated in order to determine the extent of the impairment loss, if any. Impairment loss is recognised as expense in the unconsolidated profit and loss account. An impairment loss is reversed only to the extent that the asset’s carrying amount does not exceed the carrying amount that would have been determined, net of depreciation or amortization, if no impairment loss had been recognised.

55
5.14 Financial instruments
Financial assets and financial liabilities
Financial instruments carried on the unconsolidated statement of financial position include cash and balances with treasury banks, balances with other banks, lendings to financial institutions, investments, advances, other assets, bills payable, borrowings, deposits and other liabilities. The particular recognition methods adopted for significant financial assets and financial liabilities are disclosed in the individual policy statements associated with these assets and liabilities.
5.15 Off-setting of financial instruments
Financial assets and financial liabilities are only set-off and net amount is reported in the unconsolidated financial
statements when there is legally enforceable right to set-off the recognized amount and the Company either intends to settle on net basis or to settle the liabilities and realize the assets simultaneously.
5.16 Segment Reporting
A segment is a distinguishable component of the Company that is engaged either in providing differentiated products or services (business segment) or in providing products or services within a particular economic environment (geographical segment), subject to risks and rewards that are different from those of other segments. Segment information is presented as per the Company’s functional structure and the guidance of State Bank of Pakistan. The Company’s primary format of reporting is based on business segments. The Company comprises of the following main business segments: (a) Business Segment
– Corporate finance
This includes investment activities such as underwriting, Initial Public Offers (IPOs) and corporate financing.
– Trading and Sales Trading and sales includes the Company’s treasury and money market activities classified as held for trading.
– Building Rental Services
This segment undertakes the rental services of Saudi Pak Tower and its allied activities.
(b) Geographical Segment The Company conducts all its operations in Pakistan.
5.17 Non-current asset classified as held for sale The Company classifies a non-current asset as held for sale if its carrying amount will be recovered principally through a sale transaction rather than through continuing use. For this to be the case, the asset must be available for immediate sale in its present condition and its sale must be highly probable. For sale to be highly probable, the appropriate level of management must be committed to a plan to sell the asset and an active programme to locate a buyer and complete plan must have been initiated.
5.18 Forthcoming changes in approved accounting standards which are not yet effective The following standards, amendments and interpretations of approved accounting standards will be effective for accounting periods beginning on or after 01 January 2013: – IAS 19 Employee Benefits (amended 2011) - (effective for annual periods beginning on or after 1 January
2013). The amended IAS 19 includes the amendments that require actuarial gains and losses to be recognised immediately in other comprehensive income; this change will remove the corridor method and eliminate the ability for entities to recognise all changes in the defined benefit obligation and in plan assets in profit or loss, which currently is allowed under IAS 19; and that the expected return on plan assets recognised in profit or

56
loss is calculated based on the rate used to discount the defined benefit obligation. The amendments are not likely to have material impact on financial statements of the Company.
– Presentation of Items of Other Comprehensive Income (Amendments to IAS 1) - (effective for annual periods beginning on or after 1 July 2012). The amendments require that an entity present separately the items of other comprehensive income that would be reclassified to profit or loss in the future if certain conditions are met from those that would never be reclassified to profit or loss. The amendments do not address which items are presented in other comprehensive income or which items need to be reclassified. The requirements of other IFRSs continue to apply in this regard. These amendments have no impact on the financial statements of the Company.
– IAS 27 Separate Financial Statements (2011) - (effective for annual periods beginning on or after 1 January 2013). IAS 27 (2011) supersedes IAS 27 (2008). Three new standards IFRS 10 - Consolidated Financial Statements, IFRS 11- Joint Arrangements and IFRS 12- Disclosure of Interest in Other Entities dealing with IAS 27 would be applicable effective 1 January 2013. IAS 27 (2011) carries forward the existing accounting and disclosure requirements for separate financial statements, with some minor clarifications.
– IAS 28 Investments in Associates and Joint Ventures (2011) - (effective for annual periods beginning on or after 1 January 2013). IAS 28 (2011) supersedes IAS 28 (2008). IAS 28 (2011) makes the amendments to apply IFRS 5 to an investment, or a portion of an investment, in an associate or a joint venture that meets the criteria to be classified as held for sale; and on cessation of significant influence or joint control, even if an investment in an associate becomes an investment in a joint venture. The amendments have no impact on the financial statements of the Company.
– Offsetting Financial Assets and Financial Liabilities (Amendments to IAS 32) – (effective for annual periods
beginning on or after 1 January 2014). The amendments address inconsistencies in current practice when applying the offsetting criteria in IAS 32 Financial Instruments: Presentation. The amendments clarify the meaning of ‘currently has a legally enforceable right of set-off’; and that some gross settlement systems may be considered equivalent to net settlement.
– Offsetting Financial Assets and Financial Liabilities (Amendments to IFRS 7) – (effective for annual periods
beginning on or after 1 January 2013). The amendments to IFRS 7 contain new disclosure requirements for financial assets and liabilities that are offset in the statement of financial position or subject to master netting agreement or similar arrangement. This amendment is not likely to have any impact on the Company’s financial statements.
Annual Improvements 2009–2011 (effective for annual periods beginning on or after 1 January 2013). The new cycle of improvements contains amendments to the following four standards, with consequential amendments to other standards and interpretations:
a) IAS 1 Presentation of Financial Statements is amended to clarify that only one comparative period – which is the preceding period – is required for a complete set of financial statements. If an entity presents additional comparative information, then that additional information need not be in the form of a complete set of financial statements. However, such information should be accompanied by related notes and should be in accordance with IFRS. Furthermore, it clarifies that the ‘third statement of financial position’, when required, is only required if the effect of restatement is material to statement of financial position.
b) IAS 16 Property, Plant and Equipment is amended to clarify the accounting of spare parts, stand-by equipment and servicing equipment. The definition of ‘property, plant and equipment’ in IAS 16 is now considered in determining whether these items should be accounted for under that standard. If these items do not meet the definition, then they are accounted for using IAS 2 Inventories. The amendment is not likely to have any material impact on the financial statements.

57
c) IAS 32 Financial Instruments: Presentation - is amended to clarify that IAS 12 Income Taxes applies to the accounting for period taxes relating to distributions to holders of an equity instrument and transaction costs of an equity transaction. The amendment removes a perceived inconsistency between IAS 32 and IAS 12.
d) IAS 34 Interim Financial Reporting is amended to align the disclosure requirements for segment assets and segment liabilities in interim financial reports with those in IFRS 8 Operating Segments. IAS 34 now requires the disclosure of a measure of total assets and liabilities for a particular reportable segment. In addition, such disclosure is only required when the amount is regularly provided to the chief operating decision maker and there has been a material change from the amount disclosed in the last annual financial statements for that reportable segment. – IFRIC 20 Stripping cost in the production phase of a surface mining (effective for annual periods
beginning on or after 1 January 2013). The interpretation requires production stripping cost in a surface mine to be capitalized if certain criteria are met. This improvement is not relevant to the Company’s financial statements.

58
6 CASH AND BALANCES WITH TREASURY BANKS In hand: – Local currency – Foreign currency With State Bank of Pakistan in: – Local currency current accounts – Foreign currency current account With National Bank of Pakistan in: – Foreign currency deposit account
7 BALANCES WITH OTHER BANKS In Pakistan On current accounts – local currency On deposit accounts – – Local currency – Foreign currency
8 NON-CURRENT ASSET CLASSIFIED AS HELD FOR SALE Balance as at January 01 Cost of investment reclassified from investments Fair value adjustment during the year Less: Amounts received till December 31 Balance as at December 31 Less: Impairment on asset classified as held for sale at its fair value
6.1
7.17.2
8.1
133,970 -
133,970
65,404,446 -
65,404,446
-
65,538,416
4,448,072
331,870,835 29,778,548
366,097,455
175,000,000 -
(60,000,000) (40,000,000)
75,000,000
(28,910,341) 46,089,659
147,586 -
147,586
55,134,738 -
55,134,738
128,478
55,410,802
16,483,175
51,399,790 28,506,222 96,389,187
- 225,000,000
- (50,000,000) 175,000,000
(104,211,199) 70,788,801
2012Rupees
2012Rupees
2012Rupees
2011Rupees
2011Rupees
2011Rupees
Note
Note
Note
6.1 Deposits are maintained with the State Bank of Pakistan to comply with its requirements issued from time to time.
7.1 These deposit accounts carry interest rate ranging from 5.00% to 9.5% per annum (2011: 5.00% per annum).7.2 These deposit accounts carry interest rate of 0.25% per annum (2011: 0.25% per annum).

59
8.1 Particulars of impairment on assets classified as held for sale at its fair value Balance as at January 01 Impairment loss on asset classified as held for sale at its fair value Reversal of Impairment on asset classified as held for sale at its fair value Balance as at December 31
9 LENDINGS TO FINANCIAL INSTITUTIONS Call money lendings Repurchase agreements lendings (reverse repo)
9.3 Particulars of lendings In local currency In foreign currencies
9.4 Securities held as collateral against lendings to financial institutions
9.4.1 These represent the securities obtained under reverse repo transactions that have been used to raise finance under repo transaction.
9.19.2
104,211,199
-
(75,300,858) 28,910,341
200,000,000 50,000,000
250,000,000
250,000,000 -
250,000,000
-
104,211,199
- 104,211,199
171,111,111 -
171,111,111
171,111,111 -
171,111,111
2012Rupees
2012Rupees
2012 2011
Held by the Company Rupees
Held by the Company Rupees
Pakistan Investment Bonds 9.4.1 50,000,000 50,000,000
50,000,000 50,000,000
- -
- -
- -
- -
Further given as collateral
Rupees
Further given as collateral
RupeesTotal
RupeesTotal
Rupees
2011Rupees
2011Rupees
Note
Note
9.1 This includes clean placements and term deposit receipts. These carry markup rate 10.30% per annum (2011: 11.00% to 12.97% per annum) maturing on January 2013 (2011: January 2012 to April 2012).
9.2 These are secured against Pakistan Investment Bonds (PIBs). The difference between the contracted purchase price and the re-sale price is recognized as income over the period of the contract. These carry mark up rate of 10.00% per annum having maturity within 2 days.

60
10.2 In accordance with the requirements of the Stock Exchanges (Corporatization, Demutualization and Integration) Act 2012 (the Act), during the year the Company has received equity shares and one Trading Right Entitlement certificate in ISE in lieu of its membership card in that exchange.
Based on the revalued assets and liabilities of ISE, a total of 3,034,603 ordinary shares of Rs. 10 each in the corporatized
and demutualized ISE have been allotted to the Company in a dematerialized form. Out of the aforementioned, 1,213,841 ordinary shares in ISE (i.e. 40 percent) have been received in the Company’s CDC participant account whereas 1,820,762 ordinary shares in ISE (i.e. 60 percent) have been held in the blocked sub accounts maintained under ISE participant ID with Central Depository Company of Pakistan Limited. The rights attached to 60% shares held in blocked account shall be dealt with in accordance with the provisions contained in the Act. The blocked account shall be operated by the Board of Directors of the stock exchanges in the manner prescribed by the Securities and Exchange Commission of Pakistan.
Since the par value of shares received by the Company is more than the carrying value of membership card, investment in
ISE is recognised to the extent of the carrying value of membership card and trading right in ISE is recognised at Nil value. 10.3 This includes premium of Rs. 2.922 million (2011: Rs. 17.394 million) on purchase of PIB’s. The premium is being amor-
tized over the years having maturity on April 2014. Investment in PIB’s carry coupon interest rates of 8% per annum (2011: 8% to 11% per annum).
10.4 This represents the cost of acquisition of 35.06% (2011: 35.06%) shares in the paid up capital of Saudi Pak Leasing
Company Limited. The management considers this investment to be a strategic investment. Market value of shares at the year end amounted to Rs. 51.465 million (2011: Rs. 7.601 million).
10.5 To support Saudi Pak Leasing Company Limited (SPLC) in addressing its adverse financial position and minimum capital
requirement; after approval of its Board of Directors, the Company has converted balance of clean placement amounting to Rs. 150 million and long term finance facilities amounting to Rs. 183.208 million to SPLC into an interest free subor-dinated loan with effect from 28 May 2009. However, due to conflicting regulations as applicable to NBFC’s and DFI’s
10 INVESTMENTS 10.1 Investment by types: Held-For-Trading securities (HFT) Quoted shares Available-For-Sale securities (AFS) Quoted shares Un-quoted shares Market Treasury Bills Pakistan Investment Bonds (PIBs) Term Finance Certificates (TFCs) Mutual Funds Other-Islamabad Stock Exchange (“ISE” Membership) Sub-total for AFS securities Held-To-Maturity securities (HTM) Pakistan Investment Bonds (PIBs) Term Finance Certificates (TFCs) Sub-total for HTM securities Subsidiaries Saudi Pak Leasing Company Limited – Investment in shares – Subordinated loan Saudi Pak Insurance Company Limited Saudi Pak Real Estate Company Limited Less: Transferred to non-current asset classified as held for sale Sub-total for subsidiaries Investment at cost Provision for diminution in value of investments Investments (net of provisions) Surplus / (deficit) on revaluation of AFS securities
10.2
10.3
10.410.5
10.6
10.8
19
-
967,553,496 479,833,048 576,777,088
- 250,181,356
50,000,000
2,500,000
2,326,844,988
202,922,009 1,599,088,365
1,802,010,374
243,467,574 333,208,501
- 500,000,000
1,076,676,075
-
1,076,676,075
5,205,531,437 (1,552,778,949)
3,652,752,488 341,825,897
3,994,578,385
-
2,259,831,087 579,833,048 278,653,500
- 57,257,340
150,000,000
-
3,325,574,975
517,393,918 1,867,282,191
2,384,676,109
243,467,574 333,208,501 225,000,000 500,000,000
1,301,676,075
(225,000,000)
1,076,676,075
6,786,927,159 (2,332,736,612)
4,454,190,547 64,300,152
4,518,490,699
-
- -
2,257,107,700 245,206,600
- -
-
2,502,314,300
- -
-
- - - - -
-
-
2,502,314,300 -
2,502,314,300 -
2,502,314,300
-
- -
645,925,200 195,241,900
- -
-
841,167,100
- -
-
- - - - -
-
-
841,167,100 -
841,167,100 -
841,167,100
-
967,553,496 479,833,048
2,833,884,788 245,206,600 250,181,356
50,000,000
2,500,000
4,829,159,288
202,922,009 1,599,088,365
1,802,010,374
243,467,574 333,208,501
- 500,000,000
1,076,676,075
-
1,076,676,075
7,707,845,737 (1,552,778,949)
6,155,066,788 341,825,897
6,496,892,685
-
2,259,831,087 579,833,048 924,578,700 195,241,900
57,257,340 150,000,000
-
4,166,742,075
517,393,918 1,867,282,191
2,384,676,109
243,467,574 333,208,501 225,000,000 500,000,000
1,301,676,075
(225,000,000)
1,076,676,075
7,628,094,259 (2,332,736,612)
5,295,357,647 64,300,152
5,359,657,799
2012 2011
Held by the Company Rupees
Held by the Company Rupees
Given as collateral
Rupees
Given as collateral
RupeesTotal
RupeesTotal
Rupees
Note

61
relating to subordinated debt, the Board in its meeting held on January 12, 2011 decided to convert the same into pref-erence shares. The SBP vide its letter no BPRD/BRD/SPIAICO/2012/7143 dated June 06, 2012 has granted extension for conversion of subordinated loan into equity till December 31, 2012.
10.6 This represents 50 million shares in Saudi Pak Real Estate Company Limited representing 100% of paid up capital of Saudi Pak Real Estate Company Limited having a break-up value of Rs. 11.82 (2011: Rs. 12.17) per share on the basis of last available unaudited financial statements.
10.7 Investment by segments Federal Government securities – Pakistan Investment Bonds (PIBs) – Market Treasury Bills Fully paid up ordinary shares – Listed securities – Unlisted securities Term Finance Certificates (TFCs) – Listed TFCs – Unlisted TFCs Other investments Mutual Funds Other - ISE Membership Subordinated loan – Saudi Pak Leasing Company limited
Total investment at cost Less: Provision for diminution in value of investments Investments (net of provisions) Surplus / (deficit) on revaluation of Available-For-Sale securities (AFS)
10.7.1 Investment in fully paid up ordinary shares-listed
10.7.510.7.5
10.7.110.7.2
10.7.310.7.4
10.7.610.2
10.8
448,128,609 2,833,884,788 3,282,013,397
1,211,021,070 979,833,048
2,190,854,118
1,029,689,893 819,579,828
1,849,269,721
50,000,000 2,500,000
333,208,501 385,708,501
7,707,845,737 (1,552,778,949)
6,155,066,788 341,825,897
6,496,892,685
137,377,068 - - -
- - - - -
39,388,341 176,765,409
20,249,363 19,993,839 60,968,470
108,725,040
45,348,645 25,283,071 7,421,064
52,729,924 9,397,766
77,784,678 427,901,860
4,070,051 - - -
- - - - -
1,229,275
1,017,317 1,210,550 1,017,500 6,000,000
6,247,948 384,913 825,000
3,317,900 1,066,648
2,127,695
Agritech LimitedAskari Bank LimitedArif Habib Corporation LimitedAzgard Nine limitedSummit Bank Limited (Arif Habib Bank Limited)Attock Cement LimitedBank Islami Pakistan LimitedBank Al-Falah LimitedChenab LimitedCrescent Steel & Allied Products Limited Sub-Total carried forward
712,635,818 924,578,700
1,637,214,518
2,503,298,661 1,079,833,048 3,583,131,709
1,058,603,877 865,935,654
1,924,539,531
150,000,000 -
333,208,501 483,208,501
7,628,094,259 (2,332,736,612)
5,295,357,647 64,300,152
5,359,657,799
2012Rupees
2012Number of ordinary shares Name of investee companies
2012Rupees
2011Rupees
2011 2011Rupees
Note

62
10.7.1 Investment in fully paid up ordinary shares-listed (continued)
176,765,409
-
21,661,280
-
51,068,169
23,153,386
43,130,940
41,921,325
47,998,542
-
20,095,515
10,205,220
-
64,608,772
14,389,050
20,297,937
17,811,960
15,207,798
25,590,200
40,368,270
8,362,500
39,341,309
28,394,283
15,764,775
71,168,774
20,000,000
21,747,125
243,467,573
1,980,000
57,256,013
-
-
8,823,174
17,707,500
-
42,734,271
1,211,021,070
427,901,860
74,024,610
28,316,074
21,192,963
89,948,621
32,646,276
48,881,732
94,072,347
49,999,503
41,508,061
22,328,350
68,038,113
21,356,550
88,837,060
14,389,050
24,068,697
87,827,408
30,415,596
99,801,780
40,368,270
19,196,118
86,103,323
148,767,134
48,350,044
84,456,615
20,000,000
50,233,748
243,467,573
1,980,000
194,784,174
58,784,385
4,776,542
8,823,174
17,707,500
39,377,644
70,567,766
2,503,298,661
-
4,000,000
-
4,008,500
500,000
1,500,000
1,875,000
11,572,199
-
450,000
1,500,000
-
1,000,000
1,000,000
1,265,000
2,000,000
60,000
1,000,000
343,750
2,000,000
3,059,000
161,987
420,000
632,000
993,623
453,000
15,835,403
50,000
190,300
-
-
458,764
95,000
-
6,185,000
5,700,524
5,228,883
3,199,957
7,060,348
470,000
1,700,000
4,207,540
11,572,199
1,361,990
500,000
10,000,487
200,000
1,250,000
1,000,000
1,500,000
9,861,622
100,000
3,900,000
275,000
4,591,000
6,695,000
848,704
1,288,126
750,000
993,623
1,046,386
15,835,403
50,000
647,398
1,596,000
665,000
458,764
76,000
5,135,000
10,213,350
Sub-Total carried forward
Dewan Farooq Motors Limited
Dewan Salman Fiber Limited
Dewan Cement Limited
Fauji Cement Company Limited
Fauji Fertilizer Company Limited
Fauji Fertilizer Bin Qasim Limited
Fecto Cement Limited
Japan Power Generation Limited
Jahangir Siddiqui and Company Limited
Kott Addu Power Company Limited
Maple Leaf Cement Limited
Mari Gas Company Limited
National Bank of Pakistan Limited
Nishat Chunian Power Limited
Nishat Power Limited
NIB Bank Limited
Pakistan State Oil Company Limited
Pakistan Telecommunication Company Limited
Pakistan Petroleum Limited
Lafarge Pakistan Cement Limited
Pace Pakistan Limited
Packages Limited
Pak Reinsurance Limited
Pakistan Refinery Limited
Pak Elektron Limited
Pakistan National Shipping Corporation (PNSC)
Saudi Pak Leasing Company Limited
Security Papers Limited
Sitara Chemicals Industries Limited
Sui Northern Gas Company Limited
Samba Bank Limited
Samin Textiles Limited
Shell Pakistan Limited
Telecard Company Limited
World Call Telecom Limited
2012Number of ordinary shares Name of investee companies
2012Rupees
2011 2011Rupees

63
Allied Bank Limited Azgard Nine Limited Askari Bank Limited Bank Alfalah Limited Engro Corporation Pakistan Limited Jahangir Siddiqui and Company Limited Maple Leaf Cement (Sukuk) Limited Trust Investment Bank Limited World Call Telecom Limited World Call Telecom Limited Pakistan Mobile Communications Limited Pakistan Mobile Communications Limited Summit Bank Limited
10.7.2 Investment in fully paid up ordinary shares – unlisted
10.7.2.1 Details of investment in unlisted companies having 10% and more of paid-up capital of investee company are as follows:
10.7.3 Investment in term finance certificates – listed
Name of the Company
*This does not include value of bonus shares amounting to Rs. 300,000
Pak Kuwait Takaful CompanyEquity International (Pvt) Limited*
Mr. Imtiaz BhattiMr. Robert Micheal
30-Jun-1230-Jun-11
10.00 20.00
13.04 1.32
40,000,000 6,000,000
Name of the Chief Executive
breakup Value of Investment
Total Rupees
As per Accounts
% age Held
5,710,000
10,000,000
6,500,000
4,000,000
6,000,000
11,250,000
5,000,000
15,000,000
50,000,000
50,000,000
-
40,000,000
50,000,000
168,750,000
37,623,048
20,000,000
500,000,000
979,833,048
5,710,000
10,000,000
6,500,000
4,000,000
6,000,000
11,250,000
5,000,000
15,000,000
50,000,000
50,000,000
100,000,000
40,000,000
50,000,000
168,750,000
37,623,048
20,000,000
500,000,000
1,079,833,048
571,000
1,000,000
650,000
400,000
630,000
1,125,000
500,000
1,500,000
5,000,000
5,000,000
-
4,000,000
5,000,000
16,875,000
3,762,304
2,000,000
50,000,000
571,000
1,000,000
650,000
400,000
630,000
1,125,000
500,000
1,500,000
5,000,000
5,000,000
5,714,285
4,000,000
5,000,000
16,875,000
3,762,304
2,000,000
50,000,000
Ali Paper Board Industries Limited
Saudi Pak Kalabagh Livestock
Company Limited
Bela Chemical Industries Limited
Fruit Sap Limited
Equity International (Pvt) Limited
Taurus Securities Limited
Highnoon Textiles Limited
Wah Nobel Acetates Limited
Pakistan Textile City Limited
Alhamra Hills Private Limited
Vision Network Television
Pak Kuwait Takaful Company
Al Hamra Avenue Private Limited
Pace Barka Properties Limited
Innovative Investment Bank Limited
Trust Investment Bank Limited
Saudi Pak Real Estate Limited
298,685,966 136,614,140
31,470,305 -
241,785,560 24,937,525
145,931,250 3,748,500
21,415,716 22,486,485 49,330,000 23,823,125 29,461,321
1,029,689,893
448,835,644 124,898,600
31,482,931 53,720,915
198,900,000 17,468,500
149,745,000 4,998,000
28,554,287 - - - -
1,058,603,877
59,839 44,419
6,313 -
48,780 5,000
31,125 2,000
10,000 15,000 10,000
250 6,000
89,839 30,000
6,313 16,159 39,780
7,000 31,125 2,000
10,000 - - - -
5,000 5,000 4,989
- 4,957 5,000 5,000 5,000 5,000 2,150 5,000
100,000 5,000
2012
2012
Number of ordinary shares
Number of ordinary shares
Name of investee companies
Name of investee companies
2012Rupees
2012Rupees
2011
2011
2011Rupees
2011Rupees
10.7.2.1
10.7.2.1
Note
Original face
Value (Rs.)

64
Avari Hotels Limited Amtex Limited (Sukuk) B.R.R Guardian Modaraba Gharibwal Cement Limited JDW Sugar Mills Limited Martin Dow Pharmaceuticals Faysal Bank Limited(RBS) Agritech Limited Sitara Energy (Sukuk) Sitara Peroxide Limited
Mr. Byram D. AvariMr. Khurram IftikharMr. Ayaz DawoodMr. Muhammad Tausif ParachaMr. Jahangir TareenMr. Jawed AkhaiMr. Naveed A. KhanMr. Ahmed Jaudet BilalMr. Javed IqbalMr. Imran Ghafoor
10.7.3.1 These carry rate of return ranging from 11.38% to 13.58% per annum (2011: 13.11% to 15% per annum) and having maturity upto 8 years. 10.7.4 Investment in Term Finance Certificates – unlisted
10.7.4.1 These carry rate of return ranging from 8.98% to 13.74% (2011: 12.12% to 15.67%) per annum and having maturity of upto 7 years. 10.7.5 Principal terms of investments in Federal Government securities
169,829,200 67,500,000 47,343,750 24,355,500 16,666,670 26,680,000 12,470,000
286,283,751 35,227,272
133,223,685
819,579,828
169,829,200 67,500,000 49,218,750 24,355,500 27,777,780 33,120,000 24,950,000
286,286,697 42,272,727
140,625,000
865,935,654
40,000 18,000 10,000
5,000 10,000 10,000 10,000 57,263
7,045 30,000
40,000 18,000 10,000
5,000 10,000 10,000 10,000 57,263 11,273 30,000
5,000 5,000 5,000 5,000 5,000 5,000 5,000 5,000 5,000 5,000
2012Number of certificates
Name of investment
10.7.6 Investments in mutual funds
Pakistan Investment BondsMarket Treasury Bills
April 2014 to August 2016January 2013 to November 2013
8% to 11.50% 9.09% to 11.89%
Semi-annuallyOn maturity
On maturityOn maturity
Company’s name
Maturity period
Name of Chief Executive
Principal Rate Coupon payment
2012Rupees
20112011
Rupees
Value per
certificate (Rupees)
NAFA – Financial Sector Income FundPak Oman Advantage Fund
10.8 Provision for diminution in value of investments Opening balance Charge for the year Reversals for the year Reversals (related to quoted AFS securities) Written off Closing balance
- 50,000,000 50,000,000
2,332,736,612 274,915,839
(113,383,687) (941,489,815)
- 1,552,778,949
100,000,000 50,000,000
150,000,000
1,476,452,904 985,646,529
- (129,362,821)
- 2,332,736,612
- 5,000,000
9,939,784 5,000,000
10.8.1
2012Number of ordinary sharesName of investee
2012Rupees
2011 2011Rupees
Note
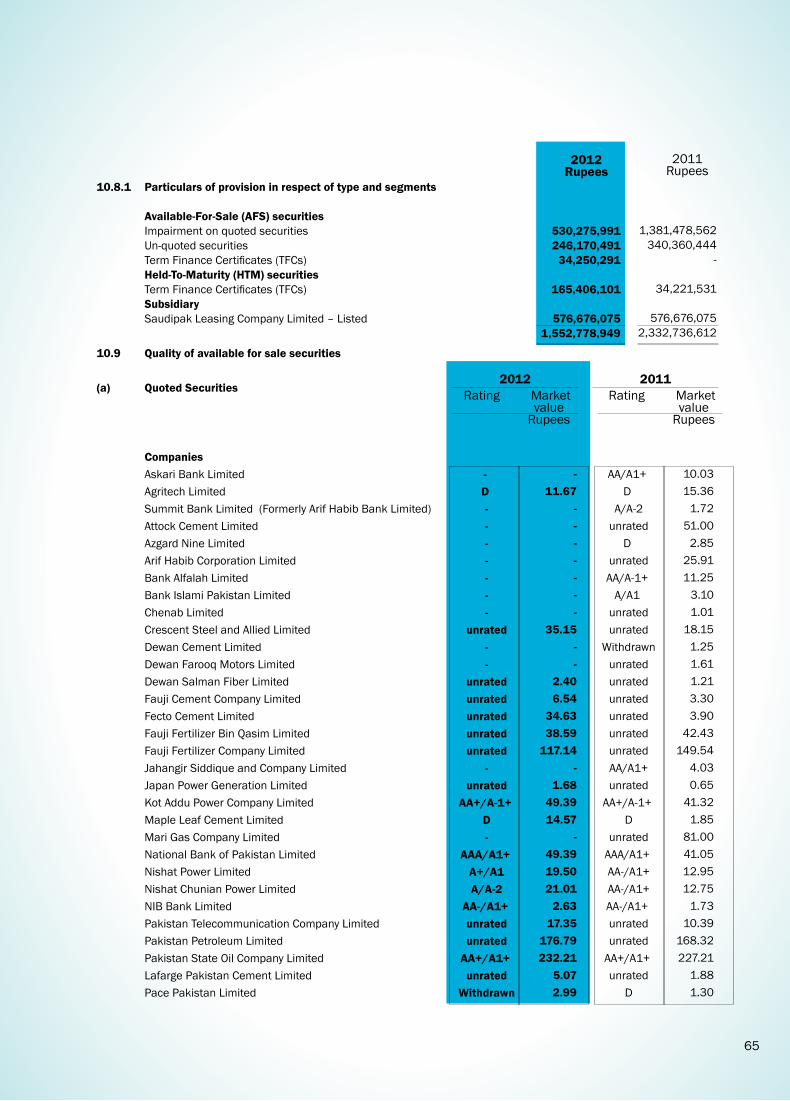
65
10.8.1 Particulars of provision in respect of type and segments Available-For-Sale (AFS) securities Impairment on quoted securities Un-quoted securities Term Finance Certificates (TFCs) Held-To-Maturity (HTM) securities Term Finance Certificates (TFCs) Subsidiary Saudipak Leasing Company Limited – Listed
10.9 Quality of available for sale securities (a) Quoted Securities Companies Askari Bank Limited Agritech Limited Summit Bank Limited (Formerly Arif Habib Bank Limited) Attock Cement Limited Azgard Nine Limited Arif Habib Corporation Limited Bank Alfalah Limited Bank Islami Pakistan Limited Chenab Limited Crescent Steel and Allied Limited Dewan Cement Limited Dewan Farooq Motors Limited Dewan Salman Fiber Limited Fauji Cement Company Limited Fecto Cement Limited Fauji Fertilizer Bin Qasim Limited Fauji Fertilizer Company Limited Jahangir Siddique and Company Limited Japan Power Generation Limited Kot Addu Power Company Limited Maple Leaf Cement Limited Mari Gas Company Limited National Bank of Pakistan Limited Nishat Power Limited Nishat Chunian Power Limited NIB Bank Limited Pakistan Telecommunication Company Limited Pakistan Petroleum Limited Pakistan State Oil Company Limited Lafarge Pakistan Cement Limited Pace Pakistan Limited
530,275,991 246,170,491
34,250,291
165,406,101
576,676,075 1,552,778,949
-D - - - - - - -
unrated - -
unrated unrated unrated unrated unrated
- unrated
AA+/A-1+ D -
AAA/A1+ A+/A1 A/A-2
AA-/A1+ unrated unrated AA+/A1+ unrated
Withdrawn
AA/A1+D
A/A-2 unrated
D unrated AA/A-1+
A/A1 unrated unrated
Withdrawn unrated unrated unrated unrated unrated unrated AA/A1+ unrated
AA+/A-1+ D
unrated AAA/A1+ AA-/A1+ AA-/A1+ AA-/A1+ unrated unrated AA+/A1+ unrated
D
- 11.67
- - - - - - -
35.15 - -
2.40 6.54
34.63 38.59
117.14 -
1.68 49.39 14.57
- 49.39 19.50 21.01
2.63 17.35
176.79 232.21
5.07 2.99
10.03 15.36
1.72 51.00
2.85 25.91 11.25
3.10 1.01
18.15 1.25 1.61 1.21 3.30 3.90
42.43 149.54
4.03 0.65
41.32 1.85
81.00 41.05 12.95 12.75
1.73 10.39
168.32 227.21
1.88 1.30
1,381,478,562 340,360,444
-
34,221,531
576,676,075 2,332,736,612
2012Rupees
2011Rupees
2012 2011 Rating Rating Market Market
value Rupees
value Rupees

66
(a) Quoted Securities (continued) Packages Limited Pak Reinsurance Limited Pak Refinery Limited Pak Elektron limited PNSC Sitara Chemicals Industries Limited Sui Northern Gas Company Limited Security Papers Limited Samba Bank Limited Samin Textile Limited Saudi Pak Leasing Company Limited Shell Pakistan Limited Telecard Company Limited World Call Telecom Limited (b) Mutual Funds Companies NAFA - Financial Sector Income Fund Pak Oman Advantage Fund
AA/A1+ AA
unrated Withdrawn
AA-/A1+A+/A1
- AAA/A1+
- unrated unrated unrated
- D
- AM3
11.2.1
11.111.1.611.2.3
11.1.311.1.4
AA/A1+ AA
unrated A-/A2
AA-/A1+A+/A1
AA/A1+AAA/A1+
A+/A1 unrated unrated unrated
D BBB-/A3
AM 2-3-Star
151.16 24.45 69.30 10.76 34.82
179.00 -
51.32 -
6.70 3.25
136.19 -
2.53
- 10.93
82.72 15.50 67.71 3.49
12.71 72.20 15.71 35.40
1.45 4.05 0.48
190.28 0.80 1.00
10.21 10.85
2012 2011 Rating Rating Market
value Rupees
value Rupees
Market
2012 2011 Rating Rating Market
value Rupees
value Rupees
Market
11 ADVANCES – In Pakistan – Outside Pakistan Net investment in finance lease – In Pakistan – Outside Pakistan Bills discounted and purchased Advances – gross Provision for non-performing advances Provision for non-performing lease finance Advances – net of provision 11.1 Particulars of advances - gross 11.1.1 – In local currency – In foreign currencies 11.1.2 Long term advances (for over one year) Short term advances (for upto one year) Staff advances
7,092,317,868 -
7,092,317,868
210,392,271 -
210,392,271 -
7,302,710,139 (2,195,374,997)
(145,670,449) 4,961,664,693
7,265,482,351 37,227,788
7,302,710,139
6,199,470,004 1,083,604,881
19,635,254 7,302,710,139
7,358,988,556 -
7,358,988,556
255,131,202 -
255,131,202 -
7,614,119,758 (2,206,262,869)
(172,356,548) 5,235,500,341
7,576,891,970 37,227,788
7,614,119,758
6,752,004,926 849,103,139
13,011,693 7,614,119,758
2012Rupees
Note 2011Rupees
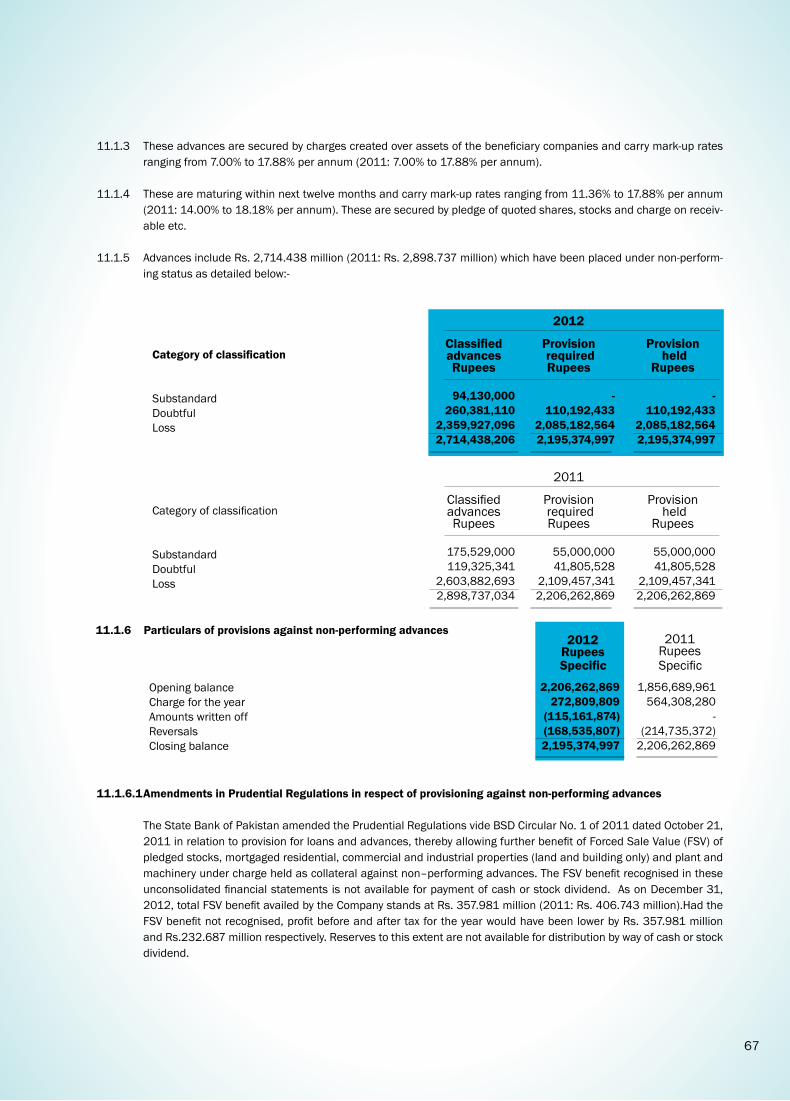
67
11.1.6 Particulars of provisions against non-performing advances
Opening balanceCharge for the yearAmounts written offReversalsClosing balance
Category of classification
SubstandardDoubtfulLoss
Category of classification
SubstandardDoubtfulLoss
11.1.3 These advances are secured by charges created over assets of the beneficiary companies and carry mark-up rates ranging from 7.00% to 17.88% per annum (2011: 7.00% to 17.88% per annum).
11.1.4 These are maturing within next twelve months and carry mark-up rates ranging from 11.36% to 17.88% per annum (2011: 14.00% to 18.18% per annum). These are secured by pledge of quoted shares, stocks and charge on receiv-able etc.
11.1.5 Advances include Rs. 2,714.438 million (2011: Rs. 2,898.737 million) which have been placed under non-perform-
ing status as detailed below:-
11.1.6.1 Amendments in Prudential Regulations in respect of provisioning against non-performing advances
The State Bank of Pakistan amended the Prudential Regulations vide BSD Circular No. 1 of 2011 dated October 21, 2011 in relation to provision for loans and advances, thereby allowing further benefit of Forced Sale Value (FSV) of pledged stocks, mortgaged residential, commercial and industrial properties (land and building only) and plant and machinery under charge held as collateral against non–performing advances. The FSV benefit recognised in these unconsolidated financial statements is not available for payment of cash or stock dividend. As on December 31, 2012, total FSV benefit availed by the Company stands at Rs. 357.981 million (2011: Rs. 406.743 million).Had the FSV benefit not recognised, profit before and after tax for the year would have been lower by Rs. 357.981 million and Rs.232.687 million respectively. Reserves to this extent are not available for distribution by way of cash or stock dividend.
2,206,262,869 272,809,809
(115,161,874) (168,535,807) 2,195,374,997
94,130,000 260,381,110
2,359,927,096 2,714,438,206
175,529,000 119,325,341
2,603,882,693 2,898,737,034
- 110,192,433
2,085,182,564 2,195,374,997
55,000,000 41,805,528
2,109,457,341 2,206,262,869
- 110,192,433
2,085,182,564 2,195,374,997
55,000,000 41,805,528
2,109,457,341 2,206,262,869
1,856,689,961 564,308,280
- (214,735,372)
2,206,262,869
2012Rupees
Specific Specific
ClassifiedadvancesRupees
ClassifiedadvancesRupees
Provision required Rupees
Provision required Rupees
2012
2011
Provision held
Rupees
Provision held
Rupees
2011Rupees

68
11.1.7 Particulars of write offs: Against provisions Directly charged to the unconsolidated profit and loss account 11.1.8 Particulars of amounts written off against provisions Write offs of Rs. 500,000 and above Write offs of below Rs. 500,000
11.2 Net investment in finance lease Minimum lease payments receivables Less: Unearned finance income Present value of minimum lease payments Less: Provision for potential lease losses Net investment in lease
11.2.1 Net investment in finance lease Lease rental receivable Less: Unearned finance income Present value of minimum lease payments
Category of classification
SubstandardDoubtfulLoss
Lease rental receivable Less: Unearned finance income Present value of minimum lease payments
11.1.9 In terms of sub-section (3) of Section 33A of the Banking Companies Ordinance, 1962 the statement in respect of written off loans or any other financial relief of Rs. 500,000 or above allowed to a person(s) during the year ended December 31, 2012 is given at Annexure - 1.
11.2.2 Investment in lease finance includes Rs. 157.285 million (2011: Rs. 186.679 million) which has been placed under non-performing status as detailed below:-
115,161,874 -
115,161,874
115,161,874 -
115,161,874
296,575,498 (86,183,227) 210,392,271
(145,670,449) 64,721,822
164,410,317 78,715,361 85,694,956
- 23,228,752
134,056,073 157,284,825
267,344,677 83,964,959
183,379,718
132,165,181 7,467,866
124,697,315
- 11,614,376
134,056,073 145,670,449
91,517,160 19,765,676 71,751,484
296,575,498 86,183,227
210,392,271
- 11,614,376
134,056,073 145,670,449
358,861,837 103,730,635 255,131,202
11.2.111.2.2
- - -
- - -
358,861,837 (103,730,635)
255,131,202 (172,356,548)
82,774,654
2012Rupees
2012Rupees
Note
2011Rupees
2011Rupees
Less thanone yearRupees
One year to five year Rupees
2012
TotalRupees
Classifiedadvance
Rupees
Specific provision required Rupees
2012
Specific provision
held Rupees
Less thanone yearRupees
One year to five year Rupees
2011
TotalRupees

69
SubstandardDoubtfulLoss
28,645,418 -
158,033,839 186,679,257
14,322,709 -
158,033,839 172,356,548
14,322,709 -
158,033,839 172,356,548
Classifiedadvance
Rupees
Specific provision required Rupees
2011
Specific provision
held Rupees
11.2.3 Particulars of provisions against non-performing lease finance Opening balance Charge for the year Amounts written off Reversals Closing balance 11.2.4 Particulars of amounts written off against provisions Write offs of Rs. 500,000 and above Write offs of below Rs. 500,000
11.3 Particulars of loans and advances to directors and associated companies etc. Debts due by directors, executives or officers of the Company or any of them either severally or jointly with any other persons Debts due by companies or firms in which the directors of the Company are interested as directors, partners Debts due by subsidiary companies, controlled firms, managed modarabas and other related parties 11.3.1 Opening balance Loans granted during the year Repayments during the year Closing balance 12 OPERATING FIXED ASSETS Capital work-in-progress Property and equipment Intangible assets
172,356,548 - -
(26,686,099) 145,670,449
- - -
19,635,254
-
-
13,011,693 19,656,435
(13,032,874) 19,635,254
- 2,382,378,987
1,366,369 2,383,745,356
12.112.2
174,984,715 7,161,354
- (9,789,521)
172,356,548
- - -
13,011,693
-
-
13,625,441 7,976,499
(8,590,247) 13,011,693
- 2,078,316,564
4,273,260 2,082,589,824
2012Rupees
Specific Specific
2011Rupees
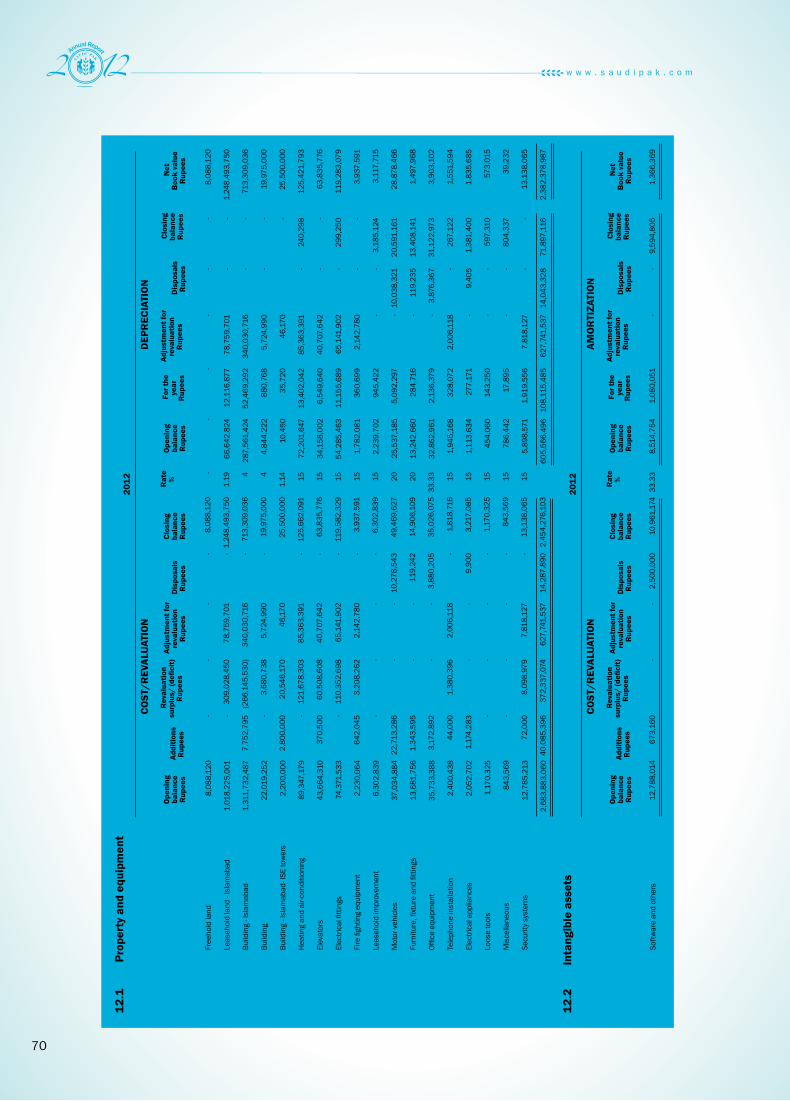
70
8,0
88,1
20
1,0
18,2
25,0
01
1,3
11,7
32,4
87
22,
019,
252
2,2
00,0
00
89,
347,
179
43,
664,
310
74,
371,
533
2,2
30,0
64
6,3
02,8
39
37,
034,
884
13,
681,
756
35,
733,
388
2,4
00,4
38
2,0
52,7
02
1,1
70,3
25
843
,569
12,
785,
213
2,6
83,8
83,0
60
Fre
ehol
d la
nd
Lea
seho
ld la
nd -
Isla
mab
ad
Bui
ldin
g - I
slam
abad
Bui
ldin
g
Bui
ldin
g - I
slam
abad
- ISE
towe
rs
Hea
ting
and
air-c
ondi
tioni
ng
Ele
vato
rs
Ele
ctric
al fi
tting
s
Fire
figh
ting
equi
pmen
t
Lea
seho
ld im
prov
emen
t
Mot
or v
ehic
les
Fur
nitu
re, fi
xtur
e an
d fit
tings
Offi
ce e
quip
men
t
Tel
epho
ne in
stal
latio
n
Ele
ctric
al a
pplia
nces
Loo
se to
ols
Mis
cella
neou
s
Sec
urity
sys
tem
s
Sof
twar
e an
d ot
hers
-
66,
642,
824
287
,561
,424
4,8
44,2
22
10,
450
72,
201,
647
34,
158,
002
54,
285,
463
1,7
82,0
81
2,2
39,7
02
25,
537,
185
13,
242,
660
32,
862,
961
1,9
45,1
68
1,1
13,6
34
454
,060
786
,442
5,8
98,5
71
605
,566
,496
-
12,
116,
877
52,
469,
292
880
,768
35,
720
13,
402,
042
6,5
49,6
40
11,
155,
689
360
,699
945
,422
5,0
92,2
97
284
,716
2,1
36,3
79
328
,072
277
,171
143
,250
17,
895
1,9
19,5
56
108
,115
,485
-
78,
759,
701
340
,030
,716
5,7
24,9
90
46,
170
85,
363,
391
40,
707,
642
65,
141,
902
2,1
42,7
80 - - - -
2,0
06,1
18 - - -
7,8
18,1
27
627
,741
,537
- - - - - - - - -
10,
038,
321
119
,235
3,8
76,3
67 -
9,4
05 - - -
14,
043,
328
- - - - -
240
,298
-
299
,250
-
3,1
85,1
24
20,
591,
161
13,
408,
141
31,
122,
973
267
,122
1,3
81,4
00
597
,310
804
,337
-
71,
897,
116
8,0
88,1
20
1,2
48,4
93,7
50
713
,309
,036
19,
975,
000
25,
500,
000
125
,421
,793
63,
835,
776
119
,283
,079
3,9
37,5
91
3,1
17,7
15
28,
878,
466
1,4
97,9
68
3,9
03,1
02
1,5
51,5
94
1,8
35,6
85
573
,015
39,
232
13,
138,
065
2,3
82,3
78,9
87
- -
7,7
52,7
95 -
2,8
00,0
00 -
370
,500
-
642
,045
-
22,
713,
286
1,3
43,5
95
3,1
72,8
92
44,
000
1,1
74,2
83 - -
72,
000
40,
085,
396
-
1.1
9 4
4
1.1
4
15
15
15
15
15
20
20
33.3
3
15
15
15
15
15
-
309
,028
,450
(266
,145
,530
)
3,6
80,7
38
20,
546,
170
121
,678
,303
60,
508,
608
110
,352
,698
3,2
08,2
62 - - - -
1,3
80,3
96 - - -
8,0
98,9
79
372
,337
,074
-
78,
759,
701
340
,030
,716
5,7
24,9
90
46,
170
85,
363,
391
40,
707,
642
65,
141,
902
2,1
42,7
80 - - - -
2,0
06,1
18 - - -
7,8
18,1
27
627
,741
,537
- - - - - - - - -
10,
278,
543
119
,242
3,8
80,2
05 -
9,9
00 - - -
14,
287,
890
8,0
88,1
20
1,2
48,4
93,7
50
713
,309
,036
19,
975,
000
25,
500,
000
125
,662
,091
63,
835,
776
119
,582
,329
3,9
37,5
91
6,3
02,8
39
49,
469,
627
14,
906,
109
35,
026,
075
1,8
18,7
16
3,2
17,0
85
1,1
70,3
25
843
,569
13,
138,
065
2,4
54,2
76,1
03
12,
788,
014
8,5
14,7
54
1,0
80,0
51
- -
9,5
94,8
05
1,3
66,3
69
673
,160
33
.33
- -
2,5
00,0
00
10,
961,
174
12.1
P
rope
rty
and
equi
pmen
t
CO
ST/R
EVAL
UAT
ION
DEP
REC
IATI
ON
Ope
ning
ba
lanc
eR
upee
s
Ope
ning
ba
lanc
eR
upee
s A
dditi
ons
Rup
ees
For
the
year
R
upee
s
Rev
alua
tion
su
rplu
s/ (d
efici
t)
Rup
ees
Adj
ustm
ent f
or
reva
luat
ion
Rup
ees
Adj
ustm
ent f
or
reva
luat
ion
Rup
ees
Dis
posa
ls
Rup
ees
Dis
posa
ls
Rup
ees
Clo
sing
ba
lanc
e
Rup
ees
Clos
ing
bala
nce
Rup
ees
Net
B
ook
valu
eR
upee
s
Rat
e
%
2012
CO
ST/R
EVAL
UAT
ION
12.2
In
tang
ible
ass
ets
AM
OR
TIZA
TIO
N
Ope
ning
ba
lanc
eR
upee
s
Ope
ning
ba
lanc
eR
upee
s A
dditi
ons
Rup
ees
For
the
year
R
upee
s
Rev
alua
tion
su
rplu
s/ (d
efici
t)
Rup
ees
Adj
ustm
ent f
or
reva
luat
ion
Rup
ees
Adj
ustm
ent f
or
reva
luat
ion
Rup
ees
Dis
posa
ls
Rup
ees
Dis
posa
ls
Rup
ees
Clo
sing
ba
lanc
e
Rup
ees
Clos
ing
bala
nce
Rup
ees
Net
B
ook
valu
eR
upee
s
Rat
e
%
2012

71
8,0
88,1
20
1,0
18,2
25,0
01
1,3
11,7
00,3
57
22,
019,
252 -
89,
347,
179
41,
000,
000
74,
371,
533
2,3
10,5
36
6,2
73,1
68
35,
889,
296
13,
835,
686
35,
865,
353
2,3
34,9
11
1,9
88,7
02
1,1
70,3
25
1,0
63,3
93
10,
984,
666
2,6
76,4
67,4
78
Fre
ehol
d la
nd
Lea
seho
ld la
nd -
Isla
mab
ad
Bui
ldin
g - I
slam
abad
Bui
ldin
g
Bui
ldin
g - I
slam
abad
- ISE
towe
rs
Hea
ting
and
air-c
ondi
tioni
ng
Ele
vato
rs
Ele
ctric
al fi
tting
s
Fire
figh
ting
equi
pmen
t
Lea
seho
ld im
prov
emen
t
Mot
or v
ehic
les
Fur
nitu
re, fi
xtur
e an
d fit
tings
Offi
ce e
quip
men
t
Tel
epho
ne in
stal
latio
n
Ele
ctric
al a
pplia
nces
Loo
se to
ols
Mis
cella
neou
s
Sec
urity
sys
tem
s
-
54,
525,
947
235
,092
,454
3,9
63,4
54 -
58,
799,
605
27,
674,
970
43,
129,
774
1,5
01,9
24
1,3
37,1
97
26,
339,
542
13,
135,
138
29,
642,
520
1,6
31,0
76
880
,508
309
,536
1,0
07,2
95
4,1
26,7
63
503
,097
,703
-
12,
116,
877
52,
468,
970
880
,768
10,
450
13,
402,
042
6,4
83,0
32
11,
155,
689
344
,529
957
,736
5,2
14,8
36
434
,865
4,8
08,2
30
314
,092
233
,126
144
,524
16,
948
1,7
71,8
08
110
,758
,522
- - - - - - - -
64,
372
55,
231
6,0
17,1
93
327
,343
1,5
87,7
89 - - -
237
,801
-
8,2
89,7
29
-
66,
642,
824
287
,561
,424
4,8
44,2
22
10,
450
72,
201,
647
34,
158,
002
54,
285,
463
1,7
82,0
81
2,2
39,7
02
25,
537,
185
13,
242,
660
32,
862,
961
1,9
45,1
68
1,1
13,6
34
454
,060
786
,442
5,8
98,5
71
605
,566
,496
8,0
88,1
20
951
,582
,177
1,0
24,1
71,0
63
17,
175,
030
2,1
89,5
50
17,
145,
532
9,5
06,3
08
20,
086,
070
447
,983
4,0
63,1
37
11,
497,
699
439
,096
2,8
70,4
27
455
,270
939
,068
716
,265
57,
127
6,8
86,6
42
2,0
78,3
16,5
64
- -
32,
130 -
2,2
00,0
00 -
2,6
64,3
10 - -
160
,256
7,6
20,8
95
173
,500
1,5
91,2
67
65,
527
64,
000 -
17,
980
1,8
00,5
47
16,
390,
412
-
1.1
9 4
4
1.1
4
15
15
15
15
15
20
20
33.3
3
15
15
15
15
15
- - - - - - - -
80,
472
130
,585
6,4
75,3
07
327
,430
1,7
23,2
32 - - -
237
,804
-
8,9
74,8
30
8,0
88,1
20
1,0
18,2
25,0
01
1,3
11,7
32,4
87
22,
019,
252
2,2
00,0
00
89,
347,
179
43,
664,
310
74,
371,
533
2,2
30,0
64
6,3
02,8
39
37,
034,
884
13,
681,
756
35,
733,
388
2,4
00,4
38
2,0
52,7
02
1,1
70,3
25
843
,569
12,
785,
213
2,6
83,8
83,0
60
9,8
11,0
14
Sof
twar
e an
d ot
hers
6
,510
,254
2
,004
,500
-
8
,514
,754
4
,273
,260
2
,977
,000
33
.33
-
12,
788,
014
12.1
P
rope
rty
and
equi
pmen
t (co
ntin
ued)
12.2
In
tang
ible
ass
ets
(con
tinue
d) Op
enin
g ba
lanc
eRu
pees
Open
ing
bala
nce
Rupe
es
CO
ST/R
EVAL
UAT
ION
DEP
REC
IATI
ON
Open
ing
bala
nce
Rupe
es A
dditi
ons
Rupe
es
For
the
year
Ru
pees
Dis
posa
ls
Rupe
es D
ispo
sals
Ru
pees
Clo
sing
ba
lanc
e
Rupe
es
Clos
ing
bala
nce
Rupe
es
Net
Boo
k va
lue
Rup
ees
Rat
e
%
2011
CO
ST/R
EVAL
UAT
ION
DEP
REC
IATI
ON
Open
ing
bala
nce
Rupe
es A
dditi
ons
Rupe
es
For
the
year
Ru
pees
Dis
posa
ls
Rupe
es D
ispo
sals
Ru
pees
Clo
sing
ba
lanc
e
Rupe
es
Clos
ing
bala
nce
Rupe
es
Net
Bo
ok v
alue
Rupe
es
Rat
e
%
2011
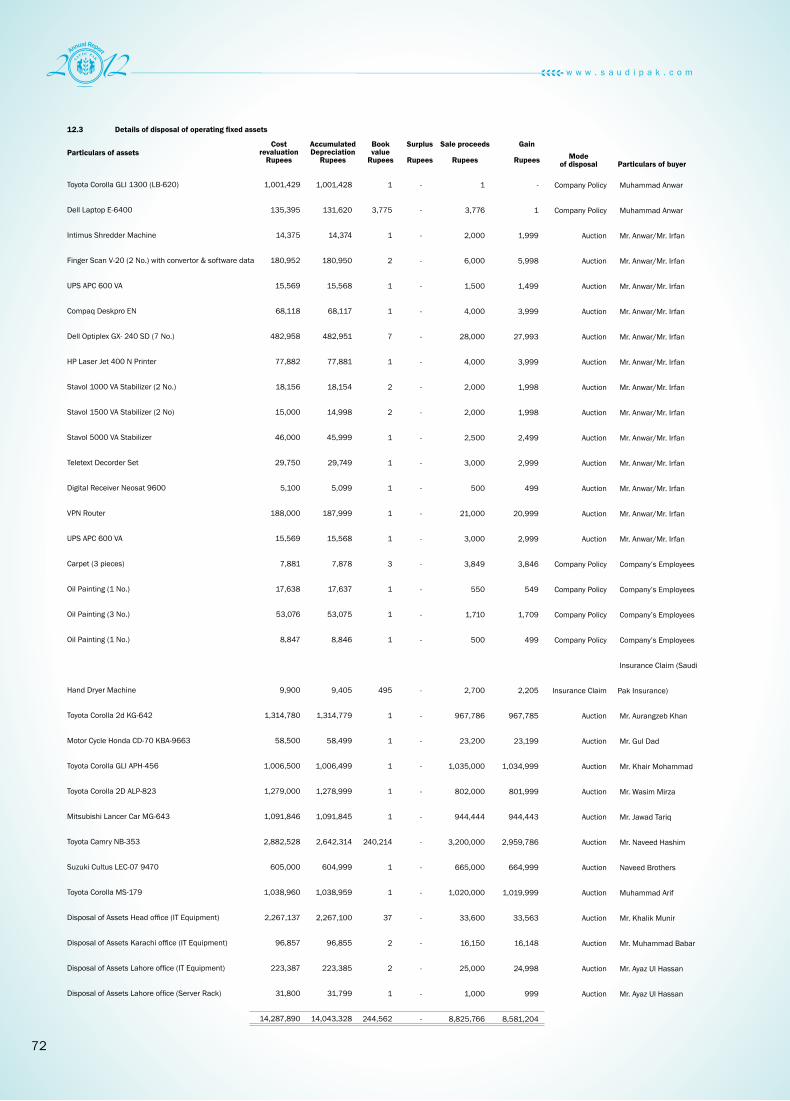
72
Particulars of assets
12.3 Details of disposal of operating fixed assets
Toyota Corolla GLI 1300 (LB-620)
Dell Laptop E-6400
Intimus Shredder Machine
Finger Scan V-20 (2 No.) with convertor & software data
UPS APC 600 VA
Compaq Deskpro EN
Dell Optiplex GX- 240 SD (7 No.)
HP Laser Jet 400 N Printer
Stavol 1000 VA Stabilizer (2 No.)
Stavol 1500 VA Stabilizer (2 No)
Stavol 5000 VA Stabilizer
Teletext Decorder Set
Digital Receiver Neosat 9600
VPN Router
UPS APC 600 VA
Carpet (3 pieces)
Oil Painting (1 No.)
Oil Painting (3 No.)
Oil Painting (1 No.)
Hand Dryer Machine
Toyota Corolla 2d KG-642
Motor Cycle Honda CD-70 KBA-9663
Toyota Corolla GLI APH-456
Toyota Corolla 2D ALP-823
Mitsubishi Lancer Car MG-643
Toyota Camry NB-353
Suzuki Cultus LEC-07 9470
Toyota Corolla MS-179
Disposal of Assets Head office (IT Equipment)
Disposal of Assets Karachi office (IT Equipment)
Disposal of Assets Lahore office (IT Equipment)
Disposal of Assets Lahore office (Server Rack)
1,001,429
135,395
14,375
180,952
15,569
68,118
482,958
77,882
18,156
15,000
46,000
29,750
5,100
188,000
15,569
7,881
17,638
53,076
8,847
9,900
1,314,780
58,500
1,006,500
1,279,000
1,091,846
2,882,528
605,000
1,038,960
2,267,137
96,857
223,387
31,800
14,287,890
1,001,428
131,620
14,374
180,950
15,568
68,117
482,951
77,881
18,154
14,998
45,999
29,749
5,099
187,999
15,568
7,878
17,637
53,075
8,846
9,405
1,314,779
58,499
1,006,499
1,278,999
1,091,845
2,642,314
604,999
1,038,959
2,267,100
96,855
223,385
31,799
14,043,328
1
3,775
1
2
1
1
7
1
2
2
1
1
1
1
1
3
1
1
1
495
1
1
1
1
1
240,214
1
1
37
2
2
1
244,562
-
-
-
-
-
-
-
-
-
-
-
-
-
-
-
-
-
-
-
-
-
-
-
-
-
-
-
-
-
-
-
-
-
1
3,776
2,000
6,000
1,500
4,000
28,000
4,000
2,000
2,000
2,500
3,000
500
21,000
3,000
3,849
550
1,710
500
2,700
967,786
23,200
1,035,000
802,000
944,444
3,200,000
665,000
1,020,000
33,600
16,150
25,000
1,000
8,825,766
-
1
1,999
5,998
1,499
3,999
27,993
3,999
1,998
1,998
2,499
2,999
499
20,999
2,999
3,846
549
1,709
499
2,205
967,785
23,199
1,034,999
801,999
944,443
2,959,786
664,999
1,019,999
33,563
16,148
24,998
999
8,581,204
Company Policy
Company Policy
Auction
Auction
Auction
Auction
Auction
Auction
Auction
Auction
Auction
Auction
Auction
Auction
Auction
Company Policy
Company Policy
Company Policy
Company Policy
Insurance Claim
Auction
Auction
Auction
Auction
Auction
Auction
Auction
Auction
Auction
Auction
Auction
Auction
Muhammad Anwar
Muhammad Anwar
Mr. Anwar/Mr. Irfan
Mr. Anwar/Mr. Irfan
Mr. Anwar/Mr. Irfan
Mr. Anwar/Mr. Irfan
Mr. Anwar/Mr. Irfan
Mr. Anwar/Mr. Irfan
Mr. Anwar/Mr. Irfan
Mr. Anwar/Mr. Irfan
Mr. Anwar/Mr. Irfan
Mr. Anwar/Mr. Irfan
Mr. Anwar/Mr. Irfan
Mr. Anwar/Mr. Irfan
Mr. Anwar/Mr. Irfan
Company’s Employees
Company’s Employees
Company’s Employees
Company’s Employees
Insurance Claim (Saudi
Pak Insurance)
Mr. Aurangzeb Khan
Mr. Gul Dad
Mr. Khair Mohammad
Mr. Wasim Mirza
Mr. Jawad Tariq
Mr. Naveed Hashim
Naveed Brothers
Muhammad Arif
Mr. Khalik Munir
Mr. Muhammad Babar
Mr. Ayaz Ul Hassan
Mr. Ayaz Ul Hassan
Cost revaluation
Rupees
Accumulated Depreciation
Rupees
Book value
Rupees
Surplus
Rupees
Sale proceeds
Rupees Mode of disposal Particulars of buyer
Gain
Rupees
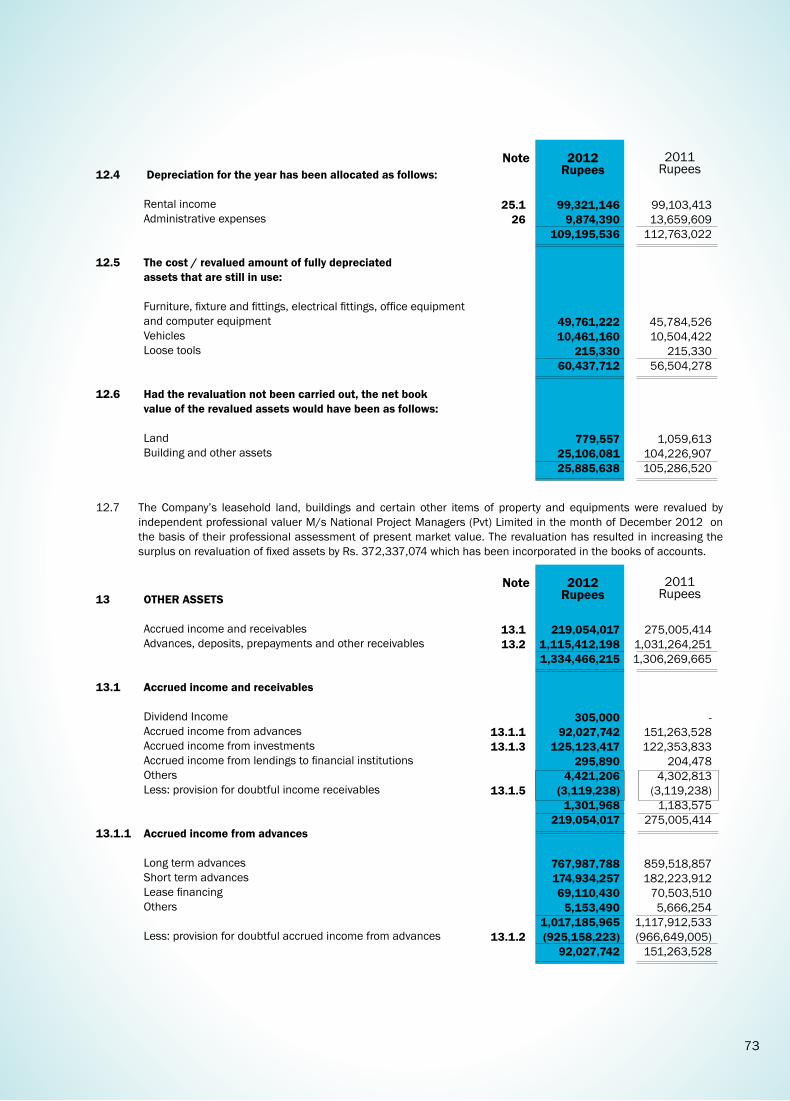
73
12.4 Depreciation for the year has been allocated as follows: Rental income Administrative expenses 12.5 The cost / revalued amount of fully depreciated assets that are still in use: Furniture, fixture and fittings, electrical fittings, office equipment and computer equipment Vehicles Loose tools 12.6 Had the revaluation not been carried out, the net book value of the revalued assets would have been as follows: Land Building and other assets
13 OTHER ASSETS Accrued income and receivables Advances, deposits, prepayments and other receivables 13.1 Accrued income and receivables Dividend Income Accrued income from advances Accrued income from investments Accrued income from lendings to financial institutions Others Less: provision for doubtful income receivables 13.1.1 Accrued income from advances Long term advances Short term advances Lease financing Others Less: provision for doubtful accrued income from advances
12.7 The Company’s leasehold land, buildings and certain other items of property and equipments were revalued by independent professional valuer M/s National Project Managers (Pvt) Limited in the month of December 2012 on the basis of their professional assessment of present market value. The revaluation has resulted in increasing the surplus on revaluation of fixed assets by Rs. 372,337,074 which has been incorporated in the books of accounts.
99,321,146 9,874,390
109,195,536
49,761,222 10,461,160
215,330 60,437,712
779,557 25,106,081 25,885,638
219,054,017 1,115,412,198 1,334,466,215
305,000 92,027,742
125,123,417 295,890
4,421,206 (3,119,238)
1,301,968 219,054,017
767,987,788 174,934,257 69,110,430
5,153,490 1,017,185,965 (925,158,223)
92,027,742
25.126
13.113.2
13.1.113.1.3
13.1.5
13.1.2
99,103,413 13,659,609
112,763,022
45,784,526 10,504,422
215,330 56,504,278
1,059,613 104,226,907 105,286,520
275,005,414 1,031,264,251 1,306,269,665
- 151,263,528 122,353,833
204,478 4,302,813
(3,119,238) 1,183,575
275,005,414
859,518,857 182,223,912
70,503,510 5,666,254
1,117,912,533 (966,649,005)
151,263,528
2012Rupees
2012Rupees
Note
Note
2011Rupees
2011Rupees

74
13.1.2 Provision for doubtful accrued income from advances Opening balance Charge for the year Amounts written off Reversals Closing balance 13.1.3 Accrued income from investments Government Securities Term Finance Certificates (TFCs) Commercial Papers Less: provision for doubtful accrued income from investments 13.1.4 Provision for doubtful accrued income from investments Opening balance Charge for the year Reversals Closing balance 13.1.5 Provision for doubtful income receivables Opening balance Charge for the year Closing balance 13.2 Advances, deposits, prepayments and other receivables Advances to suppliers Security deposits Prepayments Receivable from stock brokers Advance tax Non banking assets acquired in satisfaction of claims Advance for purchase of shares Less: provision for receivable from stock brokers Less: provision for advance for purchase of shares Less: provision for non banking assets acquired in satisfaction of claims
13.2.1 These represent the amount of assets acquired against settlement of advances from various customers. Valuation of these properties was conducted by M/s Harvester Services (Pvt.) Limited. Market value assessed amounts to Rs. 268.133 million. Provision has been created against the shortfall.
966,649,005 105,139,894 (68,014,069) (78,616,607) 925,158,223
73,340,140 210,140,166
- 283,480,306
(158,356,889) 125,123,417
114,205,239 92,213,400
(48,061,750) 158,356,889
3,119,238 -
3,119,238
17,500,146 6,588,245 5,968,102 4,435,867
816,715,763 413,102,345
256,792 1,264,567,260
(3,818,270) (256,792)
(145,080,000) (149,155,062)
1,115,412,198
13.1.4
13.2.1
13.2.2
877,271,300 137,756,144
- (48,378,439) 966,649,005
66,871,806 169,687,266
- 236,559,072
(114,205,239) 122,353,833
60,324,156 70,285,442
(16,404,359) 114,205,239
3,119,238 -
3,119,238
4,293,072 6,508,611 4,805,094 3,910,643
753,694,214 400,008,887
256,792 1,173,477,313
(3,818,270) (256,792)
(138,138,000) (142,213,062) 1,031,264,251
2012Rupees
Note 2011Rupees
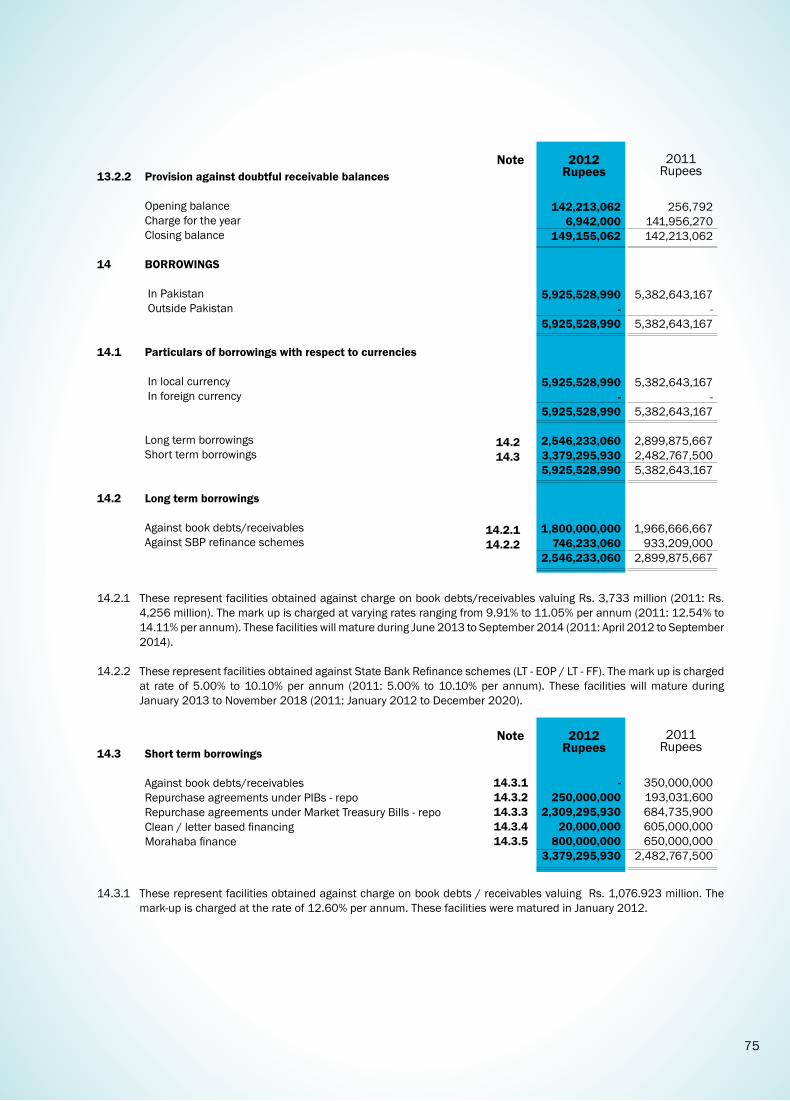
75
13.2.2 Provision against doubtful receivable balances Opening balance Charge for the year Closing balance 14 BORROWINGS In Pakistan Outside Pakistan 14.1 Particulars of borrowings with respect to currencies In local currency In foreign currency Long term borrowings Short term borrowings 14.2 Long term borrowings Against book debts/receivables Against SBP refinance schemes
14.3 Short term borrowings Against book debts/receivables Repurchase agreements under PIBs - repo Repurchase agreements under Market Treasury Bills - repo Clean / letter based financing Morahaba finance
14.2.1 These represent facilities obtained against charge on book debts/receivables valuing Rs. 3,733 million (2011: Rs. 4,256 million). The mark up is charged at varying rates ranging from 9.91% to 11.05% per annum (2011: 12.54% to 14.11% per annum). These facilities will mature during June 2013 to September 2014 (2011: April 2012 to September 2014).
14.2.2 These represent facilities obtained against State Bank Refinance schemes (LT - EOP / LT - FF). The mark up is charged
at rate of 5.00% to 10.10% per annum (2011: 5.00% to 10.10% per annum). These facilities will mature during January 2013 to November 2018 (2011: January 2012 to December 2020).
14.3.1 These represent facilities obtained against charge on book debts / receivables valuing Rs. 1,076.923 million. The mark-up is charged at the rate of 12.60% per annum. These facilities were matured in January 2012.
142,213,062 6,942,000
149,155,062
5,925,528,990 -
5,925,528,990
5,925,528,990 -
5,925,528,990
2,546,233,060 3,379,295,930 5,925,528,990
1,800,000,000 746,233,060
2,546,233,060
- 250,000,000
2,309,295,930 20,000,000
800,000,000 3,379,295,930
14.214.3
14.2.114.2.2
14.3.114.3.214.3.314.3.414.3.5
256,792 141,956,270 142,213,062
5,382,643,167 -
5,382,643,167
5,382,643,167 -
5,382,643,167
2,899,875,667 2,482,767,500 5,382,643,167
1,966,666,667 933,209,000
2,899,875,667
350,000,000 193,031,600 684,735,900 605,000,000 650,000,000
2,482,767,500
2012Rupees
2012Rupees
Note
Note
2011Rupees
2011Rupees

76
14.3.2 These are secured against Pakistan Investment Bonds. These carry markup rate of 9.5% (2011: 11.90%) per annum and will mature in January 2013 (2011: January 2012).
14.3.3 These are secured against Treasury bills. These carry mark up rates ranging from 7.75% to 9.25% (2011: 11.90%) per
annum and are maturing in January 2013 (2011: January 2012).
14.3.4 These represent overnight borrowing in local currency from various financial institutions. These carry interest rate of 9.1% (2011: 10.25% to 12.60%) per annum. This facility will be maturing in January 2013 (2011: January 2012 to March 2012 ).
14.3.5 These represent morahaba finance arranged from an Islamic Bank. These carry markup rates ranging from 9.76%
to 9.86% (2011: 12.23% to 12.47%) per annum. These will be maturing from February 2013 to June 2013 (2011: January 2012 to June 2012).
14.4 Details of borrowings secured/unsecured Secured Borrowings from State Bank of Pakistan : – Against SBP refinance schemes Repurchase agreement borrowings Against book debts/receivables Morahaba finance Unsecured Call borrowings
15 DEPOSITS AND OTHER ACCOUNTS Certificate of Investments (COIs)
16 DEFERRED TAX LIABILITIES Deferred tax credits arising due to following taxable temporary differences: Accelerated tax depreciation Surplus on revaluation of operating fixed assets Surplus / (deficit) on revaluation of securities Deferred tax debits arising due to following deductible temporary differences: Provision against employee benefits Net investment in leases Accumulated tax losses Valuation reserve against accumulated tax losses
15.1 These represent certificate of investments issued to various institutions. The mark up is charged at varying rates ranging from 9.50% to 12.00% per annum (2011: 12.15% to 13.80% per annum). These are repayable in period ranging from January 2013 to June 2013 (2011: January 2012 to December 2012).
16.1 In view of the uncertainty about timings of taxable profits in the foreseeable future against which the tax losses can be utilized, the Company has not recognized deferred tax asset on accumulated tax losses and therefore, has created an equivalent amount of valuation reserve against it amounting to Rs. 484,569,518 (2011: Rs. 574,204,238).
746,233,060 2,559,295,930 1,800,000,000
800,000,000 5,905,528,990
20,000,000 5,925,528,990
685,000,000
18,029,299 780,109,376 119,639,064 917,777,739
(12,082,978) (10,016,588)
(484,569,518) (506,669,084)
411,108,655 484,569,518 895,678,173
15.1
2019
16.1
933,209,000 877,767,500
2,316,666,667 650,000,000
4,777,643,167
605,000,000 5,382,643,167
759,500,000
3,972,837 679,617,796 22,505,053
706,095,686
(11,741,947) (25,122,254)
(574,204,238) (611,068,439)
95,027,247 574,204,238 669,231,485
2012Rupees
2012Rupees
Note
Note
2011Rupees
2011Rupees
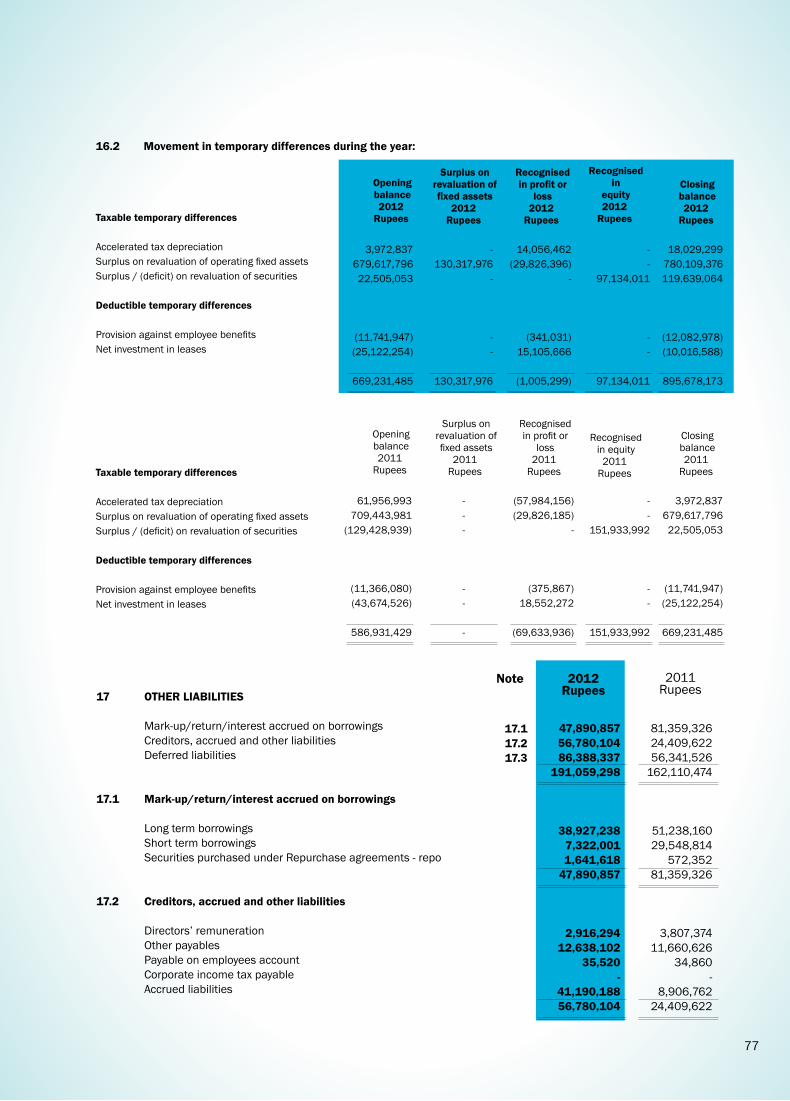
77
17 OTHER LIABILITIES Mark-up/return/interest accrued on borrowings Creditors, accrued and other liabilities Deferred liabilities 17.1 Mark-up/return/interest accrued on borrowings Long term borrowings Short term borrowings Securities purchased under Repurchase agreements - repo 17.2 Creditors, accrued and other liabilities Directors’ remuneration Other payables Payable on employees account Corporate income tax payable Accrued liabilities
Taxable temporary differences
Accelerated tax depreciationSurplus on revaluation of operating fixed assetsSurplus / (deficit) on revaluation of securities
Deductible temporary differences
Provision against employee benefits Net investment in leases
Taxable temporary differences
Accelerated tax depreciationSurplus on revaluation of operating fixed assetsSurplus / (deficit) on revaluation of securities
Deductible temporary differences
Provision against employee benefits Net investment in leases
3,972,837 679,617,796 22,505,053
(11,741,947) (25,122,254)
669,231,485
61,956,993 709,443,981
(129,428,939)
(11,366,080) (43,674,526)
586,931,429
- 130,317,976
-
- -
130,317,976
- - -
- -
-
14,056,462 (29,826,396)
-
(341,031) 15,105,666
(1,005,299)
(57,984,156) (29,826,185)
-
(375,867) 18,552,272
(69,633,936)
- -
97,134,011
- -
97,134,011
- -
151,933,992
- -
151,933,992
18,029,299 780,109,376 119,639,064
(12,082,978) (10,016,588)
895,678,173
3,972,837 679,617,796 22,505,053
(11,741,947) (25,122,254)
669,231,485
16.2 Movement in temporary differences during the year:
47,890,857 56,780,104 86,388,337
191,059,298
38,927,238 7,322,001 1,641,618
47,890,857
2,916,294 12,638,102
35,520 -
41,190,188 56,780,104
17.117.217.3
81,359,326 24,409,622 56,341,526
162,110,474
51,238,160 29,548,814
572,352 81,359,326
3,807,374 11,660,626
34,860 -
8,906,762 24,409,622
2012Rupees
Note
Opening balance
2012Rupees
Opening balance
2011Rupees
Surplus on revaluation of fixed assets
2012Rupees
Surplus on revaluation of fixed assets
2011Rupees
Recognised in profit or
loss 2012
Rupees
Recognised in profit or
loss 2011
Rupees
Recognised in
equity 2012
Rupees
Recognised in equity
2011Rupees
Closing balance
2012Rupees
Closing balance
2011Rupees
2011Rupees
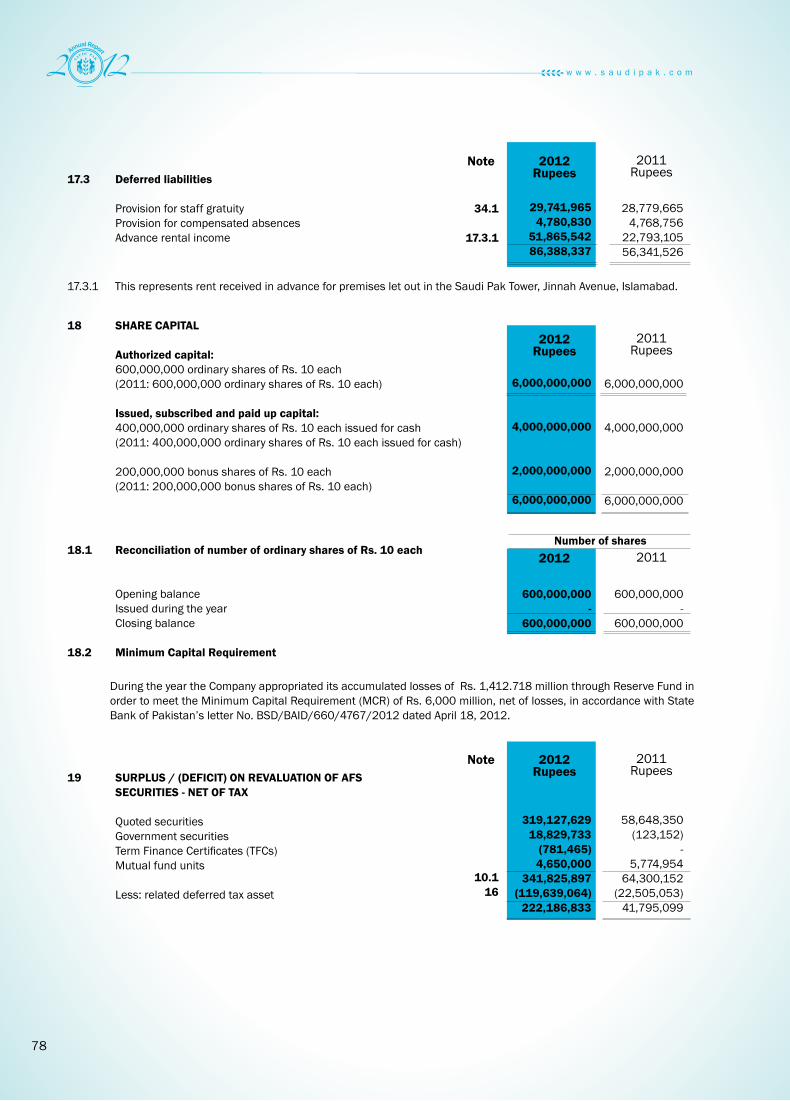
78
17.3 Deferred liabilities Provision for staff gratuity Provision for compensated absences Advance rental income
18 SHARE CAPITAL Authorized capital: 600,000,000 ordinary shares of Rs. 10 each (2011: 600,000,000 ordinary shares of Rs. 10 each) Issued, subscribed and paid up capital: 400,000,000 ordinary shares of Rs. 10 each issued for cash (2011: 400,000,000 ordinary shares of Rs. 10 each issued for cash) 200,000,000 bonus shares of Rs. 10 each (2011: 200,000,000 bonus shares of Rs. 10 each)
17.3.1 This represents rent received in advance for premises let out in the Saudi Pak Tower, Jinnah Avenue, Islamabad.
19 SURPLUS / (DEFICIT) ON REVALUATION OF AFS SECURITIES - NET OF TAX Quoted securities Government securities Term Finance Certificates (TFCs) Mutual fund units Less: related deferred tax asset
18.1 Reconciliation of number of ordinary shares of Rs. 10 each Opening balance Issued during the year Closing balance 18.2 Minimum Capital Requirement
During the year the Company appropriated its accumulated losses of Rs. 1,412.718 million through Reserve Fund in order to meet the Minimum Capital Requirement (MCR) of Rs. 6,000 million, net of losses, in accordance with State Bank of Pakistan’s letter No. BSD/BAID/660/4767/2012 dated April 18, 2012.
Number of shares
29,741,965 4,780,830
51,865,542 86,388,337
6,000,000,000
4,000,000,000
2,000,000,000
6,000,000,000
319,127,629 18,829,733
(781,465) 4,650,000
341,825,897 (119,639,064)
222,186,833
600,000,000 -
600,000,000
34.1
17.3.1
10.116
28,779,665 4,768,756
22,793,105 56,341,526
6,000,000,000
4,000,000,000
2,000,000,000
6,000,000,000
58,648,350 (123,152)
- 5,774,954
64,300,152 (22,505,053)
41,795,099
600,000,000 -
600,000,000
2012Rupees
2012Rupees
2012Rupees
2012
Note
Note
2011Rupees
2011Rupees
2011Rupees
2011

79
20 SURPLUS ON REVALUATION OF OPERATING FIXED ASSETS - NET OF TAX Movement in surplus on revaluation of operating fixed assets: Opening balance Surplus on revaluation of fixed assets Surplus realized on disposal Transferred to unappropriated profit in respect of – Incremental depreciation charged during the year – Deferred tax Surplus on revaluation of operating fixed assets Related deferred tax liability Deferred tax recognized on surplus on revaluation of fixed assets Transferred to unconsolidated profit and loss account in respect of incremental depreciation Closing balance
21 CONTINGENCIES AND COMMITMENTS 21.1 Direct credit substitutes Letter of comfort / guarantee 21.2 Non disbursed commitment for term and working capital finance 21.3 Commitments in respect of purchase of forward exchange contracts [USD 27.40 million] 21.4 Commitments for the acquisition of operating fixed assets (intangibles assets)
21.5 Tax contingencies (a) Assessment Orders Under Income Tax Ordinance, 2001 Tax year 2004, 2005 and 2006
Provision for Non-Performing Loans (NPLs) for tax years 2004, 2005 and 2006 were disallowed by the tax authorities and restricted the credit for tax paid/suffered during the relevant tax years. As a consequence of foregoing, cumulative income tax demand of Rs. 63.8 million was raised by the Income Tax Authorities. Although the said demands have been paid, these are being contested by the Company and related appeals are presently pending for adjudication before Appellate Tribunal Inland Revenue (ATIR). It is likely that the appeals will be decided in favour of the Company.
(b) Tax year 2008 and 2009 The Company’s income tax liability after relief by Commissioner Inland Revenue (Appeals) is now Rs 231 million
and Rs. 612 million for the tax year 2008 and 2009 respectively out of which the Company paid Rs. 425 million. Certain issues including disallowance of provision against NPLs and apportionment of expenses are being contested in appeals before ATIR, which are likely to be decided in Company’s favor.
(c) Tax year 2010 The Company’s income tax liability after relief by Commissioner Inland Revenue (Appeals) is now Rs 147 million
out of which the Company paid Rs. 30 million. Certain issues including disallowance of provision against NPLs and
1,941,591,296 372,337,074
-
(55,391,880) (29,826,396) (85,218,276)
2,228,710,094
(679,617,796) (130,317,976)
29,826,396 (780,109,376)
1,448,600,718
207,385,000
1,016,363,000
-
31,550,741
1,255,298,741
16
2,026,825,068 -
(16,100)
(55,391,487) (29,826,185) (85,217,672)
1,941,591,296
(709,443,981) -
29,826,185 (679,617,796)
1,261,973,500
18,134,000
824,499,000
2,463,933,000
5,664,339
3,312,230,339
2012Rupees
Note 2011Rupees

80
apportionment of expenses are being contested in appeals before ATIR, which are likely to be decided in Company’s favor.
21.6 Other contingencies
(a) Ceco Tyre Ltd (COS No.141/2009 of Rs. 202.00 million)
Saudi Pak had sanctioned a long term finance facility of Rs.30.00 million on 20.10.2008 in favor of Ceco Tyre Ltd which was not disbursed due to negative e-CIB reported by the Bank of Punjab (BOP).
Subsequently in the year 2009, Ceco Tyre Ltd filed the subject damages suit against the Company for allegedly suffering business losses due to non-disbursement of approved finance. On completion of evidence of both the parties, the matter will be fixed for final arguments of legal counsels before the Court. Saudi Pak is vehemently defending the suit as the Plaintiff had no cause of action against Saudi Pak. It is likely to be dismissed by the honorable Court after hearing final arguments.
(b) Ali Akbar Spinning Mills Limited (COS No.113/2009/10 of Rs.827.102 million)
Ali Akbar Spinning Mills Limited is a willful defaulter against whom a recovery suit for Rs.91.886 million has been filed
by the Company in the High Court. Ali Akbar Spinning Mills Limited feeling aggrieved by the Company’s action and to forestall and delay the payments, filed the titled frivolous suit for damages.
The Plaintiff had mainly alleged to have suffered business losses of Rs.827.102 million due to over-payments to and not allowing additional financing by the Company. The Company had made no such commitment.
The Company is vehemently contesting this frivolous suit and is likely to be dismissed.
22 MARK-UP/RETURN/INTEREST EARNED On advances On investments On lendings to financial institutions On lease financing On profit and loss saving accounts 22.1 On advances Long term advances Short term advances Staff advances 22.2 On investments Term Finance Certificates Government securities 23 MARK-UP/RETURN/INTEREST EXPENSED Mark-up/return/interest expensed PIB’s premium amortization Brokerage fee
579,871,443 466,756,394
30,411,683 14,052,541
3,757,467 1,094,849,528
537,782,799 41,627,529
461,115 579,871,443
192,595,345 274,161,049 466,756,394
652,373,058 14,471,909
1,705,568 668,550,535
22.122.2
23.1
786,205,566 506,963,244
14,857,059 15,968,247
2,978,256 1,326,972,372
714,438,423 71,370,920
396,223 786,205,566
246,155,889 260,807,355 506,963,244
932,227,741 16,927,990
1,579,161 950,734,892
2012Rupees
Note 2011Rupees
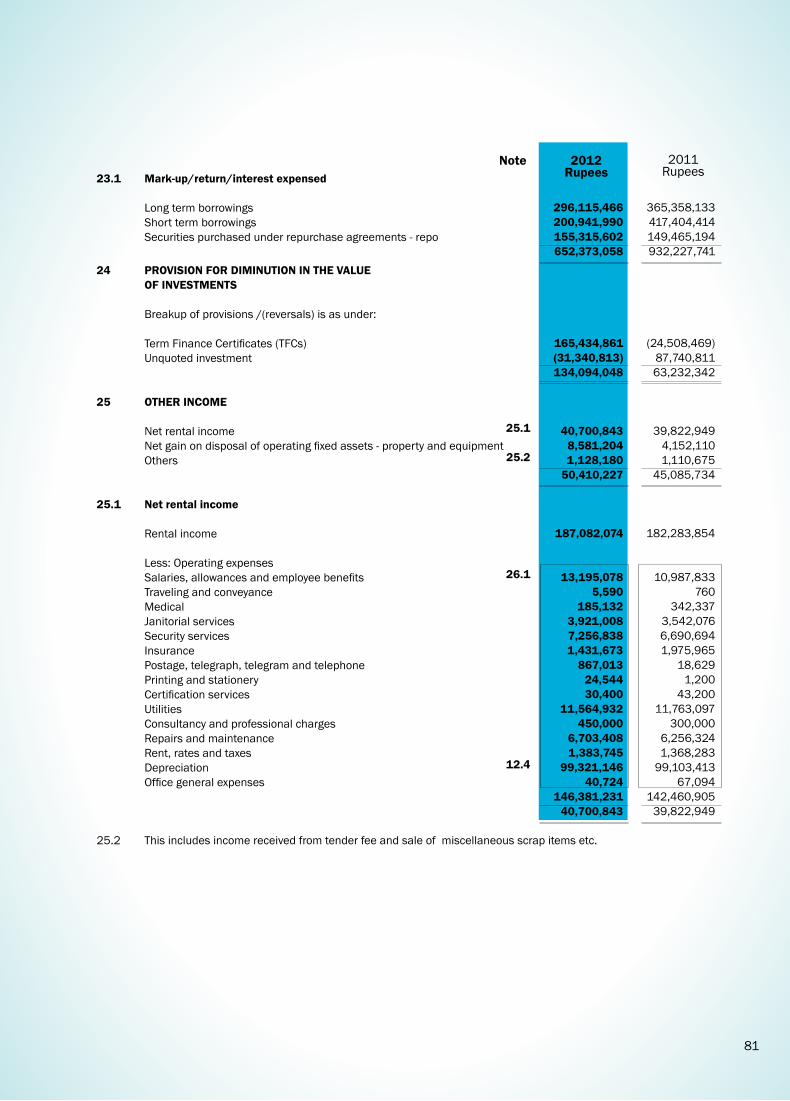
81
23.1 Mark-up/return/interest expensed Long term borrowings Short term borrowings Securities purchased under repurchase agreements - repo
24 PROVISION FOR DIMINUTION IN THE VALUE OF INVESTMENTS Breakup of provisions /(reversals) is as under: Term Finance Certificates (TFCs) Unquoted investment 25 OTHER INCOME Net rental income Net gain on disposal of operating fixed assets - property and equipment Others 25.1 Net rental income Rental income Less: Operating expenses Salaries, allowances and employee benefits Traveling and conveyance Medical Janitorial services Security services Insurance Postage, telegraph, telegram and telephone Printing and stationery Certification services Utilities Consultancy and professional charges Repairs and maintenance Rent, rates and taxes Depreciation Office general expenses 25.2 This includes income received from tender fee and sale of miscellaneous scrap items etc.
296,115,466 200,941,990 155,315,602 652,373,058
165,434,861 (31,340,813) 134,094,048
40,700,843 8,581,204 1,128,180
50,410,227
187,082,074
13,195,078 5,590
185,132 3,921,008 7,256,838 1,431,673
867,013 24,544 30,400
11,564,932 450,000
6,703,408 1,383,745
99,321,146 40,724
146,381,231 40,700,843
25.1
25.2
26.1
12.4
365,358,133 417,404,414 149,465,194 932,227,741
(24,508,469) 87,740,811 63,232,342
39,822,949 4,152,110 1,110,675
45,085,734
182,283,854
10,987,833 760
342,337 3,542,076 6,690,694 1,975,965
18,629 1,200
43,200 11,763,097
300,000 6,256,324 1,368,283
99,103,413 67,094
142,460,905 39,822,949
2012Rupees
Note 2011Rupees

82
26 ADMINISTRATIVE EXPENSES Salaries, allowances and employee benefits Traveling and conveyance Vehicle running expenses Utilities Advertisement and publicity Postage, telegram, telephone and telex Printing, stationery and periodical Legal and professional charges Consultancy, custodial and rating services Auditor’s remuneration Repair and maintenance Office and general expenses Bank charges Professional training Insurance Depreciation Donations
26.3 Auditors’ remuneration Audit fee Half yearly review Code of Corporate Governance review Out of pocket expenses
153,057,517 22,545,597
3,293,637 6,134,063 1,224,885 5,850,633 3,433,695 3,544,280
10,328,378 675,000
4,918,269 18,412,322
423,484 1,245,996 1,720,734 9,874,390
50,000
246,732,880
502,000 75,000 23,000 75,000
675,000
26.126.2
26.3
12.426.4
109,429,570 32,072,933
3,122,033 4,420,297 1,351,823 5,601,086 2,930,685 3,930,978 5,213,997
495,000 4,867,082
14,114,559 372,092
1,036,023 657,522
13,659,609 -
203,275,289
368,500 55,000 16,500 55,000
495,000
2012Rupees
2012Rupees
Note
Note
2011Rupees
2011Rupees
26.1 This includes the followings staff benefits:
– Rs. 4.051 million (2011: Rs. 3.528 million) on account of employee provident fund expense;
– Rs. 6.394 million (2011: Rs. 5.629 million) on account of gratuity expense; and
– Rs. 1.207 million (2011: Rs. 2.771 million) on account of compensated absences expense. 26.2 This includes payments made to Directors of the Company for attending Board / Board’s committee meetings
amounting to Rs. 13.747 million (2011: Rs. 18.917 million).
26.4 The donation was given to the Life Welfare Society for affectees of floods in Pakistan through Pakistan Rangers (Punjab).
27 IMPAIRMENT LOSS ON QUOTED SECURITIES
During the year, the Company has charged impairment loss on quoted securities in accordance with the accounting policy [refer note 5.3 (c) ] based on criteria for significant and prolonged decline in value of securities as approved by the Board of Directors.

83
28 OTHER PROVISIONS/WRITE OFFS Provision against non banking assets acquired in satisfaction of claims Provision against receivable from stock brokers
29 OTHER CHARGES Penalties imposed by the State Bank of Pakistan 30 TAXATION – Current year – Prior years – Deferred 30.1 Relationship between tax expense and accounting profit / (loss) Accounting profit/ (loss) for the year Tax rate Tax on accounting profit / (loss) Tax effect on income subject to lower rate of taxation Tax effect of other income considered separately Tax effect of prior years Deferred tax asset not recognised Tax effect of permanent differences 30.2 Tax status For tax related contingencies - refer note 21.5. 31 BASIC AND DILUTED LOSS PER SHARE Profit / (Loss) for the year - Rupees Weighted average number of ordinary shares - Number Basic and diluted earning / (loss) per share - Rupees 32 CASH AND CASH EQUIVALENTS Cash and balance with treasury banks Balance with other banks
6,942,000 -
6,942,000
-
25,885,193 -
(1,005,299)
24,879,894
405,464,676
35%
141,912,637 4,427,912
(15,296,259) -
(88,974,802) (17,189,594)
24,879,894
380,584,782
600,000,000
0.634
65,538,416 366,097,455
431,635,871
30.1
67
138,138,000 3,818,270
141,956,270
922,250
26,698,535 99,296,373
(69,633,936)
56,360,972
(1,411,748,812)
35%
(494,112,084) (17,757,539) 402,431,309
99,296,373 105,670,479 (39,167,566)
56,360,972
(1,468,109,784)
600,000,000
(2.447)
55,410,802 96,389,187
151,799,989
2012Rupees
Note 2011Rupees
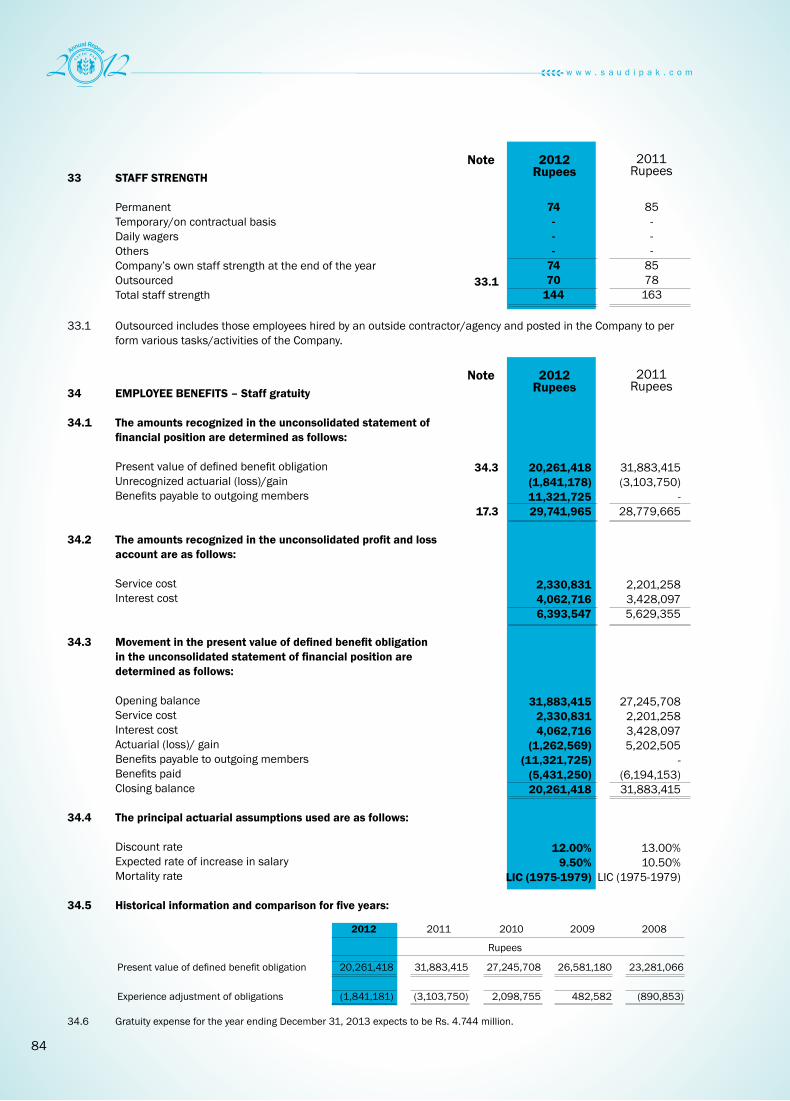
84
33 STAFF STRENGTH Permanent Temporary/on contractual basis Daily wagers Others Company’s own staff strength at the end of the year Outsourced Total staff strength
34 EMPLOYEE BENEFITS – Staff gratuity 34.1 The amounts recognized in the unconsolidated statement of financial position are determined as follows: Present value of defined benefit obligation Unrecognized actuarial (loss)/gain Benefits payable to outgoing members 34.2 The amounts recognized in the unconsolidated profit and loss account are as follows: Service cost Interest cost 34.3 Movement in the present value of defined benefit obligation in the unconsolidated statement of financial position are determined as follows: Opening balance Service cost Interest cost Actuarial (loss)/ gain Benefits payable to outgoing members Benefits paid Closing balance 34.4 The principal actuarial assumptions used are as follows: Discount rate Expected rate of increase in salary Mortality rate 34.5 Historical information and comparison for five years:
Present value of defined benefit obligation
Experience adjustment of obligations
34.6 Gratuity expense for the year ending December 31, 2013 expects to be Rs. 4.744 million.
20,261,418
(1,841,181)
31,883,415
(3,103,750)
27,245,708
2,098,755
26,581,180
482,582
23,281,066
(890,853)
2012
Rupees
2011 2010 2009 2008
33.1 Outsourced includes those employees hired by an outside contractor/agency and posted in the Company to per form various tasks/activities of the Company.
74 - - -
74 70
144
20,261,418 (1,841,178) 11,321,725 29,741,965
2,330,831 4,062,716 6,393,547
31,883,415 2,330,831 4,062,716
(1,262,569) (11,321,725)
(5,431,250) 20,261,418
12.00%9.50%
LIC (1975-1979)
33.1
34.3
17.3
85 - - -
85 78
163
31,883,415 (3,103,750)
- 28,779,665
2,201,258 3,428,097 5,629,355
27,245,708 2,201,258 3,428,097 5,202,505
- (6,194,153) 31,883,415
13.00%10.50%
LIC (1975-1979)
2012Rupees
2012Rupees
Note
Note
2011Rupees
2011Rupees

85
FeesManagerial remunerationContribution to defined contribution planRent and house maintenanceUtilitiesMedicalBonus and Others
Number of persons
AssetsCash balances with treasury banksBalances with other banksNon-current asset classified as held for saleLendings to financial institutionsInvestmentsAdvancesOther assets
Liabilities
BorrowingsDeposits and other accountsOther liabilities
Commitments in respect of purchase of forward exchange contracts
36.1 On-balance sheet financial instruments (continued)
36.2 Off-balance sheet financial instruments
35 COMPENSATION OF CHIEF EXECUTIVE, DIRECTORS AND EXECUTIVES
- 7,180,645
718,065 4,488,387
718,065 87,053
1,789,933 14,982,148
1
65,538,416 366,097,455
46,089,659 250,000,000
6,496,892,685 4,961,664,693
74,591,614 12,260,874,522
5,925,528,990 685,000,000 104,670,961
6,715,199,951
-
55,410,802 96,389,187 70,788,801
171,111,111 5,359,657,799 5,235,500,341
136,959,787 11,125,817,828
5,382,643,167 759,500,000 105,768,948
6,247,912,115
2,463,933,000
- 1,135,320
113,532 681,192 113,532 188,717 689,659
2,921,952
1
2,916,294 - - - - - -
2,916,294
6
3,807,374 - - - - - -
3,807,374
6
- 19,908,000
1,990,800 11,944,800
1,990,800 3,318,000
11,285,181 50,437,581
29
- 16,395,234
1,639,523 9,837,140 1,639,523 2,717,868 9,990,911
42,220,199
24
2012
2012
2012
2011
2011
2012 2012Chief Executive
Book value Rupees
Book value Rupees
Book value Rupees
Book value Rupees
Fair value Rupees
Fair value Rupees
Fair value Rupees
Fair value Rupees
Directors Executives2011 2011 2011
35.1 Chief Executive and majority of executives are also provided with Company maintained cars. 36 FAIR VALUE OF FINANCIAL INSTRUMENTS
36.1 On-balance sheet financial instruments
The fair value of quoted investments is based on quoted market prices and rates quoted at Reuters Pages (PKRV) with the exception of unlisted securities. Fair value of remaining financial assets and liabilities except fixed term loans, staff loans, non-performing advances and fixed term deposits is not significantly different from the carrying amounts . Fair value of fixed term loans, staff loans, and fixed term deposits cannot be calculated with sufficient reliability due to absence of current and active market for such assets / liabilities and reliable data regarding mar-ket rates for similar instruments. The provision for non-performing advances is calculated in accordance with the Company’s accounting policy as stated in note 5.9. The effective rates and maturity profile are stated in note 41.2.4 and 41.3.1 respectively.

86
Fair value is the amount for which an asset could be exchanged, or a liability settled, between knowledgeable willing parties in an arm’s length transaction.
The fair value of quoted investments is based on quoted market prices and rates quoted at Reuters Pages (PKRV) with the exception of unlisted securities. Fair value of unquoted equity investments is determined on the basis of lower of cost and break-up value of these investments as per the latest available financial statements.
The fair value of fixed term advances of over one year and fixed term deposits of over one year can not be calculated with sufficient reliability due to non-availability of relevant active market for similar assets and liabilities. Loans and advances are reduced for any impairment against non-performing advances determined in accordance with Prudential Regulations.
In the opinion of the management, the fair value of the remaining financial assets and liabilities are not significantly different from their carrying value since assets and liabilities are either short term in nature or in the case of customer loans and deposits are frequently repriced. The maturity profile and effective rates are stated in note 41.2.4
37 DERIVATIVE INSTRUMENTS
The Company does not deal in derivative instruments.
38 SEGMENT DETAILS WITH RESPECT TO BUSINESS ACTIVITIES
The segment analysis with respect to business activity is as follows:
Total income Total expenses Net income (loss) Segment assets (gross) Segment non performing loans Segment provision required Segment liabilities Segment Return On net Assets (ROA) (%) Segment cost of funds (%)
Total income Total expenses Net income (loss) Segment assets (gross) Segment non performing loans Segment provision required Segment liabilities Segment Return On net Assets (ROA) (%) Segment cost of funds (%)
800,905 539,259 261,646
10,602,071 3,680,883 2,506,452 3,818,274
2.47 5.09
1,051,183 1,378,597 (327,414)
11,552,792 3,685,942 2,412,841 3,908,093
(2.83) 11.93
786,925 684,936 101,989
8,066,348 - -
3,032,308 1.26 8.49
125,614 1,250,883
(1,125,269) 6,828,543
- -
2,347,322 (16.48)
18.32
188,210 146,381
41,829 2,105,355
- -
846,684 1.99 6.95
183,395 142,461
40,934 2,483,706
- -
718,070 1.65 5.74
1,776,040 1,370,576
405,464 20,773,774 3,680,883 2,506,452 7,697,266
1.95 6.60
1,360,192 2,771,941
(1,411,749) 20,865,041
3,685,942 2,412,841 6,973,485
(6.77) 13.29
Corporate Finance
2012Rs. 000
Corporate Finance
2011Rs. 000
Trading and sales
2012Rs. 000
Trading and sales
2011Rs. 000
Building rental
services2012
Rs. 000
Building rental services
2011Rs. 000
Total2012
Rs. 000
Total
2011Rs. 000
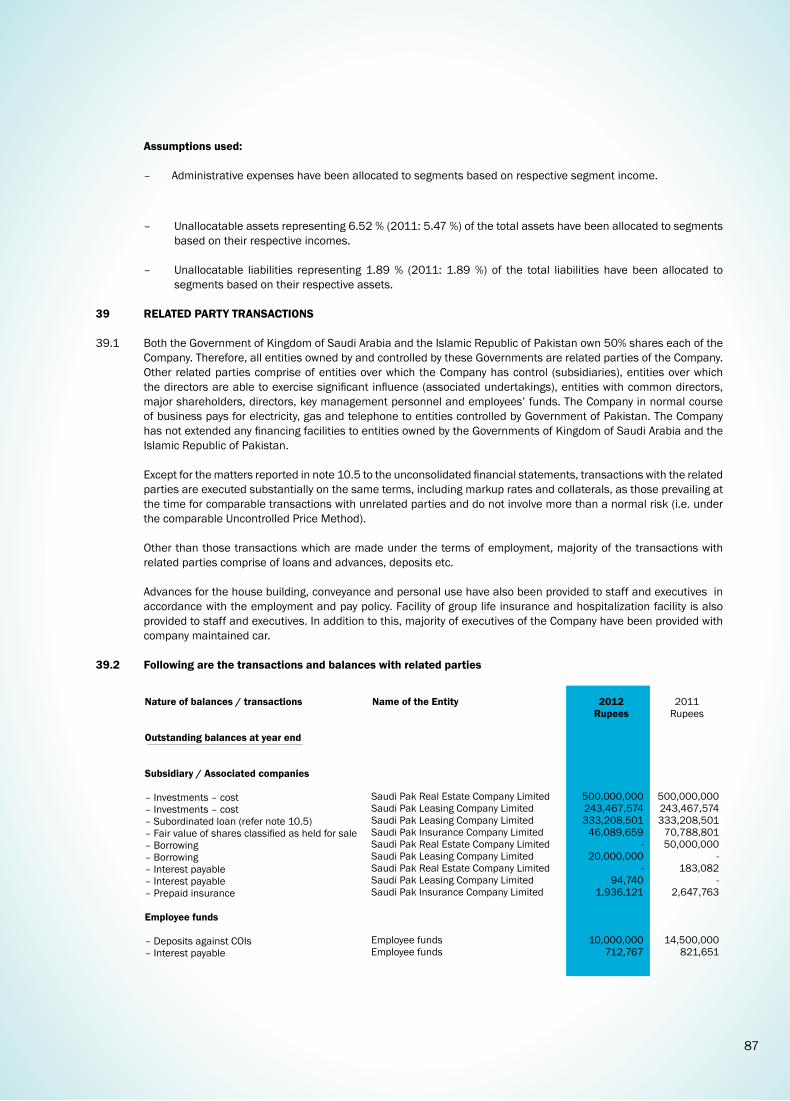
87
Assumptions used: – Administrative expenses have been allocated to segments based on respective segment income.
– Unallocatable assets representing 6.52 % (2011: 5.47 %) of the total assets have been allocated to segments based on their respective incomes.
– Unallocatable liabilities representing 1.89 % (2011: 1.89 %) of the total liabilities have been allocated to segments based on their respective assets.
39 RELATED PARTY TRANSACTIONS 39.1 Both the Government of Kingdom of Saudi Arabia and the Islamic Republic of Pakistan own 50% shares each of the
Company. Therefore, all entities owned by and controlled by these Governments are related parties of the Company. Other related parties comprise of entities over which the Company has control (subsidiaries), entities over which the directors are able to exercise significant influence (associated undertakings), entities with common directors, major shareholders, directors, key management personnel and employees’ funds. The Company in normal course of business pays for electricity, gas and telephone to entities controlled by Government of Pakistan. The Company has not extended any financing facilities to entities owned by the Governments of Kingdom of Saudi Arabia and the Islamic Republic of Pakistan.
Except for the matters reported in note 10.5 to the unconsolidated financial statements, transactions with the related parties are executed substantially on the same terms, including markup rates and collaterals, as those prevailing at the time for comparable transactions with unrelated parties and do not involve more than a normal risk (i.e. under the comparable Uncontrolled Price Method).
Other than those transactions which are made under the terms of employment, majority of the transactions with
related parties comprise of loans and advances, deposits etc.
Advances for the house building, conveyance and personal use have also been provided to staff and executives in accordance with the employment and pay policy. Facility of group life insurance and hospitalization facility is also provided to staff and executives. In addition to this, majority of executives of the Company have been provided with company maintained car.
39.2 Following are the transactions and balances with related parties
Nature of balances / transactions Name of the Entity 2012Rupees
2011Rupees
Outstanding balances at year end Subsidiary / Associated companies – Investments – cost – Investments – cost – Subordinated loan (refer note 10.5)– Fair value of shares classified as held for sale– Borrowing – Borrowing – Interest payable – Interest payable – Prepaid insurance Employee funds
– Deposits against COIs – Interest payable
Saudi Pak Real Estate Company LimitedSaudi Pak Leasing Company LimitedSaudi Pak Leasing Company LimitedSaudi Pak Insurance Company LimitedSaudi Pak Real Estate Company LimitedSaudi Pak Leasing Company LimitedSaudi Pak Real Estate Company LimitedSaudi Pak Leasing Company LimitedSaudi Pak Insurance Company Limited
Employee fundsEmployee funds
500,000,000 243,467,574 333,208,501
46,089,659 -
20,000,000 -
94,740 1,936,121
10,000,000 712,767
500,000,000 243,467,574 333,208,501
70,788,801 50,000,000
- 183,082
- 2,647,763
14,500,000 821,651

88
Nature of balances / transactions
39 RELATED PARTY TRANSACTIONS (continued)
Name of the Entity 2012Rupees
2011Rupees
Transactions during the year Subsidiary / Associated companies – Adjustment against COIs placement – Borrowing availed – Deposits against COIs – Borrowing availed – Interest expensed – Interest expensed – Rent received – Rent received – Rent received – Claims received – Premium paid – Maturity of borrowing – Maturity of deposits against COIs– Farm house related expenses paid– Fair value of shares classified as held for sale– Installment received
40 CAPITAL ADEQUACY 40.1 Scope of applications
The Basel II framework has been applied in accordance with Circular No. BSD/BAI-2/201/1490/2008 dated December 30, 2008. Standardized Approach is used for calculating the Capital Adequacy for Market and Credit risk while Basic Indicator Approach (BIA) is used for Operational Risk Capital Adequacy purpose. The Company has three subsidiaries, namely Saudi Pak Real Estate Company Limited (SPREL), Saudi Pak Insurance Company Limited (SPICL) and Saudi Pak Leasing Company Limited (SPLCL). SPREL is the wholly-owned subsidiary while SPLCL is 35.06% owned by the Company and SPICL is 54.87% of the Company (this investment has been classified as non-current asset held for sale - also refer notes 8 and 10.5). The fact that the Company has neither any significant minority investments in banking, securities, or any other financial entities nor does it has any majority or significant minority equity holding in an insurance excludes it from a need for further consolidation. Furthermore, the Company does not indulge in any securitization activity that shields it from the risk inherent in securitization.
40.2 Capital management
The objective of managing capital is to safeguard the Company’s ability to continue as a going concern, so that it could continue to provide adequate returns to shareholders by pricing products and services commensurately with the level of risk. It is the policy of the Company to maintain a strong capital base so as to maintain investor, creditor and market confidence and to sustain future development of the business. The impact of the level of capital on shareholders’ return is also recognised and the Company recognises the need to maintain a balance between the higher returns that might be possible with greater gearing and the advantages and security afforded by a sound capital position.
Saudi Pak Leasing Company LtdSaudi Pak Real Estate Company LtdSaudi Pak Real Estate Company LtdSaudi Pak Leasing Company LimitedSaudi Pak Real Estate Company LimitedSaudi Pak Leasing Company LimitedSaudi Pak Leasing Company LimitedSaudi Pak Insurance Company LimitedSaudi Pak Real Estate Company LtdSaudi Pak Insurance Company LimitedSaudi Pak Insurance Company LimitedSaudi Pak Real Estate Company LimitedSaudi Pak Real Estate Company LimitedSaudi Pak Real Estate Company LimitedSaudi Pak Insurance Company LimitedSaudi Pak Insurance Company Limited
- -
50,000,000 20,000,000
2,305,000 94,740
441,000 1,887,000 3,339,360
668,262 2,206,791
50,000,00050,000,000 2,211,068
15,300,858 40,000,000
103,525,000 50,000,000
- -
183,082 -
696,045 987,900
- 240,381
3,710,597 - - -
(104,211,199) 50,000,000
Key Management Personnel – Advances to executives – Repayment of advances Employee funds – Deposits against COIs – Maturity of deposits against COIs – Borrowings availed – Borrowings paid – Contribution to the employees provident fund – Interest expense
10,128,850 5,918,694
- 4,500,000
- -
4,050,538 1,788,668
3,030,000 4,096,838
13,046,247 13,620,000 15,029,589 15,029,589
3,528,150 1,455,231
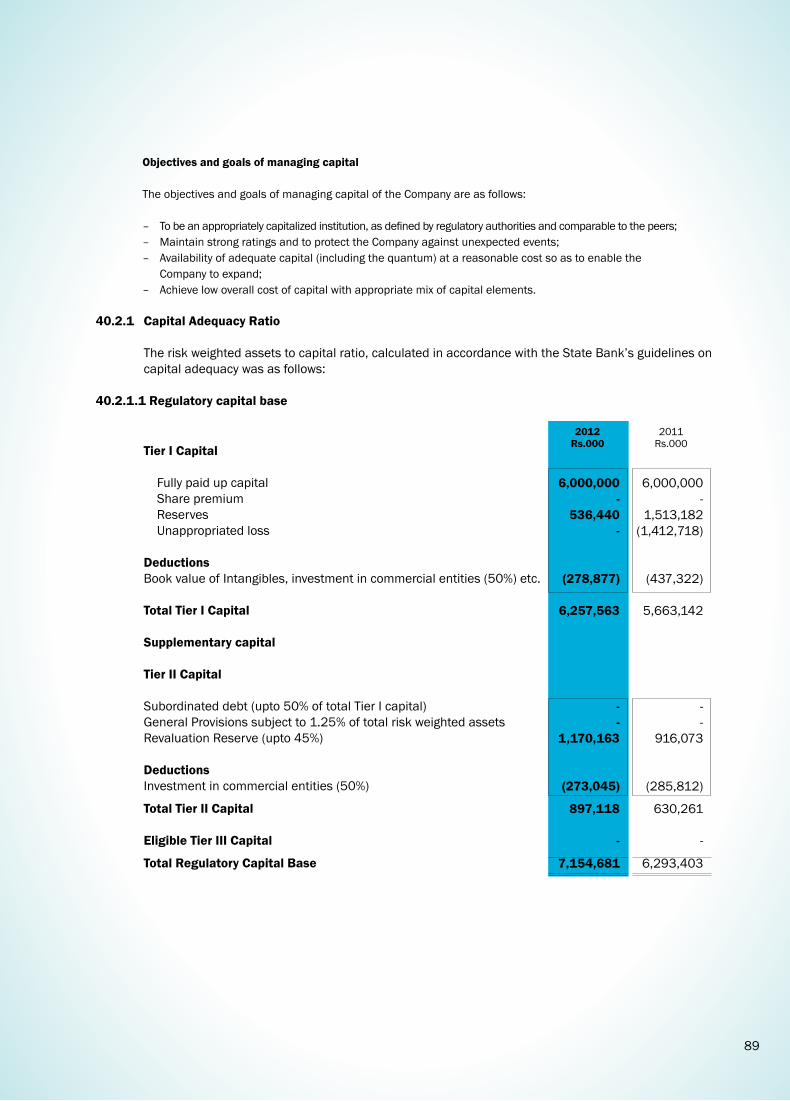
89
Objectives and goals of managing capital The objectives and goals of managing capital of the Company are as follows:
– To be an appropriately capitalized institution, as defined by regulatory authorities and comparable to the peers;– Maintain strong ratings and to protect the Company against unexpected events; – Availability of adequate capital (including the quantum) at a reasonable cost so as to enable the Company to expand; – Achieve low overall cost of capital with appropriate mix of capital elements.
40.2.1 Capital Adequacy Ratio
The risk weighted assets to capital ratio, calculated in accordance with the State Bank’s guidelines on capital adequacy was as follows:
40.2.1.1 Regulatory capital base
Tier I Capital Fully paid up capital Share premium Reserves Unappropriated loss Deductions Book value of Intangibles, investment in commercial entities (50%) etc. Total Tier I Capital Supplementary capital Tier II Capital Subordinated debt (upto 50% of total Tier I capital) General Provisions subject to 1.25% of total risk weighted assets Revaluation Reserve (upto 45%) Deductions Investment in commercial entities (50%) Total Tier II Capital Eligible Tier III Capital Total Regulatory Capital Base
2012Rs.000
2011Rs.000
6,000,000 -
536,440 -
(278,877)
6,257,563
- -
1,170,163
(273,045)
897,118
-
7,154,681
6,000,000 -
1,513,182 (1,412,718)
(437,322)
5,663,142
- -
916,073
(285,812)
630,261
-
6,293,403

90
Market Risk Portfolios subject to Standardized Approach
Interest rate risk Equity position risk Foreign exchange risk Operational Risk
Capital Adequacy Ratio Total eligible regulatory capital held - Rs. (000)
Total Risk Weighted Assets - Rs. (000) Capital Adequacy Ratio - % age
40.3 Credit Risk-General Disclosures Basel II Specific The Company used standardized approach for credit risk. 40.3.1 Credit Risk: Disclosures for portfolio subject to the Standardized Approach Types of Exposures and ECAI’s used - 2012
26,457 227,095
4,169
108,710
1,855,762
11,944 305,977 349,230
130,505
2,306,244
(a)
(b)
(a) / (b)
188,975 1,622,110
29,779
776,503
13,255,448
2012
7,154,681
13,255,448
53.98%
85,313 2,185,550 2,494,500
932,176
16,473,165
2011
6,293,403
16,473,165
38.20%
2012
Rs. 000 Rs. 000Rs. 000 Rs. 000Capital Requirements Risk Weighted Assets
2011 2012 2011
Exposures
Corporate Banks
JCR-VIS
xx
PACRA
xx
Credit Risk Claims on: Corporate Banks Sovereigns Retail portfolio Secured by residential property Past Due Loans Listed equity investments Unlisted equity investments Fixed Assets Other Assets Off Balance Sheet Exposure-Market Related
631,521 16,200
- 2,345
230 223,486
46,222 49,594
333,533 186,200
-
917,499 6,934
- 1,621
243 -
58,125 50,114
290,964 182,398
690
4,510,867 115,714
- 16,751
1,640 1,596,329
330,156 354,244
2,382,379 1,330,001
-
6,553,563 49,526
- 11,575
1,737 -
415,177 357,957
2,078,317 1,302,846
4,928
2012
Rs. 000 Rs. 000Rs. 000 Rs. 000Capital Requirements Risk Weighted Assets
2011 2012 2011

91
40.3.2 Credit Exposures subject to Standardized approach
CRM= Credit Risk Mitigation
Amount Outstanding
Rs. 000
Exposures
Corporate
Banks
Unrated
418,353 2,294,767
7,750 13,417
576,763 331,961
-
7,800,585
11,443,596
883,135 1,059,786
126,804 818,392
581,838 80,884
84
7,891,187
11,442,110
RatingCategory
123,45,6
123
- - - -
- - -
-
-
- - - -
- - -
-
-
418,353 2,294,767
7,750 13,417
576,763 331,961
-
7,800,585
11,443,596
883,135 1,059,786
126,804 818,392
581,838 80,884
84
7,891,187
11,442,110
Amount Outstanding
Rs. 000
DeductionCRM
Rs. 000
DeductionCRM
Rs. 000Net amount
Rs. 000Net amount
Rs. 000
2012 2011
41 RISK MANAGEMENT
The Company realizes the importance of risk management. We have independent and dedicated risk management functions. A comprehensive risk management framework has been adopted. It is based on three lines of defense strategy to cater micro, macro and strategic level risk management. Risk Management Division has been set up primarily to carry out independent review functions in terms of credit risk, market risk, operational risk and liquid-ity risk. Stress testing is regularly conducted on the lines advised by the State Bank of Pakistan. Risk Management Committee of the Board has also been constituted and a structured Risk Reporting Framework is being developed and implemented as a part of monitoring and oversight function of the Board. Capital adequacy level is regularly as-sessed and reviewed with approved bench mark of 20 percent as against regulatory requirement of 14 percent.
The higher level of bench marking is aimed at strengthening capital base of the Company, besides providing an impeccable buffer/ cushion to absorb and withstand against unexpected macro economic shocks and unexpected losses. It is also used to asses overall risk appetite of the Company that in turn will be used to asses credit, market and operational risk appetite.
41.1 Credit risk
Credit risk is the risk that one party to a financial instrument will fail to discharge an obligation. The Company controls its credit risk by the following methods:
– Monitoring credit exposures;
– Evaluating transactions with specific counterparts; and
– Assessing credit worthiness of counterparts.
Two sets of guidelines are followed by the management for managing credit risk. Operating policy approved by the Board of Directors and Prudential Regulations issued by State Bank of Pakistan.
The operating policy defines the extent of exposure with reference to a particular sector or group. The management also classified a particular financing on the basis of SBP guidelines.
41.1.1 Segmental information
Segmental information is presented in respect of the class of business and geographical distribution of advances, deposits, contingencies and commitments.
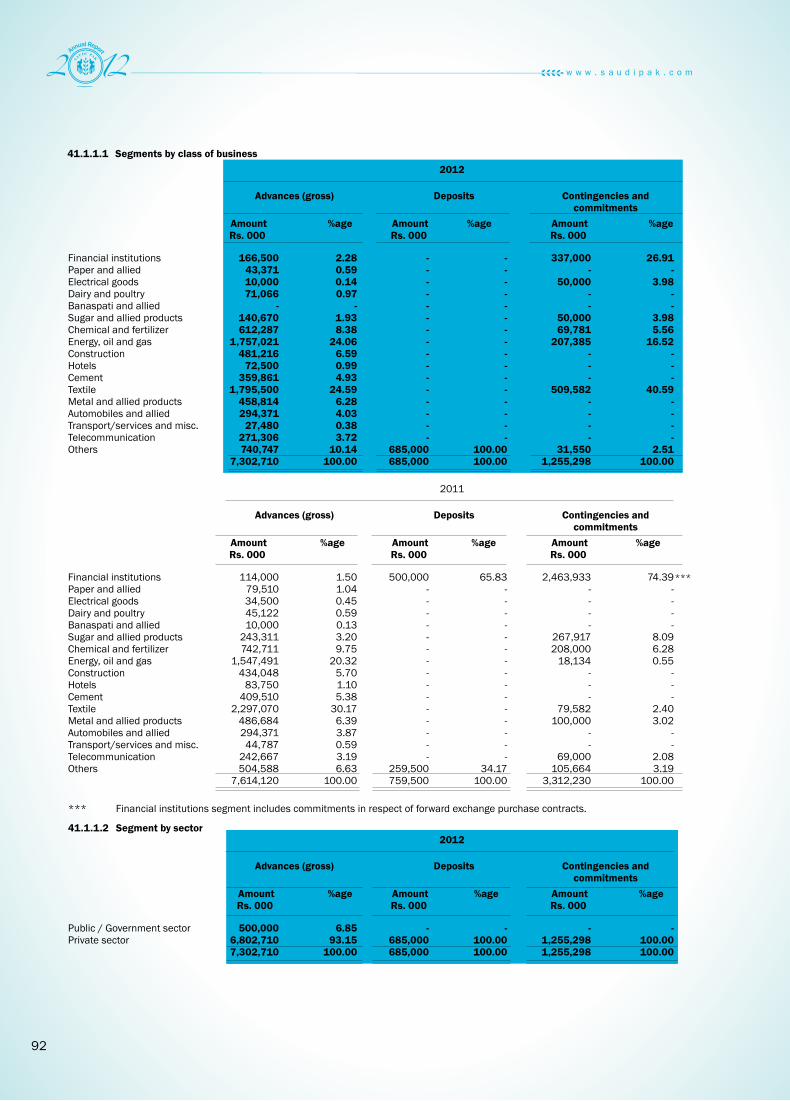
92
41.1.1.1 Segments by class of business
Advances (gross)
Advances (gross)
Advances (gross)
Contingencies and commitments
Contingencies and commitments
Contingencies and commitments
Deposits
Deposits
Deposits
Amount Rs. 000
Amount Rs. 000
Amount Rs. 000
Amount Rs. 000
Amount Rs. 000
Amount Rs. 000
Amount Rs. 000
Amount Rs. 000
Amount Rs. 000
%age
%age
%age
%age
%age
%age
%age
%age
%age
Financial institutionsPaper and allied Electrical goods Dairy and poultry Banaspati and allied Sugar and allied productsChemical and fertilizerEnergy, oil and gas Construction Hotels Cement Textile Metal and allied products Automobiles and allied Transport/services and misc. Telecommunication Others
Public / Government sectorPrivate sector
Financial institutions Paper and allied Electrical goods Dairy and poultry Banaspati and allied Sugar and allied products Chemical and fertilizer Energy, oil and gas Construction Hotels Cement Textile Metal and allied products Automobiles and allied Transport/services and misc. Telecommunication Others
*** Financial institutions segment includes commitments in respect of forward exchange purchase contracts.
41.1.1.2 Segment by sector
166,500 43,371 10,000 71,066
- 140,670 612,287
1,757,021 481,216
72,500 359,861
1,795,500 458,814 294,371
27,480 271,306 740,747
7,302,710
500,000 6,802,710 7,302,710
114,000 79,510 34,500 45,122 10,000
243,311 742,711
1,547,491 434,048
83,750 409,510
2,297,070 486,684 294,371 44,787
242,667 504,588
7,614,120
2.28 0.59 0.14 0.97
- 1.93 8.38
24.06 6.59 0.99 4.93
24.59 6.28 4.03 0.38 3.72
10.14 100.00
6.85 93.15
100.00
1.50 1.04 0.45 0.59 0.13 3.20 9.75
20.32 5.70 1.10 5.38
30.17 6.39 3.87 0.59 3.19 6.63
100.00
- - - - - - - - - - - - - - - -
685,000 685,000
- 685,000 685,000
500,000 - - - - - - - - - - - - - - -
259,500 759,500
- - - - - - - - - - - - - - - -
100.00 100.00
- 100.00 100.00
65.83 - - - - - - - - - - - - - - -
34.17 100.00
337,000 -
50,000 - -
50,000 69,781
207,385 - - -
509,582 - - - -
31,550 1,255,298
- 1,255,298 1,255,298
2,463,933 - - - -
267,917 208,000
18,134 - - -
79,582 100,000
- -
69,000 105,664
3,312,230
26.91 -
3.98 - -
3.98 5.56
16.52 - - -
40.59 - - - -
2.51 100.00
- 100.00 100.00
74.39 - - - -
8.09 6.28 0.55
- - -
2.40 3.02
- -
2.08 3.19
100.00
2012
2012
2011
***

93
Advances (gross)
Contingencies and commitments
Deposits
Amount Rs. 000
Classified advances
Rs. 000
Classified advances
Rs. 000
Profit before taxation
Rs. 000
Classified advances
Rs. 000
Classified advances
Rs. 000
Net assets employed
Rs. 000
Specific pro-visions held
Rs. 000
Specific provisions
heldRs. 000
Total assets employed
Rs. 000
Specific provi-sions held
Rs. 000
Specific provisions
heldRs. 000
Contingencies and commitments
Rs. 000
Amount Rs. 000
Amount Rs. 000
%age %age %age
Financial institutionsPaper and alliedElectrical goodsDairy and poultryBanaspati and alliedSugar and allied productsChemical and fertilizerEnergy, oil and gasConstructionHotelsCementTextileMetal and metal productsAutomobiles and alliedTransport/servicesMiscellaneous
Public/Government sectorPrivate sector
PakistanAsia Pacific (including South Asia)EuropeUnited States of America and CanadaMiddle EastOthers
Public / Government sectorPrivate sector
41.1.1.3 Details of non-performing advances and specific provisions by class of business segment
41.1.1.4 Details of non-performing advances and specific provisions by sector
41.1.1.5 Geographical segment analysis
Total assets employed include intra group items of Rs. 546.090 million.
- 7,614,120 7,614,120
103,500 43,371
- 42,847
- 52,920 48,848
252,026 387,466
50,000 316,111 883,340 172,437 294,371
27,480 197,006
2,871,723
- 2,871,723 2,871,723
405,465 - - - -
405,465
103,500 43,371
- 42,847
- 49,832 14,973
240,219 177,890
25,000 255,856 760,700 172,437 229,936
27,480 197,004
2,341,045
- 2,341,045 2,341,045
15,904,494 - - - -
15,904,494
114,000 79,509 14,499 45,122 10,000 61,310 18,743
257,056 270,427 50,000
328,260 1,052,062
172,437 294,371 44,787
272,833 3,085,416
- 3,085,416 3,085,416
8,207,228 - - - -
8,207,228
114,000 79,509 14,499 45,122 10,000 53,229 14,972
187,735 87,606 25,000
233,429 825,744 172,437 197,717 44,787
272,833 2,378,619
- 2,378,619 2,378,619
1,255,299 - - - -
1,255,299
- 100.00 100.00
- 759,500 759,500
- 100.00 100.00
- 3,312,230 3,312,230
- 100.00 100.00
2011
2012
2012
2012
2011
2011

94
Loss before taxation
Rs. 000
Assets
2012Rs. 000
Net assets employed
Rs. 000
Off-balancesheet items2012
Rs. 000
Total assets employed
Rs. 000
Liabilities
2012Rs. 000
Contingencies and commitments
Rs. 000
Netcurrency exposure
2012Rs. 000
PakistanAsia Pacific (including South Asia)EuropeUnited States of America and CanadaMiddle EastOthers
Pakistan RupeeUnited States DollarGreat Britain PoundDeutsche MarkJapanese YenEuroOther currencies
Total assets employed include intra group items of Rs. 570.789 million.
(1,411,749) - - - - -
(1,411,749)
15,874,716 29,779
- - - - -
15,904,495
14,377,718 - - - - -
14,377,718
7,697,266 - - - - - -
7,697,266
7,404,232 - - - - -
7,404,232
1,255,299 - - - - - -
1,255,299
3,312,230 - - - - -
3,312,230
6,922,151 29,779
- - - - -
6,951,930
2011
41.2 Market Risk
Market Risk is the risk of loss in earnings and capital due to adverse changes in interest rates, foreign exchange rates, equity prices and market conditions. Thus market risk can be further described into Interest Rate Risk, Foreign Exchange Risk and Equity Position Risk.
41.2.1 Interest rate risk
Interest rate risk is the risk that the value of the financial instrument will fluctuate due to changes in the market interest rates. The Company has formulated and developed interest rate risk policies, processes and procedural guidelines, proposing interest rate limits, credit spreads, gaps and duration limits between interest sensitive assets and interest sensitive liabilities, conducting gap analysis, determining the effects of mismatching positions across the range of maturities as well as identifying and maintaining the record of the transactions that would be treated as regarding trade book portfolio for the purpose of assigning market risk capital charge. Besides, the need and requirement of setting up an independent middle office is also being evaluated.
Risk management division is responsible for conducting independent review of interest rate sensitive assets, and liabilities, monitoring of interest rate and gap limits, reporting breaches and conducting stress testing on the lines advised by SBP.
41.2.2 Foreign exchange risk
Foreign exchange risk is that our net investment in foreign currency change in value through adverse effects of currency movements.
The risk is very nominal because of the nature of the existing operations of the Company and is primarily attributable to the foreign currency assets, held in the form of foreign currency deposits with other banks and deposit through SWAP and other hedging measures depending upon open market conditions. The Company manage its foreign exchange risk by keeping the data on foreign currency assets and liabilities, proposing limits, planning and determining yield as well as hedging the risk in the case of adverse movement in currency exchange rates and identifies the transactions which will be subject to market risk capital charge.
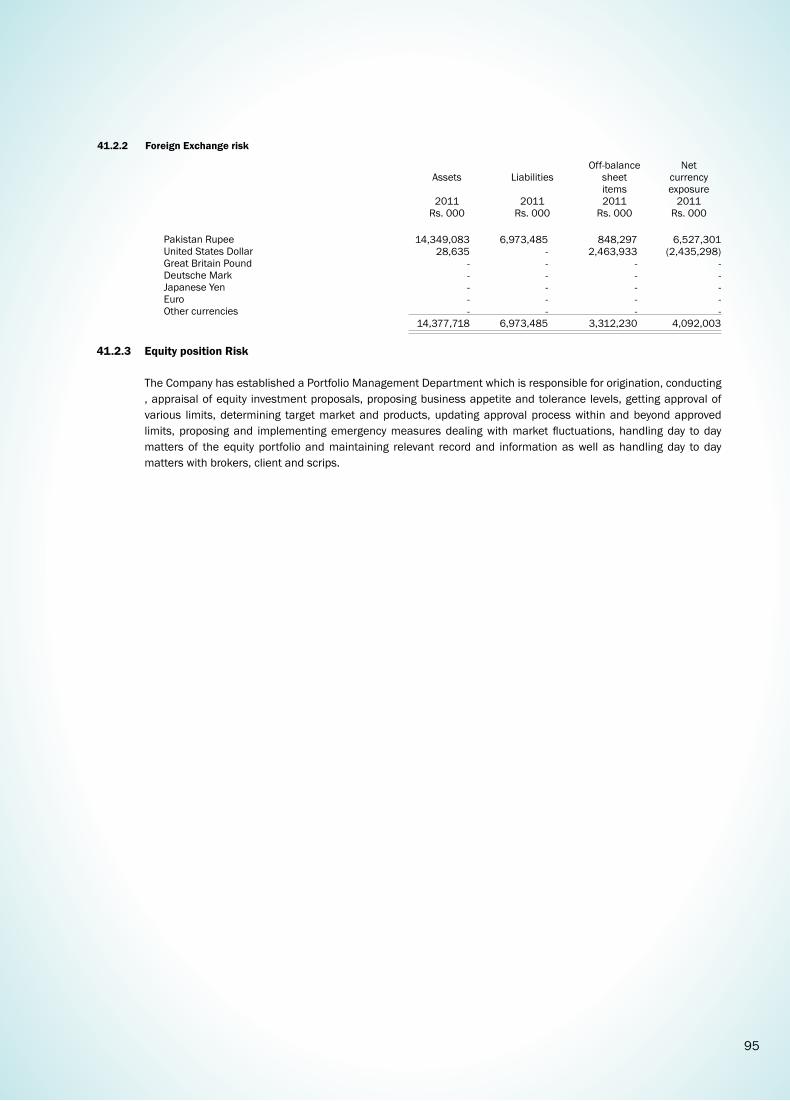
95
Assets
2011Rs. 000
Off-balancesheet items2011
Rs. 000
Liabilities
2011Rs. 000
Netcurrency exposure
2011Rs. 000
Pakistan RupeeUnited States DollarGreat Britain PoundDeutsche MarkJapanese YenEuroOther currencies
41.2.2 Foreign Exchange risk
14,349,083 28,635
- - - - -
14,377,718
6,973,485 - - - - - -
6,973,485
848,297 2,463,933
- - - - -
3,312,230
6,527,301 (2,435,298)
- - - - -
4,092,003
41.2.3 Equity position Risk
The Company has established a Portfolio Management Department which is responsible for origination, conducting , appraisal of equity investment proposals, proposing business appetite and tolerance levels, getting approval of various limits, determining target market and products, updating approval process within and beyond approved limits, proposing and implementing emergency measures dealing with market fluctuations, handling day to day matters of the equity portfolio and maintaining relevant record and information as well as handling day to day matters with brokers, client and scrips.

96
On-
bala
nce
shee
t fina
ncia
l ins
trum
ents
Asse
ts
Cash
and
bal
ance
s w
ith tr
easu
ry b
anks
Bala
nces
with
oth
er b
anks
Non
-cur
rent
ass
et c
lass
ified
as
held
for s
ale
Lend
ing
to fi
nanc
ial i
nstit
utio
ns
Inve
stm
ents
Adva
nces
Othe
r ass
ets
Liab
ilitie
s
Borro
win
gs fr
om fi
nanc
ial i
nstit
utio
ns
Dep
osits
and
oth
er a
ccou
nts
Othe
r lia
bilit
ies
On-
bala
nce
shee
t gap
Off
-bal
ance
she
et fi
nanc
ial i
nstr
umen
ts
Com
mitm
ents
in re
spec
t of
purc
hase
of f
orw
ard
cont
ract
Off
-bal
ance
she
et g
ap
Tota
l yie
ld/i
nter
est r
isk
sens
itivi
ty g
ap
Cum
ulat
ive
yiel
d/in
tere
st ri
sk s
ensi
tivity
gap
41.2
.4
Mis
mat
ch o
f int
eres
t rat
e se
nsiti
ve a
sset
s an
d lia
bilit
ies
Expo
sed
to Y
ield
/Int
eres
t ris
kEf
fect
ive
yiel
d/
inte
rest
rate
%
Tota
l
2012
Rup
ees
Upt
o 1
mon
th
2012
Rup
ees
Ove
r 1-3
mon
ths
2012
Rup
ees
Ove
r 3-6
mon
ths
2012
Rup
ees
Ove
r 6-1
2 m
onth
s
2012
Rup
ees
Ove
r 1-2
yea
rs
2012
Rup
ees
Ove
r 2-3
yea
rs
2012
Rup
ees
Ove
r 3-5
yea
rs
2012
Rup
ees
Ove
r 5-1
0 ye
ars
2012
Rup
ees
Abov
e 10
yea
rs
2012
Rup
ees
Non
-inte
rest
be
arin
g fin
anci
al
inst
rum
ents
20
12R
upee
s
-
5.0
0 -
10.
24
11.
04
12.
30 -
9.2
8
9.7
5 -
65,
538,
416
366
,097
,455
46,
089,
659
250
,000
,000
6,4
96,8
92,6
85
4,9
61,6
64,6
93
74,
591,
614
12,
260,
874,
522
5,9
25,5
28,9
90
685
,000
,000
104
,670
,961
6,7
15,1
99,9
51
5,5
45,6
74,5
71 - -
5,5
45,6
74,5
71 -
-
361
,649
,383
-
250
,000
,000
329
,472
,051
249
,348
,944
-
1,1
90,4
70,3
78
2,6
22,5
28,3
17
100
,000
,000
-
2,7
22,5
28,3
17
(1,5
32,0
57,9
39) - -
(1,5
32,0
57,9
39)
(1,5
32,0
57,9
39)
- - - -
1,1
31,7
29,4
06
1,9
55,6
77,8
03 -
3,08
7,40
7,20
9
2,3
23,8
24,3
89
575
,000
,000
-
2,8
98,8
24,3
89
188
,582
,820
- -
188
,582
,820
(1,3
43,4
75,1
19)
- - - -
2,4
61,5
31,8
07
2,7
37,0
80,5
37 -
5,1
98,6
12,3
44
345
,008
,192
10,
000,
000 -
355
,008
,192
4,8
43,6
04,1
52 - -
4,8
43,6
04,1
52
3,5
00,1
29,0
33
- - - -
559
,983
,388
77,
844 -
560
,061
,232
107
,942
,968
- -
107
,942
,968
452
,118
,264
- -
452
,118
,264
3,9
52,2
47,2
97
- - - -
200
,000
,000
3,0
76,0
61 -
203
,076
,061
174
,537
,600
- -
174
,537
,600
28,
538,
461 - - -
28,
538,
461
3,9
80,7
85,7
58
- - - -
195
,241
,900
3,0
76,0
61 -
198
,317
,961
158
,199
,268
- -
158
,199
,268
40,
118,
693 - -
40,
118,
693
4,0
20,9
04,4
51
- - - -
49,
964,
700
6,1
52,1
21 -
56,
116,
821
168
,429
,916
- -
168
,429
,916
(112
,313
,095
) - -
(112
,313
,095
)
3,9
08,5
91,3
56
- - - - -
7,1
75,3
22 -
7,1
75,3
22
25,
058,
340 - -
25,
058,
340
(17,
883,
018) - -
(17,
883,
018)
3,8
90,7
08,3
38
- - - - - - - - - - - - - - - -
3,8
90,7
08,3
38
65,
538,
416
4,4
48,0
72
46,
089,
659 -
1,5
68,9
69,4
33 -
74,
591,
614
1,7
59,6
37,1
94 - -
104
,670
,961
104
,670
,961
1,6
54,9
66,2
33 - -
1,6
54,9
66,2
33
5,5
45,6
74,5
71
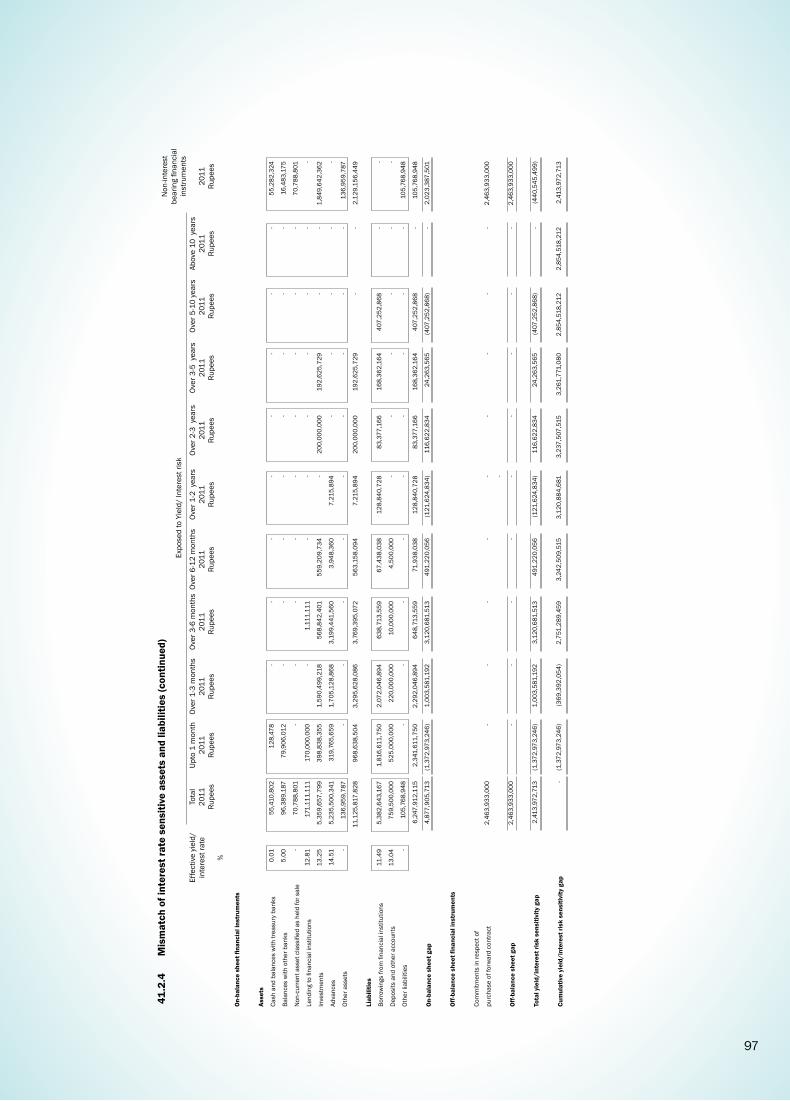
97
On-
bala
nce
shee
t fina
ncia
l ins
trum
ents
Asse
ts
Cash
and
bal
ance
s w
ith tr
easu
ry b
anks
Bala
nces
with
oth
er b
anks
Non
-cur
rent
ass
et c
lass
ified
as
held
for s
ale
Lend
ing
to fi
nanc
ial i
nstit
utio
ns
Inve
stm
ents
Adva
nces
Othe
r ass
ets
Liab
ilitie
s
Borro
win
gs fr
om fi
nanc
ial i
nstit
utio
ns
Dep
osits
and
oth
er a
ccou
nts
Othe
r lia
bilit
ies
On-
bala
nce
shee
t gap
Off
-bal
ance
she
et fi
nanc
ial i
nstr
umen
ts
Com
mitm
ents
in re
spec
t of
purc
hase
of f
orw
ard
cont
ract
Off
-bal
ance
she
et g
ap
Tota
l yie
ld/i
nter
est r
isk
sens
itivi
ty g
ap
Cum
ulat
ive
yiel
d/in
tere
st ri
sk s
ensi
tivity
gap
41.2
.4
Mis
mat
ch o
f int
eres
t rat
e se
nsiti
ve a
sset
s an
d lia
bilit
ies
(con
tinue
d)
Effe
ctiv
e yi
eld/
in
tere
st ra
te
%
Tota
l20
11Ru
pees
Upto
1 m
onth
2011
Rupe
es
Over
1-3
mon
ths
2011
Rupe
es
Expo
sed
to Y
ield
/ In
tere
st ri
sk
Over
3-6
mon
ths
2011
Rupe
es
Over
6-1
2 m
onth
s20
11Ru
pees
Over
1-2
yea
rs20
11Ru
pees
Over
2-3
yea
rs20
11Ru
pees
Over
3-5
yea
rs20
11Ru
pees
Over
5-1
0 ye
ars
2011
Rupe
es
Abov
e 10
yea
rs20
11Ru
pees
Non
-inte
rest
be
arin
g fin
anci
al
inst
rum
ents
2011
Rupe
es
0.0
1
5.0
0 -
12.
81
13.
25
14.
51 -
11.
49
13.
04 -
55,
410,
802
96,
389,
187
70,
788,
801
171
,111
,111
5,3
59,6
57,7
99
5,2
35,5
00,3
41
136
,959
,787
11,
125,
817,
828
5,3
82,6
43,1
67
759
,500
,000
105
,768
,948
6,2
47,9
12,1
15
4,8
77,9
05,7
13
2,4
63,9
33,0
00
2,4
63,9
33,0
00
2,4
13,9
72,7
13 -
128
,478
79,
906,
012 -
170
,000
,000
398
,838
,355
319
,765
,659
-
968
,638
,504
1,8
16,6
11,7
50
525
,000
,000
-
2,3
41,6
11,7
50
(1,3
72,9
73,2
46) - -
(1,3
72,9
73,2
46)
(1,3
72,9
73,2
46)
- - - -
1,5
90,4
99,2
18
1,7
05,1
28,8
68 -
3,29
5,62
8,08
6
2,0
72,0
46,8
94
220
,000
,000
-
2,2
92,0
46,8
94
1,0
03,5
81,1
92 - -
1,0
03,5
81,1
92
(369
,392
,054
)
- - -
1,1
11,1
11
568
,842
,401
3,1
99,4
41,5
60 -
3,7
69,3
95,0
72
638
,713
,559
10,
000,
000 -
648
,713
,559
3,1
20,6
81,5
13 - -
3,1
20,6
81,5
13
2,7
51,2
89,4
59
- - - -
559
,209
,734
3,9
48,3
60 -
563
,158
,094
67,
438,
038
4,5
00,0
00 -
71,
938,
038
491
,220
,056
- -
491
,220
,056
3,2
42,5
09,5
15
- - - - -
7,2
15,8
94 -
7,2
15,8
94
128
,840
,728
- -
128
,840
,728
(121
,624
,834
) - - -
(121
,624
,834
)
3,1
20,8
84,6
81
- - - -
200
,000
,000
- -
200
,000
,000
83,
377,
166 - -
83,
377,
166
116
,622
,834
- -
116
,622
,834
3,2
37,5
07,5
15
- - - -
192
,625
,729
- -
192
,625
,729
168
,362
,164
- -
168
,362
,164
24,
263,
565 - -
24,
263,
565
3,2
61,7
71,0
80
- - - - - - - -
407
,252
,868
- -
407
,252
,868
(407
,252
,868
) - -
(407
,252
,868
)
2,8
54,5
18,2
12
- - - - - - - - - - - - - - - -
2,8
54,5
18,2
12
55,
282,
324
16,
483,
175
70,
788,
801 -
1,8
49,6
42,3
62 -
136
,959
,787
2,1
29,1
56,4
49 - -
105
,768
,948
105
,768
,948
2,0
23,3
87,5
01
2,4
63,9
33,0
00
2,4
63,9
33,0
00
(440
,545
,499
)
2,4
13,9
72,7
13
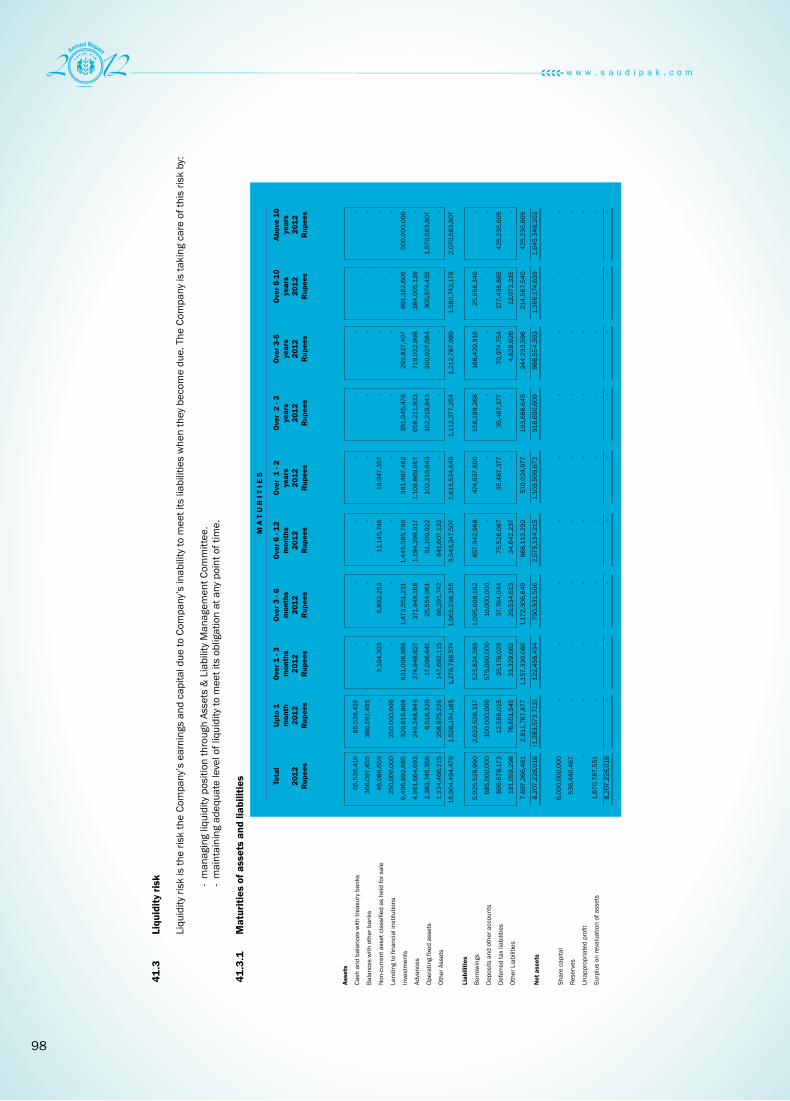
98
Asse
ts
Cash
and
bal
ance
s w
ith tr
easu
ry b
anks
Bala
nces
with
oth
er b
anks
Non
-cur
rent
ass
et c
lass
ified
as
held
for s
ale
Lend
ing
to fi
nanc
ial i
nstit
utio
ns
Inve
stm
ents
Adva
nces
Oper
atin
g fix
ed a
sset
s
Othe
r Ass
ets
Liab
ilitie
s
Borro
win
gs
Dep
osits
and
oth
er a
ccou
nts
Def
erre
d ta
x lia
bilit
ies
Othe
r Lia
bilit
ies
Net
ass
ets
Shar
e ca
pita
l
Rese
rves
Unap
prop
riate
d pr
ofit
Surp
lus
on re
valu
atio
n of
ass
ets
41.3
Li
quid
ity ri
sk
Li
quid
ity ri
sk is
the
risk
the
Com
pany
’s e
arni
ngs
and
capi
tal d
ue to
Com
pany
’s in
abili
ty to
mee
t its
liab
ilitie
s w
hen
they
bec
ome
due.
The
Com
pany
is ta
king
car
e of
this
risk
by:
- m
anag
ing
liqui
dity
pos
ition
thro
ugh
Asse
ts &
Lia
bilit
y M
anag
emen
t Com
mitt
ee.
-
mai
ntai
ning
ade
quat
e le
vel o
f liq
uidi
ty to
mee
t its
obl
igat
ion
at a
ny p
oint
of t
ime.
41.3
.1
Mat
uriti
es o
f ass
ets
and
liabi
litie
s
Tota
l
2012
Rup
ees
Upt
o 1
mon
th20
12R
upee
s
Ove
r 1 -
3 m
onth
s20
12R
upee
s
Ove
r 3 -
6 m
onth
s20
12R
upee
s
Ove
r 6 -
12
mon
ths
2012
Rup
eesM A
T U
R I
T I E
S
Ove
r 1
- 2
ye
ars
2012
Rup
ees
Ove
r 2
- 3
year
s20
12R
upee
s
Ove
r 3-5
year
s20
12R
upee
s
Ove
r 5-1
0
year
s20
12R
upee
s
Abov
e 10
ye
ars
2012
Rup
ees
65,
538,
416
366
,097
,455
46,
089,
659
250
,000
,000
6,4
96,8
92,6
85
4,9
61,6
64,6
93
2,3
83,7
45,3
56
1,3
34,4
66,2
15
15,
904,
494,
479
5,9
25,5
28,9
90
685
,000
,000
895
,678
,173
191
,059
,298
7,6
97,2
66,4
61
8,2
07,2
28,0
18
6,0
00,0
00,0
00
536
,440
,467
-
1,6
70,7
87,5
51
8,2
07,2
28,0
18
65,
538,
416
366
,097
,455
-
250
,000
,000
329
,815
,804
249
,348
,944
8,5
18,3
20
258
,875
,226
1,5
28,1
94,1
65
2,6
22,5
28,3
17
100
,000
,000
12,
588,
015
76,
651,
545
2,8
11,7
67,8
77
(1,2
83,5
73,7
12) - - - - -
- -
9,1
04,3
03 -
831
,006
,888
274
,948
,627
17,
036,
641
147
,692
,115
1,2
79,7
88,5
74
523
,824
,389
575
,000
,000
25,
176,
029
33,
329,
662
1,1
57,3
30,0
80
122
,458
,494
- - - - -
- -
5,8
92,2
53 -
1,4
73,5
51,2
31
371
,948
,168
25,
554,
961
86,
291,
742
1,9
63,2
38,3
55
1,0
95,0
08,1
92
10,
000,
000
37,
764,
044
29,
534,
613
1,1
72,3
06,8
49
790
,931
,506
- - - - -
- -
11,
145,
746 -
1,4
45,0
85,7
90
1,1
94,2
98,9
17
51,
109,
922
841
,607
,132
3,5
43,2
47,5
07
857
,942
,968
-
75,
528,
087
34,
642,
237
968
,113
,292
2,5
75,1
34,2
15 - - - - -
- -
19,
947,
357 -
381
,497
,482
1,1
09,8
69,9
67
102
,219
,843
-
1,6
13,5
34,6
49
474
,537
,600
-
35,
487,
377 -
510
,024
,977
1,1
03,5
09,6
72 - - - - -
- - - -
351
,945
,478
658
,211
,933
102
,219
,843
-
1,1
12,3
77,2
54
158
,199
,268
-
35,
487,
377 -
193
,686
,645
918
,690
,609
- - - - -
- - - -
292
,827
,407
719
,032
,998
200
,927
,584
-
1,2
12,7
87,9
89
168
,429
,916
-
70,
974,
754
4,8
28,9
26
244
,233
,596
968
,554
,393
- - - - -
- - - -
891
,162
,605
384
,005
,139
305
,574
,435
-
1,5
80,7
42,1
79
25,
058,
340 -
177
,436
,885
12,
072,
315
214
,567
,540
1,3
66,1
74,6
39 - - - - -
- - - -
500
,000
,000
-
1,5
70,5
83,8
07 -
2,0
70,5
83,8
07 - -
425
,235
,605
-
425
,235
,605
1,6
45,3
48,2
02 - - - - -

99
Asse
ts
Cash
and
bal
ance
s w
ith tr
easu
ry b
anks
Bala
nces
with
oth
er b
anks
Non
-cur
rent
ass
et c
lass
ified
as
held
for s
ale
Lend
ing
to fi
nanc
ial i
nstit
utio
ns
Inve
stm
ents
Adva
nces
Oper
atin
g fix
ed a
sset
s
Othe
r Ass
ets
Liab
ilitie
s
Borro
win
gs
Dep
osits
and
oth
er a
ccou
nts
Def
erre
d ta
x lia
bilit
ies
Othe
r Lia
bilit
ies
Net
ass
ets
Shar
e ca
pita
l
Rese
rves
Unap
prop
riate
d lo
ss
Surp
lus
on re
valu
atio
n of
ass
ets
41.3
Li
quid
ity ri
sk (c
ontin
ued)
41
.3.1
M
atur
ities
of a
sset
s an
d lia
bilit
ies
(con
tinue
d)
Tota
l
2011
Rupe
es
Upto
1
m
onth
2011
Rupe
es
Over
1 -
3 m
onth
s20
11Ru
pees
Over
3 -
6 m
onth
s20
11Ru
pees
M A
T U
R I
T I E
S
Over
6 -
12
mon
ths
2011
Rupe
es
Over
1 -
2
ye
ars
2011
Rupe
es
Over
2 -
3 ye
ars
2011
Rupe
es
Over
3-5
year
s20
11Ru
pees
Over
5-1
0
year
s20
11Ru
pees
Abov
e 10
ye
ars
2011
Rupe
es
55,
410,
802
96,
389,
187
70,
788,
801
171
,111
,111
5,3
59,6
57,7
99
5,2
35,5
00,3
41
2,0
82,5
89,8
24
1,3
06,2
69,6
65
14,
377,
717,
530
5,3
82,6
43,1
67
759
,500
,000
669
,231
,485
162
,110
,474
6,9
73,4
85,1
26
7,4
04,2
32,4
04
6,0
00,0
00,0
00
1,5
13,1
82,1
02
(1,4
12,7
18,2
97)
1,3
03,7
68,5
99
7,4
04,2
32,4
04
55,
410,
802
96,
389,
187 -
170
,000
,000
367
,643
,743
310
,998
,274
4,6
24,3
82
68,
965,
072
1,0
74,0
31,4
60
1,8
16,6
11,7
50
525
,000
,000
1,3
38,2
00
35,
209,
520
2,3
78,1
59,4
70
(1,3
04,1
28,0
10) - - - - -
- -
8,9
42,2
07 -
213
,093
,869
430
,389
,984
9,2
48,7
64
137
,930
,144
799
,604
,968
572
,046
,894
220
,000
,000
2,6
76,4
00
70,
349,
319
865
,072
,613
(65,
467,
645) - - - - -
- -
8,6
95,6
52
1,1
11,1
11
462
,718
,061
329
,497
,456
13,
873,
146
206
,895
,216
1,0
22,7
90,6
42
338
,713
,559
10,
000,
000
4,0
14,6
00
20,
357,
279
373
,085
,438
649
,705
,204
- - - - -
- -
16,
296,
238 -
1,5
86,6
13,0
27
729
,488
,934
27,
746,
292
892
,479
,233
3,2
52,6
23,7
24
67,
438,
038
4,5
00,0
00
8,0
29,2
00
8,2
14,6
91
88,
181,
929
3,1
64,4
41,7
95 - - - - -
- -
7,2
80,0
80 -
294
,095
,947
899
,495
,785
55,
492,
584 -
1,2
56,3
64,3
96
1,6
28,8
40,7
28 -
29,
826,
185 -
1,6
58,6
66,9
13
(402
,302
,517
) - - - - -
- -
29,
574,
624 -
391
,381
,902
781
,680
,999
55,
492,
584 -
1,2
58,1
30,1
09
383
,377
,166
-
29,
826,
185 -
413
,203
,351
844
,926
,758
- - - - -
- - - -
458
,403
,073
1,0
29,5
08,3
92
106
,223
,904
-
1,5
94,1
35,3
69
168
,362
,164
-
59,
652,
370
8,6
33,9
00
236
,648
,434
1,3
57,4
86,9
35 - - - - -
- - - -
1,0
85,7
08,1
77
724
,440
,517
223
,469
,477
-
2,0
33,6
18,1
71
407
,252
,868
-
149
,130
,925
19,
345,
765
575
,729
,558
1,4
57,8
88,6
13 - - - - -
- - - -
500
,000
,000
-
1,5
86,4
18,6
91 -
2,0
86,4
18,6
91 - -
384
,737
,420
-
384
,737
,420
1,7
01,6
81,2
71 - - - - -
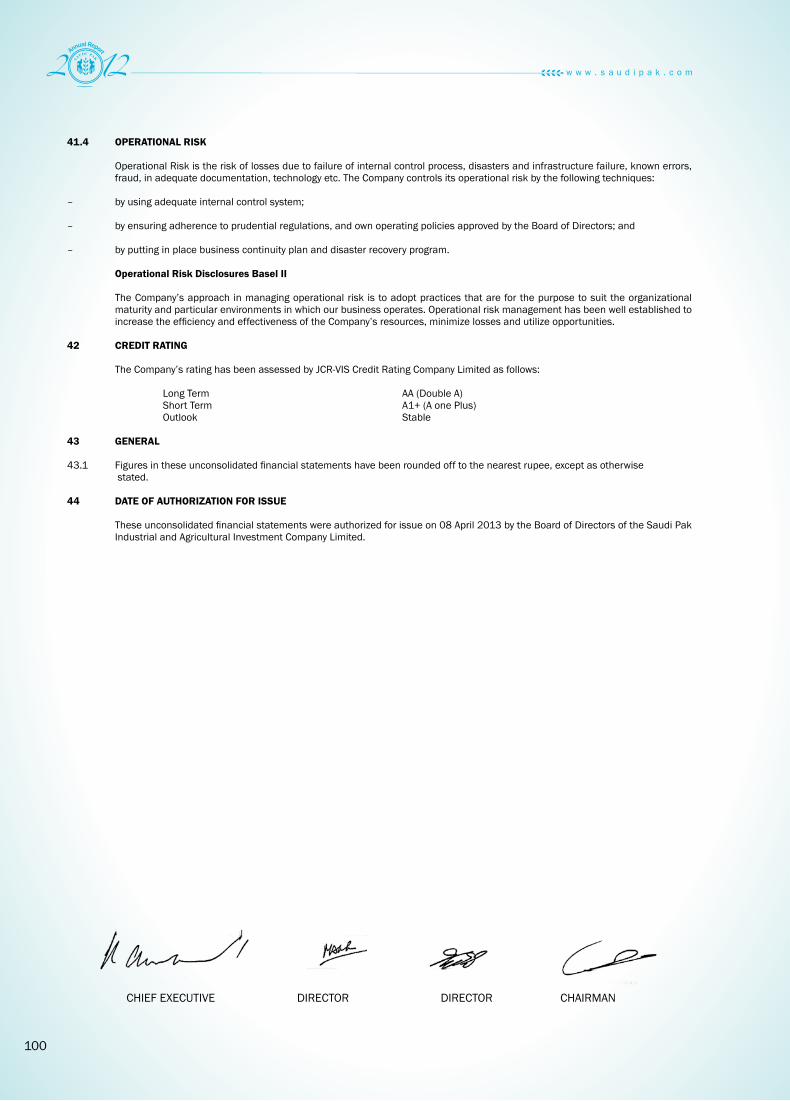
100
41.4 OPERATIONAL RISK Operational Risk is the risk of losses due to failure of internal control process, disasters and infrastructure failure, known errors,
fraud, in adequate documentation, technology etc. The Company controls its operational risk by the following techniques: – by using adequate internal control system;
– by ensuring adherence to prudential regulations, and own operating policies approved by the Board of Directors; and
– by putting in place business continuity plan and disaster recovery program.
Operational Risk Disclosures Basel II
The Company’s approach in managing operational risk is to adopt practices that are for the purpose to suit the organizational
maturity and particular environments in which our business operates. Operational risk management has been well established to increase the efficiency and effectiveness of the Company’s resources, minimize losses and utilize opportunities.
42 CREDIT RATING The Company’s rating has been assessed by JCR-VIS Credit Rating Company Limited as follows:
Long Term AA (Double A) Short Term A1+ (A one Plus) Outlook Stable 43 GENERAL 43.1 Figures in these unconsolidated financial statements have been rounded off to the nearest rupee, except as otherwise stated. 44 DATE OF AUTHORIZATION FOR ISSUE These unconsolidated financial statements were authorized for issue on 08 April 2013 by the Board of Directors of the Saudi Pak
Industrial and Agricultural Investment Company Limited.
CHIEF EXECUTIVE DIRECTOR DIRECTOR CHAIRMAN
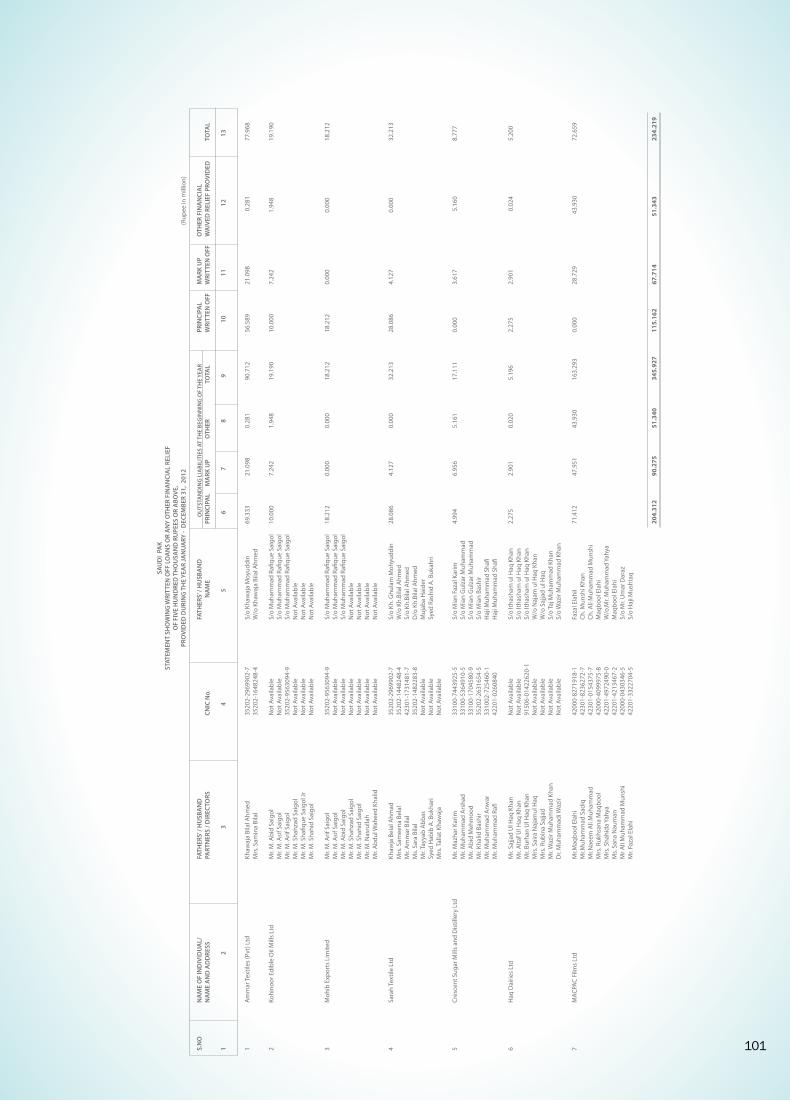
101
SAU
DI
PAK
STAT
EMEN
T SH
OW
ING
WRI
TTEN
OFF
LO
AN
S O
R A
NY
OTH
ER F
INA
NCI
AL
RELI
EFO
F FI
VE H
UN
DRE
D T
HO
USA
ND
RU
PEES
OR
ABO
VE,
PRO
VID
ED D
URI
NG
TH
E YE
AR
JAN
UA
RY -
DEC
EMBE
R 31
, 20
12
S.N
O
NA
ME
OF
IND
IVID
UA
L/
FA
THER
S’ /
HU
SBA
ND
FATH
ERS’
/ H
USB
AN
D
O
UTS
TAN
DIN
G L
IABI
LITI
ES A
T TH
E BE
GIN
NIN
G O
F TH
E YE
AR
PR
INCI
PAL
M
ARK
UP
OTH
ER F
INA
NCI
AL
N
AM
E A
ND
AD
DRE
SS
PA
RTN
ERS
/ DIR
ECTO
RS
CN
IC N
o.
NA
ME
PR
INCI
PAL
M
ARK
UP
OTH
ER
T
OTA
L W
RITT
EN O
FF
WRI
TTEN
OFF
W
AIV
ED R
ELIE
F PR
OVI
DED
TO
TAL
1
2
3
4
5
6
7
8
9
1
0
11
12
13
1
Am
mar
Text
iles
(Pvt
) Ltd
Khaw
aja
Bila
l Ahm
ed
35
202-
2969
902-
7 S/
o Kh
awaj
a M
oyud
din
69.3
33
21.0
98
0.28
1 90
.712
56
.589
21
.098
0.
281
77
.968
Mrs
. Sam
ina
Bila
l
3520
2-16
4824
8-4
W/o
Kha
waj
a Bi
lal A
hmed
2 Ko
hino
or E
dibl
e O
il M
ills
Ltd
Mr.
M. A
bid
Saig
ol
N
ot A
vaila
ble
S/
o M
uham
mad
Rafi
que
Saig
ol
10.0
00
7.24
2 1.
948
19.1
90
10.0
00
7.24
2
1.9
48
19
.190
Mr.
M. A
sif S
aigo
l
Not
Ava
ilabl
e
S/o
Muh
amm
ad R
afiqu
e Sa
igol
Mr.
M. A
rif S
aigo
l
3520
2-95
6309
4-9
S/o
Muh
amm
ad R
afiqu
e Sa
igol
Mr.
M. S
hahz
ad S
aigo
l
Not
Ava
ilabl
e
Not
Ava
ilabl
e
Mr.
M. S
hafiq
ue S
aigo
l Jr
N
ot A
vaila
ble
N
ot A
vaila
ble
M
r. M
. Sha
hid
Saig
ol
N
ot A
vaila
ble
N
ot A
vaila
ble
3
Moh
ib E
xpor
ts L
imite
d
Mr.
M. A
rif S
aigo
l
3520
2-95
6309
4-9
S/o
Muh
amm
ad R
afiqu
e Sa
igol
18
.212
0.
000
0.00
0 18
.212
18
.212
0.
000
0
.000
18.2
12
M
r. M
. Asi
f Sai
gol
N
ot A
vaila
ble
S/
o M
uham
mad
Rafi
que
Saig
ol
M
r. M
. Abi
d Sa
igol
Not
Ava
ilabl
e
S/o
Muh
amm
ad R
afiqu
e Sa
igol
Mr.
M. S
hahz
ad S
aigo
l
Not
Ava
ilabl
e
Not
Ava
ilabl
e
Mr.
M. S
hahi
d Sa
igol
Not
Ava
ilabl
e
Not
Ava
ilabl
e
Mr.
M. N
asru
llah
Not
Ava
ilabl
e
Not
Ava
ilabl
e
M
r. A
bdul
Wah
eed
Khal
id
N
ot A
vaila
ble
N
ot A
vaila
ble
4
Sara
h Te
xtile
Ltd
Khaw
ja B
elal
Ahm
ad
35
202-
2969
902-
7 S/
o Kh
. Ghu
lam
Moh
yudd
in
28.0
86
4.12
7 0.
000
32.2
13
28.0
86
4.12
7
0.0
00
32
.213
Mrs
. Sam
eena
Bel
al
35
202-
1448
248-
4 W
/o K
h.Bi
lal A
hmed
Mr.
Am
mar
Bila
l
42
301-
1731
481-
7 S/
o Kh
.Bila
l Ahm
ed
M
s. Sa
ra B
ilal
3520
2-14
8228
3-8
D/o
Kh.
Bila
l Ahm
ed
M
r. Ta
yyab
Abb
as
N
ot A
vaila
ble
M
ujab
a H
aide
r
Syed
Hab
ib A
. Buk
hari
N
ot A
vaila
ble
Sy
ed R
ashi
d A
. Buk
ahri
M
rs. T
alla
t Kha
waj
a
Not
Ava
ilabl
e
5
Cres
cent
Sug
ar M
ills
and
Dis
tille
ry L
td
Mr.
Maz
har K
arim
3310
0-74
4392
5-5
S/o
Mia
n Fa
zal K
arim
4.
994
6.95
6 5.
161
17.1
11
0.00
0 3.
617
5.16
0
8.77
7
M
r. M
uham
mad
Ars
had
33
100-
5364
910-
5 S/
o M
ian
Gul
zar M
uham
mad
Mr.
Abi
d M
ehm
ood
33
100-
1704
580-
9 S/
o M
ian
Gul
zar M
uham
mad
Mr.
Khal
id B
ashi
r
35
202-
2631
654-
5 S/
o M
ian
Bash
ir
Mr.
Muh
amm
ad A
nwar
3310
02-7
2546
0-1
Haj
i Muh
amm
ad S
hafi
M
r. M
uham
mad
Rafi
4220
1-02
6084
0
Haj
i Muh
amm
ad S
hafi
6
Haq
Dai
ries
Ltd
Mr.
Sajja
d U
l Haq
Kha
n
Not
Ava
ilabl
e
S/o
Ithas
ham
ul H
aq K
han
2.27
5 2.
901
0.02
0 5.
196
2.27
5 2.
901
0.02
4
5.20
0
M
r. A
ltaf U
l Haq
Kha
n
Not
Ava
ilabl
e
S/o
Ithas
ham
ul H
aq K
han
M
r. Bu
rhan
Ul H
aq K
han
91
506-
0142
2620
-1
S/o
Ithas
ham
ul H
aq K
han
M
rs. S
aira
Naj
amul
Haq
Not
Ava
ilabl
e
W/o
Naj
am u
l Haq
Kha
n
Mrs
. Rub
ina
Sajja
d
Not
Ava
ilabl
e
W/o
Saj
jad
ul H
aq
M
r. W
azir
Muh
amm
ad K
han
N
ot A
vaila
ble
S/
o Ta
j Muh
amm
ad K
han
D
r. M
uham
mad
i Waz
ir
Not
Ava
ilabl
e
S/o
Waz
ir M
uham
mad
Kha
n
7 M
ACPA
C Fi
lms
Ltd
M
r.Maq
bool
Ela
hi
42
000-
8271
918-
1 Fa
zal E
lahi
I
71.4
12
47.9
51
43.9
30
163.
293
0.00
0 28
.729
43.
930
72
.659
Mr.M
uham
mad
Sad
iq
42
301-
8236
272-
7 Ch
. Mun
shi K
han
M
r.Nae
em A
li M
uham
mad
4230
1-01
5437
5-7
Ch. A
li M
uham
mad
Mun
shi
M
rs. R
ukhs
ana
Maq
bool
4200
0-40
9997
5-8
Maq
bool
Ela
hi
M
rs. S
hahi
da Y
ahya
4220
1-49
7249
0-0
W/o
.Mr.
Muh
amm
ad Y
ahya
Ms.
Sana
Nau
man
4220
1-42
1346
7-2
Maq
bool
Ela
hi
M
r Ali
Muh
amm
ad M
unsh
i
4200
0-04
3034
6-5
S/o
Mr.
Um
ar D
araz
Mr.
Faza
l Ela
hi
4220
1-33
2270
4-5
S/o
Haj
i Mus
htaq
204.
312
90.2
75
51.3
40
345.
927
115.
162
67.7
14
5
1.34
3
234.
219
(Rup
ee in
mill
ion)

102

103
Auditors’ report to the members ofSaudi Pak Industrial and Agricultural Investment Company Limited
We have audited the annexed consolidated financial statements comprising consolidated balance sheet of Saudi Pak Industrial and Agricultural Investment Company Limited (“the Holding Company”) and its subsidiary companies as at 31 December, 2012 and the related consolidated profit and loss account, consolidated statement of comprehensive income, consolidated cash flow statement and consolidated statement of changes in equity together with the notes forming part thereof, for the year then ended. We have also expressed separate opinion on the financial statements of Saudi Pak Industrial and Agricultural Investment Company Limited and its subsidiary companies namely Saudi Pak Real Estate Limited and Saudi Pak Leasing Company Limited. These financial statements are the responsibility of the Holding Company’s management. Our responsibility is to express an opinion on these financial statements based on our audit.
Our audit was conducted in accordance with the International Standard on Auditing and accordingly included such tests of accounting records and such other auditing procedures as we considered necessary in the circumstances.
In our opinion, the consolidated financial statements present fairly the financial position of Saudi Pak Industrial and Agricultural Investment Company Limited and its subsidiary companies as at 31 December, 2012 and the results of their operations for the year then ended.
We draw attention to the following matters:
a) Note 10.4 to the consolidated financial statements wherein it is stated that the Board of Directors of the Holding Company decided to convert the interest free subordinated loan to Saudi Pak Leasing Company Limited (SPLCL), a subsidiary company into preference shares. The State Bank of Pakistan (SBP) has extended the time for conversion of subordinated loan into preference shares till 30 June, 2013;
b) Note 1.2 to the consolidated financial statements which states that SPLCL has incurred a net loss of Rs.129.498 million during the year ended 31 December, 2012, and as of that date, its current liabilities exceeded its current assets by Rs.673.258 million and have a negative equity of Rs.1,016.555 million as at 31 December, 2012. Furthermore, due to the liquidity crises, SPLCL has defaulted on financial obligations of Rs.617.507 million in principal and Rs.154.024 million in accrued mark-up. These conditions, along with the fact that the SPLCL’s license to carry out leasing business has expired since 18 May, 2010, indicates the existence of a material uncertainty that may cast significant doubt about the SPLCL’s ability to continue as a going concern and may affect the SPLCL’s ability to borrow funds;
c) Note 1.3 to the consolidated financial statements which gives details of certain requirements of NBFC Regulations, 2008 not met by SPLCL;
d) Note 14.1 to the consolidated financial statements wherein it is stated that certain legal requirements relating to the property documentation of development properties of Saudi Pak Real Estate Limited are under process.
Our opinion is not qualified on the matters from (a) to (d) above.
IslamabadApril 29, 2013 KPMG Taseer Hadi & Co. Chartered Accountants Engagement Partner: Riaz Pesnani

104
CONSOLIDATED STATEMENT OF FINANCIAL POSITION AS AT DECEMBER 31, 2012
ASSETSCash and balances with treasury banksBalances with other banksNon-current asset classified as held for saleLendings to financial institutionsInvestments Advances Operating fixed assetsDeferred tax assets Other assets Development properties
LIABILITIESBills payableBorrowingsDeposits and other accountsSub-ordinated loansLiabilities against assets subject to finance leaseUnderwriting provisionDeferred tax liabilitiesOther liabilities
NET ASSETS
REPRESENTED BYShare capitalReserve fund Unappropriated profit / (loss)
Non-controlling interestSurplus on revaluation of AFS securities - net of taxSurplus on revaluation of operating fixed assets - net of tax
CONTINGENCIES AND COMMITMENTS
6789
101112181314
1516
171819
20
2122
23
65,690,405 389,068,830
96,618,462 285,000,000
6,194,338,065 6,363,688,800 2,612,687,710
- 1,516,807,275
184,673,844 17,708,573,391
- 7,229,175,546 1,329,131,395
- - -
985,335,693 503,354,689
10,046,997,324 7,661,576,067
6,000,000,000 536,440,467
84,133,858 6,620,574,325 (644,095,429)
222,252,953 1,462,844,218 7,661,576,067
56,121,319 193,655,011
- 171,111,111
5,101,879,296 7,393,276,079 2,321,846,074
- 1,880,739,426
206,091,245 17,324,719,561
- 7,064,577,411 1,618,221,671
- -
228,720,865 751,003,079 599,680,474
10,262,203,500 7,062,516,061
6,000,000,000 1,513,182,102
(1,279,915,381) 6,233,266,721 (480,915,677)
43,109,063 1,267,055,954 7,062,516,061
2012Rupees
2011Rupees
Note
The annexed notes 1 to 47 form an integral part of these consolidated financial statements.
CHIEF EXECUTIVE DIRECTOR DIRECTOR CHAIRMAN

105
CONSOLIDATED PROFIT AND LOSS ACCOUNT FOR THE YEAR ENDED DECEMBER 31, 2012
Mark-up/Return/Interest Earned Mark-up/Return/Interest Expensed Net Mark-up/Interest Income Provision against non-performing loans and advances Provision for diminution in the value of investments Reversal of provision against lendings to financial institutions Bad debts written off directly Net Mark-up/Interest income / (expense) after provisions NON MARK-UP/INTEREST INCOME Fee, Commission and Brokerage Income Dividend Income Gain / (loss) from dealing in foreign currencies Net gain on dealing in quoted securities Gain on dealing in mutual funds Impairment loss on asset classified as held for sale at its fair value Unrealized gain on investments classified as held for trading Underwriting income Income from sale of development properties - net Other Income Total non mark-up/interest Income NON MARK-UP/INTEREST EXPENSES Administrative expenses Impairment loss on quoted securities Other provisions and write offs Other charges Total non-markup/interest expenses Share of profit of associate - net of dilution Extra ordinary/unusual items PROFIT / (LOSS) BEFORE TAXATION Taxation – Current – Prior years – Deferred PROFIT / (LOSS) AFTER TAXATION Attributable to: Equity holders of the Company Non-controlling interests Basic and diluted earning / (loss) per share
2425
26
10.7272829
30313233
34
35
1,246,894,674 776,603,120 470,291,554
255,824,164 134,094,048
- 403,441
390,321,653 79,969,901
15,014,467 61,420,035 25,667,710
365,647,824 9,707,632
(41,145,142) 2,257,167
15,667,851 10,895,745
180,646,033 645,779,322
375,214,513 83,227,084
6,942,000 -
465,383,597
8,256,402 -
8,256,402
268,622,029
31,877,664 -
(10,243,315) 21,634,349
246,987,680
322,137,463 (75,149,783) 246,987,680
0.537
1,479,940,562 1,173,520,079
306,420,483
642,869,184 63,232,342
- 13,069,507
719,171,033 (412,750,550)
2,932,874 94,876,526
(223,043,763) 43,584,749 41,222,136
- -
20,986,350 47,139,204
109,166,772 136,864,848
337,030,616 957,126,256 176,720,941
922,250 1,471,800,063
- - -
(1,747,685,765)
43,674,249 100,523,318 150,681,609 294,879,176
(2,042,564,941)
(1,581,085,770) (461,479,171)
(2,042,564,941)
(2.635)
2012Rupees
2011Rupees
Note
The annexed notes 1 to 47 form an integral part of these consolidated financial statements.
CHIEF EXECUTIVE DIRECTOR DIRECTOR CHAIRMAN

106
CONSOLIDATED STATEMENT OF COMPREHENSIVE INCOME FOR THE YEAR ENDED DECEMBER 31, 2012
Profit / (loss) after taxation
Other comprehensive income
Reversal of capital reserves relating to rescheduling benefits
Comprehensive income transferred to equity
Components of comprehensive income not reflected in equity
Surplus on revaluation of available-for-sale securitiesDeferred tax
Total comprehensive income
322,137,463
-
322,137,463
276,277,901 (96,697,265) 179,580,636
501,718,098
(1,581,085,770)
-
(1,581,085,770)
417,035,377 (145,962,382)
271,072,995
(1,310,012,775)
2012Rupees
2011Rupees
The annexed notes 1 to 47 form an integral part of these consolidated financial statements.
CHIEF EXECUTIVE DIRECTOR DIRECTOR CHAIRMAN
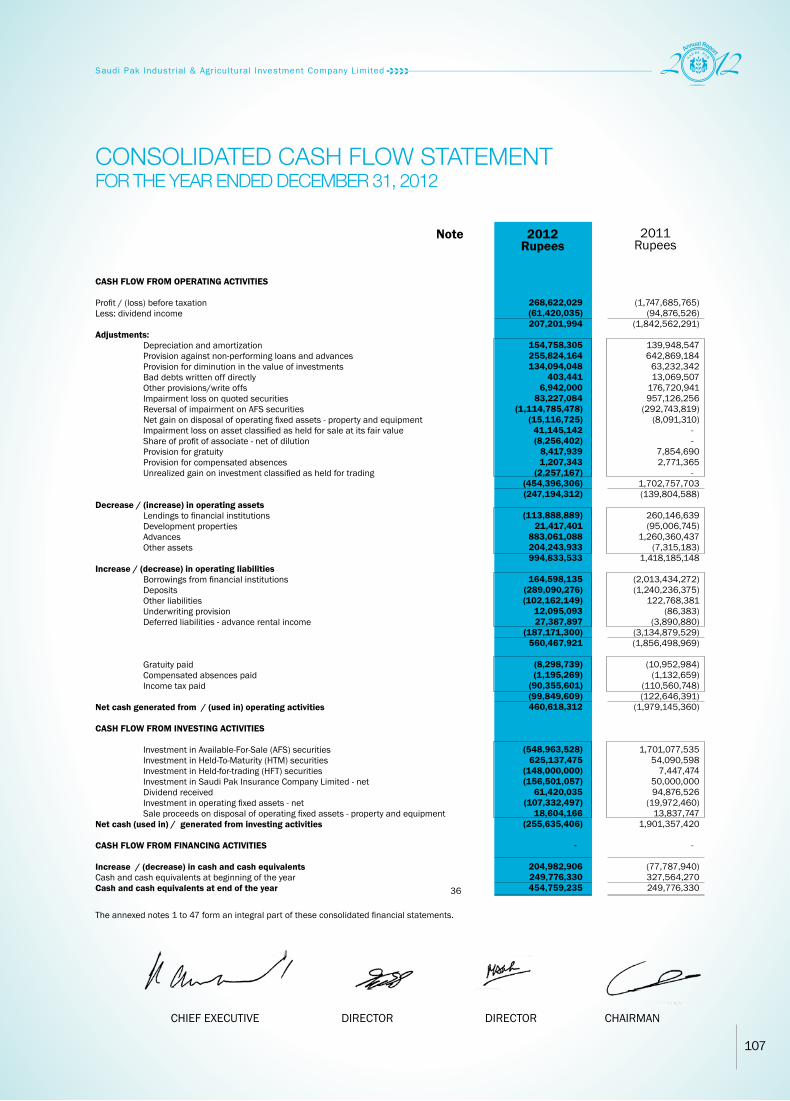
107
CONSOLIDATED CASH FLOW STATEMENTFOR THE YEAR ENDED DECEMBER 31, 2012
CASH FLOW FROM OPERATING ACTIVITIES Profit / (loss) before taxation Less: dividend income Adjustments: Depreciation and amortization Provision against non-performing loans and advances Provision for diminution in the value of investments Bad debts written off directly Other provisions/write offs Impairment loss on quoted securities Reversal of impairment on AFS securities Net gain on disposal of operating fixed assets - property and equipment Impairment loss on asset classified as held for sale at its fair value Share of profit of associate - net of dilution Provision for gratuity Provision for compensated absences Unrealized gain on investment classified as held for trading Decrease / (increase) in operating assets Lendings to financial institutions Development properties Advances Other assets Increase / (decrease) in operating liabilities Borrowings from financial institutions Deposits Other liabilities Underwriting provision Deferred liabilities - advance rental income Gratuity paid Compensated absences paid Income tax paid Net cash generated from / (used in) operating activities CASH FLOW FROM INVESTING ACTIVITIES Investment in Available-For-Sale (AFS) securities Investment in Held-To-Maturity (HTM) securities Investment in Held-for-trading (HFT) securities Investment in Saudi Pak Insurance Company Limited - net Dividend received Investment in operating fixed assets - net Sale proceeds on disposal of operating fixed assets - property and equipment Net cash (used in) / generated from investing activities CASH FLOW FROM FINANCING ACTIVITIES Increase / (decrease) in cash and cash equivalents Cash and cash equivalents at beginning of the year Cash and cash equivalents at end of the year 36
268,622,029 (61,420,035) 207,201,994
154,758,305 255,824,164 134,094,048
403,441 6,942,000
83,227,084 (1,114,785,478)
(15,116,725) 41,145,142 (8,256,402)
8,417,939 1,207,343
(2,257,167) (454,396,306) (247,194,312)
(113,888,889) 21,417,401
883,061,088 204,243,933 994,833,533
164,598,135 (289,090,276) (102,162,149)
12,095,093 27,387,897
(187,171,300) 560,467,921
(8,298,739) (1,195,269)
(90,355,601) (99,849,609) 460,618,312
(548,963,528) 625,137,475
(148,000,000) (156,501,057)
61,420,035 (107,332,497)
18,604,166 (255,635,406)
-
204,982,906 249,776,330 454,759,235
(1,747,685,765) (94,876,526)
(1,842,562,291)
139,948,547 642,869,184
63,232,342 13,069,507
176,720,941 957,126,256
(292,743,819) (8,091,310)
- -
7,854,690 2,771,365
- 1,702,757,703 (139,804,588)
260,146,639 (95,006,745)
1,260,360,437 (7,315,183)
1,418,185,148
(2,013,434,272) (1,240,236,375)
122,768,381 (86,383)
(3,890,880) (3,134,879,529) (1,856,498,969)
(10,952,984) (1,132,659)
(110,560,748) (122,646,391)
(1,979,145,360)
1,701,077,535 54,090,598
7,447,474 50,000,000 94,876,526
(19,972,460) 13,837,747
1,901,357,420
-
(77,787,940) 327,564,270 249,776,330
2012Rupees
2011Rupees
Note
The annexed notes 1 to 47 form an integral part of these consolidated financial statements.
CHIEF EXECUTIVE DIRECTOR DIRECTOR CHAIRMAN

108
CONSOLIDATED STATEMENT OF CHANGES IN EQUITYFOR THE YEAR ENDED DECEMBER 31, 2012
Balance as at January 01, 2011
Loss for the year
Capital reserves - rescheduling benefit
Total comprehensive income
Appropriation from reserve fund
Transferred from surplus on revaluation of
operating fixed assets - net of deferred tax
Non controlling interests arising on disposal of
Saudi Pak Insurance Company Limited
Balance as at December 31, 2011
Balance as at January 01, 2012
Profit for the year
Total comprehensive income
Appropriation from reserve fund
Transfer to reserve fund *
Transfer to general reserve
Transferred from surplus on revaluation of
operating fixed assets - net of deferred tax
Non controlling interest removed due to loss of
control in Saudi Pak Insurance Company Limited
Profit on dilution of holding in Saudi Pak Insurance
Company Limited before loss of control
Balance as at December 31, 2012
6,000,000,000
-
-
-
-
-
-
6,000,000,000
6,000,000,000
-
-
-
-
-
-
-
-
6,000,000,000
1,961,641,045
-
-
-
(448,458,943)
-
-
1,513,182,102
1,513,182,102
-
-
(1,412,718,297)
76,116,956
-
-
-
-
176,580,761
-
-
-
-
-
-
-
-
-
-
-
-
-
359,859,706
-
-
-
359,859,706
(203,334,991)
(1,581,085,770)
-
(1,581,085,770)
448,458,943
56,046,437
-
(1,279,915,381)
(1,279,915,381)
322,137,463
322,137,463
1,412,718,297
(76,116,956)
(359,859,706)
58,450,195
-
6,719,946
84,133,858
7,758,306,054
(1,581,085,770)
-
(1,581,085,770)
-
56,046,437
-
6,233,266,721
6,233,266,721
322,137,463
322,137,463
-
-
-
58,450,195
-
6,719,946
6,620,574,325
(42,689,064)
(461,479,171)
-
(461,479,171)
-
-
23,252,558
(480,915,677)
(480,915,677)
(75,149,783)
(75,149,783)
-
-
-
5,664,775
(93,694,744)
-
(644,095,429)
7,715,616,990
(2,042,564,941)
-
(2,042,564,941)
-
56,046,437
23,252,558
5,752,351,044
5,752,351,044
246,987,680
246,987,680
-
-
-
64,114,970
(93,694,744)
6,719,946
5,976,478,896
Share Capital Rupees
Reserve Fund
Rupees
General Reserve Rupees
Unappropriated (Loss) / Profit
Rupees
Sub - total
Rupees
Non-controlling interest Rupees
Total
Rupees
* Under Circular No 1 dated December 05, 1991 issued by the State Bank of Pakistan for Non-Banking Financial Institutions, an amount not less than 20% of the profit shall be transferred to create a reserve fund till such time the reserve fund equals the amount of paid up capital and thereafter 10% of the balance of profit of the company are to be transferred to this reserve.
The annexed notes 1 to 47 form an integral part of these consolidated financial statements.
CHIEF EXECUTIVE DIRECTOR DIRECTOR CHAIRMAN
109
NOTES TO THE CONSOLIDATED FINANCIAL STATEMENTSFOR THE YEAR ENDED DECEMBER 31, 2012
1 LEGAL STATUS AND OPERATIONS
1.1 The Group consists of Saudi Pak Industrial and Agricultural Investment Company Limited, the Holding company, its two subsidiary companies namely Saudi Pak Leasing Company Limited (SPLCL), Saudi Pak Real Estate Limited (SPREL) and its associated company namely Saudi Pak Insurance Company Limited (SPICL).
Saudi Pak Industrial and Agricultural Investment Company Limited
Saudi Pak Industrial and Agricultural Investment Company Limited (the “Company”) was incorporated in Pakistan as private limited company on December 23, 1981 and subsequently converted as a public limited company on April 30, 2008. The Company is jointly sponsored by the Governments of Kingdom of Saudi Arabia and the Islamic Republic of Pakistan. The principal activity of the Company is to invest in the industrial and agro-based industrial projects in Pakistan on commercial basis and market their products in Pakistan and abroad. The Company has been setup for a period of fifty years which may be extended with approval of both of the Governments. The registered office of the Company is situated at Saudi Pak Tower, Jinnah Avenue, Islamabad.
Saudi Pak Leasing Company Limited (‘’SPLCL’’)
Saudi Pak Leasing Company Limited (‘’SPLCL’’) was incorporated in Pakistan on January 08, 1991 and is listed on
all the three Stock Exchanges in Pakistan. The registered office of SPLCL is situated at 6th Floor, Lakson Square Building No.1, Sarwar Shaheed Road, Saddar, Karachi. The main business activity of SPLCL is the leasing of assets. SPLCL’s license to carry out the business of leasing had expired on May 18, 2010 and renewal is pending with the Securities and Exchange Commission of Pakistan. The Company holds 35.06% (2011: 35.06%) ordinary shares of SPLCL. However, SPLCL is considered subsidiary company because of the management control of the Holding Company.
Saudi Pak Real Estate Limited, (“SPREL”)
Saudi Pak Real Estate Limited, (“SPREL”) is limited by shares, incorporated in Pakistan as an unlisted public limited
company on November 14, 2006 under the Companies Ordinance, 1984. The principal businesses of SPREL are investments in properties (both for investment and development purposes), property management services, investments in joint ventures and other related services. SPREL is a wholly owned subsidiary of the Company. The registered / head office of SPREL is situated at Saudi Pak Towers, 61-A, Jinnah Avenue, Islamabad.
Saudi Pak Insurance Company Limited (‘’SPICL’’)
Saudi Pak Insurance Company Limited (‘’SPICL’’) is an unlisted public limited company incorporated in Pakistan on
February 15, 2005 under the Companies Ordinance, 1984. SPICL is engaged in non-life insurance business mainly comprising of fire, marine, motor and miscellaneous. SPICL commenced its commercial operations on April 13, 2005. The registered office of SPICL is situated at Suit no 204-A, second floor, madina city mall, Abdullah Haroon road, Karachi and principal office of SPICL is situated at UIG house 6-B, 1st floor, upper mall, Lahore, Pakistan.
The Holding Company entered into an agreement dated 09 June 2011 to sell 22,500,000 ordinary shares of Rs. 10 each in SPICL. The buyer has agreed to buy shares at a price of Rs. 99.45 million which represents Rs. 6 per share. The buyer has paid an amount of Rs. 30 million upon signing of agreement whereas the balance of Rs. 69.45 million is to be paid in seven quarterly installments comprising six quarterly installments of Rs. 10 million and seventh installment of Rs. 9.45 million. The buyer has provided performance securities against purchase price which includes immovable properties of Rs. 40 million. The shares will be transferred to the buyer in piece meal as and when the payment is received by the holding Company and after retaining 30% margin till final payment. Further, in accordance with the terms of the agreement, the remaining fully paid up 5,925,000 ordinary shares of Rs. 10
110
each will be sold to the buyer at the rate of Rs. 7.5 per share or book value of the share plus one rupee premium, whichever is higher on the terms to be agreed separately. As on date of consolidated statement of financial position, the Company holds 43.21% (2011: 57.56%) ordinary shares of SPICL. Accordingly, as on date of consolidated statement of financial position, the Company now holds 43.21% (2011: 57.56%) ordinary shares of SPICL.
1.2 Material uncertainty regarding SPLCL The country’s weak economic fundamentals along with serious challenges being faced by the country for last several years on account of various factors such as energy crisis, disturbed security environment, higher inflation, political instability and lack of trust of foreign investors have provided foundation for severe liquidity crunch for the leasing sector and for SPLCL as well. SPLCL thus faced difficulties in the form of defaults wherein recovery from customers became a challenging task. The deteriorated financial position of SPLCL can be overcome from the recovery on account of balance lease / loan portfolio, which is currently a lifeline for SPLCL, and the management is trying to recover as much as possible from the available means. The above factors affected SPLCL in the following manner: – During the year ended 31 December 2012, SPLCL has incurred a net loss of Rs. 129.498 million (2011:
725.73 million). Moreover, as at the year end, its accumulated losses stood at Rs. 1,616.483 million, whereas the equity stood at negative Rs. 1,016.555 million, as against the minimum equity requirement of Rs. 500 million. Furthermore its total liabilities exceeded total assets by Rs. 975.928 million and its current liabilities exceeded current assets by Rs. 673.258 million.
– As of 31 December 2012 impairment loss of Rs. 895.652 million on lease and loans portfolio has been
recognised and is included in the above mentioned accumulated loss figure. – SPLCL’s rating was downgraded as at 30 June 2010, not permitting SPLCL to issue new certificates of
investment. Subsequently, the management has not reviewed the rating agreement with the credit rating company.
– During the period, SPLCL defaulted in making payments of certain financial obligations due to liquidity
problems. As of 31 December 2012, total outstanding principal on which defaults were made amounts to Rs. 617.507 million and defaulted mark-up repayments amounts to Rs. 154.024 million. The management is in the process of negotiating the restructuring terms of such borrowings.
Furthermore, SPLCL’s license to carry out the leasing business had expired on 18 May 2010 and its renewal is pending with the Securities and Exchange Commission of Pakistan (SECP). However, SPLCL continues to carry out operating leases.
Although uncertainty exists due to the above factors which may cast doubt on SPLCL’s ability to continue as
a going concern, the management of SPLCL is confident that due to steps / measures as explained in the next paragraphs, which are in line with the Board’s approved rehabilitation plan for capital management and the approved financial projections, the going concern assumption is appropriate and has as such prepared this condensed interim financial information on a going concern basis.
– The Board of Directors supports SPLCL in negotiating the terms of restructuring of various borrowings from
SPLCL’s lenders (including financial institutions, term finance certificate holders, holders of certificates of investment, etc.) which will help SPLCL to continue as a going concern.
– The Board of Directors of SPLCL in their meeting held on 11 June 2012 approved to convert the sub-ordinated debt amounting to Rs. 333.208 million and a debt of major lender amounting to Rs. 195 million into convertible preference shares at a face value of Rs. 10 per share. The shareholders in extra ordinary general meeting held on 31 July 2012 also approved the decision of the Board and also decided to increase the authorised share capital of SPLCL to Rs. 2,000 million. The management of SPLCL has initiated the process of such conversion and filed an application for approval to the SECP. Subsequently, the SECP vide its letter number SC/NBFC/23/SPLCL/2013/58 dated 13 February 2013 approved the issuance of non-voting, non-cumulative, convertible and unlisted non-redeemable preference shares to Saudi Pak

111
Industrial & Agricultural Investment Company Limited (SAPICO) and the Bank of Khyber (BOK) amounting in total to Rs. 528.208 million, in lieu of conversion of sub-ordinated debt to equity and settlement of liability respectively. This will result in an increase in equity of SPLCL by Rs. 528.208 million.
– The borrowings (including mark-up thereon) of SPLCL has been brought down to Rs. 1,777.328 million
from Rs. 1,881.327 million (excluding sub-ordinated debt) during the six months period through cash payments and settlements effected by lease and term loans swapping or sale / swapping of collateral held against non-performing borrowers. The management has also finalised a few loan settlement agreements and is under negotiation with the remaining borrowers for the settlement of SPLCL’s obligation through surrender of its assets / collateral held against its non-performing exposure.
– The settlement agreements finalised as of 31 December 2012 will result in reduction of borrowing by Rs. 126.513 million by way of waiver of principal and mark-up, which is subject to performance of certain terms.
– Moreover, after the balance sheet date the management further managed to finalise settlement
agreements against their borrowing amounting to Rs. 56.316 million and will also receive a waiver in principal and mark-up of Rs. 30.702 million which is subject to performance of certain conditions. Further, the management is currently under negotiation with various borrowers amounting to Rs. 335.061 million and is expecting positive results based on the negotiations so far.
– Since October 2008, SPLCL has managed to generate liquidity from the existing business and has not
opted for any further borrowing from the market. Furthermore, the management has also prepared a contingent plan and identified certain assets which might be considered for sale if SPLCL needs to generate additional liquidity to finance its business.
– The management has negotiated with Term Finance Certificate (TFC) holders for restructuring of term finance certificates and has successfully concluded the transaction by way of step up monthly payments to be made during the period starting from January 2012 and has also successfully negotiated to defer the mark-up payments.
– Management is hopeful that the reduction in the finance cost through restructuring / settlements with the
borrowers and the issuance of preference shares (as mentioned above) will assist in reducing the losses and improving the equity. SPLCL intends to aggressively follow-up with its non-performing portfolio for the recovery of principal, mark-up and possession of collateral assets. In this respect the management has strengthened its recovery team and is expecting an approximate of Rs. 20 million each month through such recoveries. During the six months period, on an average basis, a monthly cash recovery of Rs. 18.250 million has been achieved.
– SPLCL has requested the Securities and Exchange Commission of Pakistan (SECP) for relaxation in the minimum Capital requirement under NBFC Regulations, 2008 and is hopeful that this request will be accepted based on the condition of the overall business environment and SPLCL’s position in the leasing sector. Moreover, the SECP in view of the prevailing economic condition and the overall business environment is considering a proposal for revision in the minimum capital requirement (MCR) under the NBFC Rules and it is hoped that a substantial reduction in the MCR would be in place soon.
– On achieving the Board’s approved capital management plan and the financial projections, SPLCL’s equity position is expected to reflect the following position:
112
Equity position as of 31 December 2012 Issued, subscribed and paid-up share capital Capital reserves Accumulated loss Surplus on revaluation of available-for-sale investments Equity Expected impact on the equity based on financial projections (over the next three years) Equity as of 31 December 2012: Conversion of liabilities into preference shares Reversal / waivers of mark-up on settlement of liabilities Reversal / waivers of principal on settlement of liabilities Reversal of provisions by claiming forced sales value benefitsReversal of provisions through recoveries Effects of taxation and others - net Expected equity (by June 2015)
451,605,000 148,257,389
(1,616,483,001) 66,120
(1,016,554,492)
(1,016,554,492)
668,208,000 300,997,723 224,427,000
55,570,156 453,155,095 (41,003,979)
1,661,353,995
726,809,050
2012Rupees
1.3 Certain non-compliances of NBFC Regulations 2008 by SPLCL Due to the fact that at 31 December 2012, SPLCL’s equity is negative by Rs. 1,016.555 million, SPLCL could not
meet the regulatory requirements of NBFC Regulations, 2008 (apart from those mentioned in notes 1.2 above and 20.2.2), including the following:
– Regulation 5 (1) - aggregate liabilities, excluding contingent liabilities and security deposits, of an NBFC,
shall not exceed ten times of the company’s equity (in case of operations beyond the first 2 years).
– Regulation 5 (2) - contingent liabilities of an NBFC shall not exceed seven times of its equity for the first two years of its operation and ten times of its equity in the subsequent years.
– Regulation 17 (1) - total outstanding exposure (fund and non-fund based) of an NBFC to a person should not at any time exceed 30% of the equity of the NBFC, provided that the maximum outstanding fund based exposure should not exceed 20% of the NBFC’s equity.
– Regulation 17 (2) - total outstanding exposure (fund based and non-fund based) of an NBFC to any group shall not exceed 50% of the equity of the NBFC, provided that the maximum outstanding fund based exposure should not exceed 35% of the equity.
– Regulation 18 - an NBFC shall make clean money market placement only with financial institutions and its aggregate exposure shall not exceed its equity.
– Regulation 28 (a) - a leasing company undertaking the business of lease only, shall invest at least 70% of its assets in the business of leasing. As at 31 December 2012, SPLCL’s investment in lease assets was 67.52% (30 June 2012: 71.4%) of the total assets (less allowable deductions).
– Regulation 28 (d) - total investments of the leasing company in shares, equities or scrips shall not exceed 50% of the equity of the leasing company.

113
– Regulation 28 (e) - a leasing company shall not own shares, equities or scrip of any one company in excess of 10% of its own equity or the issued capital of that company, whichever is lower.
2 BASIS OF PRESENTATION These consolidated financial statements have been presented in accordance with the requirements of format
prescribed by the State Bank of Pakistan’s BSD Circular No.4 dated February 17, 2006.
2.1 Functional and presentation currency Items included in the consolidated financial statements are measured using the currency of the primary economic environment in which the Group operates. The consolidated financial statements are presented in Pak. Rupees, which is the Group companies functional currency.
3 STATEMENT OF COMPLIANCE
3.1 These consolidated financial statements have been prepared in accordance with approved accounting standards as applicable in Pakistan. Approved accounting standards comprise of such International Financial Reporting Standards (IFRS) issued by the International Accounting Standard Board as are notified under the Companies Ordinance, 1984, provisions of and directives issued under the Companies Ordinance, 1984 and Banking Companies Ordinance, 1962 and the directives issued by State Bank of Pakistan (SBP). In case the requirements of provisions and directives issued under the Companies Ordinance, 1984 and Banking Companies Ordinance, 1962 and the directives issued by SBP differ with the requirements of IFRS, the provisions of and directives issued under the Companies Ordinance, 1984 and Banking Companies Ordinance, 1962 and the directives issued by SBP shall prevail.
3.2 The SBP through its BSD Circular Letter No. 11 dated September 11, 2002 has deferred the implementation of International Accounting Standard (IAS) 39, “Financial Instruments: Recognition and Measurement” and IAS 40, “Investment Property” for Development Financial Institutions (DFIs) till further instructions. According to the notification of SECP dated April 28, 2008, the IFRS 7 “Financial Instruments’ Disclosures” has not been made applicable for DFIs. In view of above, the requirements of these standards have not been considered in the preparation of these consolidated financial statements. The investments have been classified and valued in accordance with the requirements prescribed by the State Bank of Pakistan through various circulars.
4 BASIS OF MEASUREMENT
4.1 These consolidated financial statements have been prepared under the historical cost convention except for:
– revaluation of certain items of operating fixed assets; – revaluation of certain investments in accordance with directives of State Bank of Pakistan; and – recognition of certain employee benefits at present value. 4.2 Use of critical accounting estimates and judgments
The preparation of consolidated financial statements in conformity with the approved accounting standards requires the use of certain critical accounting estimates. It also requires the management to exercise its judgment in the process of applying the Group’s accounting policies. The Group uses estimates and assumptions concerning the future. The resulting accounting estimate will, by definition, seldom equal the related actual results. Estimates and judgments are continually evaluated and are based on historical experience and other factors, including expectations of future events that are believed to be reasonable under the circumstances. The areas involving a higher degree of judgment or complexity, or areas where assumptions and estimates are significant to these consolidated financial statements are as follows:
(a) Provision against non performing loans and advances
The Group reviews its loan portfolio to assess amount of non-performing advances and provisions required there
against on regular basis. While assessing this requirement various factors including the delinquency in the account, financial position of the borrowers and the requirements of the Prudential Regulations are considered. The amount of general provision is determined in accordance with the management’s judgment.
114
(b) Classification of investments
– Held-For-Trading (HFT) In classifying investments as ‘held-for-trading’, the Group has determined securities which are acquired with
an intention to trade by taking advantage of short term market / interest rate movements and are to be sold within 90 days.
– Held-To-Maturity (HTM)
In classifying investments as ‘held-to-maturity’, the Group follows the guidance provided in SBP circulars on classifying non-derivative financial assets with fixed or determinable payments and fixed maturity. In making this judgment, the Group evaluates its intention and ability to hold such investment to maturity.
– Available-For-Sale (AFS)
The investments which are not classified as ‘held-for-trading’ or ‘held-to-maturity’ are classified as ‘available-
for-sale’. (c) Valuation and impairment of ‘available-for-sale’ equity investments The Group determines that ‘available-for-sale’ equity investments are impaired when there has been a significant
or prolonged decline in the fair value below its cost. The determination of what is significant or prolonged requires judgment. In making this judgment, the Group evaluates among other factors, the normal volatility in share price. In addition, the impairment may be appropriate when there is an evidence of deterioration in the financial health of the invested industry and sector performance, changes in technology and operational/financial cash flows.
(d) Taxation In making the estimates for income taxes currently payable by the Group, the management considers the current
income tax laws and the decisions of appellate authorities on certain issues in the past. (e) Fair value of derivatives The fair values of derivatives which are not quoted in active markets are determined by using valuation techniques.
The valuation techniques take into account the relevant interest rates at the date of consolidated statement of financial position and the rates contracted.
(f) Depreciation, amortization and revaluation of operating fixed assets / intangible assets In making estimates of the depreciation / amortization method, the management uses the method which reflects
the pattern in which economic benefits are expected to be consumed by the Group. The method applied is reviewed at each financial year end and if there is a change in the expected pattern of consumption of the future economic benefits embodied in the assets, the method is changed to reflect the changed pattern. Such change is accounted for as change in accounting estimates in accordance with International Accounting Standard (IAS) 8 “Accounting Policies, Changes in Accounting Estimates and Errors”. Further, the Group estimates the revalued amount of land and buildings on a regular basis. The estimates are based on valuations carried out by independent professional valuers under the market conditions.
(g) Staff retirement benefits Certain actuarial assumptions have been adopted as disclosed in these consolidated financial statements (refer note
37) for the actuarial valuation of staff retirement benefit plans. Actuarial assumptions are entity’s best estimates of the variables that will determine the ultimate cost of providing post employment benefits. Changes in these assumptions in future years may affect the liability / asset under these plans in those years.

115
(h) Provision against other assets and receivables The Group reviews other assets and receivables to assess any amount of provision / bad debts required there
against on regular basis.
(i) Development properties The management reviews the net realizable value of development properties to assess any diminution in the
respective carrying values. These estimates are based on historical experience and are continuously reviewed. Net realizable value is determined with respect to estimated selling price less estimated expenditures to make the sales.
(j) Transfer of equitable interest in development properties
The Group has entered into a number of contracts with buyers for the sale of bungalows, shops and offices. Management has determined that equitable interest in such assets and therefore risks and rewards of the ownership are transferred to the buyer once he is committed to complete the payment for the purchase. This commitment is evidenced by a signed contract for the purchase of the property and payments of sufficient progress payments. Based on this, Group recognizes revenues and profits as the acts to complete the property are performed.
5 SUMMARY OF SIGNIFICANT ACCOUNTING POLICIES
5.1 Basis of Consolidation The consolidated financial statements include the financial statements of the Company, its two subsidiary companies
and one associated company as stated in note 1.1 above.
– Subsidiaries are those enterprises in which the holding company directly or indirectly controls, beneficially owns or holds more than 50% of the voting securities or otherwise has the power to elect and appoint more than 50% of its directors. The financial statements of the subsidiaries are included in the consolidated financial statements from the date control commences until the date that control ceases.
– The assets and liabilities of subsidiary companies have been consolidated on a line by line basis and the carrying value of investment held by the holding company is eliminated against holding company’s share in paid up capital of the subsidiaries.
– Material intra-group balances and transactions have been eliminated. Non-controlling interests are that part of net results of the operations and of net assets of the subsidiary attributable to interests which are not owned by the holding company. Non-controlling interests are presented as separate item in the consolidated financial statements. Losses applicable to Non-controlling interests in a subsidiary are allocated to the Non-controlling interests even if doing so causes the Non-controlling interests to have a deficit balance.
– The accounting policies of subsidiaries have been changed when necessary to align them with the policies adopted by the Group.
– Associate is the entity in which the group has significant influence, but not control over the financial and operating policies. Significant influence exists when the Group hold between 20 to 50 percent of the voting power of another entity. The consolidated financial statements include the Groups share of result of the associate. Investment in associate is accounted for using the equity method of accounting and was initially recognized at cost.
– During the year, the Holding Company lost its control over SPICL and accordingly SPICL has been accounted for as subsidiary till the date of loss of control and as associate thereafter in these consolidated financial statements. Also refer note 1.1

116
5.2 Cash and cash equivalents
Cash and cash equivalents comprise of cash and balances with treasury banks and balances with other banks in current and deposit accounts.
5.3 Sale and repurchase agreements
Securities sold under repurchase agreement (repo) are retained in the consolidated financial statements as
investments and a liability for consideration received is included in borrowings. Conversely, consideration for securities purchased under resale agreement (reverse repo) are included in lendings to financial institutions. The difference between sale and repurchase / purchase and resale price is recognised as mark-up / return expensed and earned on a time proportion basis as the case may be. Repo and reverse repo balances are reflected under borrowings from and lendings to financial institutions respectively.
5.4 Investments Investments are classified as follows:
(a) Held-For-Trading (HFT)
These represent securities acquired with the intention to trade by taking advantage of short-term market / interest
rate movements. These are marked to market and surplus / (deficit) arising on revaluation of ‘held for trading’ investments is taken to consolidated profit and loss account in accordance with the requirements prescribed by the State Bank of Pakistan through various circulars.
(b) Held-To-Maturity (HTM)
These represent securities acquired with the intention and ability to hold them upto maturity. These are carried at amortized cost less impairment, if any, in accordance with the requirements prescribed by the State Bank of Pakistan through various circulars.
(c) Available-For-Sale (AFS)
These represent securities which do not fall under ‘held for trading’ or ‘held to maturity’ categories. In accordance with the requirements of the State Bank of Pakistan’s BSD Circular No. 20 dated August 04, 2000, available for sale securities for which ready quotations are available on Reuters Page (PKRV) or Stock Exchanges are valued at market value and the resulting surplus / deficit on revaluation net of deferred tax is kept in a separate account and is shown below the shareholders’ equity in the consolidated statement of financial position. Where the decline in prices of available for sale securities is significant or prolonged, it is considered impaired and included in consolidated profit and loss account.
Unquoted equity securities are valued at the lower of cost and break-up value. Break-up value of equity securities
is calculated with reference to the net assets of the investee companies as per their latest available financial statements. Investments in other unquoted securities are valued at cost less impairment losses, if any.
All purchases and sale of investment that require delivery within the time frame established by regulations or
market convention are recognized at the trade date, which is the date the Group commits to purchase or sell the investments.
5.5 Advances Advances are stated net of provision for non-performing advances. Provision for non-performing advances is
determined in accordance with the requirements of the Prudential Regulations issued by State Bank of Pakistan from time to time.
The provision against non-performing advances is charged to the consolidated profit and loss account. Advances are

117
written off when there is no realistic prospect of recovery.
The SBP amended the Prudential Regulations in relation to provision for loans and advances of the Holding Company and Securities and Exchange Commission of Pakistan has amended the time based criteria for calculating the provision for SPLCL against non performing leases. Related impacts and disclosures are given in notes 11.1.6.1, 11.1.6.2, 11.2.2.3 and 11.2.3.1.
5.6 Net investment in finance lease
These are stated at present value of minimum lease payments under the agreements. The allowance for potential lease losses is maintained at a level which in the opinion of management, is adequate to provide for potential lease losses on lease portfolio that can be reasonably anticipated. The allowance is increased by the provisions charged to income and decreased by write offs, net of recoveries. The Group maintains provision for potential lease losses in accordance with the Prudential Regulations applicable on the Group.
5.7 Operating fixed assets and depreciation/ amortization
(a) Tangible assets Tangible operating fixed assets are stated at cost less accumulated depreciation and impairment loss, if any, except
for freehold land which is stated at cost and lease hold land, buildings and certain other items which are carried at revalued amount less depreciation.
Certain items of tangible operating fixed assets are revalued by professionally qualified valuers with sufficient regularity to ensure that the net carrying amount does not differ materially from their fair value. Surplus / (deficit) arising on revaluation of fixed assets is credited/ (debited) to the surplus on revaluation of assets account and is shown below the shareholders’ equity in the consolidated statement of financial position.
Revaluation is carried out with sufficient regularity to ensure that the carrying amount of assets does not differ materially from their fair value.
Depreciation is provided on straight line method at rates specified in note 12.1 to the consolidated financial statements so as to write off the cost of the assets over their estimated useful lives. Depreciation of an asset begins when it is available for use. Depreciation of an asset ceases at the earlier of the date that the asset is classified as held for sale and the date that the asset is derecognized. Therefore, depreciation does not cease when the asset becomes idle or is retired from active use unless the asset is fully depreciated.
Maintenance and normal repairs are charged to consolidated profit and loss account as and when incurred. Major
renewals and improvements are capitalized. Gains and losses on disposal of operating fixed assets are taken to the consolidated profit and loss account.
(b) Intangibles Intangible assets are stated at cost less accumulated amortization. Impairment losses, if any, is charged to
consolidated profit and loss account. Amortization is computed from the date of purchase to date of disposal / write off using the straight line method in accordance with the rates specified in note 12.2 to these consolidated financial statements to write off cost of the assets over their estimated useful lives.
(c) Capital work in progress Capital work in progress is stated at cost less accumulated impairment losses, if any, and is transferred to the
respective item of operating fixed assets when available for intended use.
5.8 Taxation Income tax on the profit or loss for the year comprises current and deferred tax. Income tax is recognized in the

118
consolidated profit and loss account, except to the extent that it relates to items recognized directly in equity or below equity / other comprehensive income, in which case it is recognized in equity or below equity / other comprehensive income.
(a) Current Provision for current taxation is the expected tax payable on the taxable income for the year using tax rates applicable
at the date of consolidated statement of financial position. The charge for the current tax also includes adjustments, where considered necessary relating to prior years, arising from assessments made during the year for such years.
(b) Deferred Deferred tax is provided for by using the balance sheet liability method, providing for temporary differences between
the carrying amounts of assets and liabilities for financial reporting purposes and the amount used for taxation purposes. The amount of deferred tax provided is based on the expected manner of realization or settlement of the carrying amount of assets and liabilities using tax rates enacted or substantially enacted at the date of consolidated statement of financial position, expected to be applicable at the time of its reversal. A deferred tax asset is recognized only to the extent that it is probable that the future taxable profit will be available and credits can be utilized. Deferred tax assets are reduced to the extent it is no longer probable that the related tax benefit will be realized.
The Group recognizes deferred tax asset/liability on (deficit)/surplus on revaluation of securities and revaluation of operating fixed assets in accordance with the requirement of International Accounting Standard (IAS) 12 “Income Taxes” which is adjusted against the related surplus / (deficit).
5.9 Provisions Provisions are recognized when there are present, legal or constructive obligations as a result of past events and it
is probable that an out flow of resources embodying economic benefits will be required to settle the obligation and a reliable estimate of the amounts can be made. Provision for guarantee claims and other off balance sheet obligations is recognized when intimated and reasonable certainty exists to settle the obligations. Expected recoveries are recognized by debiting customer accounts. Charge to consolidated profit and loss account is stated net off expected recoveries.
5.10 Staff retirement benefits
(a) Defined benefit plan
The Group operates an unfunded gratuity scheme for all of its permanent employees who have put in three years
of continuous service with the Group. The actuarial valuation is carried out periodically using “Projected Unit Credit Method” as allowed under the International Accounting Standard (IAS) 19 “Employee Benefits”. A portion of the actuarial gains or losses is recognized over the expected remaining working life of its employees if the net cumulative unrecognized actuarial gains or losses at the end of the previous year exceeds the “corridor limit” which is defined as the greater of:
– 10% of the present value of the defined benefit obligation at that date (before deducting plan assets); and
– 10% of the fair value of any plan assets at that date.
(b) Defined contribution plan
The Group (except SPLCL) also operates a recognized funded provident fund scheme for all of its permanent
employees. Equal monthly contributions at the rate of 10% of basic salary are made both by the Group and the employees, which are transferred to the provident fund.
119
(c) Compensated absences As per its service rules, the Group grants compensated absences to all of its permanent employees. The provision
for compensated absences is made on the basis of last drawn basic salary. 5.11 Revenue recognition (a) Mark-up/ interest on loans and advances and return on investments is recognized on accrual basis except on
classified advances which is recognized on receipt basis in compliance with Prudential Regulations issued by the SBP.
(b) Markup/interest on rescheduled/ restructured loans and advances and return on investment is recognized in
accordance with the directives of the SBP.
(c) Unrealized income is held in suspense account, where necessary, in accordance with the requirements of SBP guidelines and recognized as income on receipt basis.
(d) Fees, commission and brokerage income is recognized at the time of performance of service.
(e) Dividend income is recognized when the Group’s right to receive income is established.
(f) The Group follows the finance method to recognize income from lease financing. Under this method, the unearned lease income (excess of the sum of total lease rentals and estimated residual value over the cost of the leased assets) is deferred and taken to income over the term of lease period so as to produce a constant periodic rate of return on the outstanding net investment in lease. Gains/ losses on termination of lease contracts are recognized as income/expense when these are realized.
(g) Gains and losses on sale of investments are included in income currently.
(h) Gains and losses on disposal of operating fixed assets are taken to the consolidated profit and loss account. (i) Premium income under a policy is recognized over the period of insurance from the date of issuance of policy to
which it relates to its expiry as follows:
– For direct business, evenly over the period of the policy; and– For proportional reinsurance business, evenly over the period of underlying insurance policies.
Where the pattern of incidence of risk varies over the period of the policy, premium is recognized as revenue in
accordance with the pattern of incidence of risk. Premium for policies receivable in installments are recorded as receivable at the inception of the policy and are recognized as income over the period of the policy, in accordance with the provisions of the SEC ( Insurance ) Rules, 2002.
(j) Sale of properties Revenue on sale of plots, buildings, bungalows and villas is recognized on accrual basis if all of the following
conditions are met: – the Group has transferred to the buyer the significant risks and rewards of ownership of the goods;– the Group retains neither continuing managerial involvement to the degree usually associated with ownership
nor effective control over the properties sold; – the amount of revenue, cost incurred or to be incurred in respect of the transaction can be measured reliably;
and – it is probable that the economic benefit associated with the transaction will flow to the Group;
Revenue on sale of buildings, bungalows and villas is recognized on the percentage completion if all of the following
conditions are met: The Group transfers to the buyer the significant risks and reward of ownership of the work in progress in its current
120
state as the work progresses. The significant risks and rewards of ownership are transferred to the buyer when the buyer is committed and the commitment is evidenced by a signed contract and is unable to require a refund except for non delivery of the unit. Management believes that the likelihood of the Group being unable to fulfill its contractual obligations for this reason is remote.
(k) Rendering of services Revenue from rendering of services is recognized when the outcome of the transaction can be estimated reliably by
reference to the stage of completion of the transaction at the date of consolidated statement of financial position.
(l) Finance leases income
The Group follows the ‘financing method’ in accounting for recognition of finance lease. At the commencement of a lease, the total unearned finance income i.e. the excess of aggregate installment contract receivables plus residual value over the cost of the leased asset is amortized over the term of the lease, applying the annuity method, so as to produce a constant periodic rate of return on the net investment in finance leases. Initial direct costs are deferred and amortized over the lease term as a yield adjustment. Processing, front end and commitment fees and commission are recognized as income when such services are provided.
(m) Operating lease Rental income from operating leases is recognized on a straight-line basis over the term of the relevant lease. 5.12 Foreign currency transactions Foreign currency transactions are translated into Pak. Rupee at the exchange rates prevailing on the date of
transaction. Monetary assets and liabilities in foreign currencies are translated to Pak. Rupee at the exchange rates prevailing at the date of consolidated statement of financial position. Exchange gains and losses are included in consolidated profit and loss account currently.
5.13 Impairment The carrying amount of the Group’s assets are reviewed at the date of consolidated statement of financial position to
determine whether there is any indication of impairment. If such indications exist, the asset’s recoverable amount is estimated in order to determine the extent of the impairment loss, if any. Impairment loss is recognized as expense in the consolidated profit and loss account. An impairment loss is reversed only to the extent that the asset’s carrying amount does not exceed the carrying amount that would have been determined, net of depreciation or amortization, if no impairment loss had been recognized.
– Financial assets
A financial asset is assessed at each reporting date to determine whether there is any objective evidence that it is impaired. A financial asset is impaired if there is objective evidence as a result of one or more events that occurred after the initial recognition of the asset, and that loss event(s) had an impact on the estimated future cash flows of that asset that can be estimated reliably.
– Non - financial assets The carrying amount of the assets other than deferred tax assets are reviewed at each date of consolidated
statement of financial position to determine whether there is any indication of impairment of any asset or a group of assets. If any such indication exists, the recoverable amount of such assets is estimated and impairment losses are recognized immediately in the consolidated profit and loss account.
A previously recognized impairment loss is reversed only if there has been a change in the estimates used to determine the recoverable amount of an asset, but not to an amount higher than the carrying amount that would have been determined (net of any depreciation) had no impairment loss been recognized for the asset in prior years. Reversal of impairment loss is recognized as income.

121
5.14 Financial instruments Financial assets and financial liabilities Financial instruments carried on the consolidated statement of financial position include cash and balances with
treasury banks, balances with other banks, lendings to financial institutions, investments, advances, other assets, bills payable, borrowings, deposits and other liabilities. The particular recognition methods adopted for significant financial assets and financial liabilities are disclosed in the individual policy statements associated with these assets and liabilities.
5.15 Off-setting of financial instruments Financial assets and financial liabilities are only set-off and net amount is reported in the consolidated financial
statements when there is legally enforceable right to set-off the recognized amount and the Group either intends to settle on net basis or to settle the liabilities and realize the assets simultaneously.
5.16 Insurance contracts Insurance contracts are those contracts where the SPICL (the insurer) has accepted significant insurance risk from
another party (the policyholders) by agreeing to compensate the policyholders if a specified uncertain future event (the insured event) adversely affects the policyholders. Once a contract has been classified as an insurance contract it remains an insurance contract for the remainder of its lifetime, even if the insurance risk reduces significantly during this period, unless all rights and liabilities are extinguished or expired. Insurance contracts are classified into following main categories, depending on the nature and duration of risk and whether or not the terms and conditions are fixed.
– Fire and property damages – Marine, aviation and transport– Motor – Miscellaneous
Fire and property insurance contracts mainly compensate the SPICL’s customers for damage suffered to their
properties or for the value of property lost. Marine Insurance covers the loss or damage of vessels, cargo, terminals and any transport of property by which cargo is transferred, acquired or held between the points of origin and final destination. Motor insurance provides protection against losses incurred as a result of theft, traffic accidents and against third party liability that could be incurred in an accident. Other various types of insurance are classified in miscellaneous category which includes mainly engineering, crop and livestock, personal accident, worker compensation, travel, products of financial institutions and crop insurance etc.
The SPICL has not issue any insurance contracts with discretionary participation features (DPF) or any investment
contracts. 5.17 Reinsurance ceded The Group enters into reinsurance contracts in the normal course of business in order to limit the potential for
losses arising from certain exposures. Outward reinsurance premiums are accounted for in the same period as the related premiums for the direct or accepted reinsurance business being reinsured. Reinsurance liabilities represent balances due to reinsurance companies. Amounts payable are estimated in a manner consistent with the related reinsurance contract. Reinsurance assets represent balances due from reinsurance companies. Amounts recoverable from reinsurers are estimated in a manner consistent with the provision for outstanding claims or settled claims associated with the reinsurance policies and are in accordance with the related reinsurance contract. Reinsurance assets are not offset against related insurance liabilities. Income or expenses from reinsurance contract are not offset against expenses or income from related insurance assets. Reinsurance assets or liabilities are derecognized when the contractual rights are extinguished or expired.

122
The Group assesses its reinsurance assets for impairment on the date of consolidated statement of financial position, if there is an objective evidence that the reinsurance asset is impaired, the Group reduces the carrying amount of the reinsurance asset to its recoverable amount and recognizes that impairment loss in the consolidated profit and loss account.
5.18 Claim expense General insurance claims include all claims occurring during the year, whether reported or not, related internal and
external claims handling costs that are directly related to the processing and settlement of claims, a reduction for the value of salvage and other recoveries and any adjustments to claims outstanding from previous years. The Group recognizes liability in respect of all claims incurred upto the date of consolidated statement of financial position which is measured at the undiscounted value of the expected future payments. The claims are considered to be incurred at the time of the incident giving rise to the claim except as otherwise expressly indicated in an insurance contract. The liability for claims include amounts relating to unpaid reported claims, claims incurred but not reported (IBNR) and expected claims settlement costs. Provision for liability in respect of unpaid reported claims is made on the basis of individual case estimates. Provision for IBNR is based on the management’s best estimate which takes into account the past trends, expected future patterns of reporting of claims and the claims actually reported subsequent to the date of consolidated statement of financial position.
5.19 Reinsurance recoveries against outstanding claims Claims recoveries from the reinsurer are recognized as an asset at the same time as the claims which give rise to
the right of recovery are recognized as a liability and are measured at the amount expected to be received. Claims expenses are reported net of reinsurance in the consolidated profit and loss account.
5.20 Commission expense and other acquisition costs
Commission expense and other acquisition costs are charged to the consolidated profit and loss account at the time the policies are accepted. Commission income from reinsurers is recognized at the time of issuance of the underlying insurance policy by the Group. This income is deferred and brought to account as revenue in accordance with the pattern of recognition of the reinsurance premium to which it relates. Profit commission, if any, which the Group may be entitled to under the terms of reinsurance is recognized on accrual basis.
5.21 Premium deficiency reserves The consolidated is required as per SEC (Insurance) Rules, 2002, to maintain a provision in respect of premium
deficiency for the class of business where the unearned premium liability is not adequate to meet the expected future liability, after reinsurance from claims and other supplementary expenses expected to be incurred after the date of consolidated statement of financial position in respect of the unexpired policies in that class of business at the date of consolidated statement of financial position. The movement in the premium deficiency reserve is recorded as an expense/ income in consolidated profit and loss account for the year.
For this purpose, loss ratios for each class are estimated based on historical claim development. Judgment is used
in assessing the extent to which past trends may not apply in future or the effects of one-off claims. If these ratios are adverse, premium deficiency is determined. The loss ratios estimated on these basis for the unexpired portion are as follows:
Fire and property damage 117%; Marine, aviation and transport 53%; Motor 64%; and
Miscellaneous 48%.
Based on an analysis of combined operating ratio for the expired period of each reportable segment, the management considers that the unearned premium reserve for all classes of business as at the year end is adequate to meet the expected future liability after reinsurance from claims and other expenses, expected to be incurred after the date of consolidated statement of financial position in respect of policies in those classes of business in force at the date of

123
consolidated statement of financial position. 5.22 Amount due to other insurers/reinsurers Liabilities for other insurers/ reinsurers are carried at cost which is the fair value of consideration to be paid in the
future for services 5.23 Repossessed assets These assets are acquired in settlement of certain loans / lease receivables. These are measured at lower of
carrying amount of the related receivables and fair value less cost to sell of repossessed assets. 5.24 Finance Leases (as lessor)
Amounts due from lessees under finance lease are recorded as receivables at the amount of the net investment in the leases. Finance lease income is allocated to accounting periods so as to reflect a constant periodic rate of return on the net investment outstanding in respect of the leases
5.25 Provision for unearned premium
Provision for unearned premium represents the portion of premium written relating to the unexpired period of coverage. The Group has opted for the 1/24 method to calculate provision for unearned premium as per the option given under SEC Insurance Rules, 2002.
5.26 Borrowing costs Borrowing costs directly attributable to the acquisition, construction or production of qualifying assets, which are
assets that necessarily take a substantial period of time to get ready for their intended use or sale, are added to the cost of those assets, until such time as the assets are substantially ready for their intended use or sale. All other borrowing costs are recognized in profit or loss in the period in which they are incurred.
5.27 Development properties
Development properties include land acquired for development of bungalows, shops and offices for sale. These are carried in the consolidated statement of financial position at lower of cost and net realizable value. Cost includes all direct costs attributable to the design and construction of the properties. The properties are considered to be completed when all related activities, including the infrastructure and facilities for the entire project, have been completed. Net realizable value represents the selling price in the ordinary course of business less cost of completion and estimated cost necessarily to be incurred for sale.
5.28 Segment Reporting A segment is a distinguishable component of the Group that is engaged either in providing differentiated products
or services (business segment) or in providing products or services within a particular economic environment (geographical segment), subject to risks and rewards that are different from those of other segments. Segment information is presented as per the Group’s functional structure and the guidance of State Bank of Pakistan. The Group’s primary format of reporting is based on business segments. The Group comprises of the following main business segments:
(a) Business Segment
– Corporate finance This includes investment activities such as underwriting, Initial Public Offers (IPOs) and corporate financing
which includes leases of assets.

124
– Trading and Sales Trading and sales includes the Group’s treasury and money market activities classified as held for trading. – Real Estate Services This segment undertakes the investments in properties (both for investment and development purposes),
property management services, investments in joint ventures and other related services.
– Insurance Services This segment includes non-life insurance business mainly comprising of fire, marine, motor and
miscellaneous.
(b) Geographical Segment The Group conducts all its operations in Pakistan.
5.29 Forthcoming changes in approved accounting standards which are not yet effective
The following standards, amendments and interpretations of approved accounting standards will be effective for accounting periods beginning on or after 01 January 2013: – IAS 19 Employee Benefits (amended 2011) - (effective for annual periods beginning on or after 1 January
2013). The amended IAS 19 includes the amendments that require actuarial gains and losses to be recognised immediately in other comprehensive income; this change will remove the corridor method and eliminate the ability for entities to recognise all changes in the defined benefit obligation and in plan assets in profit or loss, which currently is allowed under IAS 19; and that the expected return on plan assets recognised in profit or loss is calculated based on the rate used to discount the defined benefit obligation. The amendments are not likely to have material impact on financial statements of the Group.
– Presentation of Items of Other Comprehensive Income (Amendments to IAS 1) - (effective for annual periods beginning on or after 1 July 2012). The amendments require that an entity present separately the items of other comprehensive income that would be reclassified to profit or loss in the future if certain conditions are met from those that would never be reclassified to profit or loss. The amendments do not address which items are presented in other comprehensive income or which items need to be reclassified. The requirements of other IFRSs continue to apply in this regard. These amendments have no impact on the financial statements of the Group.
– IAS 27 Separate Financial Statements (2011) - (effective for annual periods beginning on or after 1 January
2013). IAS 27 (2011) supersedes IAS 27 (2008). Three new standards IFRS 10 - Consolidated Financial Statements, IFRS 11- Joint Arrangements and IFRS 12- Disclosure of Interest in Other Entities dealing with IAS 27 would be applicable effective 1 January 2013. IAS 27 (2011) carries forward the existing accounting and disclosure requirements for separate financial statements, with some minor clarifications. The amendments are not expected to impact the current transaction of the Group.
– IAS 28 Investments in Associates and Joint Ventures (2011) - (effective for annual periods beginning on or after 1 January 2013). IAS 28 (2011) supersedes IAS 28 (2008). IAS 28 (2011) makes the amendments to apply IFRS 5 to an investment, or a portion of an investment, in an associate or a joint venture that meets the criteria to be classified as held for sale; and on cessation of significant influence or joint control, even if an investment in an associate becomes an investment in a joint venture. The amendments have no impact on the financial statements of the Group.
– Offsetting Financial Assets and Financial Liabilities (Amendments to IAS 32) – (effective for annual periods
beginning on or after 1 January 2014). The amendments address inconsistencies in current practice when applying the offsetting criteria in IAS 32 Financial Instruments: Presentation. The amendments clarify the meaning of ‘currently has a legally enforceable right of set-off’; and that some gross settlement systems may be considered equivalent to net settlement.

125
– Offsetting Financial Assets and Financial Liabilities (Amendments to IFRS 7) – (effective for annual periods
beginning on or after 1 January 2013). The amendments to IFRS 7 contain new disclosure requirements for financial assets and liabilities that are offset in the statement of financial position or subject to master netting agreement or similar arrangement. This amendment is not likely to have any impact on the Group’s financial statements.
Annual Improvements 2009–2011 (effective for annual periods beginning on or after 1 January 2013). The new
cycle of improvements contains amendments to the following four standards, with consequential amendments to other standards and interpretations:
a) IAS 1 Presentation of Financial Statements is amended to clarify that only one comparative period – which is the preceding period – is required for a complete set of financial statements. If an entity presents additional comparative information, then that additional information need not be in the form of a complete set of financial statements. However, such information should be accompanied by related notes and should be in accordance with IFRS. Furthermore, it clarifies that the ‘third statement of financial position’, when required, is only required if the effect of restatement is material to statement of financial position.
b) IAS 16 Property, Plant and Equipment is amended to clarify the accounting of spare parts, stand-by equipment and servicing equipment. The definition of ‘property, plant and equipment’ in IAS 16 is now considered in determining whether these items should be accounted for under that standard. If these items do not meet the definition, then they are accounted for using IAS 2 Inventories. The amendment is not likely to have any material impact on the financial statements.
c) IAS 32 Financial Instruments: Presentation - is amended to clarify that IAS 12 Income Taxes applies to the accounting for period taxes relating to distributions to holders of an equity instrument and transaction costs of an equity transaction. The amendment removes a perceived inconsistency between IAS 32 and IAS 12.
d) IAS 34 Interim Financial Reporting is amended to align the disclosure requirements for segment assets and segment liabilities in interim financial reports with those in IFRS 8 Operating Segments. IAS 34 now requires the disclosure of a measure of total assets and liabilities for a particular reportable segment. In addition, such disclosure is only required when the amount is regularly provided to the chief operating decision maker and there has been a material change from the amount disclosed in the last annual financial statements for that reportable segment. – IFRIC 20 Stripping cost in the production phase of a surface mining (effective for annual periods beginning
on or after 1 January 2013). The interpretation requires production stripping cost in a surface mine to be capitalized if certain criteria are met. This improvement is not relevant to the Company’s financial statements.

126
6 CASH AND BALANCES WITH TREASURY BANKS In hand: – Local currency – Foreign currency With State Bank of Pakistan in: – Local currency current accounts – Foreign currency current account With National Bank of Pakistan in: – Foreign currency deposit account
6.1
262,249 -
262,249
65,428,156 -
65,428,156
- 65,690,405
625,089 -
625,089
55,367,752 -
55,367,752
128,478 56,121,319
2012Rupees
2011Rupees
Note
8 NON-CURRENT ASSETS CLASSIFIED AS HELD FOR SALE Investment in Associated Company Offices of Saudi Pak Real Estate Limited
8.1 51,231,186 45,387,276 96,618,462
- - -
2012Rupees
2012Rupees
2011Rupees
2011Rupees
Note
Note
Carrying value at loss of controlShare of profit - net of tax and dilution
Less: fair value adjustment
61,178,357 8,256,402
69,434,759 (18,203,573) 51,231,186
- - - --
7 BALANCES WITH OTHER BANKS In Pakistan On current accounts – local currency On deposit accounts – – Local currency – Foreign currency
7.17.27.3
4,453,572
354,836,710 29,778,548
389,068,830
30,850,306
134,293,082 28,511,623
193,655,011
2012Rupees
2011Rupees
Note
6.1 Deposits are maintained with the State Bank of Pakistan to comply with its requirements issued from time to time.
7.1 These deposit accounts carry interest rate of 5.00% to 9.50% per annum (2011: 5.00% to 13.50% per annum). 7.2 These deposit accounts carry interest rate of 0.25% per annum (2011: 0.25% per annum). 7.3 This includes bank balances of Rs. 330,961,893 (2011: Rs. 953,597) with Silk Bank Limited that carries profit rate ranging between 5% to 9.5% (2011: 5% to 11%) per annum.
8.1 Investment in associate represents 43.21% (2011: 57.56%) investment in the equity of Saudi Pak Insurance Company Limited (SPICL).

127
8.2.1 This represents Office Building Block No. B-901 and B-902, 9th Floor Lakson Square Building No. 3, Sarwar Shaheed Road, Karachi. The management has decided to sell these office building blocks and accordinglly these has been classified as non-current assets held for sale in accordance with the requirements of IFRS 5 “Non-current Assets Held for Sale and Discontinued Operations”. Previously these office were classified as Property and Equipment.
8.2.2 This represents Office Building Block No. B-903 and B-904, 9th Floor Lakson Square Building No. 3, Sarwar Shaheed
Road, Karachi. The management decided to sell these office building blocks and and accordinglly these has been classified as non-current assets held for sale in accordance with the requirements of IFRS 5 “Non-current Assets Held for Sale and Discontinued Operations”. Previously these blocks were classified as Investment Property with change in fair value of Investment recognised in Profit and Loss account using Fair value method.
9.1 This includes clean placements and term deposit receipts. These carry markup rate ranging from 10.30% to 12% per annum (2011: 11.00% to 12.97% per annum) maturing between January 2013 to April 2013 (2011: between January 2012 to April 2012).
9.2 These are secured against Pakistan Investment Bonds (PIBs). The difference between the contracted purchase price and the re-sale price is recognized as income over the period of the contract. These carry mark up rate of 10.00% per annum having maturity within 2 days.
8.2 Offices of Subsidiary Company Offices- Company occupied Offices- Leased out
9 LENDINGS TO FINANCIAL INSTITUTIONS Call money lendings Repurchase agreements lendings (reverse repo)
9.3 Particulars of lendings In local currency In foreign currencies
8.2.18.2.2
9.19.2
18,011,276 27,376,000 45,387,276
235,000,000 50,000,000
285,000,000
285,000,000 -
285,000,000
- - -
171,111,111 -
171,111,111
171,111,111 -
171,111,111
2012Rupees
2012Rupees
2012Rupees
2011Rupees
2011Rupees
2011Rupees
Note
Note
The Holding Company entered into an agreement dated 09 June 2011 to sell 22,500,000 ordinary shares of Rs. 10 each in Saudi Pak Insurance Company Limited (SPICL). During the year, the Holding Company lost its control over SPICL and as of date of consolidated statement of financial position, the Holding Company holds 43.21% (2011: 57.56%) ordinary shares of SPICL. Accordingly SPICL has been accounted for as subsidiary till the date of loss of control and as associate after loss of control in these consolidated financial statements. Further, Holding Company’s investment in associate has been classified as non-current asset held for sale in accordance with International Financial Reporting Standards 5 “Non-current Assets Held for Sales and Discontinued Operations” and measured at fair value in accordance with requirements of IFRS 5. Also refer note 1.1.
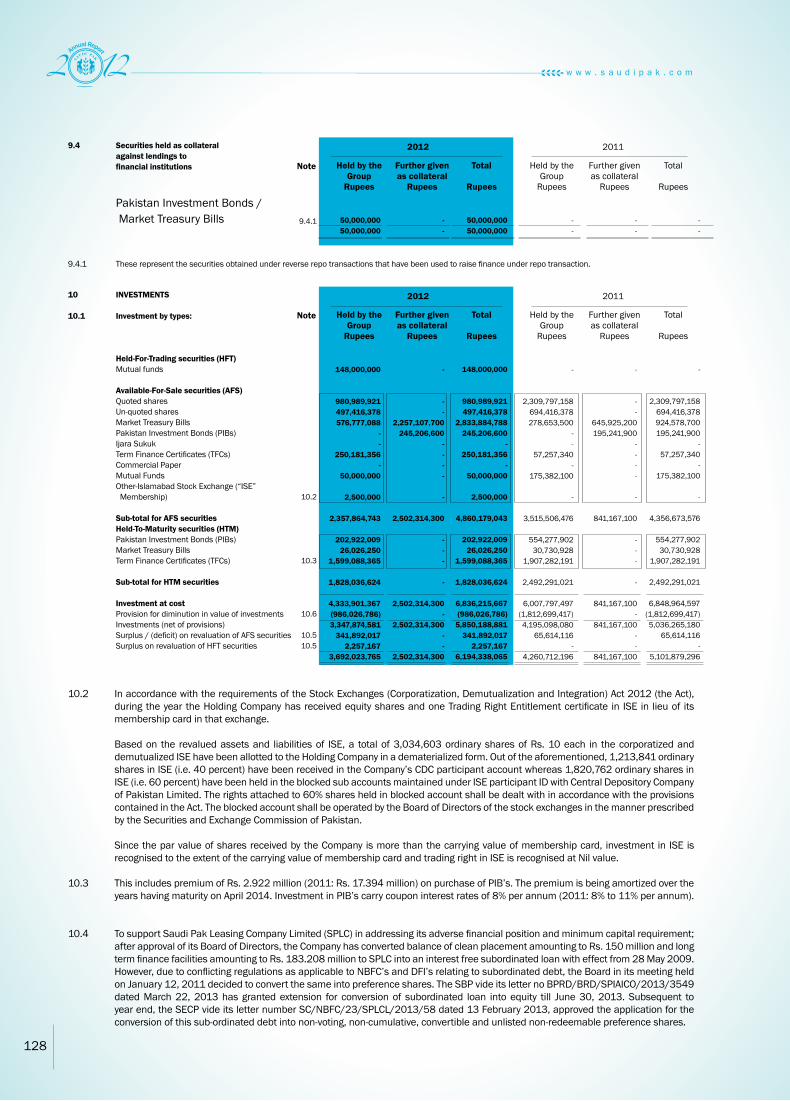
128
9.4 Securities held as collateral against lendings to financial institutions
Pakistan Investment Bonds / Market Treasury Bills
9.4.1 These represent the securities obtained under reverse repo transactions that have been used to raise finance under repo transaction.
10.2 In accordance with the requirements of the Stock Exchanges (Corporatization, Demutualization and Integration) Act 2012 (the Act), during the year the Holding Company has received equity shares and one Trading Right Entitlement certificate in ISE in lieu of its membership card in that exchange.
Based on the revalued assets and liabilities of ISE, a total of 3,034,603 ordinary shares of Rs. 10 each in the corporatized and demutualized ISE have been allotted to the Holding Company in a dematerialized form. Out of the aforementioned, 1,213,841 ordinary shares in ISE (i.e. 40 percent) have been received in the Company’s CDC participant account whereas 1,820,762 ordinary shares in ISE (i.e. 60 percent) have been held in the blocked sub accounts maintained under ISE participant ID with Central Depository Company of Pakistan Limited. The rights attached to 60% shares held in blocked account shall be dealt with in accordance with the provisions contained in the Act. The blocked account shall be operated by the Board of Directors of the stock exchanges in the manner prescribed by the Securities and Exchange Commission of Pakistan.
Since the par value of shares received by the Company is more than the carrying value of membership card, investment in ISE is
recognised to the extent of the carrying value of membership card and trading right in ISE is recognised at Nil value.
10.3 This includes premium of Rs. 2.922 million (2011: Rs. 17.394 million) on purchase of PIB’s. The premium is being amortized over the years having maturity on April 2014. Investment in PIB’s carry coupon interest rates of 8% per annum (2011: 8% to 11% per annum).
10.4 To support Saudi Pak Leasing Company Limited (SPLC) in addressing its adverse financial position and minimum capital requirement; after approval of its Board of Directors, the Company has converted balance of clean placement amounting to Rs. 150 million and long term finance facilities amounting to Rs. 183.208 million to SPLC into an interest free subordinated loan with effect from 28 May 2009. However, due to conflicting regulations as applicable to NBFC’s and DFI’s relating to subordinated debt, the Board in its meeting held on January 12, 2011 decided to convert the same into preference shares. The SBP vide its letter no BPRD/BRD/SPIAICO/2013/3549 dated March 22, 2013 has granted extension for conversion of subordinated loan into equity till June 30, 2013. Subsequent to year end, the SECP vide its letter number SC/NBFC/23/SPLCL/2013/58 dated 13 February 2013, approved the application for the conversion of this sub-ordinated debt into non-voting, non-cumulative, convertible and unlisted non-redeemable preference shares.
9.4.1 50,000,000 50,000,000
- -
- -
- -
50,000,000 50,000,000
- -
2012 2011
Held by the Group
Rupees
Held by the Group
Rupees
Further given as collateral
Rupees
Further given as collateral
Rupees
Total
Rupees
Total
Rupees
Note
10 INVESTMENTS 10.1 Investment by types: Held-For-Trading securities (HFT) Mutual funds Available-For-Sale securities (AFS) Quoted shares Un-quoted shares Market Treasury Bills Pakistan Investment Bonds (PIBs) Ijara Sukuk Term Finance Certificates (TFCs) Commercial Paper Mutual Funds Other-Islamabad Stock Exchange (“ISE” Membership) Sub-total for AFS securities Held-To-Maturity securities (HTM) Pakistan Investment Bonds (PIBs) Market Treasury Bills Term Finance Certificates (TFCs) Sub-total for HTM securities Investment at cost Provision for diminution in value of investments Investments (net of provisions) Surplus / (deficit) on revaluation of AFS securities Surplus on revaluation of HFT securities
10.2
10.3
10.6
10.510.5
148,000,000
980,989,921 497,416,378 576,777,088
- -
250,181,356 -
50,000,000
2,500,000
2,357,864,743
202,922,009 26,026,250
1,599,088,365
1,828,036,624
4,333,901,367 (986,026,786) 3,347,874,581
341,892,017 2,257,167
3,692,023,765
-
2,309,797,158 694,416,378 278,653,500
- -
57,257,340 -
175,382,100
-
3,515,506,476
554,277,902 30,730,928
1,907,282,191
2,492,291,021
6,007,797,497 (1,812,699,417) 4,195,098,080
65,614,116 -
4,260,712,196
-
- -
2,257,107,700 245,206,600
- - - -
-
2,502,314,300
- - -
-
2,502,314,300 -
2,502,314,300 - -
2,502,314,300
-
- -
645,925,200 195,241,900
- - - -
-
841,167,100
- - -
-
841,167,100 -
841,167,100 - -
841,167,100
148,000,000
980,989,921 497,416,378
2,833,884,788 245,206,600
- 250,181,356
- 50,000,000
2,500,000
4,860,179,043
202,922,009 26,026,250
1,599,088,365
1,828,036,624
6,836,215,667 (986,026,786)
5,850,188,881 341,892,017
2,257,167 6,194,338,065
-
2,309,797,158 694,416,378 924,578,700 195,241,900
- 57,257,340
- 175,382,100
-
4,356,673,576
554,277,902 30,730,928
1,907,282,191
2,492,291,021
6,848,964,597 (1,812,699,417) 5,036,265,180
65,614,116 -
5,101,879,296
2012 2011
Held by the Group
Rupees
Held by the Group
Rupees
Further given as collateral
Rupees
Further given as collateral
Rupees
Total
Rupees
Total
Rupees
Note

129
10.5 Investment by segments Federal Government securities – Pakistan Investment Bonds (PIBs) – Market Treasury Bills Fully paid up ordinary shares – Listed securities – Unlisted securities Term Finance Certificates (TFCs) – Listed TFCs – Unlisted TFCs Other investments Mutual Funds Other - ISE Membership Total investment at cost Less: Provision for diminution in value of investments Investments (net of provisions) Surplus / (deficit) on revaluation of Available-For-Sale securities (AFS) Surplus on revaluation of Held- For- Trading securities (HFT)
10.5.1 Investment in fully paid up ordinary shares – listed
10.5.510.5.5
10.5.110.5.2
10.5.310.5.4
10.5.610.2
10.6
2110.7
448,128,609 2,859,911,038 3,308,039,647
980,989,921 497,416,378
1,478,406,299
1,029,689,893 819,579,828
1,849,269,721
198,000,000 2,500,000
200,500,000
6,836,215,667 (986,026,786)
5,850,188,881 341,892,017
2,257,167 6,194,338,065
137,377,068
-
-
-
-
-
-
-
137,377,068
20,249,363
19,993,839
60,968,470
108,725,040
45,348,645
25,283,071
7,421,064
52,729,924
340,719,416
4,070,051
-
-
-
-
-
-
-
1,017,317
1,210,550
1,017,500
6,000,000
6,247,948
384,913
825,000
3,317,900
Agritech Limited
Askari Bank Limited
Arif Habib Corporation Limited
Azgard Nine limited
Summit Bank Limited (Arif Habib
Bank Limited)
Attock Cement Limited
Bank Islami Pakistan Limited
Bank Al-Falah Limited
Sub-Total carried forward
749,519,802 955,309,628
1,704,829,430
2,309,797,158 694,416,378
3,004,213,536
1,058,603,877 905,935,654
1,964,539,531
175,382,100 -
175,382,100
6,848,964,597 (1,812,699,417) 5,036,265,180
65,614,116 -
5,101,879,296
2012Rupees
2012Number of ordinary shares Name of investee companies
2012Rupees
2011Rupees
2011 2011Rupees
Note

130
10.5.1 Investment in fully paid up ordinary shares – listed (continued)
137,377,068
-
39,388,341
-
21,661,280
-
8,276,067
-
51,068,169
23,153,386
43,130,940
41,921,325
47,998,542
-
20,095,515
10,205,220
-
64,608,772
14,389,050
20,297,937
17,811,960
20,368,155
25,590,200
40,368,270
8,362,500
39,341,309
28,394,283
15,764,775
71,168,774
20,000,000
21,747,125
-
1,980,000
57,256,013
-
-
911,724,976
340,719,416
9,397,766
77,784,678
74,024,610
28,316,074
21,192,963
24,207,495
8,667
89,948,621
32,646,276
48,881,732
94,072,347
49,999,503
41,508,061
22,328,350
68,038,113
21,356,550
88,837,060
14,389,050
24,068,697
92,732,833
35,575,955
99,801,780
40,817,664
19,196,118
86,103,323
148,767,134
48,350,044
84,456,615
20,000,000
50,233,748
4,065,642
1,980,000
199,070,581
59,011,010
4,776,542
2,166,665,018
-
1,229,275
-
4,000,000
-
40,000
-
4,008,500
500,000
1,500,000
1,875,000
11,572,199
-
450,000
1,500,000
-
1,000,000
1,000,000
1,265,000
2,000,000
72,000
1,000,000
343,750
2,000,000
3,059,000
161,987
420,000
632,000
993,623
453,000
-
50,000
190,300
-
-
1,066,648
2,127,695
5,700,524
5,228,883
3,199,957
90,000
900
7,060,348
470,000
1,700,000
4,207,540
11,572,199
1,361,990
500,000
10,000,487
200,000
1,250,000
1,000,000
1,500,000
10,161,622
110,000
3,900,000
278,300
4,591,000
6,695,000
848,704
1,288,126
750,000
993,623
1,046,386
616,503
50,000
662,248
1,596,000
665,000
Sub-Total carried forward
Chenab Limited
Crescent Steel & Allied Products Limited
Dewan Farooq Motors Limited
Dewan Salman Fiber Limited
Dewan Cement Limited
Engro Corporation Pakistan Limited
Fatima Fertilizer Limited
Fauji Cement Company Limited
Fauji Fertilizer Company Limited
Fauji Fertilizer Bin Qasim Limited
Fecto Cement Limited
Japan Power Generation Limited
Jahangir Siddiqui and Company Limited
Kott Addu Power Company Limited
Maple Leaf Cement Limited
Mari Gas Company Limited
National Bank of Pakistan Limited
Nishat Chunian Power Limited
Nishat Power Limited
NIB Bank Limited
Pakistan State Oil Company Limited
Pakistan Telecommunication Company Limited
Pakistan Petroleum Limited
Lafarge Pakistan Cement Limited
Pace Pakistan Limited
Packages Limited
Pak Reinsurance Limited
Pakistan Refinery Limited
Pak Elektron Limited
Pakistan National Shipping Corporation (PNSC)
Silk Bank Limited
Security Papers Limited
Sitara Chemicals Industries Limited
Sui Northern Gas Company Limited
Samba Bank Limited
Sub-Total carried forward
2012Number of ordinary shares Name of investee companies
2012Rupees
2011 2011Rupees
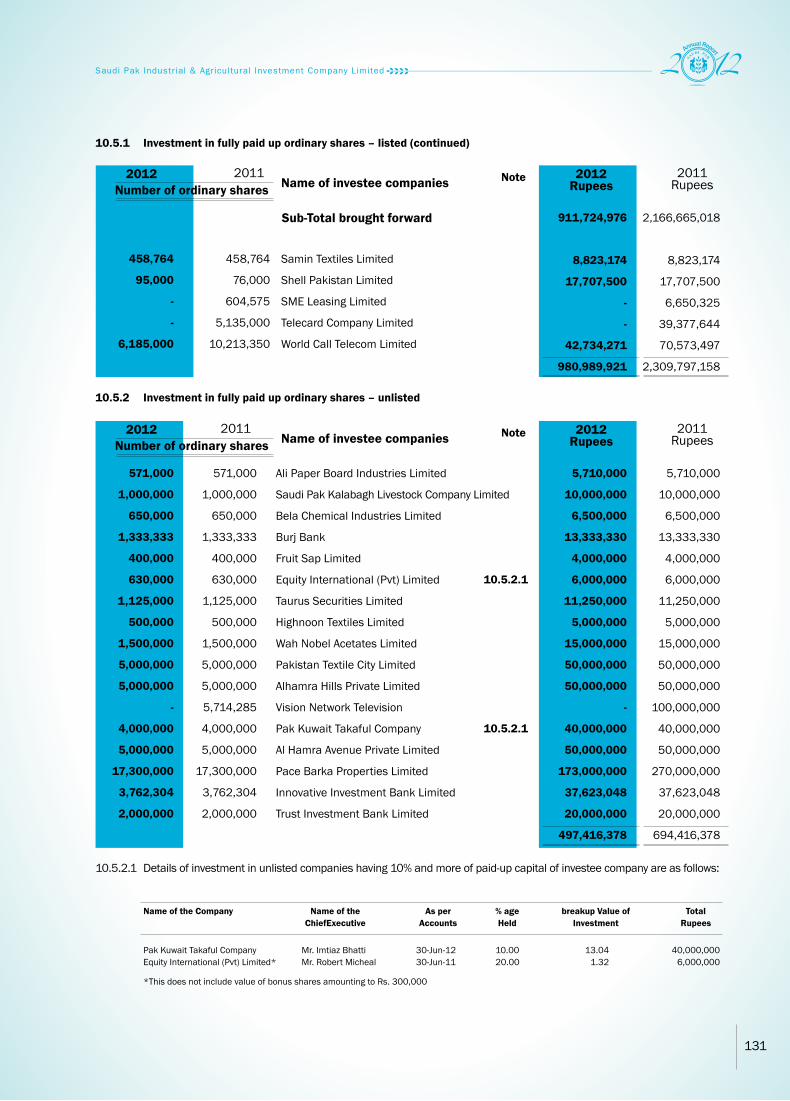
131
10.5.1 Investment in fully paid up ordinary shares – listed (continued)
10.5.2 Investment in fully paid up ordinary shares – unlisted
10.5.2.1 Details of investment in unlisted companies having 10% and more of paid-up capital of investee company are as follows:
911,724,976
8,823,174
17,707,500
-
-
42,734,271
980,989,921
5,710,000
10,000,000
6,500,000
13,333,330
4,000,000
6,000,000
11,250,000
5,000,000
15,000,000
50,000,000
50,000,000
-
40,000,000
50,000,000
173,000,000
37,623,048
20,000,000
497,416,378
2,166,665,018
8,823,174
17,707,500
6,650,325
39,377,644
70,573,497
2,309,797,158
5,710,000
10,000,000
6,500,000
13,333,330
4,000,000
6,000,000
11,250,000
5,000,000
15,000,000
50,000,000
50,000,000
100,000,000
40,000,000
50,000,000
270,000,000
37,623,048
20,000,000
694,416,378
458,764
95,000
-
-
6,185,000
571,000
1,000,000
650,000
1,333,333
400,000
630,000
1,125,000
500,000
1,500,000
5,000,000
5,000,000
-
4,000,000
5,000,000
17,300,000
3,762,304
2,000,000
458,764
76,000
604,575
5,135,000
10,213,350
571,000
1,000,000
650,000
1,333,333
400,000
630,000
1,125,000
500,000
1,500,000
5,000,000
5,000,000
5,714,285
4,000,000
5,000,000
17,300,000
3,762,304
2,000,000
Samin Textiles Limited
Shell Pakistan Limited
SME Leasing Limited
Telecard Company Limited
World Call Telecom Limited
Ali Paper Board Industries Limited
Saudi Pak Kalabagh Livestock Company Limited
Bela Chemical Industries Limited
Burj Bank
Fruit Sap Limited
Equity International (Pvt) Limited
Taurus Securities Limited
Highnoon Textiles Limited
Wah Nobel Acetates Limited
Pakistan Textile City Limited
Alhamra Hills Private Limited
Vision Network Television
Pak Kuwait Takaful Company
Al Hamra Avenue Private Limited
Pace Barka Properties Limited
Innovative Investment Bank Limited
Trust Investment Bank Limited
2012
2012
Number of ordinary shares
Number of ordinary shares
Name of investee companies
Name of investee companies
Sub-Total brought forward
2012Rupees
2012Rupees
2011
2011
2011Rupees
2011Rupees
10.5.2.1
10.5.2.1
Note
Note
Name of the Company
*This does not include value of bonus shares amounting to Rs. 300,000
Pak Kuwait Takaful CompanyEquity International (Pvt) Limited*
Mr. Imtiaz BhattiMr. Robert Micheal
30-Jun-1230-Jun-11
10.00 20.00
13.04 1.32
40,000,000 6,000,000
Name of the ChiefExecutive
breakup Value of Investment
Total Rupees
As per Accounts
% age Held

132
Allied Bank Limited Azgard Nine Limited Askari Bank Limited Bank Alfalah Limited Engro Corporation Pakistan Limited Jahangir Siddiqui and Company Limited Maple Leaf Cement (Sukuk) Limited Trust Investment Bank Limited World Call Telecom Limited World Call Telecom Limited Pakistan Mobile Communications Limited Pakistan Mobile Communications Limited Summit Bank Limited
10.5.3 Investment in Term Finance Certificates – listed
10.5.3.1 These carry rate of return ranging from 11.38% to 13.58% per annum (2011: 13.11% to 15% per annum) and having maturity upto 8 years.
298,685,966 136,614,140
31,470,305 -
241,785,560 24,937,525
145,931,250 3,748,500
21,415,716 22,486,485 49,330,000 23,823,125 29,461,321
1,029,689,893
448,835,644 124,898,600
31,482,931 53,720,915
198,900,000 17,468,500
149,745,000 4,998,000
28,554,287 - - - -
1,058,603,877
59,839 44,419
6,313 -
48,780 5,000
31,125 2,000
10,000 15,000 10,000
250 6,000
89,839 30,000
6,313 16,159 39,780
7,000 31,125 2,000
10,000 - - - -
5,000 5,000 4,989
- 4,957 5,000 5,000 5,000 5,000 2,150 5,000
100,000 5,000
2012Number of ordinary shares Name of investee companies
2012Rupees
2011 2011Rupees
Original face
Value (Rs.)
Avari Hotels Limited Amtex Limited (Sukuk) B.R.R Guardian Modaraba Gharibwal Cement Limited JDW Sugar Mills Limited Martin Dow Pharmaceuticals Faysal Bank Limited(RBS) Agritech Limited Sitara Energy (Sukuk) Flying Board & Paper Products Sitara Peroxide Limited
Mr. Byram D. AvariMr. Khurram IftikharMr. Ayaz DawoodMr. Muhammad Tausif ParachaMr. Jahangir TareenMr. Jawed AkhaiMr. Naveed A. KhanMr. Ahmed Jaudet BilalMr. Javed IqbalMr. Kamran KhanMr. Imran Ghafoor
10.5.4 Investment in Term Finance Certificates – unlisted
10.5.4.1 These carry rate of return ranging from 8.98% to 13.74% (2011: 12.12% to 15.67%) per annum and having maturity of upto 7 years.
10.5.5 Principal terms of investments in Federal Government securities
169,829,200 67,500,000 47,343,750 24,355,500 16,666,670 26,680,000 12,470,000
286,283,751 35,227,272
- 133,223,685 819,579,828
169,829,200 67,500,000 49,218,750 24,355,500 27,777,780 33,120,000 24,950,000
286,286,697 42,272,727 40,000,000
140,625,000 905,935,654
40,000 18,000 10,000
5,000 10,000 10,000 10,000 57,263
7,045 -
30,000
40,000 18,000 10,000
5,000 10,000 10,000 10,000 57,263 11,273
8,000 30,000
5,000 5,000 5,000 5,000 5,000 5,000 5,000 5,000 5,000
- 5,000
2012Number of
ordinary shares
Name of investment
Pakistan Investment BondsMarket Treasury Bills
May 2013 to August 2016January 2013 to November 2013
8% to 11.50%9.09% to 11.89%
Semi-annuallyOn maturity
On maturityOn maturity
Company’s name
Maturity period
Name of Chief Executive
Principal Rate Coupon payment
2012Rupees
2011 2011Rupees
Value per
certificate (Rupees)

133
10.5.6 Investments in mutual funds
Atlas Money Market FundNAFA – Financial Sector Income FundPak Oman Advantage FundUBL Fund Managers LimitedArif Habib Investments LimitedPICIC Asset Management Company Limited
10.6 Provision for diminution in value of investments Opening balance Charge for the year Reversals for the year Reversals (related to quoted AFS securities) Written off Closing balance
10.6.1 Particulars of provision in respect of type and segments Available-For-Sale (AFS) securities Impairment on quoted securities Un-quoted securities Term Finance Certificates (TFCs) Held-To-Maturity (HTM) securities Term Finance Certificates (TFCs)
10.7 Unrealized gain on revaluation of investments classified as held for trading
48,000,000 -
50,000,000 50,000,000 25,000,000 25,000,000
198,000,000
1,812,699,417 288,112,847
(142,080,063) (972,705,415)
- 986,026,786
537,310,417 249,059,977
34,250,291
165,406,101 986,026,786
2,257,167
25,382,100 100,000,000
50,000,000 - - -
175,382,100
1,085,084,638 1,020,358,598
- (292,743,819)
- 1,812,699,417
1,415,775,694 342,702,192
54,221,531 1,812,699,417
-
96,050 -
5,000,000 509,439 505,383 252,162
52,881 9,939,784 5,000,000
- - -
10.6.1
10.5
2012Number of ordinary sharesName of investee
2012Rupees
2011 2011Rupees
Note
10.8 Quality of available for sale securities (a) Quoted Securities Companies Askari Bank Limited Agritech Limited Summit Bank Limited (Formerly Arif Habib Bank Limited) Attock Cement Limited Azgard Nine Limited Arif Habib Corporation Limited Bank Alfalah Limited Bank Islami Pakistan Limited Chenab Limited Crescent Steel and Allied Limited Dewan Cement Limited Engro Corporation Pakistan Limited Dewan Farooq Motors Limited Dewan Salman Fiber Limited Fauji Cement Company Limited
-D - - - - -- -
unrated -
A/A1 -
unrated unrated
AA/A1+D
A/A-2 unrated
D unrated AA/A-1+
A/A1 unrated unrated
Withdrawn -
unrated unrated unrated
- 11.67
- - - - - - -
35.15 -
92.04 -
2.40 6.54
10.03 15.36
1.72 51.00
2.85 25.91 11.25
3.10 1.01
18.15 1.25
- 1.61 1.21 3.30
2012 2011 Rating Rating Market Market
value Rupees
value Rupees

134
Fecto Cement Limited Fauji Fertilizer Bin Qasim Limited Fauji Fertilizer Company Limited Jahangir Siddique and Company Limited Japan Power Generation Limited Kot Addu Power Company Limited Maple Leaf Cement Limited Mari Gas Company Limited National Bank of Pakistan Limited Nishat Power Limited Nishat Chunian Power Limited NIB Bank Limited Pakistan Telecommunication Company Limited Pakistan Petroleum Limited Pakistan State Oil Company Limited Lafarge Pakistan Cement Limited Pace Pakistan Limited Packages Limited Pak Reinsurance Limited Pak Refinery Limited Pak Elektron limited PNSC Sitara Chemicals Industries Limited Sui Northern Gas Company Limited Security Papers Limited Samba Bank Limited Samin Textile Limited Saudi Pak Leasing Company Limited Shell Pakistan Limited Telecard Company Limited World Call Telecom Limited
(b) Mutual Funds Companies Atlas Money Market Fund NAFA – Financial Sector Income Fund Pak Oman Advantage Fund UBL Fund Managers Limited Arif Habib Investments Limited PICIC Asset Management Company Limited
2012 2011
unrated unrated unrated
- unrated
AA+/A-1+ D -
AAA/A1+ A+/A1 A/A-2
AA-/A1+ unrated unrated AA+/A1+ unrated
Withdrawn AA/A1+
AA unrated
Withdrawn AA-/A1+A+/A1
-AAA/A1+
- unrated unrated unrated
- D
AA(f)-
AM3AM2
A+/A1AM2-
34.63 38.59
117.14 -
1.68 49.39 14.57
- 49.39 19.50 21.01
2.63 17.35
176.79 232.21
5.07 2.99
151.16 24.45 69.30 10.76 34.82
179.00 -
51.32 -
6.70 3.25
136.19 -
2.53
505.05 -
10.93 100.28
50.14 100.43
unrated unrated unrated AA/A1+ unrated
AA+/A-1+ D
unrated AAA/A1+ AA-/A1+ AA-/A1+ AA-/A1+ unrated unrated AA+/A1+ unrated
D AA/A1+
AA unrated A-/A2
AA-/A1+A+/A1
AA/A1+AAA/A1+
A+/A1 unrated unrated unrated
D BBB-/A3
- AM 2-3-Star
- - -
3.90 42.43
149.54 4.03 0.65
41.32 1.85
81.00 41.05 12.95 12.75
1.73 10.39
168.32 227.21
1.88 1.30
82.72 15.50 67.71 3.49
12.71 72.20 15.71
35.40 1.45 4.05 0.48
190.28 0.80 1.00
- 10.21 10.85
- - -
(a) Quoted Securities (continued)
Rating Rating Market Market value
Rupees value
Rupees
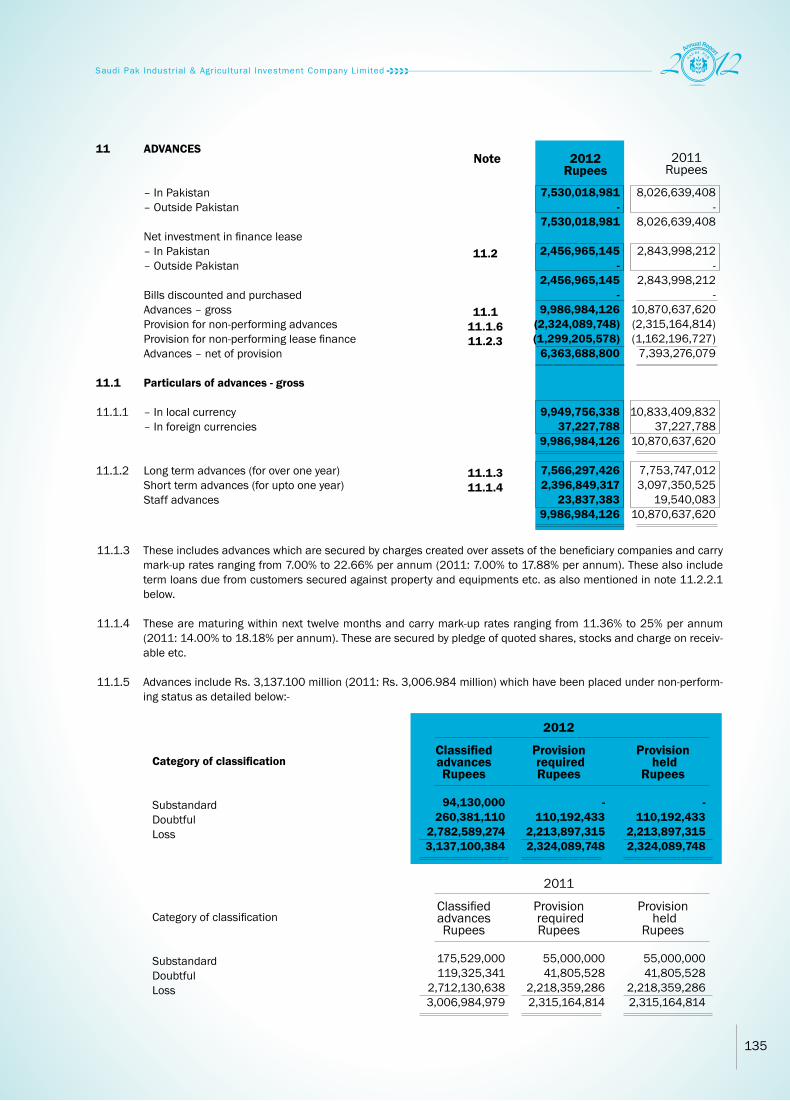
135
11.2
11.111.1.611.2.3
11.1.311.1.4
11 ADVANCES – In Pakistan – Outside Pakistan Net investment in finance lease – In Pakistan – Outside Pakistan Bills discounted and purchased Advances – gross Provision for non-performing advances Provision for non-performing lease finance Advances – net of provision 11.1 Particulars of advances - gross 11.1.1 – In local currency – In foreign currencies 11.1.2 Long term advances (for over one year) Short term advances (for upto one year) Staff advances
7,530,018,981 -
7,530,018,981
2,456,965,145 -
2,456,965,145 -
9,986,984,126 (2,324,089,748) (1,299,205,578)
6,363,688,800
9,949,756,338 37,227,788
9,986,984,126
7,566,297,426 2,396,849,317
23,837,383 9,986,984,126
8,026,639,408 -
8,026,639,408
2,843,998,212 -
2,843,998,212 -
10,870,637,620 (2,315,164,814) (1,162,196,727)
7,393,276,079
10,833,409,832 37,227,788
10,870,637,620
7,753,747,012 3,097,350,525
19,540,083 10,870,637,620
2012Rupees
Note 2011Rupees
11.1.3 These includes advances which are secured by charges created over assets of the beneficiary companies and carry mark-up rates ranging from 7.00% to 22.66% per annum (2011: 7.00% to 17.88% per annum). These also include term loans due from customers secured against property and equipments etc. as also mentioned in note 11.2.2.1 below.
11.1.4 These are maturing within next twelve months and carry mark-up rates ranging from 11.36% to 25% per annum
(2011: 14.00% to 18.18% per annum). These are secured by pledge of quoted shares, stocks and charge on receiv-able etc.
11.1.5 Advances include Rs. 3,137.100 million (2011: Rs. 3,006.984 million) which have been placed under non-perform-
ing status as detailed below:-
Category of classification
SubstandardDoubtfulLoss
Category of classification
SubstandardDoubtfulLoss
94,130,000 260,381,110
2,782,589,274 3,137,100,384
175,529,000 119,325,341
2,712,130,638 3,006,984,979
- 110,192,433
2,213,897,315 2,324,089,748
55,000,000 41,805,528
2,218,359,286 2,315,164,814
- 110,192,433
2,213,897,315 2,324,089,748
55,000,000 41,805,528
2,218,359,286 2,315,164,814
ClassifiedadvancesRupees
ClassifiedadvancesRupees
Provision required Rupees
Provision required Rupees
2012
2011
Provision held
Rupees
Provision held
Rupees

136
11.1.6 Particulars of provisions against non-performing advances
Opening balanceCharge for the yearAmounts written offReversalsClosing balance
11.1.6.1 Amendments in Prudential Regulations in respect of provisioning against non-performing advances
The State Bank of Pakistan amended the Prudential Regulations vide BSD Circular No. 1 of 2011 dated October 21,
2011 in relation to provision for loans and advances, thereby allowing further benefit of Forced Sale Value (FSV) of pledged stocks, mortgaged residential, commercial and industrial properties (land and building only) and plant and machinery under charge held as collateral against non–performing advances. The FSV benefit recognised in these unconsolidated financial statements is not available for payment of cash or stock dividend. As on December 31, 2012, total FSV benefit availed by the Group stands at Rs. 357.981 million (2011: Rs. 406.743 million).Had the FSV benefit not recognised, profit before and after tax for the year would have been lower by Rs. 357.981 million and Rs.232.687 million respectively. Reserves to this extent are not available for distribution by way of cash or stock dividend.
11.1.6.2 The above provision for non-performing loans is net of forced sales values (FSVs) of collaterals of Rs. 256.88 million
(31 December 2011: Rs. 684.365 million) considered by the Group for the purpose of determination of provision requirements. Had this benefit of FSVs not been taken by the Group, the specific provision against non-performing loans would have been higher by Rs. 256.88 million (31 December 2011: Rs. 539.72 million) and the Group’s profit for the period (before taxation) would also have been lower by the same amount.
2,315,164,814 346,373,485
(115,161,874) (222,286,677) 2,324,089,748
1,896,800,692 633,099,494
(214,735,372) 2,315,164,814
2012Rupees
Specific Specific
2011Rupees
11.1.7 Particulars of write offs: Against provisions Directly charged to the unconsolidated profit and loss account 11.1.8 Particulars of amounts written off against provisions Write offs of Rs. 500,000 and above Write offs of below Rs. 500,000
11.2 Net investment in finance lease Minimum lease payments receivables Add: Residual value of leased assets Less: Unearned finance income Present value of minimum lease payments Less: Provision for potential lease losses Net investment in lease
115,161,874 403,441
115,565,315
115,161,874 -
115,161,874
2,067,834,510 502,181,821
2,570,016,331 (113,051,186) 2,456,965,145
(1,299,205,578) 1,157,759,567
11.2.111.2.2
- 13,069,507 13,069,507
- - -
2,327,585,921 713,390,221
3,040,976,142 (196,977,930)
2,843,998,212 (1,162,196,727) 1,681,801,485
2012Rupees
Note 2011Rupees

137
11.2.1 Present value of minimum lease payments Lease rental receivable Less: Unearned finance income Present value of minimum lease payments
Category of classification
SubstandardDoubtfulLoss
Lease rental receivable Less: Unearned finance income Present value of minimum lease payments
11.2.2 Investment in lease finance includes Rs. 1,310.819 million (2011: Rs. 1,176.519 million) which has been placed under non-performing status as detailed below:-
11.2.2.1 These above term loans include balances due from customers which are secured against property and equipments etc. The internal rate of return on lease contract receivable ranges from 12.5% to 20.01% (2011: 6.01% to 25.96%) per annum.
11.2.2.2 As per NBFC Regulation 28 (a), a leasing company undertaking the business of lease only, shall invest at least 70%
of its assets in the business of leasing. As at 31 December 2012, the Group’s investment in lease assets was 67.52% (31 December 2011: 65%) of the total assets (less allowable deductions).
11.2.2.3 For SPLCL, the Securities and Exchange Commission of Pakistan has amended the time based criteria for calculating the provision against non-performing leases via SRO (1)/2012, dated 26 April 2012. The new criteria became applicable from 01 July 2012. Under the revised criteria, classification and provisioning / suspension requirement would start from the 180th day of default and would need to be fully provided after 2 years of default (earlier starting from 365 days up to 3 years). SPLCL has applied the new criteria for calculating the provision against non-performing leases. Due to the change in time based criteria, the specific provision against non-performing lease portfolio has increased by Rs. 41.235 million.
1,997,188,587 (85,638,654)
1,911,549,933
- 23,228,752
1,287,591,202 1,310,819,954
2,834,479,711 (130,588,607) 2,703,891,105
572,827,744 (27,412,532) 545,415,212
- 11,614,376
1,287,591,202 1,299,205,578
159,872,784 (19,765,676) 140,107,109
2,570,016,331 (113,051,186) 2,456,965,145
- 11,614,376
1,287,591,202 1,299,205,578
2,994,352,495 (150,354,282) 2,843,998,213
Less thanone yearRupees
One year to five year Rupees
2012
Total
Rupees
Classifiedadvance
Rupees
Specific provision required Rupees
2012
Specific provision
held Rupees
Less thanone yearRupees
One year to five year Rupees
2011
Total
Rupees
SubstandardDoubtfulLoss
28,645,418 -
1,147,874,018 1,176,519,436
14,322,709 -
1,147,874,018 1,162,196,727
14,322,709 -
1,147,874,018 1,162,196,727
Classifiedadvance
Rupees
Specific provision required Rupees
2011
Specific provision
held Rupees

138
Opening balanceCharge for the yearAmounts written offReversalsClosing balance
11.2.3 Particularsofprovisionsagainstnon-performingleasefinance
11.2.3.1 The above provision for non-performing lease losses is net of the forced sales values (FSVs) of leased assets / collaterals of Rs. 571.097 million (31 December 2011: Rs. 181.366 million) considered by the Group for the purpose of determination of provision requirements. Had this benefit of FSVs not been taken by the Group, the specific provision against non-performing lease portfolio would have been higher by Rs. 571.097 million (31 December 2011: Rs. 145.145 million) and the Group’s profit (before taxation) would also have been lower by the same amount.
1,162,196,727 251,824,887
- (114,816,036)
1,299,205,578
877,148,350 294,837,898
- (9,789,521)
1,162,196,727
2012Rupees
Specific Specific
2011Rupees
v
v
11.2.4 Particulars of amounts written off against provisions Write offs of Rs. 500,000 and above Write offs of below Rs. 500,000 11.3 Particulars of loans and advances to directors and associated companies etc. Debts due by directors, executives or officers of the Group or any of them either severally or jointly with any other persons Debts due by companies or firms in which the directors of the Group are interested as directors, partners Debts due by subsidiary companies, controlled firms, managed modarabas and other related parties 12 OPERATING FIXED ASSETS Capital work-in-progress Property and equipment Intangible assets
- - -
23,837,383
-
-
- 2,611,229,390
1,458,320 2,612,687,710
12.112.2
- - -
19,540,083
-
-
- 2,316,609,971
5,236,103 2,321,846,074
2012Rupees
Note
Specific Specific
2011Rupees

139
Fre
ehol
d la
nd
Lea
seho
ld la
nd -
Isla
mab
ad
Bui
ldin
g - I
slam
abad
Bui
ldin
g
Bui
ldin
g - I
slam
abad
- ISE
towe
rs
Hea
ting
and
air-c
ondi
tioni
ng
Ele
vato
rs
Ele
ctric
al fi
tting
s
Fire
figh
ting
equi
pmen
t
Lea
seho
ld im
prov
emen
t
Mot
or v
ehic
les
Fur
nitu
re, fi
xtur
e an
d fit
tings
Offi
ce e
quip
men
t
Tel
epho
ne in
stal
latio
n
Ele
ctric
al a
pplia
nces
Loo
se to
ols
Mis
cella
neou
s
Sec
urity
sys
tem
s
Lea
seho
ld P
lant
and
Mac
hine
ry
Sof
twar
e an
d ot
hers
8,0
88,1
20
1,0
18,2
25,0
01
1,3
11,7
32,4
87
219
,756
,656
2,2
00,0
00
92,
929,
728
43,
664,
310
74,
371,
533
2,2
30,0
64
6,3
02,8
39
89,
879,
553
25,
058,
137
70,
705,
443
2,4
00,4
38
2,0
52,7
02
1,1
70,3
25
843
,569
12,
785,
213
111
,062
,135
3,0
95,4
58,2
53
19,
125,
618
-
66,
642,
824
287
,561
,424
44,
544,
725
10,
450
75,
193,
441
34,
158,
002
54,
285,
463
1,7
82,0
81
2,2
39,7
02
58,
910,
073
21,
464,
267
61,
916,
425
1,9
45,1
68
1,1
13,6
34
454
,060
786
,442
5,8
98,5
71
59,
941,
530
778
,848
,282
13,
889,
515
-
12,
116,
877
52,
469,
292
18,
961,
853
35,
720
13,
858,
471
6,5
49,6
40
11,
155,
689
360
,699
945
,422
6,7
07,5
00
663
,321
3,0
32,8
92
328
,072
277
,171
143
,250
17,
895
1,9
19,5
56
23,
551,
217
153
,094
,537
1,6
63,7
68
-
78,
759,
701
340
,030
,716
5,7
24,9
90
46,
170
85,
363,
391
40,
707,
642
65,
141,
902
2,1
42,7
80 - - - -
2,0
06,1
18 - - -
7,8
18,1
27 -
627
,741
,537
-
- - -
5,1
31,9
95 - - - - - -
19,
257,
407
832
,485
4,8
11,3
63 -
9,4
05 - - -
6,5
03,9
60
36,
546,
615 -
- - -
6,8
09,6
64 - - - - - -
14,
597,
098
1,3
64,1
27
7,0
92,0
21 - - - - - -
29,
862,
910
4,3
95,0
21
- - -
45,
839,
929 -
3,6
88,5
21 -
299
,250
-
3,1
85,1
24
31,
763,
068
19,
930,
976
53,
045,
933
267
,122
1,3
81,4
00
597
,310
804
,337
-
76,
988,
787
237
,791
,757
11,
158,
262
8,0
88,1
20
1,2
48,4
93,7
50
713
,309
,036
202
,411
,287
25,
500,
000
125
,556
,119
63,
835,
776
119
,283
,079
3,9
37,5
91
3,1
17,7
15
35,
145,
125
3,5
81,6
00
3,8
59,3
08
1,5
51,5
94
1,8
35,6
85
573
,015
39,
232
13,
138,
065
37,
973,
293
2,6
11,2
29,3
90
1,4
58,3
20
- -
7,7
52,7
95
59,
268,
650
2,8
00,0
00 -
370
,500
-
642
,045
-
26,
641,
286
2,5
34,1
55
3,3
46,1
92
44,
000
1,1
74,2
83 - -
72,
000
2,3
01,4
80
106
,947
,386
673
,160
-
1.1
9 4
4
1.1
4
15
15
15
15
15
20
20
33.3
3
15
15
15
15
15
33.3
3
-
309
,028
,450
(266
,145
,530
)
45,
166,
954
20,
546,
170
121
,678
,303
60,
508,
608
110
,352
,698
3,2
08,2
62 - - - -
1,3
80,3
96 - - -
8,0
98,9
79
10,
006,
600
423
,829
,890
-
-
78,
759,
701
340
,030
,716
5,7
24,9
90
46,
170
85,
363,
391
40,
707,
642
65,
141,
902
2,1
42,7
80 - - - -
2,0
06,1
18 - - -
7,8
18,1
27 -
627
,741
,537
-
- - -
14,
686,
783 - - - - - -
27,
886,
309
3,2
47,2
24
12,
331,
189 - - - - - -
58,
151,
505
4,6
82,1
96
- - -
55,
529,
271 - - - - - -
21,
726,
337
832
,492
4,8
15,2
05 -
9,9
00 - - -
8,4
08,1
35
91,
321,
340
2,5
00,0
00
8,0
88,1
20
1,2
48,4
93,7
50
713
,309
,036
248
,251
,216
25,
500,
000
129
,244
,640
63,
835,
776
119
,582
,329
3,9
37,5
91
6,3
02,8
39
66,
908,
193
23,
512,
576
56,
905,
241
1,8
18,7
16
3,2
17,0
85
1,1
70,3
25
843
,569
13,
138,
065
114
,962
,080
2,8
49,0
21,1
47
12,
616,
582
12.1
P
rope
rty
and
equi
pmen
t
12.2
In
tang
ible
ass
ets
CO
ST/R
EVAL
UAT
ION
CO
ST/R
EVAL
UAT
ION
DEP
REC
IATI
ON
DEP
REC
IATI
ON
2012
2012
Ope
ning
ba
lanc
eR
upee
s
Ope
ning
ba
lanc
eR
upee
s
Add
ition
s R
upee
s F
or th
e ye
ar
Rup
ees
Rev
alua
tion
su
rplu
s/ (d
efici
t)
Rup
ees
Adj
ustm
ent f
or
reva
luat
ion
Rup
ees
Adj
ustm
ent f
or
reva
luat
ion
Rup
ees
Dis
posa
ls
Rup
ees
Adj
ustm
ent
for l
oss
of
cont
rol i
n su
bsid
iary
Adj
ustm
ent f
or
loss
of c
ontr
ol
in s
ubsi
diar
y
Dis
posa
ls
Rup
ees
Clo
sing
ba
lanc
e
Rup
ees
Clos
ing
bala
nce
Rup
ees
Net
B
ook
valu
eR
upee
s
Rat
e
%
Ope
ning
ba
lanc
eR
upee
s
Ope
ning
ba
lanc
eR
upee
s
Add
ition
s R
upee
s F
or th
e ye
ar
Rup
ees
Rev
alua
tion
su
rplu
s/ (d
efici
t)
Rup
ees
Adj
ustm
ent f
or
reva
luat
ion
Rup
ees
Adj
ustm
ent f
or
reva
luat
ion
Rup
ees
Dis
posa
ls
Rup
ees
Adj
ustm
ent
for l
oss
of
cont
rol i
n su
bsid
iary
Adj
ustm
ent f
or
loss
of c
ontr
ol
in s
ubsi
diar
y
Dis
posa
ls
Rup
ees
Clo
sing
ba
lanc
e
Rup
ees
Clos
ing
bala
nce
Rup
ees
Net
B
ook
valu
eR
upee
s
Rat
e
%

140
8,0
88,1
20
1,0
18,2
25,0
01
1,3
11,7
00,3
57
235
,762
,975
-
92,
929,
728
41,
000,
000
74,
371,
533
2,3
10,5
36
6,2
73,1
68
92,
473,
661
23,
912,
053
67,
964,
746
2,3
34,9
11
1,9
88,7
02
1,1
70,3
25
1,0
63,3
93
10,
984,
666
121
,597
,135
3,1
14,1
51,0
10
Fre
ehol
d la
nd
Lea
seho
ld la
nd -
Isla
mab
ad
Bui
ldin
g - I
slam
abad
Bui
ldin
g
Bui
ldin
g - I
slam
abad
- ISE
towe
rs
Hea
ting
and
air-c
ondi
tioni
ng
Ele
vato
rs
Ele
ctric
al fi
tting
s
Fire
figh
ting
equi
pmen
t
Lea
seho
ld im
prov
emen
t
Mot
or v
ehic
les
Fur
nitu
re, fi
xtur
e an
d fit
tings
Offi
ce e
quip
men
t
Tel
epho
ne in
stal
latio
n
Ele
ctric
al a
pplia
nces
Loo
se to
ols
Mis
cella
neou
s
Sec
urity
sys
tem
s
Lea
seho
ld P
lant
and
Mac
hine
ry
-
54,
525,
947
235
,092
,454
36,
041,
131 -
61,
351,
399
27,
674,
970
43,
129,
774
1,5
01,9
24
1,3
37,1
97
59,
887,
658
20,
969,
941
57,
664,
256
1,6
31,0
76
880
,508
309
,536
1,0
07,2
95
4,1
26,7
63
63,
628,
670
670
,760
,499
-
12,
116,
877
52,
468,
970
8,8
57,6
39
10,
450
13,
842,
042
6,4
83,0
32
11,
155,
689
344
,529
957
,736
12,
763,
176
883
,997
6,2
22,8
47
314
,092
233
,126
144
,524
16,
948
1,7
71,8
08
8,7
24,9
85
137
,312
,467
- - -
354
,045
- - - -
64,
372
55,
231
13,
740,
761
389
,671
1,9
70,6
78 - - -
237
,801
-
12,
412,
125
29,
224,
684
-
66,
642,
824
287
,561
,424
44,
544,
725
10,
450
75,
193,
441
34,
158,
002
54,
285,
463
1,7
82,0
81
2,2
39,7
02
58,
910,
073
21,
464,
267
61,
916,
425
1,9
45,1
68
1,1
13,6
34
454
,060
786
,442
5,8
98,5
71
59,
941,
530
778
,848
,282
8,0
88,1
20
951
,582
,177
1,0
24,1
71,0
63
175
,211
,931
2,1
89,5
50
17,
736,
287
9,5
06,3
08
20,
086,
070
447
,983
4,0
63,1
37
30,
969,
480
3,5
93,8
70
8,7
89,0
18
455
,270
939
,068
716
,265
57,
127
6,8
86,6
42
51,
120,
605
2,3
16,6
09,9
71
- -
32,
130
73,
425,
864
2,2
00,0
00 -
2,6
64,3
10 - -
160
,256
15,
763,
315
1,6
10,7
77
5,0
80,4
02
65,
527
64,
000 -
17,
980
1,8
00,5
47
4,0
00,0
00
106
,885
,108
-
1.1
9 4
4
1.1
4
15
15
15
15
15
20
20
33.3
3
15
15
15
15
15
- - -
89,
432,
183 - - - -
80,
472
130
,585
18,
357,
423
464
,693
2,3
39,7
05 - - -
237
,804
-
14,
535,
000
125
,577
,865
8,0
88,1
20
1,0
18,2
25,0
01
1,3
11,7
32,4
87
219
,756
,656
2,2
00,0
00
92,
929,
728
43,
664,
310
74,
371,
533
2,2
30,0
64
6,3
02,8
39
89,
879,
553
25,
058,
137
70,
705,
443
2,4
00,4
38
2,0
52,7
02
1,1
70,3
25
843
,569
12,
785,
213
111
,062
,135
3,0
95,4
58,2
53
16,
148,
618
Sof
twar
e 1
1,25
3,43
5 2
,636
,080
-
1
3,88
9,51
5 5
,236
,103
2
,977
,000
3
3.33
-
1
9,12
5,61
8
12.1
P
rope
rty
and
equi
pmen
t (co
ntin
ued)
12.2
In
tang
ible
ass
ets
(con
tinue
d)
CO
ST/R
EVAL
UAT
ION
DEP
REC
IATI
ON
2011
Ope
ning
ba
lanc
eR
upee
s
Ope
ning
ba
lanc
eR
upee
s
Add
ition
s R
upee
s F
or th
e ye
ar
Rup
ees
Dis
posa
ls
Rup
ees
Dis
posa
ls
Rup
ees
Clo
sing
ba
lanc
e
Rup
ees
Clos
ing
bala
nce
Rup
ees
Net
B
ook
valu
eR
upee
s
Rat
e
%
Ope
ning
ba
lanc
eR
upee
s
Ope
ning
ba
lanc
eR
upee
s
Add
ition
s R
upee
s F
or th
e ye
ar
Rup
ees
Dis
posa
ls
Rup
ees
Dis
posa
ls
Rup
ees
Clo
sing
ba
lanc
e
Rup
ees
Clos
ing
bala
nce
Rup
ees
Net
B
ook
valu
eR
upee
s
Rat
e
%
CO
ST/R
EVAL
UAT
ION
DEP
REC
IATI
ON
2011
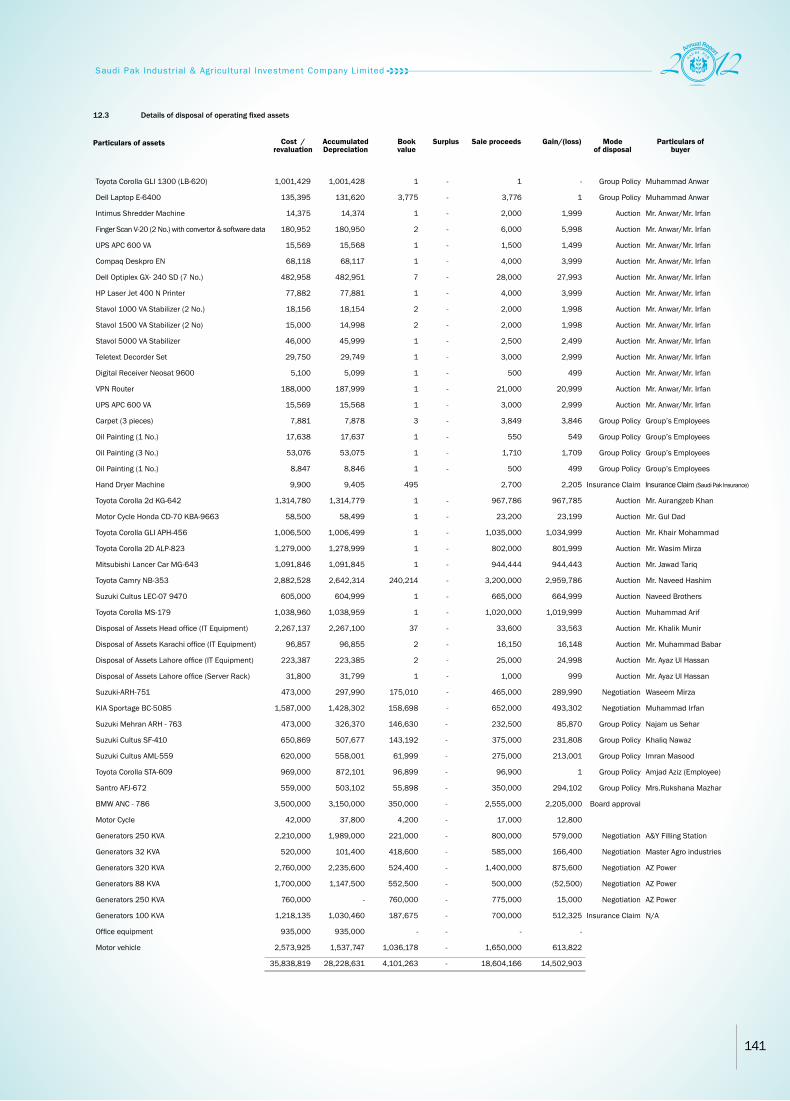
141
Particulars of assets
12.3 Detailsofdisposalofoperatingfixedassets
Toyota Corolla GLI 1300 (LB-620)
Dell Laptop E-6400
Intimus Shredder Machine
Finger Scan V-20 (2 No.) with convertor & software data
UPS APC 600 VA
Compaq Deskpro EN
Dell Optiplex GX- 240 SD (7 No.)
HP Laser Jet 400 N Printer
Stavol 1000 VA Stabilizer (2 No.)
Stavol 1500 VA Stabilizer (2 No)
Stavol 5000 VA Stabilizer
Teletext Decorder Set
Digital Receiver Neosat 9600
VPN Router
UPS APC 600 VA
Carpet (3 pieces)
Oil Painting (1 No.)
Oil Painting (3 No.)
Oil Painting (1 No.)
Hand Dryer Machine
Toyota Corolla 2d KG-642
Motor Cycle Honda CD-70 KBA-9663
Toyota Corolla GLI APH-456
Toyota Corolla 2D ALP-823
Mitsubishi Lancer Car MG-643
Toyota Camry NB-353
Suzuki Cultus LEC-07 9470
Toyota Corolla MS-179
Disposal of Assets Head office (IT Equipment)
Disposal of Assets Karachi office (IT Equipment)
Disposal of Assets Lahore office (IT Equipment)
Disposal of Assets Lahore office (Server Rack)
Suzuki-ARH-751
KIA Sportage BC-5085
Suzuki Mehran ARH - 763
Suzuki Cultus SF-410
Suzuki Cultus AML-559
Toyota Corolla STA-609
Santro AFJ-672
BMW ANC - 786
Motor Cycle
Generators 250 KVA
Generators 32 KVA
Generators 320 KVA
Generators 88 KVA
Generators 250 KVA
Generators 100 KVA
Office equipment
Motor vehicle
1,001,428
131,620
14,374
180,950
15,568
68,117
482,951
77,881
18,154
14,998
45,999
29,749
5,099
187,999
15,568
7,878
17,637
53,075
8,846
9,405
1,314,779
58,499
1,006,499
1,278,999
1,091,845
2,642,314
604,999
1,038,959
2,267,100
96,855
223,385
31,799
297,990
1,428,302
326,370
507,677
558,001
872,101
503,102
3,150,000
37,800
1,989,000
101,400
2,235,600
1,147,500
-
1,030,460
935,000
1,537,747
28,228,631
1,001,429
135,395
14,375
180,952
15,569
68,118
482,958
77,882
18,156
15,000
46,000
29,750
5,100
188,000
15,569
7,881
17,638
53,076
8,847
9,900
1,314,780
58,500
1,006,500
1,279,000
1,091,846
2,882,528
605,000
1,038,960
2,267,137
96,857
223,387
31,800
473,000
1,587,000
473,000
650,869
620,000
969,000
559,000
3,500,000
42,000
2,210,000
520,000
2,760,000
1,700,000
760,000
1,218,135
935,000
2,573,925
35,838,819
1
3,775
1
2
1
1
7
1
2
2
1
1
1
1
1
3
1
1
1
495
1
1
1
1
1
240,214
1
1
37
2
2
1
175,010
158,698
146,630
143,192
61,999
96,899
55,898
350,000
4,200
221,000
418,600
524,400
552,500
760,000
187,675
-
1,036,178
4,101,263
-
-
-
-
-
-
-
-
-
-
-
-
-
-
-
-
-
-
-
-
-
-
-
-
-
-
-
-
-
-
-
-
-
-
-
-
-
-
-
-
-
-
-
-
-
-
-
-
-
1
3,776
2,000
6,000
1,500
4,000
28,000
4,000
2,000
2,000
2,500
3,000
500
21,000
3,000
3,849
550
1,710
500
2,700
967,786
23,200
1,035,000
802,000
944,444
3,200,000
665,000
1,020,000
33,600
16,150
25,000
1,000
465,000
652,000
232,500
375,000
275,000
96,900
350,000
2,555,000
17,000
800,000
585,000
1,400,000
500,000
775,000
700,000
-
1,650,000
18,604,166
-
1
1,999
5,998
1,499
3,999
27,993
3,999
1,998
1,998
2,499
2,999
499
20,999
2,999
3,846
549
1,709
499
2,205
967,785
23,199
1,034,999
801,999
944,443
2,959,786
664,999
1,019,999
33,563
16,148
24,998
999
289,990
493,302
85,870
231,808
213,001
1
294,102
2,205,000
12,800
579,000
166,400
875,600
(52,500)
15,000
512,325
-
613,822
14,502,903
Group Policy
Group Policy
Auction
Auction
Auction
Auction
Auction
Auction
Auction
Auction
Auction
Auction
Auction
Auction
Auction
Group Policy
Group Policy
Group Policy
Group Policy
Insurance Claim
Auction
Auction
Auction
Auction
Auction
Auction
Auction
Auction
Auction
Auction
Auction
Auction
Negotiation
Negotiation
Group Policy
Group Policy
Group Policy
Group Policy
Group Policy
Board approval
Negotiation
Negotiation
Negotiation
Negotiation
Negotiation
Insurance Claim
Muhammad Anwar
Muhammad Anwar
Mr. Anwar/Mr. Irfan
Mr. Anwar/Mr. Irfan
Mr. Anwar/Mr. Irfan
Mr. Anwar/Mr. Irfan
Mr. Anwar/Mr. Irfan
Mr. Anwar/Mr. Irfan
Mr. Anwar/Mr. Irfan
Mr. Anwar/Mr. Irfan
Mr. Anwar/Mr. Irfan
Mr. Anwar/Mr. Irfan
Mr. Anwar/Mr. Irfan
Mr. Anwar/Mr. Irfan
Mr. Anwar/Mr. Irfan
Group’s Employees
Group’s Employees
Group’s Employees
Group’s Employees
Insurance Claim (Saudi Pak Insurance)
Mr. Aurangzeb Khan
Mr. Gul Dad
Mr. Khair Mohammad
Mr. Wasim Mirza
Mr. Jawad Tariq
Mr. Naveed Hashim
Naveed Brothers
Muhammad Arif
Mr. Khalik Munir
Mr. Muhammad Babar
Mr. Ayaz Ul Hassan
Mr. Ayaz Ul Hassan
Waseem Mirza
Muhammad Irfan
Najam us Sehar
Khaliq Nawaz
Imran Masood
Amjad Aziz (Employee)
Mrs.Rukshana Mazhar
A&Y Filling Station
Master Agro industries
AZ Power
AZ Power
AZ Power
N/A
Accumulated Depreciation
Cost / revaluation
Book value
Surplus Sale proceeds Mode of disposal
Particulars of buyer
Gain/(loss)

142
12.4 The cost / revalued amount of fully depreciated assets that are still in use: Furniture, fixtures and fittings, electrical fittings, office equipment and computer equipments Building improvement Vehicles Loose tools
12.6 Had the revaluation not been carried out, the net book value of the revalued assets would have been as follows: Land Office premises Building and other assets Properties of SPLCL
13 OTHER ASSETS Accrued income and receivables Advances, deposits, prepayments and other receivables 13.1 Accrued income and receivables Dividend income Accrued income from advances Accrued income from investments Accrued income from lendings to financial institutions Other receivables 13.1.1 Accrued income from advances Long term advances Short term advances Lease financing Others Less: provision for doubtful accrued income from advances
13.113.2
13.1.113.1.2
13.1.3
12.5 The Holding Company’s leasehold land, buildings and certain other items of property and equipments were revalued by independent professional valuer M/s National Project Managers (Pvt) Limited in the month of December 2012 on the basis of their professional assessment of present market value. The revaluation has resulted in increasing the surplus on revaluation of fixed assets by Rs. 372,337,074 which has been incorporated in the books of accounts.
The properties of SPLCL were revalued as of 28 September 2008 and 30 June 2012. The revaluation was carried out by independent valuers, on the basis of professional assessment of present market values and the revaluation of 30 June 2012 resulted in surplus of Rs. 41.486 million and Rs. 17.501 million and deficit of Rs. 7.495 million for properties, generators and plant respectively over the written down values.
12.7 The Holding Company holds the title of a portion in office premises of SPLCL. The net book value of this portions as of 31 December 2012 is Rs.15.741 million.
78,624,161 3,526,371
10,461,160 215,330
92,827,022
45,784,526 45,784,526 10,504,422
215,330 102,288,804
1,059,613
13,452,499 104,226,907
13,452,499 132,191,518
550,795,709 1,329,943,717 1,880,739,426
(1,037,029,984) 205,626,007 125,713,273
400,919 219,055,510 550,795,709
856,688,012 182,223,912 198,077,813
5,666,254 1,242,655,991
(1,037,029,984) 205,626,007
2012Rupees
Note 2011Rupees
2011Rupees
2011Rupees
779,557
12,025,096 25,106,081 34,574,575 72,485,309
2012Rupees
395,384,541 1,121,422,734 1,516,807,275
305,000 106,948,777 125,123,417
642,738 162,364,609 395,384,541
768,583,692 175,868,668 159,056,929
5,153,490 1,108,662,779
(1,001,714,002) 106,948,777
2012Rupees

143
13.1.2 Accrued income from investments Government Securities Term Finance Certificates (TFCs) Commercial Papers Less: provision for doubtful accrued income from investments
13.2 Advances, deposits, prepayments and other receivables Advances to suppliers Advance against purchase of property Security deposits Prepayments and other receivables Receivable from stock brokers Advance tax - net Premium due but unpaid Amount due from other insurers Reinsurance recoveries against outstanding claims Deferred commission expense Non banking assets acquired in satisfaction of claims Advance for purchase of shares Less: provision for receivable from stock brokers Less: provision for advance for purchase of shares Less: provision for non banking assets acquired in satisfaction of claims
13.2.2 Provision against doubtful receivable balances Opening balance Charge for the year Closing balance 14 DEVELOPMENT PROPERTIES Balance at beginning of the year Cost of plots Construction cost Development properties sold during the year Balance at end of the year
13.1.3 This includes amount of Rs. 161.06 million (2011: Rs. 217.87 million) on account of receivable from Divine Devel-opers (Private) Limited in respect of sale of development properties which is secured against various properties.
13.2.1 These represent the amount of assets acquired against settlement of advances from various customers. Valuation of these properties was conducted by M/s Harvester Services (Pvt.) Limited. Market value assessed amounts to Rs. 268.133 million. Provision has been created against the shortfall.
14.1 SPREL has entered into agreements for purchase and construction of properties from Divine Developers (Private) Limited (‘DDPL’). These properties relate to two projects of DDPL namely “Commercial Area - Divine Garden” and “Residential - Divine Gardens”. In this respect, significant risks and rewards incidental to the ownership of land held under development have been transferred as also confirmed by the legal advisor’s opinion of the SPREL Other relevant property documentation are in process.
73,340,140 210,140,166
- 283,480,306
(158,356,889) 125,123,417
17,502,419 -
7,285,204 7,179,341 4,435,867
820,815,828 - - - -
413,102,345 256,792
1,270,577,796 (3,818,270)
(256,792) (145,080,000) (149,155,062)
1,121,422,734
142,213,062 6,942,000
149,155,062
206,091,245 - -
(21,417,401) 184,673,844
13.2.1
13.2.2
14.1
68,112,949 169,687,266
2,118,297 239,918,512
(114,205,239) 125,713,273
4,293,072 45,193,200
9,988,695 50,535,148
3,910,643 761,497,883
61,160,304 41,811,499 80,478,357 13,022,299
400,008,887 256,792
1,472,156,779 (3,818,270)
(256,792) (138,138,000) (142,213,062) 1,329,943,717
256,792 141,956,270 142,213,062
111,084,500 -
161,061,976 (66,055,231) 206,091,245
2012Rupees
Note 2011Rupees

144
15 BORROWINGS In Pakistan Outside Pakistan 15.1 Particulars of borrowings with respect to currencies In local currency In foreign currency Long term borrowings Short term borrowings 15.2 Long term borrowings Against book debts/receivables Term finance certificates - secured Clean / letter based financing Against SBP refinance schemes
7,229,175,546 -
7,229,175,546
7,229,175,546 -
7,229,175,546
3,051,415,599 4,177,759,947 7,229,175,546
1,866,384,616 430,853,483
7,944,440 746,233,060
3,051,415,599
15.1
15.215.3
15.2.115.2.2
15.2.3
7,064,577,411 -
7,064,577,411
7,064,577,411 -
7,064,577,411
2,899,980,249 4,164,597,162 7,064,577,411
1,966,771,249 512,307,979
- 933,209,000
3,412,288,228
2012Rupees
Note 2011Rupees
15.2.1 These represent facilities obtained by Holding Company against charge on book debts/receivables valuing Rs. 3,733 million (2011: Rs. 4,256 million). The mark up is charged at varying rates ranging from 9.91% to 12% per annum (2011: 12.54% to 14.11% per annum). These facilities will mature during June 2013 to September 2014 (2011: April 2011 to September 2014).
15.2.2 This represents third issue of registered and listed Term Finance Certificates (TFCs) issued by SPLCL to banking
companies and financial institutions, trusts and general public. These are secured by way of a first exclusive charge on specific leases including lease rentals and receivables against lease with 25% margin available at all times to the TFCs holders on total outstanding amount of the issue. The total issue comprises of 150,000 number of certificates of Rs. 5,000 each.
The issue was first restructured by way of “”Supplemental Declaration of Trust”” dated 13 September 2010 and was
further restructured by way of “” Second Supplemental Declaration of Trust”” dated 13 January 2012. To make the second proposed restructuring terms of Supplemental Declaration of Trust effective, an extra ordinary resolution has been passed by 75% of the aggregate amount outstanding to TFC holders. As of 31 December 2012, the trustee has obtained necessary approval of TFC holders. The management considers the restructuring terms of Second Supple-mental Declaration of Trust as effective and is making necessary payments as per the revised terms.
The revised terms and conditions of the issue after rescheduling are as follows: Principal redemption The principal redemption of TFCs is structured to be in 63 un-equal monthly instalments starting from 13 January
2012 as follows:- Rs. 3 million per month starting from January 2012 to December 2012- Rs. 4 million per month starting from January 2013 to December 2013- Rs. 6 million per month starting from January 2014 to December 2014- Rs. 13 million per month starting from January 2015 to February 2017- Rs. 20.854 million in March 2017
Mark-up on TFCs The issue carries return at 6% per annum for first 36 months (from 13 January 2012 to 13 December 2014) and;

145
15.3 Short term borrowings Against book debts/receivables Repurchase agreements under PIBs - repo Repurchase agreements under Market Treasury Bills - repo Term finance certificates - secured Clean / letter based financing Morahaba finance
668,019,569 250,000,000
2,309,295,930 48,000,000
102,444,448 800,000,000
4,177,759,947
15.3.115.3.215.3.315.2.2
15.3.4
1,419,521,683 193,031,600 684,735,900
- 705,000,000 650,000,000
3,652,289,183
2012Rupees
Note 2011Rupees
- One month KIBOR per annum for remaining 27 months (from 13 January 2015 to 13 March 2017).
- Mark-up shall be paid on monthly basis starting from 25th month till the maturity of the TFC Mark-up payments
on TFCs for first 24 months is deferred till 13 December 2013. Deferred mark-up is the sum of deferred mark-up pay-ments for the first 24 months and the outstanding deferred mark-up (relating to first restructuring as of 13 September 2011) and amounts to Rs. 25.368 million
- Mark-up on TFCs is deferred till 13 December 2013 and is payable in 3 equal instalments in December 2014, 2015 and 2016.
15.2.3 These represent facilities obtained by Holding Company against State Bank Refinance schemes (LT - EOP / LT - FF).
The mark up is charged at rate of 5.00% to 10.10% per annum (2011: 5.00% to 10.10% per annum). These facilities will mature during January 2013 to November 2018 (2011: January 2012 to December 2020).
15.3.1 SPLCL has availed borrowing from various parties as per following details:
a) Finance of Rs. 77.50 million obtained from National Bank of Pakistan on 1 April 2010 through a letter of placement
carrying mark-up at a rate of 11.2% for a period of 140 days. SPLCL has not paid any amount in respect of this finance. As of 31 December 2012, SPLCL has accrued a mark-up of Rs. 23.923 million. The management is currently under negotiation to settle / restructure this borrowing.
b) Finance of Rs. 63 million obtained from Innovative Investment Bank Limited on 3 December 2010 through a letter of placement carrying mark-up at a rate of 8% for a period of 90 days. The facility was rolled over for a further period of 184 days on 14 March 2011. Since the disbursement of facility, SPLCL has paid an amount of Rs. 3 million on account of principal repayment. As of 31 December 2012, SPLCL has accrued a mark-up of Rs. 13.641 million. The management is currently under negotiation to settle / restructure this borrowing.
c) Finance of Rs. 150 million obtained from Meezan Bank Limited (MBL) on 20 September 2008 under Murabaha
arrangement at the rate of 12% per annum. SPLCL paid Rs. 81 million on various dates from September 2008 to June 2011.
The remaining amount of Rs. 69 million was restructured by way of settlement agreement on 22 April 2011 whereby
SPLCL transferred a lease portfolio of Rs. 32 million. During the period, on 16 September 2012, a revised settlement agreement was signed and as per the revised settlementagreement, loan is to be settled by way of transferring of its assets / collateral held against one of its non-performing borrower and cash payment of Rs. 9.870 million as down payment. SPLCL has made the down payment on 06 September 2012 and the collateral is to be transferred after the execution of a tripartite agreement between SPLCL, MBL and the said borrower.
d) Finance of Rs. 26 million obtained from AKD Aggressive Income Fund on 23 June 2011 through letter of placement
for a period of 30 days at a rate of 10% per annum. SPLCL has repaid an amount of Rs. 7.237 million on various dates till 31 December 2012. As of 31 December 2012, SPLCL has accrued a mark-up of Rs. 3.261 million.
e) Finance of Rs. 57.5 million obtained from IGI Investment Bank Limited on 23 August 2010 for a period of 31 days at
a rate of 9% per annum. The finance was restructured by way of settlement agreement on 24 November 2010. As per the restructuring agreement, loan is to be settled by way of transfer of lease receivables of SPLCL and by further making a payment of Rs. 15.272 million. As per rescheduling agreement dated 24 November 2010, the revised

146
facility carries mark-up at 10.03% per annum, payable monthly. As of 31 December 2012, SPLCL has accrued a mark-up of Rs. 5.607 million. The management is currently under negotiation to settle this borrowing.
f) Finance of Rs. 117 million obtained from KASB Funds (KASB Income Opportunity Fund and KASB Asset Allocation
Fund) on 13 July 2009. The finance was restructured by way of settlement agreement dated 28 December 2011. As per the agreement, loan is to be settled by way of transferring of assets / collateral held by SPLCL against its non-performing borrowers, lease receivables of SPLCL and cash payment of Rs. 23.085 million in twenty four equal monthly instalments. During the period, SPLCL has paid an amount of Rs. 4.50 million on account of principal repayment. As per rescheduling agreement the finance carries no mark-up.
Finance of Rs. 100 million obtained from National Bank of Pakistan on 21 March 2005 mainly for lease financing
activities. As per the agreement, loan was payable in semi annual instalments of Rs. 12.5 million each from 21 September 2005 to 21 March 2009. The agreement was further amended with the maturity date to March 2010. As of 31 December 2012, all instalments were paid except for the last instalment which was due on 21 March 2009 and is still outstanding. As per agreement the finance carries mark-up at 6 month KIBOR + 1.5%, payable semi-annually. As of 31 December 2012, SPLCL has accrued mark up of Rs. 5.806 million.The management is currently under negotiation to settle / restructure this borrowing.
g) Finance of Rs. 127 million obtained from First Women Bank Limited on 31 December 2008 mainly for lease financing
activities. The finance was restructured by way of settlement agreement dated 01 March 2010. As per the rescheduling terms, the entire principal was payable in unequal monthly instalments upto 31 December 2012. SPLCL paid the instalments up to 31 December 2010 and afterwards no amount has been paid. As per rescheduling agreement the finance carries mark-up at 12% per annum, payable monthly. As of 31 December 2012, SPLCL has accrued mark-up of Rs. 19.705 million. The management is currently under negotiation to settle / restructure this borrowing.
h) Finance of Rs. 50 million obtained from Askari Income Fund mainly for lease financing activities. The finance was
restructured by way of settlement agreement on 01 March 2010 and 31 January 2011. As per the rescheduling terms, the entire principal was payable in monthly instalments of Rs. 1 million starting from 6 February 2011 and outstanding mark-up was waived. Th SPLCL paid the instalments upto 15 July 2011 and afterwards no amount has been paid.
i) Finance of Rs. 468 million obtained from Bank of Khyber which was restructured by way of settlement agreements
on 22 March 2009, 24 August 2011 and 21 June 2012. As per the latest agreement dated 21 June 2012, SPLCL was required to settle the loan through following terms:
- Transfer of a property (held as collateral of Rs. 150 million against the borrower). - Issue of preference shares of Rs. 195 million (for conversion of liability of Rs. 195 million). - Cash payment of Rs. 55 million including down payment of Rs. 10 million and Rs. 45 million in monthly instalments
of Rs. 1 million each. The transfer of property amounting to Rs. 150 million was completed on 19 July 2012, whereas the issue of preference
shares amounting to Rs. 195 million has been approved by the SECP subsequent to the year end. Further, monthly instalments of Rs. 1 million each are being paid regularly by SPLCL. This finance carries no mark-up.
j) “Finance of Rs. 100 million obtained from HSBC Bank Middle East Limited on 16 March 2010 mainly for lease financing activities. The finance was restructured by way of settlement agreement dated 12 September 2011 and 21 June 2012. As per the latest restructuring agreement dated 21 June 2012, loan is payable as Rs. 1.8 million down payment and Rs. 37 million in monthly instalments of Rs. 1.4 million each. On fully complying with the terms of the settlement agreement SPLCL shall be entitled with a waiver of Rs. 28 million in principal and Rs. 3.8 million in mark-up. As per rescheduling agreement the finance carries no mark-up. As of 31 December 2012 SPLCL is complying with revised terms of the restructuring agreement.
k) Finance of Rs. 117 million obtained from CDC Trustee United Growth & Income Fund on 14 January 2010 mainly for
lease financing activities. The finance was restructured by way of settlement agreements dated 12 May 2010 and 12 July 2012. As per the revised restructuring agreement loan is to be settled by way of transfer of three properties of SPLCL’s debtors on 31 December 2012 and 30 June 2013. As per revised restructuring agreement the finance carries no mark-up. SPLCL is in the process of renegotiating certain properties with the lender.

147
l) Finance of Rs. 15.7 million obtained from Silk Bank Limited on 27 April 2009 against issuance of irrevocable letter of comfort to Silk Bank on account of Uni-Link International for opening of letter of credit. SPLCL has paid Rs. 4.04 million upto 31 March 2011. The finance has been restructured by way of a settlement agreement dated 12 September 2012. As per the agreement loan is to be settled by making down payment of Rs. 0.707 million and balance of Rs. 11 million is to be paid in 54 equal monthly instalments of Rs. 0.204 per month. As of 31 December 2012, SPLCL has accrued a mark up of Rs. 1.807 million.
15.3.2 These represents finances obtained by Holding Company and these finances are secured against Pakistan Investment Bonds. These carry markup rate of 9.50% (2011: 11.90%) per annum and will mature in January 2013 (2011: January 2012).
15.3.3 These represents finances obtained by Holding Company and these are secured against Treasury bills and carry mark
up rates of 7.75% to 9.25% (2011: 11.90%) per annum and are maturing in January 2013 (2011: January 2012).
15.3.4 These represent morahaba finance arranged from an Islamic Bank. These carry markup rates ranging from 9.76% to 9.86% (2011: 12.23% to 12.47%) per annum. These will be maturing from February 2013 to June 2013 (2011: January 2012 to June 2012).
16.1 These represent certificate of investments issued to various institutions. The mark up is charged at varying rates ranging from 9.50% to 12.00% per annum (2011: 12.15% to 13.80% per annum). These are repayable in period ranging from January 2013 to June 2013 (2011: January 2012 to December 2012).
16.2 These represent security deposits received against lease contracts and are refundable / adjustable at the expiry / termination of the respective leases.
15.4 Details of borrowings secured/unsecured Secured Borrowings from State Bank of Pakistan : – Against SBP refinance schemes Repurchase agreement borrowings Against book debts/receivables Term finance certificates Morahaba finance Unsecured Call borrowings 16 DEPOSITS AND OTHER ACCOUNTS Certificate of Investments (COIs) Security deposits against finance leases
17 UNDERWRITING PROVISION Provision for outstanding claims Provision for unearned premium Additional provision for unexpired risks Commission income earned
746,233,060 2,559,295,930 2,534,404,185
478,853,483 800,000,000
7,118,786,658
110,388,888 7,229,175,546
848,664,301 480,467,095
1,329,131,395
- - - - -
16.116.2
933,209,000 1,390,075,479 3,386,292,932
- 650,000,000
6,359,577,411
705,000,000 7,064,577,411
926,442,000 691,779,671
1,618,221,671
112,663,524 105,136,280
2,000,656 8,920,405
228,720,865
2012Rupees
2012Rupees
Note
Note
2011Rupees
2011Rupees

148
18 DEFERRED TAX LIABILITIES Deferredtaxcreditsarisingduetofollowingtaxable temporary differences: Accelerated tax depreciation Surplus on revaluation of operating fixed assets Investments - held for trading Surplus on revaluation of securities Deferredtaxdebitsarisingduetofollowingdeductible temporary differences: Provision against employee benefits Investment property Net investment in leases Accumulated tax losses Valuation reserve 19 OTHER LIABILITIES Mark-up/return/interest accrued on borrowings Creditors, accrued and other liabilities Deferred liabilities 19.1 Mark-up/return/interest accrued on borrowings Long term borrowings Short term borrowings Securities purchased under Repurchase agreements - repo 19.2 Creditors, accrued and other liabilities Directors’ remuneration Other payables Payable on employees account Corporate income tax payable - net Amount due to other insurers/reinsurers Premium received in advance Accrued liabilities
19.3 Deferred liabilities Provision for staff gratuity Provision for compensated absences Advance rental income
53,411,322 784,316,976
790,008 119,639,064 958,157,370
(12,082,978) (4,250,470) 45,005,067
(490,311,389) (461,639,770)
496,517,600 488,818,093 985,335,693
337,813,754 80,683,038 84,857,897
503,354,689
230,027,498 106,144,638
1,641,618 337,813,754
2,916,294 13,152,782
35,520 3,942,490
- -
60,635,952 80,683,038
29,742,065 4,780,830
50,335,002 84,857,897
19.119.219.3
37.1
19.3.1
22
21
20,947,379 679,153,497
- 22,505,053
722,605,929
(11,741,947) -
40,139,097 (574,204,238) (545,807,088)
176,798,841 574,204,238 751,003,079
402,499,229 139,808,168
57,373,077 599,680,474
372,378,063 29,548,814
572,352 402,499,229
3,807,374 12,122,626
3,830,385 3,102,482 3,555,785
- 113,389,516 139,808,168
29,657,216 4,768,756
22,947,105 57,373,077
2012Rupees
Note 2011Rupees
19.3.1 This includes rent received in advance for premises let out in the Saudi Pak Tower, Jinnah Avenue, Islamabad.
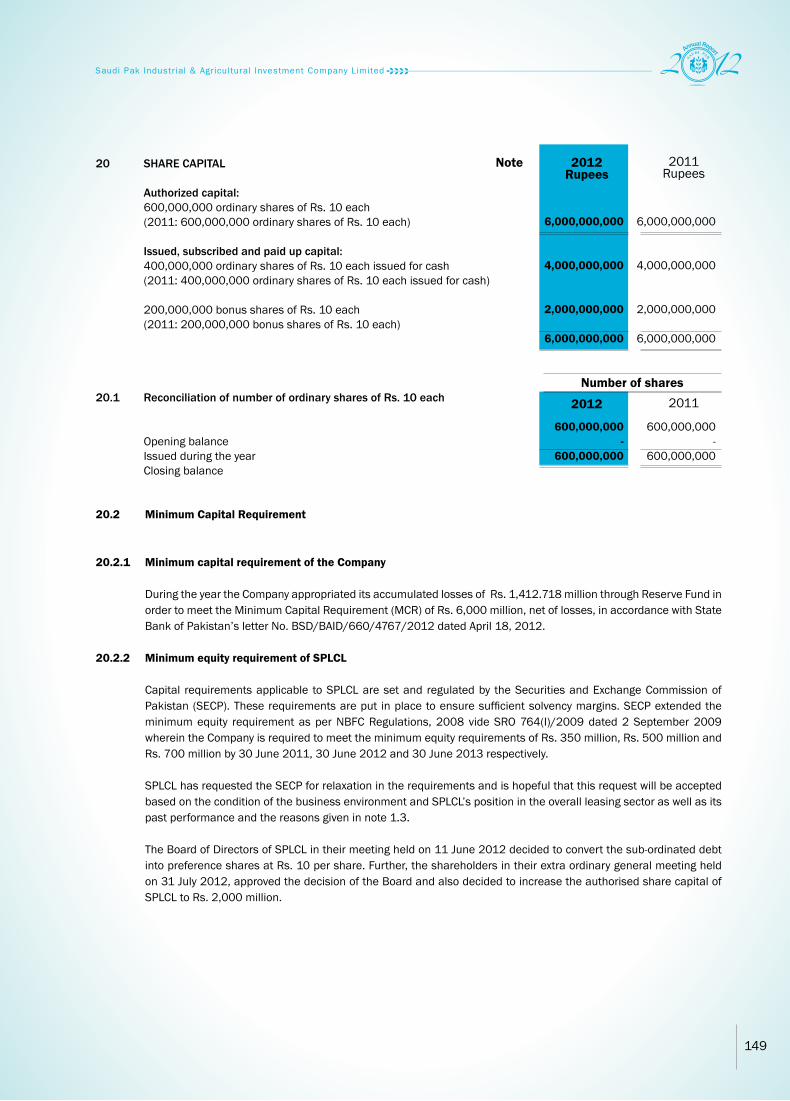
149
20 SHARE CAPITAL Authorized capital: 600,000,000 ordinary shares of Rs. 10 each (2011: 600,000,000 ordinary shares of Rs. 10 each) Issued, subscribed and paid up capital: 400,000,000 ordinary shares of Rs. 10 each issued for cash (2011: 400,000,000 ordinary shares of Rs. 10 each issued for cash) 200,000,000 bonus shares of Rs. 10 each (2011: 200,000,000 bonus shares of Rs. 10 each) 20.1 Reconciliation of number of ordinary shares of Rs. 10 each Opening balance Issued during the year Closing balance
20.2 Minimum Capital Requirement
20.2.1 Minimum capital requirement of the Company During the year the Company appropriated its accumulated losses of Rs. 1,412.718 million through Reserve Fund in
order to meet the Minimum Capital Requirement (MCR) of Rs. 6,000 million, net of losses, in accordance with State Bank of Pakistan’s letter No. BSD/BAID/660/4767/2012 dated April 18, 2012.
20.2.2 Minimum equity requirement of SPLCL
Capital requirements applicable to SPLCL are set and regulated by the Securities and Exchange Commission of Pakistan (SECP). These requirements are put in place to ensure sufficient solvency margins. SECP extended the minimum equity requirement as per NBFC Regulations, 2008 vide SRO 764(I)/2009 dated 2 September 2009 wherein the Company is required to meet the minimum equity requirements of Rs. 350 million, Rs. 500 million and Rs. 700 million by 30 June 2011, 30 June 2012 and 30 June 2013 respectively.
SPLCL has requested the SECP for relaxation in the requirements and is hopeful that this request will be accepted
based on the condition of the business environment and SPLCL’s position in the overall leasing sector as well as its past performance and the reasons given in note 1.3.
The Board of Directors of SPLCL in their meeting held on 11 June 2012 decided to convert the sub-ordinated debt into preference shares at Rs. 10 per share. Further, the shareholders in their extra ordinary general meeting held on 31 July 2012, approved the decision of the Board and also decided to increase the authorised share capital of SPLCL to Rs. 2,000 million.
6,000,000,000
4,000,000,000
2,000,000,000
6,000,000,000
600,000,000 -
600,000,000
6,000,000,000
4,000,000,000
2,000,000,000
6,000,000,000
600,000,000 -
600,000,000
2012Rupees
2012
Number of shares
Note 2011Rupees
2011

150
21 SURPLUS / (DEFICIT) ON REVALUATION OF AFS SECURITIES - NET OF TAX Quoted securities Government securities Term Finance Certificates (TFCs) Mutual fund units Less: related deferred tax liability
22 SURPLUS ON REVALUATION OF OPERATING FIXED ASSETS - NET OF TAX Movement in surplus on revaluation of operating fixed assets: Opening balance Surplus on revaluation of fixed assets Surplus realized on disposal Transferred to unappropriated profit in respect of – Incremental depreciation charged during the year – Deferred tax Surplusonrevaluationofoperatingfixedassets Related deferred tax liability Deferred tax recognized on surplus on revaluation of fixed assets Transferred to consolidated profit and loss account in respect of incremental depreciation Closing balance
23 CONTINGENCIES AND COMMITMENTS 23.1 Direct credit substitutes Letter of comfort / guarantee 23.2 Nondisbursedcommitmentfortermandworkingcapitalfinance 23.3 Claims against the Group not acknowledged as debts 23.4 Commitmentsinrespectofpurchaseofforwardexchangecontracts [2011: USD 27.40 million ] 23.5 Commitmentsfortheacquisitionofoperatingfixedassets(intangiblesassets) 23.6 Taxcontingencies (a) AssessmentOrdersUnderIncomeTaxOrdinance,2001
319,193,749 18,829,733
(781,465) 4,650,000
341,892,017 (119,639,064)
222,252,953
1,946,209,451 390,390,456
-
(57,965,532) (31,473,181) (89,438,713)
2,247,161,194
(679,153,497) (136,636,660)
31,473,181 (784,316,976)
1,462,844,218
207,385,000
1,016,363,000
168,034,208
-
31,550,741
1,423,332,949
10.518
18
58,671,491 (123,152)
- 7,065,777
65,614,116 (22,505,053)
43,109,063
2,033,333,470 -
(38,256)
(56,605,746) (30,480,017) (87,085,763)
1,946,209,451
(709,633,514) -
30,480,017 (679,153,497)
1,267,055,954
18,134,000
824,499,000
32,000,000
2,463,933,000
5,664,339
3,344,230,339
2012Rupees
Note 2011Rupees

151
Taxyear2004,2005and2006 Provision for Non-Performing Loans (NPLs) for tax years 2004, 2005 and 2006 were disallowed by the tax authorities
and restricted the credit for tax paid/suffered during the relevant tax years. As a consequence of foregoing, cumula-tive income tax demand of Rs. 63.8 million was raised by the Income Tax Authorities. Although the said demands have been paid, these are being contested by the Holding Company and related appeals are presently pending for adjudication before Appellate Tribunal Inland Revenue (ATIR). It is likely that the appeals will be decided in favour of the Holding Company.
(b) Taxyear2008and2009 The Holding Company’s income tax liability after relief by Commissioner Inland Revenue (Appeals) is now Rs 231 mil-
lion and Rs. 612 million for the tax year 2008 and 2009 respectively out of which the Company paid Rs. 425 million. Certain issues including disallowance of provision against NPLs and apportionment of expenses are being contested in appeals before ATIR, which are likely to be decided in Holding Company’s favor.
(c) Taxyear2010 The Holding Company’s income tax liability after relief by Commissioner Inland Revenue (Appeals) is now Rs 147 mil-
lion out of which the Company paid Rs. 30 million. Certain issues including disallowance of provision against NPLs and apportionment of expenses are being contested in appeals before ATIR, which are likely to be decided in Holding Company’s favor
(d) SPLCLTaxcontingency SPLCL has been issued with a notice under section 14 of the Federal Excise Act, 2005. In the notice it has been al-
leged that SPLCL has not paid Federal Excise Duty (FED) in terms of section 3 read with Entry 8 of Table-II of the first schedule to the Federal Excise Act 2005 for the periods 2007-08, 2008-09 & 2009-10. Accordingly, Rs. 126,204,794 has been alleged to be recoverable. The above amount of FED has been imposed on all the income of SPLCL for the three years including mark up income earned on finance lease contracts.
According to SPLCL’s tax advisor, FED is applicable in respect of document fee, front end fee and syndicate lease in-
come. These represent services rendered by leasing companies in respect of finance lease which are funded services. These services for the periods 2007-08 and 2008-09 are not chargeable to FED because of the reason that for those years FED was chargeable on services which were non-funded. However, for the periods 2009-10 due to amendment in Entry 8 the said services are chargeable to FED as provisions of the Federal Excise Act, 2005. Accordingly the amount of liability comes out of Rs. 198,530.
SPLCL has filed an appeal before the Commissioner Inland Revenue (Appeals) against the said order. The CIR (A) vide
through appellate order number 97 of 2012 dated 30 April 2012 constituted that the duty so charged is legally and constitutionally valid under the FED Act 2005. However, it also mentioned that the notice issued is barred by time for the period from July 2007 to September 2008 and accordingly deleted the levy of FED for the said tax period.
SPLCL has further decided to prefer appeal before the Appellate Tribunal Inland Revenue against the above CIR (A)
order. Moreover, the SPLCL’s tax advisor is of the view that SPLCL has a strong arguable case that it is likely to succeed in getting the relief claimed against the said demand.
23.7 Other contingencies (a) Ceco Tyre Ltd (COS No.141/2009 of Rs. 202.00 million) “Saudi Pak had sanctioned a long term finance facility of Rs.30.00 million on 20.10.2008 in favor of Ceco Tyre Ltd
which was not disbursed due to negative e-CIB reported by the BOP.
Subsequently in the year 2009, Ceco Tyre Ltd filed the subject damages suit against the Company for allegedly suf-fering business losses due to non-disbursement of approved finance. On completion of evidence of both the parties, the matter will be fixed for final arguments of legal counsels before the Court. Saudi Pak is vehemently defending the suit as the Plaintiff had no cause of action against Saudi Pak. It is likely to be dismissed by the honorable Court after hearing final arguments.
(b) Ali Akbar Spinning Mills Limited (COS No.113/2009/10 of Rs.827.102 million) “Ali Akbar Spinning Mills Limited is a willful defaulter against whom a recovery suit for Rs.91.886 million has been filed
by the Company in the High Court. Ali Akbar Spinning Mills Limited feeling aggrieved by the Company’s action and to forestall and delay the payments, filed the titled frivolous suit for damages.
The Plaintiff had mainly alleged to have suffered business losses of Rs.827.102 million due to over-payments to and not allowing additional financing by the Company. The Company had made no such commitment.
The Company is vehemently contesting this frivolous suit and is likely to be dismissed.

152
24 MARK-UP/RETURN/INTEREST EARNED On advances On investments On lendings to financial institutions On lease financing - net On profit and loss saving accounts 24.1 On advances Long term advances Short term advances Staff advances 24.2 On investments Term Finance Certificates Government securities 25 MARK-UP/RETURN/INTEREST EXPENSED Mark-up/return/interest expensed Deposits PIB’s premium amortization Brokerage fee 25.1 Mark-up/return/interestexpensed Long term borrowings Short term borrowings Securities purchased under repurchase agreements - repo 26 PROVISION FOR DIMINUTION IN THE VALUE OF INVESTMENTS Breakup of provisions /(reversals) is as under: Term Finance Certificates (TFCs) Unquoted investment 27 UNDER WRITING INCOME Net premium revenue Net claims Premium deficiency reserve Expenses Net commission 28 INCOME FROM SALE OF DEVELOPMENT PROPERTIES - NET Revenue from sale of development properties Revenue from lease rentals of properties Less: cost incurred on development properties 28.1 Revenue from sale of development properties Residential Project Commercial Project 28.2 Cost incurred on development properties Residential Project Commercial Project
651,964,368 471,422,053
40,178,357 77,543,474 5,786,422
1,246,894,674
552,143,348 99,359,905
461,115 651,964,368
192,595,345 278,826,708 471,422,053
744,626,894 15,565,568 14,471,909
1,938,749 776,603,120
371,522,089 217,789,203 155,315,602 744,626,894
165,434,861 (31,340,813) 134,094,048
82,646,947 (23,291,723)
2,000,656 (40,236,323)
(5,451,706) 15,667,851
30,892,706 1,420,440
(21,417,401) 10,895,745
22,987,500 7,905,206
30,892,706
15,697,900 5,719,501
21,417,401
24.124.2
25.1
28.1
28.2
28.2.1 28.2.2
28.2.128.2.2
821,909,794 514,416,153
19,249,101 116,269,807
8,095,707 1,479,940,562
714,438,423 107,075,148
396,223 821,909,794
246,155,889 268,260,264 514,416,153
1,134,305,586 20,707,342 16,927,990
1,579,161 1,173,520,079
566,992,516 417,847,876 149,465,194
1,134,305,586
(24,508,469) 87,740,811 63,232,342
89,757,340 (16,186,545)
- (50,723,790)
(1,860,655) 20,986,350
112,291,435 903,000
(66,055,231) 47,139,204
94,762,500 17,528,935
112,291,435
53,372,860 12,682,371 66,055,231
2012Rupees
Note 2011Rupees

153
RevenueCostProfit
RevenueCostProfit
RevenueCostProfit
RevenueCostProfit
459,750,000 (313,958,000)
145,792,000
137,481,847 (99,469,576)
38,012,271
459,750,000 (313,958,000)
145,792,000
137,481,847 (99,469,576)
38,012,271
676767
18.518.518.5
626262
12.7512.7512.75
308,032,500 (210,351,860)
97,680,640
25,434,142 (18,401,872)
7,032,270
285,045,000 (194,653,960)
90,391,040
17,528,935 (12,682,371)
4,846,564
285,045,000 (194,653,960)
90,391,040
17,528,935 (12,682,371)
4,846,564
190,282,500 (141,281,100)
49,001,400
- - -
22,987,500 (15,697,900)
7,289,600
7,905,206 (5,719,501) 2,185,706
94,762,500 (53,372,860)
41,389,640
17,528,935 (12,682,371)
4,846,564
28.2.1 Residential Project
Profit recognized on stage of completion method
28.2.2 Commercial Project
28.2.1.1 On 31 December 2012, inspection of the project, Residential Area - Divine Gardens has been carried out by an in-dependent valuer, M/s Ali & Ali Engineers and Valuers, certifying that 67 % of the project is completed till that date. The basis for inspection / valuation is real estate inquires, market trends and investors’ opinion.
Total
Total
31 December 2012
31 December 2012
31 December 2011
31 December 2011
Total
Total
2012 Rupees
2012 Rupees
2011 Rupees
2011 Rupees
(%)
(%)
(%)
(%)
2012 Rupees
2012 Rupees
2011 Rupees
2011 Rupees
2012 Rupees
2012 Rupees
2011 Rupees
2011 Rupees
2012 Rupees
2012 Rupees
2011 Rupees
2011 Rupees
Stage of completion as at
December 31, 2012
Stage of completion as at
December 31, 2012
Stage of completion as at
December 31, 2011
Stage of completion as at
December 31, 2011
On the basis of stage of completion
On the basis of stage of completion
On the basis of stage of completion
On the basis of stage of completion
Revenue recognized
in prior years
Revenue recognized
in prior years
Revenue recognized
in prior years
Revenue recognized
in prior years
Revenue to be recognized in current year
Revenue to be recognized in current year
Revenue to be recognized in current year
Revenue to be recognized in current year

154
28.2.2.1 On 31 December 2012, inspection of the project, Commercial Area - Divine Gardens has been carried out by an independent valuer, M/s Ali & Ali Engineers and Valuers, certifying that 18.50 % of the project is completed till that date. The basis for inspection / valuation is real estate inquires, market trends and investors’ opinion.
28.2.2.2 Subsequent to the year end, SPREL has sold the entire commercial property.
29 OTHER INCOME Net rental income Net gain on disposal of operating fixed assets - property and equipment Waiver on settlement of long term finances Others 29.1 Net rental income Rental income Less: Operating expenses Salaries, allowances and employee benefits Traveling and conveyance Medical Janitorial services Security services Insurance Postage, telegraph, telegram and telephone Printing and stationery Certification services Utilities Consultancy and professional charges Repairs and maintenance Rent, rates and taxes Depreciation Office general expenses
30 ADMINISTRATIVE EXPENSES Salaries, allowances and employee benefits Traveling and conveyance Vehicle running expenses Utilities Advertisement and publicity Postage, telegram, telephone and telex Printing, stationery and periodical Legal and professional charges Consultancy, custodial and rating services Auditor’s remuneration Repair and maintenance Office and general expenses Bank charges Professional training Depreciation Donations
37,384,923 15,116,725 93,232,072 34,912,313
180,646,033
183,766,154
13,195,078 5,590
185,132 3,921,008 7,256,838 1,431,673
867,013 24,544 30,400
11,564,932 450,000
6,703,408 1,383,745
99,321,146 40,724
146,381,231 37,384,923
203,865,894 28,192,236 10,034,288
8,732,807 2,270,475 7,302,941 4,603,360
12,639,296 16,560,767
1,826,900 7,663,138
25,750,813 684,217
1,245,996 43,791,385
50,000
375,214,513
29.1
29.2
30.130.2
30.3
30.4
39,822,949 8,091,310
- 61,252,513
109,166,772
182,283,854
10,987,833 760
342,337 3,542,076 6,690,694 1,975,965
18,629 1,200
43,200 11,763,097
300,000 6,256,324 1,368,283
99,103,413 67,094
142,460,905 39,822,949
174,009,805 35,051,384 12,455,543
7,263,790 1,863,559 7,542,495 3,684,564
12,611,958 7,697,356 1,729,900 6,913,469
23,528,969 789,507
1,043,183 40,845,134
-
337,030,616
2012Rupees
2012Rupees
Note
Note
2011Rupees
2011Rupees
29.2 This includes income received from tender fee and sale of miscellaneous scrap items etc.
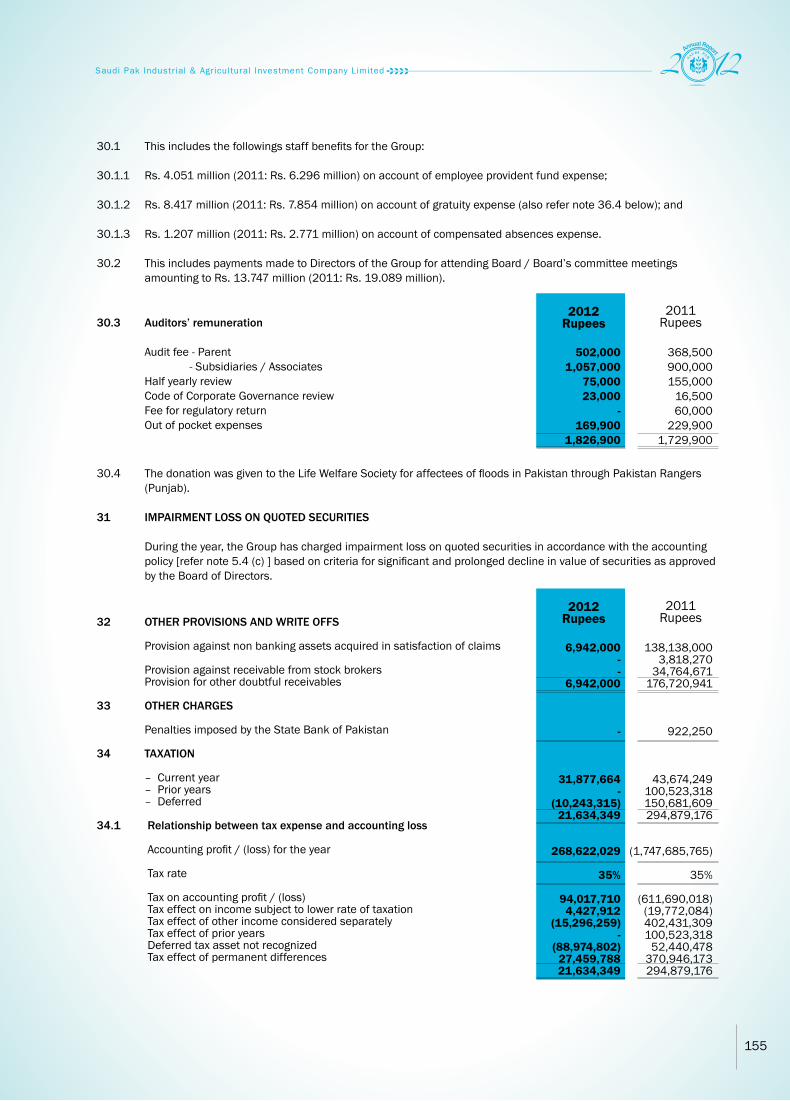
155
30.1 This includes the followings staff benefits for the Group:
30.1.1 Rs. 4.051 million (2011: Rs. 6.296 million) on account of employee provident fund expense;
30.1.2 Rs. 8.417 million (2011: Rs. 7.854 million) on account of gratuity expense (also refer note 36.4 below); and
30.1.3 Rs. 1.207 million (2011: Rs. 2.771 million) on account of compensated absences expense.
30.2 This includes payments made to Directors of the Group for attending Board / Board’s committee meetings amounting to Rs. 13.747 million (2011: Rs. 19.089 million).
30.4 The donation was given to the Life Welfare Society for affectees of floods in Pakistan through Pakistan Rangers (Punjab).
31 IMPAIRMENT LOSS ON QUOTED SECURITIES
During the year, the Group has charged impairment loss on quoted securities in accordance with the accounting
policy [refer note 5.4 (c) ] based on criteria for significant and prolonged decline in value of securities as approved by the Board of Directors.
30.3 Auditors’ remuneration Audit fee - Parent - Subsidiaries / Associates Half yearly review Code of Corporate Governance review Fee for regulatory return Out of pocket expenses
32 OTHER PROVISIONS AND WRITE OFFS Provision against non banking assets acquired in satisfaction of claims Provision against receivable from stock brokers Provision for other doubtful receivables 33 OTHER CHARGES Penalties imposed by the State Bank of Pakistan 34 TAXATION – Current year – Prior years – Deferred 34.1 Relationshipbetweentaxexpenseandaccountingloss Accounting profit / (loss) for the year Tax rate Tax on accounting profit / (loss) Tax effect on income subject to lower rate of taxation Tax effect of other income considered separately Tax effect of prior years Deferred tax asset not recognized Tax effect of permanent differences
502,000 1,057,000
75,000 23,000
- 169,900
1,826,900
6,942,000 - -
6,942,000
-
31,877,664 -
(10,243,315) 21,634,349
268,622,029
35%
94,017,710 4,427,912
(15,296,259) -
(88,974,802) 27,459,788 21,634,349
368,500 900,000 155,000
16,500 60,000
229,900 1,729,900
138,138,000 3,818,270
34,764,671 176,720,941
922,250
43,674,249 100,523,318 150,681,609 294,879,176
(1,747,685,765)
35%
(611,690,018) (19,772,084) 402,431,309 100,523,318
52,440,478 370,946,173 294,879,176
2012Rupees
2012Rupees
2011Rupees
2011Rupees
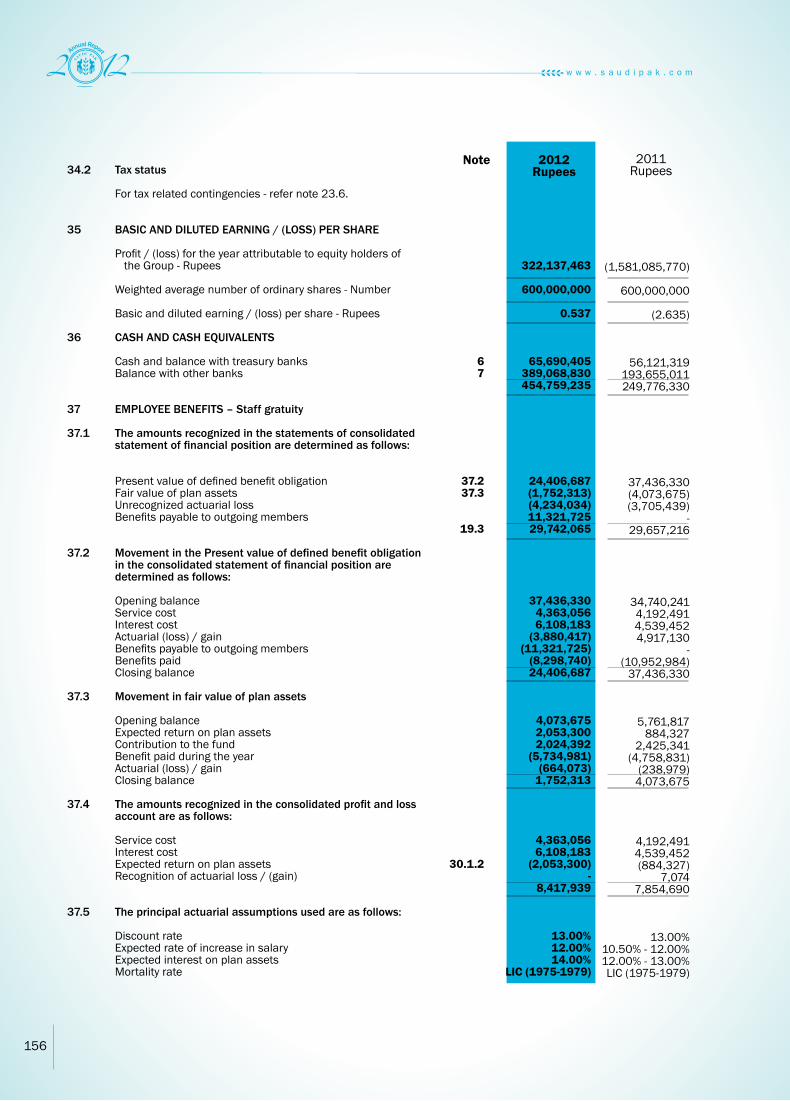
156
34.2 Taxstatus For tax related contingencies - refer note 23.6. 35 BASIC AND DILUTED EARNING / (LOSS) PER SHARE Profit / (loss) for the year attributable to equity holders of the Group - Rupees Weighted average number of ordinary shares - Number Basic and diluted earning / (loss) per share - Rupees
36 CASH AND CASH EQUIVALENTS Cash and balance with treasury banks Balance with other banks 37 EMPLOYEE BENEFITS – Staff gratuity 37.1 The amounts recognized in the statements of consolidated statementoffinancialpositionaredeterminedasfollows: Present value of defined benefit obligation Fair value of plan assets Unrecognized actuarial loss Benefits payable to outgoing members 37.2 MovementinthePresentvalueofdefinedbenefitobligation intheconsolidatedstatementoffinancialpositionare determined as follows: Opening balance Service cost Interest cost Actuarial (loss) / gain Benefits payable to outgoing members Benefits paid Closing balance 37.3 Movement in fair value of plan assets Opening balance Expected return on plan assets Contribution to the fund Benefit paid during the year Actuarial (loss) / gain Closing balance 37.4 Theamountsrecognizedintheconsolidatedprofitandloss account are as follows: Service cost Interest cost Expected return on plan assets Recognition of actuarial loss / (gain) 37.5 The principal actuarial assumptions used are as follows: Discount rate Expected rate of increase in salary Expected interest on plan assets Mortality rate
322,137,463
600,000,000
0.537
65,690,405 389,068,830 454,759,235
24,406,687 (1,752,313) (4,234,034) 11,321,725 29,742,065
37,436,330 4,363,056 6,108,183
(3,880,417) (11,321,725)
(8,298,740) 24,406,687
4,073,675 2,053,300 2,024,392
(5,734,981) (664,073)
1,752,313
4,363,056 6,108,183
(2,053,300) -
8,417,939
13.00%12.00%14.00%
LIC (1975-1979)
67
37.237.3
19.3
30.1.2
(1,581,085,770)
600,000,000
(2.635)
56,121,319 193,655,011 249,776,330
37,436,330 (4,073,675) (3,705,439)
- 29,657,216
34,740,241 4,192,491 4,539,452 4,917,130
- (10,952,984)
37,436,330
5,761,817 884,327
2,425,341 (4,758,831)
(238,979) 4,073,675
4,192,491 4,539,452 (884,327)
7,074 7,854,690
13.00%10.50% - 12.00%12.00% - 13.00%LIC (1975-1979)
2012Rupees
Note 2011Rupees

157
FeesManagerial remunerationPost employment benefitsRent and house maintenanceUtilitiesMedicalBonus and others
Number of persons
38.1 Chief Executive and majority of executives are also provided with Group maintained cars. 39 FAIR VALUE OF FINANCIAL INSTRUMENTS 39.1 On-balancesheetfinancialinstruments
38 COMPENSATION OF CHIEF EXECUTIVE, DIRECTORS AND EXECUTIVES
- 12,295,461 1,111,446 6,942,710
718,065 87,053
3,594,933 24,749,668
3
- 11,534,798
473,532 4,108,170 1,485,893
478,842 3,497,139
21,578,374
5
4,138,794 - - - - - -
4,138,794
20
3,979,874 - - - - - -
3,979,874
20
- 27,500,770
2,352,776 15,552,294
1,990,800 3,318,000
12,188,181 62,902,821
38
- 29,598,120
1,915,523 13,658,660
3,297,500 3,262,706
10,194,911 61,927,420
42
2012 2012 2012Chief Executive Directors Executives
2011 2011 2011
AssetsCash balances with treasury banksBalances with other banksLendings to financial institutionsInvestmentsAdvancesOther assets
Liabilities
Borrowings Deposits and other accounts Other liabilities
39.2 Off-balancesheetfinancialinstruments Commitments in respect of purchase of forward exchange contracts
39.1 On-balance sheet financial instruments
65,690,405 389,068,830 285,000,000
6,194,338,065 6,363,688,800
396,002,138 13,693,788,238
7,229,175,546 1,329,131,395
414,554,302 8,972,861,243
-
56,121,319 193,655,011 171,111,111
5,101,879,296 7,393,276,079
734,338,242 13,650,381,058
7,064,577,411 1,618,221,671
539,204,915 9,222,003,997
2,463,933,000
2012
2012
2011
2011
Book value Rupees
Book value Rupees
Book value Rupees
Book value Rupees
Fair value Rupees
Fair value Rupees
Fair value Rupees
Fair value Rupees
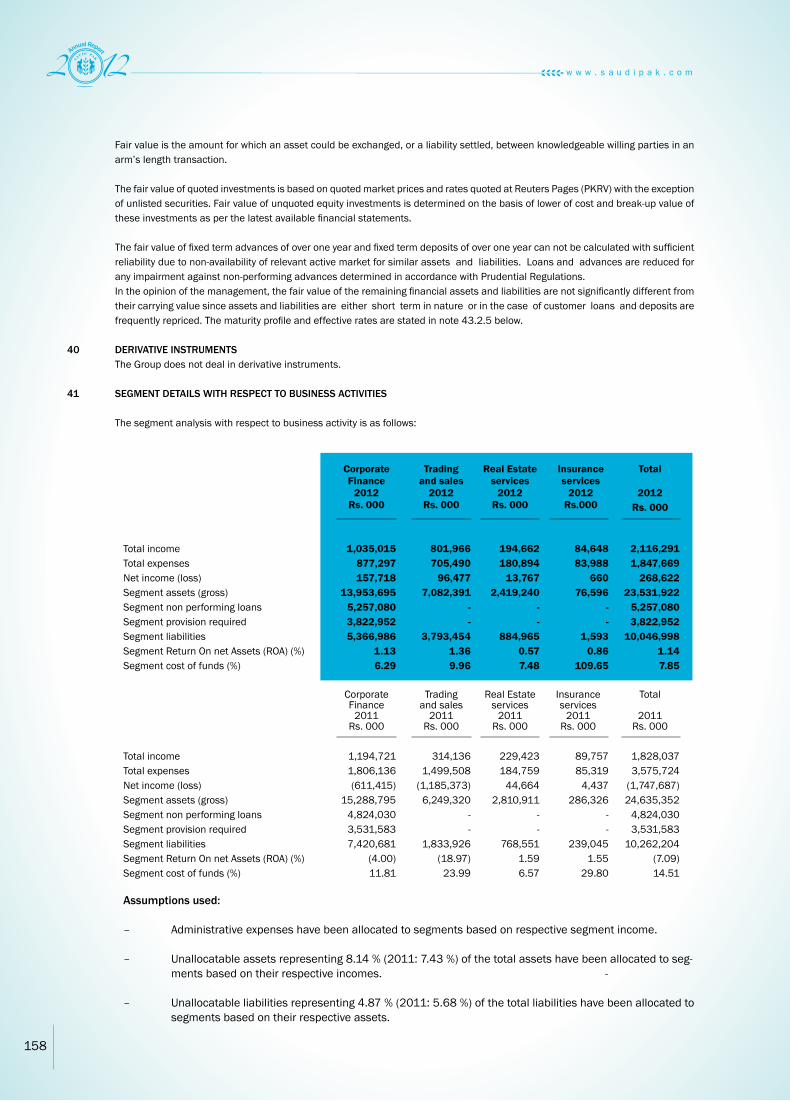
158
Fair value is the amount for which an asset could be exchanged, or a liability settled, between knowledgeable willing parties in an arm’s length transaction.
The fair value of quoted investments is based on quoted market prices and rates quoted at Reuters Pages (PKRV) with the exception of unlisted securities. Fair value of unquoted equity investments is determined on the basis of lower of cost and break-up value of these investments as per the latest available financial statements.
The fair value of fixed term advances of over one year and fixed term deposits of over one year can not be calculated with sufficient reliability due to non-availability of relevant active market for similar assets and liabilities. Loans and advances are reduced for any impairment against non-performing advances determined in accordance with Prudential Regulations.
In the opinion of the management, the fair value of the remaining financial assets and liabilities are not significantly different from their carrying value since assets and liabilities are either short term in nature or in the case of customer loans and deposits are frequently repriced. The maturity profile and effective rates are stated in note 43.2.5 below.
40 DERIVATIVE INSTRUMENTS The Group does not deal in derivative instruments.
41 SEGMENT DETAILS WITH RESPECT TO BUSINESS ACTIVITIES The segment analysis with respect to business activity is as follows:
Assumptions used:
– Administrative expenses have been allocated to segments based on respective segment income.
– Unallocatable assets representing 8.14 % (2011: 7.43 %) of the total assets have been allocated to seg-ments based on their respective incomes. -
– Unallocatable liabilities representing 4.87 % (2011: 5.68 %) of the total liabilities have been allocated to segments based on their respective assets.
Total income Total expenses Net income (loss) Segment assets (gross) Segment non performing loans Segment provision required Segment liabilities Segment Return On net Assets (ROA) (%) Segment cost of funds (%)
Total income Total expenses Net income (loss) Segment assets (gross) Segment non performing loans Segment provision required Segment liabilities Segment Return On net Assets (ROA) (%) Segment cost of funds (%)
1,035,015 877,297 157,718
13,953,695 5,257,080 3,822,952 5,366,986
1.13 6.29
1,194,721 1,806,136 (611,415)
15,288,795 4,824,030 3,531,583 7,420,681
(4.00) 11.81
801,966 705,490
96,477 7,082,391
- -
3,793,454 1.36 9.96
194,662 180,894
13,767 2,419,240
- -
884,965 0.57 7.48
314,136 1,499,508
(1,185,373) 6,249,320
- -
1,833,926 (18.97)
23.99
229,423 184,759
44,664 2,810,911
- -
768,551 1.59 6.57
84,648 83,988
660 76,596
- -
1,593 0.86
109.65
89,757 85,319
4,437 286,326
- -
239,045 1.55
29.80
2,116,291 1,847,669
268,622 23,531,922
5,257,080 3,822,952
10,046,998 1.14 7.85
1,828,037 3,575,724
(1,747,687) 24,635,352
4,824,030 3,531,583
10,262,204 (7.09) 14.51
Corporate Finance
2012Rs. 000
Corporate Finance
2011Rs. 000
Trading and sales
2012Rs. 000
Real Estateservices
2012Rs. 000
Trading and sales
2011Rs. 000
Real Estateservices
2011Rs. 000
Insurance services
2012Rs.000
Insurance services
2011Rs. 000
Total
2012Rs. 000
Total
2011Rs. 000

159
42 RELATED PARTY TRANSACTIONS
42.1 Both the Government of Kingdom of Saudi Arabia and the Islamic Republic of Pakistan own 50% shares each of the Group. Therefore, all entities owned by and controlled by these Governments are related parties of the Group. Other related parties comprise of entities over which the Group has control (subsidiaries), entities over which the directors are able to exercise significant influence (associated undertakings), entities with common directors, major shareholders, directors, key management personnel and employees’ funds. The Group in normal course of business pays for electricity, gas and telephone to entities controlled by Government of Pakistan. The Group has not extended any financing facilities to entities owned by the Governments of Kingdom of Saudi Arabia and the Islamic Republic of Pakistan
Except for the matters reported in note 10.4 to the consolidated financial statements, transactions with the related parties are executed substantially on the same terms, including markup rates and collaterals, as those prevailing at the time for comparable transactions with unrelated parties and do not involve more than a normal risk (i.e. under the comparable Uncontrolled Price Method).
Other than those transactions which are made under the terms of employment, majority of the transactions with related parties
comprise of loans and advances, deposits etc.
Advances for the house building, conveyance and personal use have also been provided to staff and executives in accordance with the employment and pay policy. Facility of group life insurance and hospitalization facility is also provided to staff and executives. In addition to this, majority of executives of the Group have been provided with Group maintained car.
42.2 Following are the transactions and balances with related parties
Nature of balances / transactions Outstanding balances at year end with associated undertakings – Certificate of Investments – Term Deposit Receipt – Bank Balances – Accrued Income – Insurance premium receivable – Insurance claims payable Employee funds – Deposits against COIs – Interest and other payables – Payable to defined benefit plan Transactions during the year with associated undertakings – Premium received – Claims paid – Bank charges – Tracker charges – Rent expensed – Interest income – Advisory Fee Key Management Personnel – Advances to executives – Repayment of advances Employee funds – Deposits against COIs – Maturity of deposits against COIs – Borrowings availed – Borrowings paid – Contribution to the employees provident fund – Contribution to defined benefit plan – Interest expense
- - - - - -
10,000,000 712,767 944,644
- - - - - - -
10,128,850 5,918,694
- 4,500,000
- -
4,557,869 -
1,788,668
55,000,000 41,931,000 5,990,242 2,118,297
32,421,665 4,298,277
14,500,000 821,651 944,644
61,503,392 1,448,177
126,011 427,950
96,000 2,906,384
-
3,030,000 4,096,838
13,046,247 13,620,000 15,029,589 15,029,589
4,901,466 1,545,081 1,455,231
2012Rupees
2011Rupees

160
43 CAPITAL ADEQUACY 43.1 Scope of applications
The Basel II framework has been applied in accordance with Circular No. BSD/BAI-2/201/1490/2008 dated
December 30, 2008. Standardized Approach is used for calculating the Capital Adequacy for Market and Credit risk while Basic Indicator Approach (BIA) is used for Operational Risk Capital Adequacy purpose.
As stated in note 1.1, the Group has two subsidiaries, namely Saudi Pak Real Estate Company Limited (SPREL) and Saudi Pak Leasing Company Limited (SPLCL) and one associated company namely Saudi Pak Insurance Company Limited (SPICL). SPREL is the wholly-owned subsidiary while SPLCL is 35.06% owned by the holding Company and SPICL is 43.21% owned by the holding Company. SPLCL is included, while calculating Capital Adequacy for the Group, using full consolidation method. The holding Company has significant minority investments in Equity International (Private) Limited (a financial entity). The holding Company has not consolidated SPREL and SPICL for consolidated Capital Adequacy Ratio (CAR) purposes. Investments in SPREL and SPICL have been deducted from core capital. The Group does not indulge in any securitization activity that shields it from the risk inherent in securitization.
43.2 Capital management The objective of managing capital is to safeguard the Group’s ability to continue as a going concern, so that it could
continue to provide adequate returns to shareholders by pricing products and services commensurately with the level of risk. It is the policy of the Group to maintain a strong capital base so as to maintain investor, creditor and market confidence and to sustain future development of the business. The impact of the level of capital on shareholders’ return is also recognized and the Group recognizes the need to maintain a balance between the higher returns that might be possible with greater gearing and the advantages and security afforded by a sound capital position.
Objectives and goals of managing capital
The objectives and goals of managing capital of the Group are as follows:
– To be an appropriately capitalized institution, as defined by regulatory authorities and comparable to the
peers; – Maintain strong ratings and to protect the Group against unexpected events;
– Availability of adequate capital (including the quantum) at a reasonable cost so as to enable the Group to
expand; – Achieve low overall cost of capital with appropriate mix of capital elements.
43.2.1 Capital Adequacy Ratio
The risk weighted assets to capital ratio, calculated in accordance with the State Bank’s guidelines on capital
adequacy was as follows:

161
43.2.1.1 Regulatory capital base Tier I Capital Fully paid up capital Share premium Reserves Unappropriated loss Minority in the equity of the subsidiary Deductions Book value of Intangibles, investment in commercial entities (50%) etc. Total Tier I Capital Supplementary capital Tier II Capital Subordinated debt (upto 50% of total Tier I capital) General Provisions subject to 1.25% of total risk weighted assets Revaluation Reserve (upto 45%) Deductions Investment in commercial entities, insurance subsidiary etc (50%) Total Tier II Capital Eligible Tier III Capital Total Regulatory Capital Base
6,000,000 -
588,419 (566,739) (644,095)
(278,969)
5,098,616
- -
1,180,039
(273,045)
906,994
-
6,005,610
6,000,000 -
1,565,161 (1,937,113)
(571,407)
(437,967)
4,618,674
- -
918,588
(285,812)
632,776
-
5,251,450
2012Rupees
2011Rupees
43.2.2 Risk weighted exposures Credit Risk Claims on : Corporate Banks Public sector entities Retail portfolio Secured by residential property Listed equity investments Unlisted equity investments Fixed Assets Other Assets Off Balance Sheet Exposure-Non Market Related Off Balance Sheet Exposure-Market Related
Market Risk Portfolios subject to Standardized Approach Interest rate risk Equity position risk Foreign exchange risk Operational Risk
Capital Adequacy Ratio Total eligible regulatory capital held - Rs. (000)
Total Risk Weighted Assets - Rs. (000)
Capital Adequacy Ratio - % age
845,691 16,682
- 2,011
21,564 54,156 55,759
357,775 188,517 162,883
-
26,639 228,906
4,169
101,422
2,066,174
6,040,649 119,159
- 14,364
154,032 386,827 398,282
2,555,537 1,346,552 1,163,452
-
190,275 1,635,046
29,779
724,446
14,758,400
2012
6,005,610
14,758,400
40.69%
1,028,390 7,465
- 1,494
27,265 58,125 71,008
303,754 200,309 113,749
690
11,944 310,254 349,231
147,654
2,631,332
7,345,641 53,318
- 10,672
194,748 415,177 507,201
2,169,674 1,430,776
812,492 4,928
85,313 2,216,100 2,494,507
1,054,672
18,795,219
2011
5,251,450
18,795,219
27.94%
2012 20112011 2012
Book value Rupees
Book value Rupees
Fair value Rupees
Fair value Rupees
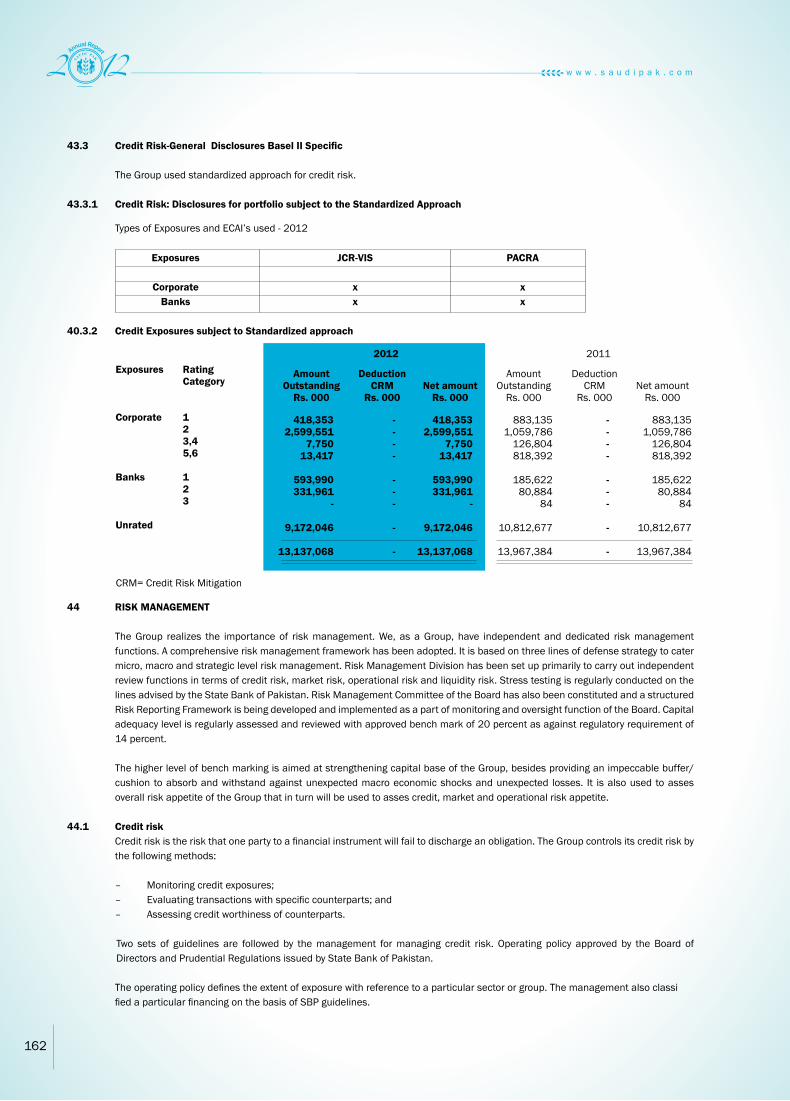
162
Amount Outstanding
Rs. 000
Amount Outstanding
Rs. 000
DeductionCRM
Rs. 000
DeductionCRM
Rs. 000Net amount
Rs. 000Net amount
Rs. 000
2012 2011
43.3 Credit Risk-General Disclosures Basel II Specific The Group used standardized approach for credit risk. 43.3.1 Credit Risk: Disclosures for portfolio subject to the Standardized Approach Types of Exposures and ECAI’s used - 2012
44 RISK MANAGEMENT The Group realizes the importance of risk management. We, as a Group, have independent and dedicated risk management
functions. A comprehensive risk management framework has been adopted. It is based on three lines of defense strategy to cater micro, macro and strategic level risk management. Risk Management Division has been set up primarily to carry out independent review functions in terms of credit risk, market risk, operational risk and liquidity risk. Stress testing is regularly conducted on the lines advised by the State Bank of Pakistan. Risk Management Committee of the Board has also been constituted and a structured Risk Reporting Framework is being developed and implemented as a part of monitoring and oversight function of the Board. Capital adequacy level is regularly assessed and reviewed with approved bench mark of 20 percent as against regulatory requirement of 14 percent.
The higher level of bench marking is aimed at strengthening capital base of the Group, besides providing an impeccable buffer/ cushion to absorb and withstand against unexpected macro economic shocks and unexpected losses. It is also used to asses overall risk appetite of the Group that in turn will be used to asses credit, market and operational risk appetite.
44.1 Credit risk Credit risk is the risk that one party to a financial instrument will fail to discharge an obligation. The Group controls its credit risk by the following methods: – Monitoring credit exposures; – Evaluating transactions with specific counterparts; and – Assessing credit worthiness of counterparts.
Two sets of guidelines are followed by the management for managing credit risk. Operating policy approved by the Board of Directors and Prudential Regulations issued by State Bank of Pakistan.
The operating policy defines the extent of exposure with reference to a particular sector or group. The management also classi fied a particular financing on the basis of SBP guidelines.
40.3.2 Credit Exposures subject to Standardized approach
CRM= Credit Risk Mitigation
Exposures
Corporate
Banks
Unrated
418,353 2,599,551
7,750 13,417
593,990 331,961
-
9,172,046
13,137,068
883,135 1,059,786
126,804 818,392
185,622 80,884
84
10,812,677
13,967,384
RatingCategory
123,45,6
123
- - - -
- - -
-
-
- - - -
- - -
-
-
418,353 2,599,551
7,750 13,417
593,990 331,961
-
9,172,046
13,137,068
883,135 1,059,786
126,804 818,392
185,622 80,884
84
10,812,677
13,967,384
Exposures
Corporate Banks
JCR-VIS
xx
PACRA
xx
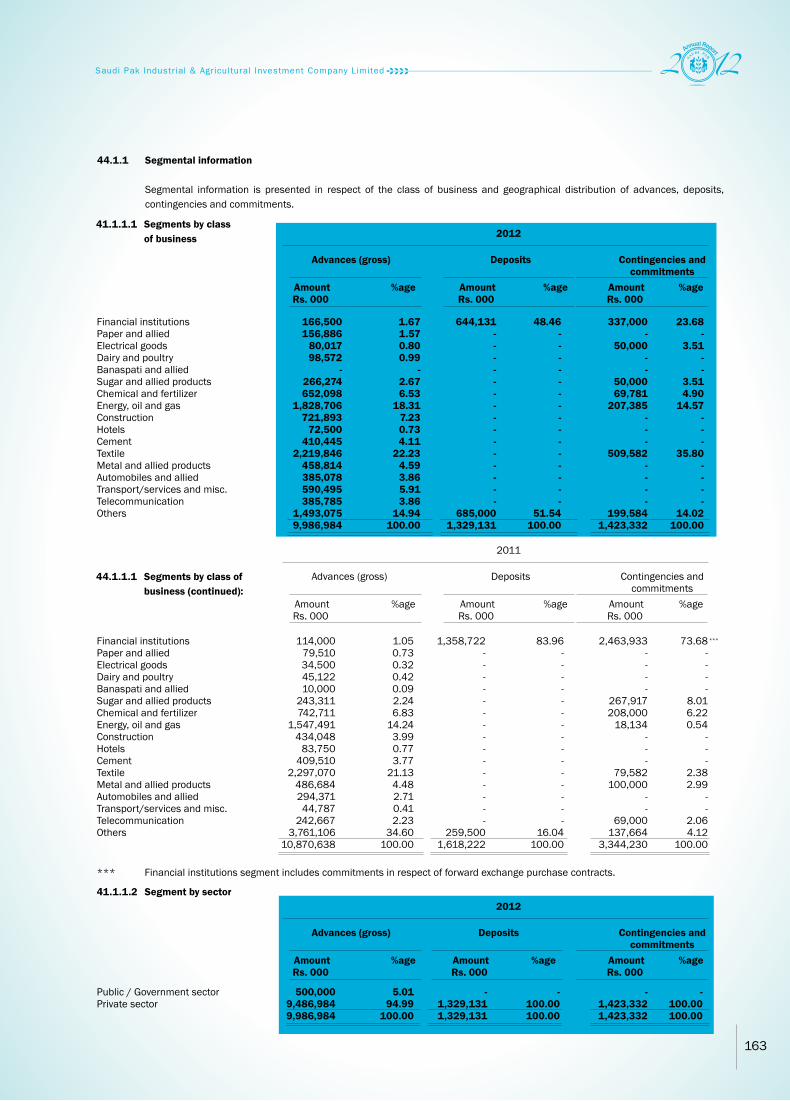
163
44.1.1 Segmental information Segmental information is presented in respect of the class of business and geographical distribution of advances, deposits,
contingencies and commitments. 41.1.1.1 Segments by class of business
44.1.1.1 Segments by class of business (continued):
Financial institutions Paper and alliedElectrical goodsDairy and poultryBanaspati and alliedSugar and allied productsChemical and fertilizerEnergy, oil and gasConstructionHotelsCementTextileMetal and allied productsAutomobiles and alliedTransport/services and misc.TelecommunicationOthers
Public / Government sectorPrivate sector
Financial institutions Paper and alliedElectrical goodsDairy and poultryBanaspati and alliedSugar and allied productsChemical and fertilizerEnergy, oil and gasConstructionHotelsCementTextileMetal and allied productsAutomobiles and alliedTransport/services and misc.TelecommunicationOthers
*** Financial institutions segment includes commitments in respect of forward exchange purchase contracts.
41.1.1.2 Segment by sector
166,500 156,886
80,017 98,572
- 266,274 652,098
1,828,706 721,893
72,500 410,445
2,219,846 458,814 385,078 590,495 385,785
1,493,075 9,986,984
500,000 9,486,984 9,986,984
114,000 79,510 34,500 45,122 10,000
243,311 742,711
1,547,491 434,048
83,750 409,510
2,297,070 486,684 294,371 44,787
242,667 3,761,106
10,870,638
1.67 1.57 0.80 0.99
- 2.67 6.53
18.31 7.23 0.73 4.11
22.23 4.59 3.86 5.91 3.86
14.94 100.00
5.01 94.99
100.00
1.05 0.73 0.32 0.42 0.09 2.24 6.83
14.24 3.99 0.77 3.77
21.13 4.48 2.71 0.41 2.23
34.60 100.00
644,131 - - - - - - - - - - - - - - -
685,000 1,329,131
- 1,329,131 1,329,131
1,358,722 - - - - - - - - - - - - - - -
259,500 1,618,222
48.46 - - - - - - - - - - - - - - -
51.54 100.00
- 100.00 100.00
83.96 - - - - - - - - - - - - - - -
16.04 100.00
337,000 -
50,000 - -
50,000 69,781
207,385 - - -
509,582 - - - -
199,584 1,423,332
- 1,423,332 1,423,332
2,463,933 - - - -
267,917 208,000
18,134 - - -
79,582 100,000
- -
69,000 137,664
3,344,230
23.68 -
3.51 - -
3.51 4.90
14.57 - - -
35.80 - - - -
14.02 100.00
- 100.00 100.00
73.68 - - - -
8.01 6.22 0.54
- - -
2.38 2.99
- -
2.06 4.12
100.00
Advances (gross)
Contingencies and commitments
Deposits
Amount Rs. 000
Amount Rs. 000
Amount Rs. 000
%age %age %age
2012
Advances (gross)
Contingencies and commitments
Deposits
Amount Rs. 000
Amount Rs. 000
Amount Rs. 000
%age %age %age
2012
Advances (gross)
Contingencies and commitments
Deposits
Amount Rs. 000
Amount Rs. 000
Amount Rs. 000
%age %age %age
2011
***

164
Classified advances
Rs. 000
Classified advances
Rs. 000
Profit before taxation
Rs. 000
Classified advances
Rs. 000
Classified advances
Rs. 000
Net assets employed
Rs. 000
Specific provisions
held
Rs. 000
Specific provisions
held
Rs. 000
Total assets employed
Rs. 000
Specific provisions
held
Rs. 000
Specific provisions
held
Rs. 000
Contingencies and commitments
Rs. 000
Financial institutionsPaper and alliedElectrical goodsDairy and poultryBanaspati and alliedSugar and allied productsChemical and fertilizerEnergy, oil and gasConstructionHotelsCementTextileMetal and metal productsAutomobiles and alliedTransport/servicesOthers
Public/Government sectorPrivate sector
PakistanAsia Pacific (including South Asia)EuropeUnited States of America and CanadaMiddle EastOthers
Public / Government sectorPrivate sector
44.1.1.3 Details of non-performing advances and specific provisions by class of business segment
41.1.1.4 Details of non-performing advances and specific provisions by sector
41.1.1.5 Geographical segment analysis
- 10,870,638 10,870,638
103,500 103,287
6,804 59,554 82,103 52,920 71,473
295,782 524,748 50,000
335,610 1,155,209
211,485 349,631 445,040 600,774
4,447,920
- 4,447,920 4,447,920
268,622 - - - - -
268,622
103,500 74,818
4,577 47,309 55,695 49,832 29,595
247,656 246,775
25,000 255,856 945,489 194,376 271,894 261,457 809,466
3,623,295
- 3,623,295 3,623,295
17,708,573 - - - - -
17,708,573
114,000 79,509 14,499 45,122 10,000 61,310 18,743
257,056 270,427 50,000
328,260 1,052,062
172,437 294,371 44,787
1,370,921 4,183,504
- 4,183,504 4,183,504
7,661,576 - - - - -
7,661,576
114,000 79,509 14,499 45,122 10,000 53,229 14,972
187,735 87,606 25,000
233,429 825,744 172,437 197,717 44,787
1,371,576 3,477,362
- 3,477,362 3,477,362
1,423,333 - - - - -
1,423,333
- 100.00 100.00
- 1,618,222 1,618,222
- 100.00 100.00
- 3,344,230 3,344,230
- 100.00 100.00
2012
2012
2012
2011
2011
Advances (gross)
Contingencies and commitments
Deposits
Amount Rs. 000
Amount Rs. 000
Amount Rs. 000
%age %age %age
2011

165
Loss before taxation
Rs. 000
Assets
2012Rs. 000
Net assets employed
Rs. 000
Off-balancesheet items2012
Rs. 000
Total assets employed
Rs. 000
Liabilities
2012Rs. 000
Contingencies and commitments
Rs. 000
Netcurrency exposure
2012Rs. 000
PakistanAsia Pacific (including South Asia)EuropeUnited States of America and CanadaMiddle EastOthers
44.1.1.5 Geographical segment analysis (continued)
Pakistan RupeeUnited States DollarGreat Britain PoundDeutsche MarkJapanese YenEuroOther currencies
44.2.2 Foreign Exchange risk (continued)
(1,747,686) - - - - -
(1,747,686)
17,678,795 29,779
- - - - -
17,708,574
17,324,720 - - - - -
17,324,720
10,046,997 - - - - - -
10,046,997
7,062,516 - - - - -
7,062,516
1,423,333 - - - - - -
1,423,333
3,344,230 - - - - -
3,344,230
6,208,465 29,779
- - - - -
6,238,244
2011
44.2 Market Risk
Market Risk is the risk of loss in earnings and capital due to adverse changes in interest rates, foreign exchange rates, equity prices and market conditions. Thus, the market risk can be further described into Interest Rate Risk, Foreign Exchange Risk and Equity Position Risk. Further, in respect of insurance business of the Group i.e., SPICL; insurance risk is also relevant as stated in note 44.2.4 below.
44.2.1 Interest rate risk
Interest rate risk is the risk that the value of the financial instrument will fluctuate due to changes in the market interest rates. The Group has formulated and developed interest rate risk policies, processes and procedural guidelines, proposing interest rate limits, credit spreads, gaps and duration limits between interest sensitive assets and interest sensitive liabilities, conducting gap analysis, determining the effects of mismatching positions across the range of maturities as well as identifying and maintaining the record of the transactions that would be treated as regarding trade book portfolio for the purpose of assigning market risk capital charge. Besides, the need and requirement of setting up an independent middle office is also being evaluated.
Risk management division is responsible for conducting independent review of interest rate sensitive assets, and liabilities, monitoring of interest rate and gap limits, reporting breaches and conducting stress testing on the lines advised by SBP.
44.2.2 Foreign exchange risk Foreign exchange risk is that our net investment in foreign currency change in value through adverse effects of currency
movements. The risk is very nominal because of the nature of the existing operations of the Group and is primarily attributable to the
foreign currency assets, held in the form of foreign currency deposits with other banks and deposit through SWAP and other hedging measures depending upon open market conditions. The Group manages its foreign exchange risk by keeping the data on foreign currency assets and liabilities, proposing limits, planning and determining yield as well as hedging the risk in the case of adverse movement in currency exchange rates and identifies the transactions which will be subject to market risk capital charge.

166
Assets
2011Rs. 000
Off-balancesheet items2011
Rs. 000
Liabilities
2011Rs. 000
Netcurrency exposure
2011Rs. 000
Pakistan RupeeUnited States DollarGreat Britain PoundDeutsche MarkJapanese YenEuroOther currencies
41.2.2 Foreign Exchange risk
17,296,080 28,640
- - - - -
17,324,721
10,262,204 - - - - - -
10,262,204
880,297 2,463,933
- - - - -
3,344,230
6,153,580 (2,435,293)
- - - - -
3,718,287
44.2.3 Equity position Risk
The Group has established a Portfolio Management Department which is responsible for origination, conducting , ap-praisal of equity investment proposals, proposing business appetite and tolerance levels, getting approval of various limits, determining target market and products, updating approval process within and beyond approved limits, proposing and implementing emergency measures dealing with market fluctuations, handling day to day matters of the equity portfolio and maintaining relevant record and information as well as handling day to day matters with brokers, clients and scrips.
44.2.4 Insurance risk
– The SPICL accepts the insurance risk through its insurance contracts where it assumes the risk of loss from persons
or organizations that are directly subject to the underlying loss. The SPICL is exposed to the uncertainty surrounding the timing, frequency and severity of claims under these contracts.
– The SPICL manages its risk through its underwriting and reinsurance strategy within an overall risk management. Reinsurance is purchased to mitigate the effect of potential loss to the SPICL from individual, large or catastrophic events and also to provide access to specialist risks and to assist in managing capital. Insurance policies are written with approved reinsurers on either a proportional or excess of loss treaty basis.
– A concentration of risk may also arise from a single insurance contract issued to a particular demographic type of a policyholder, within a geographical location or types of commercial business. The SPICL minimizes its exposure to significant losses by obtaining reinsurance from a number of reinsurers, who are dispersed over several geographical regions and minimizes its exposure to significant losses by obtaining reinsurance from a number of reinsurers, who are dispersed over several geographical regions.
Geographical concentration of insurance risk
– To optimize benefits from the principle of average and law of large numbers, geographical spread of risk is of extreme
importance. There are a number of parameters which are significant in assessing the accumulation of risk with refer-ence to the geographical location, the most important of which is risk survey.
– Risk surveys are carried out on a regular basis for the evaluation of physical hazard associated with the commercial/industrial/residential occupation of the insured. Details regarding the fire separation/segregation with respect to the manufacturing processes, storage, utilities etc are extracted from the layout plan of the insured facility. Such details are formed part of the reports which are made available to the underwriters/reinsurance personnel for their evalua-tion. Reference is made to the standard construction specification as laid down by IAP (Insurance Association of Paki-stan). For instance, the presence of Perfect Party Walls, Double Fire Proof Iron Doors and Physical Separation between the building within an insured’s premises. It is basically the property contained within an area which is separated by another property by sufficient distance to confine insured damage from uncontrolled fire and explosion under the most adverse conditions to that one area.
– Keeping in view the maximum exposure in respect of key zone aggregates, number of proportional and non propor-tional reinsurance arrangement are in place to protect the net account in case of a major catastrophic event. Apart from the adequate event limit which is a multiple of the treaty capacity or the primary recovery from the proportional treaty, any loss over and above the said limit would be recovered from the non-proportional treaty which is very much in line with the risk management philosophy of the SPICL.
– In compliance of the regulatory requirement, the reinsurance agreements are duly submitted with SECP on an annual basis.
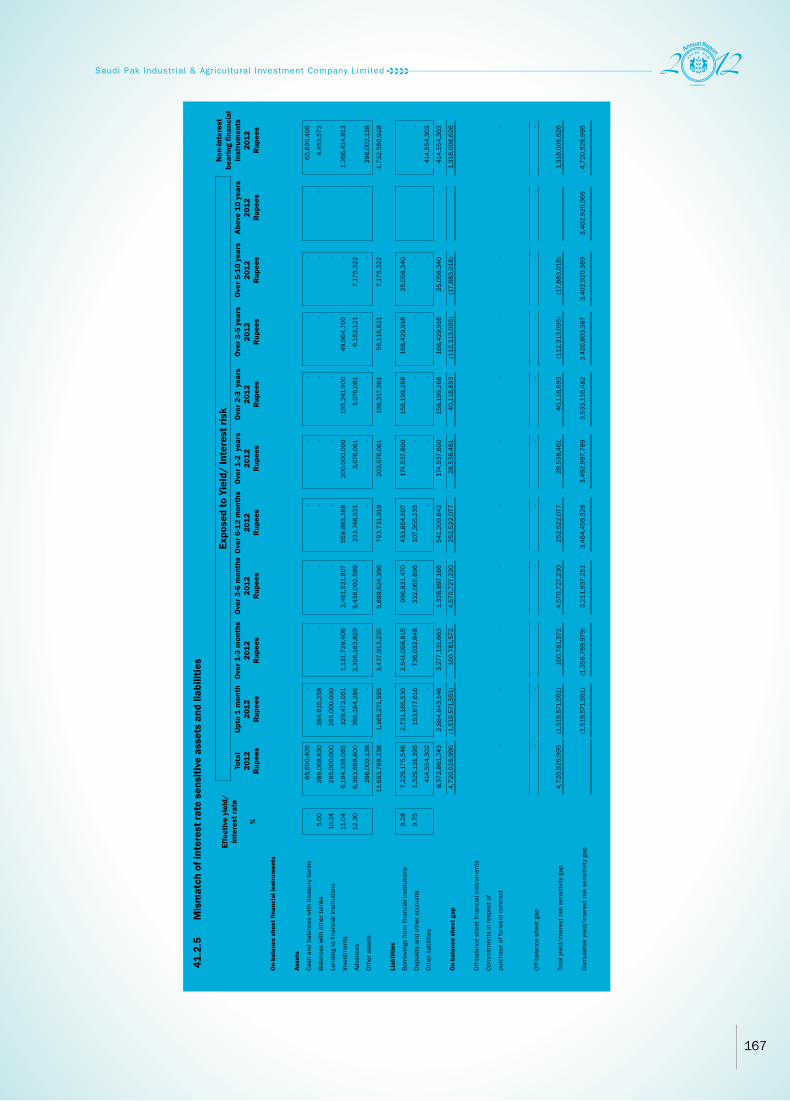
167
On-
bala
nce
shee
t fina
ncia
l ins
trum
ents
Asse
ts
Cash
and
bal
ance
s w
ith tr
easu
ry b
anks
Bala
nces
with
oth
er b
anks
Lend
ing
to fi
nanc
ial i
nstit
utio
ns
Inve
stm
ents
Adva
nces
Othe
r ass
ets
Liab
ilitie
s
Borro
win
gs fr
om fi
nanc
ial i
nstit
utio
ns
Dep
osits
and
oth
er a
ccou
nts
Othe
r lia
bilit
ies
On-
bala
nce
shee
t gap
Off-b
alan
ce s
heet
fina
ncia
l ins
trum
ents
Com
mitm
ents
in re
spec
t of
purc
hase
of f
orw
ard
cont
ract
Off-b
alan
ce s
heet
gap
Tota
l yie
ld/i
nter
est r
isk
sens
itivi
ty g
ap
Cum
ulat
ive
yiel
d/in
tere
st ri
sk s
ensi
tivity
gap
41.2
.5
Mis
mat
ch o
f int
eres
t rat
e se
nsiti
ve a
sset
s an
d lia
bilit
ies
-
5.0
0
10.2
4
11.
04
12.
30 -
9.2
8
9.7
5 -
65,
690,
405
389
,068
,830
285
,000
,000
6,1
94,3
38,0
65
6,3
63,6
88,8
00
396
,002
,138
13,6
93,7
88,2
38
7,2
29,1
75,5
46
1,3
29,1
31,3
95
414
,554
,302
8,9
72,8
61,2
43
4,7
20,9
26,9
95 - -
4,7
20,9
26,9
95 -
-
384
,615
,258
285
,000
,000
329
,472
,051
366
,184
,286
-
1,3
65,2
71,5
95
2,7
31,1
65,5
30
153
,677
,616
-
2,8
84,8
43,1
46
(1,5
19,5
71,5
51) - -
(1,5
19,5
71,5
51)
(1,5
19,5
71,5
51)
- - -
1,1
31,7
29,4
06
2,3
06,1
83,8
29 -
3,43
7,91
3,23
5
2,5
41,0
98,8
15
736
,032
,848
-
3,2
77,1
31,6
63
160
,781
,572
- -
160
,781
,572
(1,3
58,7
89,9
79)
- - -
2,4
61,5
31,8
07
3,4
38,0
92,5
89 -
5,8
99,6
24,3
96
996
,831
,470
332
,065
,696
-
1,3
28,8
97,1
66
4,5
70,7
27,2
30 - -
4,5
70,7
27,2
30
3,2
11,9
37,2
51
- - -
559
,983
,388
233
,748
,531
-
793
,731
,919
433
,854
,607
107
,355
,235
-
541
,209
,842
252
,522
,077
- -
252
,522
,077
3,4
64,4
59,3
28
- - -
200
,000
,000
3,0
76,0
61 -
203
,076
,061
174
,537
,600
- -
174
,537
,600
28,
538,
461 - -
28,
538,
461
3,4
92,9
97,7
89
- - -
195
,241
,900
3,0
76,0
61 -
198
,317
,961
158
,199
,268
- -
158
,199
,268
40,
118,
693 - -
40,
118,
693
3,5
33,1
16,4
82
- - -
49,
964,
700
6,1
52,1
21 -
56,
116,
821
168
,429
,916
- -
168
,429
,916
(112
,313
,095
) - -
(112
,313
,095
)
3,4
20,8
03,3
87
- - - -
7,1
75,3
22 -
7,1
75,3
22
25,
058,
340 - -
25,
058,
340
(17,
883,
018) - -
(17,
883,
018)
3,4
02,9
20,3
69
- - - - - - - - - - - - - - -
3,4
02,9
20,3
69
65,
690,
405
4,4
53,5
72 -
1,2
66,4
14,8
13 -
396
,002
,138
1,7
32,5
60,9
28 - -
414
,554
,302
414
,554
,302
1,3
18,0
06,6
26 - -
1,3
18,0
06,6
26
4,7
20,9
26,9
95
Expo
sed
to Y
ield
/ In
tere
st ri
skEf
fect
ive
yiel
d/
inte
rest
rate
%
Tota
l20
12R
upee
s
Upt
o 1
mon
th20
12R
upee
s
Ove
r 1-3
mon
ths
2012
Rup
ees
Ove
r 3-6
mon
ths
2012
Rup
ees
Ove
r 6-1
2 m
onth
s20
12R
upee
s
Ove
r 1-2
yea
rs20
12R
upee
s
Ove
r 2-3
yea
rs20
12R
upee
s
Ove
r 3-5
yea
rs20
12R
upee
s
Ove
r 5-1
0 ye
ars
2012
Rup
ees
Abov
e 10
yea
rs20
12R
upee
s
Non
-inte
rest
be
arin
g fin
anci
al
inst
rum
ents
20
12R
upee
s

168
Expo
sed
to Y
ield
/ In
tere
st ri
skEf
fect
ive
yiel
d/
inte
rest
rate
%To
tal
2011
Rupe
es
Upto
1 m
onth
2011
Rupe
es
Over
1-3
mon
ths
2011
Rupe
es
Over
3-6
mon
ths
2011
Rupe
es
Over
6-1
2 m
onth
s20
11Ru
pees
Over
1-2
yea
rs20
11Ru
pees
Over
2-3
yea
rs20
11Ru
pees
Over
3-5
yea
rs20
11Ru
pees
Over
5-1
0 ye
ars
2011
Rupe
es
Abov
e 10
yea
rs20
11Ru
pees
Non
-inte
rest
be
arin
g fin
anci
al
inst
rum
ents
20
11Ru
pees
On-
bala
nce
shee
t fina
ncia
l ins
trum
ents
Asse
ts
Cash
and
bal
ance
s w
ith tr
easu
ry b
anks
Bala
nces
with
oth
er b
anks
Lend
ing
to fi
nanc
ial i
nstit
utio
ns
Inve
stm
ents
Adva
nces
Othe
r ass
ets
Liab
ilitie
s
Borro
win
gs fr
om fi
nanc
ial i
nstit
utio
ns
Dep
osits
and
oth
er a
ccou
nts
Othe
r lia
bilit
ies
On-
bala
nce
shee
t gap
Off
-bal
ance
she
et fi
nanc
ial i
nstr
umen
ts
Com
mitm
ents
in re
spec
t of
purc
hase
of f
orw
ard
cont
ract
Off
-bal
ance
she
et g
ap
Tota
l yie
ld/i
nter
est r
isk
sens
itivi
ty g
ap
Cum
ulat
ive
yiel
d/in
tere
st ri
sk s
ensi
tivity
gap
44.2
.5
Mis
mat
ch o
f int
eres
t rat
e se
nsiti
ve a
sset
s an
d lia
bilit
ies
(con
tinue
d)
0.0
1
5.0
0
12.
81
13.
25
14.
51 -
11.
49
13.
04 -
56,
121,
319
193
,655
,011
171
,111
,111
5,1
01,8
79,2
96
7,3
93,2
76,0
79
734
,338
,242
13,6
50,3
81,0
58
7,0
64,5
77,4
11
1,6
18,2
21,6
71
539
,204
,915
9,2
22,0
03,9
97
4,4
28,3
77,0
61
2,4
63,9
33,0
00
2,4
63,9
33,0
00
1,9
64,4
44,0
61 -
128
,478
162
,804
,705
170
,000
,000
401
,663
,324
499
,580
,304
-
1,2
34,1
76,8
11
1,9
56,7
72,9
37
596
,560
,139
-
2,5
53,3
33,0
76
(1,3
19,1
56,2
65) - -
(1,3
19,1
56,2
65)
(1,3
19,1
56,2
65)
- - -
1,5
96,1
49,1
56
2,0
64,7
58,1
58 -
3,66
0,90
7,31
4
2,3
52,3
69,2
68
363
,120
,278
-
2,7
15,4
89,5
46
945
,417
,768
- -
945
,417
,768
(373
,738
,497
)
- -
1,1
11,1
11
577
,317
,308
3,7
38,8
85,4
95 -
4,3
17,3
13,9
14
1,0
59,1
97,1
20
224
,680
,417
-
1,2
83,8
77,5
37
3,0
33,4
36,3
77 - -
3,0
33,4
36,3
77
2,6
59,6
97,8
80
- - -
576
,159
,548
1,0
82,8
36,2
30 -
1,6
58,9
95,7
78
908
,405
,160
433
,860
,837
-
1,3
42,2
65,9
97
316
,729
,781
- -
316
,729
,781
2,9
76,4
27,6
61
- - -
33,
899,
628
7,2
15,8
92 -
41,
115,
520
128
,840
,728
- -
128
,840
,728
(87,
725,
208) - - -
(87,
725,
208)
2,8
88,7
02,4
53
- - -
233
,899
,628
- -
233
,899
,628
83,
377,
166 - -
83,
377,
166
150
,522
,462
- -
150
,522
,462
3,0
39,2
24,9
15
- - -
260
,424
,985
- -
260
,424
,985
168
,362
,164
- -
168
,362
,164
92,
062,
821 - -
92,
062,
821
3,1
31,2
87,7
36
- - - - - - -
407
,252
,868
- -
407
,252
,868
(407
,252
,868
) - -
(407
,252
,868
)
2,7
24,0
34,8
68
- - - - - - - - - - - - - - -
2,7
24,0
34,8
68
55,
992,
841
30,
850,
306 -
1,4
22,3
65,7
19 -
734
,338
,242
2,2
43,5
47,1
08 - -
539
,204
,915
539
,204
,915
1,7
04,3
42,1
93
2,4
63,9
33,0
00
2,4
63,9
33,0
00
(759
,590
,807
)
1,9
64,4
44,0
61

169
44.3
Li
quid
ity ri
sk
Li
quid
ity ri
sk is
the
risk
the
Gro
up’s
ear
ning
s an
d ca
pita
l due
to G
roup
’s in
abili
ty to
mee
t its
liab
ilitie
s w
hen
they
bec
ome
due.
The
Gro
up is
taki
ng c
are
of th
is ri
sk b
y:
-
man
agin
g liq
uidi
ty p
ositi
on th
roug
h As
sets
& L
iabi
lity
Man
agem
ent C
omm
ittee
.
-
mai
ntai
ning
ade
quat
e le
vel o
f liq
uidi
ty to
mee
t its
obl
igat
ion
at a
ny p
oint
of t
ime.
44.3
.1
Mat
uriti
es o
f ass
ets
and
liabi
litie
s
Asse
ts
Cash
and
bal
ance
s w
ith tr
easu
ry b
anks
Bala
nces
with
oth
er b
anks
Non
-cur
rent
ass
et c
lass
ified
as
held
for s
ale
Lend
ing
to fi
nanc
ial i
nstit
utio
ns
Inve
stm
ents
Adva
nces
Oper
atin
g fix
ed a
sset
s
Dev
elop
men
t pro
pert
ies
Othe
r Ass
ets
Liab
ilitie
s
Borro
win
gs
Dep
osits
and
oth
er a
ccou
nts
Unde
rwrit
ing
prov
isio
n
Def
erre
d ta
x lia
bilit
ies
Othe
r Lia
bilit
ies
Net
ass
ets
Shar
e ca
pita
l
Rese
rves
Unap
prop
riate
d lo
ss
Non
-con
trolli
ng in
tere
st
Surp
lus
on re
valu
atio
n of
ass
ets
65,
690,
405
389
,068
,830
96,
618,
462
285
,000
,000
6,1
94,3
38,0
65
6,3
63,6
88,8
00
2,6
12,6
87,7
10
184
,673
,844
1,5
16,8
07,2
75
17,
708,
573,
391
7,2
29,1
75,5
46
1,3
29,1
31,3
95 -
985
,335
,693
503
,354
,689
10,0
46,9
97,3
23
7,6
61,5
76,0
68
6,0
00,0
00,0
00
536
,440
,467
84,
133,
858
(644
,095
,429
)
1,6
85,0
97,1
71
7,6
61,5
76,0
67
65,
690,
405
389
,068
,830
4,0
25,7
69
250
,000
,000
329
,815
,804
272
,716
,012
27,
596,
850
15,
389,
487
274
,070
,314
1,6
28,3
73,4
71
2,6
22,5
28,3
17
153
,677
,617
-
20,
059,
475
102
,676
,153
2,8
98,9
41,5
62
(1,2
70,5
68,0
91) - - - - - -
- -
8,0
51,5
39 -
831
,006
,888
975
,958
,831
55,
193,
701
30,
778,
974
178
,082
,291
2,0
79,0
72,2
24
523
,824
,389
736
,032
,851
-
40,
118,
949
85,
378,
878
1,3
85,3
55,0
67
693
,717
,157
- - - - - -
- -
12,
077,
308
35,
000,
000
1,4
73,5
51,2
31
512
,150
,576
82,
790,
551
46,
168,
461
132
,147
,006
2,2
93,8
85,1
33
1,0
95,0
08,1
92
332
,065
,702
-
82,
592,
804
185
,682
,261
1,6
95,3
48,9
59
598
,536
,174
- - - - - -
- -
24,
154,
616 -
1,4
94,4
47,1
35
1,4
74,7
79,7
33
165
,581
,102
92,
336,
922
932
,507
,664
4,1
83,8
07,1
72
988
,307
,620
107
,355
,225
-
97,
942,
467
112
,716
,056
1,3
06,3
21,3
68
2,8
77,4
85,8
04 - - - - - -
- -
48,
309,
230 -
430
,858
,827
1,3
66,8
33,5
78
102
,219
,843
- -
1,9
48,2
21,4
78
735
,266
,904
- -
35,
487,
377 -
770
,754
,281
1,1
77,4
67,1
97 - - - - - -
- - - -
401
,306
,823
658
,211
,933
102
,219
,837
- -
1,1
61,7
38,5
93
549
,293
,224
- -
35,
487,
377 -
584
,780
,601
576
,957
,992
- - - - - -
- - - -
342
,188
,752
719
,032
,998
200
,927
,584
- -
1,2
62,1
49,3
34
689
,888
,560
- -
70,
974,
754
4,8
28,9
26
765
,692
,240
496
,457
,094
- - - - - -
- - - -
891
,162
,605
384
,005
,139
305
,574
,435
- -
1,5
80,7
42,1
79
25,
058,
340 - -
177
,436
,885
12,
072,
315
214
,567
,540
1,3
66,1
74,6
39 - - - - - -
- - - - - -
1,5
70,5
83,8
07 - -
1,5
70,5
83,8
07 - - -
425
,235
,605
-
425
,235
,605
1,1
45,3
48,2
02 - - - - - -
Tota
l
2012
Rup
ees
Upt
o 1
mon
th20
12R
upee
s
Ove
r 1 -
3 m
onth
s20
12R
upee
s
Ove
r 3 -
6 m
onth
s20
12R
upee
s
Ove
r 6 -
12
mon
ths
2012
Rup
eesM A
T U
R I
T I E
S
Ove
r 1
- 2
ye
ars
2012
Rup
ees
Ove
r 2
- 3
year
s20
12R
upee
s
Ove
r 3-5
year
s20
12R
upee
s
Ove
r 5-1
0
year
s20
12R
upee
s
Abov
e 10
ye
ars
2012
Rup
ees
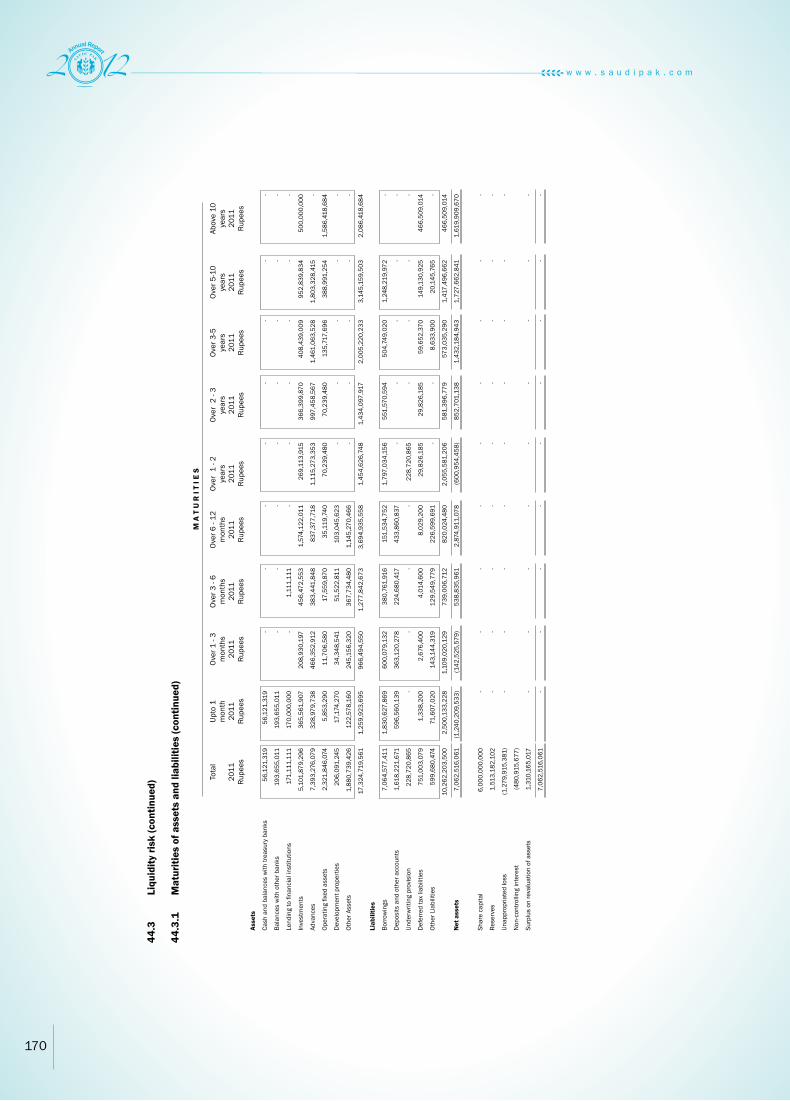
170
Asse
ts
Cash
and
bal
ance
s w
ith tr
easu
ry b
anks
Bala
nces
with
oth
er b
anks
Lend
ing
to fi
nanc
ial i
nstit
utio
ns
Inve
stm
ents
Adva
nces
Oper
atin
g fix
ed a
sset
s
Dev
elop
men
t pro
pert
ies
Othe
r Ass
ets
Liab
ilitie
s
Borro
win
gs
Dep
osits
and
oth
er a
ccou
nts
Unde
rwrit
ing
prov
isio
n
Def
erre
d ta
x lia
bilit
ies
Othe
r Lia
bilit
ies
Net
ass
ets
Shar
e ca
pita
l
Rese
rves
Unap
prop
riate
d lo
ss
Non
-con
trolli
ng in
tere
st
Surp
lus
on re
valu
atio
n of
ass
ets
44.3
Li
quid
ity ri
sk (c
ontin
ued)
44
.3.1
M
atur
ities
of a
sset
s an
d lia
bilit
ies
(con
tinue
d)
56,
121,
319
193
,655
,011
171
,111
,111
5,1
01,8
79,2
96
7,3
93,2
76,0
79
2,3
21,8
46,0
74
206
,091
,245
1,8
80,7
39,4
26
17,
324,
719,
561
7,0
64,5
77,4
11
1,6
18,2
21,6
71
228
,720
,865
751
,003
,079
599
,680
,474
10,2
62,2
03,5
00
7,0
62,5
16,0
61
6,0
00,0
00,0
00
1,5
13,1
82,1
02
(1,2
79,9
15,3
81)
(480
,915
,677
)
1,3
10,1
65,0
17
7,0
62,5
16,0
61
56,
121,
319
193
,655
,011
170
,000
,000
365
,561
,907
328
,979
,738
5,8
53,2
90
17,
174,
270
122
,578
,160
1,2
59,9
23,6
95
1,8
30,6
27,8
69
596
,560
,139
-
1,3
38,2
00
71,
607,
020
2,5
00,1
33,2
28
(1,2
40,2
09,5
33) - - - - -
- - -
208
,930
,197
466
,352
,912
11,
706,
580
34,
348,
541
245
,156
,320
966
,494
,550
600
,079
,132
363
,120
,278
-
2,6
76,4
00
143
,144
,319
1,1
09,0
20,1
29
(142
,525
,579
) - - - - -
- -
1,1
11,1
11
456
,472
,553
383
,441
,848
17,
559,
870
51,
522,
811
367
,734
,480
1,2
77,8
42,6
73
380
,761
,916
224
,680
,417
-
4,0
14,6
00
129
,549
,779
739
,006
,712
538
,835
,961
- - - - -
- - -
1,5
74,1
22,0
11
837
,377
,718
35,
119,
740
103
,045
,623
1,1
45,2
70,4
66
3,6
94,9
35,5
58
151
,534
,752
433
,860
,837
-
8,0
29,2
00
226
,599
,691
820
,024
,480
2,8
74,9
11,0
78 - - - - -
- - -
269
,113
,915
1,1
15,2
73,3
53
70,
239,
480 - -
1,4
54,6
26,7
48
1,7
97,0
34,1
56 -
228
,720
,865
29,
826,
185 -
2,0
55,5
81,2
06
(600
,954
,458
) - - - - -
- - -
366
,399
,870
997
,458
,567
70,
239,
480 - -
1,4
34,0
97,9
17
551
,570
,594
- -
29,
826,
185 -
581
,396
,779
852
,701
,138
- - - - -
- - -
408
,439
,009
1,4
61,0
63,5
28
135
,717
,696
- -
2,0
05,2
20,2
33
504
,749
,020
- -
59,
652,
370
8,6
33,9
00
573
,035
,290
1,4
32,1
84,9
43 - - - - -
- - -
952
,839
,834
1,8
03,3
28,4
15
388
,991
,254
- -
3,1
45,1
59,5
03
1,2
48,2
19,9
72 - -
149
,130
,925
20,
145,
765
1,4
17,4
96,6
62
1,7
27,6
62,8
41 - - - - -
- - -
500
,000
,000
-
1,5
86,4
18,6
84 - -
2,0
86,4
18,6
84 - - -
466
,509
,014
-
466
,509
,014
1,6
19,9
09,6
70 - - - - -
Tota
l
2011
Rupe
es
Upto
1
m
onth
2011
Rupe
es
Over
1 -
3 m
onth
s20
11Ru
pees
Over
3 -
6 m
onth
s20
11Ru
pees
Over
6 -
12
mon
ths
2011
Rupe
es
M A
T U
R I
T I E
S
Over
1 -
2
ye
ars
2011
Rupe
es
Over
2 -
3 ye
ars
2011
Rupe
es
Over
3-5
year
s20
11Ru
pees
Over
5-1
0
year
s20
11Ru
pees
Abov
e 10
ye
ars
2011
Rupe
es

171
44.4 OPERATIONAL RISK Operational Risk is the risk of losses due to failure of internal control process, disasters and infrastructure failure, known errors,
fraud, in adequate documentation, technology etc. The Group controls its operational risk by the following techniques:
– by using adequate internal control system;
– by ensuring adherence to prudential regulations, and own operating policies approved by the Board of Directors; and
– by putting in place business continuity plan and disaster recovery program.
Operational Risk Disclosures Basel II
The Group’s approach in managing operational risk is to adopt practices that are for the purpose to suit the organizational maturity
and particular environments in which our business operates. Operational risk management has been well established to increase the efficiency and effectiveness of the Group’s resources, minimize losses and utilize opportunities.
45 CREDIT RATING The Company’s rating has been assessed by JCR-VIS Credit Rating Company Limited as follows:
Long Term AA (Double A) Short Term A1+ (A one Plus) Outlook Stable 46 GENERAL 46.1 Figures in these consolidated financial statements have been rounded off to the nearest rupee, except as otherwise stated.
47 DATE OF AUTHORIZATION FOR ISSUE
These consolidated financial statements were authorized for issue on 29 April 2013 by the Board of Directors of the Saudi Pak
Industrial and Agricultural Investment Company Limited.
CHIEF EXECUTIVE DIRECTOR DIRECTOR CHAIRMAN

Notes