Regional Update North America Air Traffic and Airlines ACI World Economic Committee January 24, 2008...
20
Regional Update North America Air Traffic and Airlines ACI World Economic Committee January 24, 2008 Leo Fermin San Francisco International Airport
Transcript of Regional Update North America Air Traffic and Airlines ACI World Economic Committee January 24, 2008...
Regional UpdateNorth America
Air Traffic and Airlines
ACI World Economic CommitteeJanuary 24, 2008
Leo FerminSan Francisco International Airport
2
Outline
Air Traffic Growth in 2007
Expectations for 2008
State of the Industry

3
Air Traffic Growth in 2007
Expectations for 2008
State of the Industry
4
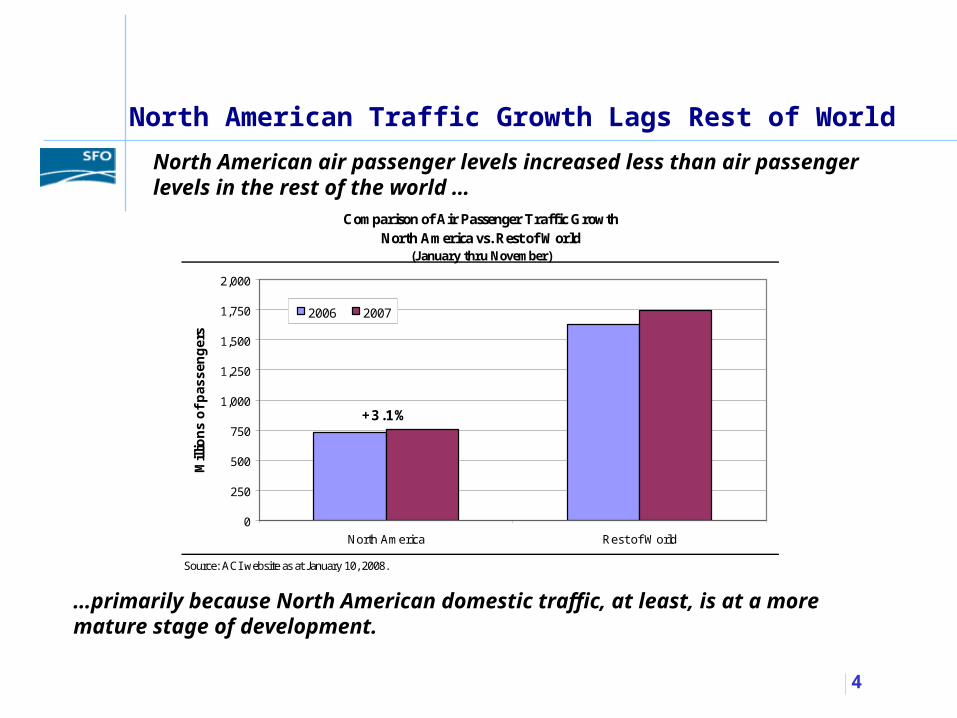
North American air passenger levels increased less than air passengerlevels in the rest of the world …
North American Traffic Growth Lags Rest of World
…primarily because North American domestic traffic, at least, is at a more mature stage of development.
Comparison of Air Passenger Traffic GrowthNorth America vs. Rest of World
(January thru November)
Source: ACI website as at January 10, 2008.
0
250
500
750
1,000
1,250
1,500
1,750
2,000
North America Rest of World
Mill
ion
s o
f p
as
sen
ger
s
2006 2007
+3.1%
+7.1%
5
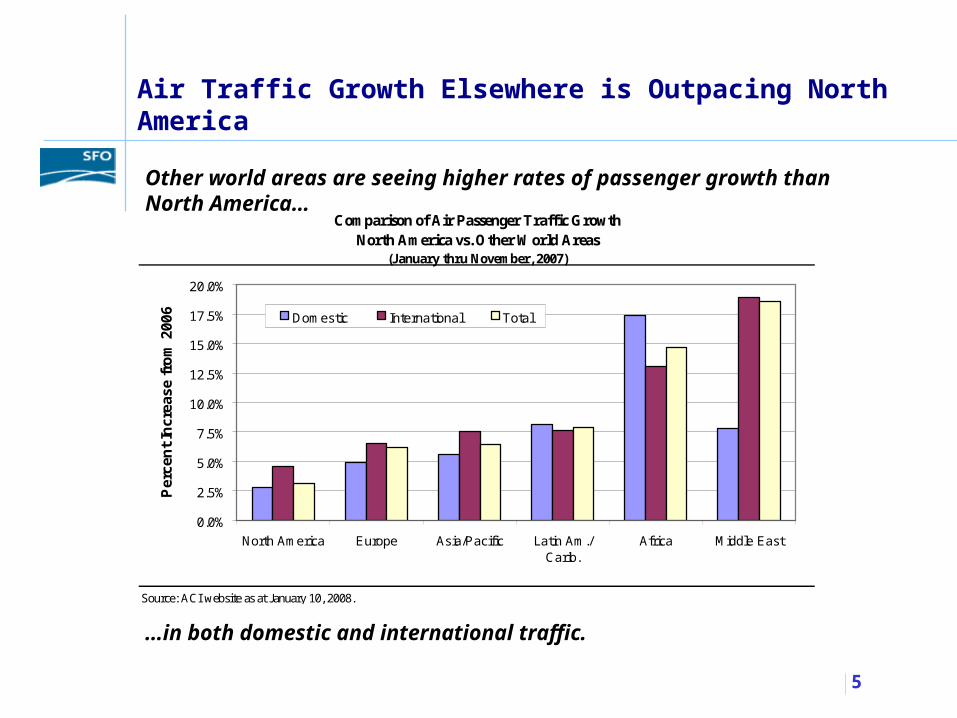
Other world areas are seeing higher rates of passenger growth than North America…
Air Traffic Growth Elsewhere is Outpacing North America
…in both domestic and international traffic.
Comparison of Air Passenger Traffic GrowthNorth America vs. Other World Areas
(January thru November, 2007)
Source: ACI website as at January 10, 2008.
0.0%
2.5%
5.0%
7.5%
10.0%
12.5%
15.0%
17.5%
20.0%
North America Europe Asia/Pacific Latin Am./Carib.
Africa Middle East
Pe
rcen
t In
cre
ase
fro
m 2
006 Domestic International Total
6
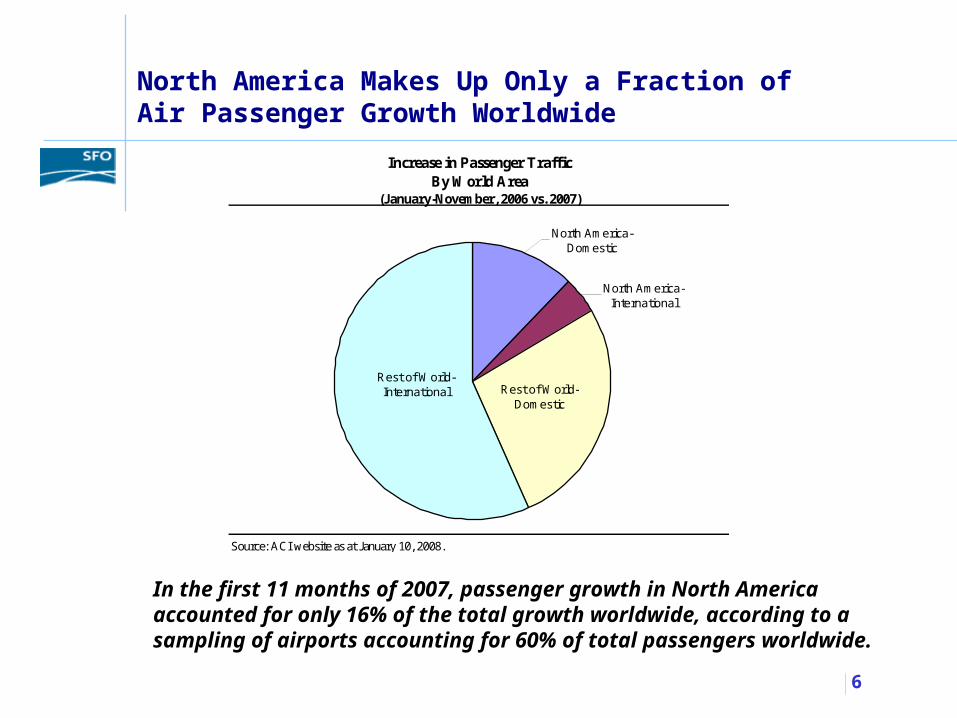
North America Makes Up Only a Fraction of Air Passenger Growth Worldwide
In the first 11 months of 2007, passenger growth in North America accounted for only 16% of the total growth worldwide, according to a sampling of airports accounting for 60% of total passengers worldwide.
Increase in Passenger TrafficBy World Area
(January-November, 2006 vs. 2007)
Source: ACI website as at January 10, 2008.
North America-Domestic
North America-International
Rest of World-International Rest of World-
Domestic
7
Key Reasons for Slower U.S. Air Traffic Growth in 2007Compared to Other Areas of the World
U.S. ECONOMY
• The U.S. economy slowed in 2007, following a surge in global energy prices, some reining in of consumer purchasing power, a correction in the housing market, and problems in the home mortgage and consumer credit markets. In 2008, continued slow GDP growth is expected, amid lessened consumer spending and business investment
• The value of the U.S. dollar has slipped versus most foreign currencies, making international travel more expensive for Americans, but making travel to the U.S. more affordable for others.

8
Key Reasons for Slower U.S. Air Traffic Growth in 2007Compared to Other Areas of the World – con’t.
U.S. AIR TRAVEL MARKET
• The U.S. domestic market is relatively mature, having already experienced considerable fare and service stimulation. Many other world areas, however, are now experiencing those stimulative effects.
• The airport security “hassle factor,” which is tending to cause the U.S. to be perceived as a difficult place to travel to or through, is inhibiting international air travel. Domestic air traffic has also been affected. Air trips under 300 miles, for example, have given way largely to surface travel and have not recovered from the post-9/11 drop.
9
Key Reasons for Slower U.S. Air Traffic Growth in 2007Compared to Other Areas of the World – con’t.
U.S. DOMESTIC AIRLINE INDUSTRY
• Sharp domestic fare increases suppressed U.S. traffic growth in 2006. Fare increases continued in 2007, but were more modest.
• The legacy airlines, in particular, exhibited capacity discipline in 2006 in an effort to restore profitability. The result was a broad decline in capacity, and load factors rose to all-time highs. Limited capacity growth by the U.S. legacy carriers occurred in 2007. Many airlines have signaled capacity declines in 2008, which could cause fares to rise further and continue to limit traffic growth.
• Low-cost carriers are approaching 30 percent of the U.S. market. Most major markets are served by at least one low-cost carrier, and some by more than one. Hence, traffic has already been stimulated by low fares in most U.S. domestic markets.

10
U.S. Passenger Growth in 2007: Forecast vs. Actual
Forecast by Federal Aviation Administration, published in March 2007, for federal fiscal year ending September 30.
Actual traffic from Bureau of Transportation Statistics.
While U.S. domestic air passengers did not meet the FAA forecast in 2007…
…U.S. international passengers exceeded FAA expectations.
Increase in Passengersfrom FFY 2006
FAA Forecast Actual
U.S. Domestic 3.7% 3.1%
U.S. International 4.7% 5.1%
Total U.S. 3.8% 3.3%
11
Air Traffic Growth in 2007
Expectations for 2008
State of the Industry

12
Total U.S. departing seats are growing at a diminishing rate…
U.S. Seat Capacity Growth is Decelerating
…and U.S. domestic capacity is scheduled to decline in the spring.
Change in Total Scheduled Departing Seats by Sectorvs. Corresponding Quarter of Previous Year
U.S. Airports1
Source: Official Airline Guide .
Note: 1. Includes airports in Alaska, Hawaii, U.S. Virgin Islands, and Puerto Rico, but not inthe islands of the U.S. Pacific Trust.
-1.0%
0.0%
1.0%
2.0%
3.0%
4.0%
5.0%
6.0%
Jul-Sep '07 Oct-Dec '07 Jan-Mar '08 Apr-Jun '08
Per
cen
t In
crea
se
Domestic International Total

13
U.S. Domestic Seat Capacity Showing Declining Trend
Although low-cost carriers (LCCs) continue to add domestic capacity…
…seats offered by the network and other carriers are declining.
Change in Domestic Scheduled Departing Seats by Type of Carriervs. Corresponding Quarter of Previous Year
U.S. Airports1
Source: Official Airline Guide .
Note: 1. Includes airports in Alaska, Hawaii, U.S. Virgin Islands, and Puerto Rico, but not in
the islands of the U.S. Pacific Trust.
-4.0%
-2.0%
0.0%
2.0%
4.0%
6.0%
8.0%
10.0%
Jul-Sep '07 Oct-Dec '07 Jan-Mar '08 Apr-Jun '08
Per
cen
t In
crea
se
LCC Network & Other Total
14
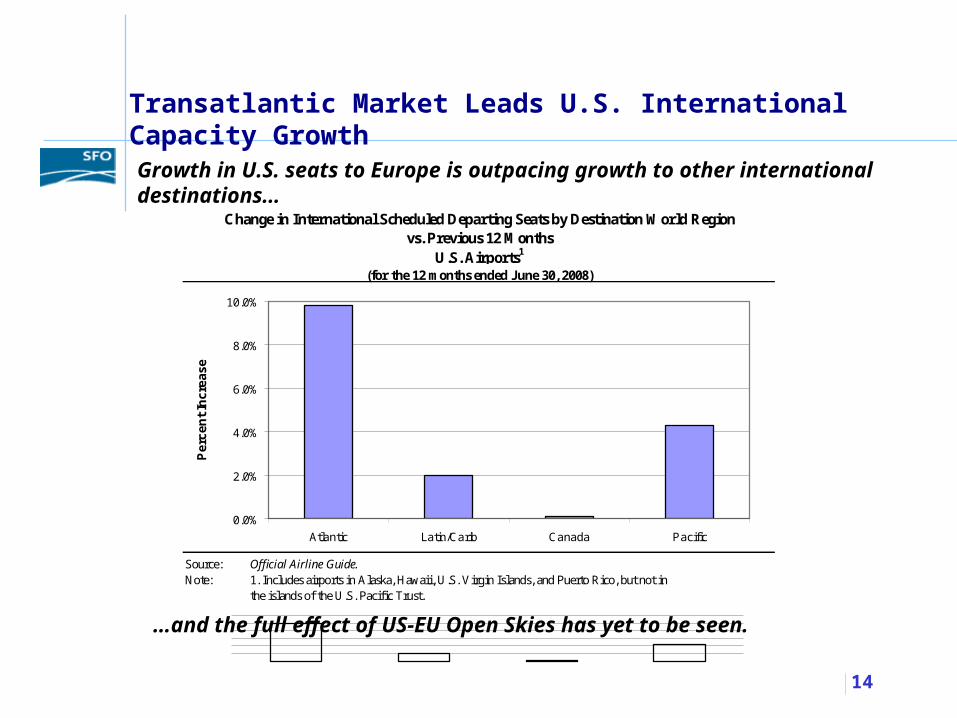
Growth in U.S. seats to Europe is outpacing growth to other international destinations…
Transatlantic Market Leads U.S. International Capacity Growth
…and the full effect of US-EU Open Skies has yet to be seen.
Change in International Scheduled Departing Seats by Destination World Regionvs. Previous 12 Months
U.S. Airports1
(for the 12 months ended June 30, 2008)
Source: Official Airline Guide.Note: 1. Includes airports in Alaska, Hawaii, U.S. Virgin Islands, and Puerto Rico, but not in
the islands of the U.S. Pacific Trust.
0.0%
2.0%
4.0%
6.0%
8.0%
10.0%
Atlantic Latin/Carib Canada Pacific
Per
cen
t In
crea
se
0.0%
2.0%
4.0%
6.0%
8.0%
10.0%
12.0%
Atlantic Latin/Carib Canada Pacific
Per
cen
t In
crea
se
15
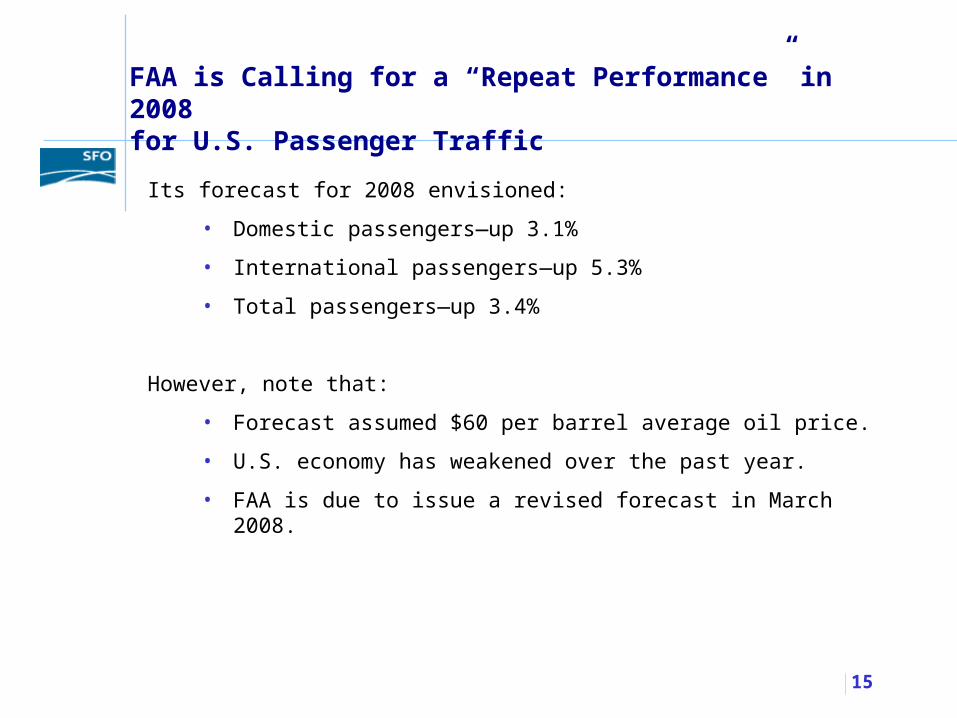
FAA is Calling for a “Repeat Performance” in 2008for U.S. Passenger Traffic
Its forecast for 2008 envisioned:
• Domestic passengers—up 3.1%
• International passengers—up 5.3%
• Total passengers—up 3.4%
However, note that:
• Forecast assumed $60 per barrel average oil price.
• U.S. economy has weakened over the past year.
• FAA is due to issue a revised forecast in March 2008.
16
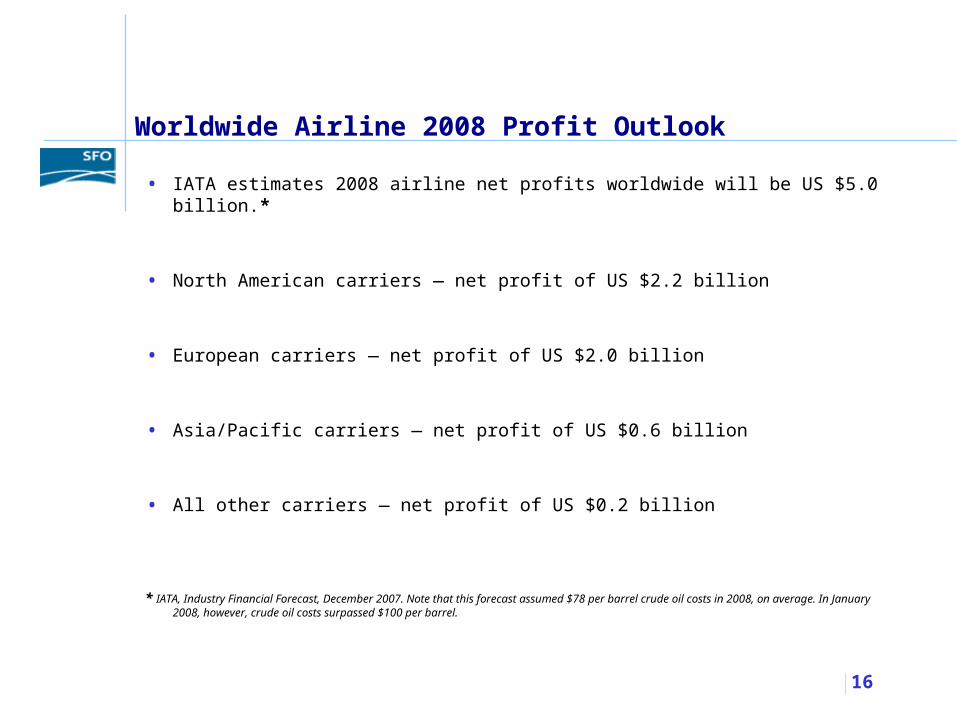
Worldwide Airline 2008 Profit Outlook
• IATA estimates 2008 airline net profits worldwide will be US $5.0 billion.*
• North American carriers — net profit of US $2.2 billion
• European carriers — net profit of US $2.0 billion
• Asia/Pacific carriers — net profit of US $0.6 billion
• All other carriers — net profit of US $0.2 billion
* IATA, Industry Financial Forecast, December 2007. Note that this forecast assumed $78 per barrel crude oil costs in 2008, on average. In January 2008, however, crude oil costs surpassed $100 per barrel.
17
Air Traffic Growth in 2007
Expectations for 2008
State of the Industry

18
Where the U.S. Airline Industry is Now
• U.S. carriers are leaner and healthier after years of cost cutting.
• Operating cost differentials are slowly narrowing between the “legacy” carriers, who have cut costs, reduced capacity and dropped less profitable routes, and the LCCs, who are beginning to see their costs creep upwards as they mature.
• Fare increases have successfully been implemented in the past two years, facilitated by widespread capacity restraint.
• Many airlines have shifted domestic capacity to more profitable international routes.
19
Where the U.S. Airline Industry is Now – con’t.
However:
• The U.S. economy has slowed, following difficulties in the home mortgage market, spillover effects into other consumer credit markets, increasing energy costs, and more modest consumer spending.
• Crude oil prices have broken the $100 per barrel level, and associated high jet fuel prices are becoming an increasingly difficult burden.
• Labor concessions made following 2001, often through bankruptcy proceedings, are coming up for renewal, and labor unions are seeking to share in recent airline profits.
20
Where the U.S. Airline Industry is Now – con’t.
• Congestion and flight delays are increasing nationwide.
• Concerns are continuing to mount about the logistics and financing of a needed upgrade to the nation’s air traffic control system.
• Airlines are facing increasing dissatisfaction from customers related to on-time performance and customer service.
• There is an increasing likelihood of mergers in the U.S. airline industry. Such consolidation could conceivably reduce the number of airline hubs, reduce domestic capacity still further, and put upward pressure on airfares.