Regional State of the Environment Report - Lachlan Shire€¦ · Regional State of the Environment...
82
catchment management authority CENTRAL WEST CATCHMENT COWRA BLAYNEY OBERON BATHURST REGIONAL MID-WESTERN REGIONAL ORANGE WELLINGTON BOURKE BOGAN WARREN COONAMBLE GILGANDRA WARRUMBUNGLE NARROMINE DUBBO LACHLAN CABONNE Wellington Molong Dubbo Narromine Warren Nyngan Condobolin Orange Blayney Cowra Oberon Bathurst Mudgee Gilgandra Coonamble Bourke Coonabarabran Macqaurie Marshes Macquarie R iv e r Bog a n R iver C u d g e g o n g River C astlere a g h R iver Lake Burrendong Darl i ng Riv e r Regional State of the Environment Report 2010–2011 For the Councils of the Greater Central West Region of NSW: Bathurst, Blayney, Bogan, Bourke, Cabonne, Coonamble, Cowra, Dubbo, Gilgandra, Lachlan, Mid-Western, Narromine, Oberon, Orange, Warren, Warrumbungle, Wellington Supplementary Report Regional State of the Environment Report for the Councils of the Greater Central West Region of NSW 2010–2011 Supplementary Report
Transcript of Regional State of the Environment Report - Lachlan Shire€¦ · Regional State of the Environment...

catchment management authority
C E N T R A L
W E S T
C A T C H M E N T
COWRA
BLAYNEY
OBERON
BATHURSTREGIONAL
MID-WESTERNREGIONAL
ORANGE
WELLINGTON
BOURKE
BOGAN
WARREN
COONAMBLE
GILGANDRA
WARRUMBUNGLE
NARROMINE
DUBBO
LACHLAN CABONNE
Wellington
Molong
DubboNarromine
Warren
Nyngan
Condobolin
Orange
Blayney
CowraOberon
Bathurst
Mudgee
Gilgandra
Coonamble
Bourke
Coonabarabran
MacqaurieMarshes
Macquarie River
Bogan River
Cudg
eg
ong River
Castlereagh River
Lake Burrendong
Darl ing
Riv e r
Regional State of theEnvironment Report
2010–2011
For the Councils
of the Greater Central West Region of NSW:
Bathurst, Blayney, Bogan, Bourke, Cabonne, Coonamble, Cowra, Dubbo, Gilgandra,
Lachlan, Mid-Western, Narromine, Oberon, Orange, Warren, Warrumbungle, Wellington
Supplementary Report
Regional State of the Environment Report for the Councils of the G
reater Central West Region of N
SW
2010–2011 Supplem
entary Report
Printed on recycled paper

2010–2011 Supplementary Report 1
Regional State of the Environment Report
The preparation of the Regional State of the
Environment (SoE) Report 2010-11 was funded by the
Central West Catchment Management Authority with
contributions from the 17 participating local Councils.
It should be noted that this is a Supplementary SoE
Report and shows trends, where possible, in relation
to the data from the Comprehensive Report produced
in 2008-09 and the Supplementary Report produced
in 2009-10.
Prepared for:
The 17 participating Councils and the
Central West Catchment Management Authority
30 Warne Street, Wellington, NSW
PO Box 227, Wellington, NSW, 2820
Tel: 02 6840 7800 Fax; 02 6840 7801
www.cw.cma.nsw.gov.au
Prepared by:
Molino Stewart Pty Ltd
Phone: (02) 9354 0300
www.molinostewart.com.au
Design:
Wild Red Frog Design
Phone: (02) 9975 3305
© Central West Catchment Management Authority
and the Councils of Bathurst, Blayney, Bogan, Bourke,
Cabonne, Coonamble, Cowra, Dubbo, Gilgandra,
Lachlan, Mid-Western, Narromine, Oberon, Orange,
Warren, Warrumbungle and Wellington.
All intellectual property and copyright reserved.
Apart from any fair dealing for the purpose of private
study, research, criticism or review, as permitted under
the Copyright Act 1968, no part of this report may be
reproduced, transmitted, stored in a retrieval system
or adapted in any form or by any means (electronic,
mechanical, photocopying, recording or otherwise)
without written permission. Enquiries should be
addressed to one of the Councils listed above or the
Central West Catchment Management Authority.
Acknowledgements
catchment management authority

2 2010–2011 Supplementary Report
ContentsAbbreviAtions 3
MessAge froM the ChAirMAn 4
introduCtion 6What is a Supplementary Report? 7Why a Regional SoE Report? 7Who is involved in the Regional SoE Report? 8What are Catchment Management Authorities? 9Understanding this Report 9
LAnd 10Issue - Land Degradation 10
Air 16Issue – Air Pollution 16
WAter 20Issue – Water Quantity 21Issue – Water Quality 29
biodiversity 38Issue – Loss of Biodiversity 38
huMAn settLeMent 50Issue – Changing and Increasing Human Settlements 50
WAste 56Issue – Waste Generation and Disposal 56
toWArds sustAinAbiLity 62Issue – A Sustainable Future 62
referenCes 70
Appendix – dAtA Contributed by And sourCed for CounCiLs 72

2010–2011 Supplementary Report 3
Regional State of the Environment Report
AbbreviationsANZECC Australian and New Zealand Environment Conservation CouncilCANFA Conservation Agriculture and No-till Farming AssociationCAP Catchment Action PlanCentroc Central West Regional Organisation of CouncilsCMA Catchment Management AuthorityDPI Department of Primary IndustriesEC Electrical ConductivityEEC Endangered Ecological CommunityGL GigalitreGPT Gross Pollutant Trapha HectarekL KilolitreLBL Load-based LicensingLEP Local Environmental PlanLGA Local Government AreaML MegalitreNPI National Pollutant InventoryNSW New South WalesOEH Office of Environment and HeritagePAS Priorities Action StatementPoEO Protection of the Environment OperationsPVP Property Vegetation PlanREC Roadside Environment CommitteeRFS Rural Fire ServiceRVMP Roadside Vegetation Management PlanSoE State of the EnvironmentTAGI That’s a Good IdeaWONS Weeds of National SignificanceWTP Water Treatment Plant

4 2010–2011 Supplementary Report
The breaking of the drought across the region over the past eighteen months was welcomed by all, but it certainly brought to mind the adage “it never rains but it pours”.
The rainfall not only revived the natural resources of the catchment but also the communities that live off the land, with farmers - for the main part - reporting good results for both cropping and grazing.
For local Councils the rainfall increased dam and groundwater levels, once more assuring town water supplies. However, the downside to all of this was the quantity of water that came off the land. It flowed out of dams causing flooding, and into the catchment rivers and creeks causing not only damage to infrastructure but also to our riparian zones.
This flooding left many Councils with the huge task of repairing roads and fixing bridges and other infrastructure, whilst trying to carry on with business as usual. Fortunately, State and Federal funding is available to help repair damage to infrastructure, but what of the damage caused to our natural resources?
Across the catchment Councils were reporting severe erosion problems that not only threaten the health of our waterways but, if left, will threaten infrastructure in future events. With variations to climate these events can be anticipated to happen more frequently and with growing intensity. Regrettably, for this damage there is no recognised source of funding to assist with repair.
above Tom Gavel,
Chairman, Central West
Catchment Management
Authority
right Callistemon or
Bottlebrush is a genus of
34 species of shrubs in
the family Myrtaceae, all
of which are endemic to
Australia.
The Central West Catchment Management
Authority (CMA) is again pleased to support the 17
regional Councils in the preparation of a Regional
State of the Environment Report.
Message from the Chairman

2010–2011 Supplementary Report 5
Regional State of the Environment Report
above Ben Chifley Dam,
Bathurst (source: David
McKellar).
The matter has been taken up with both the State and Federal Governments, with the Federal Government able to provide some small one-off funding during the year to the Central West CMA, which went towards restoration works on the Macquarie River at Wellington but still leaves many other areas awaiting rehabilitation (see the case study on page 13).
What we can do though is recognise that there is a wide range of constructive activities we can undertake ourselves to protect our waterways such as ensuring that: riparian zones remain well-vegetated or are revegetated and buffered from development; Floodplain Risk Management Plans are updated and in place; and new and future development is sited away from sensitive areas and is designed to reduce impermeable surfaces, as well as taking advantage of opportunities for water re-use at site.
The Central West CMA commends the Councils for their efforts to protect our local environ-ments and is once again pleased to support the 17 regional Councils in the preparation of this Supplementary Regional State of the Environment Report.
Tom Gavel Chairman Central West Catchment Management Authority
Robert Gledhill Chairman Lachlan Catchment Management Authority
Rory Treweeke Chairman Western Catchment Management Authority

The Local Government Act 1993 required that all local Councils in NSW produce an annual SoE Report on major environmental impacts, related activities and management plans.
Under the 1993 Act, Councils were required to specifically report on:1. Land2. Air3. Water4. Biodiversity5. Waste6. Noise7. Aboriginal heritage8. Non-Aboriginal heritage.
In each of these environmental themes particular reference was required to be made to:• management plans relating to the
environment• special Council projects relating to the
environment• the environmental impact of Council
activities.
The Local Government Act 1993 was amended in 2009. The amendments promote the use of an Integrated Planning and Reporting Framework to guide a Council’s future strategic planning and reporting. As part of the Framework, Councils are required to develop environmental objectives with their communities in relation to local environmen-tal issues. These environmental objectives form part of each Council’s overarching Community Strategic Plan. The information in the new type of annual SoE Reports, which are required under the amended legislation, will be used to inform Council’s preparation of the Community Strategic Plan and continue to inform the required reviews of the Community Strategic Plan.
The implementation of this new Framework is being staggered across the 152 NSW Councils. All of the participating Councils in this Report are ‘Group 3 Councils’ in the Framework implementation process, meaning that they do not need to change their
A State of the Environment (SoE) Report is an important management tool which aims
to provide the community and the local Council with information on the condition of
the environment in the local area. It also provides a platform for community action by
raising awareness and understanding of key environmental issues which in turn helps people
and organisations make informed decisions regarding future management actions to reduce the
negative impacts on the environment.
below A morning stroll in
the Central West.
Water
6 2010–2011 Supplementary Report
Introduction

reporting methods until 2012. This Report therefore follows the original SoE reporting structure with its eight environmental themes as listed above.
What is a supplementary report?
Under the Local Government Act 1993, a Council must produce a Comprehensive SoE Report for the year ending after each election of Councillors. A Supplementary Report is required in intervening years. The Supplemen-tary Report updates trends and reports on new environmental impacts and initiatives that have occurred or been introduced since the last Comprehensive Report.
This is the fourth Regional SoE Report supported by the Central West CMA. It builds upon the first (Supplementary) Regional SoE Report produced for 2007–08, the second (Comprehensive) Regional SoE Report produced for 2008–09 and the third (Supple-mentary) Regional SoE Report produced for 2009–10.
As this is a Supplementary Report, it primarily covers trends in environmental indicators and responses in 2010–11 and compares this to the previous year.
The 2008–09 Comprehensive Report should be referenced as the base document for detailed information, particularly relating to environmental threats and background information (e.g. demographic and climatic data).
Why a regional soe report?
Environmental issues are not restricted to Council boundaries. Regional SoE Reports are recommended by the NSW Government and used by some groups of Councils in NSW to enable a better understanding of the state of the environment in a regional context and to
identify future collaborative pathways. More specifically, a regional approach to reporting:• facilitates a better understanding of the
state of the environment across the region• encourages collaboration in regards to
partnering on projects and sharing ideas and resources
• assists in the management of shared environmental resources
• forges stronger regional links across participating Councils.
The initiatives presented in this Report for each participating Council do not reflect all of the initiatives undertaken by Councils during the reporting period. Furthermore, the format of the Regional SoE Report does not allow for each Council to identify progress on their environmental management and sustainability plans, which some Councils have previously included in their SoE Reports. Councils can append additional information specific to their Council to this Report, should they wish.
above Re-vegetation
works, Macquarie River,
Bathurst (source: David
McKellar).
Councils are strongly encouraged to develop their SoE Report in partnership
with other councils in their region and Catchment Management Authorities, as
environmental monitoring and reporting is usually more useful when done at a
regional and/or catchment scale.NSW Department of Local Government
2010–2011 Supplementary Report 7
Regional State of the Environment Report

Who is involved in the regional soe report?
As shown in Figure 1, most of the participating Councils are situated, totally or partly, in the area of the Central West Catchment. Bourke Shire Council is located wholly in the Western Catchment while Cowra and parts of Blayney, Lachlan, Cabonne, Bathurst and Oberon lie in the Lachlan Catchment. Parts of Mid-Western lie within the Hunter-Central Rivers Catchment and parts of Warrumbungle lie within the Namoi Catchment.
The participating Councils are:• Bathurst Regional Council• Blayney Shire Council• Bogan Shire Council• Bourke Shire Council• Cabonne Council
• Coonamble Shire Council• Cowra Shire Council• Dubbo City Council• Gilgandra Shire Council• Lachlan Shire Council• Mid-Western Regional Council• Narromine Shire Council• Oberon Council• Orange City Council• Warren Shire Council• Warrumbungle Shire Council• Wellington Council
All participating Councils have provided data to be included in the Report, with additional regional information sourced by the Central West CMA and other government agencies (see Appendix for details of data sources).
150100
kilometres
500
C E N T R A L
W E S T
C A T C H M E N T
W E S T E R N
C A T C H M E N T
L A C H L A N C A T C H M E N TCOWRA
BLAYNEY
OBERON
BATHURSTREGIONAL
MID-WESTERNREGIONAL
ORANGE
WELLINGTON
BOURKE
BOGAN
WARREN
COONAMBLE
GILGANDRA
WARRUMBUNGLE
NARROMINEDUBBO
LACHLAN
CABONNE
Wellington
Molong
DubboNarromine
WarrenNyngan
CondobolinIvanhoe
Broken Hill
Forbes Orange
Blayney
CowraOberon
Bathurst
Mudgee
Gilgandra
Coonamble
Bourke
Coonabarabran
MacqaurieMarshes
Macquarie River
Bogan River
Cud
gego
ng River
Castlereagh River
Lake Burrendong
Figure 1: Map showing
participating Council
areas and catchment
boundaries
Water
8 2010–2011 Supplementary Report
WaterIntroduction

What are Catchment Management Authorities?
Thirteen CMAs have been established across the State by the NSW Government to ensure that regional communities have a significant say in how natural resources are managed in their catchments. The three CMAs covered or partly covered in this Report are:
Central West CMA: www.cw.cma.nsw.gov.auLachlan CMA: www.lachlan.cma.nsw.gov.auWestern CMA: www.western.cma.nsw.gov.au
For more detailed information about the CMAs refer to the 2008–09 Comprehensive SoE Report or to their respective websites. The 2008–09 Comprehensive SoE Report can be found at http://cw.cma.nsw.gov.au/Publica-tions/resources.html
understanding this report
themesAs discussed above, this Report covers the ‘traditional’ themes used in NSW SoE reporting as required by legislation. These reporting themes have been integrated under the following themes for the Report:• Land• Air• Water• Biodiversity• Human Settlements• Waste• Towards Sustainability.
The last theme (‘Towards Sustainability’) is a diversion from the traditional SoE reporting themes and reflects the desire for the participat-ing Councils and CMAs to help move their local communities towards environmental sustainability.
environmental issuesIn 2009, each participating Council identified key environmental issues. These environmen-tal issues were categorised and have been addressed under the themes as issues or sub-issues.
It should be stressed that the number of issues and sub-issues related to each theme does not reflect the importance of that theme
in comparison to other themes. However, it reflects more the range of disparate issues under each theme.
It should also be noted that although they are discussed primarily under one theme, several issues such as climate change, relate to other themes in the Report.
environmental indicatorsIndicators are important management tools used in environmental reporting. They summarise and communicate information about the condition of key aspects of complex environments so that decision-making can be better informed.
In this Report, a suite of indicators has been identified that help report on the envi-ronmental themes and issues listed above.
A list of Councils that provided data for each indicator is found in the appendix of this Report.
Where data for 2008–09 and 2009–10 is available, it is provided along with data for 2010–11 in a summary table at the com-mencement of each theme chapter. Some data for the previous years in the summary tables is not directly comparable to that shown for the reporting year (2010–11). This is due to either recalculation of the previous data or a change in the Councils included in the comparison. Due to this, the trend arrows in the summary tables only relate to a comparison of this year’s data with the previous year’s (2009–10) data, where direct comparison can be made. The trend arrows used in the summary tables are:
improvement no or little change worsening trend
There is an explanation for each trend within the chapter and, if relevant, possible reasons for it occurring.
pressure-state-responseThe conventional way of reporting on each theme is using the ‘Pressure-State-Response’ model. This order has been modified to State-Pressure-Response in this Report to initially highlight the current situation. Wording has also been changed as follows: Pressure to ‘Threat’, State to ‘Condition’.
2010–2011 Supplementary Report 9
Regional State of the Environment Report Regional State of the Environment Report
5. Water
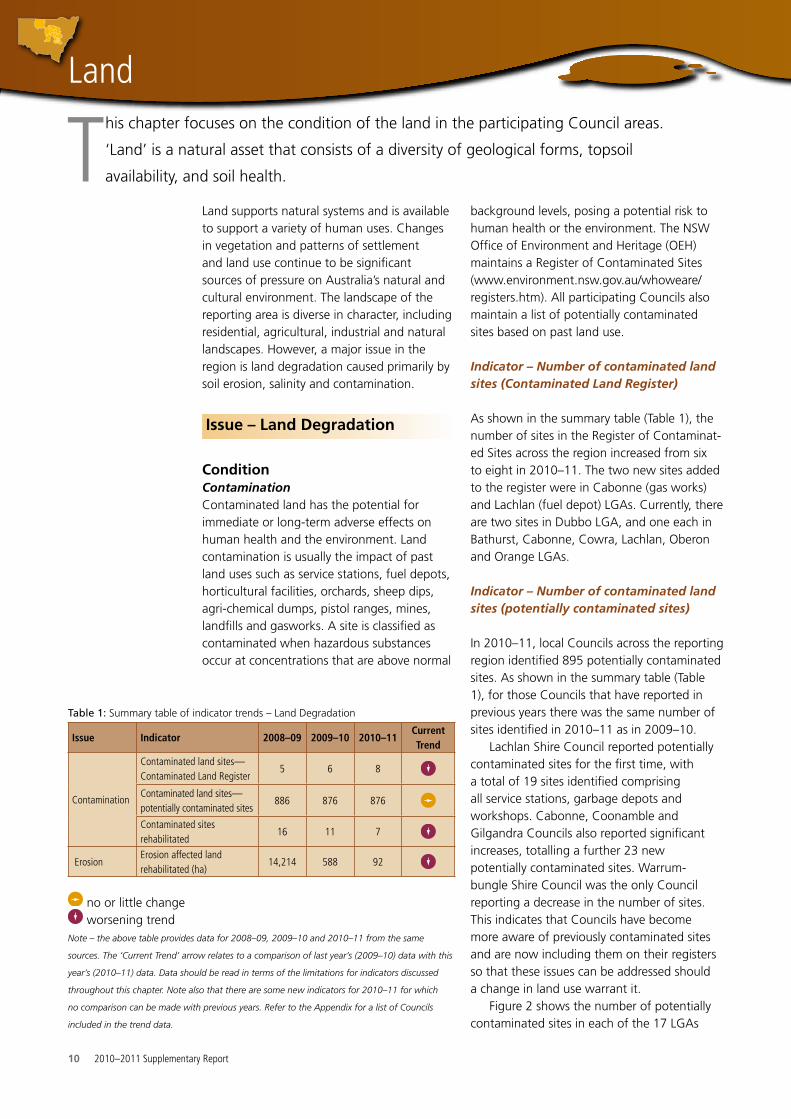
This chapter focuses on the condition of the land in the participating Council areas.
‘Land’ is a natural asset that consists of a diversity of geological forms, topsoil
availability, and soil health.
Land supports natural systems and is available to support a variety of human uses. Changes in vegetation and patterns of settlement and land use continue to be significant sources of pressure on Australia’s natural and cultural environment. The landscape of the reporting area is diverse in character, including residential, agricultural, industrial and natural landscapes. However, a major issue in the region is land degradation caused primarily by soil erosion, salinity and contamination.
issue – Land degradation
ConditionContaminationContaminated land has the potential for immediate or long-term adverse effects on human health and the environment. Land contamination is usually the impact of past land uses such as service stations, fuel depots, horticultural facilities, orchards, sheep dips, agri-chemical dumps, pistol ranges, mines, landfills and gasworks. A site is classified as contaminated when hazardous substances occur at concentrations that are above normal
background levels, posing a potential risk to human health or the environment. The NSW Office of Environment and Heritage (OEH) maintains a Register of Contaminated Sites (www.environment.nsw.gov.au/whoweare/registers.htm). All participating Councils also maintain a list of potentially contaminated sites based on past land use.
Indicator – Number of contaminated land sites (Contaminated Land Register)
As shown in the summary table (Table 1), the number of sites in the Register of Contaminat-ed Sites across the region increased from six to eight in 2010–11. The two new sites added to the register were in Cabonne (gas works) and Lachlan (fuel depot) LGAs. Currently, there are two sites in Dubbo LGA, and one each in Bathurst, Cabonne, Cowra, Lachlan, Oberon and Orange LGAs.
Indicator – Number of contaminated land sites (potentially contaminated sites)
In 2010–11, local Councils across the reporting region identified 895 potentially contaminated sites. As shown in the summary table (Table 1), for those Councils that have reported in previous years there was the same number of sites identified in 2010–11 as in 2009–10.
Lachlan Shire Council reported potentially contaminated sites for the first time, with a total of 19 sites identified comprising all service stations, garbage depots and workshops. Cabonne, Coonamble and Gilgandra Councils also reported significant increases, totalling a further 23 new potentially contaminated sites. Warrum-bungle Shire Council was the only Council reporting a decrease in the number of sites. This indicates that Councils have become more aware of previously contaminated sites and are now including them on their registers so that these issues can be addressed should a change in land use warrant it.
Figure 2 shows the number of potentially contaminated sites in each of the 17 LGAs
Table 1: Summary table of indicator trends – Land Degradation
Issue Indicator 2008–09 2009–10 2010–11Current Trend
Contamination
Contaminated land sites—Contaminated Land Register
5 6 8
Contaminated land sites—potentially contaminated sites
886 876 876
Contaminated sites rehabilitated
16 11 7
ErosionErosion affected land rehabilitated (ha)
14,214 588 92
no or little change worsening trend
Note – the above table provides data for 2008–09, 2009–10 and 2010–11 from the same
sources. The ‘Current Trend’ arrow relates to a comparison of last year’s (2009–10) data with this
year’s (2010–11) data. Data should be read in terms of the limitations for indicators discussed
throughout this chapter. Note also that there are some new indicators for 2010–11 for which
no comparison can be made with previous years. Refer to the Appendix for a list of Councils
included in the trend data.
Water
10 2010–2011 Supplementary Report
Land

above Cotton fields
in Bourke.
and makes comparisons for the last four years where reported by Councils.
ErosionErosion is a significant factor that influences water quality in our streams, habitat quality and land use potential. Erosion generally occurs where land has been disturbed or where water concentrates, such as unsealed roads, roadsides and driveways, agricultural areas through cropping, land clearing and over grazing, industrial areas, stormwater outlets, where vegetation is otherwise removed and in waterways. Impacts from erosion include loss of arable land and habitat, weed invasion, soil loss, dust storms, loss of soil health and sedimentation of waterways.
SalinityWhile there are several causes of salinity (including irrigation and removal of vegetation), the effects on land resources can be significant regardless of the cause. Salinity changes the soil structure, increasing the erosion hazard. Limited vegetation will
grow on saline areas, reducing feed for stock, habitat for native species and changing the local ecosystem. Salt also affects infrastructure such as roads and buildings which may result in high economic impacts for the local Council and community. Salinity levels in rivers are discussed in the chapter on Water.
Number of potentially contaminated sites0 50 100 150 200 250 300 350 400
2010–112009–102008–092007–08
WellingtonWarrumbungle
WarrenOrangeOberon
NarromineMid-Western
LachlanGilgandra
DubboCowra
CoonambleCabonne
BourkeBogan
BlayneyBathurst
Figure 2: Number of
potentially contaminated
sites in each LGA.
2010–2011 Supplementary Report 11
Regional State of the Environment Report

threatFive main threats to the Land resources of the region are:1. Land clearing2. Poor agricultural practices3. Inappropriate development and land use
change (including mining see below)4. Climate change5. Waste disposal (legal and illegal)
Details about each of these threats are provided in the 2008-09 Comprehensive Report.
MiningThe boom in global demand for Australian resources continues to have a significant impact on the economy of the Central West of NSW. In many areas, mining is a major employer and exploration for new commercial deposits is widespread across the region. The resources industry provides job opportunities for many people who in other times would have been forced to leave the region to find work and it also brings new people into the region. Mining can have regional benefits but may also put social pressure on some regional towns. The number and scale of active mines and exploration projects can threaten the local environment through possible contamination of groundwater, vegetation clearance and subsidence affecting surface water.
Indicator - Area covered by mining and mining exploration projects
Indicator - Number and type of operating mines and quarries, licenced under the PoEO Act
These are new indicators for this reporting period so no comparison with previous years is possible.
There is a significant area currently covered by exploration titles across every one of the 17 LGAs with the largest areas being in the Bourke and Warrumbungle LGAs, both having more than one million hectares under exploration titles. The total across the whole region is 7,426,548 hectares (approximately 5% of the reporting area).
There are operating mines in 10 of the 17 LGAs with the largest area being the 87 active mining leases covering 22,382 hectares in the Mid-Western LGA. The Mid-Western LGA also has the largest number of exploration leases (75), covering approxi-mately 90% of the LGA. The other active mining leases are in the Bathurst, Blayney, Bogan, Bourke, Cabonne, Cowra, Lachlan, Oberon and Wellington LGAs. Figure 3 shows the total area under both exploration and mining leases by LGA.
response
Contamination
Indicator – Number of contaminated sites rehabilitated
Fourteen of the 17 participating Councils reported on this indicator for 2010–11. As shown in Table 1, they reported that seven sites across the region have been rehabilitated. This is a reduction from the 11 sites reported as rehabilitated in 2009–10 and continues the downward trend reported last year.
Agricultural landsA significant focus of CMA funding programs has been improving soil management in agriculture, not only for soil health but also to limit soil losses from impacts of stock, stormwater and flooding, and wind erosion.
Targeted incentive funding for farmers has included increased groundcover percentages and improved organic content of soils as well as farm planning.
Hectares0 200000 400000 600000 800000 1000000 1200000
MiningExploration
WellingtonWarrumbungle
WarrenOrangeOberon
NarromineMid-Western
LachlanGilgandra
DubboCowra
CoonambleCabonne
BourkeBogan
BlayneyBathurst
Figure 3: Total area
covered by mining and
mining exploration
projects.
Water
12 2010–2011 Supplementary Report
Land

CAse study: stabilisation of the bell river at WellingtonFor the last 40 years, the Bell River near the confluence with the Macquarie River at Wellington, has suffered acceleration in bank erosion.This accelerated erosion is directly attributable to the irrigation and environmental storage requirements and flood mitigation management of the Burrendong Dam under the control of State Water and the Office of Water.
While Wellington accepts the resulting controlled flows from Burrendong Dam benefit all communities downstream it is evident one of the unintended consequences is severe erosion in the Bell River environs at Wellington.
Major flood events in 1976, 1990, 1998, 2005 and 2010 have resulted in major bank erosion, particularly in the section immediately before the Bell River meets the Macquarie River.
The 2010 flood events have further eroded a considerable section of the Bell River bank on private property. There is now a significant risk the next major flood event will:• cut a direct channel to the Macquarie River thus impinging on the existing low level road
bridge across the Macquarie at Oxley Park• create an unsatisfactory right angled entry to the Macquarie with the potential to create
further disturbed flow patterns in both rivers• remove more soil from private property and further degrade the riverine environment
with loss of significant landscape including significant trees.
Protective riprap work has been undertaken adjacent to Cameron Park and the Polo fields and this has been successful in stabilising the river banks at these locations.
Wellington Council is seeking funding assistance to install bank protection to hold the river alignment created earlier this year and maintain the existing entry alignment of the Bell River to the Macquarie River. Together with planting of appropriate native species, it is believed the riverine environment of the Bell River can be rehabilitated and protected into the foreseeable future.
The initial funding sought is an estimated $710,000 for the junction of the Bell and Macquarie Rivers and further $832,520 in stages to protect other upstream urban and rural areas.
The accompanying photo from the 1998 flood showing the suspended fence across the river visibly demonstrates the amount of bank erosion resulting from one flood event. A similar amount of bank was lost during the 2010 flood events.
Riverbank erosion on the Bell River, Wellington.
2010–2011 Supplementary Report 13
Regional State of the Environment Report

CAse study: ‘reveg the sedge’ project (Lachlan)The ‘Reveg the Sedge’ project was proposed by Western Plains Regional Development Inc and Lachlan Shire Council. The project involves the replanting of the southern bank of the Lachlan River at Condobolin with native sedge grass. The project also involves the creation of a walking path along the river bank with decorative terrazzo cement tiles and interpretative signage placed along the path.
BackgroundThe ’Reveg the Sedge’ project is also related to a project known as ‘Weaving Wellbeing’. This project is supported by Western Plains Regional Development Inc, the Wiradjuri Arts Group, the Lachlan Arts Council, West Women Weaving, Arts OutWest, Orange Local Aboriginal Lands Council and Western NSW Local Health Network through the provision of workshop and gallery space, artistic expertise and mentoring programs. The project aims to build skills in the techniques of basket weaving and the manufacturing of terrazzo tiles amongst the Indigenous community so that Indigenous artworks may be placed in public spaces within the buildings and grounds of Orange Base Hospital. The goal is to mark the hospital as a regional place of importance to Aboriginal peoples, thereby creating a sense of ownership for Aboriginal people.
The project utilises sedge grass as a resource for weaving and local ochre and soil for the terrazzo. Woven baskets are to be hung above windows that overlook internal courtyards. The terrazzo tiles are to be designed and laid within the courtyards to represent the path of the Lachlan River, flowing from Forbes through Condobolin and on to Lake Cargelligo.
Spiny Sedge (Cyperus gymnocaulos) is an important fibre traditionally used by Indigenous peoples of the Wiradjuri nation in the Lachlan River catchment to weave baskets. Known locally as ‘sedge grass’, it was common along waterways in the area but its occurrence has dwindled over the past decade due to prolonged drought conditions. The plant is a wetland plant and requires a permanent water supply to propogate.
The natural resource for the Weaving Wellbeing project is however in short supply due to the drought. Plants are required to be of a particular height and quality, and suitable plants are generally unavailable within 200 kilometres of Condobolin.
In order to ensure supply of sedge grass for the Weaving Wellbeing project, sedge grass seedlings are collected from the shore of Lake Cargelligo. The seedlings are then propagated in an irrigated shade house within the grounds of the Lachlan CMA offices.
Once sufficiently hardy, specimens are then planted along that southern bank below the high water mark in the vicinity of the recreation facilities within the Reserve Area, between the Diggers Avenue bridge and the junction of the Lachlan River and Goobang Creek. The planting area is to be specified as being between contours along the river bank, beneath the top of bank. These contours were surveyed and pegged to mark the area to be replanted.
The Central West Catchment Action Plan (CAP) (2006) outlines management targets, which include: ‘By 2016, 50,000 ha of the catchment will be managed to have a desirable perennial plant component for landscape protection (MTSS1)’.
In its update of the 2006–16 CAP (Central West CMA, 2010), the Central West CMA reported that the two targets for perennial plantings have both been exceeded and jointly cover 99,542 ha.
Erosion
Indicator – Extent of erosion affected land rehabilitated
The Central West CMA reported during the year that 90 ha of water ponding and water spreading projects were undertaken during the year to rehabilitate erosion affected land. There were a further three hectares reported as rehabilitated across the Coonamble and Mid-Western LGAs. This is a significant contraction from the 574 ha reported across the Central West CMA in 2009–10 and continues the downward trend from the previous year mainly due to a decrease in available funding and an emphasis on improved management through farm plannng courses. However, the Central West CMA notes that land that uses best management practices for soil health covers
opposite Blasting at
Wilpinjong Mine,
Mid-Western LGA.
Water
14 2010–2011 Supplementary Report
Land

Project objectivesThe objectives of the Reveg the Sedge project are to:a) facilitate the survival of sedge grass by
revegetating a section of the banks of the Lachlan River with this endemic species,
b) demonstrate a means to sustainably manage the natural environment by restoration of a riparian zone and prevention of further erosion and degradation,
c) ensure the supply of sedge grass for the Weaving Wellbeing project,
d) provide an informative and interesting recreation facility that promotes an un-derstanding of an aspect of Indigenous culture,
e) strengthen partnerships between organisa-tions such as Lachlan Shire Council, the Lachlan CMA, Western Plains Regional Development Inc, Condobolin Local Aboriginal Lands Council and state agencies, and
f) provide the site and the work to allow for the successful implementation of the links to learning objectives, in building skills within Indigenous school students relevant to their culture, interests and potential job prospects.
SummaryThe ‘Reveg the Sedge’ project will bring substantial social, economic and environmen-tal benefits to the community of Condobolin and the surrounding region.
402,475 ha as a result of several of its CAP initiatives.
Salinity
Indicator – Extent of salinity affected land rehabilitated
The Central West CMA reported that no additional salinity recovery actions were funded during 2010–11. This continues the worsening trend reported last year, due to funding availability. Other programs such as revegetation programs and perennial planting have positive impacts.
The walking path under construction
Regional State of the Environment Report
2010–2011 Supplementary Report 15

This chapter focuses on the condition of the air
(atmosphere) in the participating Council areas.
Globally, the condition of the air has been heavily
scrutinised in recent times due to its potential impact on
climate change.
opposite Methane flare
at the Bathurst waste
management centre
(source: David McKellar).
The atmosphere regulates the type and amount of radiation that hits the earth’s surface from the sun (via the ozone layer), regulates temperature (through the ‘greenhouse effect’) and provides the gases that plants need to grow and animals, including people, need to breathe. However, some substances in the atmosphere may reduce the air’s quality, and pollution resulting from smoke, industrial and agricultural emissions can at times be a problem within the reporting area.
issue – Air pollution
Condition
Regional Air QualityMuch of the regional air quality monitoring in NSW is confined to the Greater Metropoli-tan area which includes Sydney, Wollongong and Newcastle. The OEH monitors at one site in the reporting region, Bathurst; however, ozone and particulates are the only air pollutants measured at this site (other sites in NSW also measure nitrogen dioxide, visibility, carbon monoxide and sulphur dioxide). Particulates can include dust, smoke, plant spores, bacteria and salt. Particulate matter may be a primary pollutant, such as smoke particles, or a secondary pollutant formed from the chemical reaction of gaseous pollutants.
Human activities resulting in particulate matter in the air include mining, burning of fossil fuels, transportation, agricultural and hazard reduction burning, the use of incin-erators, and the use of solid fuel for cooking and heating.
Particulate matter can be usefully classified by size. Large particles usually settle out of the air quickly while smaller particles may remain suspended for days or months. Rainfall is an important mechanism for removing particles from the air.
Table 2: Summary table of indicator trends – Air Pollution
Issue Indicator 2008–09 2009–10 2010–11Current Trend
Regional Air Quality
Number of days that air pollution maximum goals for particulate matter were exceeded*
5 8 0
Air Quality Complaints
Number of air quality complaints to OEH Pollution Line
103 45 148
Number of air quality complaints to Council
101 112 131
Odour
Number of odour complaints received by Council
120 89 117
Number of odour complaints received by OEH
25 89 50
Industrial Pollution
Number of premises on the National Pollution Inventory
51 50 46
Number of Environment Protection Licences issued
202 194 192
*data collected at Bathurst – only monitoring station
improvement worsening trend
Note – the above table provides data for 2008–09, 2009–10 and 2010–11 from the same
sources. The ‘Current Trend’ arrow relates to a comparison of last year’s (2009–10) data with this
year’s (2010–11) data. Data should be read in terms of the limitations for indicators discussed
throughout this chapter. Note also that there are some new indicators for 2010–11 for which
no comparison can be made with previous years. Refer to the Appendix for a list of Councils
included in the trend data
Water
16 2010–2011 Supplementary Report
WaterAir

Figure 4: Types of air
quality complaints to
local Councils in
2010–11.
above Morning fog at
Borenore, Cabonne.
0 5 10 15 20 25 30 35
Wood Smoke OtherDustBurn-offs
WellingtonWarrumbungle
WarrenOrangeOberon
NarromineMid-Western
LachlanGilgandra
DubboCowra
CoonambleCabonne
BourkeBogan
BlayneyBathurst
Number of complaints
The size of a particle also determines its potential impact on human health. Larger particles are usually trapped in the nose and throat and swallowed. Smaller particles may reach the lungs and cause irritation there. Fine particles can be carried deep into the lungs and irritate the airways. When exposed to particulate pollution, people suffering from heart disease may experience symptoms such as chest pain, and shortness of breath. Particulate pollution can also aggravate existing respiratory diseases such as asthma and chronic bronchitis.
Indicator–Number of days that air pollution maximum goals were exceeded
During the 2010-2011 reporting year there were no days where particulate matter exceeded the National Environment Protection Measure standard for PM10 particles (which is an average daily reading of 50 micrograms per cubic metre). PM10 is used to define air particles that are up to 10 micrometers in diameter and are among the coarser particles that can be measured in air quality analysis.
This was a marked improvement in 2010–11 from the total of eight and five exceedances during the previous two years. This change is probably due to the wetter conditions experienced in the region over the year as the main contributors to high PM10 particle levels in the region (including in Bathurst) are dust storms, bushfires and burn-offs.
Air Quality Complaints
Indicator – Number of air quality complaints to the OEH Pollution Line
Indicator–Number of air quality complaints to local Councils
As shown in the summary table (Table 2), the number of complaints to the local Councils about air quality matters (not including odour issues) increased markedly in comparison to both the previous two years. Complaints reported to the OEH Pollution Line also showed a significant increase from 45 in 2009–10 to 148 in the 2010–11 year which could be due to complaints arising from increased mining activity.
There were a total number of 131 air quality complaints to Councils in 2010–11 from all 17 participating Councils. The types of air quality complaints across the Council areas are shown in Figure 4 and overall they are spread reasonably evenly across the four categories of burn-offs, dusts, wood smoke and other. This is a change from previous years where dust and burn-offs were the main specified air quality complaints.
The geographic distribution of complaints has also changed this year. Dubbo LGA is still the largest single contributor but its complaints fell from 54 in 2009–10 to 34 this year. By contrast, increases in complaints were reported by ten of the 17 local Councils.
2010–2011 Supplementary Report 17
Regional State of the Environment Report

Number of complaints0 10 20 30 40 50
2010–112009–102008–09
WellingtonWarrumbungle
WarrenOrangeOberon
NarromineMid-Western
LachlanGilgandra
DubboCowra
CoonambleCabonne
BourkeBogan
BlayneyBathurst
Figure 5: Number of
odour complaints received
by Councils.
above Clear skies over
Obley Road, Cabonne.
Odour
Indicator – Number of odour complaints received by Council
Indicator – Number of odour complaints received by OEH Pollution Line
The 17 participating local Councils reported that there were 117 odour complaints received in 2010–11, which is a significant increase from the 89 reported in the 2009–10 reporting year and is very similar to the 120 complaints in the 2008–09 year. Figure 5 shows the number of odour complaints
received by each Council during the reporting period compared with the previous two years.
The two LGAs reporting the most significant increase in the number of complaints were Bourke (from two in 2009–10 to 22 in 2010–11) and Cowra (from seven to 32). Nineteen of the complaints received in the Bourke LGA were due to a large fish kill in the Darling River caused by blackwater from the major flooding event.
By contrast, there were 50 odour complaints received by the OEH Pollution Line in 2010–11, which is a significant reduction from the 89 reported in 2009–10. However, this is still an increase from the 25 complaints reported in 2008–09. It is possible that Councils are receiving more complaints from the one-off exceptional events like the Bourke fish kill and that the OEH Pollution Line tends to receive complaints for more persistent odour issues.
threatThere are several threats to the air quality of the region including from dust storms, vehicles, solid fuel heaters, backyard burning, bushfires, agricultural activities (e.g. stubble burning, agricultural spray drifts) and commercial and industrial sources. More information about these threats can be found in the 2008–09 Comprehensive Report.
Water
18 2010–2011 Supplementary Report
WaterAir

Industrial Pollution
Indicator – Number of premises on the National Pollutant Inventory
As shown in the summary table (Table 2), the number of NPI (National Pollutant Inventory) industry pollution emitters in the region has reduced slightly in the last year, with 46 in the most recent year (2010–11) compared with 51 in the previous NPI reporting period. The reductions occurred in the Bourke, Dubbo and Mid-Western LGAs.
Indicator – Number of Environment Protection Licences issued
There are currently 192 active Environment Protection Licences (including air, water pollution discharges) for premises across the reporting area, as issued by the OEH under the Protection of the Environment Operations Act 1997 (PoEO Act). As shown in the summary table (Table 2), this is a small reduction from the 194 active licences in 2009–10 and builds on the reduction from 202 in the 2008–09 year which suggests that an improving trend in the potential for regulated air and water pollution is being established.
response
FiresHazard reduction burns and limiting the impact of smoke from these is managed through Bushfire Risk Management Plans, developed by the local Bushfire Management Committee which is comprised of local land managers including local Councils, OEH, Crown Lands Division and the Rural Fire Service (RFS).
These plans now include assessment and management of environmental assets (threatened and vulnerable species, significant flora and fauna), as well as human settlement (buildings, properties, houses), economic assets (such as primary production land, commercial forests or tourist destinations) and cultural assets (Aboriginal or non-Aboriginal heritage areas and sites). Education is also a very important tool to reduce the impact of fire, and the media is used in peak seasons to raise awareness of fire risks (advertising, radio
announcements, television advertising, risk indicators).
Emission of Air PollutantsUnder the PoEO Act emissions from scheduled premises are regulated by the OEH. In general, emissions and air quality complaints from non-scheduled premises are regulated by local Councils.
Several Councils are taking proactive steps to reduce woodsmoke impacts on air quality including direct funding for air quality improvement programs and also educating residents about ways to minimise woodsmoke.
Bathurst Regional Council has a 2011 Woodheater Rebate Program to help reduce pollution in the region. Bathurst residents can receive financial assistance to replace older style woodheaters with cleaner and more efficient alternatives. The rebate is open for a wide variety of heating alternatives including fixed flue gas, reverse cycle, central heating, and electric heat pump heating. Dubbo City Council has an annual Clean Air/Woodsmoke awareness program for residents.
below Urban sunset at
Mudgee.
2010–2011 Supplementary Report 19
Regional State of the Environment Report

This chapter reports on the quantity and quality of water in the catchments of the reporting
area including the consumption of potable water. In this context, ‘water’ refers to the
rivers, aquatic habitats, creeks, wetlands, groundwater, dams, stormwater, potable water
and the catchment activities which may impact upon them.
There are two main issues in relation to water in the reporting area. Firstly, the quantity of water is often variable within many rivers due to the periodic effects of drought and flood. Many rivers in Australia’s south have been dammed to provide a reliable water supply for agriculture and urban use and increasing demand is placing pressure on inland water
systems. Secondly, the quality of the water existing within the river and groundwater systems is also important, with threats arising from industrial, urban and agricultural pollution sources, as well as from treated wastewater and stormwater.
The Murray-Darling Basin Authority is currently preparing the Murray-Darling Basin
Table 3: Summary Table of Indicator Trend – Water Quantity
Issue Indicator 2008–09 2009–10 2010–11Current Trend
Dam Levels Average dam levels 17.2% 12.3% 60.5%
Water Extraction
Number of irrigation licences from surface water sources 6,279 5,002 5,087
Volume of surface water permissible for extraction under licences (GL) 1,519 1,397 1,595
Actual volume extracted through surface water licences (GL) 130 135 173
Number of bore licences from groundwater resources 21,667 26,321 22,987
Volume of groundwater permissible for extraction under licences (GL) 404 417 2,859
Water sharing plans in place 22 25 45
Town Water Consumption
Total number of serviced properties 75,469 76,048 79,582
Total number of unserviced properties 10,369 18,584 17,591
Annual metered supply (ML) 25,060 24,355 21,599
Annual consumption (Total from WTP) (ML) 28,145 27,508 24,265
Average annual household use (kL/household) 329 303 209
Average level of water restrictions implemented 1.5 1.4 0.8
Council Water Consumption
Area of irrigated Council managed parks, sportsgrounds, public open space (ha) 793 791 911
Water used by council for irrigation (including treated and untreated) (ML) 1,161 719 716
improvement no or little change worsening trend
Note – the above table provides data for 2008–09, 2009–10 and 2010–11 from the same sources. The ‘Current Trend’ arrow relates to a comparison of last year’s
(2009–10) data with this year’s (2010–11) data. Data should be read in terms of the limitations for indicators discussed throughout this chapter. Note also that there are
some new indicators for 2010–11 for which no comparison can be made with previous years. Refer to the Appendix for a list of Councils included in the trend data.
Water
20 2010–2011 Supplementary Report
Water

Plan, as required by the Water Act 2007. The Basin Plan will provide an agreed Basin-wide framework to manage the water resources of the Murray–Darling Basin. The Basin Plan will identify, and seek to protect and restore, key environmental assets which are essential to the life of the rivers, their surrounding landscapes and the cultural values of the communities which depend on those water resources. The Basin Plan will also take into account the impact of this protection and restoration on individual communities, industries, regions and the wider economy.
The Basin Plan is due to start in 2012. Aspects of the plan, such as water trading rules, will take effect from this date while other aspects will only start when new State water resources plans start. The 2011–2012 Comprehensive SoE Report will discuss the impacts of the Basin Plan on the Central West Region.
issue – Water quantity
ConditionContinued demand for surface water and the lack of rainfall (drought) in previous reporting periods placed significant pressure on not only town water supplies but also water licences and allocation for agriculture and industry. However, the past year has seen drought conditions lift across the Central West with the La Ninã weather pattern. The particularly intense weather cycle meant that 2010 was the third wettest year for Australia (since national records began in 1900) with a national mean total rainfall of 690mm, well above the average of 465mm.
Late November 2010 to mid January 2011 was extremely wet through much of eastern Australia. Six major rain events affected large parts of the eastern states resulting in widespread flooding on many rivers. Significant floods affected the Macquarie, Lachlan and Castlereagh catchments in inland NSW in early December 2010. Combined with the devastating flooding in southern Queensland and widespread flooding in parts of northern and western Victoria and Tasmania, the flooding, in terms of extent, impact and severity, was amongst the most significant in Australia’s recorded history.
Sixty-three local government areas in NSW, including those in the Lachlan and Castlereagh catchments, were declared natural disaster areas since December 2010 as a result of flooding. Flood warnings were in place for all western-flowing NSW rivers from the Namoi to the Murrumbidgee.
Many residents around the region were evacuated including approximately 1,000 residents in low-lying areas of Coonamble following the unseasonably wet summer which caused major flooding on the Castlereagh River. However, hundreds of people defied the warning, with the majority of residents choosing to remain. The Mayor tried to encourage residents to move to higher ground, even if only for the few hours when the river peaked, as the Bureau of Meteorology was concerned that the state of the town’s levee would leave residents vulnerable.
In February 2011, there were major flood warnings in place for the Culgoa, Bokhara, Birrie, Darling and Narran Rivers. Flooding lasted for between five to six weeks in many locations, as a result of the floodwaters in Queensland moving south. The towns of Bourke, Louth, Tilpa and Wilcannia were all affected by major floods.
Across the region, the total estimated flood damage bill in 2010–11 was $37.5M with flood damage being quantified in 14 of the 17 LGAs (see Figure 6). The highest cost was in the Dubbo LGA which had estimated flood damages of $9,473,000. The Lachlan and Mid-Western LGAs had flood damage
Figure 6: Flood damage
estimates for each
Council in 2010–11
Dollars
0 2000000 4000000 6000000 8000000 10000000
Wellington
Warrumbungle
Warren
Oberon
Mid-Western
Lachlan
Gilgandra
Dubbo
Cowra
Coonamble
Cabonne
Bourke
Bogan
Blayney
2010–2011 Supplementary Report 21
Regional State of the Environment Report

above Flooding in
Dubbo CBD.
Water
estimates of almost $5M each, whilst more than $1.5M of flood damage was reported in each of the Bourke, Warren, Warrumbungle and Wellington LGAs, ranging from $1.7M to $3.8M.
In 2010, Dubbo City Council announced an allocation of $3.5M for the construction of a stormwater pipeline to protect the CBD from floodwaters of up to 90 cm in depth. It has recognised its existing system is not large enough to handle a flood of that magnitude and is rectifying the problem to cater for a one-in-100 year (1% chance per year) event.
Narromine Shire Council is also planning to extend its flood levee so that houses will not have to raise their floor level. The Department of Planning currently requires new houses to be built one metre above the 1-in-100 flood level which has been causing difficulties for new residents trying to build. The levee raising will mean the stricter controls of floor level will be relaxed,
however the risk of flooding to the region remains. The entire project is expected to cost more than $2.5M and while external funding will be sought, the Council will contribute around $800,000.
Although the floods were devastating for many, the rainfall also resulted in the Murray-Darling Basin recording its wettest year on record, ending a record sequence of below-average rainfall years extending back to 2001. That led to a dramatic recovery in water storages across the basin from 26% at the start of 2010 to 80% at the start of 2011. Following record flooding in 2010 and 2011, water from the Paroo River in south-west Queensland flowed into the Darling River in New South Wales for the first time in 20 years and only the third time since Europeans arrived. The substantial flows and the environ-mental benefits of the floods are expected to be great, particularly for riparian vegetation, native fish and waterbirds.
Water
22 2010–2011 Supplementary Report
Water

Figure 7: Dam levels for
2010–11.
Indicator – Average dam levels
Dam storage levels indicate both the current rainfall and the pressures that water consumption place on water storages. Six major dams in the region – Carcoar, Wyangala, Lake Cargelico, Windamere, Oberon and Burrendong – were used to indicate dam levels. As shown in the summary table (Table 3), the average level for the total of these six dams rose from 12.3% capacity in 2009–10 to 60.5% in 2010–11.
A smaller dam, Lake Rowlands, on a tributary of the Belubula River, had a storage level average of 90% during 2010–11. The water consumption from the dam ranged from 422 kL per month to 7,838 per month during 2010–11.
Figure 7 illustrates the dramatic turnaround in dam storage levels in a single year as the drought was broken. Burrendong is one of the two major dams in the region with a total storage capacity of 1,188,000 ML. Early in the 2010–11 year this huge dam was just about empty, recording a low of only 1.67% of capacity. This jumped to a peak of 87.5% of capacity at the height of inflows and the dam level has averaged 64.9% over the year. The other major dam is Wyangala (1,220,000 ML) which paints a similar picture, with storage ranging from a low of 7.3% to a peak of 91.6% and an average of 63.4% over the year.
threat
Surface and Groundwater ExtractionIrrigation places significant pressure on water resources. While many irrigators have had low levels of water allocation over the past few years, historical over-allocation of water licences has seen additional stress placed on aquatic habitats such as the Macquarie Marshes despite the requirement for environ-mental flows. The demand for groundwater extraction, particularly for irrigation, is increasing and placing additional pressure on aquifers and ecosystems. The increase in mining operations has the potential to have a severe impact on water resources in the region.
Indicator–Number of irrigation licenses from surface water sources
Perc
ent
of C
apac
ity
0
30
60
90
120
150
AverageLowHigh
BurrendongOberon DamWindamereLake CargelicoWyangalaCarcoar
Indicator–Volume of surface water permissible for extraction under licenses
A stabilisation in the number of surface water irrigation licences was reported this year for the Central West Catchment following the significant reduction between 2008–09 and 2009–10. The small increase from 5,002 in 2009–10 to 5,087 in 2010–11 is probably reflective of renewed optimism in the agricultural sector following the significant rains of the last year.
However, the volume of surface water permissible for extraction under licences in 2010–11 showed a 5% increase over 2008–09. The increase in comparison with 2009–10 was much larger, which suggests that the 2009–10 number was probably incorrect and led to an overly positive picture being painted in last year’s report.
The reduction in the number of licences from 2008–09 offers some hope for a long-term beneficial impact on water availabil-ity in the region. However, until the volume of surface water permissible for extraction under licenses starts to show a substantial decrease there will continue to be concerns about the systemic over-allocation of water.
Indicator–Annual volume extracted through surface water licences
The amount of surface water extracted rose significantly from 135 GL to 173 GL in 2010–11 which likely reflects the easing in drought conditions across the region, resulting in increases in allocations to irrigators.
2010–2011 Supplementary Report 23
Regional State of the Environment Report

Water
CAse study: Water sharing in oberon LgAIn July 2010, water levels in Oberon Dam were reaching critical levels (10%) and there were concerns expressed by Oberon Council that the water sharing arrangements associated with the Fish River Water Supply Scheme, which included Oberon Dam, were not working properly.
The Fish River Water Supply Scheme supplies water to Oberon and Lithgow (both primarily out of Oberon Dam), the Sydney Catchment Authority (for a number of townships in the Blue Mountains) and Delta Electricity for power generation. The latter two stakeholders also access water from the Duckmaloi Weir to supplement their water supply. There are also numerous ‘minor customers’ that extract water from the scheme for domestic supply. The scheme is operated by State Water.
The Minister for Water asked the NSW Office of Water to undertake a review of the Fish River Water Supply Scheme’s water sharing arrangements and develop some recommendations which would provide enhanced water security for the township of Oberon, whilst minimising any impacts on other stakeholders in the scheme.
The NSW Office of Water commissioned comprehensive modelling of the current water sharing arrangements and the potential implications of some alternate arrangements. The results of this modelling informed a number of possible modifications to the sharing arrangements. These modifications have been discussed at length with each of the key stakeholders and, as a result, 36 recommendations to improve the water sharing arrangements have been tabled within the Fish River Water Supply Scheme.
In summary, these recommendations were:1. Secure Oberon’s Water supply through:
• Abiggershareofwaterinthescheme• ReduceconstraintsonOberon’saccessatmid-rangestoragelevels;• Increasedconstraintsonotherstakeholders’accessatverylowstoragelevels,whichtakeintoaccountthat
they have alternate water supply options and better take into account their essential requirements during periods of extreme water storage
• EstablishmentofanewLevel8constraintonaccessforotherstakeholderswhenOberonDamsnetstoragedrops to 5% of full supply
2. Modify the share of water in the Scheme for Lithgow, which recognises its historical under-utilisation3. Enhance access to Duckmaloi Weir for both the Sydney Catchment Authority and Delta to reduce the pressure on
Oberon Dam and offset the impacts of reduced access to Oberon Dam for these two stakeholders4. Do not change access for the ‘minor consumers’5. Clarify the water licensing arrangements with State Water6. Provide some guidance for on-going governance arrangements7. Provide a framework for longer term water sharing arrangements.
These recommendations have been forwarded to the Minister for Water for consideration.
Oberon Dam in May 2009 at 12.5% capacity
Water
24 2010–2011 Supplementary Report
Water

above Agricultural
irrigation in Bathurst
(source: David McKellar).
However, this number is still only around 10.8% of the volume permissible for extraction under 2010–11 licences and should be set in context against the 232 GL extracted in 2005–06. The high rainfall in the 2010–11 year has probably also acted to suppress demand for water extraction due to ample supplies of water in farm dams and in the soil itself. It is expected that there will be a further increase in water extraction in the 2011–12 year with ample water available for irrigation allocations.
Indicator–Number of bore licences from groundwater resources
Indicator–Volume of groundwater permissible for extraction under licences
Indicator–Actual volume extracted through groundwater licences
Groundwater is an important natural resource across the reporting region, and the volume of water stored in the watertable vastly exceeds the volume of fresh surface water resources (Western CMA, 2007).
The number of licences for extraction of bore water declined to 22,987 after increasing to 26,321 in the 2009–10 reporting year. The
latest figure represents a 6% increase on the number of licences reported in the 2008–09 year. This suggests that the 2009–10 figure was potentially an aberration in the data and that the longer term picture is still an increasing trend.
There was a large increase in the volume of groundwater permissible for extraction under licences. Although this may be ad-vantageous to primary producers and take pressure off surface water resources, increases in groundwater extractions may have serious impacts on groundwater dependent ecosystems and recharging of streams.
For the first time data has been sourced on the actual volume of water extracted in the region from groundwater, measured in 2010–11 as 97 GL. There has been a long standing problem in managing actual bore water usage because the large majority of bores have never been metered. Therefore the value reported is unlikely to give an accurate reflection of the percentage of actual compared with licensed extraction. However, it will be interesting to track this number over future years as, contrary to normal expecta-tions, an increasing trend in actual usage reported is likely to be positive, if it reflects increased metering of bores.
2010–2011 Supplementary Report 25
Regional State of the Environment Report

Water
Town Water ConsumptionReticulated water consumption is relatively small in comparison to that used for irrigation. In the region it accounts for about four percent of water consumption compared with 88% used for irrigation and eight percent for stock and domestic use (Murray Darling Basin Committee, 2007). Nevertheless, with many towns and regional centres growing, there are increasing pressures on water used for town water supplies.
Indicator – Total number of serviced properties
Indicator – Total number of unserviced properties
As shown in the summary table (Table 3), the number of properties serviced by town water has continued the increased trend reported
in previous years. This expansion of the reticulated systems may increase pressure on water supplies and thus is seen as a worsening trend for this indicator, unless more water sensitive urban design practices are adopted in new developments.
The Councils in the region have also reported a decrease in the number of un-serviced properties: down from 18,520 in 2009–10 to 17,591 in 2010–11, with most or all of these having presumably contributed to the increase in the number of serviced properties. This follows on from a large increase in unserviced properties reported last year, making the long-term trend unclear, but it appears to still be upward when comparing this year’s values to those reported in 2008–09. In some cases, unserviced properties represent potential future demand in waiting on the reticulated system which may increase the pressure on water supplies.
Indicator – Annual metered water supply
Indicator – Annual town water consumption (total from Water Treatment Plant)
Household water use is an indicator of the pressure on water resources, particularly in times of declared drought. As shown in the summary table (Table 3), the annual town water consumption as measured from water treatment plants decreased by almost 12% from 2009–10 to 2010–11 for the local Councils that reported in both years, continuing the trend reported in the last two years. The annual metered supply fell by a similar amount.
Figure 8 provides a breakdown of water consumption across the region in 2010–11 compared with water use in the three previous reporting years. Water consumption has decreased for almost all LGAs with the most notable exception being Bourke which reported a large increase in 2010–11. This is the first year in which the Bourke LGA’s town water has been metered with previous years’ data only being estimates. Whilst Bourke’s consumption would have been reduced during the three previous reporting years due to water restrictions, it is likely that consumption in these years was significantly
Megalitres (ML)0 2000 4000 6000 8000 10000
2010–112009–102008–092007–08
WellingtonWarrumbungle
WarrenOrangeOberon
NarromineMid-Western
LachlanGilgandra
DubboCowra
CoonambleCabonne
BourkeBogan
BlayneyBathurst
Figure 8: Annual town
water consumption
above Bourke Weir.
Water
26 2010–2011 Supplementary Report
Water

underestimated. This in turn means that the overall reduction this year across the region is probably actually larger than reported here.
These reductions in water demand are likely to be, at least in part, a response to the increased rainfall which would have filled domestic rainwater tanks and reduced the demand for household water.
It remains to be seen how much of the reduction is due to permanent behavioural changes in the community resulting from water saving programs, domestic rainwater harvesting, etc.
Indicator – Average annual household use
As shown in Table 3, the data for average annual water use per household across the reporting region shows a sharp decrease in 2010–11 compared with the two previous years, continuing the trend reported last year. Councils have generally attributed the lower household water use to the unusually wet summer.
It will be interesting to monitor if this trend can be maintained as drought conditions across the region ease. Long-term predictions are still for a tightening of water avail-ability and reductions in household water consumption will be necessary to counteract
the overall trend of slowly rising population for the region.
Indicator–Number of residential meters
The number of residential water meters is a new indicator for this year with a total of 69,362 meters reported by the 16 LGAs who were able to provide this data.
Council water consumptionDue to the large number of services they provide, local Councils are large users of water in com-parison to most businesses and households. Their efficient use of water is therefore critical to overall water consumption as well as their important role in civic leadership, educating and leading the community in water use minimisation.
Indicator – The area of irrigated Council managed parks, sportsground and public open space
Indicator – Treated and untreated water used by Council for irrigation
As a potentially significant use of water, the area of irrigated Council facilities provides an indication of high water demand. As shown in the summary table (Table 3), there was a
below Irrigation infra-
structure for cotton fields
in Narromine.
Regional State of the Environment Report

Water
significant increase of just over 15% in the total area of recreation facilities that were irrigated by the local Councils across the region. The increased water availability means that Councils can now irrigate parks, sports fields and other public open spaces where they may have been unable to do so in the past few years due to drought. This may result in high usage of water for this purpose.
However, as shown in the summary table (Table 3), the amount of water used (treated and untreated) for irrigation by the nine local Councils that reported in both years, was almost unchanged in 2010–11 compared with 2009–10. Dubbo and Orange Councils both reported significant reductions in water use despite reporting that they irrigated a much larger area. Cowra reported that it used about a quarter the amount of water it used last year to irrigate the same area.
These changes suggest a marked improvement in the water management practices of some local Councils.
response
Surface and Groundwater Extraction
Indicator – Number of water sharing plans in place
Changes to State legislation commenced in 2004 and have culminated in new river regulations such as Water Sharing Plans. Water Sharing Plans establish rules for sharing water between the environmental needs of the river or aquifer and water users, and also between different types of water use such as town supply, rural domestic supply, stock watering, industry and irrigation. These plans include environmental flows to help maintain riparian and aquatic health even when flows are low due to extraction and drought.
There were 45 Water Sharing Plans in place across the region in the 2010–11 year which is approximately double the level recorded in each of the two previous years. In contrast to the two previous years, there were Water Sharing Plans in place in every one of the seventeen LGAs. In 2008–09 and 2009–10 a third of all plans were implemented in the Narromine LGA. This year Narromine still had three new plans in place but Mid-Western (six
new plans) and Warren (four new plans) were the largest contributors.
The Water Sharing Plans are either for groundwater, regulated sources or surface water. This year saw slightly less regulated plans than in the two prior years, but a big increase in the number of surface water and groundwater plans in place.
Town Water ConsumptionCouncils in the region are responding to pressure on water resources by implement-ing a number of programs. Bathurst Regional Council runs a Water Wise Bathurst campaign that aims to educate residents and businesses on water-saving methods, has a number of water saving projects underway at Council facilities and through their wastewater treatment works, recycles up to two million litres of water a day. Other Councils including Lachlan Shire Council have also continued with their Water Wise education campaigns with information and pamphlets available to residents.
Bourke Shire’s Management Plan for 2011-2014 outlines a strategic area of focus to secure a sustainable water supply for all users. The plan describes the intention to further develop the stormwater drainage system to enable Council to harvest and re-use stormwater run-off, and Council staff are currently trialling a SMART water meter for use on all water supply sources.
These local programs are in addition to the NSW State Government’s $310M Climate Change Fund which has been established to help people save energy and water. This includes rebates for householders to install rainwater tanks for hot water, flushing toilets and washing clothes.
Indicator – Level of water restrictions implemented
As shown in the summary table (Table 3), the average level of water restrictions implemented across the region in 2010–11 has reduced, with most Councils now having either no restrictions or having gone to permanent low-level restric-tions, e.g. Bathurst Council’s voluntary odds and evens watering program. Only Orange and Oberon Councils reported that they were still on high level restrictions.
Water
28 2010–2011 Supplementary Report
Water

Note that there are generally standard definitions of restrictions along the Macquarie River through the Lower Macquarie Water Utilities Alliance and the Bathurst-Orange-Dubbo Alliance.
issue – Water Quality
Condition
Surface water and groundwater quality
Indicator –Total Nitrogen -% of samples exceeding ANZECC guidelines
Indicator –Total Phosphorus -% of samples exceeding ANZECC guidelines
The nutrients nitrogen and phosphorus are essential for plant growth. High concentrations indicate potential for excessive weed and algal growth (including noxious blue-green algae).
As shown in the summary table (Table 4), for those Councils where water quality has been sampled in both years, 80% of samples exceeded the total phosphorus ANZECC water quality guidelines for algal growth in 2010–11, which is an increase from the 73% reported in 2009–10.
No samples in the current reporting period exceeded the total nitrogen ANZECC water quality guidelines for algal growth. This is a further improvement from the already low levels reported in previous years.
Table 4: Summary Table of Indicator Trends – Water Quality
Issue Indicator 2008–09 2009–10 2010–11Current Trend
Surface and Groundwater Quality
Total Nitrogen – Percentage samples exceeding ANZECC guidelines for algal growth 3% 2% 0%
Total Phosphorus – Percentage samples exceeding ANZECC guidelines for algal growth 87% 73% 80%
E.coli – Percentage samples exceeding ANZECC guidelines for irrigated crops and dairy 56% 39% 47%
Town Water Quality
Number of instances drinking water guidelines not met 115 141 119
Number of drinking water complaints 1,021 459 1,029
Industrial/ Agricultural Pollution
Load Based Licensing Fees ($) 132,898 189,862 246,502
Exceedances of license discharge consent recorded 23 22 26
No. of trade waste approvals 392 400 686
Total volume of trade waste discharged to sewer 1,391 1,368 1,500
Erosion & sediment control complaints received by Council 32 129 37
Waste water treatment
Number of septic tanks in LGA 19,910 20,486 20,582
Number of septic related complaints 37 28 13
Stormwater Pollution
Number of gross pollutant traps installed 42 42 43
Volume of litter collected in GPTs (tonnes) 142 872 896
Total catchment area of GPTs (ha) 4,885 4,812 4,812
improvement no or little change worsening trend
Note – the above table provides data for2008–09, 2009–10 and 2010–11 from the same sources. The ‘Current Trend’ arrow relates to a comparison of last year’s
(2009–10) data with this year’s (2010–11) data. Data should be read in terms of the limitations for indicators discussed throughout this chapter. Note also that there are
some new indicators for 2010–11 for which no comparison can be made with previous years. Refer to the Appendix for a list of Councils included in the trend data.
2010–2011 Supplementary Report 29
Regional State of the Environment Report

CAse study: how to make our towns and cities more water sensitive and sustainableThe Central West CMA, on behalf of the Salinity and Water Quality Alliance group of Councils, has invested in a national research program being run out of Monash University called ‘Cities as Water Supply Catchments’.
The program is based around three pillars:1. Towns and Cities as Water Supply catchments – stormwater as a precious resource at a diversity of supply scales.
Designing resilient stormwater harvesting schemes needs to focus on ensuring that they are adaptive to a wide range of possible seasonal rainfall and water demand scenarios.
2. Towns and Cities Providing Ecosystem Services – the built environment functions to supplement and support the function of the natural environment and society. Stormwater harvesting, treatment and infiltration will benefit aquatic ecosystems. While a network of green/blue corridors can effectively convey and/or detain flood waters for flood protection of downstream communities.
3. Towns and Cities Comprising Water Sensitive Communities – building socio-political capital for sustainability.
The aim of the research is to produce a Blueprint that sets the agenda for how people manage stormwater in the future, enabling us to create sustainable urban environments that neither deplete natural resources nor degrade the health and amenity of land and water environments.
The Councils of the Central West of NSW want the Blueprint to start to bring change to the region and make evident that the way forward is to adopt water sensitive urban design as every day practice, rather than just as demon-stration sites. It is hoped that the Blueprint will show all sections of Council, including councillors, and the community, the benefits of adopting water sensitive urban design, rather than it being seen as an unnecessary impediment to doing business.
A raingarden in a car park which filters the stormwater from the hard surfaces and reduces the pollutants prior to the water being either
stored and reused or released into the local receiving waters.
Water
30 2010–2011 Supplementary Report
WaterWater

With the guidance of the Blueprint we can transition our towns and cities to water sensitive towns and cities, through a holistic approach to urban stormwater, including designing for resilience to climate change, that will ensure our water supply is secure and our water environ-ments protected.
The nexus between sustainable urban water management and the vitality and prosperity of urban environments is only beginning to be recognised and includes:• Access to secured and clean water supply• Clean water environment• Flood protection • Urban design strategies• Mitigating urban heat• Creating productive landscapes and • The quality of public open space
In the Central West, the ‘Stormwater to Smartwater Policy’ prepared on behalf of the Salinity and Water Quality Alliance, articulates how we might secure the sustainable growth of our communities at the local level. It is a catchment-wide policy, which includes technical guidelines, for adoption by all Councils that will ensure that water sensitive design concepts are used in the development process. It aims to:• Promote best practice stormwater management • Protect groundwater, creeks, rivers and wetlands by improving the quality of run-off• Protect human health by improving the quality of run-off• Manage all the impacts of new development including salinity and run-off quantity and quality• Protect our land, creeks and rivers from erosion and siltation • Add value while minimising development costs• Reduce potable water demand.
To help promote water sensitive urban design, as there are very few demonstration sites in the catchment, the Central West CMA has provided funding to two Councils to start implementing projects.
Bathurst Regional Council now has a water sensitive design concept in place for a new greenfields development site, adjacent to the highly eroded Sawpit Creek. The aim of the plan is to ensure that run-off – before and after development – remains the same, thus reducing the detrimental impact of future development on the creek. The creek has now been rehabilitated with in-stream erosion control structures as well as revegetation of its banks, so it is important that this rehabilitation is not threatened by future development.
Control of stormwater run-off from the development site is achieved by re-using rainwater at each house, preferably internally for toilet flushing and laundry use, and ensuring maximum water infiltration throughout the site through the use of biofiltration (swales and raingardens), whilst using natural flowlines to create water features within the allocated open space areas of the development.
At Dubbo City Council, a car park has been designed to clean and capture run-off, by filtering it through gardens that are designed to capture pollutants and slow the water. This water is then stored underground for reuse in irrigation.
Establishing water sensitive towns and cities will involve significant departures from the conventional urban water management approach, and will require a major socio-technical overhaul of conventional approaches. Through membership of the ‘Cities as Water Supply Catchments’ program, adoption of the ‘Stormwater to Smartwater Policy’ and through local capacity building activities, it is hoped that the Councils of the Central West region will be successful in adopting new and more sustainable strategies for urban stormwater management and development of our towns.
Section through a typical rain garden.
2010–2011 Supplementary Report 31
Regional State of the Environment Report Regional State of the Environment Report

Indicator – E.coli - % of samples exceeding ANZECC guidelines
E.coli is found in the intestines of animals and does not originate from other environmen-tal sources. For this reason, E.coli is a highly specific indicator of faecal contamination in drinking water. As shown in the summary table (Table 4), there was an increase in the percentage of samples that exceeded ANZECC water quality guidelines (and thus a worsening trend in this indicator). Note that the ANZECC guideline used here is for raw human food crops (e.g. lettuces) in direct contact with water or for watering of pasture/fodder for dairy animals with no withholding period.
Figure 9 shows the percentage exceedances of this ANZECC guideline from the reporting Councils. It shows that many of the streams in the region have high E.coli readings which have implications for drinking and recreation. The reasons for these exceedances could include stock watering close to and in streams, poorly treated sewage and discharge from unregulated septic systems. Note that the indicator does not reflect on the quality of drinking water supplied for town water from treatment plants.
Town Water Quality
Indicator – Number of instances drinking guidelines not met
Indicator – Number of drinking water complaints
% samples exceeding ANZECC guidelines0 20 40 60 80 100
2010–112009–102008–092007–08
WellingtonWarrumbungle
WarrenOrange
NarromineMid-Western
LachlanGilgandra
DubboCoonamble
CabonneBlayney
Bathurst
As shown in the summary table (Table 4), the number of drinking water complaints (for the 16 Councils reporting in both years) increased significantly from 459 in 2009–10 to 1,029 in 2010–11. The majority of these relate to Bathurst’s town water supply and are for discolouration. For the Councils that reported in all of the last three years, the number of complaints this year was very similar to the 1,021 complaints recorded in 2008–09.
The quality of drinking water is very important to the community and this increase in the number of complaints made regarding water quality is somewhat tempered by the fact that the number of instances where drinking water guidelines were not met decreased from 144 to 119 in 2010–11. Most of this change was due to the implementation of the new Mendooran water supply system (see case study), with guideline exceedances in Warrumbungle Shire halving from 46 in 2009–10 to 22 in 2010–11. With the Mendooran system now fully operational, it is likely that this number will fall further in the next SoE reporting period.
threat
Industrial/Agricultural Pollution
Indicator – Number of trade waste approvals
Indicator – Total volume of trade waste discharged to sewer
Indicator – Trade waste licenses in force currently
Councils have a number of statutory respon-sibilities for the approval of liquid trade waste discharged to the sewerage system under the Local Government Act 1993. Liquid trade waste means all liquid waste, other than sewage of a domestic nature. As shown in the summary table (Table 4), there was a large increase in the total number of trade waste approvals in 2010–11 reported from all of the participating Councils: jumping to 686 from 400. A large proportion of this increase is explained by Bathurst LGA which reported 273 licences in force and had previously reported
Figure 9: Percentage of
E.coli samples exceeding
ANZECC guidelines for
irrigated crops and dairy.
Water
32 2010–2011 Supplementary Report
Water
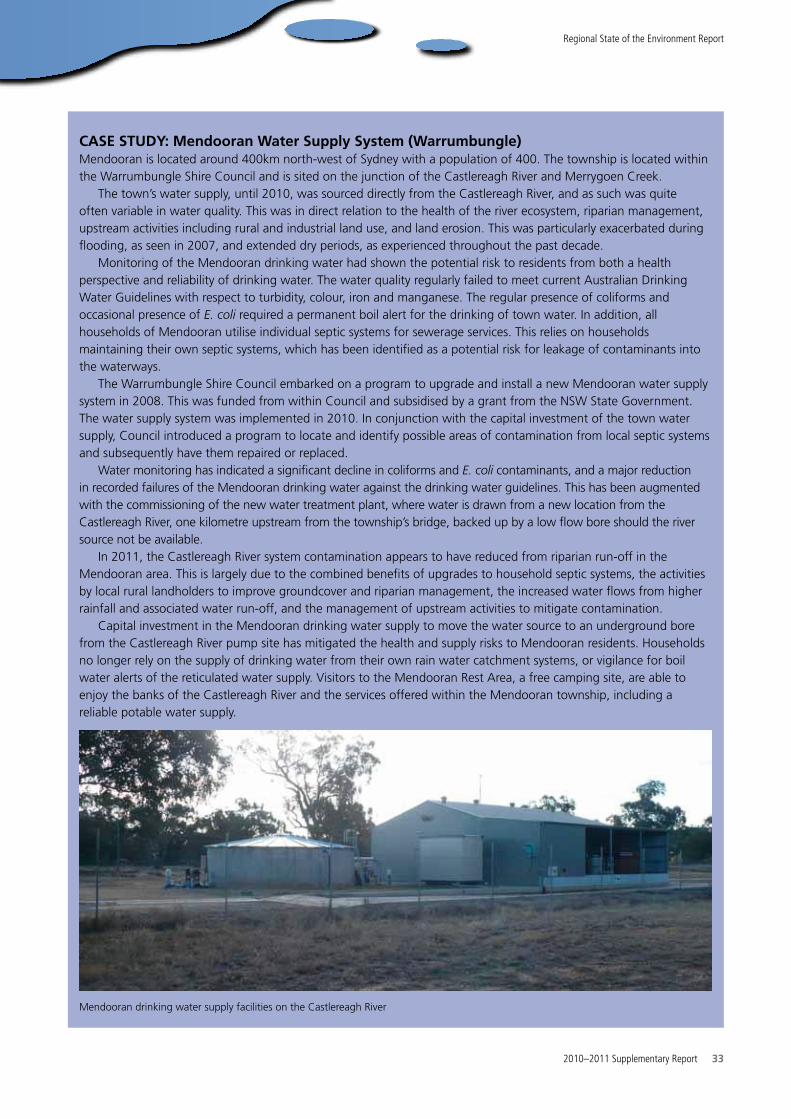
CAse study: Mendooran Water supply system (Warrumbungle)Mendooran is located around 400km north-west of Sydney with a population of 400. The township is located within the Warrumbungle Shire Council and is sited on the junction of the Castlereagh River and Merrygoen Creek.
The town’s water supply, until 2010, was sourced directly from the Castlereagh River, and as such was quite often variable in water quality. This was in direct relation to the health of the river ecosystem, riparian management, upstream activities including rural and industrial land use, and land erosion. This was particularly exacerbated during flooding, as seen in 2007, and extended dry periods, as experienced throughout the past decade.
Monitoring of the Mendooran drinking water had shown the potential risk to residents from both a health perspective and reliability of drinking water. The water quality regularly failed to meet current Australian Drinking Water Guidelines with respect to turbidity, colour, iron and manganese. The regular presence of coliforms and occasional presence of E. coli required a permanent boil alert for the drinking of town water. In addition, all households of Mendooran utilise individual septic systems for sewerage services. This relies on households maintaining their own septic systems, which has been identified as a potential risk for leakage of contaminants into the waterways.
The Warrumbungle Shire Council embarked on a program to upgrade and install a new Mendooran water supply system in 2008. This was funded from within Council and subsidised by a grant from the NSW State Government. The water supply system was implemented in 2010. In conjunction with the capital investment of the town water supply, Council introduced a program to locate and identify possible areas of contamination from local septic systems and subsequently have them repaired or replaced.
Water monitoring has indicated a significant decline in coliforms and E. coli contaminants, and a major reduction in recorded failures of the Mendooran drinking water against the drinking water guidelines. This has been augmented with the commissioning of the new water treatment plant, where water is drawn from a new location from the Castlereagh River, one kilometre upstream from the township’s bridge, backed up by a low flow bore should the river source not be available.
In 2011, the Castlereagh River system contamination appears to have reduced from riparian run-off in the Mendooran area. This is largely due to the combined benefits of upgrades to household septic systems, the activities by local rural landholders to improve groundcover and riparian management, the increased water flows from higher rainfall and associated water run-off, and the management of upstream activities to mitigate contamination.
Capital investment in the Mendooran drinking water supply to move the water source to an underground bore from the Castlereagh River pump site has mitigated the health and supply risks to Mendooran residents. Households no longer rely on the supply of drinking water from their own rain water catchment systems, or vigilance for boil water alerts of the reticulated water supply. Visitors to the Mendooran Rest Area, a free camping site, are able to enjoy the banks of the Castlereagh River and the services offered within the Mendooran township, including a reliable potable water supply.
Mendooran drinking water supply facilities on the Castlereagh River
2010–2011 Supplementary Report 33
Regional State of the Environment Report

about 200 less due to a data error. However, even with Bathurst LGA removed from the numbers there is still a 28% increase from last year, with significant increases reported in Cowra, Dubbo and Gilgandra. In Cowra, the implementation of a new trade waste policy has led to a substantial increase in approvals.
The total volume of trade waste discharged to the sewer also increased by approximately 10% to a total of approximately 1,500 in the 2010–11 year.
Indicator – Erosion and sediment control complaints received by Council
One measure of the threat to waterways from sediment pollution is the number of erosion and sediment control complaints received by the local Councils. The complaints can range
from sediment spilling out of construction sites to obvious plumes of sediment flowing into streams.
As shown in the summary table (Table 4), the number of complaints fell dramatically for those Councils that reported in the last three years, nearly returning to what is probably the more normal level reported in 2008–09. The higher 2009–10 numbers were heavily influenced by complaints regarding erosion/sediment control for roads reported by Gilgandra Council (64) and Mid-Western Regional Council (14).
Indicator – Load based licensing volume and fees paid
The load-based licensing (LBL) scheme sets limits on the pollutant loads emitted by holders of environment protection licences, and links licence fees to pollutant emissions. LBL is a powerful tool for controlling, reducing and preventing air and water pollution in NSW.
For the nine Councils reporting in 2010–11 and in 2009–10, the LBL fees paid increased by approximately 23% to $246,503, which follows a 30% increase reported last year. These numbers may suggest a worsening trend with the increased pollutant loads posing a threat to the environment.
The data on LBL volume is not readily comparable across the last three years. This is due to a combination of some questionable data in previous years and a change to the data collection this year whereby Councils have been asked to provide volumes split by pollutant type. Figure 10 shows this breakdown.
Indicator – Exceedances of license discharge consent recorded
As shown in the summary table (Table 4), there was a small increase reported in the number of exceedances of licence discharge consent to 26 cases in 2010–11.
Septic tanks
Indicator – Number of septic tanks in LGA
There are an estimated 20,580 septic systems in use across the region (see Figure 11) and as shown in the summary table
Figure 10: Load based
licensing volume
by pollutant type in
2010–11.
Figure 11: Estimated
number of septic tanks
by LGA.
kg of Pollutants0 20000 40000 60000 80000 100000 120000
Suspended SolidsPhosphorousOil & GreaseNitrogenBOD
WellingtonWarrenOrangeOberon
NarromineMid-Western
LachlanGilgandra
DubboCowra
CabonneBourkeBogan
BlayneyBathurst
Number of septic tanks by LGA
0 1000 2000 3000 4000 5000
2010–112009–102008–092007–08
WellingtonWarrumbungle
WarrenOrangeOberon
NarromineMid-Western
LachlanGilgandra
DubboCowra
CoonambleCabonne
BourkeBogan
BlayneyBathurst
Water
34 2010–2011 Supplementary Report
Water

Our water resources are of major
environmental, social and economic value
to NSW, and if water quality becomes degraded
this resource will lose its value.”DECCW
(Table 4) this number has increased slightly from 2009–10 and more significantly since 2008–09. If poorly maintained, septic systems can be a source of nutrients to local streams and potentially cause problems such as blue-green algae blooms and issues for public health.
Indicator – Septic related complaints
One way to gauge problems related to the management of septic systems is through the number of septic related complaints to Councils. As shown in the summary table (Table 4), the number of septic-related complaints decreased for those Councils that reported last year, continuing the downward (improving) trend. The bulk of this decrease came from the Warrumbungle LGA where complaints fell from 12 in 2009–10 to only one in the last year. This is probably related to the program of improvements and repairs to septic systems in Mendooran (see case study above).
Some Councils, such as Dubbo City Council, have strategies to monitor and educate users in the management of septic systems.
Indicator – Proportion of annual failed wastewater treatment plant inspections
Only two Councils (Blayney and Orange) reported any failed WTP inspections in the 2010–11 year compared with three Councils in the previous year.
SalinityLand use has a significant impact on the level of salinity in streams through removal of vegetation, irrigation and discharges of saline water. While geology, topography and prevailing weather conditions also affect salinity, land use is a primary factor that affects mobilisation of salts into waterways and through soils. Salt generally degrades aquatic habitats as well as adversely impacting on soils and the crops and vegetation utilising those soils.
Due to the nature of the Macquarie River, most salt generated in the uplands and slopes is deposited back into the landscape through irrigation, floodplain entrapment or deposition within the
wetlands and effluent systems of the lower catchment areas.
A proportion of the salt is also discharged into the Barwon-Darling River system. Salinity in the Barwon-Darling is highly variable and can range from 200 EC to more than 3,000 EC, although the median is generally around 500 EC (Western CMA, 2007).
The levels of salt load in the Macquarie River are expected to rise by 2.33% by 2020 and by 2.88% by 2050. The Lachlan River salt loads are predicted to rise by lower levels: 1.11% by 2020 and 1.81% by 2050 (OEH, 2009).
Indicator – Average salinity levels in selected streams
This is a new indicator. Annual average salinity levels for selected streams in 2010–11 were:• Bogan River at Gongolgan: 268 EC• Castlereagh River at Gungalman: 533 EC• Cudgegong River downstream of
Windamere Dam: 433 EC• Macquarie River at Dubbo: 348 EC• Macquarie River at Warren: 397 EC• Macquarie River at Carinda: 453 EC
above Water filtration
plant, Bathurst (source:
David McKellar).
2010–2011 Supplementary Report 35
Regional State of the Environment Report

responseA Priority Action Plan has been developed as part of the NSW Diffuse Source Water Pollution Strategy. It identifies agreed projects that will be progressed across NSW (including the reporting region) to help improve management of priority diffuse source water pollution problems.
The Central West CMA supports a water quality monitoring program in conjunction
with the Salinity and Water Quality Alliance, a working group of Councils across the catchment sharing knowledge, ideas and engaging in cooperative projects to improve water quality outcomes across the catchment. Data is collected by Council officers on a six-monthly basis and is provided to the CMA, which collates the data (note that this data is used in this Report).
CAse study: phosphorus – a conundrum for Local government (dubbo)Phosphorus is an additive in laundry detergents and useful in overcoming the hardness of water. Whilst demand for phosphorus continues to grow significantly, the availability and supply of phosphorus is finite. Therefore re-using wastewater for agricultural production or greywater re-use is an excellent way to utilise phosphorus without requiring more.
Despite its water softening properties, phosphorus has a number of significant implications for Australia’s future ecological, environmental and economic conditions. A study by the Co-operative Research Centre for Fresh Water Ecology and Albury City Council found that using phosphorus-free laundry detergents could save communities tens of thousands of dollars each year in sewage treatment costs, as well as reducing the risk of toxic algal blooms.
Dubbo City Council’s use of waste water at the Greengrove Effluent Irrigation Facility for hay and lucerne production is an example of Council’s commitment to sustainability of the local environment and has consider-able cost savings for the community. At Greengrove, effluent is used under strict environmental controls for crop production which is harvested and removed from the Greengrove facility. This in turn reduces the need for the application of additional phosphorous for plant production industries.
For the first time in many years, Dubbo City Council recently discharged treated effluent into the river system due to weather conditions. Effluent contains a very high percentage of phosphorus which incurs significant discharge fees as set by the OEH. Discharge fees of $59,717 were payable in 2010/2011. These fees could be substantially reduced if phosphorus was not included in laundry detergents. Reducing the potential nutrient loading of waterways is vital as high nutrient loads can lead to the occurrence of blue green algal blooms that can poison water supplies (leading to more expensive water processing), poisoning of livestock, fish populations and low oxygen levels in the water. Such conditions could increasingly become an issue for the local community as future environmental impact and OEH charges will reflect increasing costs to the community.
A not-for–profit organisation, ‘Do Something’, is working on a National Phosphate Ban campaign and has success-fully committed a number of Australian supermarkets and detergent manufacturers to remove phosphate from their products. There is currently a voluntary labelling scheme for laundry detergent packets which have either a P (‘contains phosphorus’) or a NP (‘virtually no phosphorus’). By choosing NP detergent, you are helping to reduce the environmental impact of your wastewater. Dubbo City Council is working to identify a mix of voluntary and regulatory measures it can take to reduce the use of phosphorus in its operations.
Phosphorus is commonly found
in washing detergents
Water
36 2010–2011 Supplementary Report
Water

CAse study: orange City Council’s on-site storm Water Management & Contamination self Assessment toolkit
In the initial stages of developing a Business Self-Assessment toolkit, it was recognised that to be useful to a range of businesses, the tool needed to flag areas where savings could be made. This would be by way of best practices for waste management, site management, water conservation, stormwater protection, through to more cost effective purchasing, insurance assessments, and accreditation.
The Business Self-Assessment Toolkit and Resource Library were developed in consultation with ten local Orange businesses from a variety of industries. When consulting with the ten businesses, Orange City Council found that the businesses were looking for a guide to self assess their own water quality management practices and resources to support any improvements identified.
The desired resources included information to increase general internal staff awareness of practices for managing water quality and conserving water, meeting legislation and protecting the local environment.
The Resource Library links to the Self-Assessment Tool, providing businesses with support to respond to areas that have been identified for improvement.
Resources have been developed by Orange City Council and collected from a variety of authoritative sources including local, state and federal government departments and educational institu-tions. Resources include a series of regulatory codes and guidelines as well as education posters, fact sheets and signage.
Harvested stormwater entering Suma Park Dam, Orange.
Stormwater Pollution
Indicator – Number of gross pollutant traps installed
Indicator – Amount of litter collected in gross pollutant traps
Indicator – Total catchment area of gross pollutant traps
Litter collected in gross pollutant traps (GPTs) provides an indication of potential water quality impacts. Installation of GPTs is a Council response to litter impacts. These devices trap larger pollutants such as litter and coarser sediments in stormwater drains and outlets, but they do not trap smaller particles and heavy metals. While there are ongoing costs associated with maintenance and cleaning of these traps, there are significant benefits to aquatic ecosystems and the visual improvement of waterways plays a significant role in community awareness of Council envi-ronmental programs.
As shown in the summary table (Table 4), there was little change in the number of GPTs installed by those Councils that reported in both years with the only change being one new GPT in the Dubbo LGA.
The total catchment area that drained to the GPTs was unchanged.
The volume of litter collected in the GPTs in the reporting LGAs increased slightly to 896 tonnes from the 872 tonnes reported last year. This suggests that the much lower number reported in 2008–09 could have been an aberrant reading, probably due to teething problems in Councils’ data collection.
Indicator – Number of Erosion and Sediment Policies implemented
This was a new indicator in 2009–10 which simply tracks which Councils have implemented an erosion and sediment control policy.
Only four of the 17 Councils in the region reported that they have a policy in place compared with six who said they had a policy in place in 2009–10. One of those who have changed their status from yes to no is Dubbo City Council which reported last year that their policy was outdated and needed review.
2010–2011 Supplementary Report 37
Regional State of the Environment Report

Table 5: Summary Table of Indicator Trends - Biodiversity
Issue Indicator 2008–09 2009–10 2010–11Current Trend
Habitat Loss Vegetation protected and rehabilitated through CMA incentive funding (ha) 7,583 4,175
Addition to National Park estate (ha) 711 22,605 115,289
Proportion of Council reserves that is bushland/remnant vegetation 52% 52% 52%
Habitat areas revegetated (ha) 244 294 114
Environmental volunteers working on public open space (hours) 13,257 14,520 15,591
Project Funding Agreements with Landholders 73 278
Threatened Species
State Threatened species listed for Central West and Lachlan catchments 117 117 117
Fish restocking activities: native species 252,401 378,219 276,683
Fish restocking activities: non-native species 311,000 296,500
Invasive Species Number of declared noxious weeds 112 116 114
Land Clearing Clearing Complaints to OEH 47 26
Riparian Riparian vegetation recovery actions 38 12 25
Riparian vegetation recovery area (ha) 1,626 1,793 156
Roadside Roadside vegetation management plans 5 6 6
improvement no or little change worsening trend
Note – the above table provides data for2008–09, 2009–10 and 2010–11 from the same sources. The ‘Current Trend’ arrow relates to a comparison of last year’s
(2009–10) data with this year’s (2010–11) data. Data should be read in terms of the limitations for indicators discussed throughout this chapter. Note also that there are
some new indicators for 2010–11 for which no comparison can be made with previous years. Refer to the Appendix for a list of Councils included in the trend data.
There are a wide variety of ecosystems across the reporting region, formed by interactions across a range of factors including soils, local climate, vegetation types, and disturbance by activities such as farming and water availability. Habitat loss and degradation is an issue in the region, particularly through activities such as poor land use planning and management practices, inap-propriate fire regimes, development and pest
Biodiversity is essential to functioning ecosystems which maintain important processes on
which all life depends. Many species of plants and animals rely on specific habitats in order
to survive. The value of biodiversity extends beyond the catchment boundaries, providing
national and international benefits.
and weed invasion. This can result in a loss of species or changes in species composition, such as threatened ecological communities and loss of ecosystem services.
This issue of decline is increasingly being recognised by farmers and others in the community, and is being incorporated into the evolving natural resource management response such as CAPs.
Water
38 2009-2010 Supplementary Report
Biodiversity

Biological diversity, or biodiversity, is defined as:
‘The variety of life forms, the different plants, animals and micro-organisms, the
genes they contain, and the ecosystems they form. Biodiversity includes genetic
diversity, species diversity and ecosystem diversity’ NSW Government, 2008
above The remains
of a River Red Gum
(Eucalyptus camaldulensis)
that rests inside Warren
Township’s Macquarie
Park on the banks of the
Macquarie River.
The tree fell after being
struck by lightning during
the July 1998 flood.
It has a circumference
of 8.8 metres and was
later carbon dated at 950
years old. Because of its
environmental and culture
significance the base of
the tree was reinstated to
its original position.
issue – Loss of biodiversity
ConditionA recent study by Goldney, Kerle and Fleming (2007) examined the condition of flora and fauna in the Central West Catchment. By combining information about remnant vegetation and its condition and the status of the fauna with a range of landscape indicators about the health of the land, the study developed an indication of landscape condition across the catchment. The study found that the eastern half to two-thirds of the Central West Catchment is in poor condition and most of the remainder is in moderate condition. Some areas have a high level of remnant vegetation but the condition of that vegetation, much of which is heavily grazed, reduces the condition value.
Indicator – Addition to National Parks estate
Indicator – Area of State Forest in the LGAs
The area of land that is placed under protection, or reserved, may be considered an indicator of the amount of protected habitat available in the Council area. However many types of habitat are not well represented in the reserve system, as reserves tend to be on land that has low economic value rather than land that has representative (ecological) value.
In 2010–11, 115,289 ha were added to the National Park estate within the reporting region. This is an increase from the 22,605 ha added in 2009–10. There were eight new national parks, state conservation areas and community conservation areas gazetted comprising 88,017 ha. This figure is dominated by the new Toorale National Park and the Toorale State Conservation Area located in Bourke LGA which total 85,251
ha. There was a further 27,272 ha added to existing national parks, nature reserves and state and community conservation areas in the region during 2010–11.
The reserved land under State Forests in the 2010–11 reporting year was 273,562 hectares which includes both native forests and plantations. Although managed in a variety of different ways across the region, they do provide larger areas of habitat in what is otherwise a highly cleared landscape.
Indicator - Proportion of Council reserves that are bushland/remnant vegetation
In 2010–11, 52.8% of the 5,894 ha of Council reserves were bushland or remnant vegetation, across the 11 Councils which provided reliable data for this indicator. This indicator measures the amount of habitat available in those
2010–2011 Supplementary Report 39
Regional State of the Environment Report

Figure 12: Number of
state threatened species,
EECs and populations
by CMA.
below Blue Tongue Lizard
(Lyndel Wilson).
State Threatened Species, EECs and Populations by CMA
0 30 60 90 120 150
Endangered Population
Endangered Ecological Community
Vulnerable
Endangered
Critically Endangered
Lachlan CMA
Central West CMA
reserves managed by local Councils and is essentially unchanged from last year.
Threatened speciesThere are numerous Threatened Species and Endangered Ecological Communities (EECs) across the region. Box-Gum Woodland, (also known as Box Gum Grassy Woodland) is one of the most threatened communities in the State with less than 7% of its original extent remaining in most areas across the region (National Parks and Wildlife Service, 2003). It is listed on both State and National registers.
It was widely found across the Central West and Lachlan regions, however the high level of clearing linked to agricultural land use in the reporting region has caused significant decline.
Indicator – Locally sensitive ecological communities and species list
Indicator – Number of State threatened species recorded in LGA
Threatened Species, Populations and EECs are listed under the NSW Threatened Species Con-servation Act 1995, the Fisheries Management Act 1994 and the Environmental Protection and Biodiversity Conservation Act 1999. Figure 12 shows the breakdown of threatened species, EECs and Endangered Populations across the Central West and Lachlan CMA areas. The number of threatened species listed in the Central West CMA area is 117 and is unchanged from last year. The number of Endangered Populations remained constant but there was one additional EEC listed (Tablelands Snow Gum, Black Sallee, Candlebark and Ribbon Gum Grassy Woodland) in the area.
A list of threatened species, populations and EECs for the CMAs in the region can be found at http://www.threatenedspecies.environment.nsw.gov.au/index.aspx.
In addition to the species listed under State and Federal legislation, a number of the local Councils in the region are monitoring locally sensitive species. For example, in the Gilgandra LGA the turquoise parrot, koala, malleefowl, glossy black-cockatoo and yellowbellied sheathtail-bat are locally sensitive species, which are restricted to relatively small habitat areas within the Curban State Forest, Goonoo State Forest and the Warrumbungles National Park.
threat
Land Clearing
Indicator – Number of complaints regarding clearing rates of native vegetation
The removal of vegetation, whether individual trees or large scale (broad acre) land clearing contributes to the changing character and
Water
40 2010–2011 Supplementary Report
WaterBiodiversity

viability of remnant vegetation and can dra-matically affect the health of the landscape and local amenity. Information on the number or area of trees removed is not recorded by local Councils, however the CMAs can approve vegetation clearance through Property Vegetation Plans (PVPs). During 2010–11, the Central West CMA approved 23 Clearing PVPs and two incentive PVPs. This was an increase from the 21 Clearing PVPs reported in 2009–10.
Some land clearing is approved by Councils or the State Government under development applications, such as residential or industrial development (including mining). For example, Mid-Western Regional Council has several large mines which will continue clearing significant areas through new approvals and expansions in the next few years.
In 2010–11 there were 26 land clearing complaints recorded by OEH which was down from the 47 complaints recorded in the previous year. Figure 13 shows the land clearing complaints received by OEH across the LGAs in the reporting region for the last two reporting periods.
Invasive Species
Indicator – Number of declared noxious weeds
The reporting area has 114 declared noxious weeds (NSW DPI, 2011), and a significant number of environmental weeds present. This number has decreased slightly since the previous reporting year of 2009–10 but is up from the prior year and so shows no clear trend. Noxious weeds declared for the reporting Councils can be found by accessing the website: www.dpi.nsw.gov.au/agriculture/pests-weeds/weeds/noxweed.
Indicator – Number of non-native fish restocked
Restocking with non-native fish is a threatening process for some native aquatic species. The NSW Department of Primary Industries - Fisheries reported that 296,500 non-native fish were restocked in 2010–11 comprising approximately 60% rainbow trout and 40% brown trout.
response
Agreements with landholders
Indicator – Area and number of conserva-tion agreements
Indicator – Area and number of wildlife refuges
These are new indicators. The NSW Government is committed to the protection and conservation of high conservation value lands. Parks and reserves already protect
Number of complaints by LGA
0 2 4 6 8 10
2010–112009–10
WellingtonWarrumbungle
WarrenOrangeOberon
NarromineMid-Western
LachlanGilgandra
DubboCowra
CoonambleCabonne
BourkeBogan
BlayneyBathurst
Figure 13: Number of
land clearing complaints
by LGA.
above The removal
of Willows from the
Cudgegong River in
Mid-Western LGA.
2010–2011 Supplementary Report 41
Regional State of the Environment Report

CAse study: Water Lettuce and the Warrego river–prevention is Cheaper than Cure (bourke)The Warrego River catchment is located in south west Queensland and north west New South Wales and covers an area of 65,000 square kilometres.
It briefly flows westward from its source in the Carnarvon Ranges towards Tambo, but then turns to flow basically southwards to its junction with the Darling River, approximately 35 kilometres north east of the township of Louth, approximately 900 kilometres from its origin. The Darling River Basin is 112,834 square km in size and eventually becomes the Murray Darling Basin.
The river is an ecological base for many species of native fish including Murray Cod (threatened population), as well as providing an important sanctuary for many species of water birds, reptiles and native animals and provides all landholders along its length with water for both stock and domestic consumption.
Cunnamulla, which is approximately 110 kilometres north of the New South Wales/Queensland state border, has a weir pool (A D Tanock Weir) constructed on the Warrego River as a safe guard for the town’s water supply.
Water Lettuce (Pistia stratiotes) has been a problem in this weir pool for a number of years, with both the Paroo Shire Council and Queensland Department of Primary Industries and Fisheries being unsuccessful in containing and controlling this noxious weed. Water Lettuce outbreaks can have serious impacts on native aquatic animals and plants, as well as interfere with irrigation, boating and water sport activities.
Much of the Murray-Darling catchment is currently free of this weed and all efforts should be made to control known infestations and prevent its further introduction.
The Darling River system is largely free of aquatic weeds and Bourke Council’s Senior Weeds Officer, Don Mackenzie has stated that he would like to keep it that way.
He has worked closely with Paroo Shire and Queensland Department of Primary Industries to ensure the escaped infestation does not enter the Darling River.
In January 2008, whilst experiencing major flooding, many reports were received by both the above organisa-tions, of Water Lettuce in abundance, being seen floating over the top of the weir pool and flowing downstream. In March 2008, an initial aerial survey was conducted over the Paroo and Warrego Rivers which resulted in no sightings of the weed.
There have since been a further three flood events, each time requiring an aerial inspection of the rivers, searching for this State prohibited aquatic weed. Fortunately to date, no Water Lettuce has been found.
Aerial inspections by helicopter are not cheap (approximately $1,200 per hour for a turbine powered machine), however the cost so far has been minimal compared to the costs that would be required if this weed was to become established along the Paroo, Warrego and Darling Rivers.
Water Lettuce (Pistia stratiotes) at Cunnamulla
Water
42 2010–2011 Supplementary Report

more than five million hectares of NSW, or around 6% of the state’s area. However, many valuable landscapes and habitats fall on land that is either privately owned or required for public amenity.
OEH has developed major programs to encourage broad involvement in land conser-vation across NSW, regardless of tenure. OEH also works in partnership with other organi-sations to support non-statutory community programs which promote conservation on private lands.
The Conservation Partners Program provides the opportunity to protect and conserve significant natural and cultural heritage values on private and non-re-served public lands through Conservation Agreements and Wildlife Refuges under the National Parks and Wildlife Act 1974. These long-term legal commitments are entered into voluntarily and complement the public national park and reserve system. These lands play a critical role in connecting conserva-tion areas to facilitate species survival and movement, and strengthen the resilience of protected areas by acting as a buffer to threats, including the potential implications of climate change.
At the end of the 2010–11 reporting period there were 18 Conservation Agreements totalling 2,160 ha across the 17 LGAs in the region. Cowra LGA had the most Conservation Agreements with four, followed by Mid-Western, Oberon and Bathurst each with three.
At the end of 2010–11, there were 111 Wildlife Refuges totalling 259,267 ha across the 17 LGAs in the region. Bathurst LGA had the most Wildlife Refuges with 17, followed by Cabonne and Oberon each with 14. The total area of Wildlife Refuges in the region is dominated by one Wildlife Refuge in Bourke LGA which covers 142,295 ha.
RehabilitationRehabilitation and sustainability projects have been developed by organisations to help reduce the impact of land clearing on biodiver-sity and to ensure some level of connectivity within the increasing urban landscape.
Indicator - Vegetation protected and reha-bilitated through CMA incentive funding
2010–2011 Supplementary Report 43
Regional State of the Environment Report

Cowra Council is currently promoting an as yet unpublished Futures 30 Natural Resource Management Group publication called Right Plant Right Place Manual which shows how biodiversity and eventually environmental sustainability can be achieved through correct planting. The manual describes popular planting species that are indigenous to the Central West region and the role they play in contributing to biodiversity. It also explains effective planting techniques, has suggestions for monitoring and contains easy-to-use botanical identification notes.
Indicator – Environmental volunteers working on public open space
Several Councils reported high levels of volunteer participation in environmental initiatives which improve habitat for native species with contributions from a range of Council co-ordinated and local community groups. As shown in the summary table (Table 5), the total number of volunteer hours recorded increased in 2010–11 to 15,591 from 14,520 in 2009–10, continuing the positive trend reported last year. Nine local Councils reported volunteer hours with the largest con-tributions being in the Bathurst, Dubbo and Orange LGAs, all of which have an appropri-ately qualified officer employed specifically to recruit and engage volunteers. Dubbo again recorded approximately two-thirds of the total hours for the region.
previous page
Re-vegetation works
along Raglan Creek,
Bathurst (source: David
McKellar).
below right Tree Day
activities in Dubbo.
below Pink cockatoos
in Eucalypt tree in
Coonamble.
The Central West CMA reported that the area of vegetation protected and rehabilitated throughout its area as a result of its funding incentives for landholders was 4,153 ha in 2010–11, comprising 2,611 ha of terrestrial vegetation, 909 ha of wetland vegetation and 653 ha of riparian vegetation. This decrease from the total of 7,583 ha reported in 2009–10 is due to continued funding constraints, and hence it appears as a worsening trend in the summary table (Table 5).
Indicator – Habitat areas revegetated
In 2010–11, 314 ha of Council land was revegetated, and for councils reporting over each of the last three years the total was 114 ha, which is a decrease from the 294 ha reported in 2009–10. However, there was little or no revegetation in most LGAs with almost all the activity occurring across just five LGAs: Bathurst (61 ha), Cabonne (200 ha), Dubbo (10 ha), Mid-Western (30 ha) and Orange (5 ha).
Water
44 2010–2011 Supplementary Report
WaterBiodiversity
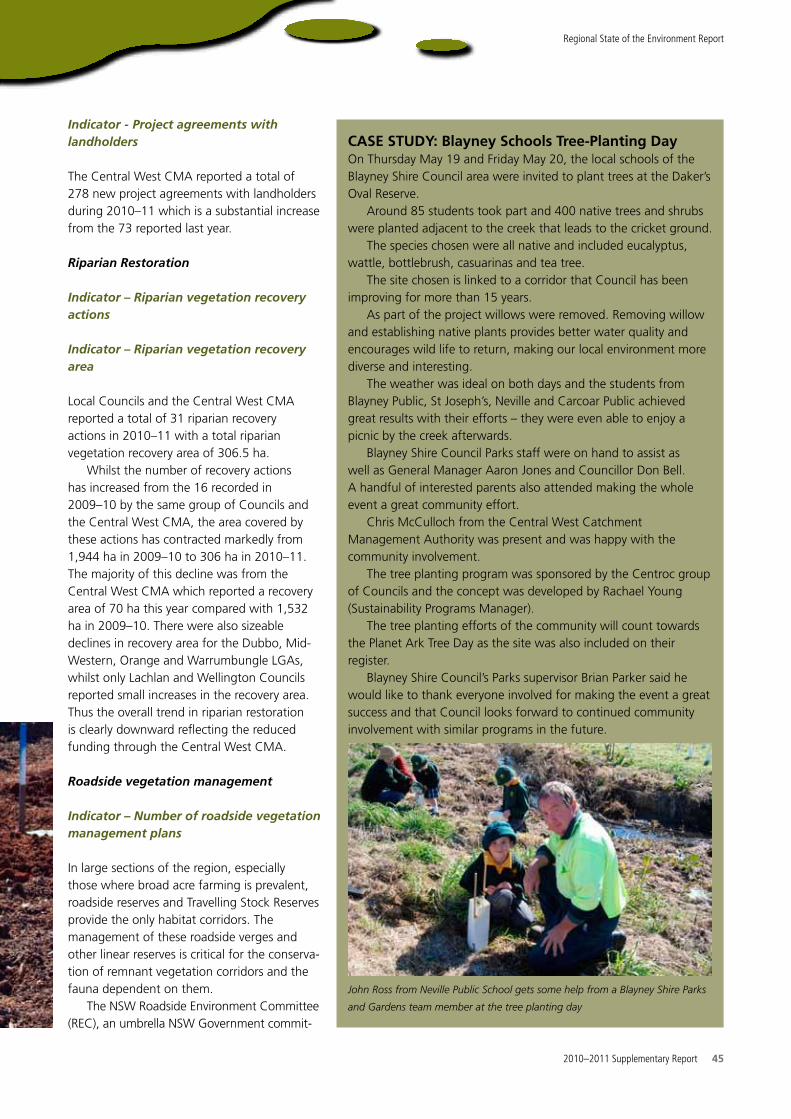
Indicator - Project agreements with landholders
The Central West CMA reported a total of 278 new project agreements with landholders during 2010–11 which is a substantial increase from the 73 reported last year.
Riparian Restoration
Indicator – Riparian vegetation recovery actions
Indicator – Riparian vegetation recovery area
Local Councils and the Central West CMA reported a total of 31 riparian recovery actions in 2010–11 with a total riparian vegetation recovery area of 306.5 ha.
Whilst the number of recovery actions has increased from the 16 recorded in 2009–10 by the same group of Councils and the Central West CMA, the area covered by these actions has contracted markedly from 1,944 ha in 2009–10 to 306 ha in 2010–11. The majority of this decline was from the Central West CMA which reported a recovery area of 70 ha this year compared with 1,532 ha in 2009–10. There were also sizeable declines in recovery area for the Dubbo, Mid-Western, Orange and Warrumbungle LGAs, whilst only Lachlan and Wellington Councils reported small increases in the recovery area. Thus the overall trend in riparian restoration is clearly downward reflecting the reduced funding through the Central West CMA.
Roadside vegetation management
Indicator – Number of roadside vegetation management plans
In large sections of the region, especially those where broad acre farming is prevalent, roadside reserves and Travelling Stock Reserves provide the only habitat corridors. The management of these roadside verges and other linear reserves is critical for the conserva-tion of remnant vegetation corridors and the fauna dependent on them.
The NSW Roadside Environment Committee (REC), an umbrella NSW Government commit-
CAse study: blayney schools tree-planting dayOn Thursday May 19 and Friday May 20, the local schools of the Blayney Shire Council area were invited to plant trees at the Daker’s Oval Reserve.
Around 85 students took part and 400 native trees and shrubs were planted adjacent to the creek that leads to the cricket ground.
The species chosen were all native and included eucalyptus, wattle, bottlebrush, casuarinas and tea tree.
The site chosen is linked to a corridor that Council has been improving for more than 15 years.
As part of the project willows were removed. Removing willow and establishing native plants provides better water quality and encourages wild life to return, making our local environment more diverse and interesting.
The weather was ideal on both days and the students from Blayney Public, St Joseph’s, Neville and Carcoar Public achieved great results with their efforts – they were even able to enjoy a picnic by the creek afterwards.
Blayney Shire Council Parks staff were on hand to assist as well as General Manager Aaron Jones and Councillor Don Bell. A handful of interested parents also attended making the whole event a great community effort.
Chris McCulloch from the Central West Catchment Management Authority was present and was happy with the community involvement.
The tree planting program was sponsored by the Centroc group of Councils and the concept was developed by Rachael Young (Sustainability Programs Manager).
The tree planting efforts of the community will count towards the Planet Ark Tree Day as the site was also included on their register.
Blayney Shire Council’s Parks supervisor Brian Parker said he would like to thank everyone involved for making the event a great success and that Council looks forward to continued community involvement with similar programs in the future.
John Ross from Neville Public School gets some help from a Blayney Shire Parks
and Gardens team member at the tree planting day
2010–2011 Supplementary Report 45
Regional State of the Environment Report

CAse study: Central West CMA Champions of the Catchment regional Awards 2010/11 - Local government partnerships Award: Warren shire Council – tiger bay Wetlands
Warren Shire Council, in consultation with community groups, has agreed to increase its commitment to the Tiger Bay Wetlands in Warren, New South Wales. This was achieved through the acquisition of 40,500 square metres of land to make substantial environmental, social and economic improvements. These improvements aimed to benefit residents, visitors, environmental groups, cultural groups as well as future generations.
Tiger Bay Wetlands was first opened on Australia Day, 1988. Between 2007 and 2010 a project was undertaken to expand the existing area and its facilities. The Tiger Bay Wetlands project involved four phases including land acquisition, extensive earthworks and hydrology, mass native plantings of wetland species by the ‘Central West Green Team’ and facilities enhancement, including a bird hide, interpretative signage, walking paths and picnic facilities. In December 2010, the project was completed after four years of dedication and collaboration. The project has resulted in a significant wetland expansion and an established range of facilities, as well as the introduction of educational amenities and resources.
The Tiger Bay Wetlands project had a variety of environmental, social and economic objectives. Some of the key environmental objectives include a 200% expansion in size of the wetlands area increasing habitat for local and migratory birds, aquatic animals and terrestrial animals, improving the water quality of flows downstream to the Macquarie Marshes and providing nutrient sources for fish and other aquatic organisms inhabiting downstream areas.
Socially, the development of the wetlands aims to have a positive impact on the social fabric and well-being of the community, as well as being used as a recreational location which can also communicate knowledge, skills and values of the importance of wetlands and waterways within the catchment to all stakeholders. The Tiger Bay Wetlands project also aims to have a positive impact on the local economy by attracting visitors to the region.
The expansion of Tiger Bay Wetlands could not have become a reality without collaborating with other Councils, the local Aboriginal community, Macquarie Cotton Growers, Macquarie Marshes Environment Trust and the Central West CMA through the Salinity and Water Quality Alliance. The project was made a reality by funding from the Central West CMA.
Bird hide and interpretative signage at Tiger Bay Wetlands Warren.
Water
46 2010–2011 Supplementary Report
Biodiversity

tee, has encouraged and supported Councils across NSW to develop Roadside Vegetation Management Plans (RVMPs) to better manage roadside environments under their jurisdiction.
RVMPs are firstly developed through assessment of the roadside vegetation, especially threatened species. The plan then identifies processes to best manage the assessed vegetation and to further monitor and evaluate the impact of the strategies. The strategies in the plan can also include those related to fire management, weed management, preservation of critical habitat and provision of clear zones for driver safety.
As shown in the summary table (Table 5), there was no change in the number of RVMPs developed compared with 2009–10. Three other Councils reported that they had a vegetation assessment of some or all of the roads in their LGA but had no RVMP.
Threatened speciesThe OEH has prepared a Priorities Action Statement (PAS) to promote the recovery of threatened species and the abatement of key threatening processes in New South Wales. The PAS identifies a number of broad strategies to help threatened plants and animals recover in New South Wales.
A total of 761 priority actions have been identified to help threatened species recover and tackle threatening processes in the Central West Catchment grouped into 25 recovery strategies and seven threat abatement strate-gies. This is an increase from 750 reported in 2009–10. Of the 761 actions, 748 are focused on the recovery of threatened species, popula-tions and endangered ecological communities.
Indicator – threatened species actions implemented
Six local Councils (Bathurst, Cabonne, Dubbo, Mid-Western, Orange and Wellington) reported in the 2010–11 year that they had implemented a total of 16 threatened species actions (e.g. PAS, recovery plans). This was an increase from the 12 reported in the 2009–10 year.
Fish numbers
Indicator – Number of fish restocking activities
CAse study: Castlereagh river riparian improvement project at CoonabarabranAs part of the Central West Salinity and Water Quality Alliance, Warrumbungle Shire Council undertook a series of natural resource management projects to restore approximately 150 metres of the Castlereagh River running through the township of Coona-barabran, west of the Oxley Highway. Works were undertaken to improve and restore the riparian area of the Castlereagh River and adjoining tributary, Race Course Creek.
The Castlereagh River is a major and important watercourse in central NSW. There are a number of large rural centres located along the length of the river, including Coonabarabran with a population of 2,700. Since the introduction of exotic plant species within riparian areas such as the willow and blackberry, the development of well-established specimens has led to a congested waterway, leading to a detrimental effect on fauna and flora populations of the river ecosystem. This waterway has become inaccessible in many locations, restricting use by local communities along the river.
Warrumbungle Shire Council planned to rectify this situation and restore the condition of the Castlereagh River. The objective is to improve the river ecosystem to encourage populations of local native flora and fauna species, and improve the amenity of the area, in turn converting the banks of the Castlereagh River within the township of Coonabarabran into a more accessible and attractive location to the community.
Works conducted include removal of invasive weed species including blackberry, privet and willow. Stormwater channels were modified with rock armour lining, and reed beds constructed at the termination of each channel.
A cycleway/footpath has been constructed to enable the public to access a scenic path from a residential area (Robertson Street) along the river bank through to Neilson Park. The resulting works will lead to improved accessibility of the Castlereagh River banks to the public, control of noxious weed species, and facilitate the development of native flora and fauna populations.
Riparian plantings along the Castlereagh River
2010–2011 Supplementary Report 47
Regional State of the Environment Report

Table 6: Invasive weeds under active management in 2010-2011.
Local Council Invasive weed species under active management
Bathurst Under active management by Upper Macquarie County Council: Serrated Tussock, Blackberry, St John’s Wort, Sweet (Rose) Briar, African Box Thorn, Small leafed Privet.Additional species targeted by Council: Willow, African Lovegrass
Bourke Golden Dodder, Johnson Grass, Green Cestrum, African Boxthorn, Pear species Opuntia and Cylindropuntia
Cabonne Blackberry, Bridal Creeper, Chilean Needle Grass, Gorse, Serrated Tussock, Willows.
Dubbo All 89 listed noxious weeds are actively treated, as well as Coolatai Grass, an as yet unlisted noxious plant that is constantly controlled
Gilgandra (Castlereagh- Macquarie County Council)
Negoora Burr, Bathurst Burr, Galvanised Burr, St John’s Wort, Mequite, Johnson Grass, Mint Weed, Green Cestrum, Blackberries, Spiny Burr Grass, Box Thorn, Prickly Pear, Sweet Briar Rose, Blue Heliotropes and Silverleaf Nightshade.
Lachlan Bathurst Burr, Devil’s Claw, Galvanised Burr, Noogoora Burr, Parthenium Weed, Prickly Pear, Star Thistle, African Boxthorn, Dodder, Johnson Grass, Silver Leaf Nightshade, Spiny Burr Grass, St Johns Wort, Wild Radish, Scotch Thistle, Blackberry, Coolatai Grass, Blue Heliotrope, Athol Pine, Green Cestum, Tropical Soda Apple, Thorn Apple,
Mid-Western Coolatai Grass, Serrated Tussock, Johnsons Grass, St John’s Wort, Spiny Burr Grass, Blue Heliotrope, Blackberry, Common Pest Pear
Orange Willows, Chilean Needle Grass, Blackberries, Serrated Tussock
Wellington Mimosa, Coolatai Grass, Whiskey Grass
above Tiger Bay wetlands
July 2011.
The NSW DPI-Fisheries, in conjunction with local Councils and recreational fishers, has restocked several streams in the region with a total of 276,683 native fish during the 2010–11 reporting period. This is approxi-mately 100,000 less than were restocked in 2009–10 but still slightly more than were restocked in 2008–09.
Invasive Species
Indicator – Invasive weed species under active management
Nine local Councils reported that they had programs in place to actively manage invasive species with all of these providing specific lists of species being actively managed.
As shown in Table 6, several Councils had active management plans in place during 2010–11 that were targeting Serrated Tussock, Blackberry, Chilean Needle Grass and Gorse (all WONS). The issues concerned with managing these WONS are of such magnitude that they need coor-dination among all levels of government, organisations and individuals with weed management responsibilities.
Water
48 2010–2011 Supplementary Report
Biodiversity

CAse study: Molong Creek rehabilitation WorksCabonne Council, Central West CMA, NSW Fisheries, local landholders and community groups formed a partnership in 2005 to restore riparian landscape function to Molong Creek which had become dysfunctional due to the monoculture impacts from Salix willows and other exotic vegetation.
The area nominated for the works started to the south east of Molong and progressed to the north of Molong for a total of approximately 15 km.
The works involved the removal of exotic vegetation and the placement of large woody debris at strategic locations to provide increased structural elements for aquatic species and endemic re-vegetation plantings to compliment the above works.
After an initial settling-in period, aquatic function significantly improved with natural regeneration of existing endemic vegetation and deep pools re-appearing combined with large woody debris.
Molong Fishing Club commenced restocking activities in 2007 with Yellow Belly after a long period of no stocking due to a lack of sustainable habitat for released fingerlings. NSW Fisheries conducted brief sampling of fish species in 2008 with River Blackfish and Smelt appearing in good numbers, combined with significant populations of macro-invertebrates around large woody debris locations.
Another result of willow removal has been the reduced inundation of town areas during flooding events despite higher water levels over the upstream weir.
A functional riparian landscape is now evident in Molong Creek with flowing water, riffles, deep holes with large woody debris and regeneration of endemic native vegetation. The project has provided positive community capacity and long term viability to this Class 1 freshwater environ known as Molong Creek.
Riparian plantings on Molong Creek
2010–2011 Supplementary Report 49
Regional State of the Environment Report

This chapter reports on human settlement issues including development, cultural heritage
and noise. Human settlements form part of the landscape, but as populations increase, they
also become a source of pressure on the environment. Councils are responsible for urban
planning, infrastructure, some aspects of environmental and heritage restoration, protection and
conservation of resources, provision of community facilities, and community services.
Table 7: Summary Table of Indicator Trends – Human Settlement
Issue Indicator 2008–09 2009–10 2010–11Current Trend
Urban/Industrial Expansion
Number of development consents and building approvals
3,909 4,303 3,391
Landuse conflict complaints 67 50 61
New road construction (km) 43 19 45
Road upgrades (km) 1,081 1,124 349
Indigenous Heritage
Inclusion in DCPs & rural strategies
8 7 8
Extent of liaison with Aboriginal communities (self-assessed from 0 = none to 3 = High)
1.3 1.8 2.0
Development approvals on listed Aboriginal sites
5 3 5
Non-Indigenous Heritage
NSW Heritage Items 98 101 108
Locally-listed heritage items 1,309 1,250 1,525
Actions to protect non-aboriginal heritage (including management plans)
21 22 19
Heritage buildings on statutory heritage lists renovated/improved in past year
62 34 55
Heritage buildings on statutory heritage lists demolished/degraded in past year
2 2 4
Noise Pollution
Urban noise complaints received by Council
833 777 1,066
Industrial noise complaints received by Council
65 97 98
Noise complaints received by OEH
334 162 246
improvement no or little change worsening trend
Note – the above table provides data for2008–09, 2009–10 and 2010–11 from the same sources. The
‘Current Trend’ arrow relates to a comparison of last year’s (2009–10) data with this year’s (2010–11)
data. Data should be read in terms of the limitations for indicators discussed throughout this chapter.
Note also that there are some new indicators for 2010–11 for which no comparison can be made
with previous years. Refer to the Appendix for a list of Councils included in the trend data.
As settlements grow, environmental issues may become more apparent concurrently with increases in conflicting land uses and levels of various types of pollution. Cultural heritage incorporates both Indigenous and non-Indig-enous heritage and both are threatened by development and a lack of management and awareness.
issue – Changing and increasing human settlements
Condition
Land useAs a population grows, the demand for infrastructure such as housing, energy, water transport and waste disposal grows. Supplying this infrastructure results in land use changes that can have negative impacts on the environment. A significant potential impact is from the urban fringe, where housing and associated infrastructure can not only affect the land but also other land uses such as agriculture. This area usually consists of rural residential development, and is often typified by conflict over land use where the zones interface.
Indicator – Land use conflict complaints
One way to measure the impact of changing land use patterns and Council zonings is through complaints about land use matters to Council. Sixteen of the participating Councils reported that there were 66 land use conflict complaints received in 2010–11. For Councils reporting in each of the last three years, as shown in the summary table (Table 7), complaints increased from the 50 complaints recorded in 2009–10 to 61 in 2010–11, but this was still an improvement on the 67 complaints reported in 2008–09.
Water
50 2010–2011 Supplementary Report
Human Settlement

Noise PollutionNoise is a type of pollution that has direct physiological and psychological effects on people. Noise can have a range of impacts from minor annoyance to more serious damage to hearing. It can cause impacts on sensitive land uses including natural areas, residential areas, schools, hospitals and parks.
Noise also affects the habitat of some native fauna species. This may include impacts on breeding cycles and a reduction in the number of species in a locality (moving to avoid noise). Some types of fauna are more susceptible to noise and vibration than others. For example, reptiles that rely on vibration as a primary sense will avoid areas of particular noise wave patterns or vibrations as they disrupt the ability to hunt and avoid predation.
Indicator – Urban noise complaints received by Council
As shown in the summary table (Table 7), from those Councils reporting in each of the last three years there was an increase in the number of urban noise complaints from 777 in 2009–10 to 1,056 in 2010–11. Although the 2009–10 number was a small decline on the prior year, this indicator is still showing an overall increasing trend.
As reported last year, the majority of the complaints relate to barking dogs, which comprised 88% of the complaints in 2010–11.
Indicator – Industrial noise complaints received by Council
As shown in Table 7, the number of industrial noise complaints was almost unchanged for those Councils reporting in each of the last three years. This follows large increases in each of the two previous years suggesting the overall trend is upwards and that growth in the main urban centres in the region is leading to a greater number of conflicts between residential and commercial land uses. A breakdown of the type of noise complaints is provided in Figure 14.
Indicator – Noise complaints received by OEH
Noise issues may also be reported to OEH and as shown in the summary table (Table 7), the
number of noise complaints across the region received by OEH rose sharply in 2010–11 to 246 complaints which was a 50% increase on the level reported in 2009–10. However, well over 90% of the complaints in each of the last three years were reported from the Mid-Western LGA which may relate to new mining operations in rural areas.
Indigenous heritage
Indicator – Current licences to access AHIMS register
The Aboriginal Heritage Information Management System (AHIMS) register of Aboriginal sites is managed by OEH. Each local Council was asked this year whether they have a licence to access the AHIMS register. This information has been requested as an indicator of the level of awareness and active management of Aboriginal sites in each LGA. Only three local Councils reported that they currently have AHIMS access, being Bathurst, Cabonne and Cowra.
0 5 10 15 20 25 30 35
Transport noiseIndustrial/commercial noiseConstruction noise
WellingtonWarrumbungle
WarrenOrangeOberon
NarromineMid-Western
LachlanGilgandra
DubboCowra
CabonneBourkeBogan
BlayneyBathurst
Number and type
Figure 14: Types
of industrial noise
complaints received by
Council in 2010–11.
below Grinding stone at
Terramungamine, Dubbo
(Central West CMA).
Regional State of the Environment Report
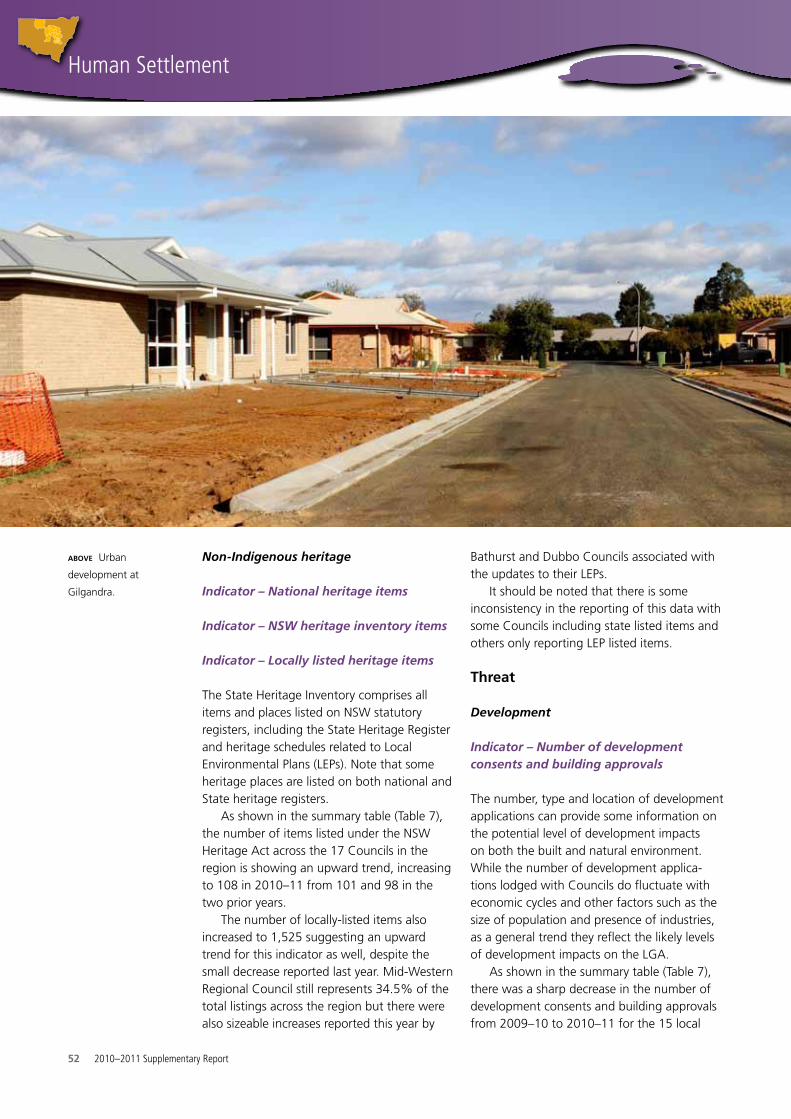
Non-Indigenous heritage
Indicator – National heritage items
Indicator – NSW heritage inventory items
Indicator – Locally listed heritage items
The State Heritage Inventory comprises all items and places listed on NSW statutory registers, including the State Heritage Register and heritage schedules related to Local Environmental Plans (LEPs). Note that some heritage places are listed on both national and State heritage registers.
As shown in the summary table (Table 7), the number of items listed under the NSW Heritage Act across the 17 Councils in the region is showing an upward trend, increasing to 108 in 2010–11 from 101 and 98 in the two prior years.
The number of locally-listed items also increased to 1,525 suggesting an upward trend for this indicator as well, despite the small decrease reported last year. Mid-Western Regional Council still represents 34.5% of the total listings across the region but there were also sizeable increases reported this year by
Bathurst and Dubbo Councils associated with the updates to their LEPs.
It should be noted that there is some inconsistency in the reporting of this data with some Councils including state listed items and others only reporting LEP listed items.
threat
Development
Indicator – Number of development consents and building approvals
The number, type and location of development applications can provide some information on the potential level of development impacts on both the built and natural environment. While the number of development applica-tions lodged with Councils do fluctuate with economic cycles and other factors such as the size of population and presence of industries, as a general trend they reflect the likely levels of development impacts on the LGA.
As shown in the summary table (Table 7), there was a sharp decrease in the number of development consents and building approvals from 2009–10 to 2010–11 for the 15 local
above Urban
development at
Gilgandra.
Water
52 2010–2011 Supplementary Report
Human Settlement
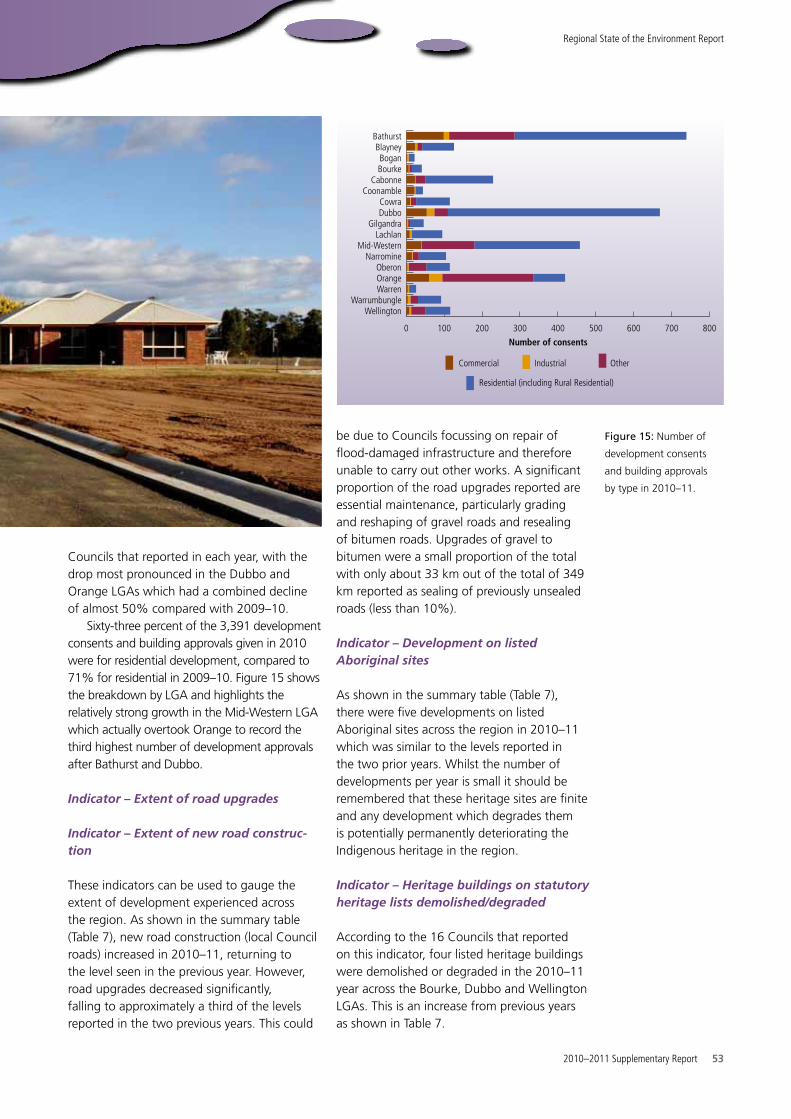
Councils that reported in each year, with the drop most pronounced in the Dubbo and Orange LGAs which had a combined decline of almost 50% compared with 2009–10.
Sixty-three percent of the 3,391 development consents and building approvals given in 2010 were for residential development, compared to 71% for residential in 2009–10. Figure 15 shows the breakdown by LGA and highlights the relatively strong growth in the Mid-Western LGA which actually overtook Orange to record the third highest number of development approvals after Bathurst and Dubbo.
Indicator – Extent of road upgrades
Indicator – Extent of new road construc-tion
These indicators can be used to gauge the extent of development experienced across the region. As shown in the summary table (Table 7), new road construction (local Council roads) increased in 2010–11, returning to the level seen in the previous year. However, road upgrades decreased significantly, falling to approximately a third of the levels reported in the two previous years. This could
be due to Councils focussing on repair of flood-damaged infrastructure and therefore unable to carry out other works. A significant proportion of the road upgrades reported are essential maintenance, particularly grading and reshaping of gravel roads and resealing of bitumen roads. Upgrades of gravel to bitumen were a small proportion of the total with only about 33 km out of the total of 349 km reported as sealing of previously unsealed roads (less than 10%).
Indicator – Development on listed Aboriginal sites
As shown in the summary table (Table 7), there were five developments on listed Aboriginal sites across the region in 2010–11 which was similar to the levels reported in the two prior years. Whilst the number of developments per year is small it should be remembered that these heritage sites are finite and any development which degrades them is potentially permanently deteriorating the Indigenous heritage in the region.
Indicator – Heritage buildings on statutory heritage lists demolished/degraded
According to the 16 Councils that reported on this indicator, four listed heritage buildings were demolished or degraded in the 2010–11 year across the Bourke, Dubbo and Wellington LGAs. This is an increase from previous years as shown in Table 7.
0 100 200 300 400 500 600 700 800
Residential (including Rural Residential)
OtherIndustrialCommercial
WellingtonWarrumbungle
WarrenOrangeOberon
NarromineMid-Western
LachlanGilgandra
DubboCowra
CoonambleCabonne
BourkeBogan
BlayneyBathurst
Number of consents
Figure 15: Number of
development consents
and building approvals
by type in 2010–11.
2010–2011 Supplementary Report 53
Regional State of the Environment Report
response
PlanningThere is a suite of planning tools that Councils in the reporting region are using to ensure that development is sensitive to the environment.
LEPs guide planning decisions for LGAs. Through zoning, development controls, policies and guidelines, they allow Councils and other consent authorities to manage the ways in which land is used. LEPs are the primary planning tool to shape the future of communities and also guide the estimated $20 billion worth of local development that is determined each year.
Under the current NSW Planning Reform Process, Councils are reviewing their LEPs using a template with the same planning language, making it easier for communities to understand what is proposed for their local area. Councils are able to include localised planning objectives and provisions specific to their area, as well as determine zoning, additional land uses, heritage items, and development standards such as height and minimum lot sizes.
To facilitate this process, all Councils in the reporting region have been supplied with En-vironmentally Sensitive Area Maps which cover Land, Water and Biodiversity. This allows the Councils to make informed decisions where future development should take place, whilst providing better protection to the natural resources of the LGA.
Indigenous heritage
Indicator – Extent of liaison with Aboriginal communities
Councils were asked to self-rate the extent of their liaison with Aboriginal communities. The 16 Councils which reported this indicator this year gave themselves an average rating of 2.1 on a scale of 0 (none) to 3 (high) in 2010–11. As shown in the summary table (Table 7), the 13 councils that have reported this indicator over the last three years have reported a steady improvement since 2008–09, suggesting that there is an increasing awareness of the importance of consultation, particularly in development processes.
Indicator – Inclusion of Indigenous Heritage in DCPs and rural strategies
Sixteen Councils reported on this indicator in 2010–11 with 11 of these reporting that they had included Indigenous community consulta-tion in development of DCPs (Development Control Plans) and rural strategies. Bogan, Narromine and Wellington Councils all reported Aboriginal inclusion in DCPs/rural strategies for the first time this year.
Indicator – Management actions/responses
There was a small improvement in this indicator in 2010–11 with three Councils (Cabonne, Dubbo and Mid-Western) reporting Indigenous heritage management actions/responses compared with only two in the two prior years.
Indicator – Management plan/strategy in place
Only Wellington Council reported that it currently has an Indigenous heritage manage-ment plan/strategy in place. Orange and Dubbo Councils also indicated that they are in the process or considering the preparation of one.
Non-Indigenous heritage
Indicator – Actions to protect non-Indige-nous heritage items
Indicator – Heritage buildings on statutory heritage lists that are renovated or improved
These indicators, introduced in 2008–09, provide a gauge of the level of protection through management of non-Indigenous heritage items. As shown in the summary table (Table 7), there was a slight decrease in 2010–11 in the number of reported actions to protect non-Indigenous heritage (including management plans).
The 55 heritage buildings on statutory lists which were renovated or improved during the year represented a significant increase from the activity reported for this indicator in 2009–10, albeit still slightly below the level reported in 2008–09.
Water
54 2010–2011 Supplementary Report
Human Settlement

CAse study: Mid-Western regional Council’s Aboriginal reference group.Changes to legislation and the consultation process with respect to Aboriginal heritage occurred early in 2010 and triggered a review of Mid-Western Regional Council’s processes and actions. One of the actions that Council took was to call for expressions of interest to form an Aboriginal Reference Group. The first meeting was held in August 2010 with a good attendance with representatives present from most of the local groups. The Group has been generally meeting on a monthly basis since that time.
Around the same time, Council was undertaking the maintenance of one of its gravel roads that was undergoing significant deterioration. This road had been in use for some considerable time (at least 50 years) and had been graded on numerous occasions over that period of time.
Unbeknown to Council, Aboriginal site officers were assessing the western half of the road while at the same time a Council road maintenance crew was working its way along the road from the eastern end. At the grid near the property known as Kookaburra the Council maintenance team was advised to stop by the Aboriginal representa-tives as the works had partially damaged some artefacts located within the driveway entrance that Council had been using as a turn-around location. Works were halted until an on-site meeting with OEH, senior Council staff and several representatives from the Aboriginal community could be arranged to discuss the issues and concerns. Council was made aware that the local Aboriginal community highly values this locality as a place of significance.
The site assessment identified some 170 sites along the road from the Kookaburra property to the intersection with Goolma Road, containing in excess of 700 artefacts. A number of these were scattered across the shoulder, within the table drain and, in some instances, were located within the gravel pavement of the road itself.
OEH assisted Council to ensure that an Aboriginal Heritage Impact Permit (AHIP) (to relocate or destroy artefacts) was processed as quickly as possible to allow the work to proceed. One of the recommendations of the site assessment report was for monitors to be on-site during the road works to collect and relocate any artefacts disturbed by the grader.
Council had no previous experience with managing an AHIP and therefore misinterpreted the conditions of the AHIP, especially in regard to the recommendations of the report that required two on-site monitors for the period of grading works. Council was unaware at the time that monitoring is not seen as employment by OEH, however the Aboriginal representatives did invoice Council for the time on-site which eventually added up to a substantial amount of funds that had to come out of the road maintenance budget.
Subsequent to works being completed and a considerable level of community backlash, some of which was played out in local media outlets with the State MP involved, Council determined through discussions with OEH officers that whilst it needs to provide an opportunity for monitors to be present at work sites if this forms part of any recommenda-tions of a site assessment report, it is not obliged to pay for this monitoring.
The Aboriginal Reference Group had met on a number of occasions by this point in time and these issues surrounding not only the media coverage, but also the payment for monitoring, were openly and honestly discussed at the November meeting. Council’s adoption of the ‘Due Diligence Code’ and its implications for Council works was also discussed at this meeting.
As a result, Council now has an un-derstanding with the local Aboriginal community that should a report call for monitoring of a works site at the earth breaking stage then Council will provide an opportunity for monitors to be present at no cost to Council.
The Lower Piambong Road site.
2010–2011 Supplementary Report 55
Regional State of the Environment Report

This chapter focuses on the generation, treatment and disposal of waste within the
reporting area. Waste is caused by the disposal of products at the perceived end of their
life, or simply when the user has no further need for them.
Table 8: Summary Table of Indicator Trends - Waste
Issue Indicator 2008–09 2009–10 2010–11Current Trend
Waste Generation
Total waste entombed at primary landfill (tonnes)
154,804 138,889 146,702
Total waste entombed at other landfills (tonnes)
6,650 8,499 6,585
Average total waste generated per person
0.90 0.94 0.95
Average cost of waste service per residential household
$202 $202 $250
Hazardous/Liquid Waste
DrumMuster collections (number of drums)
96,280 65,325 90,527
Reduce Office paper used by Council (A4 reams)
18,551 19,803 18,637
E-Waste collected (diverted from landfill) (tonnes)
21 18 23
Garden organics collected (diverted from landfill) (tonnes)
16,356 21,274 18,910
Recycle Volume of material recycled (tonnes)
22,249 16,846 21,010
Volume of material recycled per person (kg)
115 88 91
Littering and illegal dumping
Annual Volume of litter collected by streets-weeper (tonnes)
4,672 6,239 5,105
Number of illegal waste disposal complaints to Council
360 312 398
improvement no or little change worsening trend
Note – the above table provides data for 2008–09, 2009–10 and 2010–11 from the same
sources. The ‘Current Trend’ arrow relates to a comparison of last year’s (2009–10) data with this
year’s (2010–11) data. Data should be read in terms of the limitations for indicators discussed
throughout this chapter. Note also that there are some new indicators for 2010–11 for which
no comparison can be made with previous years. Refer to the Appendix for a list of Councils
included in the trend data.
With the expansion of human settlements, environmental pressure is being increased through the consumption of products that are dependant on natural resources and the inappropriate disposal of by-products. A sustainable human environment requires greater attention to urban design and a reduction in net consumption.
Within the reporting region, efforts are being made to increase the sustainability of waste management systems through reducing, reusing and recycling waste products.
issue – Waste generation and disposal
Condition
Solid waste
Indicator – Total waste entombed at primary landfill
Indicator – Average total waste generated per person per annum
Indicator – Average cost of waste service per person per annum
Indicator – Total waste entombed at other landfills (excluding recyclables)
Total waste indicates consumption patterns and the pressures placed on rural tips and primary landfills. As shown in the summary table (Table 8), for the ten Councils that reported in each of the last three years, the average total waste generated per person for 2010–11 was 0.95 tonnes, which was effectively unchanged from 2009–10. Whilst comparison with the 2008–09 number suggests an increasing trend, the data provided by some Councils in that year was only approximated.
Water
56 2010–2011 Supplementary Report
Waste

There was a decrease from 2008–09 in the volume of total waste received at primary landfills of the Councils that reported in all three years. It should be noted that prior to 2010–11, the total waste for Orange LGA included some of neighbouring Cabonne Council’s C Riding (Ward) waste and con-tamination from the recycling collections processed through the Materials Recovery Facility from Orange, Cabonne, Parkes, Forbes, Blayney and Bathurst LGAs. Therefore, in the summary table (Table 8), the total waste entombed at primary landfill has been recalculated for each year to remove Orange’s data to enable a more valid comparison across the three years. A full breakdown for the 2010–11 year by LGA, including Orange LGA is provided in Figure 16.
The volume of total waste (excluding recyclables) taken to other landfills was 6,735 tonnes for the 14 Councils reporting in 2010–11. A comparison to the two previous years is provided in the summary table (Table 8) but it should be noted that the basis of reporting this indicator was changed for the 2009–10 report so the comparison should be regarded as indicative only.
A significant increase to $250 for the average cost of waste services to people across the region was reported this year (based on 13 Councils reporting in all three years).
Figure 16: Total waste
entombed at primary
landfill.
Tonnes/annum0 20000 40000 60000 80000 100000
2010–112009–102008–092007–08
WellingtonWarrumbungle
WarrenOrangeOberon
NarromineMid-Western
LachlanGilgandra
DubboCowra
CoonambleCabonne
BourkeBogan
BlayneyBathurst
This continues the increasing trend for this indicator reported last year.
threat
LitteringOne of the most obvious forms of pollution is litter. Apart from being unsightly and taking a long time to breakdown, litter can be washed into waterways through stormwater systems where it poses a risk to aquatic life. One of the worst types of littering is illegal dumping which occurs across all LGAs in the region.
below Illegally dumped
asbestos at Lue Waste
Transfer Station in
Mid-Western LGA.
2010–2011 Supplementary Report 57
Regional State of the Environment Report
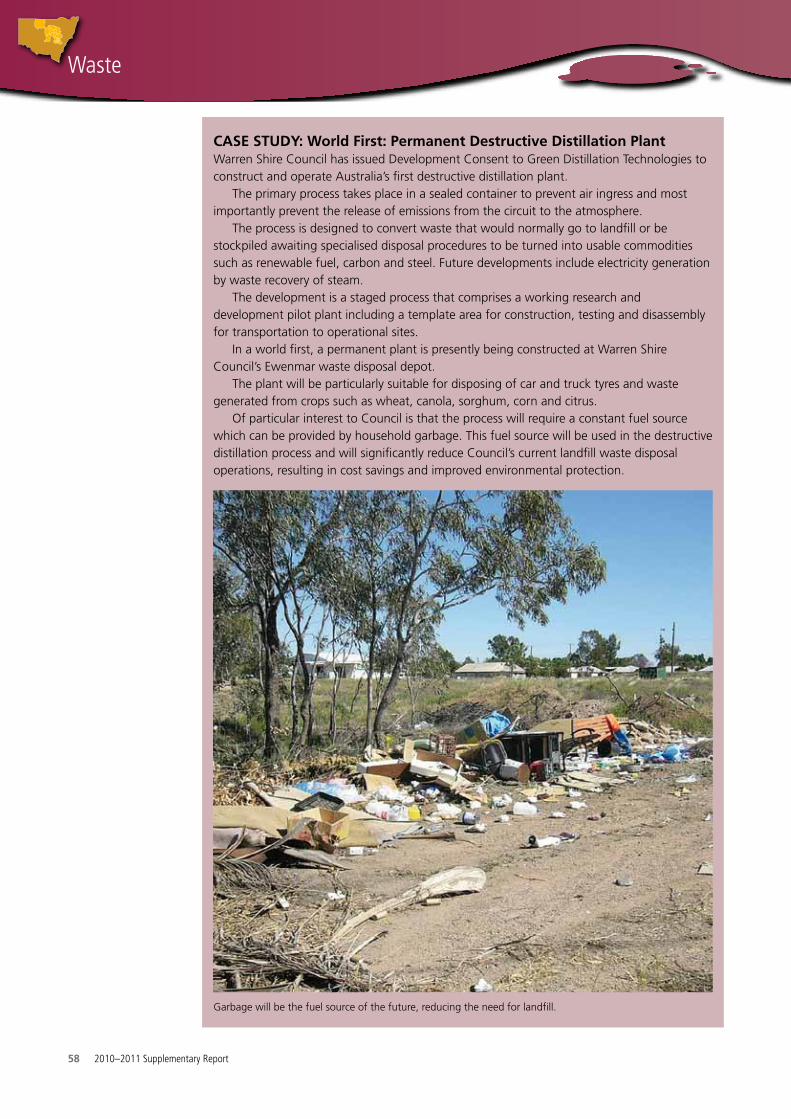
CAse study: World first: permanent destructive distillation plantWarren Shire Council has issued Development Consent to Green Distillation Technologies to construct and operate Australia’s first destructive distillation plant.
The primary process takes place in a sealed container to prevent air ingress and most importantly prevent the release of emissions from the circuit to the atmosphere.
The process is designed to convert waste that would normally go to landfill or be stockpiled awaiting specialised disposal procedures to be turned into usable commodities such as renewable fuel, carbon and steel. Future developments include electricity generation by waste recovery of steam.
The development is a staged process that comprises a working research and development pilot plant including a template area for construction, testing and disassembly for transportation to operational sites.
In a world first, a permanent plant is presently being constructed at Warren Shire Council’s Ewenmar waste disposal depot.
The plant will be particularly suitable for disposing of car and truck tyres and waste generated from crops such as wheat, canola, sorghum, corn and citrus.
Of particular interest to Council is that the process will require a constant fuel source which can be provided by household garbage. This fuel source will be used in the destructive distillation process and will significantly reduce Council’s current landfill waste disposal operations, resulting in cost savings and improved environmental protection.
Garbage will be the fuel source of the future, reducing the need for landfill.
Water
58 2010–2011 Supplementary Report
Waste

Indicator – Amount of litter collected by Council streetsweepers
From the 14 Councils that reported in each of the last three years, there was an 18% decrease in the volume of litter collected by Council streetsweepers in 2010–11 compared with 2009–10 (see Table 8). The total figure hides significant changes for individual LGAs, with Bathurst and Mid-Western reporting declines in volume of 60% and 87% respec-tively, whilst Bourke, Orange and Warrumbun-gle all reported large increases.
The amount of litter collected should be considered in relation to that collected in GPTs (see Water chapter).
Illegal dumping
Indicator – Number of illegal waste disposal complaints to Councils
The number of complaints about rubbish dumping does not necessarily reflect the frequency of incidents, nor the impact of illegal dumping. However, it does indicate community awareness of illegal dumping and the potential impact that it may have on the environment.
As shown in the summary table (Table 8) and in Figure 17, the number of illegal dumping complaints showed a substantial increase compared with 2009–10 for the 14 Councils reporting in each of the last three years. The 398 complaints reported for 2010–11 is also more than reported in the 2008–09 year suggesting that, contrary to the more optimistic picture painted in last year’s RSoE report, illegal dumping is actually a growing issue for the region, with residents becoming more aware of the problem.
Chemical disposal
Indicator – Number of farm chemical drums collected through DrumMuster collections
Councils in the reporting area are active par-ticipants in the DrumMuster program, which provides a collection service for agricultural chemical containers on an ongoing basis.
As shown in the summary table (Table 8), the number of drums collected through
Number of complaints0 50 100 150 200
2010–112009–102008–092007–08
WellingtonWarrumbungle
WarrenOrangeOberon
NarromineMid-Western
LachlanGilgandra
DubboCowra
CoonambleCabonne
BourkeBogan
BlayneyBathurst
Figure 17: Illegal waste
disposal complaints to
Council.
the DrumMuster program rose to 90,527 in 2010–11, bringing it back closer to the level reported in 2008–09, albeit still a little less. This year’s increase probably reflects improved cropping conditions across the region, leading to higher on-farm chemical use. The large variability in seasonal conditions over the last three years is likely to be masking any longer-term trends, such as changes in agri-cultural practices, which could lead to lower chemical use over the long-run.
responseThe regional waste organisation, NetWaste and participating Councils have been doing considerable work on viable options for collecting and handling household hazardous waste items, as there are currently limited other services available.
In late 2010, the following Councils par-ticipated in the regional chemical collection program: Bathurst Regional, Cabonne, Lachlan Shire, Dubbo City, Gilgandra Shire, Mid-Western Regional, Narromine Shire, Orange City and Wellington, in addition to three other NetWaste Councils not covered in this report. In total, 412 customers delivered 8.2 tonnes of material, including paint, batteries, general household chemicals and pesticides and gas cylinders.
NetWaste Councils are also currently in the process of establishing permanent storage enclosures for gas cylinders and lower risk items such as smoke detectors, household batteries and fluorescent light fittings with the intention of having these enclosures in place by July 2011.
2010–2011 Supplementary Report 59
Regional State of the Environment Report

Reduce
Indicator – E-Waste diverted from landfill
Indicator – Office paper used by Councils
E-waste is currently collected separately in nine LGAs across the region. As shown in the summary table (Table 8), the amount of eWaste collected increased to 23 tonnes for the five Councils who reported this data in each of the last three years. This is an increase
CAse study - home Composting in the netWaste regionIn recognition of the environmental impact of disposing organic material to landfill, NetWaste has been implementing a number of projects across the region to address this issue. In partnership with Centroc, one such approach is the Home Composting project, which aimed to raise awareness and equip local residents with the tools and knowledge to compost at home.
The project involved a train-the-trainer component, which meant that a local person in each participating Council area was involved in the project and could be an ongoing contact. Trainers then delivered workshops in their Council areas, with residents also invited to participate in a Compost Cookoff to talk about how their efforts went at home.
Cabonne, Dubbo City, and Lachlan Shire Councils, in addition to three other NetWaste Councils, participated in the project with 275 residents taking part in local workshops. Feedback from the project was very positive, and there was also strong support for a similar approach to be used for worm farming.
Netwaste’s compost poster.
CAse study – narromine Cardboard pressNarromine Shire Council in conjunction with AMCOR has
introduced a cardboard press at the Narromine Waste Depot. Council has been able to divert large quantities (approximately 36 tonnes during the past 12 months) of cardboard from ending up in landfill.
This service has been received positively by the community with many residents and businesses actively bringing their cardboard out to the waste depot for processing. Council is in the process of introducing a dedicated cardboard recycling trailer for businesses in Tomingley and possibly Trangie to further increase the amount of cardboard diverted away from landfill.
Cardboard for recycling at Narromine’s Waste Depot Cardboard Press
Water
60 2010–2011 Supplementary Report
Waste

Tonnes/annum0 1000 2000 3000 4000 5000 6000 7000 8000
Waste Oil
TyresSteel cans Scrap Metal - Netwaste collection
Plastic Paper and cardboardOther/Not classified
Metal - scrap/otherGlassBatteriesAluminium cans
WellingtonWarrumbungle
WarrenOrangeOberon
NarromineMid-Western
LachlanGilgandra
DubboCowra
CoonambleCabonne
BourkeBogan
BlayneyBathurst
on the amounts reported for both of the previous two years.
As relatively large employers and community leaders, Councils can be used as one indicator of changing office practices and increased awareness to minimise the use of office paper.
As shown in the summary table (Table 8), the 13 Councils that reported in each of the last three years have reduced their use of A4 office paper in the last year, but only back to approximately the same level as in 2008–09. The mix of papers used has changed over the three years with an increasing use of coloured paper and substantially lower use of 100% recycled paper, albeit that partially recycled paper has been substituted for some of this. Overall the trend in this indicator appears to be in the wrong direction, with Councils using slightly more paper and less recycled paper.
Indicator – Garden organics collected
A decrease in the volume of garden waste collected was reported this year, as shown in the summary table (Table 8), although this year’s number was still a 15.6% increase compared with the 2008–09 total. These figures are for the nine councils who reported in each of the last three years. There were also four councils reporting this data for the first time this year which collected approximately 3,000 tonnes in addition to the total reported in the summary table (see Figure 18). There have been improve-ments this year to the reporting of this data so it is difficult to draw any reliable conclusions about the trend across the region.
Indicator – Household Hazardous Wastes collected
During 2010–11, NetWaste collected 7,748 kg of Household Hazardous Wastes (HHW) across eight of the 17 LGAs within the reporting region. Over half of this total was collected in the Dubbo LGA.
Recycle
Indicator – Amount of material recycled
Indicator – Amount of material recycled per person
As shown in the summary table (Table 8), the volume of material recycled increased significantly compared with 2009–10 to 21,010 tonnes or an average of 91 kg per person across the entire region, reversing the decline reported last year. Improved reporting of this data is the likely explanation for the large swings in the data for the last two years.
It is therefore difficult to draw any reliable conclusions about the trend in recycling across the region. A breakdown of the type of materials recycled in 2010–11 is provided in Figure 19. This shows a large proportion of the material recycled is paper and cardboard. The large ‘other’ category for Dubbo LGA relates to construction and demolition waste which is crushed and re-used.
below left Council ranger
inspects illegal dumping
in Dubbo.
Tonnes by Council0 1000 2000 3000 4000 5000 6000 7000 8000
WellingtonWarrumbungle
WarrenOrangeOberon
NarromineMid-Western
LachlanGilgandra
DubboCowra
CoonambleCabonne
BourkeBogan
BlayneyBathurst
Figure 18: Garden
organics collected in
2010–11.
Figure 19: Volume of
material recycled by type
and LGA in 2010–11.
2010–2011 Supplementary Report 61
Regional State of the Environment Report
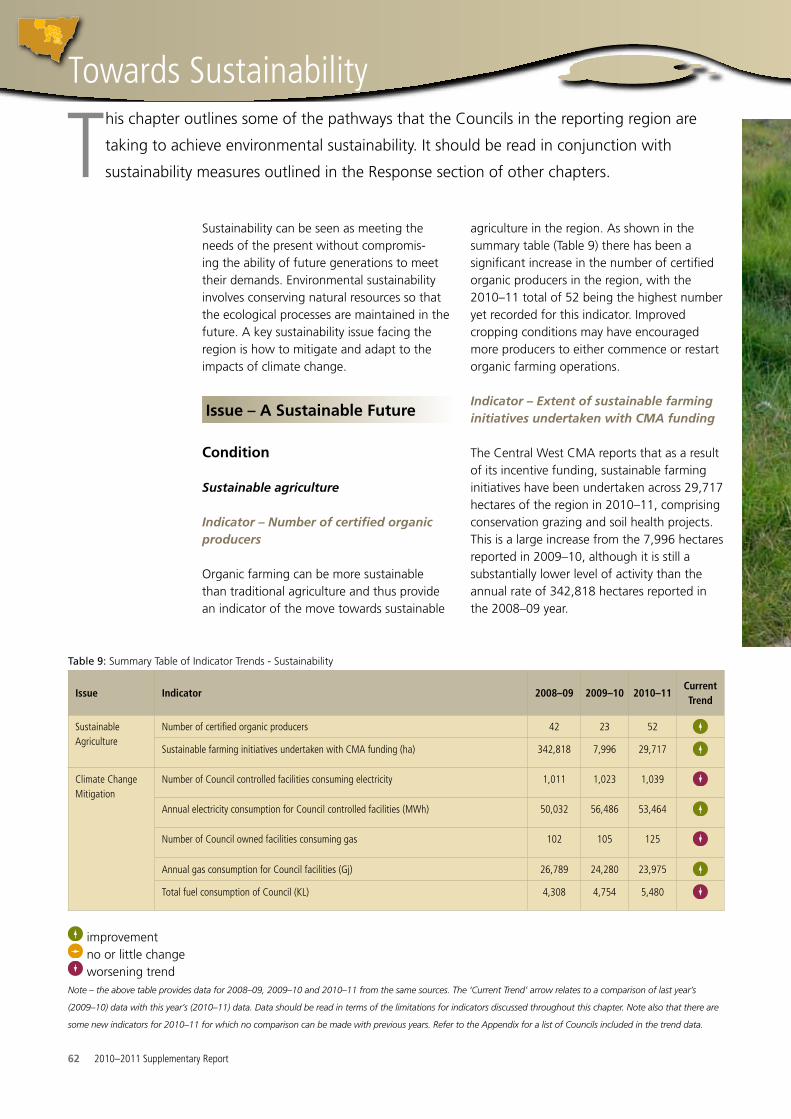
This chapter outlines some of the pathways that the Councils in the reporting region are
taking to achieve environmental sustainability. It should be read in conjunction with
sustainability measures outlined in the Response section of other chapters.
Sustainability can be seen as meeting the needs of the present without compromis-ing the ability of future generations to meet their demands. Environmental sustainability involves conserving natural resources so that the ecological processes are maintained in the future. A key sustainability issue facing the region is how to mitigate and adapt to the impacts of climate change.
issue – A sustainable future
Condition
Sustainable agriculture
Indicator – Number of certified organic producers
Organic farming can be more sustainable than traditional agriculture and thus provide an indicator of the move towards sustainable
agriculture in the region. As shown in the summary table (Table 9) there has been a significant increase in the number of certified organic producers in the region, with the 2010–11 total of 52 being the highest number yet recorded for this indicator. Improved cropping conditions may have encouraged more producers to either commence or restart organic farming operations.
Indicator – Extent of sustainable farming initiatives undertaken with CMA funding
The Central West CMA reports that as a result of its incentive funding, sustainable farming initiatives have been undertaken across 29,717 hectares of the region in 2010–11, comprising conservation grazing and soil health projects. This is a large increase from the 7,996 hectares reported in 2009–10, although it is still a substantially lower level of activity than the annual rate of 342,818 hectares reported in the 2008–09 year.
Table 9: Summary Table of Indicator Trends - Sustainability
Issue Indicator 2008–09 2009–10 2010–11Current Trend
Sustainable Agriculture
Number of certified organic producers 42 23 52
Sustainable farming initiatives undertaken with CMA funding (ha) 342,818 7,996 29,717
Climate Change Mitigation
Number of Council controlled facilities consuming electricity 1,011 1,023 1,039
Annual electricity consumption for Council controlled facilities (MWh) 50,032 56,486 53,464
Number of Council owned facilities consuming gas 102 105 125
Annual gas consumption for Council facilities (Gj) 26,789 24,280 23,975
Total fuel consumption of Council (KL) 4,308 4,754 5,480
improvement no or little change worsening trend
Note – the above table provides data for 2008–09, 2009–10 and 2010–11 from the same sources. The ‘Current Trend’ arrow relates to a comparison of last year’s
(2009–10) data with this year’s (2010–11) data. Data should be read in terms of the limitations for indicators discussed throughout this chapter. Note also that there are
some new indicators for 2010–11 for which no comparison can be made with previous years. Refer to the Appendix for a list of Councils included in the trend data.
Water
62 2010–2011 Supplementary Report
Towards Sustainability

The Lachlan CMA is working with major industry groups including dryland graziers, farmers and silviculturists and irrigation industries such as farming, grazing, dairying and horticulture, to coordinate and accelerate the adoption and implementation of sustainable land management practices. There are currently partnerships with Grain and Graze, Central West Farming Systems, and Central West Conservation Farming Association. These groups collaborate with organisations such as the Grains Research and Development Corporation, Meat and Livestock Australia and Land and Water Australia.
The Western CMA currently has a sustainable agriculture management target of 50% of landholders practising sustainable agriculture management by 2016 and has released a series of fact sheets about sustainable farming.
threats
Greenhouse Gas Emissions
Indicator – Number of Council controlled facilities using electricity
Indicator – Annual electricity consumption for Council controlled facilities
The region is a large producer of black coal and there is a heavy reliance on coal for electricity. As a significant source of greenhouse gases that Councils have a direct impact on, electricity consumption is an area for priority action.
As shown in the summary table (Table 9), the amount of electricity consumed by those Councils that reported in each of the last three years decreased from 2009–10 to 2010–11 accompanied by a small increase in
above Gross pollutants
being captured in Blackman’s
Swamp Creek, Orange, prior to
stormwater being harvested.
2010–2011 Supplementary Report 63
Regional State of the Environment Report

CAse study: Centroc tAgi program and sustainability in Lachlan CouncilThat’s a Good Idea [TAGI] is a three year project (commenced March 2007) that is run through Centroc and has been funded through the NSW Environmental Trust. The TAGI mentoring program aims to bring Council officers in the Central NSW region seeking professional development (mentees) in the area of sustainability together with experts in the field (mentors) to gain new perspectives and insights into how to incorporate sustainable practices into local government operations.
The Mentee: Francois Van der Berg is the Manager Environment and Development Services at Lachlan Shire Council. Sustainability was an “unfamiliar” term to Francois and that prompted him to enrol in this program.
The Mentor: Chris Gray has worked closely with Councils, government agencies and the corporate sector for more than thirty years. The main focus of that work has been to improve their environmental management practices. He has also worked very closely with all the Councils in the Centroc Region and so is extremely familiar with the challenges faced by, in particular, smaller rural Councils
Francois was very interested in the whole idea of introducing the concept of sustainability to Lachlan Shire Council and working to overcome the challenges he anticipated in taking this course of action. This formed the basis of the Learning Plan that Chris and Francois developed.
They decided that the first thing to do was form an in-house sustainability group. The establishment of that committee is the basis on which Francois is building his very exciting and innovative program. Francois now manages the group like a typical Council Working Party with formal Meeting Agendas, Minutes and Actions allocated to different group members. This approach has been extremely successful.
Outcomes for the mentee:• Francois has gained much more experience and knowledge in the sustainability field which gave him the
confidence to actively promote it;• He gained a better understanding of what other Councils are doing to promote sustainability;• He obtained help in establishing the sustainability committee, which brought staff members from all departments
together around a table to discuss issues that effect everyone;• He realized that a staff member does not have to work in the environmental department to play an important role
in Council’s sustainability. The key to success is to have everybody involved in sustainability matters.• Francois conducted a few composting workshops to spread the word about sustainability and to get his
community involved in sustainable practices. The workshop in Lake Cargelligo was attended by more than 70 residents and proved to be very successful.
From this project there were also substantial benefits for Lachlan Shire Council. These include:• Improved sustainability due to inter departmental involvement
of staff in the sustainability committee;• Investigations into other sustainability strategies such as the
installation of solar cells, solar hot water etc to improve sustainability of Council and community facilities;
• Review and development of new policies that are more sustainable;
• Implementation of sustainable practices such as the recycling of scrap metal with the proceeds go towards community grants;
• Support of local contractors and increased local job creation;• Improved strategies in waste management;• Improved public relations and Council image;• Improved interaction with the community through programs
such as composting workshops.
TAGI Newsletter
TAGI Mentoring Case StudyLachlan Shire Council
Sustainability is a “Good Idea”
Description of Mentoring Learning Plan and RelationshipIt was apparent from the very first meeting that Francois was very interested in the whole idea of introducing the concept of sustainability to Lachlan Shire Council and working to overcome the challenges he anticipated in taking this course of action. This formed the basis of the Learning Plan that Chris and Francois developed.
They decided, based on combined experience, that the first thing to do was form an in house sustainability group. The establishment of that committee is the basis on which Francois is building his very exciting and innovative program.
Happily his Council colleagues agreed that a Sustainability Group was needed and Francois now manages the group like a typical Council Working Party with formal Meeting Agendas, Minutes and Actions allocated to different group members. This approach has been extremely successful. It is an approach that Chris will now adopt for all similar projects that he is responsible for managing.
That’s a Good Idea [TAGI] is a three year project (commenced March 2007) that has been funded through the NSW Environmental Trust. It has three key focus areas:
1. In Council sustainability, which is being advanced through programs such as the sustainability calendar which rolls out a new activity every quarter.
2. Mentoring and training, to build the capacity of Council staff from the project officer to the GM.
3. Composting activities, to promote the use of Council green waste as a compost ingredient in balanced commercial composting.
The TAGI mentoring program aims to bring Council officers in the Central NSW region seeking professional development (mentees) in the area of sustainability together with experts in the field (mentors) to gain new perspectives and insights into how to incorporate sustainable practices into local government operations. Five Councils are involved in the TAGI Mentoring Program: Blayney Shire Council; Lachlan Shire Council; Lithgow City Council; Parkes Shire Council and Young Shire Council. The project intends:
■ To develop knowledge and pathways to enable member Councils become the most sustainable region in Australia.
■ To build sustained communication networks between member Councils that facilitate the sharing of knowledge and experience with regards to sustainability.
About the MenteeFrancois Van der Berg is the Manager Environment and Development Services at Lachlan Shire Council. He has worked for Council since 27 January 2010. Prior to this Francois worked at Brewarrina Shire Council for 3.5 years.
Sustainability was an “unfamiliar” term to Francois and that prompted him to enroll on this program. Through this program Francois gained a better understanding of what sustainability is and how to use his knowledge to the advantage of his Council and local community.
About the MentorChris Gray has worked closely with Councils, government agencies and the corporate sector for more than thirty years. The main focus of that work has been to improve their environmental management practices. He has also worked very closely with all the Councils in the CENTROC Region and so is extremely familiar with the challenges faced by, in particular, smaller rural Councils. For more about Chris contact him at GEMS Pty Ltd at: [email protected]
The Group Minutes and Action Plans now form the basis of Francois’ regular reports to senior management and Council and these have encouraged the General Manager at Lachlan Shire Council to get right behind the program.
As far as the relationship between Francois and Chris is concerned, Chris was very conscious of the fact that Francois had a wide range of responsibilities in Council and so their discussions had to be well planned and tightly structured. It should be noted that Chris and Francois met face-to-face on three occasions, which was additional to the scope of the program and this helped to generate the kind of relationship that led to outstanding outputs. They formed a close and mutually respecting relationship.
Outcomes for MenteesAs a result of the mentoring process, Francois gained much more experience and knowledge in the sustainability field;
■ He gained a better understanding of what other Councils are doing and to promote sustainability;
■ He obtained help in establishing the sustainability committee, which brought staff members from all departments together around a table to discuss issues that effect everyone;
Brief Introduction to TAGI Mentoring Program
Water
64 2010–2011 Supplementary Report
Towards Sustainability

MWh 0 5000 10000 15000 20000
2010-112009-102008-092007-08
WellingtonWarrumbungle
WarrenOrangeOberon
NarromineMid-Western
LachlanGilgandra
DubboCowra
CoonambleCabonne
BoganBlayney
Bathurst
Figure 20: Annual
electricity consumption
for Council facilities
below Electric sports
car at the Centroc
Sustainability Summit
2010 Bathurst.
the number of Council-owned facilities using electricity. However, electricity consumption has still increased by 6.9% compared to 2008–09.
A comparison of the electricity used by each Council in their facilities during 2010–11 is provided in Figure 20.
Indicator – Number of Council controlled facilities consuming natural gas
Indicator – Annual natural gas consumption for Council controlled facilities
As with electricity, the use of gas provides an indication of contributions made by Councils to greenhouse gas emissions.
As shown in the summary table (Table 9), there was a 20% increase in the number of Council facilities in the region using gas in 2010–11 compared with 2009–10. This is shown as a worsening trend, but as natural gas has a lower carbon footprint than electricity derived from fossil fuels, changes to the number of premises using gas instead of electricity could provide potential greenhouse gas emission reductions.
Whilst the number of facilities consuming gas increased sharply, the actual consumption of gas by Council-controlled facilities declined in 2010–11 compared with 2009–10.
Indicator – Annual bottled gas consumption for Council controlled facilities
This is a new indicator in the 2010–11 report. Five Councils reported using a total of 41,645 litres of bottled gas.
Indicator – Total fuel consumption
As with electricity and gas consumption, fuel use is a significant source of greenhouse gas emissions. As shown in the summary table (Table 9) there was a significant increase in the amount of fuel consumed by Councils that reported in each of the last three years, with the total consumption rising by ap-proximately 15% to 5,480 kilolitres of fuel for the 2010–11 year. This follows a similar rise of over 16% reported for this indicator last year.
Councils were asked to provide a breakdown of fuel type for the first time this year. The predominant fuel used is diesel (81.3%), followed by unleaded petrol at 12.5% and then very small amounts of biodiesel (2.8%), E10 petrol and LPG.
response
Sustainable agricultureThere are several ways that landholders in the reporting region can make agriculture more sustainable. A well managed perennial pasture has deeper roots and can survive in poorer seasons by utilising soil moisture at
2010–2011 Supplementary Report 65
Regional State of the Environment Report

composition and fertility. Perennial pastures have the potential to sustainably support high levels of livestock production, provided they are well managed and well matched to soils, aspect, topography, climate and livestock enterprise (Central West CMA, 2008). It is also important that there be a future emphasis on ‘no till’ practices and more cap and pipe projects in artesian areas.
CAse study: Centroc’s summit at the Mount: recharging the region.With funding from the NSW Environmental Trust and generous sponsorship from Bathurst Regional Council, Centroc members organised a Summit in July 2010 to build on the successes of the 2009 Summit and recharge the region.
Key note speakers were: • Mr Jon Dee, Australian of the Year• Prof David Karoly, eminent climate scientist• Prof Ian Acworth, Hydrogeologist• Mr Allan Jones, implementing change in reducing carbon emissions in local government
Young people also gave their point of view and Mr Glenn Holdstock of the National Broadband Company explained the status of the national broadband roll out.
The first day incorporated a Mayoral Bike Ride where the region’s Mayors had the opportunity to ride unusual and electric bicycles. Day one also incorporated the Electric Vehicle Challenge where the gathered electric vehicles all lined up on the grid at Mt Panorama and slid silently into an endurance test – to see who could go round the Mount the longest before their batteries ran flat.
There were a variety of presentations from the electric car industry and practitioners of better environmental practice in Central NSW. An Expo displayed innovative technology in delivering resilience to Central NSW.
The awards night celebrated Robert Wilson OAM and the winners of the Country Energy Shiny Halo Awards.Both the Opposition and Government at the Federal and State levels had opportunities to present their case for a
vision for Central NSW responding to Centroc’s priorities.This was Centroc’s first environmentally themed Summit and provided an excellent opportunity to collect
information about the environmental priorities of our region which was done via a large issues board that requested members commit up to five days of their time on particular areas.
The priority areas identified by Summit participants for action across the region are • Energy (establishing renewable energy generation and decentralised power systems utilising solar and solar
thermal, windpower, geothermal and trigeneration);
• Water (implementing the Centroc Water Security Study); and
• Transport (Support and advocate for rail in the region). Centroc now supports projects in the three highest priority areas and is working towards the others.
Jon Dee 2010 Australian of the Year
was the keynote speaker at the Shiny
Halo Dinner.
a greater depth than one based on annual species. Provided adequate ground cover is maintained, the potential for various forms of soil degradation (rising water tables, salinity, erosion and soil acidification) are also reduced.
Perennial pastures can also limit nutrient run-off into streams, be more competitive against weed invasion, increase soil carbon and improve soil structure, pasture
Water
66 2010–2011 Supplementary Report
Towards Sustainability

Council sustainability plans
Indicator – Council sustainability plans
Indicator – Council sustainability initiatives
Eight of the local Councils reported that they now have sustainability plans in place, which is an increase from last year. Six councils were able to itemise a total of 30 specific Council sustain-ability initiatives. These are shown in Table 10.
NetWaste together with eight of its Councils from the Central Sub-Region are leading the way in moving towards working in a more sustainable way and towards a more sustainable community. Blayney, Cabonne, Cowra, Forbes, Lachlan, Parkes, Weddin and Wellington Shire Councils recently adopted a Regional Environmental Sustainability Action Plan (ReSAP), a project which was funded by the NSW Environ-mental Trust and NetWaste and facilitated by EcoLens Consulting. It is the successful result of planning and consultation, including feedback from the community, over a twelve month period, to develop a ReSAP.
The Council sustainability initiatives support NSW State Government plans such as the new Home Power Savings Program which offers free help for low income earners to save up to 20% off their power use by receiving a visit from an energy expert, a Power Savings Kit and a personal action plan.
Table 10: Examples of Council Sustainability Initiatives
Local Council Council sustainability initiatives
Bathurst Sustainable schools grant program, Wastewatchers education program, Clean-up Australia Day, Sustainable Living Expo, Community tree plantings days and working bees, Implementation projects urban waterways management plan, Biodiversity Management Plan, Recycling and waste avoidance programs, Household hazardous collections, Development of Backyards for Wildlife Book, In house sustainability initiatives, eg. double sided printing
Cabonne Waste to Art, Free E-waste collection, Household Haxardous Waste Collection, Inhouse sustainability initiatives such as double sided printing, turing off computers/lights/monitors/printers/servers, Develop Council energy efficiency and sustainability committee, involvement with Centroc & NetWaste sustainability initiatives
Dubbo National Tree Day, School Tree Day, Clean Up Australia Day, Dubbo Show, Clean up World Weekend, Mobile Muster, Drum Muster, Bulky waste collection, Composting Workshops, Dubbo 2036 community plan, Dubbo LEP
Lachlan Sustainability committee implemented measures such as default double sided printing on all PCs,composting of all council shredded paper, promoting practices such as turning off computers after hours/sleep mode, reuse of council kitchen waste for chook food
Mid-Western Sponsorship of and participation in Green Day, Student parliament run in partnership with Red Hill Environment Education Centre, Native plant propagation project run in partnership with Red Hill Environment Education Centre, Wastewatchers education program continued in primary schools, School veggie garden program continued in primary schools, Worm farm – compost bin rebate continued
Orange Greener energy program, stormwater program for business
Bathurst Regional Council is also in the final construction stages of its Sustainable Lifestyle House – an educational project that showcases a range of construction techniques, materials, design features, fittings and fixtures which are more sustainable than those found in a standard building. The project aimed to educate both the community and the local building industry, and provide inspiration for members of the community who wish to build or renovate a home.
Construction of the Sustainable Lifestyle House commenced in September 2010 and works are progressing and being updated in a ‘construction blog’ on Council’s website. When construction is completed, the House will be officially opened and open days will be held on a regular basis to allow interested members of the community to view the completed home and gardens.
Climate Change Adaptation/Mitigation Initiatives
Indicator – Council plan focused on climate change adaptation/mitigation
Indicator – Council projects with climate change adaptation/mitigation objectives
Eight Councils reported that they have a sus-tainability plan or a plan that focuses attention on the issues of climate change mitigation
2010–2011 Supplementary Report 67
Regional State of the Environment Report

and/or adaptation. The ReSAP referred to above, includes strategies for climate change adaptation.
Four Councils reported that they had undertaken works or activities that have positive climate change impacts integrated in the projects objectives or outcomes. For example, Bathurst Regional Council has initiated a Revolving Energy Fund which will fund future energy savings projects with one project already having been implemented at the National Motor Racing Museum.
Indicator – Council facilities using Greenpower/renewable energy
The conversion to Greenpower is one way that Councils can reduce greenhouse gas emissions at their facilities. A number of Councils have redirected funds used for Greenpower to renewable energy systems. This follows on from the reduction in uptake reported in 2009–10. Even allowing for the fact that several Councils were unable to provide the data this year, it is clear that uptake of Greenpower by Councils is very low across the region because of substantial price rises.
Dubbo LGA has the fifth largest number of solar installations/household in Australia. There are 1,148 installations (1932 kW) meaning 9.97% of Dubbo households have solar panels connected (Clean Energy Council, May 2011). Council has also completed a renewable energy feasibility study for Council facilities within the Victoria Park / Civic Administration Precinct near the CBD. After energy efficiency initiatives, the most viable options are solar hot water and solar cells. The Council is currently installing solar panels on its facilities such as Family Day Care, Airport, Apex Oval, Rainbow Cottage, Caravan Park, Showground, Council Depot, Waste Depot, Animal Shelter and Orana Early Interven-tion building. These systems will add to the current 3 kW system which was installed on the Macquarie Regional Library in 2008. To help achieve Dubbo Council’s 2% Renewable Energy Target it is proposed to install up to 70 kW of solar cells on Council’s Western Plains Cultural Centre. This project will be one of the largest installations on a community building in Australia with annual savings of $21,300 and 88 tCO
2.
CAse study: bathurst revolving energy fundBathurst Regional Council is committed to the development of a sustainable culture as stated in the Bathurst-Orange-Dubbo Sus-tainability Charter. A stated aim of the charter is to:
“Reduce the environmental impact of Councils activities and become more efficient in our use of resources.”
Furthermore the Bathurst-Orange-Dubbo Environmental Sus-tainability Action Plan identifies that a key challenge for Councils is to “manage the growing demand for energy and rising energy costs.” Council’s total expenditure on electricity in 2010–2011 was in excess of $2.5 million. Further price rises in the order of 20% are expected to be incurred during the 2011–2012 financial year.
In the 2010–2011 Management Plan, Bathurst Regional Council committed $100,000 seed funding to establish a Revolving Energy Fund, a financial mechanism whereby a proportion of the savings made as a result of implemented energy saving projects is diverted into a designated fund to allow funding of future energy saving initiatives. It is envisaged that the Revolving Energy Fund will help build the capacity of Council to pursue environmental and operational improvements and reduce its greenhouse gas emissions.
A set of guidelines were developed for the operation of the Revolving Energy Fund and these have been adopted by Council. Under these guidelines individual projects can be funded to a maximum of $25,000. Reinvestment to the fund will occur with the initial repayment of the funding at a rate of 100% of actual savings until the initial project outlay has been repaid. Upon full repayment 50% of the savings will continue to be reinvested for a further two years in order to fund future energy saving initiatives.
The first project to be implemented under the Revolving Energy Fund was a lighting efficiency upgrade at the National Motor Racing Museum (NMRM). On average over the last five years the NMRM has consumed 147.3MWh of electricity per annum, with area lighting making up approximately 30% of this. Area lighting at the NMRM consisted of 400W high bay and 250W low bay lights and fluorescent tubes. The project replaced the high and low bay lights in the museum area with 150W LED high bay lights and the high bay lights in the shop area with LED fluorescent lighting. The total cost of the project was $23,761. The project will save approximately $11,000 and 27MWh of electricity per year, has a financial payback period of 2.2 years and will result in a reduction of 27.7 tonnes CO
2 emissions per
annum.
The National Motor
Racing Museum
received a lighting
upgrade.
Water
68 2010–2011 Supplementary Report
Towards Sustainability
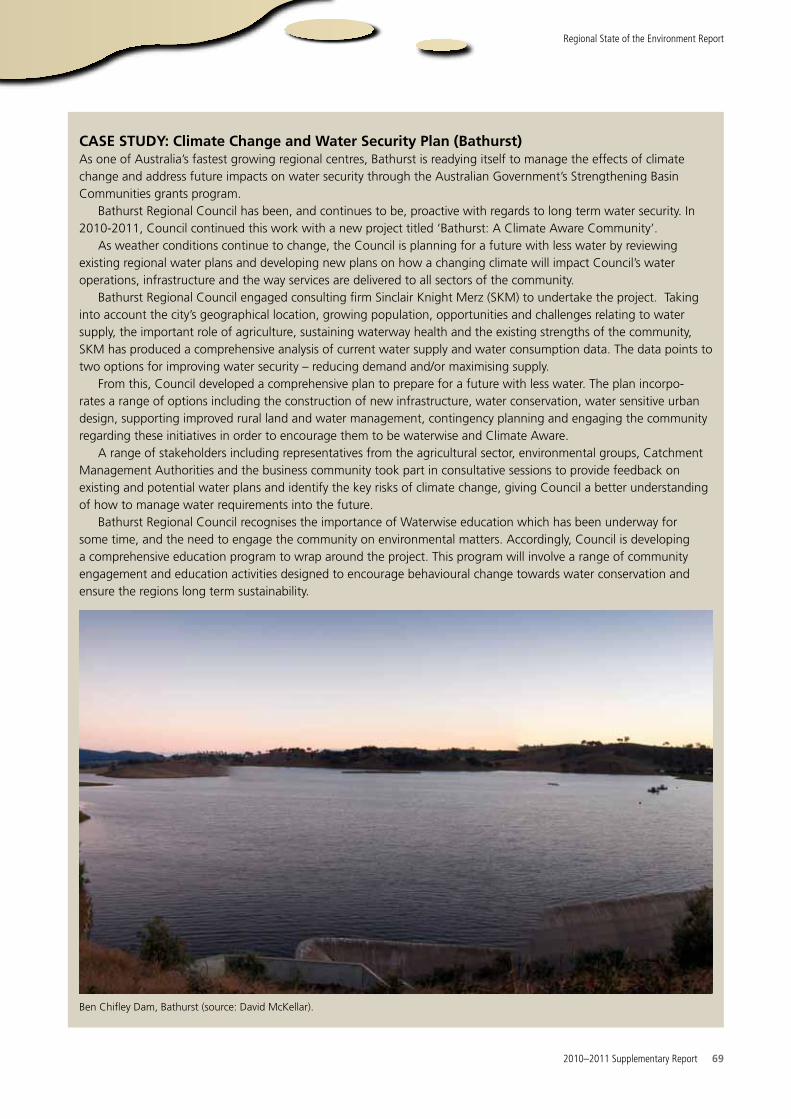
CAse study: Climate Change and Water security plan (bathurst)As one of Australia’s fastest growing regional centres, Bathurst is readying itself to manage the effects of climate change and address future impacts on water security through the Australian Government’s Strengthening Basin Communities grants program.
Bathurst Regional Council has been, and continues to be, proactive with regards to long term water security. In 2010-2011, Council continued this work with a new project titled ‘Bathurst: A Climate Aware Community’.
As weather conditions continue to change, the Council is planning for a future with less water by reviewing existing regional water plans and developing new plans on how a changing climate will impact Council’s water operations, infrastructure and the way services are delivered to all sectors of the community.
Bathurst Regional Council engaged consulting firm Sinclair Knight Merz (SKM) to undertake the project. Taking into account the city’s geographical location, growing population, opportunities and challenges relating to water supply, the important role of agriculture, sustaining waterway health and the existing strengths of the community, SKM has produced a comprehensive analysis of current water supply and water consumption data. The data points to two options for improving water security – reducing demand and/or maximising supply.
From this, Council developed a comprehensive plan to prepare for a future with less water. The plan incorpo-rates a range of options including the construction of new infrastructure, water conservation, water sensitive urban design, supporting improved rural land and water management, contingency planning and engaging the community regarding these initiatives in order to encourage them to be waterwise and Climate Aware.
A range of stakeholders including representatives from the agricultural sector, environmental groups, Catchment Management Authorities and the business community took part in consultative sessions to provide feedback on existing and potential water plans and identify the key risks of climate change, giving Council a better understanding of how to manage water requirements into the future.
Bathurst Regional Council recognises the importance of Waterwise education which has been underway for some time, and the need to engage the community on environmental matters. Accordingly, Council is developing a comprehensive education program to wrap around the project. This program will involve a range of community engagement and education activities designed to encourage behavioural change towards water conservation and ensure the regions long term sustainability.
Ben Chifley Dam, Bathurst (source: David McKellar).
2010–2011 Supplementary Report 69
Regional State of the Environment Report

Documents specifically referenced in this Report are:
Central West Catchment Management Authority (2006) Central West Catchment Action Plan 2006–16
Central West Catchment Management Authority (2010) Update on the 2006–16 Catchment Action Plan. Available from www.cw.cma.nsw.gov.au
Central West Catchment Management Authority (2011) Catchment Information. Available www.cw.cma.nsw.gov.au
Goldney, D, Kerle, A and Fleming, M (2007) Threatening Processes – Status of vertebrate fauna and their habitats. Report to the Central West CMA
Murray Darling Basin Committee (2007) Sustainable Rivers Audit: Implementation Period 2 (2005–06) Summary Report
National Parks and Wildlife Service (2003) Threatened Species Fact Sheet at www.environment.nsw.gov.au/resources/nature/Box-gumFactsheet.pdf
NSW Department of Primary Industries (2011) List of noxious weeds at www.dpi.nsw.gov.au/agriculture/pests-weeds/weeds/noxweed
Office of Environment and Heritage (2009) Salinity Audit Upland Catchments of the New South Wales Murray-Darling Basin
Western Catchment Management Authority (2007) Western Catchment Action Plan 2006-2016
A more detailed list of relevant references can be obtained from the 2008-09 Comprehensive Central West Regional State of the Environment Report.
References
70 2010–2011 Supplementary Report

Mt Oxley at sunrise,
Bourke (source: Wild Red
Frog Design)
2010–2011 Supplementary Report 71
Regional State of the Environment Report

72 2010–2011 Supplementary Report
Appendix – Data contributed by and sourced for Councils
Issue Sub-Issue Indicator Unit of Measure Bath
urst
Blay
ney
Boga
n
Bour
ke
Cabo
nne
Coon
ambl
e
Cow
ra
Dub
bo
Gilg
andr
a
Lach
lan
Mid
-Wes
tern
Nar
rom
ine
Obe
ron
Ora
nge
War
ren
War
rum
blng
le
Wel
lingt
on
Cent
ral W
est
CMA
Land
Land Degradation Contamination Contaminated land sites - Contaminated Land Register Number l l l l l l l l l l l l l l l l l
Contaminated land sites - potentially contaminated sites Number l l l l l l l l l l l l l l l l l
Contaminated sites rehabilitated Number l l l l l l l l l l l l l l l l l
Erosion Erosion affected land rehabilitated Hectares l l l l l l l l l l l l l l l l l l
Salinity Salinity affected land rehabilitated Location & sq km l
Mining Number and type of operating mines and quarries, licenced under EPA PO& EO Act Number l l l l l l l l l l l l l l l l l
Area covered by mining and mining exploration projects Hectares l l l l l l l l l l l l l l l l l
Air
Industrial Pollution Premises reporting to National Pollutant Inventory (NPI) No. of facilities reporting l l l l l l l l l l l l l l l l l
Number of Environment Protection Licences issued No of licences l l l l l l l l l l l l l l l l l
Odour Odour complaints received by Council Number l l l l l l l l l l l l l l l l l
Odour complaints received by the OEH Number l l l l l l l l l l l l l l l l l
Air Pollution Complaints Air quality complaints to the OEH Number of complaints l l l l l l l l l l l l l l l l l
Air quality complaints to Council Number of complaints l l l l l l l l l l l l l l l l l
Regional Air Quality Air pollution maximum goals for particulate matter exceeded days l
Water
Declining Water Quantity Average dam levels Volume % l l l l l l
Flood damage Dollars l l l l l l l l l l l l l l l l
Council Water Consumption Council managed parks, sportsgrounds, public open Hectares l l l l l l l l l l l l l l l l l
Irrigated council managed parks, sportsgrounds, public open space Hectares l l l l l l l l l l l l l l l l l
Water used by council for irrigation (including treated and untreated water) Megalitres (ML) l l l l l l l l l l l l l l l l l
Environmental Flows River flow (discharge) ML/day
Annual volume released to rivers for environmental flows GL
Town Water Consumption Total number of serviced properties Raw number l l l l l l l l l l l l l l l l l
Total number of unserviced properties Raw number l l l l l l l l l l l l l l l l
Annual metered supply Megalitres l l l l l l l l l l l l l l l l l
Annual consumption (Total from WTP) Megalitres l l l l l l l l l l l l l l l l
Average annual household use Kilolitres per household l l l l l l l l l l l l l l l l
Average water usage per connection type Kilolitres per annum l l l l l l l l l l l l l l l l l
Water restrictions implemented Level (1-5) l l l l l l l l l l l l l l l l l
Water conservation programs List of Programs l l l l l l l l l l l l l l l l
Number of residential meters Number l l l l l l l l l l l l l l l l l
Surface & Ground Water Extraction Number of irrigation licences from surface water sources Raw number l l l l l l l l l l l l l l l l l
Volume of surface water permissible for extraction under licences Gigalitres (GL) l l l l l l l l l l l l l l l l l
Actual volume extracted through surface water licences Gigalitres (GL) l l l l l l l l l l l l l l l l l
Number of bore licences from groundwater resources Kilolitres (kL) l l l l l l l l l l l l l l l l l
2010–2011 Supplementary Report 73
Regional State of the Environment Report
Issue Sub-Issue Indicator Unit of Measure Bath
urst
Blay
ney
Boga
n
Bour
ke
Cabo
nne
Coon
ambl
e
Cow
ra
Dub
bo
Gilg
andr
a
Lach
lan
Mid
-Wes
tern
Nar
rom
ine
Obe
ron
Ora
nge
War
ren
War
rum
blng
le
Wel
lingt
on
Cent
ral W
est
CMA
Land
Land Degradation Contamination Contaminated land sites - Contaminated Land Register Number l l l l l l l l l l l l l l l l l
Contaminated land sites - potentially contaminated sites Number l l l l l l l l l l l l l l l l l
Contaminated sites rehabilitated Number l l l l l l l l l l l l l l l l l
Erosion Erosion affected land rehabilitated Hectares l l l l l l l l l l l l l l l l l l
Salinity Salinity affected land rehabilitated Location & sq km l
Mining Number and type of operating mines and quarries, licenced under EPA PO& EO Act Number l l l l l l l l l l l l l l l l l
Area covered by mining and mining exploration projects Hectares l l l l l l l l l l l l l l l l l
Air
Industrial Pollution Premises reporting to National Pollutant Inventory (NPI) No. of facilities reporting l l l l l l l l l l l l l l l l l
Number of Environment Protection Licences issued No of licences l l l l l l l l l l l l l l l l l
Odour Odour complaints received by Council Number l l l l l l l l l l l l l l l l l
Odour complaints received by the OEH Number l l l l l l l l l l l l l l l l l
Air Pollution Complaints Air quality complaints to the OEH Number of complaints l l l l l l l l l l l l l l l l l
Air quality complaints to Council Number of complaints l l l l l l l l l l l l l l l l l
Regional Air Quality Air pollution maximum goals for particulate matter exceeded days l
Water
Declining Water Quantity Average dam levels Volume % l l l l l l
Flood damage Dollars l l l l l l l l l l l l l l l l
Council Water Consumption Council managed parks, sportsgrounds, public open Hectares l l l l l l l l l l l l l l l l l
Irrigated council managed parks, sportsgrounds, public open space Hectares l l l l l l l l l l l l l l l l l
Water used by council for irrigation (including treated and untreated water) Megalitres (ML) l l l l l l l l l l l l l l l l l
Environmental Flows River flow (discharge) ML/day
Annual volume released to rivers for environmental flows GL
Town Water Consumption Total number of serviced properties Raw number l l l l l l l l l l l l l l l l l
Total number of unserviced properties Raw number l l l l l l l l l l l l l l l l
Annual metered supply Megalitres l l l l l l l l l l l l l l l l l
Annual consumption (Total from WTP) Megalitres l l l l l l l l l l l l l l l l
Average annual household use Kilolitres per household l l l l l l l l l l l l l l l l
Average water usage per connection type Kilolitres per annum l l l l l l l l l l l l l l l l l
Water restrictions implemented Level (1-5) l l l l l l l l l l l l l l l l l
Water conservation programs List of Programs l l l l l l l l l l l l l l l l
Number of residential meters Number l l l l l l l l l l l l l l l l l
Surface & Ground Water Extraction Number of irrigation licences from surface water sources Raw number l l l l l l l l l l l l l l l l l
Volume of surface water permissible for extraction under licences Gigalitres (GL) l l l l l l l l l l l l l l l l l
Actual volume extracted through surface water licences Gigalitres (GL) l l l l l l l l l l l l l l l l l
Number of bore licences from groundwater resources Kilolitres (kL) l l l l l l l l l l l l l l l l l

74 2010–2011 Supplementary Report
Appendix – Data contributed by and sourced for Councils
Issue Sub-Issue Indicator Unit of Measure Bath
urst
Blay
ney
Boga
n
Bour
ke
Cabo
nne
Coon
ambl
e
Cow
ra
Dub
bo
Gilg
andr
a
Lach
lan
Mid
-Wes
tern
Nar
rom
ine
Obe
ron
Ora
nge
War
ren
War
rum
blng
le
Wel
lingt
on
Cent
ral W
est
CMA
Volume of groundwater permissible for extraction under licences Gigalitres (GL) l l l l l l l l l l l l l l l l l
Water sharing plans in place Number l l l l l l l l l l l l l l l l l
Declining Water Quality Industrial/Agricultural Pollution % Effluent reuse & location of reuse % l l l l l l l l l l l l l l l l l
Load Based Licensing fees Total paid in fees l l l l l l l l l l l l l l l
Exceedances of license discharge consent recorded Raw number l l l l l l l l l l l l l l l l
No. of trade waste approvals Total in place l l l l l l l l l l l l l l l l
Total volume of trade waste discharged to sewer ML l l l l l l l l l l l l l l l l
Erosion & Sediment Control complaints received by Council Number l l l l l l l l l l l l l l l
Trade waste licences in force currently Number l l l l l l l l l l l l l l l l
Load Based Licencing volume Total kg of pollutants l l l l l l l l l l l l l l l
Stormwater Pollution Number of gross pollutant traps installed Total number of GPTs currently installed l l l l l l l l l l l l l l l l
Amount of litter collected in GPTs Tonnes l l l l l l l l l l l l l l l l
Total catchment area of GPTs Hectares l l l l l l l l l l l l l l l l
Erosion & sediment control policy implemented? Yes/No l l l l l l l l l l l l l
Water pollution complaints Number and type l l l l l l l l l l l l l l l l
Town Water Quality Drinking water guidelines not met Number of instances l l l l l l l l l l l l l l l l l
Drinking water complaints Number & Type l l l l l l l l l l l l l l l l l
Surface & Ground Water Quality Salinity % samples exceeding ANZECC guideline
Total Nitrogen % samples exceeding ANZECC guideline l l l l l l l l l l l l l l l l l l
Total Phosphorus % samples exceeding ANZECC guideline l l l l l l l l l l l l l l l l l l
E.coli % samples exceeding ANZECC guideline l l l l l l l l l l l l l l l l l l
Waste water treatment Septic tanks in LGA Number l l l l l l l l l l l l l l l l
Septic related complaints Number l l l l l l l l l l l l l l l l
Proportion of annual failed wastewater treatment plant inspections % l l l l l l l l l l l l l l l l
Biodiversity
Invasive Species Invasive species (listed noxious or WONS) under active management Number of species l l l l l l l l l l l l l l
Number of declared noxious weeds Number of species l l l l l l l l l l l l l l l l l
Threatened species Locally significant species and ecological communities List l l l l l l l l l l l l l l l
Threatened Species State Threatened species listed in LGA Number & list of species l
Threatened species actions implemented (e.g. PAS, recovery plans) Number l l l l l l l l l l l l l l l
Fish restocking activities: native species Number l l l l l l l l l l l l l l l l l
Fish restocking activities: non-native species Number l l l l l l l l l l l l l l l l l
Key threatening processes Fire Regimes No. of uncontrolled fire incidents Number & area
Hazard reduction burns Number & area l l l l l l l l l l l l l l l l
Habitat Loss Vegetation protected and rehabilitated through CMA incentive funding Hectares l
Proportion of Council reserves that is bushland/remnant vegetation Hectares l l l l l l l l l l l l
Council Reserves - total area Hectares l l l l l l l l l l l l l l l l

2010–2011 Supplementary Report 75
Regional State of the Environment Report
Issue Sub-Issue Indicator Unit of Measure Bath
urst
Blay
ney
Boga
n
Bour
ke
Cabo
nne
Coon
ambl
e
Cow
ra
Dub
bo
Gilg
andr
a
Lach
lan
Mid
-Wes
tern
Nar
rom
ine
Obe
ron
Ora
nge
War
ren
War
rum
blng
le
Wel
lingt
on
Cent
ral W
est
CMA
Volume of groundwater permissible for extraction under licences Gigalitres (GL) l l l l l l l l l l l l l l l l l
Water sharing plans in place Number l l l l l l l l l l l l l l l l l
Declining Water Quality Industrial/Agricultural Pollution % Effluent reuse & location of reuse % l l l l l l l l l l l l l l l l l
Load Based Licensing fees Total paid in fees l l l l l l l l l l l l l l l
Exceedances of license discharge consent recorded Raw number l l l l l l l l l l l l l l l l
No. of trade waste approvals Total in place l l l l l l l l l l l l l l l l
Total volume of trade waste discharged to sewer ML l l l l l l l l l l l l l l l l
Erosion & Sediment Control complaints received by Council Number l l l l l l l l l l l l l l l
Trade waste licences in force currently Number l l l l l l l l l l l l l l l l
Load Based Licencing volume Total kg of pollutants l l l l l l l l l l l l l l l
Stormwater Pollution Number of gross pollutant traps installed Total number of GPTs currently installed l l l l l l l l l l l l l l l l
Amount of litter collected in GPTs Tonnes l l l l l l l l l l l l l l l l
Total catchment area of GPTs Hectares l l l l l l l l l l l l l l l l
Erosion & sediment control policy implemented? Yes/No l l l l l l l l l l l l l
Water pollution complaints Number and type l l l l l l l l l l l l l l l l
Town Water Quality Drinking water guidelines not met Number of instances l l l l l l l l l l l l l l l l l
Drinking water complaints Number & Type l l l l l l l l l l l l l l l l l
Surface & Ground Water Quality Salinity % samples exceeding ANZECC guideline
Total Nitrogen % samples exceeding ANZECC guideline l l l l l l l l l l l l l l l l l l
Total Phosphorus % samples exceeding ANZECC guideline l l l l l l l l l l l l l l l l l l
E.coli % samples exceeding ANZECC guideline l l l l l l l l l l l l l l l l l l
Waste water treatment Septic tanks in LGA Number l l l l l l l l l l l l l l l l
Septic related complaints Number l l l l l l l l l l l l l l l l
Proportion of annual failed wastewater treatment plant inspections % l l l l l l l l l l l l l l l l
Biodiversity
Invasive Species Invasive species (listed noxious or WONS) under active management Number of species l l l l l l l l l l l l l l
Number of declared noxious weeds Number of species l l l l l l l l l l l l l l l l l
Threatened species Locally significant species and ecological communities List l l l l l l l l l l l l l l l
Threatened Species State Threatened species listed in LGA Number & list of species l
Threatened species actions implemented (e.g. PAS, recovery plans) Number l l l l l l l l l l l l l l l
Fish restocking activities: native species Number l l l l l l l l l l l l l l l l l
Fish restocking activities: non-native species Number l l l l l l l l l l l l l l l l l
Key threatening processes Fire Regimes No. of uncontrolled fire incidents Number & area
Hazard reduction burns Number & area l l l l l l l l l l l l l l l l
Habitat Loss Vegetation protected and rehabilitated through CMA incentive funding Hectares l
Proportion of Council reserves that is bushland/remnant vegetation Hectares l l l l l l l l l l l l
Council Reserves - total area Hectares l l l l l l l l l l l l l l l l

76 2010–2011 Supplementary Report
Appendix – Data contributed by and sourced for Councils
76 2010–2011 Supplementary Report
Issue Sub-Issue Indicator Unit of Measure Bath
urst
Blay
ney
Boga
n
Bour
ke
Cabo
nne
Coon
ambl
e
Cow
ra
Dub
bo
Gilg
andr
a
Lach
lan
Mid
-Wes
tern
Nar
rom
ine
Obe
ron
Ora
nge
War
ren
War
rum
blng
le
Wel
lingt
on
Cent
ral W
est
CMA
Council Reserves - bushland/remnant vegetation Hectares l l l l l l l l l l l l l l l
Addition to National Park estate Hectares
Area of State Forest in LGA Hectares l l l l l l l l l l l l l l l l
Habitat areas revegetated Hectares l l l l l l l l l l l l l l l
Environmental volunteers working on public open space Person Hours l l l l l l l l l l l l l l l
Voluntary Conservation Agreements, Property Vegetation Plans & biobanking Number l
Extent (area) of native vegetation Hectares l
Area protected in conservation reserves & under voluntary conservation agreements Hectares l l l l l l l l l l l l l l l l l
Project funding agreements with landholders Number l
Land Clearing Clearing complaints to the OEH Number l l l l l l l l l l l l l l l l l
Riparian Riparian vegetation recovery actions Number l l l l l l l l l l l l l l l l l
Riparian vegetation recovery area Hectares l l l l l l l l l l l l l l l l l
Roadside Roadside vegetation management plan Yes/No l l l l l l l l l l l l l l l l l
Human Settlement
Indigenous Heritage Identification Number of Aboriginal sites on AHIMS register Number & Type
Do you have a current licence to access AHIMS register within your Council? Yes/No l l l l l l l l l l l l l l l
Construction & Development Inclusion in DCPs & rural strategies Yes/No l l l l l l l l l l l l l l l l
Extent of liaison with indigenous communities Rank (0 = none, 3 = High) l l l l l l l l l l l l l l l l
Development on listed aboriginal sites Number approvals l l l l l l l l l l l l l l l l
Maintenance Management plan/ strategy in place Yes/No, Date l l l l l l l l l l l l l l l
Management actions/ responses Number l l l l l l l l l l l l l l l l
Non-Indigenous Heritage Identification National Heritage Items Number and type
NSW Heritage Inventory items Number and type l l l l l l l l l l l l l l l l l
National Trust listed items Number and type
Locally listed heritage items Number and type l l l l l l l l l l l l l l l l l
Management Actions to protect non-aboriginal heritage (including management plans) Number l l l l l l l l l l l l l l l l
Heritage buildings on statutory heritage lists renovated/improved in past year Number l l l l l l l l l l l l l l l l
Construction & Development Heritage buildings on statutory heritage lists demolished/degraded in past year Number l l l l l l l l l l l l l l l l
Noise Pollution Urban noise Noise complaints received by Council Type & Number l l l l l l l l l l l l l l l l l
Industrial Noise Noise complaints received by Council Number l l l l l l l l l l l l l l l l
Noise complaints received by EPA Number l l l l l l l l l l l l l l l l l
Population & Settlement Patterns Ageing Populations Median age Years
Urban/Industrial Expansion Number of development consents and building approvals Number l l l l l l l l l l l l l l l l l
Landuse conflict complaints Number l l l l l l l l l l l l l l l l
New road construction km l l l l l l l l l l l l l l l l
Road upgrades km l l l l l l l l l l l l l l l l

2010–2011 Supplementary Report 77
Regional State of the Environment Report Regional State of the Environment Report
2010–2011 Supplementary Report 77
Issue Sub-Issue Indicator Unit of Measure Bath
urst
Blay
ney
Boga
n
Bour
ke
Cabo
nne
Coon
ambl
e
Cow
ra
Dub
bo
Gilg
andr
a
Lach
lan
Mid
-Wes
tern
Nar
rom
ine
Obe
ron
Ora
nge
War
ren
War
rum
blng
le
Wel
lingt
on
Cent
ral W
est
CMA
Council Reserves - bushland/remnant vegetation Hectares l l l l l l l l l l l l l l l
Addition to National Park estate Hectares
Area of State Forest in LGA Hectares l l l l l l l l l l l l l l l l
Habitat areas revegetated Hectares l l l l l l l l l l l l l l l
Environmental volunteers working on public open space Person Hours l l l l l l l l l l l l l l l
Voluntary Conservation Agreements, Property Vegetation Plans & biobanking Number l
Extent (area) of native vegetation Hectares l
Area protected in conservation reserves & under voluntary conservation agreements Hectares l l l l l l l l l l l l l l l l l
Project funding agreements with landholders Number l
Land Clearing Clearing complaints to the OEH Number l l l l l l l l l l l l l l l l l
Riparian Riparian vegetation recovery actions Number l l l l l l l l l l l l l l l l l
Riparian vegetation recovery area Hectares l l l l l l l l l l l l l l l l l
Roadside Roadside vegetation management plan Yes/No l l l l l l l l l l l l l l l l l
Human Settlement
Indigenous Heritage Identification Number of Aboriginal sites on AHIMS register Number & Type
Do you have a current licence to access AHIMS register within your Council? Yes/No l l l l l l l l l l l l l l l
Construction & Development Inclusion in DCPs & rural strategies Yes/No l l l l l l l l l l l l l l l l
Extent of liaison with indigenous communities Rank (0 = none, 3 = High) l l l l l l l l l l l l l l l l
Development on listed aboriginal sites Number approvals l l l l l l l l l l l l l l l l
Maintenance Management plan/ strategy in place Yes/No, Date l l l l l l l l l l l l l l l
Management actions/ responses Number l l l l l l l l l l l l l l l l
Non-Indigenous Heritage Identification National Heritage Items Number and type
NSW Heritage Inventory items Number and type l l l l l l l l l l l l l l l l l
National Trust listed items Number and type
Locally listed heritage items Number and type l l l l l l l l l l l l l l l l l
Management Actions to protect non-aboriginal heritage (including management plans) Number l l l l l l l l l l l l l l l l
Heritage buildings on statutory heritage lists renovated/improved in past year Number l l l l l l l l l l l l l l l l
Construction & Development Heritage buildings on statutory heritage lists demolished/degraded in past year Number l l l l l l l l l l l l l l l l
Noise Pollution Urban noise Noise complaints received by Council Type & Number l l l l l l l l l l l l l l l l l
Industrial Noise Noise complaints received by Council Number l l l l l l l l l l l l l l l l
Noise complaints received by EPA Number l l l l l l l l l l l l l l l l l
Population & Settlement Patterns Ageing Populations Median age Years
Urban/Industrial Expansion Number of development consents and building approvals Number l l l l l l l l l l l l l l l l l
Landuse conflict complaints Number l l l l l l l l l l l l l l l l
New road construction km l l l l l l l l l l l l l l l l
Road upgrades km l l l l l l l l l l l l l l l l

78 2010–2011 Supplementary Report
Appendix – Data contributed by and sourced for Councils
Issue Sub-Issue Indicator Unit of Measure Bath
urst
Blay
ney
Boga
n
Bour
ke
Cabo
nne
Coon
ambl
e
Cow
ra
Dub
bo
Gilg
andr
a
Lach
lan
Mid
-Wes
tern
Nar
rom
ine
Obe
ron
Ora
nge
War
ren
War
rum
blng
le
Wel
lingt
on
Cent
ral W
est
CMA
Waste
Waste Generation & Disposal Total waste entombed at primary landfill Tonnes/annum l l l l l l l l l l l l l l l l l
Total waste entombed at other landfills Tonnes/annum l l l l l l l l l l l l l l l l l
Average total waste generated per person Tonnes/annum (Compare to national average) l l l l l l l l l l l l l l
Average cost of waste service per residential household $ per household l l l l l l l l l l l l l l l l l
Emissions from landfill t CO2e-
Hazardous/Liquid Waste Drummuster collections No. drums &/or tonnes l l l l l l l l l l l l l l l l l
Waste Pollution Littering & Illegal Dumping Annual amount of litter collected by streetsweeper Tonnes l l l l l l l l l l l l l l l l l
Illegal waste disposal complaints to Council Number & tonnes l l l l l l l l l l l l l l l l l
Clean Up Australia sites No. of sites registered in LGA
Reduce Office paper used by Council Number of reams ordered per annum l l l l l l l l l l l l l l l l l
Garden organics collected (diverted from landfill) Tonnes l l l l l l l l l l l l l l l l l
E-Waste diverted from landfill Tonnes l l l l l l l l l l l l l l l l
Recycle Amount of material recycled Tonnes l l l l l l l l l l l l l l l l l
Volume of material recycled per person kg / person l l l l l l l l l l l l l l l l l
Toward Sustainability
Climate Change Adaptation to future impact of climate change Council adaptation initiatives Yes/No l l l l l l l l l l l l
Mitigation of climate change Council plan focused on Climate Change mitigation? Yes/No l l l l l l l l l l l l l l l l
Council projects with Climate Change adaptation/mitigation objectives? Yes/No l l l l l l l l l l l l l l l
Council mitigation initiatives List l l l l l l l l l l l l l l l l
Number of Council controlled facilities consuming electricity Number l l l l l l l l l l l l l l l l l
Annual electricity consumption for Council controlled facilities MWh l l l l l l l l l l l l l l l l
Council facilities consuming Greenpower (relate to State Govt goal of Greenpower uptake) % l l l l l l l l l l l l l l l l
No. of Council controlled facilities consuming gas Number l l l l l l l l l l l l l l l l
Annual natural gas consumption for Council controlled facilities Gigajoules l l l l l l l l l l l l l l l
Total fuel consumption of Council Total Kilolitres per annum l l l l l l l l l l l l l l l l
Annual bottled gas consumption for Council controlled facilities Litres l l l l l l l l l l l l l
Sustainable Practices Sustainable agriculture Sustainable farming initiatives undertaken with CMA funding Hectares l
Certified organic producers Number l l l l l l l l l l l l l l l l l
Council & community sustainability Council sustainability initiatives List l l l l l l l l l l l l l l l
Council sustainability plan? Yes/No l l l l l l l l l l l l l l l l
Small scale renewable energy uptake kw installed by LGA l l l l l l l l l l l l l l
l Denotes those Councils that were compared in the trend analysis for these indicators
l Data contributed but not compared in summary tables

2010–2011 Supplementary Report 79
Regional State of the Environment Report
Issue Sub-Issue Indicator Unit of Measure Bath
urst
Blay
ney
Boga
n
Bour
ke
Cabo
nne
Coon
ambl
e
Cow
ra
Dub
bo
Gilg
andr
a
Lach
lan
Mid
-Wes
tern
Nar
rom
ine
Obe
ron
Ora
nge
War
ren
War
rum
blng
le
Wel
lingt
on
Cent
ral W
est
CMA
Waste
Waste Generation & Disposal Total waste entombed at primary landfill Tonnes/annum l l l l l l l l l l l l l l l l l
Total waste entombed at other landfills Tonnes/annum l l l l l l l l l l l l l l l l l
Average total waste generated per person Tonnes/annum (Compare to national average) l l l l l l l l l l l l l l
Average cost of waste service per residential household $ per household l l l l l l l l l l l l l l l l l
Emissions from landfill t CO2e-
Hazardous/Liquid Waste Drummuster collections No. drums &/or tonnes l l l l l l l l l l l l l l l l l
Waste Pollution Littering & Illegal Dumping Annual amount of litter collected by streetsweeper Tonnes l l l l l l l l l l l l l l l l l
Illegal waste disposal complaints to Council Number & tonnes l l l l l l l l l l l l l l l l l
Clean Up Australia sites No. of sites registered in LGA
Reduce Office paper used by Council Number of reams ordered per annum l l l l l l l l l l l l l l l l l
Garden organics collected (diverted from landfill) Tonnes l l l l l l l l l l l l l l l l l
E-Waste diverted from landfill Tonnes l l l l l l l l l l l l l l l l
Recycle Amount of material recycled Tonnes l l l l l l l l l l l l l l l l l
Volume of material recycled per person kg / person l l l l l l l l l l l l l l l l l
Toward Sustainability
Climate Change Adaptation to future impact of climate change Council adaptation initiatives Yes/No l l l l l l l l l l l l
Mitigation of climate change Council plan focused on Climate Change mitigation? Yes/No l l l l l l l l l l l l l l l l
Council projects with Climate Change adaptation/mitigation objectives? Yes/No l l l l l l l l l l l l l l l
Council mitigation initiatives List l l l l l l l l l l l l l l l l
Number of Council controlled facilities consuming electricity Number l l l l l l l l l l l l l l l l l
Annual electricity consumption for Council controlled facilities MWh l l l l l l l l l l l l l l l l
Council facilities consuming Greenpower (relate to State Govt goal of Greenpower uptake) % l l l l l l l l l l l l l l l l
No. of Council controlled facilities consuming gas Number l l l l l l l l l l l l l l l l
Annual natural gas consumption for Council controlled facilities Gigajoules l l l l l l l l l l l l l l l
Total fuel consumption of Council Total Kilolitres per annum l l l l l l l l l l l l l l l l
Annual bottled gas consumption for Council controlled facilities Litres l l l l l l l l l l l l l
Sustainable Practices Sustainable agriculture Sustainable farming initiatives undertaken with CMA funding Hectares l
Certified organic producers Number l l l l l l l l l l l l l l l l l
Council & community sustainability Council sustainability initiatives List l l l l l l l l l l l l l l l
Council sustainability plan? Yes/No l l l l l l l l l l l l l l l l
Small scale renewable energy uptake kw installed by LGA l l l l l l l l l l l l l l
l Denotes those Councils that were compared in the trend analysis for these indicators
l Data contributed but not compared in summary tables


catchment management authority
C E N T R A L
W E S T
C A T C H M E N T
COWRA
BLAYNEY
OBERON
BATHURSTREGIONAL
MID-WESTERNREGIONAL
ORANGE
WELLINGTON
BOURKE
BOGAN
WARREN
COONAMBLE
GILGANDRA
WARRUMBUNGLE
NARROMINE
DUBBO
LACHLAN CABONNE
Wellington
Molong
DubboNarromine
Warren
Nyngan
Condobolin
Orange
Blayney
CowraOberon
Bathurst
Mudgee
Gilgandra
Coonamble
Bourke
Coonabarabran
MacqaurieMarshes
Macquarie River
Bogan River
Cudg
eg
ong River
Castlereagh River
Lake Burrendong
Darl ing
Riv e r
Regional State of theEnvironment Report
2010–2011
For the Councils
of the Greater Central West Region of NSW:
Bathurst, Blayney, Bogan, Bourke, Cabonne, Coonamble, Cowra, Dubbo, Gilgandra,
Lachlan, Mid-Western, Narromine, Oberon, Orange, Warren, Warrumbungle, Wellington
Supplementary Report
Regional State of the Environment Report for the Councils of the G
reater Central West Region of N
SW
2010–2011 Supplem
entary Report
Printed on recycled paper