
Regional Report for the Youth Employment Inventory...
25
1 Interventions to Support Young Workers in South, East Asia and the Pacific Regional Report for the Youth Employment Inventory Antoneta Stavreska World Bank October, 2006
Transcript of Regional Report for the Youth Employment Inventory...

1
Interventions to Support Young Workers in South, East Asia and the Pacific
Regional Report for the Youth Employment Inventory
Antoneta Stavreska
World Bank October, 2006
2
Interventions to Support Young Workers in South, East Asia and the
Pacific A. Introduction: the objective of the inventory and of the regional report
Youth employment has become a major concern in many countries around the world. As policy-makers consider measures to help young people make the transition into the labor market and obtain decent work, they are hampered by a lack of information on what their options are, what works in different situations, and what has been tried and failed. To respond to this situation, the World Bank has compiled a world-wide inventory of interventions that are designed to integrate young people into the labor market. In South and East Asia and the Pacific the Youth Employment Inventory (YEI) documented 21 interventions from 11 countries across the region. These interventions have been analyzed in order to (i) document the types of programs that have been implemented to support young workers to find work; and (ii) identify what appears to work in terms of improving employment outcomes for youth.
This regional report studies the characteristics of youth employment programs in Asia
and the Pacific, describes popular interventions and their labor market impacts whenever evaluation evidence is available. Section B describes the methodology used to compile and assess the interventions. Coverage of the inventory by category of intervention, targeting and financing is presented in Section C. Section D discusses the quality of the information and evaluations while section E assess the quality of the interventions in terms of the programs impact on employment and earnings. Conclusions are drawn in Section F. B. The methodology for designing and compiling the inventory The YEI includes programs designed to facilitate the transition of young people into the labor market. In particular, the focus is on disadvantaged young people. The inventory is meant to be as exhaustive as possible and is not confined to success stories, on the principle that there is a great deal to be learned from mistakes and failures.
The YEI itself does not include new project information but, rather, is based exclusively on existing documentation. This information has been gathered from databases, research papers, publications and web-sites of international organizations (the World Bank, the United Nations and its regional commissions, the International Labor Office, the Asian Development Bank, the African Development Bank, the Inter-American Development Bank, the Organization for Economic Cooperation and Development, the European Union and its institutions, other regional organizations, etc.), bilateral donor agencies, non-government organizations, national labor market programs, national research institutions, as well as academic publications, both books and journals, and conference reports.
This section presents the methodology implemented to compile the inventory. It includes
a description of the framework used to categorize interventions, and then summarizes the data-collection effort, focusing on the key methodological questions that define the scope and content of the inventory.

3
1. Framework for classifying interventions
A basic issue to be resolved was setting the boundaries on what to include in the inventory. Most important was how far back into the education system the inventory should cover. Analytical considerations alone would suggest that it should go back a long way. Many studies have concluded that the impact of interventions on future employment outcomes of disadvantaged young people diminish with age – in other words, addressing potential problems early has a greater return than when young people have left formal education. For example, in reviewing the evidence, the OECD (2002) has concluded that “the biggest pay-off for disadvantaged youths comes from early and sustained interventions.” (p. 31).1 In other words, any policy advice on addressing youth employment problems should emphasize that prevention is more effective than curing.
However, while there is no denying the strength of this analytical point, there are practical grounds for limiting the inventory to post-formal-schooling interventions. One is the need to set boundaries to limit the inventory to a feasible size. The second is to give it a clear identity that differentiates the study from the enormous body of literature on formal education. By limiting the scope in this way, we do not intend to detract from the importance of formal schooling and early interventions in improving subsequent labor market outcomes.
The template used to categorize programs in the inventory builds on an earlier framework
developed by Godfrey (2003). That framework embodied a two-fold approach to policy to address the employment problems of disadvantaged youth: (1) increasing the demand for labor in general in relation to supply, and (2) increasing the 'integrability' of the disadvantaged young, so that they can take advantage of opportunities that arise when the demand for labor increases. Integrability can be increased by (a) remedying or counteracting market failure (e.g., in the labor market, credit market, or training market), (b) improving labor market regulations, and (c) improving the skills of disadvantaged youth.
Based on these two premises, the inventory classifies youth employment interventions into 9 categories, displayed in Table 1. These groupings are largely self-explanatory but a few comments may be useful. Category 1, “making the labor market work better for young people”, includes interventions that improve information (counseling, job search skills), increase labor demand for youth (wage subsidies and public works), and remove discrimination. Category 2, “improving chances for young entrepreneurs”, covers interventions that provide assistance (financial, technical, and training) to youth who are starting their own business. Categories 3 and 4 both deal with training: the former includes the full range of post-formal schooling training programs while the latter includes interventions intended to address training market failures by providing information, credit, and other financial incentives. Location can also be a barrier for young people if where they reside isolates them from learning or employment opportunities, or even a secure living environment. Category 5 is meant to include interventions (e.g., transportation services or residential mobility) that can help young people overcome this form of barrier. Category 6 covers regulatory reforms (e.g., changes in labor law, minimum wage, etc.) that are designed to enhance employment opportunities for young people. Category 7 includes
1 The OECD review goes on to note that “…[S]uch interventions should begin even before children enter the compulsory schooling system, and they should be followed by intensive efforts to boost their performance in primary and secondary schooling and reduce drop-out rates.” Pre-school and school programs that attempt to improve the relative access and learning outcomes of children from disadvantaged backgrounds (variously defined) are particularly interesting.

4
programs to provide job opportunities outside the country. Interventions that provide multiple types of services, and thus cannot be included in one of the other groups, are included in Category 8. Finally, Category 9 is a residual grouping. Examples of programs under each main category are included throughout this paper.
Table 1: Categories used to classify programs in the YEI
1. Making the labor market work better for young people 1a. counseling, job search skills 1b. wage subsidies 1c. public works programs 1d. anti-discrimination legislation 1e. other 2. Improving chances for young entrepreneurs 3. Skills training for young people 3a. vocational training including apprenticeship systems 3b. literacy & numeracy – young adult literacy programs 3c. 2nd chance & equivalency programs 3d. other 4. Making training systems work better for young people 4a. information 4b. credit (to individuals or enterprises) 4c. financial incentives (subsidies, vouchers) 4d. other 5. Programs to counteract residential segregation of disadvantaged young people 5a. transportation 5b. others 6. Improving labor market regulations to the benefit of young people 7. Programs for overseas employment of young people 8. Comprehensive approach 9. Other (e.g. voluntary national service programs)
2. The inventory – how it was compiled
The inventory provides a wealth of information on each intervention and, as noted above, eligible interventions were not confined to success stories. The research team identified programs and gathered documentation from the range of sources described at the beginning of this section. With a view to maximizing synergies with other related initiatives, the compilation of the inventory was carried out in cooperation with other activities of the Youth Employment Network as well as youth employment initiatives at the World Bank.
The screening and documentation process was based on a standardized screening and data-collection methodology developed by the research team. Since different researchers were undertaking the primary research, which included determining program eligibility, reviewing documentation, entering information into the inventory database, and assessing the quality of the intervention, it was essential that a standardized methodology was followed.
Criteria for inclusion. A major methodological issue concerned the determination of what kinds of interventions would be included in the YEI. The question of how far back into the education system the inventory should go has already been discussed. Two other considerations
5
relevant to defining scope were (i) whether the inventory should be restricted to programmatic interventions or also include policies like labor market regulations and minimum wages that affect labor market outcomes for young people; and (ii) whether it should include interventions that, while not targeted at youth specifically, could have a big impact on young people. With respect to policy, the determination was to base eligibility on the stated purpose and to include only those policy interventions that specifically targeted young people (e.g., a special youth minimum wage or contracting rules that only applied to young people). As we will see in the next section, though, there were very few policies included in the inventory; almost all interventions covered are programs. As for programs, they were eligible for inclusion even if they did not explicitly target youth if the documentation indicated that young people were the primary participants. As we will see in the next section, about 20 per cent of the programs included in the inventory did not have age restrictions. Also, both completed and ongoing interventions were eligible for inclusion.
Further restrictions were imposed based on the quality of the information. Ideally, given the inventory’s objective of providing information on what works, sound impact evaluations should have been a condition of inclusion. However, most interventions simply do not meet this condition, especially in developing economies, so imposing this restriction would have excluded the majority of the interventions identified. This would have severely limited the project’s value in documenting what has been tried to support young workers, which was one of the objectives of the study. Nonetheless, a minimum amount of information was required for inclusion -- sound information on the intervention’s objectives, implementation design, and targeting criteria. Also, the data collection placed priority on including evaluated interventions – i.e., those with net impact evaluations and cost-benefit analysis. To some extent, then, interventions with evaluations are overrepresented in the inventory.
Template. A questionnaire template was designed to ensure consistency and uniformity in the collection and recording of information for the inventory. The template and the coding system used are shown in Annex A. Information collected on each program includes intervention category (as described in Table 1), country, time period in which it was implemented, current status, the specific labor market problems it sought to address, main objectives, a detailed description of the program (scale, financing, etc.), as well as several performance indicators to understand the program’s impact, summary measures on the quality of the evaluation evidence and the quality of the intervention (described below), and sources for further information on the intervention. To allow for quantitative analysis of the data, variables included in the template were coded on the basis of multiple choice measures wherever feasible. The template and coding system are shown in Annex A.
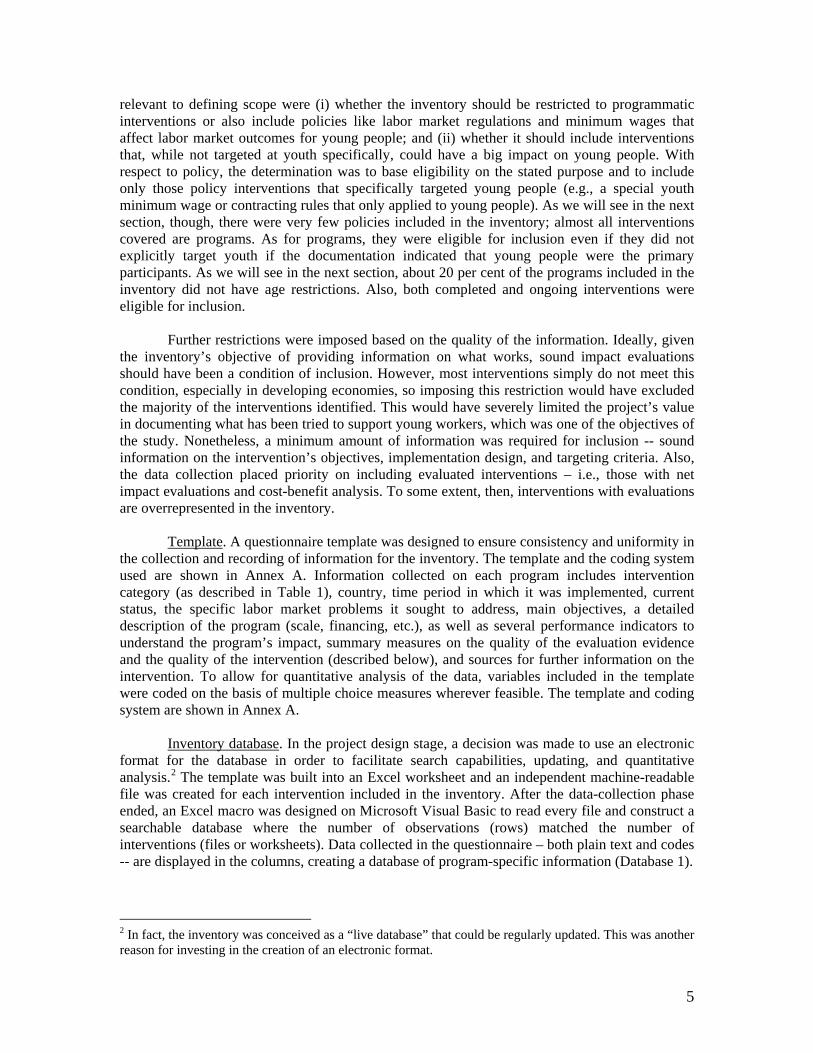
Inventory database. In the project design stage, a decision was made to use an electronic
format for the database in order to facilitate search capabilities, updating, and quantitative analysis.2 The template was built into an Excel worksheet and an independent machine-readable file was created for each intervention included in the inventory. After the data-collection phase ended, an Excel macro was designed on Microsoft Visual Basic to read every file and construct a searchable database where the number of observations (rows) matched the number of interventions (files or worksheets). Data collected in the questionnaire – both plain text and codes -- are displayed in the columns, creating a database of program-specific information (Database 1).
2 In fact, the inventory was conceived as a “live database” that could be regularly updated. This was another reason for investing in the creation of an electronic format.

6
Simultaneously, a database of country-specific information (Database 2) was created to contextualize the economic conditions of the country. This information includes level of development, level of income, and a characterization of the labor market regulatory/institutional situation. Sources of information for the country database are the World Development Indicators and the Doing Business Database (2006). The Excel macro links databases 1 and 2 through a common key-variable, namely country name, creating a comprehensive database for the analysis of the inventory. For details on how to create databases and informative tables from the inventory, see Annex B.
Quality of intervention and quality of evaluation variables. Two critical variables in the
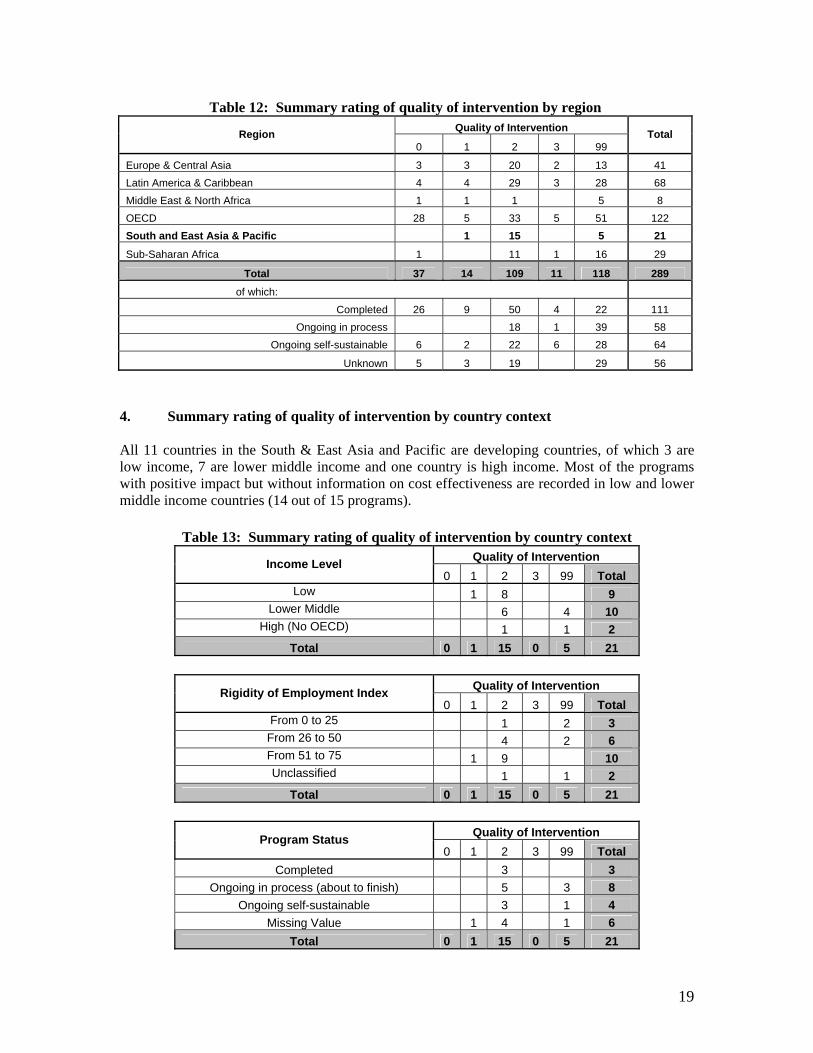
inventory database are the “quality of intervention” (QOI) and “quality of evaluation” (QOE) (template, sections I and J, respectively). These figure prominently in the analysis of what we have learned from the inventory in terms of what works for supporting young workers. Both QOI and QOE values for each intervention have been determined by the research team according to standardized criteria described below.3
The “quality of intervention” is the measure of program effectiveness. The possible
values for QOI are described in Table 2. The primary performance indicators that are considered in establishing a QOI rating are the effects of the program on the employment and earnings of participants. At one level, the QOI value can be used to identify impact – i.e., to distinguish those programs that actually help participants in the labor market (QOI=1,2, or 3) from those that appear to have no effect, or even a negative effect (QOI=0). A rating of 1 or 2 means that a program is judged to have had a positive impact, but this does not necessarily mean that it was successful. To be specific, interventions can have a positive employment impact but not be cost-effective (i.e., QOI=1).4 These programs cannot be considered successful.
Table 2: Measuring the quality of the intervention (QOI)
QOI value Description
0 Program had negative or zero impact on labor market outcomes. 1 Program had positive impact on labor market outcomes but is not cost-effective.
2 Program had positive impact on labor market outcomes and there is no evidence on costs.
3 Program had positive impact on labor market outcomes and is cost-effective. 99 Missing value. Not enough evidence to make an assessment.
Determining a value for the quality of the intervention is complicated by the fact that the evidence on which to base the assessment varies widely. In some cases, solid evaluation results are available while in others, only basic descriptive information exists. The “quality of evaluation” variable is important for identifying the evaluative basis for assessing program quality. The QOE measure is described in Table 3. With this variable, then, assessments of the effectiveness of interventions can be judged with knowledge of the underlying evidence. For example, one can consider only those programs that meet the most exacting burden of proof (i.e.,
3 To assure that the researchers applied uniform standards to assigning QOI and QOE values, the team discussed cases where ratings were not obvious and a sub-sample of programs were rated independently by all researchers. 4 A program is considered cost-effective if the evaluation results indicate that the benefits (e.g., reduced use of social assistance, increased tax gains through participants who found a job, increased earnings, etc.) exceed program costs (income support, training material, cost of training, etc.). Since we are relying on available project documentation, specific methodologies used for the cost-benefit analysis can vary.

7
QOE=3), with the tradeoff that sample size will be reduced. On the other hand, accepting a less demanding basis of evidence will increase the pool of programs under consideration, but at the expense of rigor. As we will see later in this paper, assessments of program effectiveness are correlated with the quality of the evaluation evidence.
Table 3: Measuring the quality of evaluation (QOE)
QOE value Description 0 Program has no evaluation information available on outcomes or impact.
1
Evaluation includes basic information on the gross outcomes of the intervention (e.g. number of participants/ young people who found a job after the intervention, improvement in earnings of participants) without considering net effects (i.e., there is no control group).
2 Evaluation includes estimate of net impact on, e.g., employment and earnings in the labor market (using control groups to measure impact) but no cost-benefit analysis.
3 Evaluation includes net impact plus cost-benefit analysis C. Coverage of the inventory in Latin America and the Caribbean. 1. Coverage of the inventory by category of intervention and region. South and East Asia and Pacific5 inventory covers 21 programs, of which 3 are completed, 8 are still on-going (in process), 4 are on-going and self-sustainable and for 6 programs information about completion is unknown. Most of the interventions in the inventory emphasize on various forms of skills training for youth, and measures that improve chances for young entrepreneurs. Out of 21 programs in the inventory, 9 are skills training programs and 6 are programs that improve chances for young entrepreneurs. Most of skills training programs (8) are vocational training, including apprenticeships systems programs encompassing skill development and work experience. These programs mainly aimed at increasing employability by providing necessary quality employment-oriented skills training including various technical, managerial, and technological skills. Some of them (Samoa: Opportunity for Vulnerable Poor Youth) support informal and vocational training activities for unemployed youth to improve their earning opportunities and self-identity, and some (China: Labor Preparation Program) support vocational education and training to new labor force entrants, that enhances the employment abilities and business start-up skills of potential business starters. Programs included skills training for employment in the informal sector, informal and vocational training activities, and training in the hospitality industry. Labor market training programs are recorded in China, Philippines, Samoa, Vietnam, India, Maldives and Nepal. Second most common category of intervention in the inventory is improving chances for young entrepreneurs. Programs include among others modules on integrated farming, entrepreneurial and cooperative management skills training (Philippines: Farm Youth Development Programme - FYDP); training on how to establish a productive business, support for start-up business, and follow-on consultancy service (Indonesia: Young Professional Entrepreneur Development) or development of entrepreneurial skills, in particular for establishing micro-scale enterprises (India: CYCI).
5 World Bank regional definitions apply. Due to the small number of interventions in SAR and EAP regions, the inventories are joined in one for the purposes of the report.

8
Figure 1: South and East Asia and Pacific - Categories of Intervention
6
9
1
1
4
0 1 2 3 4 5 6 7 8 9 10
Improving chances for young entrepreneurs
Skills training for young people
Making training systems work better for young people
Improving labor market regulations to the benefit of youngpeople
Comprehensive, multiple-service approach
number
There are 4 multi-service approach programs. These programs are mix of credit scheme coupled with credit plus services including training, technology transfer, marketing and business development services (Sri Lanka: Sarvodaya Economic Enterprise Development Services SEEDs); or workplace attachment training with allowance, O-T-J training coupled with training subsidy & possibility for continued employment thereafter (Hong Kong: Youth Pre-employment Training Programme (YPTP); training, skills development and public works – placements (Philippines - Kabataan 2000); or 6 to 12 months OTJ & vocational training courses with possibility for reimbursement fees with the Scheme subject to 90% attendance, pre-employment assessment, formulation of career plan, job matching, on-the-job support, review (Hong Kong: Youth Work Experience and Training Scheme – YWETS). Programs for improving labor market regulations to the benefit of young people and making training systems work better for young people are represented with one program, each. 2. Coverage of inventory by category of intervention and level of development of
country. Countries comprising South & East Asia and Pacific region vary much in terms of their levels of economic and social development, their institutional structures, as well as simply in size. Such economic and demographic differences have implications for the types of policy which are advisable or indeed feasible; however, many of the recommendations developed are broadly applicable. An attempt is also made to distinguish between which types of policy are appropriate in which context (Nail Higgins, 2001).
For the purpose of this report South & East Asia and Pacific region comprises of South Asia region and East Asia and the Pacific regions as classified by the World Bank methodology. East Asia and Pacific region comprises of 20 countries and is home to nearly 2 billion people. This diverse region includes Cambodia, China, Fiji, Indonesia, Kiribati, Korea, the People's

9
Democratic Republic of Lao (Lao PDR), Malaysia, Marshall Islands, FS Micronesia, Mongolia, Palau, Papua New Guinea, the Philippines, Samoa, Solomon Islands, Thailand, Timor-Leste, Tonga, Vanuatu, and Vietnam. South Asia region comprises of 6 countries: Afghanistan, Bangladesh, Bhutan, India, Maldives, Nepal, Pakistan, Sri Lanka.
Table 4: SEAP - Coverage of inventory by category of intervention and region
Category of intervention
South & East Asia & Pacific
1. Making the labor market work better for young people 1a. counseling, job search skills 1b. wage subsidies 1c. public works programs 1d. anti-discrimination legislation 1e. other
Sub-total 0 2. Improving chances for young entrepreneurs 6 3. Skills training for young people 3a. vocational training including apprenticeship systems 8 3b. literacy & numeracy – young adult literacy programs 3c. 2nd chance & equivalency programs 1 3d. other
Sub-total 9 4. Making training systems work better for young people 4a. information 4b. credit (to individuals or enterprises) 4c. financial incentives (subsidies, vouchers) 1 4d. other
Sub-total 1 5. Programs to counteract residential segregation of disadvantaged young people 5a. transportation 5b. others
Sub-total 0 6. Improving labor market regulations to the benefit of young people 1 7. Programs for overseas employment of young people 8. Comprehensive, multiple-service approach 4 9. Other (e.g. voluntary national service programs)
Total 21 of which:
Completed 3 Ongoing in process 8
Ongoing self-sustainable 4 Unknown 6
The inventory covers youth employment programs in 11 countries throughout the region. All of them are developing countries, of which 3 are low income (Vietnam, India and Nepal), 7 are lower middle income (China, Indonesia, Micronesia, Philippines, Samoa, Maldives and Sri Lanka) and one is high income country (Hong Kong). Low and lower middle income group countries primarily focus on skills training programs. These interventions account for 55.6% and 40.0% of total programs within each income group respectively. Also countries in these 2 income

10
groups see high shares of programs that improve chances for young entrepreneurs (33.3% of total in low income and 30.0% of total in lower middle income group countries). The evidence for high income countries is based on 2 youth employment programs in Hong Kong, both classified in comprehensive, multi-service approach programs category.
Figure 2: Coverage of inventory by category of intervention and country income level
3 3
5 4
11 2
20
2
4
6
8
10
12
Low income Low er middle income High income
Country Income Level
num
ber
Comprehensive, multiple-serviceapproach
Improving labor marketregulations to the benefit ofyoung peopleMaking training systems w orkbetter for young people
Skills training for young people
Improving chances for youngentrepreneurs
3. Coverage of inventory by category of intervention, location and age group served. Table 5: Coverage of inventory by category of intervention, location and age group served
Category of intervention Urban Rural Both Total
Only
young people
All ages
Only young people
All ages
Only young people
All ages
Only young people
All ages
1. Making the labor market work better for young people
Sub-total 0 0 0 0 0 0 0 0 2. Improving chances for young entrepreneurs 1 4 1 5 1 3. Skills training for young people 3a. vocational training including apprenticeship systems 1 1 1 5 7 1
3c. 2nd chance & equivalency programs 1 1 0 Sub-total 1 0 1 1 6 0 8 1 4. Making training systems work better for young people
4c. financial incentives (subsidies, vouchers) 1 0 1 4d. other 0 0 Sub-total 0 0 0 1 0 0 0 1 6. Improving labor market regulations to the benefit of young people 1 0 1
8. Comprehensive, multiple-service approach 2 1 1 3 1
Total 3 0 2 3 11 2 16 5
Completed 1 1 1 2 1 Ongoing in process 2 2 4 6 2
Ongoing self-sustainable 1 3 4 0
Unknown 1 1 3 1 4 2
11
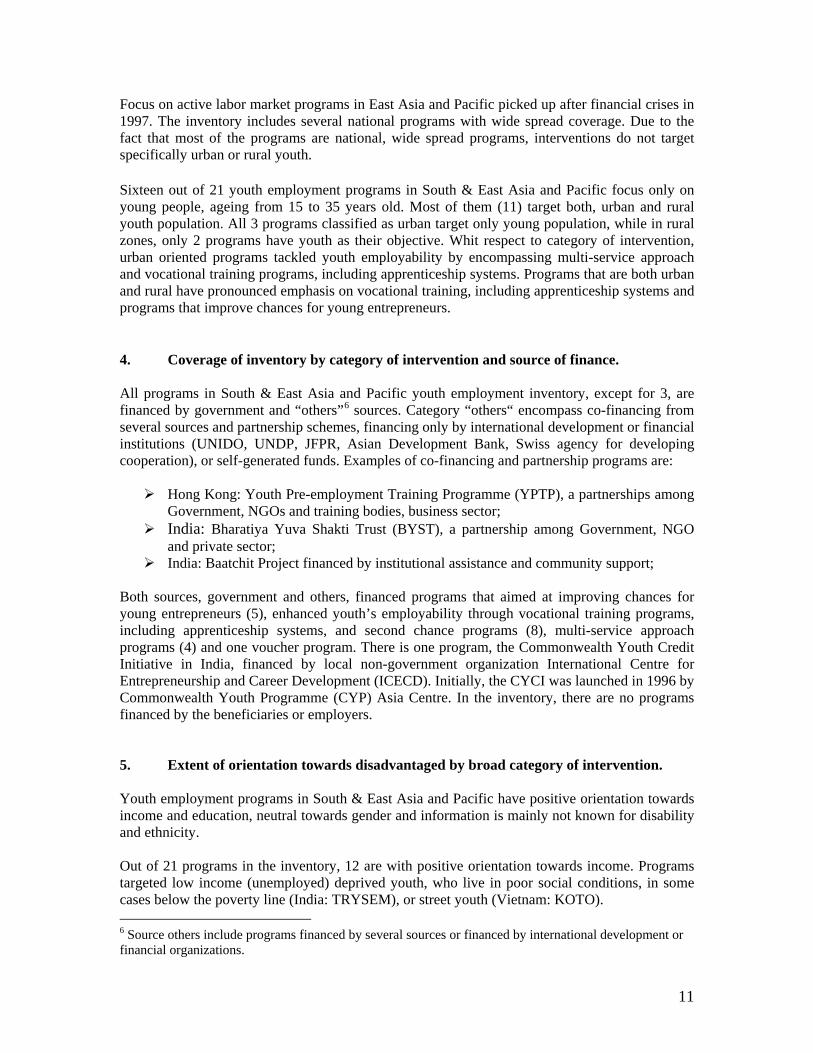
Focus on active labor market programs in East Asia and Pacific picked up after financial crises in 1997. The inventory includes several national programs with wide spread coverage. Due to the fact that most of the programs are national, wide spread programs, interventions do not target specifically urban or rural youth. Sixteen out of 21 youth employment programs in South & East Asia and Pacific focus only on young people, ageing from 15 to 35 years old. Most of them (11) target both, urban and rural youth population. All 3 programs classified as urban target only young population, while in rural zones, only 2 programs have youth as their objective. Whit respect to category of intervention, urban oriented programs tackled youth employability by encompassing multi-service approach and vocational training programs, including apprenticeship systems. Programs that are both urban and rural have pronounced emphasis on vocational training, including apprenticeship systems and programs that improve chances for young entrepreneurs. 4. Coverage of inventory by category of intervention and source of finance. All programs in South & East Asia and Pacific youth employment inventory, except for 3, are financed by government and “others”6 sources. Category “others“ encompass co-financing from several sources and partnership schemes, financing only by international development or financial institutions (UNIDO, UNDP, JFPR, Asian Development Bank, Swiss agency for developing cooperation), or self-generated funds. Examples of co-financing and partnership programs are:
Hong Kong: Youth Pre-employment Training Programme (YPTP), a partnerships among Government, NGOs and training bodies, business sector;
India: Bharatiya Yuva Shakti Trust (BYST), a partnership among Government, NGO and private sector;
India: Baatchit Project financed by institutional assistance and community support;
Both sources, government and others, financed programs that aimed at improving chances for young entrepreneurs (5), enhanced youth’s employability through vocational training programs, including apprenticeship systems, and second chance programs (8), multi-service approach programs (4) and one voucher program. There is one program, the Commonwealth Youth Credit Initiative in India, financed by local non-government organization International Centre for Entrepreneurship and Career Development (ICECD). Initially, the CYCI was launched in 1996 by Commonwealth Youth Programme (CYP) Asia Centre. In the inventory, there are no programs financed by the beneficiaries or employers. 5. Extent of orientation towards disadvantaged by broad category of intervention. Youth employment programs in South & East Asia and Pacific have positive orientation towards income and education, neutral towards gender and information is mainly not known for disability and ethnicity. Out of 21 programs in the inventory, 12 are with positive orientation towards income. Programs targeted low income (unemployed) deprived youth, who live in poor social conditions, in some cases below the poverty line (India: TRYSEM), or street youth (Vietnam: KOTO). 6 Source others include programs financed by several sources or financed by international development or financial organizations.

12
Table 6: Coverage of inventory by category of intervention and source of finance Source of finance Category of intervention
Government Beneficiaries Employers NGOs Other NA 1. Making the labor market work better for young people Sub-total 0 0 0 0 0 0 2. Improving chances for young entrepreneurs 3 1 2 3. Skills training for young people 3a. vocational training including apprenticeship systems 3 4 1 3c. 2nd chance & equivalency programs 1 Sub-total 3 0 0 0 5 1 4. Making training systems work better for young people 4c. financial incentives (subsidies, vouchers) 1 Sub-total 1 0 0 0 0 0 6. Improving labor market regulations to the benefit of young people 1 8. Comprehensive, multiple-service approach 2 2
Total 9 0 0 1 9 2 of which:
Completed 2 1 Ongoing in process 3 5
Ongoing self-sustainable 1 1 1 1 Unknown 3 3
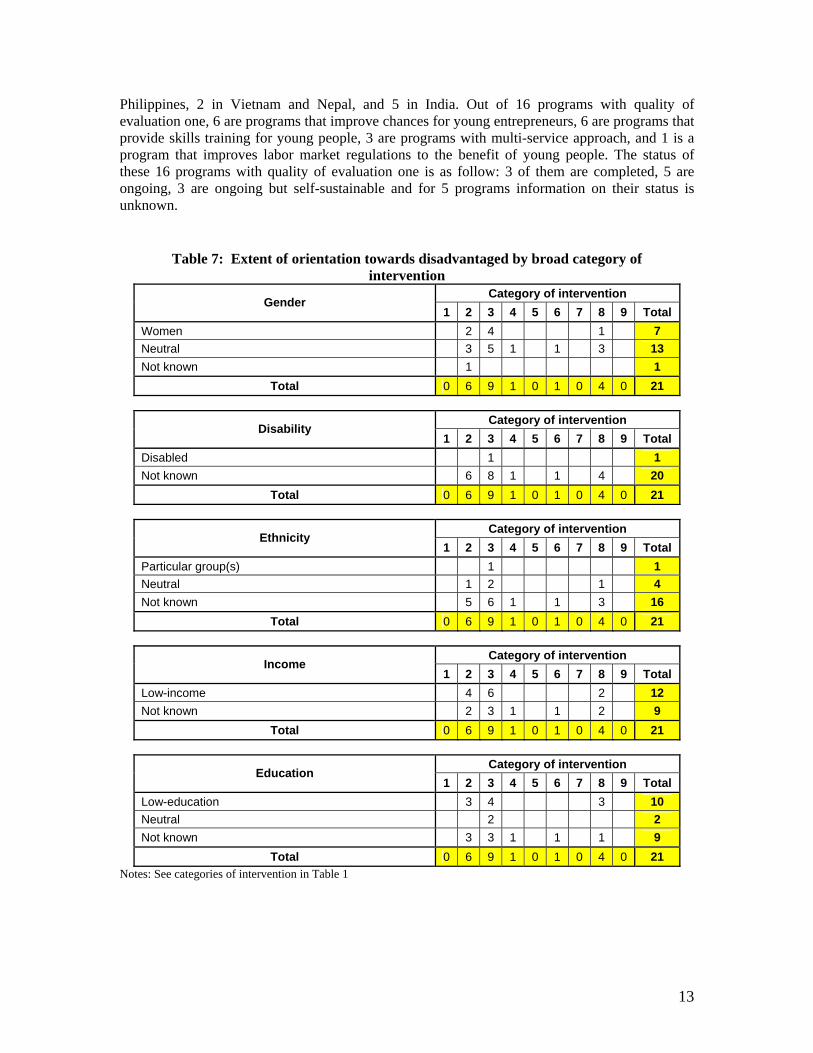
Ten or 47.6 per cent of all programs are with positive orientation towards education focusing on school leavers, youth with education attainment below the degree level, out-of-school and in-school youth. Most of interventions or 61.9 per cent are gender neutral. Only 33.3 per cent of programs are gender positive (2 programs in India, 2 programs in Nepal, Sri Lanka, Maldives and Federal states of Micronesia). There is only one program with profound distinction towards ethnicity and disability. “Training for employment project” in Nepal has clear distinction towards ethnicity. The beneficiaries include about 35% Dalits and 45% Janajatis. With respect to disability, only TRYSEM in India has objective to cover a minimum of 3 percent from the ranks of the physically handicapped. D. Quality of evaluations 1. Summary rating of quality of evaluation by category of intervention. The evaluation information in South & East Asia and Pacific on programs’ gross labor market outcomes, net impact or cost-effectiveness is very scarce. Most of the programs in the inventory, 16 out of 21, have only basic information on the gross outcomes of the intervention, thus have been rated with quality of evaluation one. Evaluation included information such as number of young people who found a job after the intervention, information about the effect of intervention on participants earnings, without considering net effects (i.e., there is no control group). This group included one program each in Hong Kong, Indonesia, Micronesia, and Sri Lanka, 3 in
13
Philippines, 2 in Vietnam and Nepal, and 5 in India. Out of 16 programs with quality of evaluation one, 6 are programs that improve chances for young entrepreneurs, 6 are programs that provide skills training for young people, 3 are programs with multi-service approach, and 1 is a program that improves labor market regulations to the benefit of young people. The status of these 16 programs with quality of evaluation one is as follow: 3 of them are completed, 5 are ongoing, 3 are ongoing but self-sustainable and for 5 programs information on their status is unknown.
Table 7: Extent of orientation towards disadvantaged by broad category of intervention
Category of intervention Gender
1 2 3 4 5 6 7 8 9 Total Women 2 4 1 7 Neutral 3 5 1 1 3 13 Not known 1 1
Total 0 6 9 1 0 1 0 4 0 21
Category of intervention Disability
1 2 3 4 5 6 7 8 9 Total Disabled 1 1 Not known 6 8 1 1 4 20
Total 0 6 9 1 0 1 0 4 0 21
Category of intervention Ethnicity
1 2 3 4 5 6 7 8 9 Total Particular group(s) 1 1 Neutral 1 2 1 4 Not known 5 6 1 1 3 16
Total 0 6 9 1 0 1 0 4 0 21
Category of intervention Income
1 2 3 4 5 6 7 8 9 Total Low-income 4 6 2 12 Not known 2 3 1 1 2 9
Total 0 6 9 1 0 1 0 4 0 21
Category of intervention Education
1 2 3 4 5 6 7 8 9 Total Low-education 3 4 3 10 Neutral 2 2 Not known 3 3 1 1 1 9
Total 0 6 9 1 0 1 0 4 0 21 Notes: See categories of intervention in Table 1

14
Table 8: Summary rating of quality of evaluation by category of intervention Quality of Evaluation Category of intervention 0 1 2 3 99
1. Making the labor market work better for young people Sub-total 0 0 0 0 0
2. Improving chances for young entrepreneurs 6 3. Skills training for young people 3a. vocational training including apprenticeship systems 3 5 3c. 2nd chance & equivalency programs 1
Sub-total 3 6 0 0 0 4. Making training systems work better for young people 4c. financial incentives (subsidies, vouchers) 1
Sub-total 1 0 0 0 0 5. Programs to counteract residential segregation of disadvantaged young people 5a. transportation 5b. others
Sub-total 0 0 0 0 0 6. Improving labor market regulations to the benefit of young people 1 7. Programs for overseas employment of young people 8. Comprehensive, multiple-service approach 1 3 9. Other (e.g. voluntary national service programs) Unclassified
Total 5 16 0 0 0 of which:
Completed 3 Ongoing in process 3 5
Ongoing self-sustainable 1 3 Unknown 1 5
Notes: 0 1 2 3 99
Program has no evaluation information on the outcomes; Evaluation included basic information on the gross outcomes of the intervention (e.g. number of participants/ young people who found a job after the intervention, earnings of participants improved), without considering net effects (i.e., there is no control group); Evaluation included that has estimate of net outcomes on the labor market, using indicators like employment and earnings (using control groups to measure the impact of the intervention); Evaluation included net impact plus includes a cost-benefit analysis; Missing Value;
There are 5 programs with no evaluation information on the labor outcomes at all. Three of these programs are ongoing, one is ongoing, but self-sustainable and for one program the information on the program’s status is unknown. There are no programs with net impact or cost-benefit analysis in the inventory. 2. Summary rating of quality of evaluation by regions In South & East Asia and Pacific inventory there are no programs with net impact or cost-benefit analysis. These results could be explained by the status of the programs, low share of recorded total youth employment programs, poor data availability on programs, as well as the country income level. In this context, only one third of all programs in the region are completed and

15
ongoing, self-sustainable, and 90.5% of region’s programs are in low or lower middle income countries.
Table 9: Quality of evaluation by Region Quality of Evaluation Region
0 1 2 3 Total
Europe & Central Asia 11 18 2 10 41 Latin America & Caribbean 29 22 11 6 68 Middle East & North Africa 5 3 8 OECD 48 32 31 11 122 South and East Asia & Pacific 5 16 21 Sub-Saharan Africa 16 11 1 1 29
Total 114 102 45 28 289 of which:
Completed 21 44 26 21 112 Ongoing in process 38 19 1 58
Ongoing self-sustainable 28 18 13 7 66 Unknown 27 21 5 53
E. Quality of interventions 1. Quality of intervention × quality of evaluation Lack of net impact evaluations and cost-benefit analyses, insufficient evidence and poor data on programs are a significant obstacle for making a sound assessment on the quality of youth employment interventions in the region, especially with respect to net impact of interventions.
Table 10: Quality of intervention x quality of evaluation Quality of Intervention Quality of Evaluation
0 1 2 3 99 Total 0 5 5 1 1 15 16 2 0 3 0 99 0
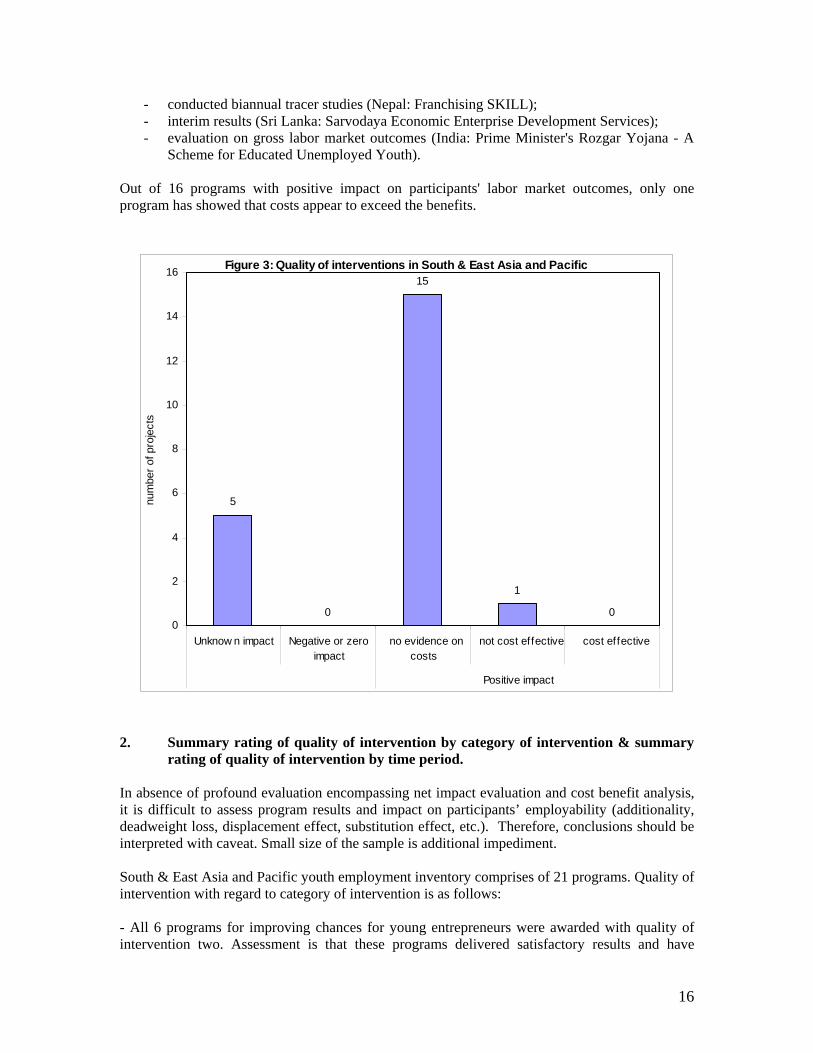
Total 0 1 15 0 5 21 Based on program documentation, there are 5 programs with unknown impact and 16 programs with positive impact for program participants in terms of increased earnings or likelihood of being employed (employability). The positive impact was assessed (awarded) on bases of:
- “quick evaluation” by contacting and interviewing program beneficiaries (India: TRYSEM);
- conducted survey on a voluntary basis to investigate the employment situation of the graduates, successful rate over 50.6% and placements (Hong Kong: Youth Pre-employment Training Programme);
- build monitoring and evaluation in programs’ modules (Indonesia: Young Professional Entrepreneur Development);
16
- conducted biannual tracer studies (Nepal: Franchising SKILL); - interim results (Sri Lanka: Sarvodaya Economic Enterprise Development Services); - evaluation on gross labor market outcomes (India: Prime Minister's Rozgar Yojana - A
Scheme for Educated Unemployed Youth). Out of 16 programs with positive impact on participants' labor market outcomes, only one program has showed that costs appear to exceed the benefits.
Figure 3: Quality of interventions in South & East Asia and Pacific
5
0
15
1
00
2
4
6
8
10
12
14
16
Unknow n impact Negative or zeroimpact
no evidence oncosts
not cost effective cost effective
Positive impact
num
ber o
f pro
ject
s
2. Summary rating of quality of intervention by category of intervention & summary
rating of quality of intervention by time period. In absence of profound evaluation encompassing net impact evaluation and cost benefit analysis, it is difficult to assess program results and impact on participants’ employability (additionality, deadweight loss, displacement effect, substitution effect, etc.). Therefore, conclusions should be interpreted with caveat. Small size of the sample is additional impediment. South & East Asia and Pacific youth employment inventory comprises of 21 programs. Quality of intervention with regard to category of intervention is as follows: - All 6 programs for improving chances for young entrepreneurs were awarded with quality of intervention two. Assessment is that these programs delivered satisfactory results and have
17
positive impact on improving employment prospects for young entrepreneurs (participants) evaluated on bases of gross labor market outcomes (employment and earnings). However, due to quality of evaluation, programs’ net impact or cost-effectiveness could not be assessed. These programs are: Young Professional Entrepreneur Development (Indonesia), Creation of Micronesian Entrepreneur Development Centre (Micronesia), Farm Youth Development Programme (Philippines), Bharatiya Yuva Shakti Trust (India), Commonwealth Youth Credit Initiative (India) and Prime Minister's Rozgar Yojana - A Scheme for Educated Unemployed Youth (India); - Out of 9 skills training programs for young people, five have quality of intervention 2, one has quality of intervention 1 and for 3 programs quality of intervention could not be assessed (it is unknown). In more that half of the cases (55.6 per cent within this group), skills training programs increased beneficiaries’ employability and some programs have achieved 100 per cent employment for participants (Vietnam: KOTO) or 50 to 100 per cent employment of trained graduates of the vocational education and training system (Nepal: Training for employment project). These programs are: Labour Preparation Programme (China), Working Youth Centre (Philippines), Opportunity for Vulnerable Poor Youth (Samoa), Training for Disadvantaged Youth (Vietnam), Baatchit Project (India), TRYSEM (India), Employment Skills project (Maldives), Franchising SKILL (Nepal) and Training for employment project (Nepal); - Out of 4 multi-service approach programs, three are with quality of intervention 2 and for one program quality of intervention is unknown. These programs have positive impact on beneficiaries in 75 per cent of the cases. The impact is seen in enhanced employability of the participants, increased wage or self employment placements and increased earnings. The group includes following programs: Youth Pre-employment Training Programme (Honk Kong), Youth Work Experience and Training Scheme (Honk Kong), Kabataan 2000 (Philippines) and Sarvodaya Economic enterprise Development Services (Sri Lanka); - There is one program classified under making training systems work better for young people (Export Processing Villages Project in Sri Lanka) for which quality of intervention is unknown; - There is one program under category improving labor market regulations to the benefit of young people (Enactment of 2000 Enterprise Law in Vietnam) rated with quality of intervention 2; Lessons emerging from South & East Asia and Pacific youth employment programs based on limited programs’ evidence are that there is no significant dominant pattern that can tell what type of program works better in South & Eats Asia and Pacific. However, programs for young entrepreneurs, multi-service approach programs and skills programs tend to deliver positive results and appear to be successful. With respect to time dynamics, 76.2% of all programs in South & East Asia and Pacific youth employment inventory commenced mostly during 1990s and 2000s. There are one program in 1970s and two in 1980s. Programs with positive impact are distributed over all periods (1970 – up to date), with highest outcome during 1980s (100 per cent), 1990s (87.5 per cent) and 2000s (62.5 per cent)7. Out of 8 programs implemented during 1990s, 7 have positive impact on participants, hence positive labor market outcomes (quality of intervention 2) and during 2000s, five out of 8 programs have positive labor market outcomes for participants. 7 Percents of programs with positive impact are calculated as ratio of programs within each period.

18
Table 11: Summary rating of quality of intervention by category of intervention
Quality of Intervention Category of intervention 0 1 2 3 99
1. Making the labor market work better for young people Sub-total 0 0 0 0 0 2. Improving chances for young entrepreneurs 6 3. Skills training for young people 3a. vocational training including apprenticeship systems 1 4 3 3c. 2nd chance & equivalency programs 1 Sub-total 0 1 5 0 3 4. Making training systems work better for young people 4c. financial incentives (subsidies, vouchers) 1 Sub-total 0 0 0 0 1 6. Improving labor market regulations to the benefit of young people 1 8. Comprehensive, multiple-service approach 3 1
Total 0 1 15 0 5 of which:
Completed 3 Ongoing in process 5 3
Ongoing self-sustainable 3 1 Unknown 1 4 1
Figure 4: Quality of Intervention and Time Dynamics
1
2
7
5
11
3
1
0
1
2
3
4
5
6
7
8
1970 1980 1990 2000 Unknow n
num
ber o
f pro
gram
s
0
1
2
3
99
3. Summary rating of quality of intervention by region. South and East Asia and Pacific share in interventions with positive impacts and no cost information is 13.8 per cent (15 programs out of 109).
19
Table 12: Summary rating of quality of intervention by region Quality of Intervention Region
0 1 2 3 99 Total
Europe & Central Asia 3 3 20 2 13 41 Latin America & Caribbean 4 4 29 3 28 68 Middle East & North Africa 1 1 1 5 8 OECD 28 5 33 5 51 122 South and East Asia & Pacific 1 15 5 21
Sub-Saharan Africa 1 11 1 16 29
Total 37 14 109 11 118 289 of which:
Completed 26 9 50 4 22 111 Ongoing in process 18 1 39 58
Ongoing self-sustainable 6 2 22 6 28 64
Unknown 5 3 19 29 56
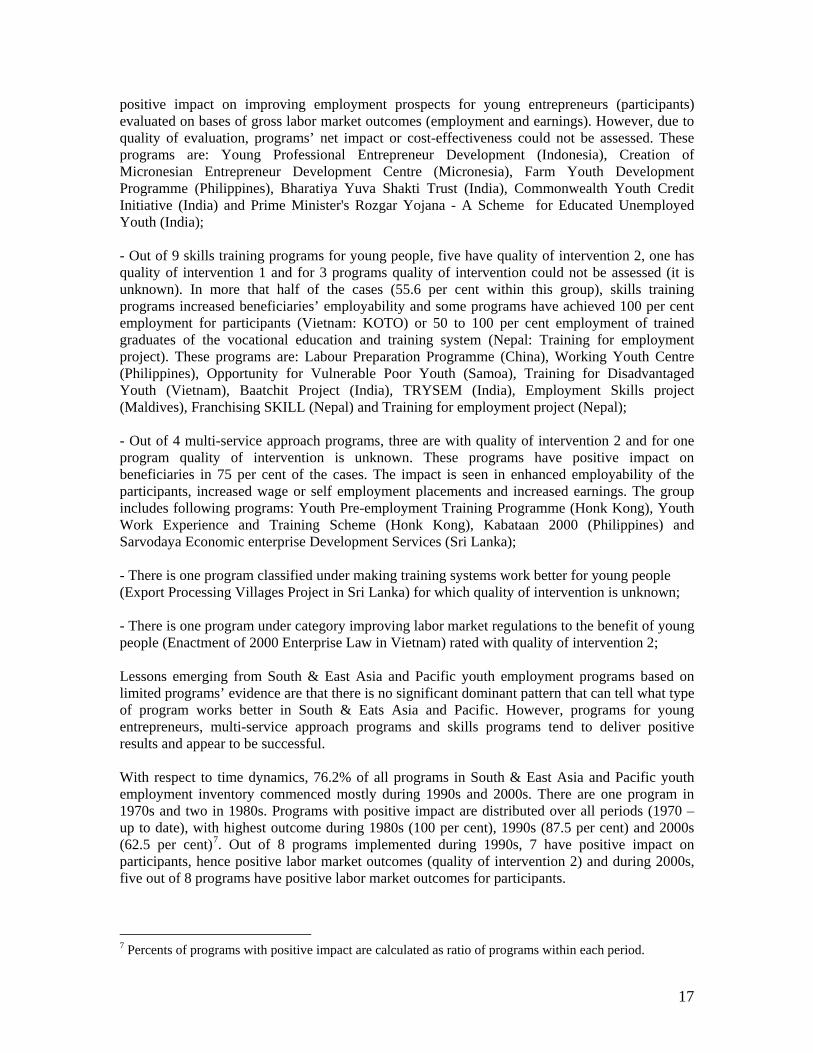
4. Summary rating of quality of intervention by country context All 11 countries in the South & East Asia and Pacific are developing countries, of which 3 are low income, 7 are lower middle income and one country is high income. Most of the programs with positive impact but without information on cost effectiveness are recorded in low and lower middle income countries (14 out of 15 programs).
Table 13: Summary rating of quality of intervention by country context Quality of Intervention Income Level
0 1 2 3 99 Total Low 1 8 9
Lower Middle 6 4 10 High (No OECD) 1 1 2
Total 0 1 15 0 5 21
Quality of Intervention Rigidity of Employment Index 0 1 2 3 99 Total
From 0 to 25 1 2 3 From 26 to 50 4 2 6 From 51 to 75 1 9 10 Unclassified 1 1 2
Total 0 1 15 0 5 21
Quality of Intervention Program Status 0 1 2 3 99 Total
Completed 3 3 Ongoing in process (about to finish) 5 3 8
Ongoing self-sustainable 3 1 4 Missing Value 1 4 1 6
Total 0 1 15 0 5 21

20
Annex A: Inventory template and coding system
PROGRAM NAME:
A. Intervention category H. Impact and performance indicators
1 Primary Category CODE 1 Outcome (number who got jobs, the number who got waged jobs, their average earnings etc.)
2 Secondary Category CODE
2 Impact (measured by e.g. the number who got jobs, the number who got waged jobs, their average
3 Tertiary Category and others CODE earnings, compared with a control group who were not affected by this intervention).
B. Country
3 Cost
C. Time period of the intervention to Society:
to Government:
D. Status of the Project
(Completed or Ongoing) CODE
to Individual Participants:
E. Problem addressed
4 Impact in relation to Cost (benefit/cost ratio, net present value, internal rate of return, cost-effectiveness)
F. Nature of the Program/Policy and/or Stated objective to Society:
to Government:
G. Program content details
1 Description
to Individual Participants:
2 Target beneficiaries
3 Age group (Only young people or all ages but mainly young people) CODE
I. Summary rating of quality of evaluation
4 Location (Urban, rural or both) CODE CODE
5 Access for disadvantaged
a. Gender (Positive, Neutral, Negative, Not known) CODE
J. Summary rating of quality of intervention
b. Disability (Positive, Neutral, Negative, Not known) CODE CODE
c. Ethnicity (Positive, Neutral, Negative, Not known) CODE
d. Income group (Positive, Neutral, Negative, Not known) CODE K. Sources of further information
e. Education (Positive, Neutral, Negative, Not known) CODE
f. Financing. (Government, Beneficiaries, Employers, NGO or Other) CODE
YOUTH EMPLOYMENT INVENTORYWorksheet for Assembling Inventory
Comments:
Comments:
Comments:
Comments:
Comments:
Comments:
Comments:
Comments:
Comments:
Comments:
Comments:
Comments:
Comments:
Comments:
Comments:
Comments:
21
A. Intervention category Codes G. Program content details
1 Making the labor market work better for young people 3 Age group:
1a counseling, job search skills 1d anti-discrimination legislation 1 Only young people 99 Missing Value
1b wage subsidies 1e other 2 All ages but mainly young people
1c public works programs 4 Location:
2 Improving chances for young entrepreneurs 1 Urban 3 Both
3 Skills training for young people 2 Rural 99 Missing Value
3a vocational skills (active labor market training programs for youth) including apprenticeship 5 Access for disadvantaged:
3b literacy & numeracy – young adult literacy programs a. Gender:
3c second-chance and equivalency programs 1 Positive e.g. women 3 Negative
3d other 2 Neutral 4 Not known
4 Making training systems work better for young people b. Disability:
4a information 4c financial incentives (subsidies, vouchers) 1 Positive 3 Negative
4b credit (to individuals or enterprises) 4d other 2 Neutral 4 Not known
5 Programs to counteract residential segregation of disadvantaged young people c. Ethnicity:
5a transportation 5b others 1 Positive 3 Negative
6 Improving labor market regulations to the benefit of young people 2 Neutral 4 Not known
7 Programs for overseas employment of young people d. Income group:
8 Comprehensive, multiple service approach 1 Positive e.g. low income 3 Negative
9 Other (e.g., voluntary national service programs) 2 Neutral 4 Not known
99 Missing Value e. Education:
1 Positive e.g. out-school 3 Negative
D. Status of the Project 2 Neutral 4 Not known
1 Completed 3 Ongoing self-sustainable f. Financing:
2 Ongoing in process (about to finish) 99 Missing Value 1 Government
2 Beneficiaries 4 NGOs
3 Employers 5 Other
I. Summary rating of quality of evaluation
0 Program has no evaluation information available on outcomes or impact
1
2
3 Evaluation includes net impact plus cost-benefit analysis.
99 Missing Value
J. Summary rating of quality of intervention
0
1
2 Program had positive impact in the labor market and there is no evidence on costs.
3 Program had positive impact in the labor market and is cost effective.
99 Missing Value: Not enough evidence to make an assessment.
YOUTH EMPLOYMENT INVENTORYCodesheet for Assembling Inventory
Evaluation includes basic information on the gross outcomes of the intervention (e.g. number of participants/ young people who found a job after the intervention, improvement in earnings of participants) without considering net effects (i.e., there is no control group).
Evaluation includes estimate of net impact on, e.g., employment and earnings in the labor market (using control groups to measure impact) but no cost-benefit analysis.
Program had negative or zero impact in the labor market.
Program had positive impact in the labor market, but it is not cost effective.

22
Annex B: Template Reader Manual This Annex contains detailed instructions to guide the creation of electronic databases for the inventory as well as standardized informative tables for analysis. Microsoft Excel serves as software platform for this process. The automatic compilation of files and tables are done through Visual Basic macros. Key files The Template_Reader.zip contains the following three files:
1. MACROS.xls 2. Countrydata_Inventory.xls 3. Codebook.xls
MACROS.xls contains the Visual Basic code that will allow you to create a database from a collection of formatted templates. Countrydata_Inventory.xls contains some macroeconomic information that will be added to the database you create in order to organize the information in tables. Codebook.xls contains the variable definitions of the generated database. It also contains the location of each variable in the formatted templates, as well as the Visual Basic code needed to update the macros in case the template format is updated or variables are added. How to use the Template Reader Macro:
1) Create a folder called TEMPLATES anywhere in your hard drive.
2) Inside TEMPLATES create two folders with the following names: a. FilledTemplates: this folder will contain all the templates that you want in your
database. b. Country_Data: this folder will contain the file countrydata_Inventory.xls which is
used to add macro statistics and region codes to the database.
3) Place all templates in the folder FilledTemplates and place countrydata_Inventory.xls in the Country_Data folder.
4) Place the MACROS.xls file in the TEMPLATES folder and open it by double clicking on
its icon. Excel will not display the contents of this file. If you want to access it, click on the Visual Basic Editor button in Excel (or click on Tools menu, Macro, and Visual Basic Editor)
5) Create an empty excel spreadsheet and save it in the TEMPLATES folder with the name
OUTPUT. In OUTPUT.xls create an empty worksheet and name it DATA. Save OUTPUT.xls.
6) Place the cursor in any cell within worksheet DATA, in OUTPUT.xls. In Excel go to
Tools menu, select Macro and then Macros (or press Alt+F8). Choose the CREATE_DATABASE macro and click in Run it. This will take a few minutes while the

23
macro reads each file and builds the database.
7) Once the database has been created you can proceed to create the tables. For this, simply go to the Tools menu, select Macro and then Macros (or press Alt+F8). Choose the TABLES macro and run it.

24
Annex C: Further information of the youth employment inventory in South and East Asia and the Pacific BOX: NGO financed program The CYCI is a small enterprise scheme for young people involving “micro-credit” (small-scale lending), training and enterprise development. The scheme provides low-cost, easily accessible credit and training to underprivileged young people to bring economic self-sufficiency. These services are provided through: low interest rates, low training costs, partnership with NGOs, ongoing training and monitoring of enterprises. Focus is on developing capacity for enterprise management, a pre-requisite for the self-employed. Program has three stages:
Stage I – Pre Credit (community outreach support system and identification and selection of youth); Stage II – Training for Capacity Building (capacity building, group formation, basic credit management,
entrepreneurship training); and Stage III – Credit Delivery & Support (credit dispersion, credit management system, post training support for
growth, expansion and re-lending). During 1996 – 1999 (pilot), and after that is self-sustaining. BOX: Training for Employment Project, Nepal
Training for Employment, Nepal (TfE) Project initiated activities targeting out-of-school youth to create avenues of employment while contributing to the process of capacity strengthening of technical training providers (TTPs) to deliver quality and demand-based training programs. After successful completion of its orientation phase of three years (Jan 2000 - Dec 2002), TfE has embarked on second phase (Jan 2003 – Dec 2006) with refocused priority of its programmatic approach. Project developed training packages for out-of-school youths (Primary to Secondary level – below class ten) leading to employment and career path. All training packages are modular based for the excluded mass (youths completing primary or lower secondary level) including option for career pathways. While developing training packages parameters like employability, replication of the training program, potential to be absorbed by the system etc. will be complied with. Training package development is an on going process for the project. The selection process for potential new training package will be based on information about regional employment markets, areas potential for self-employment and, emerging trends etc. Experience of Orientation Phase (2000-2002): TfE supported the technical training providers (TTPs) to enhance their capacity for quality-training delivery and linkages with enterprises. This led to the development and implementation of different kinds of innovative training approaches from the TTPs. Some of the approaches that have linked training with employment in TfE's experience during the first phase: 1. Cooperative based self-employment approach: Financial support from Members of Parliament and DDC; registration of cooperative involving all training graduates; establishment of cooperative agro-vet shop; individual veterinary services in VDC level with indirect support from veterinary sub-centre; about 80 % of the graduates is self-employed (average monthly earning is about Rs. 4000); 2. Group based enterprises approach for self-employment: Wage employment in district level offices; establishment of small enterprises through group approach; individual veterinary, electrical and plumbing services in VDC level; about 60 % of the graduates is self-employed (average monthly earning is about Rs. 3000); 3. Private, public and local Government linkages approach: Community Health Centres (CHCs) established with the support of Local Government (VDC/Municipality) District Health Office and communities; CHW graduates and few of Midwifery graduates are providing services from CHCs as self-employed; majority of the Midwifery graduates are working in Nursing Homes; 4. Employment pool approach: TTP provides seasonal employment to the all graduates; TTP provides English and other refresher classes during off-season; 5. Pre-training employment market focus approach: the TTP organizes interaction programs with the potential employers to give information about the training program and its graduates which in turn help them to find employment or to enhance their employability; graduates have also open their own workshops; Placement and Counseling Unit (PCU) support has been initiated to link activities from the pre-training stage to post –training stage with employers; 6. Linking training with financial services approach: Some of the graduates started their own small enterprises with Nirdhan Bank's loan; about 5 % of the graduates are involved in wage employment; more than 50 % of the graduates initiated self-employment as mobile technician; 7. Job contract approach (with enterprises/contractors): Employment provided by bead craft on job contract basis; for electrical and electronic training graduates, TTP took a contract and then sub-contracted it to the graduates; some of the graduates got regular job in TTP's own workshops; 8. Apprenticeship approach: Collection of demand for the trainees from the enterprises and send them as per the need; proactive visits to different enterprises/offices etc; orientation to the trainees is given for self-employment; almost 100 % of the BTI graduates is employed (majority are in self –employment).
25
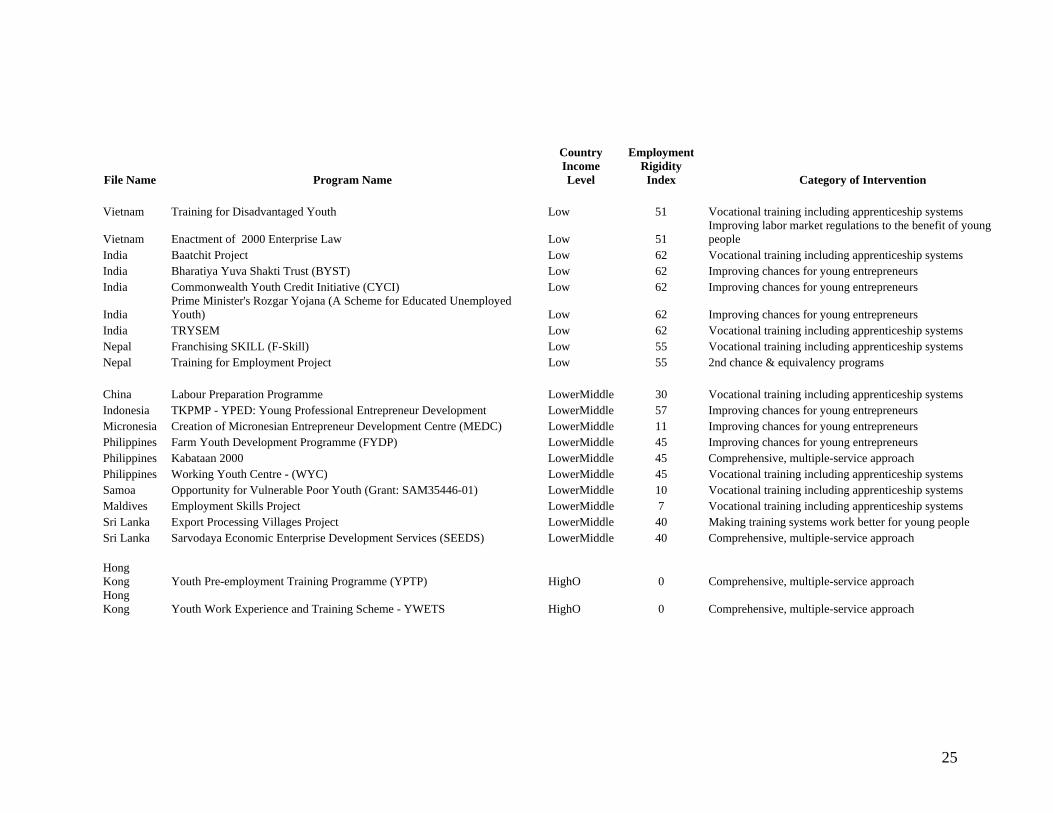
File Name Program Name
Country Income Level
Employment Rigidity Index Category of Intervention
Vietnam Training for Disadvantaged Youth Low 51 Vocational training including apprenticeship systems
Vietnam Enactment of 2000 Enterprise Law Low 51 Improving labor market regulations to the benefit of young people
India Baatchit Project Low 62 Vocational training including apprenticeship systems India Bharatiya Yuva Shakti Trust (BYST) Low 62 Improving chances for young entrepreneurs India Commonwealth Youth Credit Initiative (CYCI) Low 62 Improving chances for young entrepreneurs
India Prime Minister's Rozgar Yojana (A Scheme for Educated Unemployed Youth) Low 62 Improving chances for young entrepreneurs
India TRYSEM Low 62 Vocational training including apprenticeship systems Nepal Franchising SKILL (F-Skill) Low 55 Vocational training including apprenticeship systems Nepal Training for Employment Project Low 55 2nd chance & equivalency programs China Labour Preparation Programme LowerMiddle 30 Vocational training including apprenticeship systems Indonesia TKPMP - YPED: Young Professional Entrepreneur Development LowerMiddle 57 Improving chances for young entrepreneurs Micronesia Creation of Micronesian Entrepreneur Development Centre (MEDC) LowerMiddle 11 Improving chances for young entrepreneurs Philippines Farm Youth Development Programme (FYDP) LowerMiddle 45 Improving chances for young entrepreneurs Philippines Kabataan 2000 LowerMiddle 45 Comprehensive, multiple-service approach Philippines Working Youth Centre - (WYC) LowerMiddle 45 Vocational training including apprenticeship systems Samoa Opportunity for Vulnerable Poor Youth (Grant: SAM35446-01) LowerMiddle 10 Vocational training including apprenticeship systems Maldives Employment Skills Project LowerMiddle 7 Vocational training including apprenticeship systems Sri Lanka Export Processing Villages Project LowerMiddle 40 Making training systems work better for young people Sri Lanka Sarvodaya Economic Enterprise Development Services (SEEDS) LowerMiddle 40 Comprehensive, multiple-service approach Hong Kong Youth Pre-employment Training Programme (YPTP) HighO 0 Comprehensive, multiple-service approach Hong Kong Youth Work Experience and Training Scheme - YWETS HighO 0 Comprehensive, multiple-service approach