Regional Movers Index
10
Regional Movers Index Powered by: 28th June 2021
Transcript of Regional Movers Index

Regional Movers Index
Powered by:
28th June 2021

The Regional Movers Index presents fresh analysis of movements between Australia’s regions and capital cities.
The Index is a partnership between the Regional Australia Institute (RAI) and the Commonwealth Bank of Australia (CBA), joining forces to better inform decision making to support the regionalisation of our nation.
The Index updates the trend identified in the RAI’s 2019 Big Movers report – that in recent decades more people have been moving from Australia’s capital cities to regions than in the opposite direction.
• The Index is powered by CBA data from relocations amongst its 10 million customers.
• Quarterly and annual changes are presented in the Index. Future data will only have a one-month reporting gap, compared with ABS data that has a four-month gap.
• The Index will be an invaluable resource for both the public and private sectors. By tracking people movements it enables early identification of growth trends, and flags places emerging as hot spots needing fresh thinking on housing and infrastructure.
See Appendix A1 for definitions and methodology.
What is Regional Movers Index?
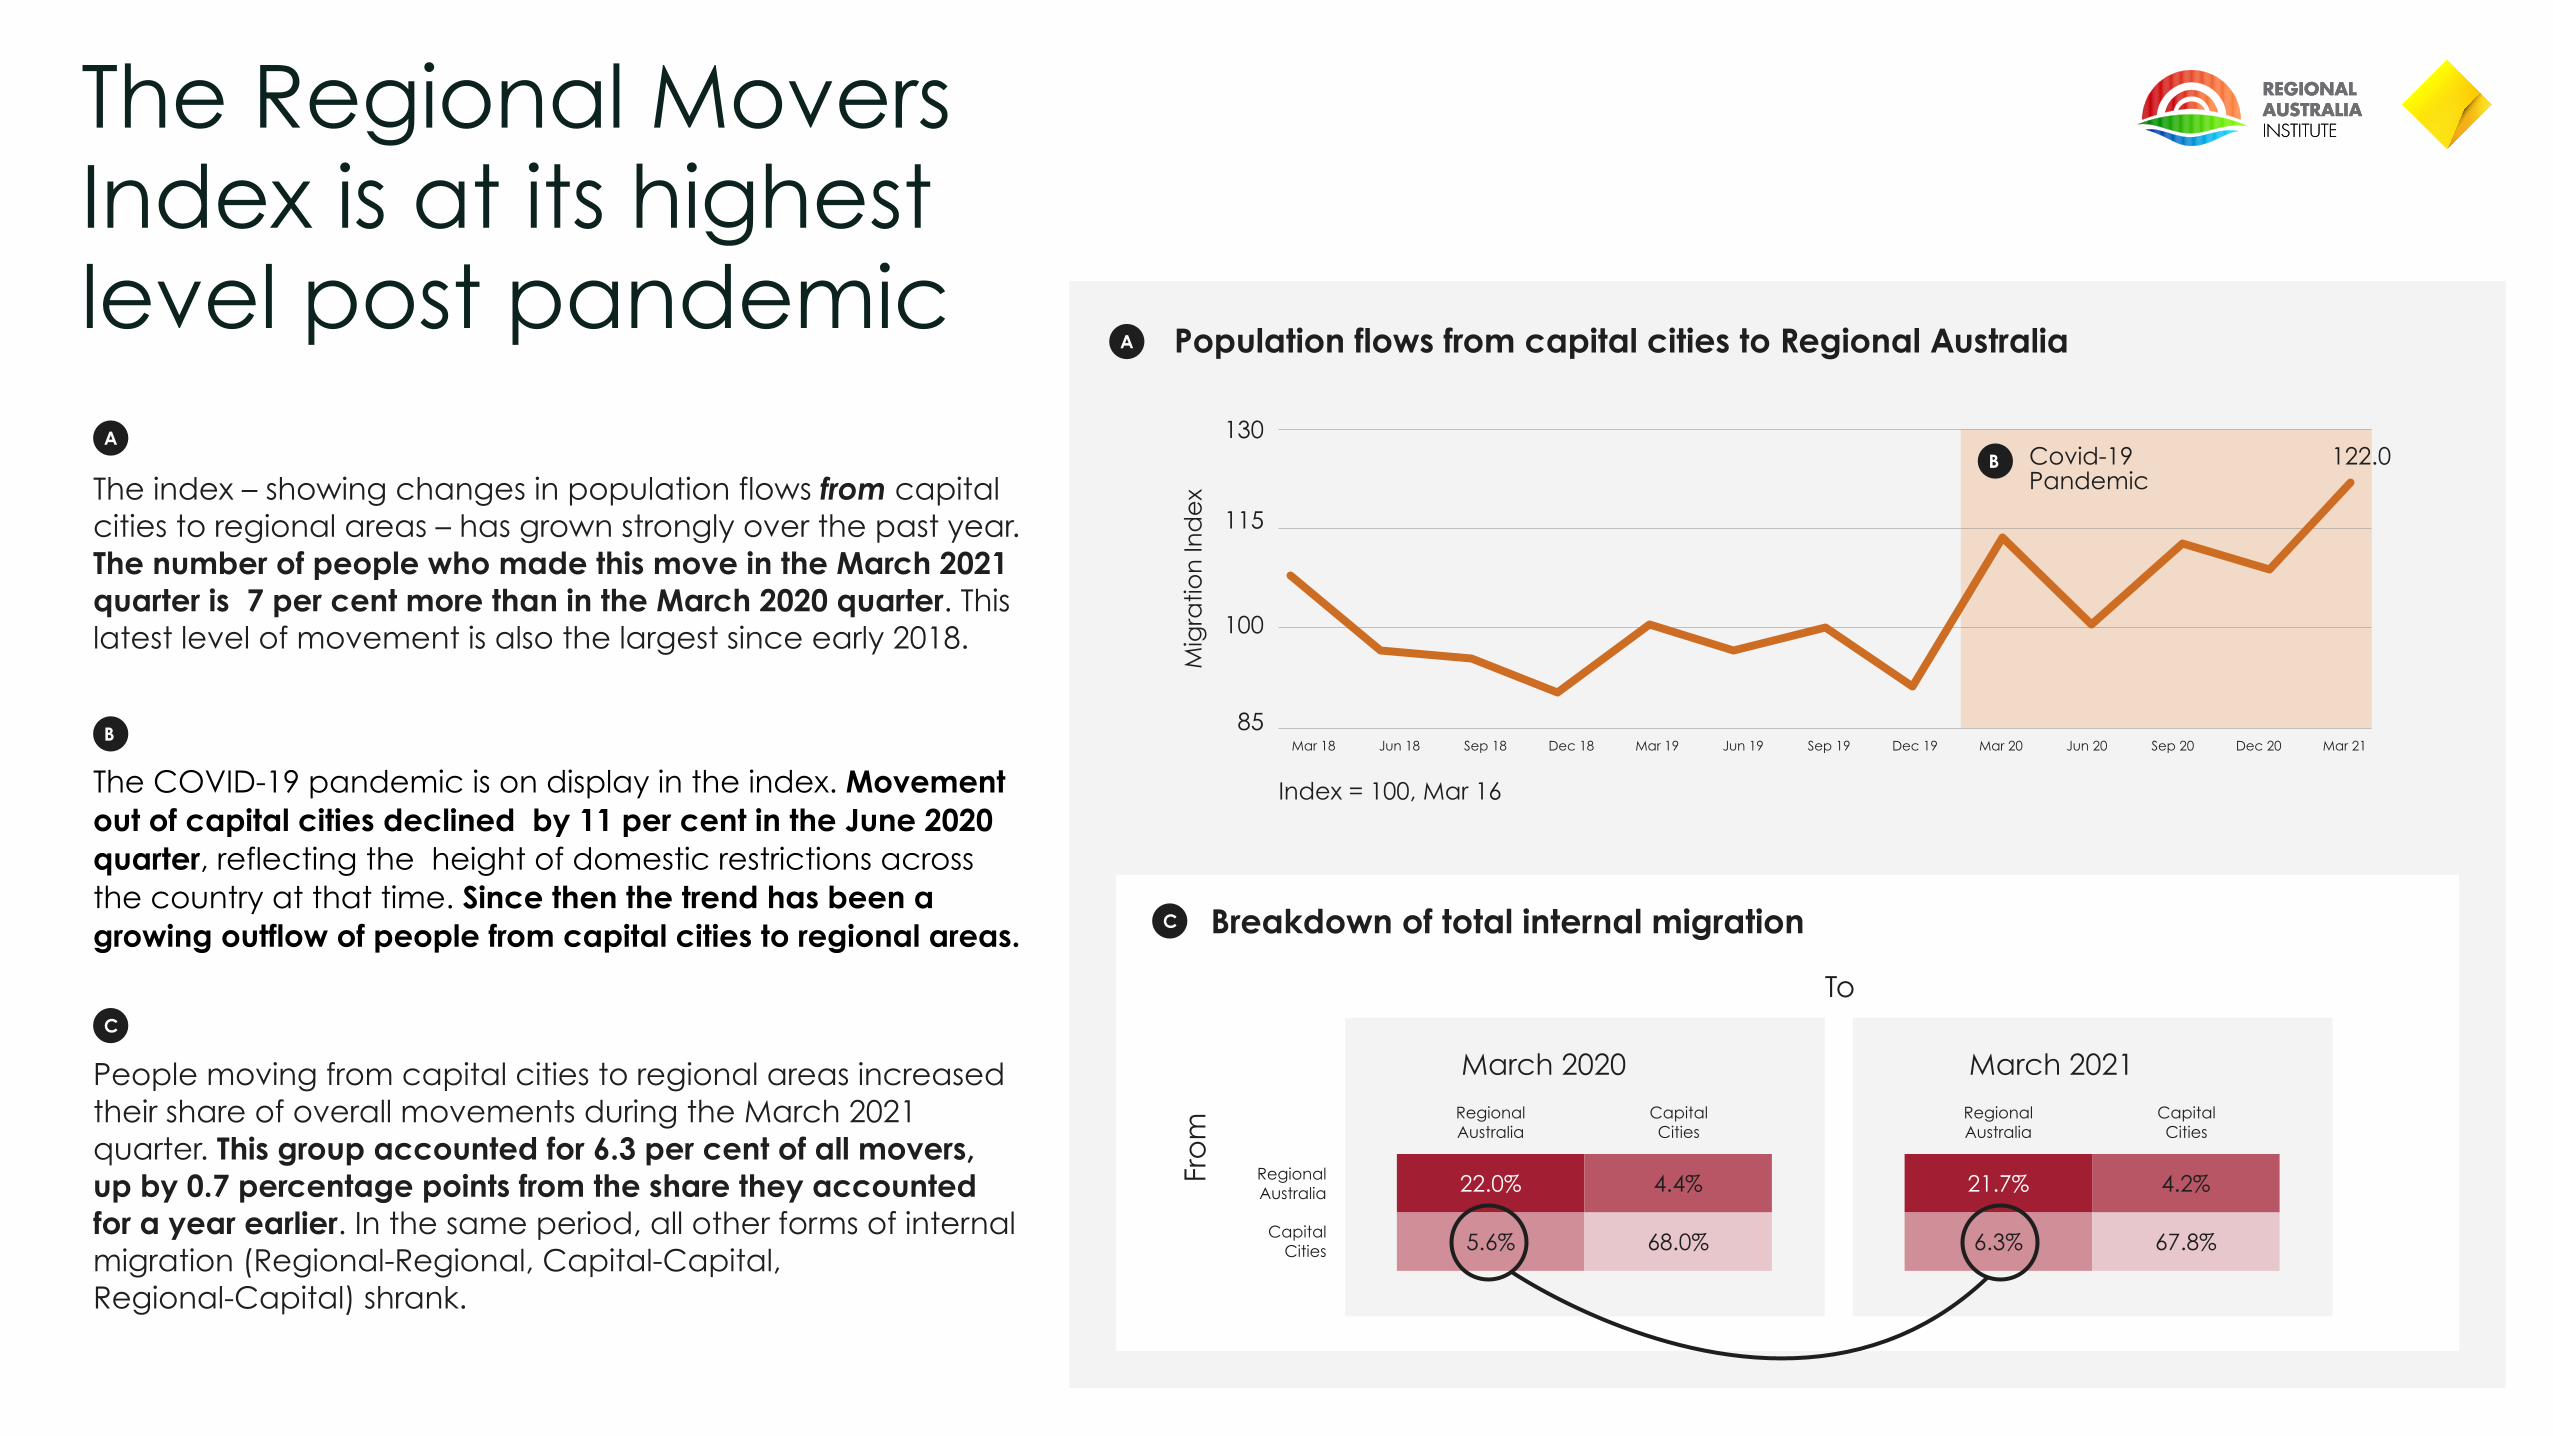
The Regional Movers Index is at its highest level post pandemic
The index – showing changes in population flows from capital cities to regional areas – has grown strongly over the past year. The number of people who made this move in the March 2021 quarter is 7 per cent more than in the March 2020 quarter. This latest level of movement is also the largest since early 2018.
Mig
ratio
n In
de
x
Index = 100, Mar 16
Covid-19 Pandemic
130
115
100
85Mar 18 Mar 19 Mar 20 Mar 21Jun 18 Jun 19 Jun 20Sep 18 Sep 19 Sep 20Dec 18 Dec 19 Dec 20
122.0
To
Fro
mRegional Australia
Capital Cities
Fro
m
March 2020
Regional Australia
Capital Cities
22.0%
5.6%
4.4%
68.0%
March 2021
Regional Australia
Capital Cities
21.7%
6.3%
4.2%
67.8%
Population flows from capital cities to Regional AustraliaA
C
A
Breakdown of total internal migration
C
B
B
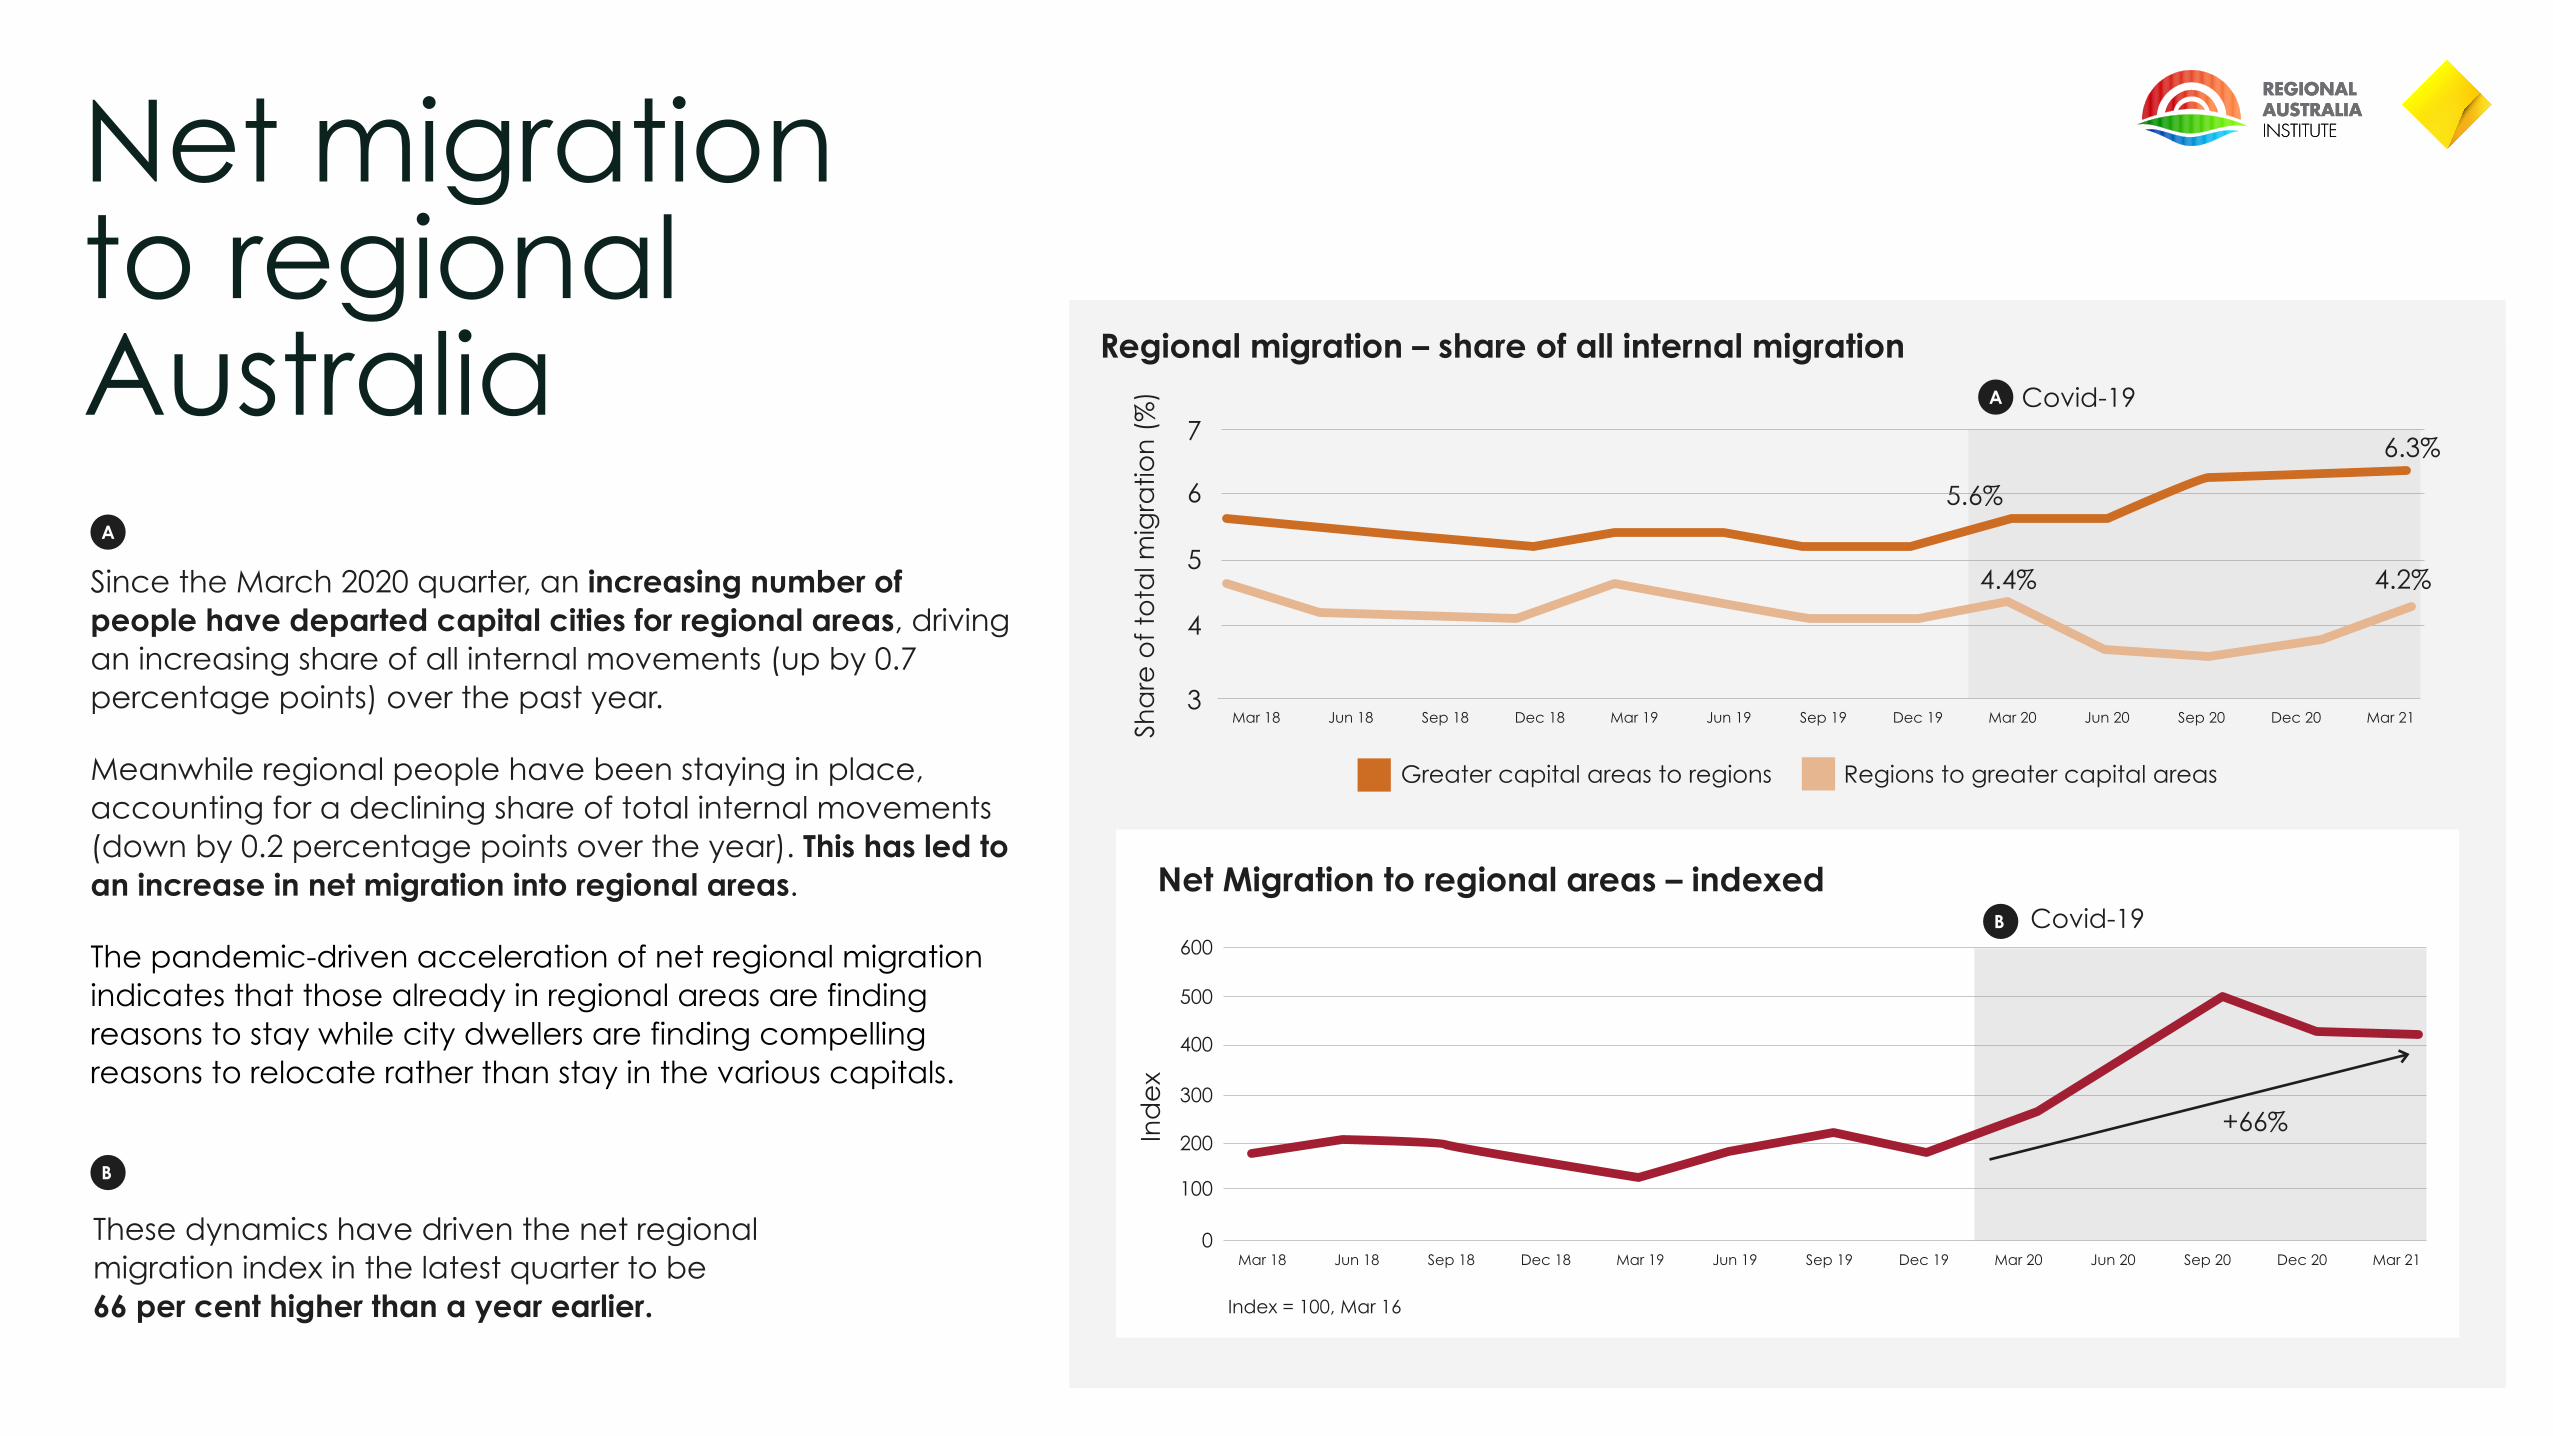
People moving from capital cities to regional areas increased their share of overall movements during the March 2021 quarter. This group accounted for 6.3 per cent of all movers, up by 0.7 percentage points from the share they accounted for a year earlier. In the same period, all other forms of internal migration (Regional-Regional, Capital-Capital, Regional-Capital) shrank.
The COVID-19 pandemic is on display in the index. Movement out of capital cities declined by 11 per cent in the June 2020 quarter, reflecting the height of domestic restrictions across the country at that time. Since then the trend has been a growing outflow of people from capital cities to regional areas.
Net migration to regional Australia
Since the March 2020 quarter, an increasing number of people have departed capital cities for regional areas, driving an increasing share of all internal movements (up by 0.7 percentage points) over the past year.
Meanwhile regional people have been staying in place, accounting for a declining share of total internal movements (down by 0.2 percentage points over the year). This has led to an increase in net migration into regional areas.
The pandemic-driven acceleration of net regional migration indicates that those already in regional areas are finding reasons to stay while city dwellers are finding compelling reasons to relocate rather than stay in the various capitals.
Ind
ex
Covid-19600
500
400
300
200
100
0Mar 18 Mar 19 Mar 20 Mar 21Jun 18 Jun 19 Jun 20Sep 18 Sep 19 Sep 20Dec 18 Dec 19 Dec 20
Index = 100, Mar 16
+66%
Regional migration – share of all internal migration
Net Migration to regional areas – indexed
Sha
re o
f to
tal m
igra
tion
(%
)
5.6%
4.4%
6.3%
4.2%
3
4
5
6
7
Mar 18 Mar 19 Mar 20 Mar 21Jun 18 Jun 19 Jun 20Sep 18 Sep 19 Sep 20Dec 18 Dec 19 Dec 20
Covid-19A
A
These dynamics have driven the net regional migration index in the latest quarter to be 66 per cent higher than a year earlier.
B
B
Greater capital areas to regions Regions to greater capital areas

Regional Hotspots: Top Five LGAs(by share of capital to regional migration)
The largest numbers of capital city dwellers who are moving to regional Australia are heading for the high population coastal centres proximate to capital cities.
The Gold Coast is the most popular destination among people moving from capitals to regions. The Glitter Strip welcomed 11 per cent of all capital city dwellers who moved to regional areas during the March 2021 quarter. The next most popular destinations were the Sunshine Coast, Greater Geelong, Wollongong and Newcastle.
The Sunshine Coast recorded the largest growth in migration from capital cities compared with the other Top 5 LGAs. Migration to the Sunshine Coast grew by 24 per cent in the March 2021 quarter, and by 14 per cent over the year.
Quarterly growth (%)
Annual growth (%)
WollongongNSW
WollongongNSW
Greater GeelongVIC
Greater GeelongVIC
Sunshine CoastQLD
Sunshine CoastQLD
Gold Coast QLD
Gold Coast QLD
NewcastleNSW
NewcastleNSW
Top 5 LGAs by share of capital to regional migration
Growth in March ‘21 Quarter for Top 5 LGAs
A
A
B
B
13%7%9% 10%
24%
14%17%
5%8%
0%
2%3%4%6%11%
% of Regional Migration
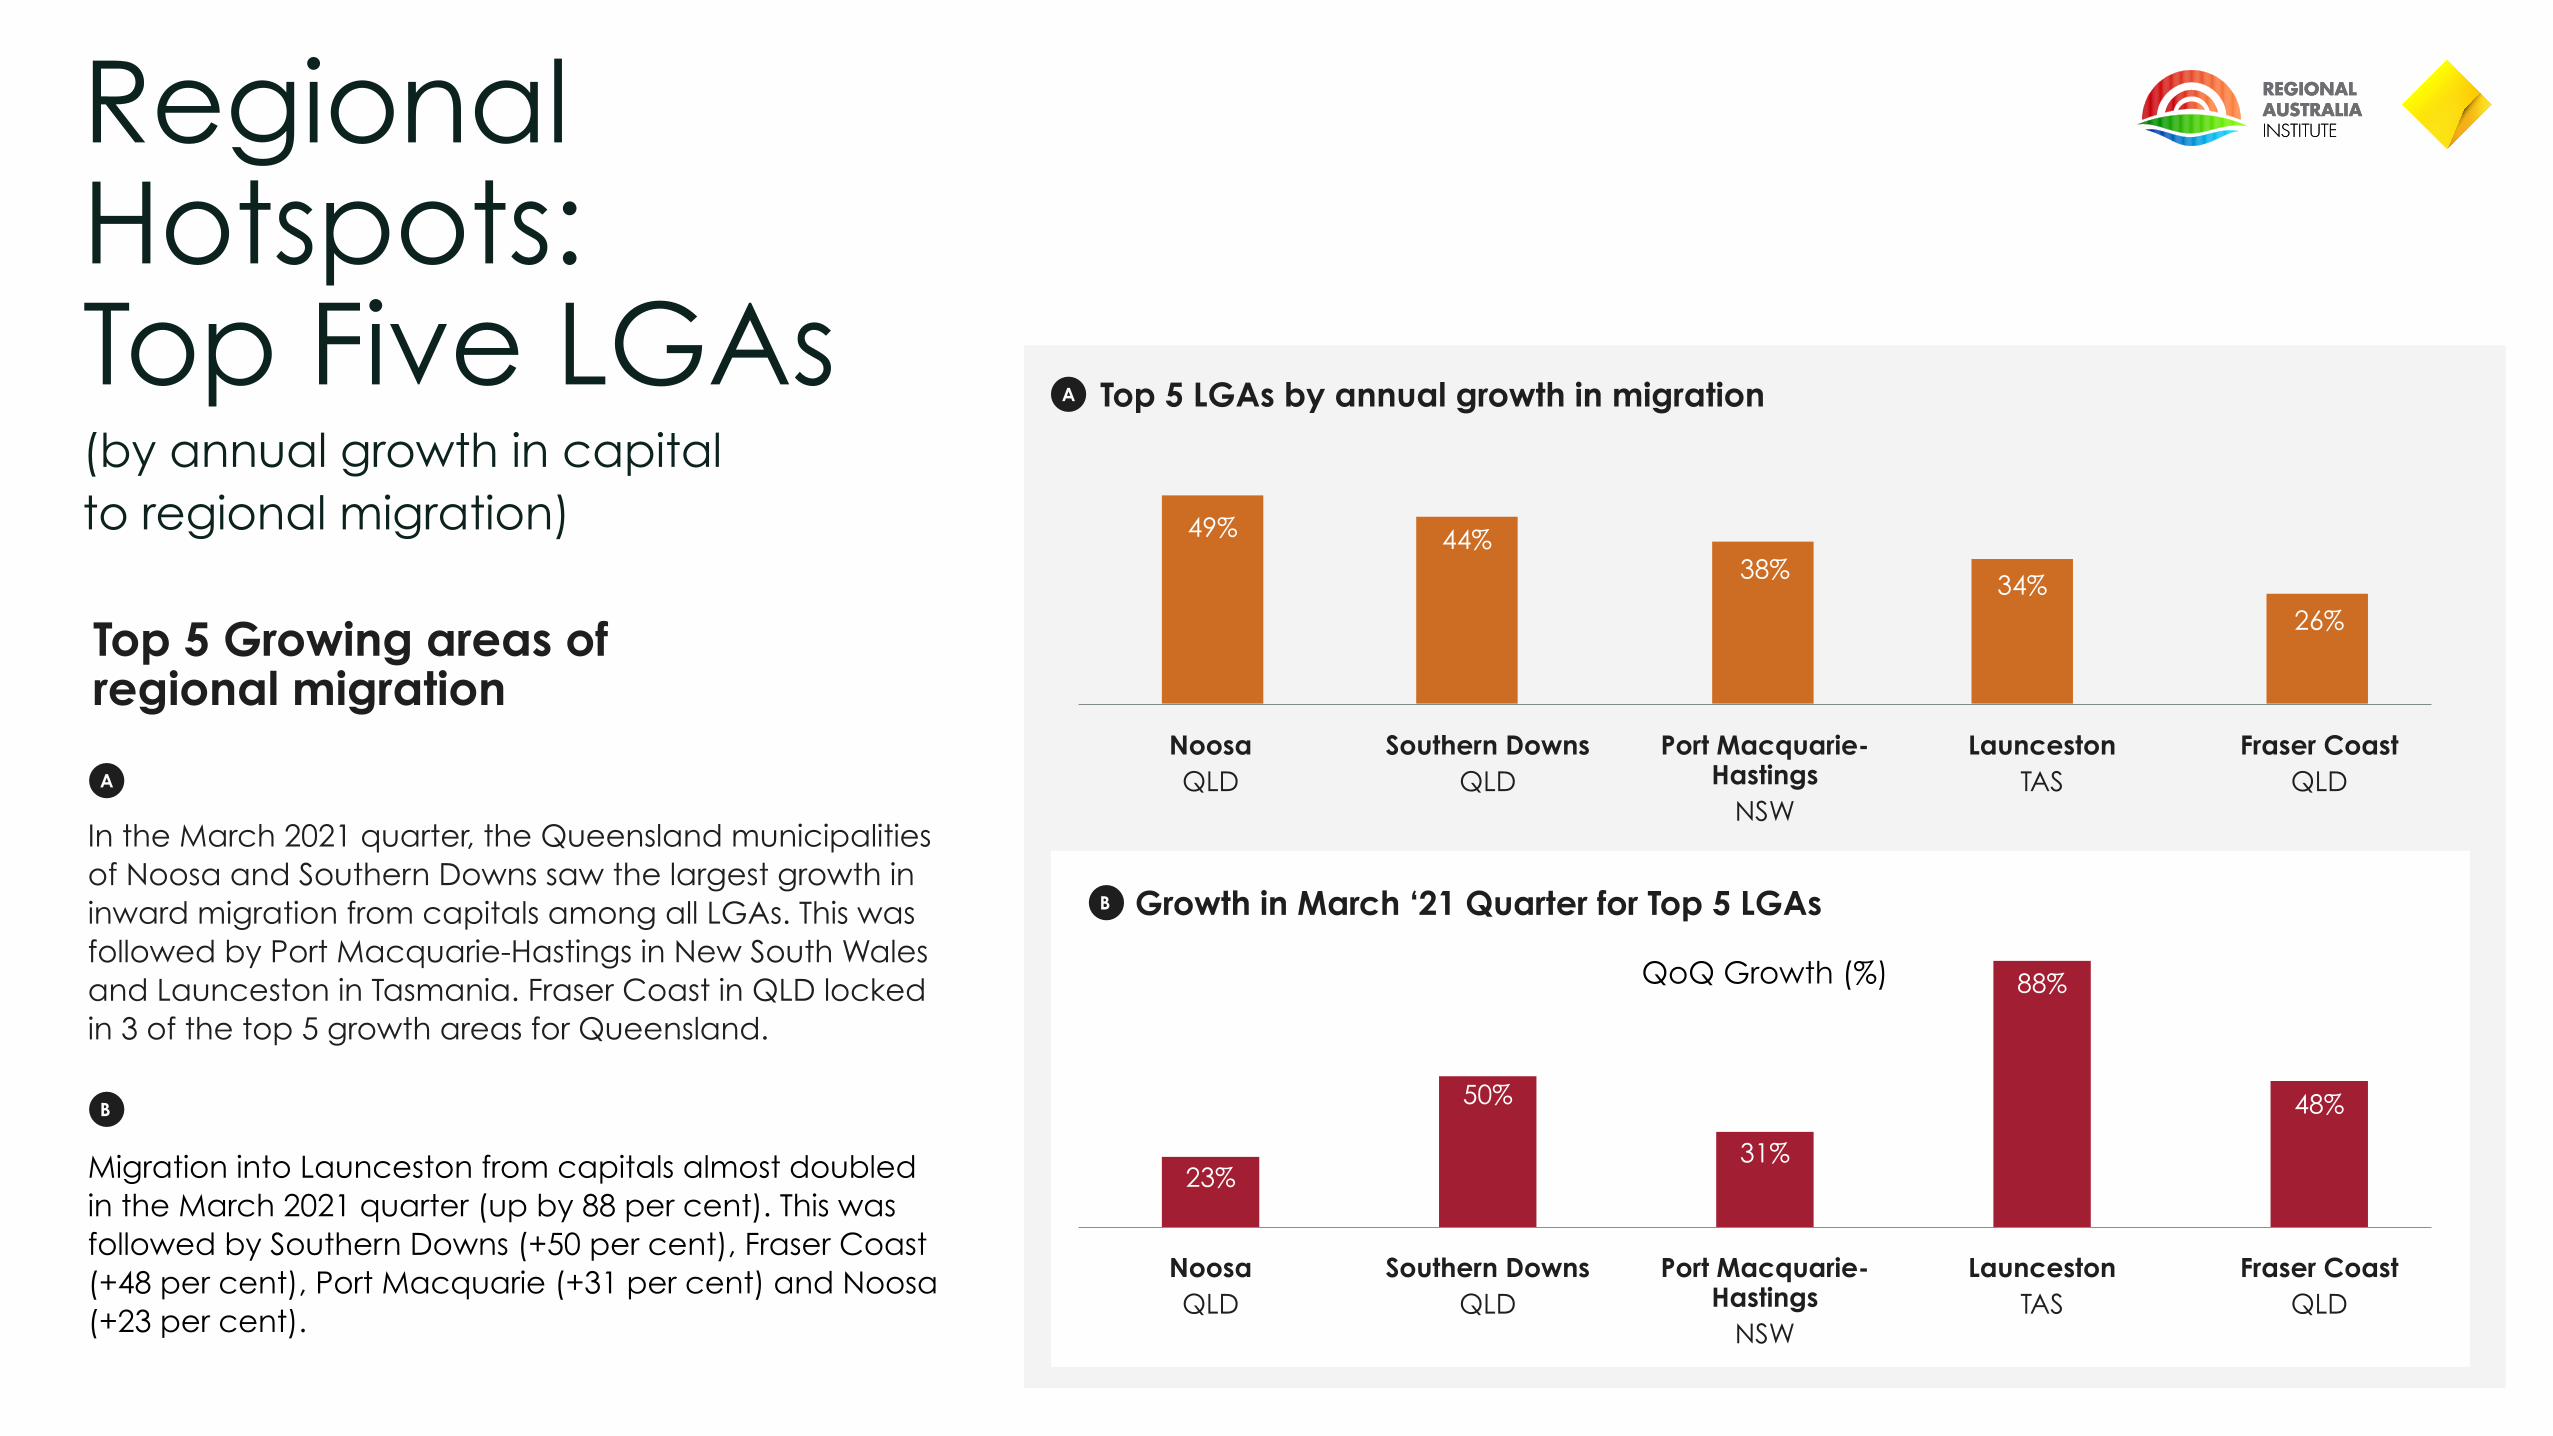
In the March 2021 quarter, the Queensland municipalities of Noosa and Southern Downs saw the largest growth in inward migration from capitals among all LGAs. This was followed by Port Macquarie-Hastings in New South Wales and Launceston in Tasmania. Fraser Coast in QLD locked in 3 of the top 5 growth areas for Queensland.
Migration into Launceston from capitals almost doubled in the March 2021 quarter (up by 88 per cent). This was followed by Southern Downs (+50 per cent), Fraser Coast (+48 per cent), Port Macquarie (+31 per cent) and Noosa (+23 per cent).
26%34%
38%44%49%
Growth in March ‘21 Quarter for Top 5 LGAs
Top 5 LGAs by annual growth in migrationA
A
B
B
Fraser CoastQLD
LauncestonTAS
Port Macquarie-Hastings
NSW
Southern DownsQLD
NoosaQLD
48%
88%
31%
50%
23%
Fraser CoastQLD
LauncestonTAS
Port Macquarie-Hastings
NSW
Southern DownsQLD
NoosaQLD
QoQ Growth (%)
Top 5 Growing areas of regional migration
Regional Hotspots: Top Five LGAs(by annual growth in capital to regional migration)
Migration Patterns By StateCapital City Net Overflows Regional Area Net Inflows, State Shares (Mar 21 Quarter)
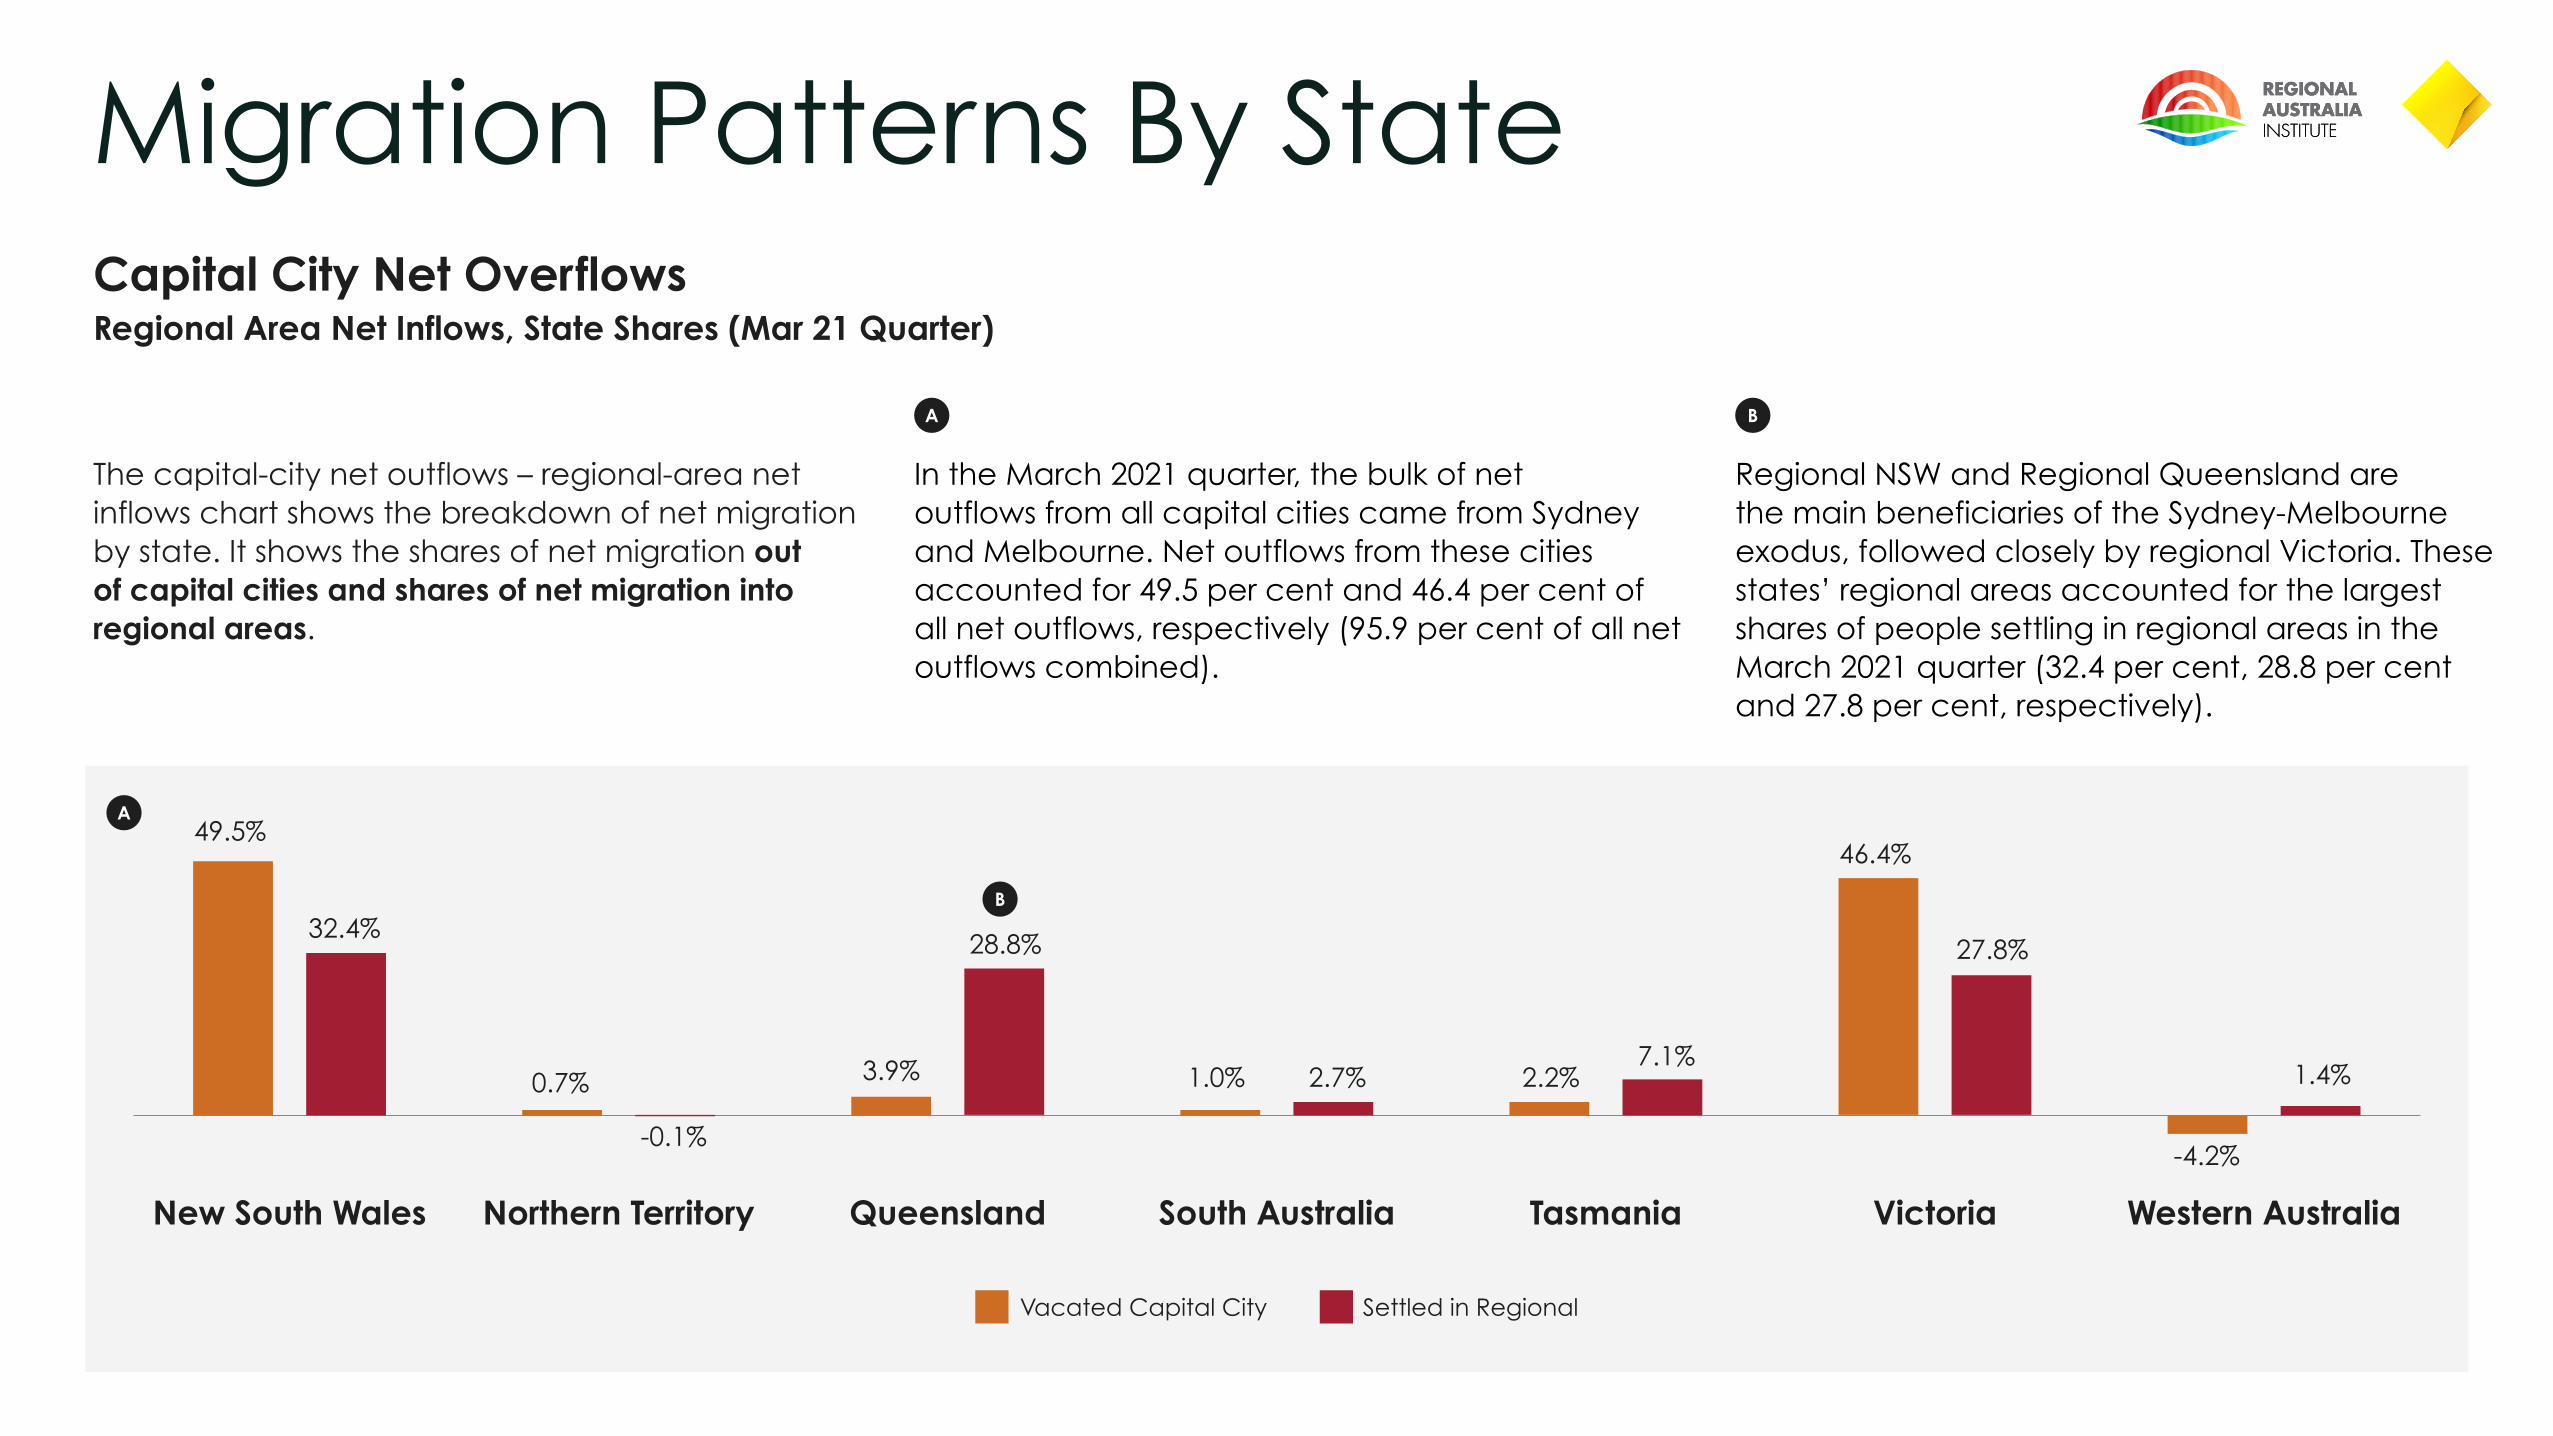
The capital-city net outflows – regional-area net inflows chart shows the breakdown of net migration by state. It shows the shares of net migration out of capital cities and shares of net migration into regional areas.
In the March 2021 quarter, the bulk of net outflows from all capital cities came from Sydney and Melbourne. Net outflows from these cities accounted for 49.5 per cent and 46.4 per cent of all net outflows, respectively (95.9 per cent of all net outflows combined).
Regional NSW and Regional Queensland are the main beneficiaries of the Sydney-Melbourne exodus, followed closely by regional Victoria. These states’ regional areas accounted for the largest shares of people settling in regional areas in the March 2021 quarter (32.4 per cent, 28.8 per cent and 27.8 per cent, respectively).
New South Wales Northern Territory Queensland South Australia Tasmania Victoria Western Australia
Vacated Capital City Settled in Regional
-4.2%
1.4%
27.8%
46.4%
2.2%2.7%1.0%
28.8%
3.9%
-0.1%
0.7%
32.4%
49.5%
7.1%
B
B
A
A

Appendix
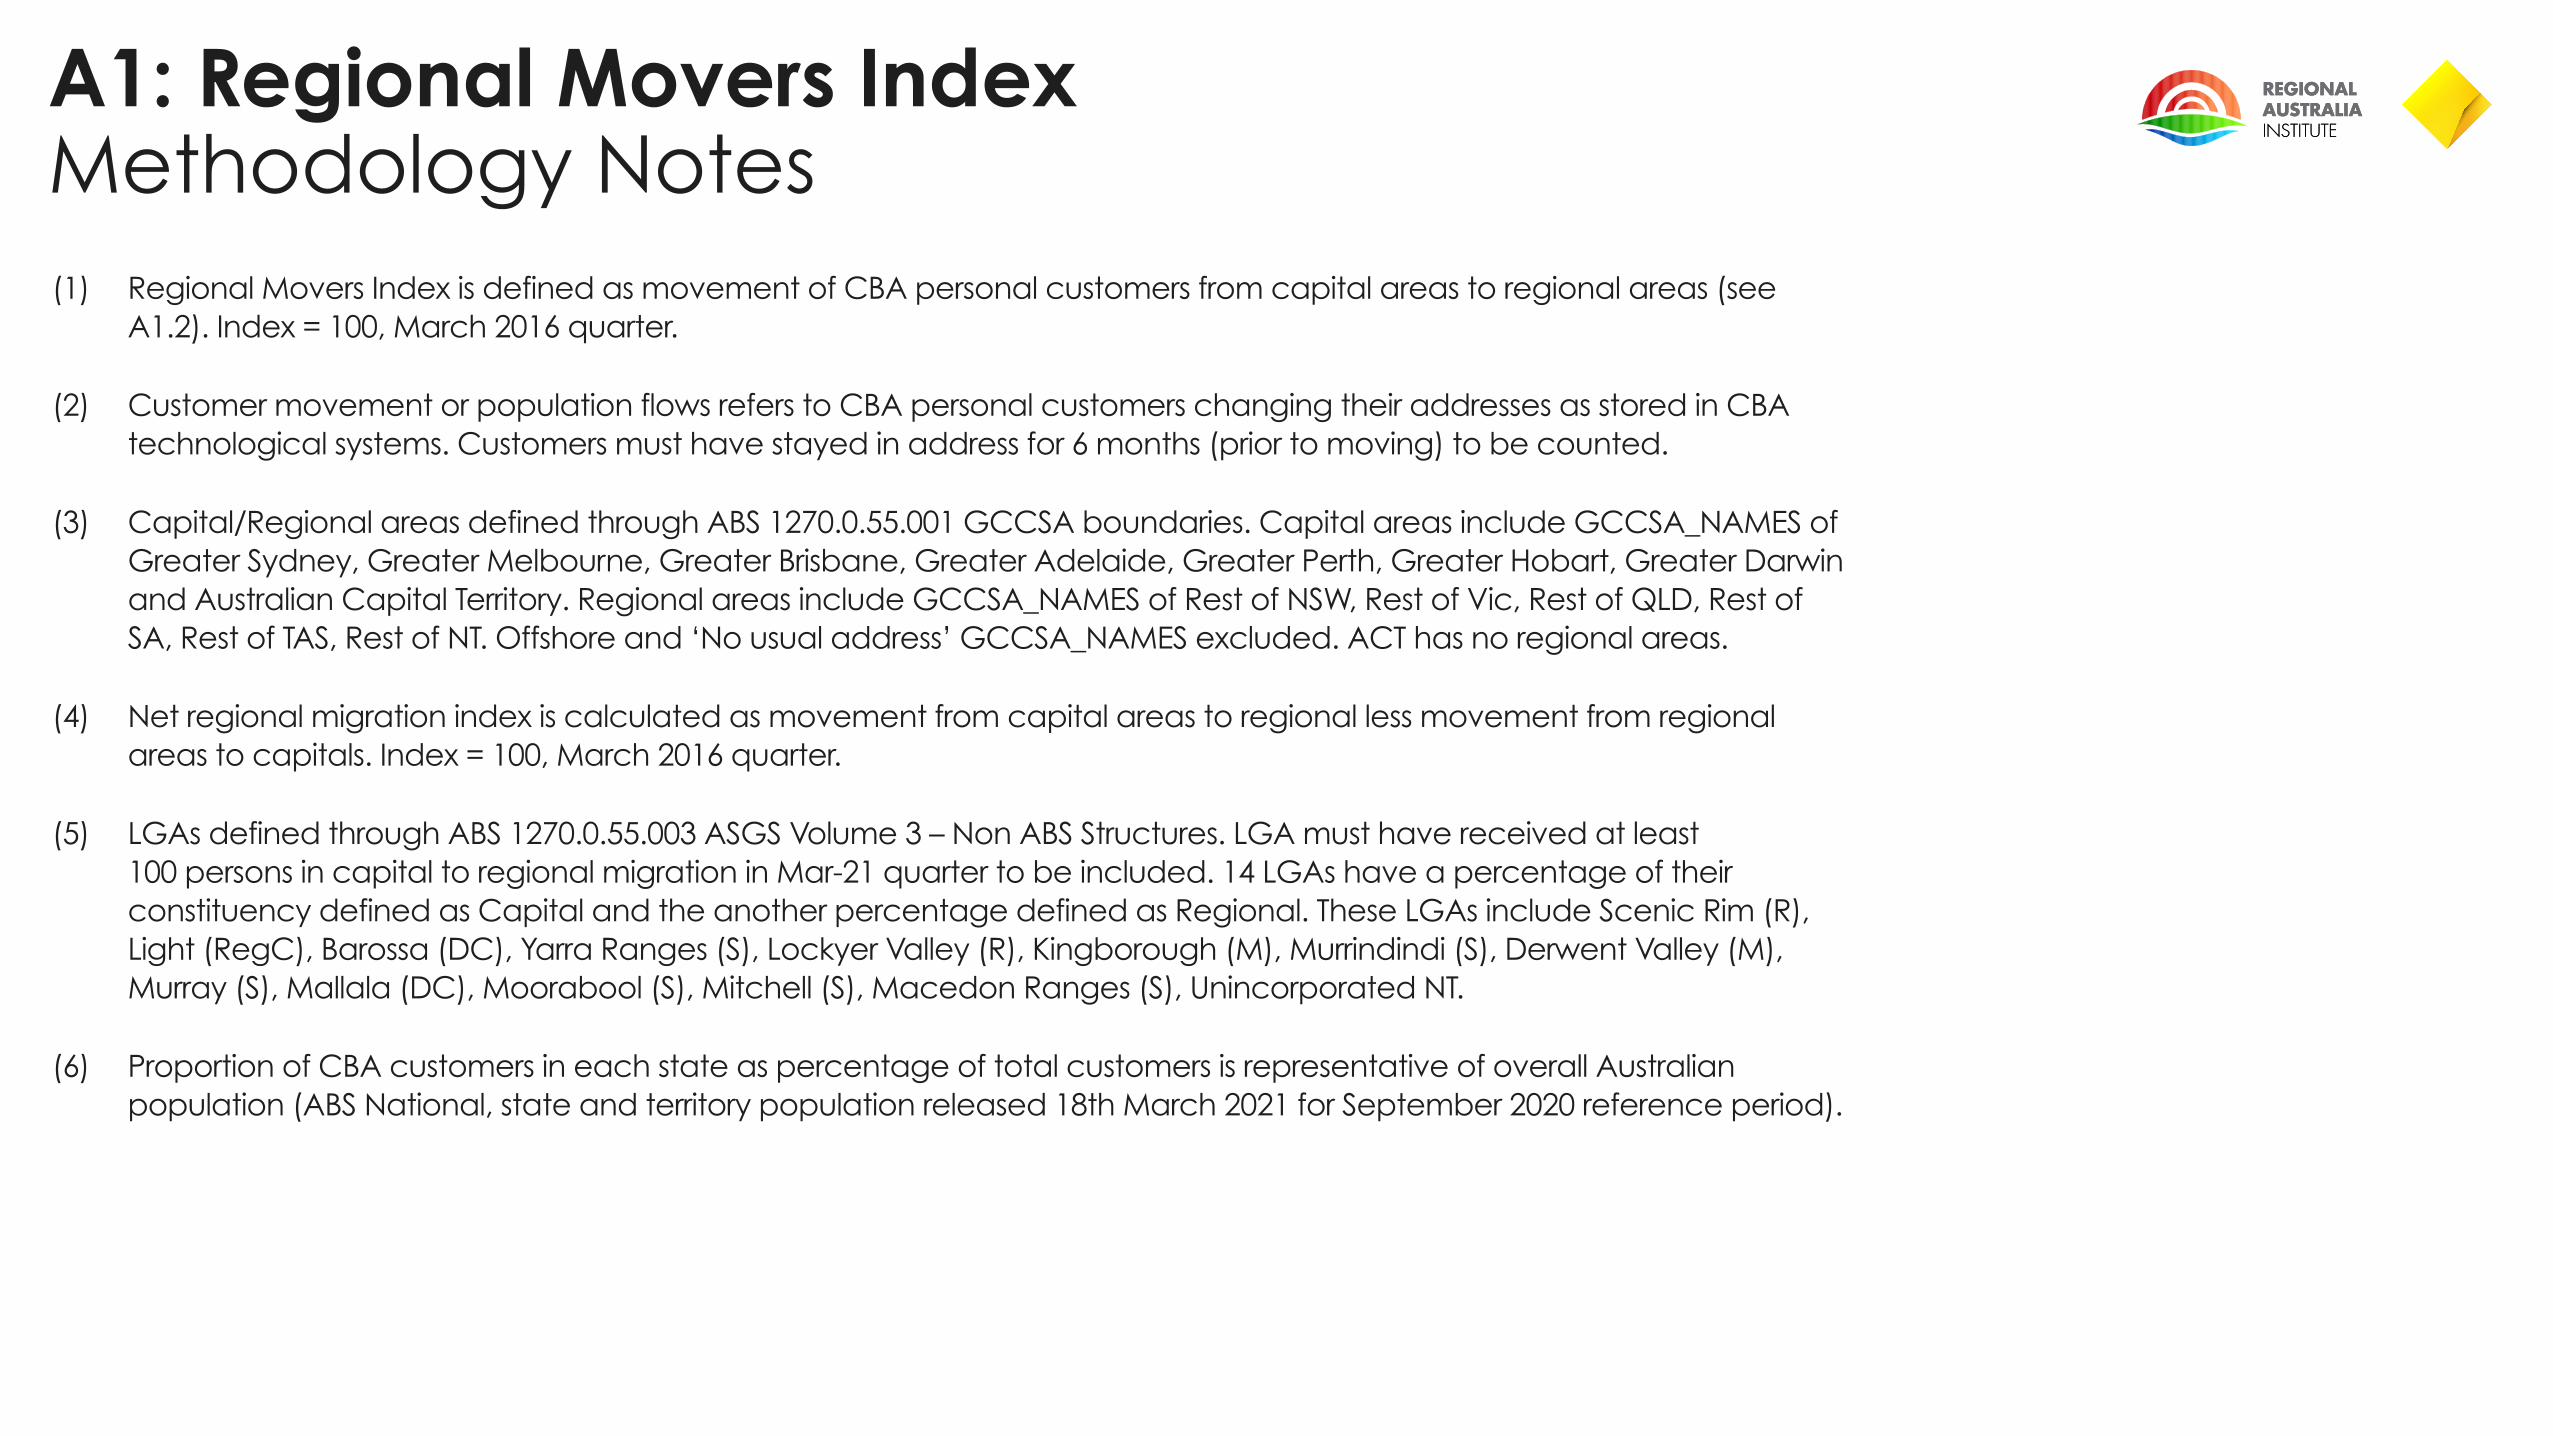
A1: Regional Movers Index Methodology Notes(1) Regional Movers Index is defined as movement of CBA personal customers from capital areas to regional areas (see
A1.2). Index = 100, March 2016 quarter.
(2) Customer movement or population flows refers to CBA personal customers changing their addresses as stored in CBA technological systems. Customers must have stayed in address for 6 months (prior to moving) to be counted.
(3) Capital/Regional areas defined through ABS 1270.0.55.001 GCCSA boundaries. Capital areas include GCCSA_NAMES of Greater Sydney, Greater Melbourne, Greater Brisbane, Greater Adelaide, Greater Perth, Greater Hobart, Greater Darwin and Australian Capital Territory. Regional areas include GCCSA_NAMES of Rest of NSW, Rest of Vic, Rest of QLD, Rest of SA, Rest of TAS, Rest of NT. Offshore and ‘No usual address’ GCCSA_NAMES excluded. ACT has no regional areas.
(4) Net regional migration index is calculated as movement from capital areas to regional less movement from regional areas to capitals. Index = 100, March 2016 quarter.
(5) LGAs defined through ABS 1270.0.55.003 ASGS Volume 3 – Non ABS Structures. LGA must have received at least 100 persons in capital to regional migration in Mar-21 quarter to be included. 14 LGAs have a percentage of their constituency defined as Capital and the another percentage defined as Regional. These LGAs include Scenic Rim (R), Light (RegC), Barossa (DC), Yarra Ranges (S), Lockyer Valley (R), Kingborough (M), Murrindindi (S), Derwent Valley (M), Murray (S), Mallala (DC), Moorabool (S), Mitchell (S), Macedon Ranges (S), Unincorporated NT.
(6) Proportion of CBA customers in each state as percentage of total customers is representative of overall Australian population (ABS National, state and territory population released 18th March 2021 for September 2020 reference period).
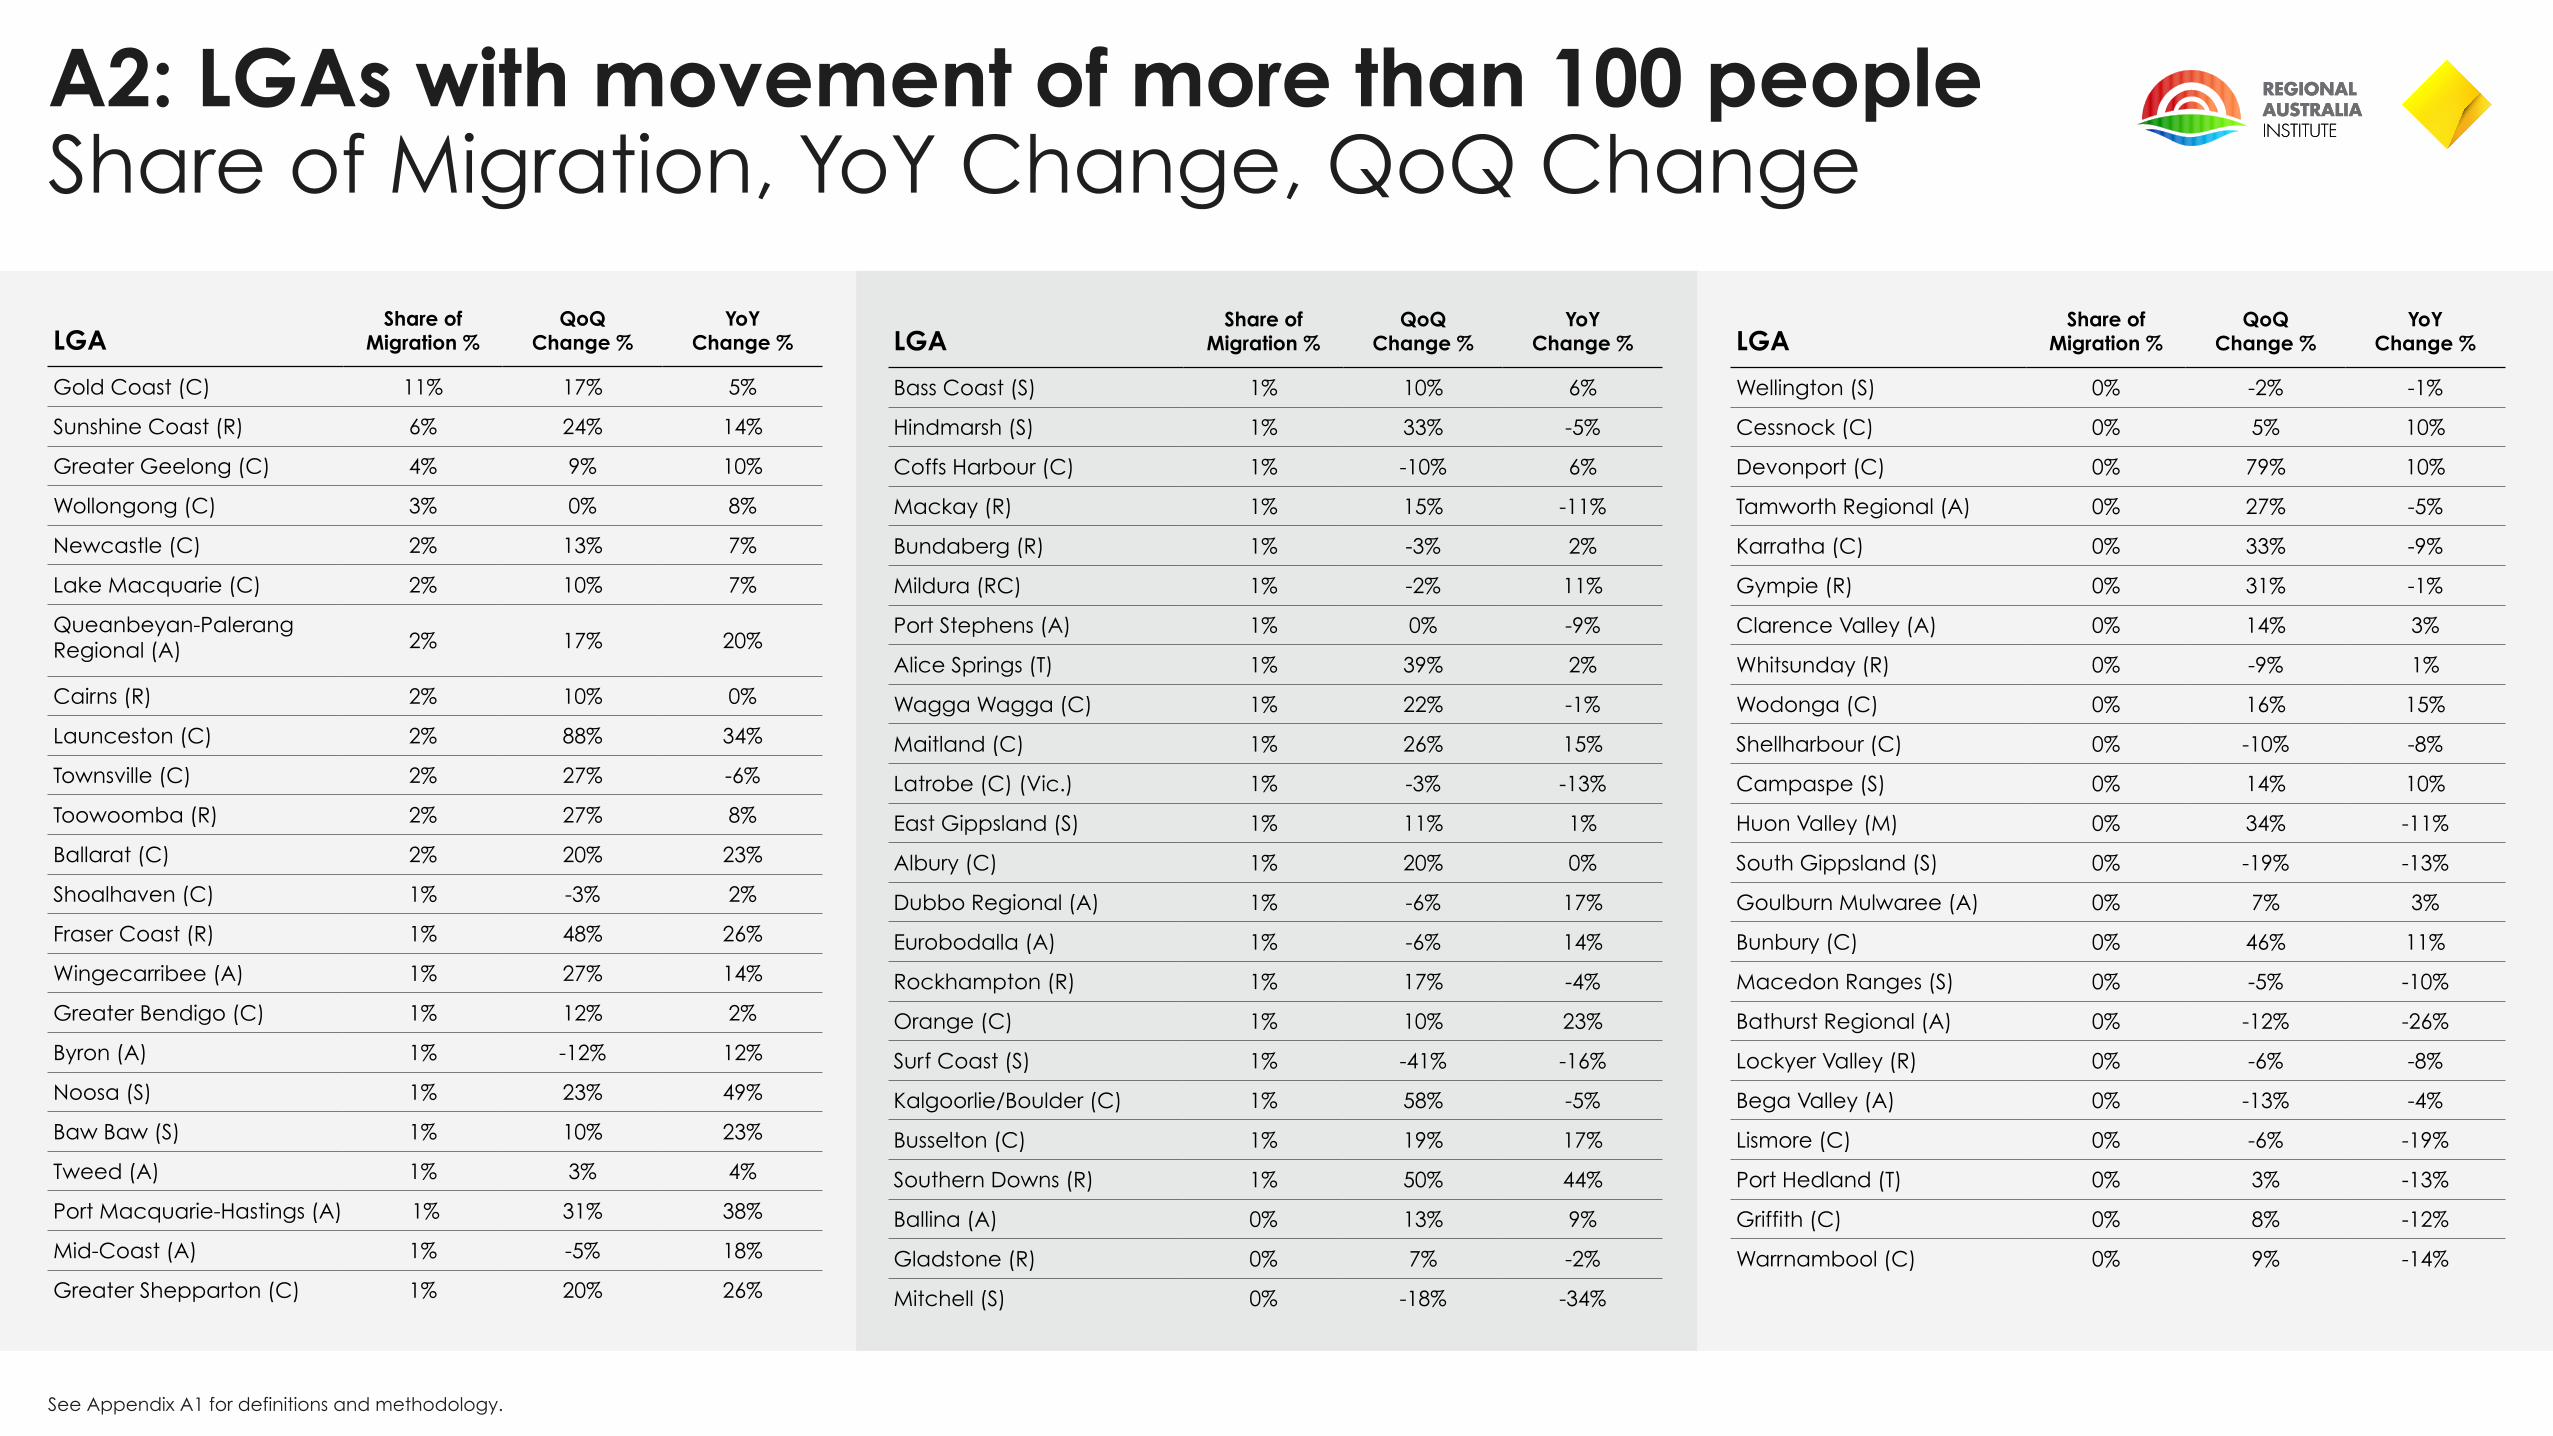
A2: LGAs with movement of more than 100 people Share of Migration, YoY Change, QoQ Change
See Appendix A1 for definitions and methodology.
LGAShare of
Migration %QoQ
Change %YoY
Change %
Gold Coast (C) 11% 17% 5%
Sunshine Coast (R) 6% 24% 14%
Greater Geelong (C) 4% 9% 10%
Wollongong (C) 3% 0% 8%
Newcastle (C) 2% 13% 7%
Lake Macquarie (C) 2% 10% 7%
Queanbeyan-Palerang Regional (A) 2% 17% 20%
Cairns (R) 2% 10% 0%
Launceston (C) 2% 88% 34%
Townsville (C) 2% 27% -6%
Toowoomba (R) 2% 27% 8%
Ballarat (C) 2% 20% 23%
Shoalhaven (C) 1% -3% 2%
Fraser Coast (R) 1% 48% 26%
Wingecarribee (A) 1% 27% 14%
Greater Bendigo (C) 1% 12% 2%
Byron (A) 1% -12% 12%
Noosa (S) 1% 23% 49%
Baw Baw (S) 1% 10% 23%
Tweed (A) 1% 3% 4%
Port Macquarie-Hastings (A) 1% 31% 38%
Mid-Coast (A) 1% -5% 18%
Greater Shepparton (C) 1% 20% 26%
LGAShare of
Migration %QoQ
Change %YoY
Change %
Bass Coast (S) 1% 10% 6%
Hindmarsh (S) 1% 33% -5%
Coffs Harbour (C) 1% -10% 6%
Mackay (R) 1% 15% -11%
Bundaberg (R) 1% -3% 2%
Mildura (RC) 1% -2% 11%
Port Stephens (A) 1% 0% -9%
Alice Springs (T) 1% 39% 2%
Wagga Wagga (C) 1% 22% -1%
Maitland (C) 1% 26% 15%
Latrobe (C) (Vic.) 1% -3% -13%
East Gippsland (S) 1% 11% 1%
Albury (C) 1% 20% 0%
Dubbo Regional (A) 1% -6% 17%
Eurobodalla (A) 1% -6% 14%
Rockhampton (R) 1% 17% -4%
Orange (C) 1% 10% 23%
Surf Coast (S) 1% -41% -16%
Kalgoorlie/Boulder (C) 1% 58% -5%
Busselton (C) 1% 19% 17%
Southern Downs (R) 1% 50% 44%
Ballina (A) 0% 13% 9%
Gladstone (R) 0% 7% -2%
Mitchell (S) 0% -18% -34%
LGAShare of
Migration %QoQ
Change %YoY
Change %
Wellington (S) 0% -2% -1%
Cessnock (C) 0% 5% 10%
Devonport (C) 0% 79% 10%
Tamworth Regional (A) 0% 27% -5%
Karratha (C) 0% 33% -9%
Gympie (R) 0% 31% -1%
Clarence Valley (A) 0% 14% 3%
Whitsunday (R) 0% -9% 1%
Wodonga (C) 0% 16% 15%
Shellharbour (C) 0% -10% -8%
Campaspe (S) 0% 14% 10%
Huon Valley (M) 0% 34% -11%
South Gippsland (S) 0% -19% -13%
Goulburn Mulwaree (A) 0% 7% 3%
Bunbury (C) 0% 46% 11%
Macedon Ranges (S) 0% -5% -10%
Bathurst Regional (A) 0% -12% -26%
Lockyer Valley (R) 0% -6% -8%
Bega Valley (A) 0% -13% -4%
Lismore (C) 0% -6% -19%
Port Hedland (T) 0% 3% -13%
Griffith (C) 0% 8% -12%
Warrnambool (C) 0% 9% -14%