Regional Market Analysis - World Food Programme
37
Regional Market Analysis VAM Unit Issue 5 September 2019 - January 2020
Transcript of Regional Market Analysis - World Food Programme

Regional Market Analysis
VAM Unit
Issue 5
September 2019 - January 2020
September 2019 – January 2020 Page 2
Regional Market Analysis
Regional Market Analysis
Introduction
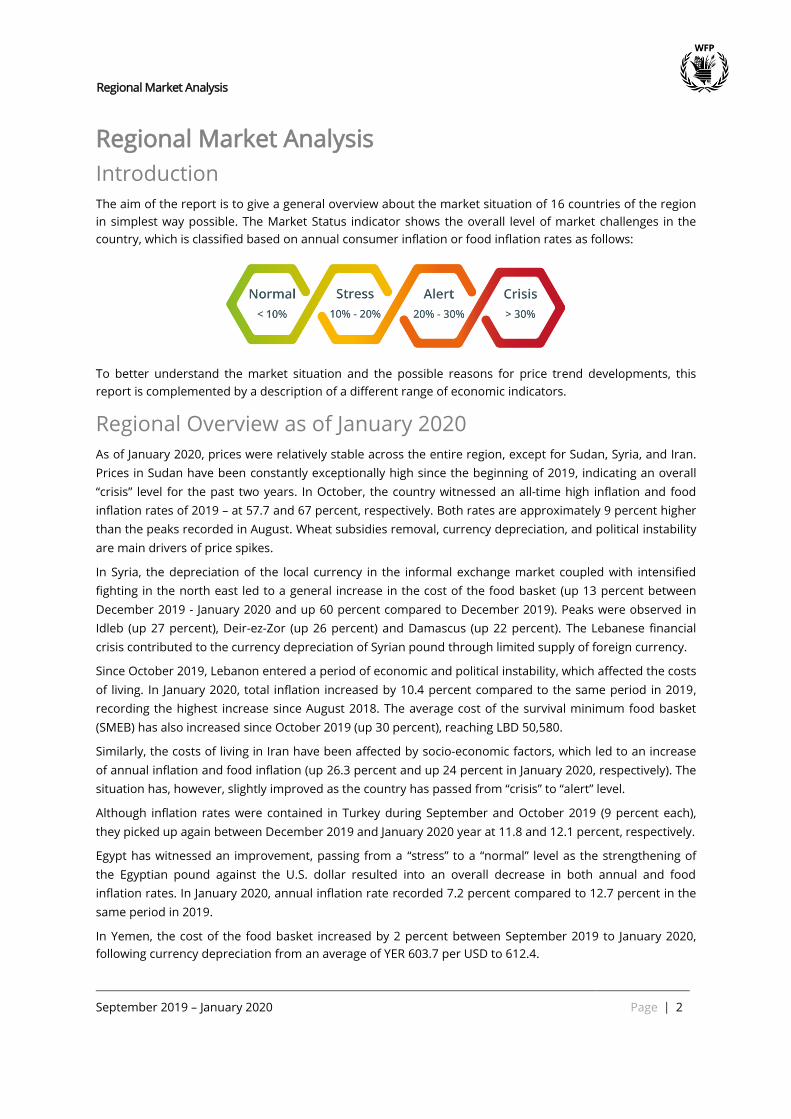
The aim of the report is to give a general overview about the market situation of 16 countries of the region
in simplest way possible. The Market Status indicator shows the overall level of market challenges in the
country, which is classified based on annual consumer inflation or food inflation rates as follows:
To better understand the market situation and the possible reasons for price trend developments, this
report is complemented by a description of a different range of economic indicators.
Regional Overview as of January 2020
As of January 2020, prices were relatively stable across the entire region, except for Sudan, Syria, and Iran.
Prices in Sudan have been constantly exceptionally high since the beginning of 2019, indicating an overall
“crisis” level for the past two years. In October, the country witnessed an all-time high inflation and food
inflation rates of 2019 – at 57.7 and 67 percent, respectively. Both rates are approximately 9 percent higher
than the peaks recorded in August. Wheat subsidies removal, currency depreciation, and political instability
are main drivers of price spikes.
In Syria, the depreciation of the local currency in the informal exchange market coupled with intensified
fighting in the north east led to a general increase in the cost of the food basket (up 13 percent between
December 2019 - January 2020 and up 60 percent compared to December 2019). Peaks were observed in
Idleb (up 27 percent), Deir-ez-Zor (up 26 percent) and Damascus (up 22 percent). The Lebanese financial
crisis contributed to the currency depreciation of Syrian pound through limited supply of foreign currency.
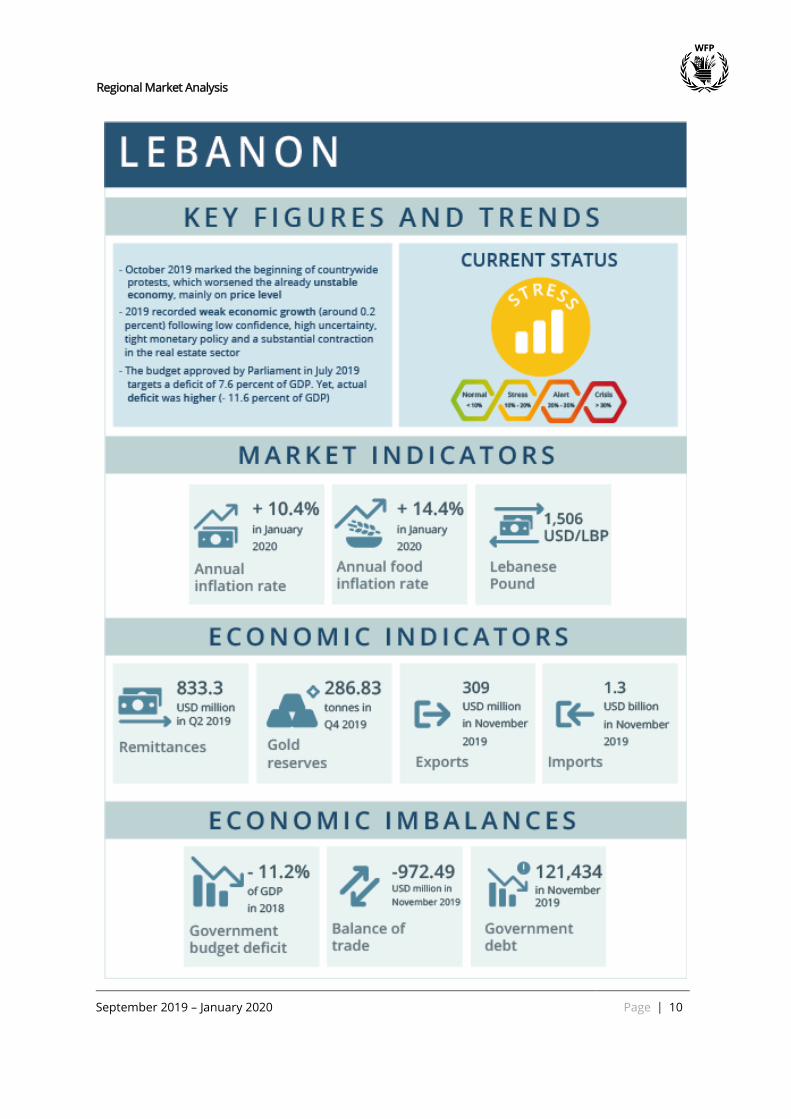
Since October 2019, Lebanon entered a period of economic and political instability, which affected the costs
of living. In January 2020, total inflation increased by 10.4 percent compared to the same period in 2019,
recording the highest increase since August 2018. The average cost of the survival minimum food basket
(SMEB) has also increased since October 2019 (up 30 percent), reaching LBD 50,580.
Similarly, the costs of living in Iran have been affected by socio-economic factors, which led to an increase
of annual inflation and food inflation (up 26.3 percent and up 24 percent in January 2020, respectively). The
situation has, however, slightly improved as the country has passed from “crisis” to “alert” level.
Although inflation rates were contained in Turkey during September and October 2019 (9 percent each),
they picked up again between December 2019 and January 2020 year at 11.8 and 12.1 percent, respectively.
Egypt has witnessed an improvement, passing from a “stress” to a “normal” level as the strengthening of
the Egyptian pound against the U.S. dollar resulted into an overall decrease in both annual and food
inflation rates. In January 2020, annual inflation rate recorded 7.2 percent compared to 12.7 percent in the
same period in 2019.
In Yemen, the cost of the food basket increased by 2 percent between September 2019 to January 2020,
following currency depreciation from an average of YER 603.7 per USD to 612.4.

September 2019 – January 2020 Page 3
Regional Market Analysis
Annual inflation rates, January 2020
Annual food inflation rates, January 2020
Normal (< 10%) Stress (10% - 20%)
Alert (20% - 30%) Crisis (> 30%)
Data sources: WFP, UNGIWG, GeoNames, GAUL, and OCHA.
The designations employed and the presentation of material in the map(s) do not imply the expression of
any opinion on the part of WFP concerning the legal or constitutional status of any country, territory, city or
sea, or concerning the delimitation of its frontiers or boundaries.
Notes on the data:
* All figures represent annual rates in January 2020 except for the following:
• Total and food inflation → Jordan (latest available is December 2019), Libya (latest available is
September 2019 and Sudan (latest available is October 2019)
• Total inflation → Iraq and Tajikistan (latest available is December 2019)
• Food inflation → Iraq, Palestine, Tajikistan and Tunisia (latest available is November 2019).
** Syria and Yemen food inflation represents WFP monitored food basket. No data available on annual
inflation rates (grey shaded areas).

September 2019 – January 2020 Page 4
Regional Market Analysis
September 2019 – January 2020 Page 5
Regional Market Analysis
Source: WFP SNAP
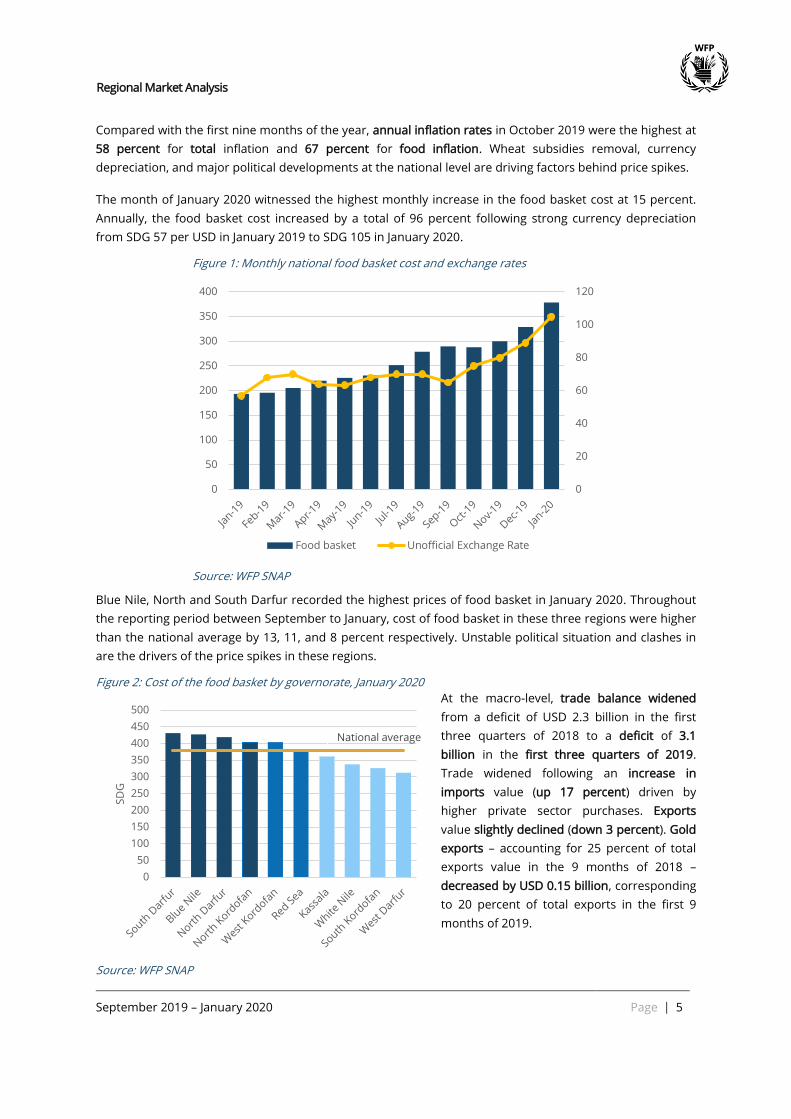
Compared with the first nine months of the year, annual inflation rates in October 2019 were the highest at
58 percent for total inflation and 67 percent for food inflation. Wheat subsidies removal, currency
depreciation, and major political developments at the national level are driving factors behind price spikes.
The month of January 2020 witnessed the highest monthly increase in the food basket cost at 15 percent.
Annually, the food basket cost increased by a total of 96 percent following strong currency depreciation
from SDG 57 per USD in January 2019 to SDG 105 in January 2020.
Figure 1: Monthly national food basket cost and exchange rates
Source: WFP SNAP
Blue Nile, North and South Darfur recorded the highest prices of food basket in January 2020. Throughout
the reporting period between September to January, cost of food basket in these three regions were higher
than the national average by 13, 11, and 8 percent respectively. Unstable political situation and clashes in
are the drivers of the price spikes in these regions.
Figure 2: Cost of the food basket by governorate, January 2020
At the macro-level, trade balance widened
from a deficit of USD 2.3 billion in the first
three quarters of 2018 to a deficit of 3.1
billion in the first three quarters of 2019.
Trade widened following an increase in
imports value (up 17 percent) driven by
higher private sector purchases. Exports
value slightly declined (down 3 percent). Gold
exports – accounting for 25 percent of total
exports value in the 9 months of 2018 –
decreased by USD 0.15 billion, corresponding
to 20 percent of total exports in the first 9
months of 2019.
0
20
40
60
80
100
120
0
50
100
150
200
250
300
350
400
Food basket Unofficial Exchange Rate
National average
0
50
100
150
200
250
300
350
400
450
500
SD
G

September 2019 – January 2020 Page 6
Regional Market Analysis

September 2019 – January 2020 Page 7
Regional Market Analysis
Gov ernoratePrice
January 2020
1 month
change
5 months
changes
12 months
changes
Aleppo SYP 33,497 6% 47% 54%
Damascus SYP 34,611 22% 49% 60%
Dar'a SYP 34,472 9% 38% 57%
Deir-ez-Zor SYP 39,855 26% 36% 51%
Hama SYP 37,447 20% 58% 49%
Al-Hasakeh SYP 40,008 11% 54% 84%
Homs SYP 31,187 0% 41% 26%
Idleb SYP 50,636 27% 103% 120%
Lattakia SYP 39,875 13% 56% 64%
Ar-Raqqa SYP 38,121 9% 40% 57%
Rural Damascus SYP 34,752 15% 44% 54%
As-Sweida SYP 36,707 12% 53% 65%
Tartous SYP 34,895 0% 28% 46%
Quneitra SYP 36,721 12% 54% 57%
Average SYP 37,556 13% 51% 60%
In January 2020, the national average
price of a standard reference food
basket1 increased by 13 percent reaching
SYP 37,556 compared to December 2019.
The y-o-y food basket national average
price was 60 percent higher compared to
January 20192. Peaks were recorded in
Idleb (up 27 percent), Deir-ez-Zor (up 26
percent) and Damascus (up 22 percent).
The depreciation of the Syrian Pound in
the informal exchange market is the
main driver of such increase. In Idleb,
continuing fighting and disruptions in
supply routes in north-west Ar-Raqqa
and Aleppo are the main drivers of the
reported increase. Idleb also recorded
the highest average cost of food basket
in January (SYP 50,636), followed by Al-Hasakeh (SYP 40,008) and Lattakia (SYP 39,875). The gap between the
highest and lowest recorded average food baskets is continues to widen, as it expanded by 68 percent from
SYP 11,567 in December 2019 to SYP 19,449 in January 2020. This seems to suggest a worsening of trade
relations across Syria.
Following the depreciation of the Syrian Pound, prices of many food items have surged, mainly those that
are directly imported, such as vegetable oil (up 10 percent m-o-m), rice (up 15 percent m-o-m), sugar (up 17
percent m-o-m) and wheat flour (up 8 percent m-o-m).
The national average price of diesel decreased by 13 percent, but increased by 42 percent from January
2019, reaching SYP 330/Lt. Idleb recorded the highest average at SYP 810/Lt, representing an increase of 14
percent m-o-m. Such increase is due to supply disruptions as many routes from north-east Syria are now
closed due to the Turkish ‘buffer zone’.
The national average informal exchange rate in January 2020 was SYP 1,028/USD (up 17 percent m-o-m),
while the official exchange rate between the Syrian Pound and the U.S. Dollar has remained unchanged at
SYP 434/USD since late 2017. The highest yearly increase in the informal exchange rate were observed in
Deir-ez-Zor and Tartous (up 123 percent and up 120 percent, respectively).
The national average non-skilled labour wage was relatively stable in between the last four months of 2019
and early 2020, reaching SYP 2,670/day in January (up 3 percent m-o-m); however, the wage rate was 27
percent above its y-o-y level. The January national average terms of trade (ToT) between wheat flour and
wage labour, decreased by 5 percent m-o-m and by 16 percent compared to January 2019, highlighting a
worsening purchasing power trend. The depreciation of the Syrian Pound caused an increase in the prices
of fodder, which, in turn, led to an increase in the national average price of a two-year old alive male sheep
(SYP 192,637/sheep in January 2020, up 11 percent m-o-m). The January 2020 ToT between an alive two-
year old male sheep and wheat flour was 486 kg/sheep (up 2 percent m-o-m), highlighting an improvement
in the exchange for livestock owners.
1 The standard food basket includes 28.46 Kg bread, 19 Kg rice, 19 Kg lentils, 5 Kg of sugar, and 7 L of vegetable oil 2 WFP Syria Price Bulletin, January 2020
Table 1: Food basket cost and changes, SYP
Source: WFP Syria Price Bulletin, January 2020

September 2019 – January 2020 Page 8
Regional Market Analysis

September 2019 – January 2020 Page 9
Regional Market Analysis
According to World Bank estimates, Iran’s economy is expected to contract by 8.7 percent in 2019/20 due to
external shocks to oil and gas sector output. Oil production kept decreasing throughout 2019, hitting an
average of 2.4 million barrels per day against 3.6 million in the year of 2018 (which represents a 34 percent
decline). U.S. sanctions were not limited to oil and gas sector, rather they included country’s
petrochemicals, metals, mining, and maritime sectors.
Unemployment rate reached 10.5 percent in September 20193; significant higher rates were recorded
among female workers compared their male counterpart (18.2 percent vs. 8.6 percent). Youth
unemployment rate was as high as 26.1 percent.
Sanctions, currency weakening, relatively high food imports reliance (one fifth of total merchandize imports
in 2017)4,and supply shocks following floods and earthquakes have altogether affected the cost of living in
Iran. In the last quarter of 2019, average annual inflation rate reached 34 percent, while average annual
food inflation rate stood at 30 percent.
Despite the decrease in annual inflation rates, the cost of living is still high, with positive annual total and
food inflation rates in January 2020 (at 26 and 24 percent, respectively). Reinstatement of U.S. sanctions on
Iran was placed in November 2019, leading to a higher base towards the end of 2018 and lower than
average annual inflation rates towards the end of 2019.
Figure 3: Annual inflation and annual food inflation rate, 2019-2020
Source: Iran statistics office and Bonbast
Monthly total inflation and monthly food inflation rates reached a minimum of 0.5 percent and -1.4 percent
in September 2019 following currency strengthening (IRR 115,000 per USD). However, both monthly
inflation rate and monthly food inflation rates increased in December 2019, reaching 3.2 percent and 4.1
percent, respectively. The weakening of the Riyal is the main driver of such increase.
3 Most recent data available 4 World Development Indicator, World Bank data
0
20
40
60
80
100
120
140
160
Annual inflation rate Annual food inflation rate
September 2019 – January 2020 Page 10
Regional Market Analysis

September 2019 – January 2020 Page 11
Regional Market Analysis
50,580
30,000
35,000
40,000
45,000
50,000
55,000
Jan Feb Mar Apr May Jun Jul Aug Sep Oct Nov Dec
2017 2018 2019 2020
Source: WFP SNAP
The crisis and the turmoil associated with it affected the economy of the country, particularly on the costs
of living. In January 2020, inflation rate measured through the CPI increased by 10.4 percent compared to
the same period in 2019 and by 7 percent compared to October 2019. In addition, January 2020 recorded
the highest inflation rate since August 2018. The average cost of the survival minimum food basket (SMEB)5,
has also increased since the beginning of the crisis in October 2019 (up 30 percent), reaching LBD 50,580.
Compared with January 2019, the cost of the food basket increased by 30 percent. Beirut, Mount Lebanon,
South and El Nabatieh, and are the
governorates recording the
highest cost of the SMEB in January
2020 (LBD 53, 743, LBD 52,897, LBD
51,268 and LBD 50,378,
respectively).
Government debt has increased by
3 percent in Q4, reaching LBP
121,434 billion in November 2019,
while revenues increased by 10
percent (from LBP 1,123,946 million
in September to LBP 1,253,225
million in October 2019). The crisis
did not significantly affect net trade
as both imports and exports increased by 5.8 percent between October and November 2019. Tourism
accounts for one of the sectors that suffered the most: despite H2 has always recorded a seasonal drop in
arrivals, this year the number of tourists fell by 33 percent – from 311,407 in October to 208,011 in
November 2019.
Over the years, Syrian refugees in
Lebanon have become more
vulnerable to monetary poverty,
which, according to the 2019 VASyr is
among the main drivers of food
insecurity. The proportion of Syrians
who cannot afford to buy a minimum
expenditure basket (MEB) –
corresponding to an expenditure of
USD 3.80 per day – has increased,
passing from 68 percent in 2018 to 73
percent in 2019. In addition, the
percentage of Syrian refugees who
cannot afford to buy the food basket
or survival minimum expenditure basket (SMEB) – that is spending less than US$ 2.90 a day – has increased
from 51 percent in 2018 to 55 percent in 2019.
5 The SMEB food basket is based on a monthly ration per person of 6 Kg of rice, 3.9 Kg of bulgur, 1.5 Kg of pasta, 1.5 Kg of
white beans, 1.5 Kg of sugar, 0.9 L of sunflower oil, 0.3 Kg of salt and 1.2 Kg of canned meat. See also Annex 3 of the
VASyR 2018
Figure 4: Average cost of the SMEB, 2017-2020
69%71%
75%
68%
73%
52% 53%
58%
51%
55%
40
50
60
70
80
2015 2016 2017 2018 2019
<MEB <SMEB
Figure 5: Households below S/MEB 2015-2019
Source: VASyr 2019
September 2019 – January 2020 Page 12
Regional Market Analysis

September 2019 – January 2020 Page 13
Regional Market Analysis
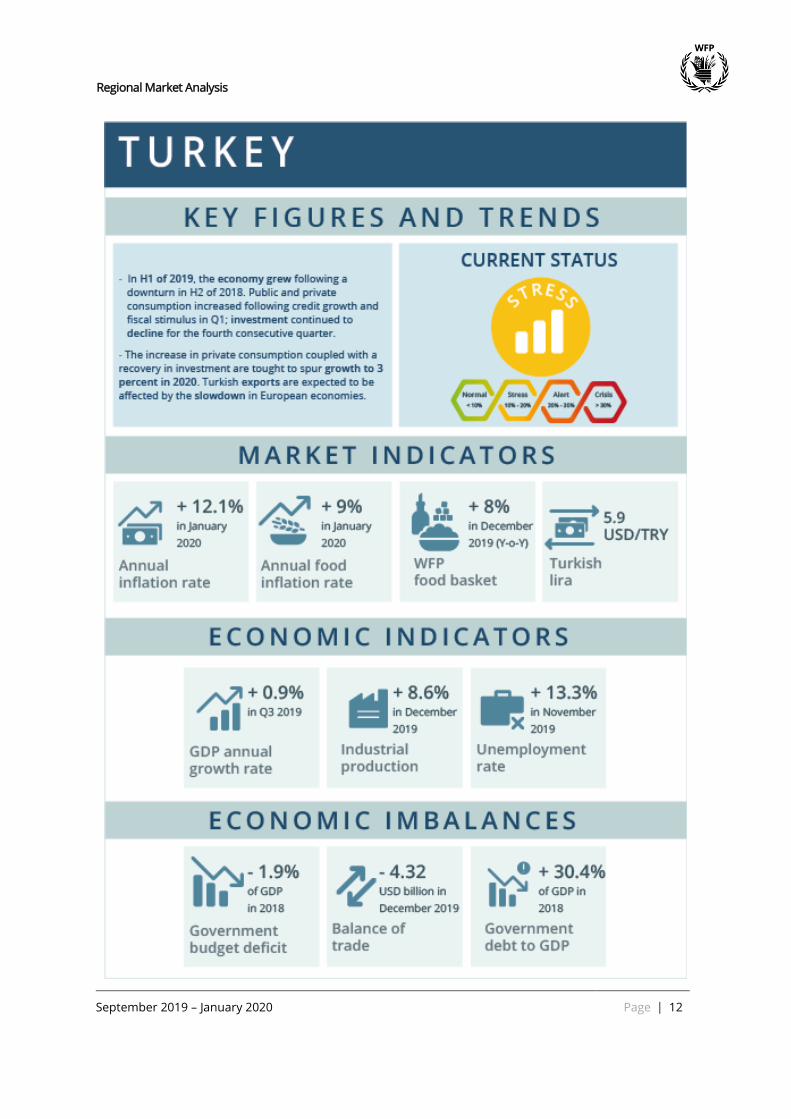
In third quarter of the year, the Turkish economy grew for the first time in 2019 (up 0.9 percent y-o-y),
rebounding from a revised 1.6 percent contraction in Q2 and compared with market expectations of 1
percent growth. Household consumption and a faster rise in government spending were the drivers of such
growth; fixed investment, conversely, contracted together with net external demand as exports increased
less than imports.
Trade deficit widened by 57.6 percent compared to last year, passing from USD 2.74 billion in December
2018 to USD 4.32 billion in December 2019. This is the largest trade gap since July 2018, which was mainly
driven by an increase in exports of manufactured products (accounting for 93 percent of total sales, which
went up 6.5 percent). Exports of agriculture, hunting and forestry went up by 4.4 percent, conversely,
mining and quarrying sales decreased by 9.9 percent. Compared with 2018, imports also increased (up 14.9
percent, corresponding to USD 19.02 billion). Purchases of intermediate goods – accounting for 75.4
percent of total imports – went up by 17.5 percent, followed by capital (up 7.3 percent) and consumption
goods (up 11.5 percent). Considering the full year 2019, the country's trade gap narrowed by 43.5 percent
to USD 31.17 billion.
Annual inflation rate increased to 12.1 percent in January from 11.84 percent in the previous month,
showing a steady increase that started in October 2019. On a monthly basis, consumer prices went up 1.35
percent in January 2020. The first month of the year, however, recorded a slight decrease in food inflation,
passing from 10.9 December 2019 to 9 percent in January 2020. In line with seasonal trends, the cost of the
food basket in Q4 was higher than the previous months, reaching its peak in December at TRY 190.27 – that
is a y-o-y increase by 8.3 percent.
Figure 6: Annual inflation rates (total and food), 2019-2020
Source: WFP SNAP and Turkish Statistical Institute
Unemployment rate increased to 13.3 percent in November 2019 from 12.3 percent in the same month of
the previous year. Job losses were recorded in agriculture, industry and construction sectors.
Government debt increased in Q4, reaching its all-time high in December (TRY 1,328,752 million).
Conversely, government revenues recorded a 12 percent m-o-m decrease between November and
December (from TRY 80,810,612 thousand to TRY 70,797,670 thousand). After a constant increase between
August and October (up 55 percent), remittances decreased by 31 percent in November to 13 USD million,
reaching the same amount of September.
0
5
10
15
20
25
30
35
Pe
rce
nta
ge
ch
an
ge
Annual inflation Annual Food inflation

September 2019 – January 2020 Page 14
Regional Market Analysis

September 2019 – January 2020 Page 15
Regional Market Analysis
Algeria’s economy remains highly dependent on hydrocarbons, and on global oil and gas prices. Due to oil
price volatility, the hydrocarbon sector continues to contract recording a decrease by 7.7 percent in Q1
2019 – corresponding to 1023 BBL/D/1k in March. Crude oil production remained stable between Q2 and
Q4 2019 (up 0.6 percent), reaching 1,021 BBL/D/1K in December 2019. The discovery of a new gas field in
May 20196, provides hope for a rebound in gas production and exports in the medium term, if the
hydrocarbon investment framework is conducive. The sluggish growth throughout 2019 has partially offset
the slight increase in nonhydrocarbon sector, which mainly consists of commercial services, industrial,
construction and public works, and agriculture sectors.
In the aftermath of the February elections, growth in the business environment remained uncertain due to
protests and corruption investigations. Political uncertainty has led to economic disruptions following
sudden changes in management and supervision, as well as investment uncertainty. As a result, GDP
growth was estimated to decelerate to 1.3 percent in 2019, compared to 1.5 percent in the previous year7.
The current account deficit is expected to widen to 8.1 percent of GDP, mainly on the back of a substantially
larger trade deficit (up 6.5 percent).
After a period of stability in 2018, annual inflation declined to 3.5 percent in March 2019 and reached 1.4
percent in January 2020. CPI averaged 176.36 points from 2008 until 2020, reaching its peak (222.30 points)
in October of 2019. In January 2020, the CPI was stable showing a 3.6 percent decrease over the previous
month. Cost of food in Algeria decreased 1 percent in January of 2020 over the same month in the previous
year.
Figure 7: Annual inflation rates (total and food), 2019-2020
Source: Office National des Statistiques (ONS)
According to the World Bank, the unavailability of recent data makes it impossible to estimate future
poverty trends. However, low rates of economic growth, persistently high unemployment and policy
uncertainty altogether account for factors, which may limit the country’s ability to reduce poverty.
6 Reuters, Algeria Discovers New Gas Field in Southwest, May 27th 2019 7 Algeria's Economic Update, October 2019
1.4%
-1%
-4
-3
-2
-1
0
1
2
3
4
Fe
b-1
9
Ma
r-1
9
Ap
r-1
9
Ma
y-1
9
Jun
-19
Jul-
19
Au
g-1
9
Se
p-1
9
Oct
-19
No
v-1
9
De
c-1
9
Jan
-20
Pe
rce
nta
ge
ch
an
ge
Annual Inflation Annual Food inflation

September 2019 – January 2020 Page 16
Regional Market Analysis

September 2019 – January 2020 Page 17
Regional Market Analysis
Source: National Statistical Service of the Republic of Armenia
0.2%
-1.8%-2
-1
0
1
2
3
4
5
6
Feb-19 Apr-19 Jun-19 Aug-19 Oct-19 Dec-19
Pe
rce
nta
ge
ch
an
ge
Annual Inflation Annual Food inflation
In the last quarter of 2019, GDP grew by 7.6 percent in Armenia. According to the World Bank Armenia
Monthly Economic Update issued in December 2019, most growth was recovered on the production side,
mainly in trade and services sector – 5.5 percentage points (pp) – and industry – that is manufacturing (1
pp), mining (0.6 pp) and construction (0.3 pp). On yearly basis, indeed, industrial production has increased
by 6.40 percent in December 2019 over the same month in the previous year. Net exports and capital
formation also positively contributed to growth (0.7 pp each) compensating for the decline in public
consumption.
Figure 8: Annual inflation rates (total and food), 2019-2020
Inflation started to
ease towards the
end of 2019 and kept
on decreasing in
January 2020 as
consumer prices fell
by 0.2 percent y-o-y,
with food, alcoholic
beverages, utilities,
transport and health
expenses equally
contributing to the
0.2 percent inflation.
Cost of food in
Armenia decreased by 1.8 percent in January of 2020 over the same month in the previous year. On a
monthly basis, consumer prices remained stable at up 1.3 percent. To bring inflation closer to its 4 percent
target, the Central Bank of Armenia lowered its interest rate in September 2019 to 5.50 percent; the
refinancing rate has been steady since then.
Imports growing strongly between September and December 2019 (from USD 519.2 million to USD 675
million), however they decreased by 54.8 percent in January 2020, following the enforcement of new
tariffs8. Exports also sharply decreased (from USD 244.5 million in September 2019 down to USD 173.8
million in January 2020); trade deficit shrank passing from USD 274.7 million in September to USD 131.4
million in January 2020. The Dram, which was remarkably stable since June 2019, was AMD 477.4 USD in
January 2020 (down 0.2 percent m-o-m); international reserves decreased to USD 2.7 billion in January
2020, after the all-time high of USD 2.8 billion in the previous month.
Government debt increased to AMD 3,352.7 billion in the third quarter of 2019 from AMD 3,300.20 billion in
the second quarter of 2019. Terms of trade9 have increased to 100.80 points in December 2019, from 93.80
points in the previous month.
Poverty rate declined from 25.7 percent in 2017 to 23.5 percent in 2018. The reduction was more
pronounced in rural areas and Yerevan, while in secondary cities the poverty rate has increased.
8 JAMnews New custom tariffs will leave Armenia facing less choice in consumption, January 4 2020 9 Terms of trade is the relationship between the prices at which a country sells its exports and the prices paid for its
imports. If the prices of a country’s exports rise relative to the prices of its imports, terms of trade have moved in a
favourable direction as the country receives more imports for each unit of goods exported.

September 2019 – January 2020 Page 18
Regional Market Analysis

September 2019 – January 2020 Page 19
Regional Market Analysis
In the first quarter (Q1) of the fiscal year 2019/202010, real GDP slightly increased to 5.6 percent against 5.3
percent in the corresponding period of the fiscal year 2018/2019. Private consumption alone constitutes
77.3 percent of total GDP, followed by investments at 18 percent. The former did not change while the
latter increased by 5.2 percentage points (an approximate increase of USD 1.99 billion).
Current account balance improved from a deficit of USD 2.01 billion in Q1 2018/2019 to a deficit of USD 1.4
billion in Q1 2019/2020. However, the current account balance deteriorated in Q1 2019/2020 over Q4
2018/2019, with a deficit increase of USD 294.5 million. Decrease in both petroleum exports by USD 606
million and remittances by USD 227 million were the factors behind the increase in the current account
deficit.
Total domestic public debt made 66.8 percent of GDP in September 2019 down from 73 percent in
September 2018. External debt increased to 34.4 percent of GDP in Q1 2019/2020 against 30.8 percent in
Q1 2018/2019. Net international reserves were stable throughout 2019 at USD 45.4 billion in December,
which represents 8.6 months of merchandize imports.
Annual inflation rates stood at 7.2 percent in January 2020 against 14.4 percent in January 2019. The below
figure shows a general decrease in both annual inflation and annual food inflation rates starting from June
2019. In January 2020, CPI increased by 0.7 percent against December 2019 despite the continuous
currency depreciation.
Figure 9: Annual Inflation rates and exchange rates, 2019-2020
Source: Central Bank of Egypt and FXTOP
The cost of the food basket11 monitored through WFP SNAP reflects the decrease in annual food inflation.
The average cost of the food basket decreased by 2.8 percent between September 2019 and January 2020
over the same period in 2018/2019. In January 2020, Garlic, potatoes, and tomatoes recorded the highest
annual price increase by 64, 64, and 26 percent respectively. Prices of other food commodities remained
either stable or witnessed a minor increase (less than 10 percent).
10 The first quarter is July - September 11 Food basket cost includes 1.5 Kg of lentils, 0.9 Kg of frozen chicken, 1.5 L of maize oil, 2 Kg of pasta, 2.3 Kg of rice, 1.4
Kg of sugar, 5 Kg of wheat flour, and 15 units of eggs
7.2%
1.8%
15.9%
15
15
16
16
17
17
18
18
19
-10
-5
0
5
10
15
20
US
D/E
GP
Pe
rca
nta
ge
ch
an
ge
Annual Inflation Rate Annual food Inflation Rate Exchange Rate

September 2019 – January 2020 Page 20
Regional Market Analysis

September 2019 – January 2020 Page 21
Regional Market Analysis
131
5.9
4.8
5.0
5.2
5.4
5.6
5.8
6.0
6.2
0
20
40
60
80
100
120
140
160
Jan Feb Mar Apr May Jun Jul Aug Sep Oct Nov Dec
US
D/T
RY
US
D/I
RR
Iran Turkey
In October 2019, the budget recorded a deficit of IQD 853 billion for the first time over the past three years.
Revenues increased by 1 percent from September 2019 to October 2019, while expenditures increased by
12 percent, largely offsetting the increase in revenues. Oil revenues represent 92 percent of total revenues;
and current expenditures make 87 percent of total expenditures. Employees’ compensation comprises 52
percent of current expenditures, followed by social welfare (23 percent) and subsidies (20 percent). Until
October 2019, expenditure on education and health combined represented 6.8 percent of total
expenditures.
In the last quarter of 2019, oil
production declined to 4.6
million barrels per day down
from 4.8 in the third quarter.
Throughout the full year
2019, oil production
increased by an average of
0.1 million barrels per day;
however, oil prices decreased
to USD 64 per barrel in 2019
compared to USD 68 in 2018.
GDP contracted by 1 percent
in 2018 over 2017;
unemployment rate was as
high was 14 percent in
201712, given the highly
dependence on oil sector,
which is capital intensive.
The country recorded low
inflation rates (0.1 percent in
December 2019). Currency
depreciation of both Turkish
Lira and Iranian Riyal played
a significant role, allowing for
cheaper access to imports
and keeping inflation stable
in the country. Turkey and
Iran are main trading
partners and exporters to
Iraq with 17 and 16 percent
respectively of total Iraq’s
imports. In October 2019,
protests broke out in the
country. The ongoing protests are likely to have an impact the economy both at the micro and
macroeconomic level.
12 Most recent data available
4.45
4.55
4.68
52
6864
0
10
20
30
40
50
60
70
80
4.2
4.3
4.4
4.5
4.6
4.7
4.8
Q1
Q2
Q3
Q4
To
tal
Q1
Q2
Q3
Q4
To
tal
Q1
Q2
Q3
Q4
To
tal
2017 2018 2019U
SD
pe
r b
arr
el
Mil
lio
n b
arr
els
pe
r d
ay
Oil Production Oil prices
Source: OPEC
Figure 11: Oil production and prices by quarter
Figure 10: Exchange rate of Turkey and Iran against USD, 2019
Source: FXTOP

September 2019 – January 2020 Page 22
Regional Market Analysis

September 2019 – January 2020 Page 23
Regional Market Analysis
Figure 12: Consumer Price Index per month in 2018 and 2019
125
126
118
120
122
124
126
128
Jan Feb Mar Apr May Jun Jul Aug Sep Oct Nov Dec
2018 2019
Real GDP slightly grew by 1.9 percent during the first three quarters of 2019, against 2.0 percent during the
same period of 2018. Increase in total exports (8.6 percent) and decrease in total imports (5.5 percent)
narrowed the trade deficit by 14.1 percent to reach JOD 6.4 billion in the first ten months of 2019. Total
workers’ remittances receipts increased by 1.4 percent for the first eleven months of 2019 compared to the
same period of 2018. Accordingly, current account deficit decreased to JOD 0.77 billion (3.4 percent of GDP)
during the first three quarters of 2019 compared to a deficit of JOD 2.04 billion (9.3 percent of GDP) during
the same period of 2018.
The general budget recorded an overall fiscal deficit of JOD 1.13 billion (-4.4 percent of GDP) during the ten
months of 2019, compared to a deficit of JOD 0.86 billion (-3.4 percent of GDP) during the same period in
2018. Revenues from foreign grants decreased by 21 percent, and current expenditures went up by 6
percent. Compensation of employees represent one fifth of total expenditures.
At the end of October 2019, gross outstanding public debt (domestic and external) rose by JOD 1.9 billion to
reach JOD 30 billion, which represents a threatening 96.9 percent of GDP. Compared with the same period
in 2018, the size of the outstanding public debt has increased by 2 percent – as it was standing at JOD 28
billion (94.4 percent of GDP). Gross foreign reserves (including gold and Special Drawing Rights) amounted
to USD 13.8 billion at the end of November 2019, 7 percent higher than November 2018. This level of
reserves covers around 7.4 months of the Kingdom's imports of goods and services.
In the third quarter of 2019, Jordan recorded high levels of unemployment rate (19.1 percent) compared to
18.6 percent in the corresponding period in 2018. Unemployment among females is higher than among
males (27.5 percent versus 17.1 percent). Youth unemployment reached 49.9 percent for the category 15-
19 years old, and 38.7 percent for the category 20-24 years old.
There were no significant fluctuations for the consumer price index (CPI) over the 12 months of 2018 and
2019, which confirms a relative price stability in the country.
In January 2020, prices remained stable with a 1 percent annual increase in the food basket cost.
Cucumbers, bananas, and Garlic witnessed highest price increase at 88, 38, and 28 percent respectively,
however, the price increases in values range between 0.3 to 0.5 Jordanian Dinar only.
Source: Central Bank of Jordan

September 2019 – January 2020 Page 24
Regional Market Analysis

September 2019 – January 2020 Page 25
Regional Market Analysis
GDP growth rates recorded 4.5 percent in 2019 compared to 3.8 percent in 2018. Construction, financial
and insurance sectors witnessed highest yearly increase at 12 percent each. Manufacturing, which
represents 14 percent of GDP, increased by 4 percent. Trade balance improved from a deficit of USD 3.4
billion in 2018 to a deficit of USD 2.9 billion in 2019. Improvements in trade balance are linked to higher
total exports (6 percent) – mainly gold– and lower total imports (7 percent).
Net flow of remittances declined by 14 percent to reach USD 1.9 billion in 2019 and on the contrary, gross
international reserves rose by 19 percent in 2019 at USD 2.4 billion. Unemployment rates kept decreasing
over the past decade reaching 6.2 percent in 2019. At the same time, monthly wages13 increased by 9
percent in November 2019 over November 2018.
Budget deficit has been shrinking over the past 4 years from a deficit of KGS 20.9 billion in 2016 to KGS 0.4
billion SOMs in 2019 thanks to the increase in government revenues. Taxes are the main source of
revenues, accounting for 73 percent of total revenues.
Figure 13: Fiscal budget, in billion KGS
Source: National Statistical Committee of the Kyrgyz Republic
Annual inflation rates kept increasing over the past five months, though low, recording 3.2 percent in
January 2020. Increasing inflation rates are driven by food inflation, which increased by 6.2 percent. In
January 2020. Price of fruits, vegetables, and bakery products increased annually by 22, 8, and 9 percent
respectively. Apples experienced the highest annual increase (at 37 percent), followed by buckwheat grits
(at 32 percent) and potatoes (at 30 percent). Wheat flour – a key food staple for the caloric intake –
increased annually by 17 percent.
Upward prices of wheat flour are justified by the increase in prices from wheat imported from Kazakhstan –
that is the main wheat exporter to Kyrgyz Republic. According to FAO GIEWS, Kazakhstani export wheat
prices14 went up from USD 205 per tonne in August 2019 to USD 228 per tonne in January 2020.
13 Monthly wages are the average wages of employees by type of economic activity sourced from Kyrgyz statistics center. 14 International prices, wheat milling (d.a.p Saryagash station)
0
5
10
15
20
25
0
20
40
60
80
100
120
140
160
180
2016 2017 2018 2019
Renevnues Expenditures Budget deficit
September 2019 – January 2020 Page 26
Regional Market Analysis

September 2019 – January 2020 Page 27
Regional Market Analysis
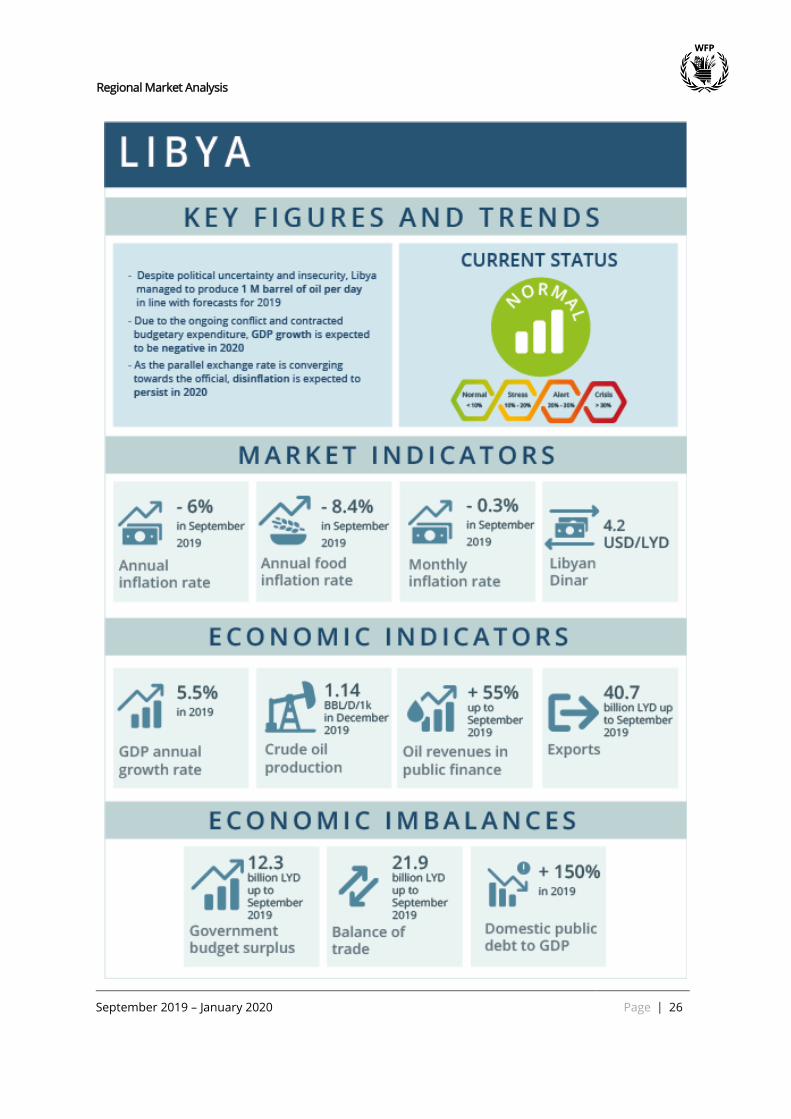
According to World Bank estimates, the ongoing conflict around Tripoli resulted into an expected slowdown
in GDP growth (from an average of 17.3 percent in 2017 and 2018 down to 5.5 percent in 2019). Steady oil
production had, however, a positive impact on GDP. According to the OPEC monthly market report, the
country produced 1.14 million barrels per day in December 2019, up from 0.93 million barrels in December
2018.
In the first three quarters of 2019, the government kept recording budget surplus attributed to oil revenues
(accounting for 55 percent of total government revenues) and tax revenues on sales of foreign currencies
(representing 41 percent of total government revenues). Government salaries also contributed (with 54
percent of total expenditures), followed by administrative expense (20 percent) and subsidies (18 percent).
Annual Inflation rate decreased by 6 percent and annual food inflation rate decreased by 8.4 percent in
September 201915. Both total and food monthly inflation rates declined (by 0.3 and 0.4 percent
respectively). The strengthening of Libyan Dinar against USD (from LYD 6.1 per USD in September 2018 to
LYD 4.3 per USD in September 2019) might be the main driver of the decline in annual inflation rates and
stable monthly inflation rates.
The national average food basket decreased by 15 percent in January 2020 compared with the same period
in 2019. In addition, the average cost of the food basket for the reporting period between September 2019
to January 2020 was 17 percent lower compared to the corresponding period in 2018/2019. In terms of
food prices, all monitored food commodities recorded lower prices in January 2020 over January 2019
except for potatoes (up 53 percent), onions (28 percent), and lamb meat (6 percent).
Figure 14: Average cost of the food basket by governorate, September 2019 - January 2020
Source: WFP SNAP
The southern region (namely the mantikas of Ubari, Murzuq, and Ghat) kept recorded the most expensive
food basket during the reporting period between September 2019 and January 2020, higher than the
national average by 34, 33, and 32 percent respectively. Security and border constraints, food supply
shortages, and recent intensifying clashes and airstrikes in Murzuq are the driving factors of higher prices in
the southern region.
15 Most recent data available
National average
0
100
200
300
400
500
600
700
800
900
1000
Ub
ari
Mu
rzu
q
Gh
at
Alju
fra
Na
lut
Alk
ufr
a
Wa
di A
shsh
ati
Se
bh
a
Al Ja
ba
l A
l G
ha
rbi
Tri
po
li
Alm
arg
eb
Sir
t
Mis
rata
To
bru
k
Be
ng
ha
zi
De
rna
Alm
arj
Ejd
ab
ia
Al Ja
ba
l A
l A
kh
da
r
Aljfa
ra
Azz
aw
ya
Zw
ara
LY
D

September 2019 – January 2020 Page 28
Regional Market Analysis

September 2019 – January 2020 Page 29
Regional Market Analysis
In early 2019, the Government of Israel (GoI) started making deductions of nearly USD 12 million per month
from the tax revenues it collects on behalf of the Palestinian Authorities. Tax revenues represented 70.3
percent of total government revenues and 29 percent of GDP in 201816.
Accordingly, GDP growth rate was capped at 1.9 percent in the first three quarters of 2019. Unemployment
rate was as high as 24.6 percent in the third quarter of 2019; 45.1 percent in Gaza Strip and 13.3 percent in
West Bank.
Trade and services balance recorded a deficit of USD 4.1 – 4 percent higher than the corresponding period
of 2018. In the same period, services balance also saw a deficit (0.8 billion, up 5 percent y-o-y). Gross
external debt increased by 14 percent in the third quarter of 2019 over the same period in 2018 to reach
USD 1.84 billion.
In terms costs of living, annual inflation rate was low (1.3 percent), while monthly inflation rate decreased
by 0.32 percent in January 2020. General price level was higher in West bank than Gaza strip as annual
inflation rate in the former recorded 1.26 percent, whereas it stood at 0.02 in the latter.
In January 2020, the food basket cost17 did not change over the same month of the previous year. The price
of bread – the main component of the food basket – increased by a minimum of 0.9 percent y-o-y.
Cucumbers (up 52 percent), Bananas (up 10 percent) witnessed the highest annual increases in January
2020. Wheat flour and chicken prices increased by 5.5 and 5 percent respectively. Fuel (petrol-gasoline)
prices rose by 8 percent from ILS 5.67 to ILS 6.12.
Figure 15: Cost of the food basket by governorate, January 2020
Source: WFP SNAP
At the governorate level, Ramallah followed by Jericho and Qalqiliya recorded the most expensive food
basket (higher than the average by 13.2, 13, and 9 percent, respectively). North and South Gaza had the
least expensive food basket costs (lower than the average by 30 and 28 percent, respectively).
16 Most recent data available. Please refer to Press Report - Preliminary Estimates of Quarterly National Accounts (Third
Quarter 2019) and Press Release on the General Government Finance 2018, issued by the Palestinian Central Bureau of
Statistics 17 The food basket consists of 9 Kg of bread, 0.45 Kg of chickpeas, 0.3 Kg of lentils, 0.45 L of maize oil, and 0.15 Kg of salt
National average
0
5
10
15
20
25
30
35
40
45
50
ILS

September 2019 – January 2020 Page 30
Regional Market Analysis

September 2019 – January 2020 Page 31
Regional Market Analysis
0
2
4
6
8
10
12
14
16
200
400
600
800
1,000
1,200
1,400
1,600
1,800
Feb Mar Apr May Jun Jul Aug Sep Oct Nov Dec
Pe
rce
nta
ge
ch
an
ge
TJS
Food basket Annual inflation Annual food inflation
Source: WFP SNAP and National Bank of Tajikistan
Figure 16: Figure 19: Monthly national food basket cost and annual
inflation rates
Similar to the growth rates of 7.1 and 7.3 percent recorded in 2017 and 2018, real GDP growth rate
continued in 2019, remaining robust at 7.2 percent y-o-y in the first nine months of 2019. According to the
Fall 2019 Country Economic Update issued by the World Bank, industry (up 12.7 percent), services (up 9.6
percent) and agriculture (up 7.1 percent) are the main drivers of growth.
After a steady reduction between July and October 2019, Tajikistan recorded a trade deficit of 184.70 USD
million in November (down 55 percent than the previous month), reflecting lower export earnings from
minerals, textile production and cotton. Towards the end of 2019, the country recorded a substantial
decrease in exports (from USD 193 million in October to USD 110.70 million in November), and imports
(from USD 312.4 million in October to USD 295.4 million in November).
Spurred by a sharp increase in food prices, inflation intensified in 2019 following a period of relative ease in
the previous year. Despite annual inflation rate recorded its lowest yearly value in October (7.3 percent),
inflationary pressure increased, by reaching 8 percent in December. Food prices went steadily down
between the peak in July (14.7 percent) and October (9.8 percent); however, they started to raise towards
the end of the year (up 10.6 percent in November). The measures imposed by the government to offset
price increase (that is price controls on beef, released stocks from the state reserves, and granted tax
exemptions to beef importers) had a modest effect as the cost of the food basked18 remained almost
unchanged since June.
In line with the fiscal consolidation
push launched in 2018 – when fiscal
deficit fell to 2.7 percent of GDP
from 6.7 percent in 2017 – the
Tajikistani government managed to
keep its budget deficit to
approximately 2.8 percent of GDP in
the nine months of 2019. Pubic
investment, however, had already
reached 80 percent in this 9 month-
window, suggesting that spending
was likely to intensify in Q4, with a
consequent increase in the fiscal
deficit to 3.5 percent of GDP in full-
year 2019.
The current account deficit for the full year 2019 is forecasted to be at approximately 5 percent of GDP,
showing no significant change from the deficit recorded in 2018 (5.1 percent of GDP). Between January and
June, international reserves increased passing from USD 56 million to around USD 1.3 billion; which is the
equivalent of 5.1 months of import cover.
Unemployment rate remained unchanged at 2.10 percent since September. Wages remained stable,
showing a 2.4 percent increase between September and November.
18 The food basket consists of 17.7 Kg of onions, 23.2 Kg of potatoes, 17.7 Kg of cabbage, 8.8 Kg of carrots, 1.4 Kg of
chicken, 2.8 Kg of beef, 2.8 Kg of mutton, 30.2 L of milk, 8.3 L of cotton oil, 6.2 Kg of beans, 6.2 Kg of dry peas, 12.4 Kg of
rice, 33.1 Kg of wheat flour, 165 g of bread, 4.2 pcs of eggs, 6.7 Kg of sugar, 1.8 Kg of salt, 0.22 Kg of green tea.
September 2019 – January 2020 Page 32
Regional Market Analysis

September 2019 – January 2020 Page 33
Regional Market Analysis
Source: National Institute of Statistics (INS)
Source: World Bank
2%
3%
4%
5%
6%
7%
8%
9%
Infl
ati
on
ra
te
Annual inflation Annual food inflation
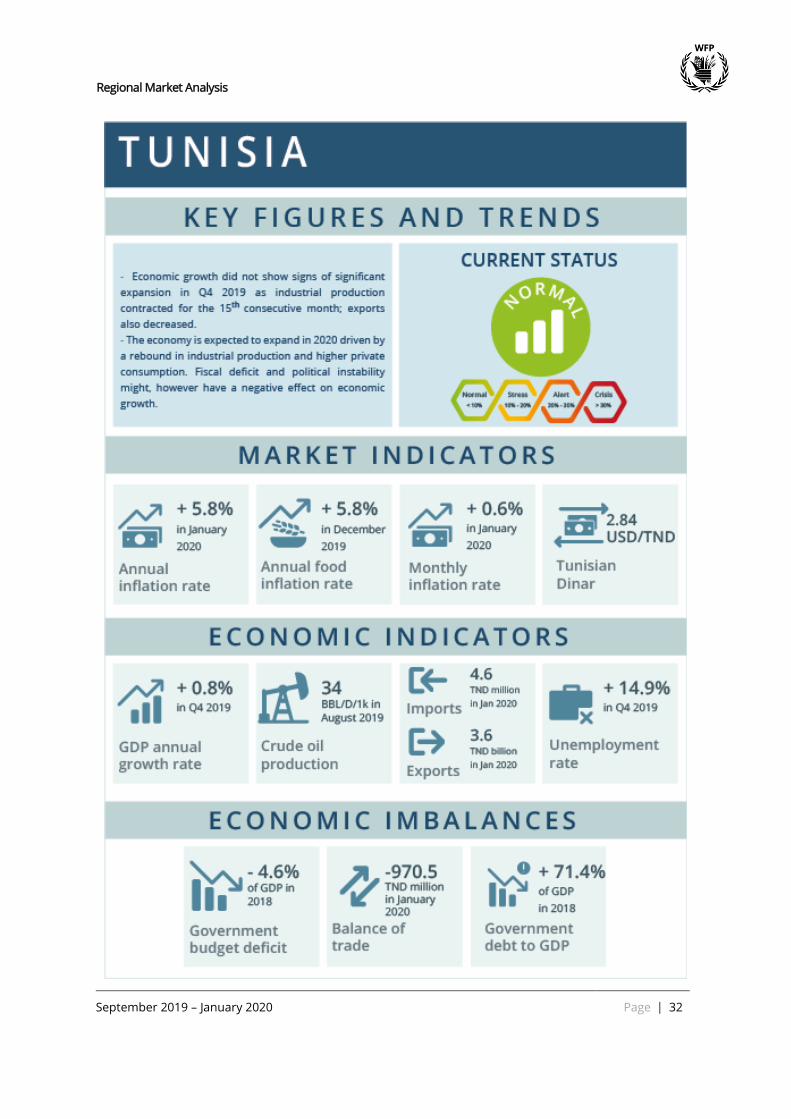
After two years of economic growth at 2 percent in 2017 and 2.5 in 2018, Tunisia recorded a slowdown in
the first half of 2019 (1.1 percent). The relative growth in the service sector, indeed, could not compensate
the contraction in agriculture and industry. To halt the acceleration in inflation – which characterized the
period between 2017 and mid-2018 –, the Central Bank tightened its monetary policy by increasing the
policy rate to 7.5 percent, by enforcing tighter loan-to-deposit ratios and by reducing liquidity injections
through FX swaps. As a result, inflation slowed down reaching 5.8 percent in January 2020.
Figure 17: Annual inflation rates (total and food), 2019-2020
Annual food inflation also went
down in Q4 2019, passing from 7.3
percent in September to 5.8
percent in December. Considering
the recent monetary policy, the cost
of the food basket19 for Q4 2019 is
expected to follow the inflation
patterns, showing a decrease
between November and December.
The eight months of 2019 recorded
a simultaneous increase in
government expenditure and
revenues, widening the fiscal deficit
to TND 3.3 billion. In January 2020,
the country recorded a trade deficit
of TND 970.5 million.
Unemployment rate remains high at
14.9 percent in the last quarter of
2019.
According to the latest World Bank
Tunisia's Economic Update, the share
of Tunisians living below the middle-
income poverty line of USD 3.2 (2011
PPP USD) fell from 9.09 percent in
2010 to 3.21 percent in 2015.
However, the pace of poverty
reduction, is expected to reduce
between 2016 and 2020, following the
GDP per capita trend, while extreme
poverty – that is those living on less
than USD1.90, 2011 PPP USD) – seems
on the way to being eradicated.
19 The food basket consists of 15.05 Kg of couscous, 0.28 kg of chickpeas, 5.5 kg of tomatoes, 1.32 kg of sugar, 2.48 kg of
chicken, 1.63 kg of potatoes, 7.92 L of milk
Figure 18: Actual and projected poverty rates and real GDP per capita

September 2019 – January 2020 Page 34
Regional Market Analysis
September 2019 – January 2020 Page 35
Regional Market Analysis
Source: WFP SNAP and WFP Dataviz
0
100
200
300
400
500
600
700
800
0
1,000
2,000
3,000
4,000
5,000
6,000
Jan Feb Mar Apr May Jun Jul Aug Sep Oct Nov Dec
US
D/Y
ER
in Y
ER
Food basket 2018 Food basket 2019
Food basket 2020 Exchange rate (RHS) 2018
Exchange rate (RHS) 2019 Exchange rate (RHS) 2020
Since late 2018 Yemen’s economy began to show signs of stabilization, supported by balance of payments
assistance from the Kingdom of Saudi Arabia and a gradual recovery of oil and gas production. According to
the World Bank Yemen's Economic Update released in October 2019, the output contraction that
characterized the period 2014-17 halted in 2018 as GDP has shown signs of positive growth. However, oil
production remains significantly below the pre-conflict levels and many Yemenis still cannot rely on any
regular source of income as protracted hostilities and widespread destruction of infrastructure keep on
disrupting economic activity.
The year 2019 also witnessed progresses in fiscal management: for the first time since 2014, the
government prepared a budget and committed to resume pension and salary payments to all civil servants.
This could potentially be a pivotal measure to restore household purchasing power, ease liquidity crisis and
reduce inflationary pressures. Thanks to the USD 2 billion Saudi Arabian deposit, oil grant, and increasing
oil export receipts, surging inflation was curtailed, by allowing the Central Bank of Yemen (CBY) to supply
foreign currency to finance essential imports. Increased foreign reserves have also helped to stabilize the
exchange rate, which depreciated by 3.9 percent in December 2019 to reach 589 YER/USD. The CBY’s new
measure to offer subsidized exchange rate for essential food imports has also helped to stabilize the
exchange rate.
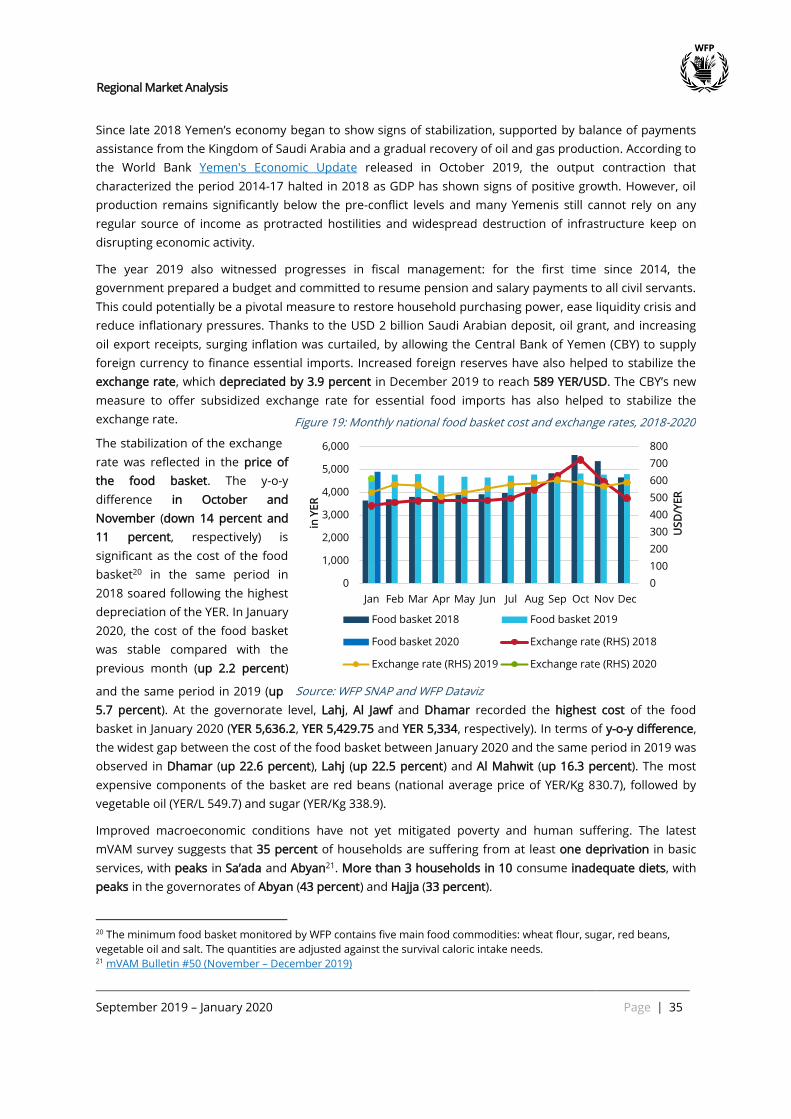
The stabilization of the exchange
rate was reflected in the price of
the food basket. The y-o-y
difference in October and
November (down 14 percent and
11 percent, respectively) is
significant as the cost of the food
basket20 in the same period in
2018 soared following the highest
depreciation of the YER. In January
2020, the cost of the food basket
was stable compared with the
previous month (up 2.2 percent)
and the same period in 2019 (up
5.7 percent). At the governorate level, Lahj, Al Jawf and Dhamar recorded the highest cost of the food
basket in January 2020 (YER 5,636.2, YER 5,429.75 and YER 5,334, respectively). In terms of y-o-y difference,
the widest gap between the cost of the food basket between January 2020 and the same period in 2019 was
observed in Dhamar (up 22.6 percent), Lahj (up 22.5 percent) and Al Mahwit (up 16.3 percent). The most
expensive components of the basket are red beans (national average price of YER/Kg 830.7), followed by
vegetable oil (YER/L 549.7) and sugar (YER/Kg 338.9).
Improved macroeconomic conditions have not yet mitigated poverty and human suffering. The latest
mVAM survey suggests that 35 percent of households are suffering from at least one deprivation in basic
services, with peaks in Sa’ada and Abyan21. More than 3 households in 10 consume inadequate diets, with
peaks in the governorates of Abyan (43 percent) and Hajja (33 percent).
20 The minimum food basket monitored by WFP contains five main food commodities: wheat flour, sugar, red beans,
vegetable oil and salt. The quantities are adjusted against the survival caloric intake needs. 21 mVAM Bulletin #50 (November – December 2019)
Figure 19: Monthly national food basket cost and exchange rates, 2018-2020

September 2019 – January 2020 Page 36
Regional Market Analysis
List of Abbreviations
CBY Central Bank of Yemen
CPI Consumer Price Index
GIEWS Global Information and Early Warning System
M-O-M Month over month
OPEC Organization of the Petroleum Exporting Countries
MEB Minimum expenditure basket
SMEB Survival minimum expenditure basket
SNAP Safety Nets Alet Platform
ToT Terms of trade
VASyr Vunlerability Assessment of Syrian Refugees
WFP World Food Programme
Y-O-Y Year over year
Overview about the covered indicators
Economic indicators:
• Gross Domestic Product (GDP) growth rates
• Budget deficit
• Government debt
• Trade balance
• Industrial and agricultural production indices.
Socio-economic indicators:
• Unemployment rates, which considers labour force between the age of 15 and 64 years old
• Youth unemployment rates, which covers labour force between 15-24 years old.
Market indicators:
• Inflation rates, which represent percentage change in Consumer Price Index (CPI). This report
covers both total and food inflation rates; changes in prices of different food commodities are
calculated through WFP SNAP platform
• Exchange rate, which is a very important indicator in terms of its effect on inflation rates and
purchasing power of households. A depreciation in the currency leads to higher import costs
translated into higher inflation rates affecting mainly net importing countries.
The economic indicators described in this report provide a snapshot of the economy of a country and,
eventually, of the wellbeing of its population. When the GDP growth rates decreases, unemployment rates,
budget deficit, government debt and inflation rates increase while trade deficit widens. All this affects the
wellbeing of the society, mainly the most vulnerable segments of the population.
September 2019 – January 2020 Page 37
Regional Market Analysis
For further information, please contact:
Siddharth Krishnaswamy Omneya Mansour Cinzia Monetta
Head of Programme and Measurement a.i. Economic and Market Analyst Market and Food Security Analyst