Strategic Leadership - Florida Hospital Leadership Institute
Upload
wilma-mathisCategory
view
24download
0description

Regional Leadership Institute
September 10, 2014
1. Examine the Data for Education in Georgia
2. Economic Impact of Georgia Non-
Graduates
3. Strengthening the Birth to Work Pipeline
4. What Can We Do?

Examine the Data for Education in Georgia

Academic Achievement Milestones
School Readiness
Literacy by 3rd Grade
Numeracy by 8th Grade
High School Graduation
Workforce and/or College Ready

School ReadinessPercent of Children with School Readiness Skills
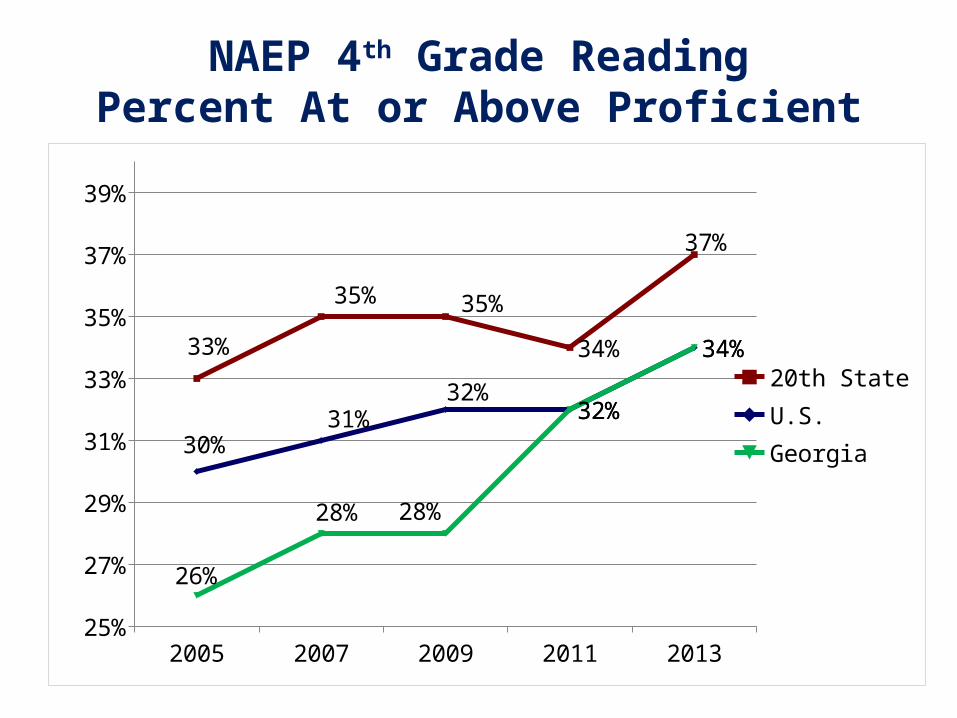
NAEP 4th Grade ReadingPercent At or Above Proficient
2005 2007 2009 2011 201325%
27%
29%
31%
33%
35%
37%
39%
33%
35% 35%
34%
37%
30%31%
32%32%
34%
26%
28% 28%
32%
34%
20th StateU.S.Georgia

2005 2007 2009 2011 201320%
22%
24%
26%
28%
30%
32%
34%
36%
38%
40%
31%
35%36% 37% 37%
29%
31%
33%
34% 34%
23%
25%
27%
28%29%
20th StateU.S.Georgia
NAEP 8th Grade MathPercent At or Above Proficient

Georgia High School Graduation Rates
Source: The Governor’s Office of Student Achievement, State Report Cards.
Year Fayette County
Clayton County
State High School
Graduation Rate
2011 78% 52% 67%
2012 86% 54% 69%
2013 87% 56% 71%
StatewideHigh School Drop-
Outs
21,844
22,155
21,401
65,400

Economic Impact of Georgia Non-Graduates

Education Pays
Source: *U.S. Bureau of Labor Statistics Table A-4. Employment status of the civilian population 25 years and over by educational attainment.
**U.S. Bureau of Labor Statistics Table 5. Quartiles of usual weekly earnings of full-time wage and salary workers.
EDUCATIONAL ATTAINMENT & EMPLOYMENT
Unemployment Rate* July 2014
Median Wkly Earnings** (& approx.
annual)
15% 10% 5% 0% 0 200 600 1000
3.1 Bachelor’s Degree & Higher $1,189 ($61,828)
5.3 Some college/ Associate Degree $741 ($38,523)
6.1 HS Graduates, No College
$651 ($33,852)
9.6 Less than a High School Diploma
$457 ($23,764)
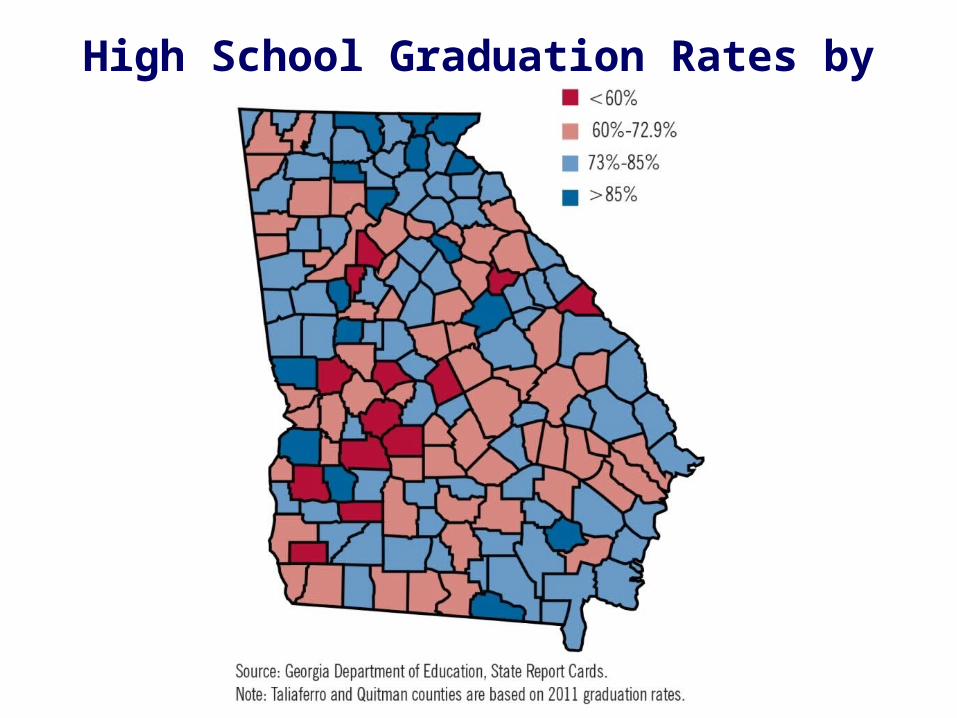
High School Graduation Rates by County

Unemployment Rate by County

Compounded Impacts of High School Non-Completion
Source: Levin, H., et al., (2007). The Costs and Benefits of an Excellent Education for All of America’s Children.
INDIVIDUALS THE COMMUNITY
Lower Lifetime Earnings Reduced buying power & tax revenues; less economic growth
Decreased health status; Higher mortality rates; More criminal activity
Higher health care & criminal justice costs
Higher teen pregnancy rates; Single motherhood
Higher public services costs
Less voting; Less volunteeringLow rate of community involvement
Strengthening the Birth to Work Pipeline

Strengthening the Birth to Work Pipeline
KEY ISSUE
#1Early Life Experiences
KEY ISSUE
#2Academic Achievement K-12
KEY ISSUE
#3Transitions to Work or College

0
200
400
600
800
1000
1200
9 12 15 18 21 24 27 30 33 36
Age of child in months
Voc
abu
lary
Siz
eDisparities in Early Vocabulary Growth
Source: Hart, B. and Risley, T. R. (2003). “The Early Catastrophe: The 30 Million Word Gap by Age 3.”
Professional Families 1,116 words
Working Class Families 749 words
Welfare Families 525 words

Economic Benefits of Early Education:Perry Preschool Study
Source: Schweinhart, L.J., et al. (2005). Lifetime effects: The High/Scope Perry Preschool study through age 40.
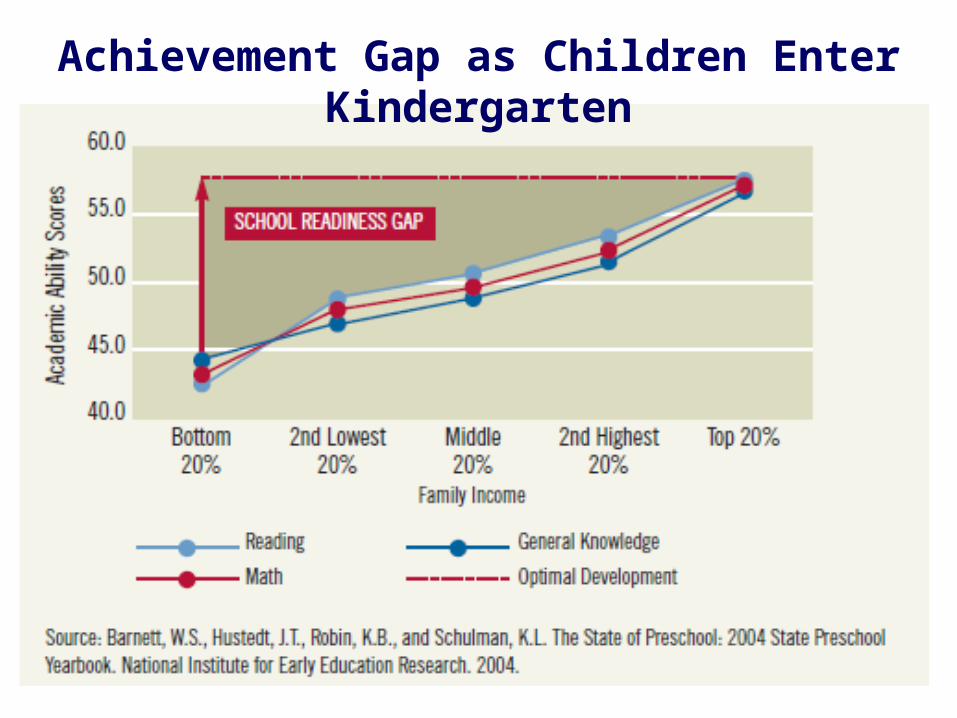
Achievement Gap as Children Enter Kindergarten
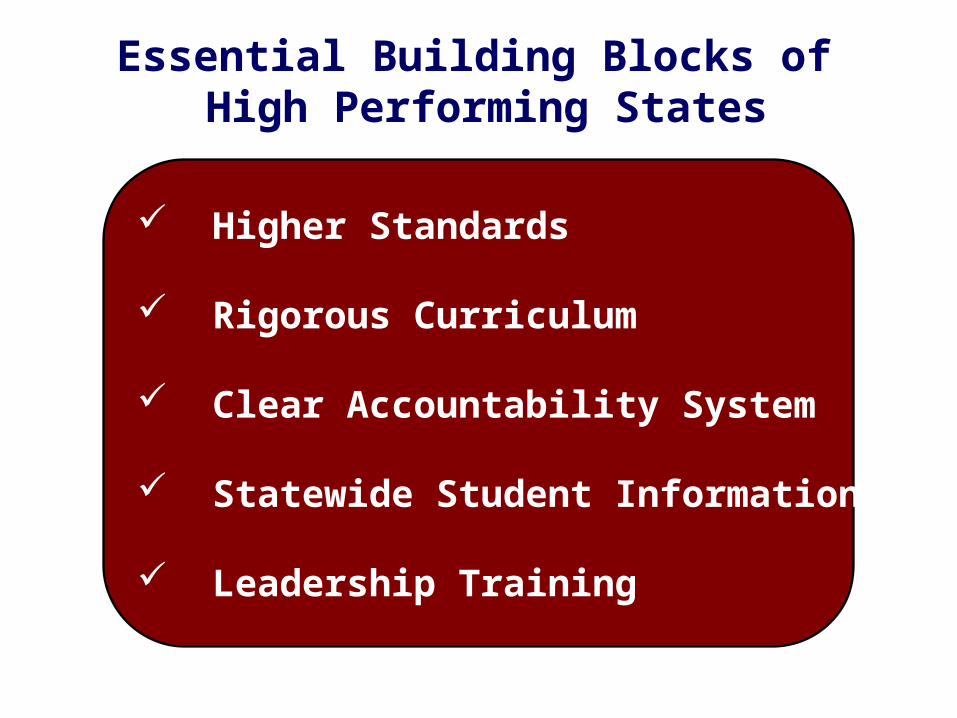
Essential Building Blocks of High Performing States
Higher Standards
Rigorous Curriculum
Clear Accountability System
Statewide Student Information System
Leadership Training
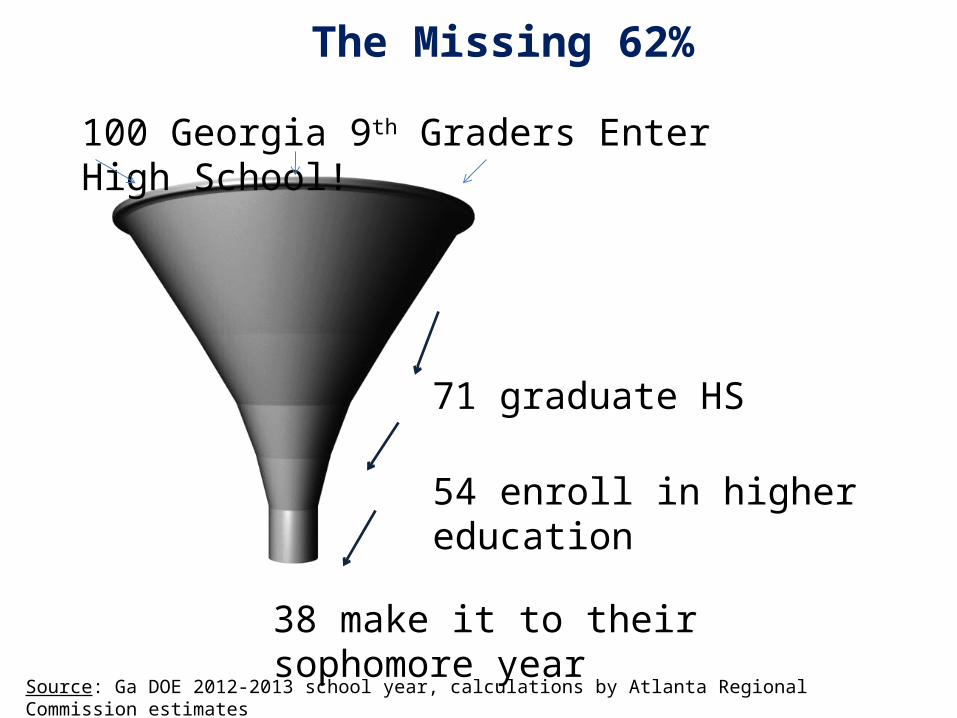
The Missing 62%
100 Georgia 9th Graders Enter High School!
71 graduate HS
54 enroll in higher education
38 make it to their sophomore year
Source: Ga DOE 2012-2013 school year, calculations by Atlanta Regional Commission estimates

The Changing Face of Georgia
Series1
0% 10% 20% 30% 40% 50% 60%
White 8%
All 16%
African-American 20%
Living in poverty 38%
Asian 45%
Hispanic 49%
2001-2010: Percent Population Increase
Source: U.S Census Data

4-Year Graduation Rate, 2013
Georgia
Not Low-Income 79%
All Students 71%
Low-Income 63%
English Language Learners 43%
Source: The Governor’s Office of Student Achievement, State Report Cards.
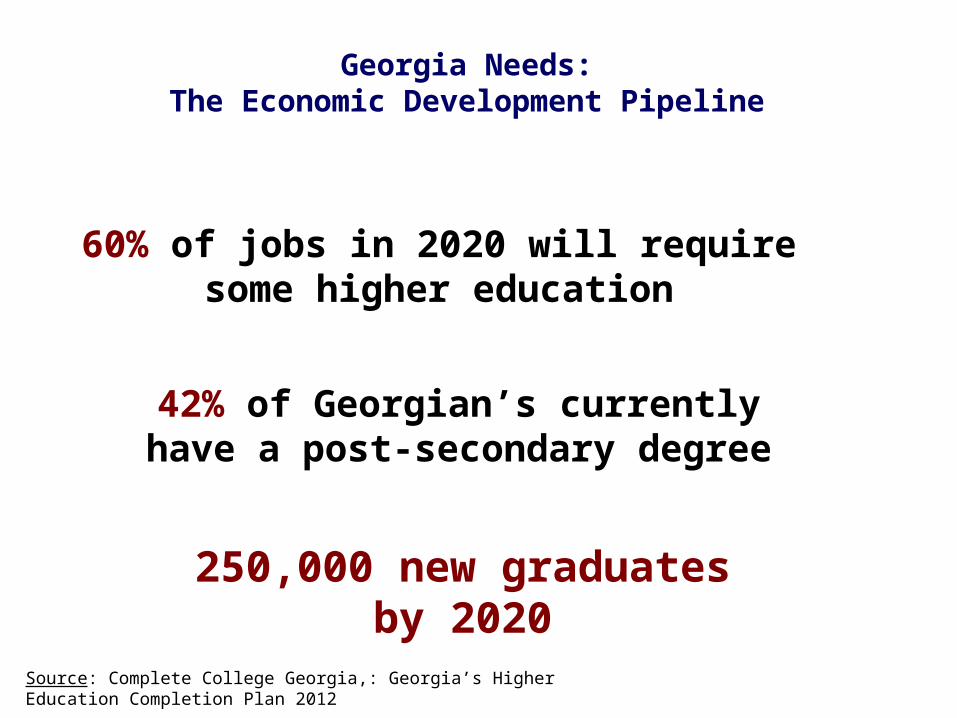
Georgia Needs:The Economic Development Pipeline
250,000 new graduates by 2020
60% of jobs in 2020 will require some higher education
42% of Georgian’s currently have a post-secondary degree
Source: Complete College Georgia,: Georgia’s Higher Education Completion Plan 2012
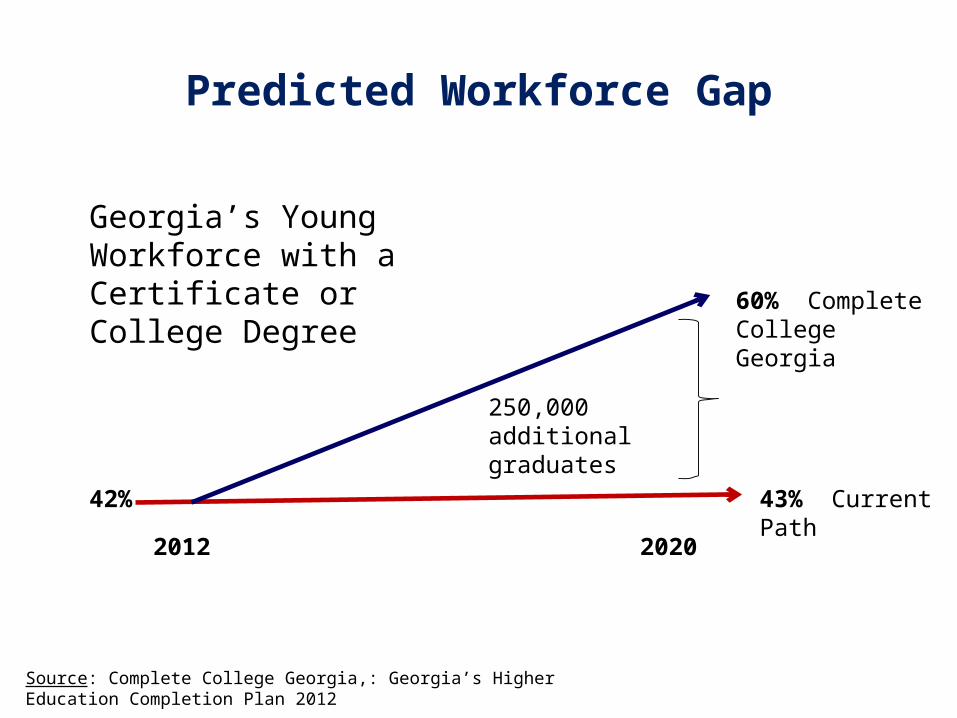
Predicted Workforce Gap
Source: Complete College Georgia,: Georgia’s Higher Education Completion Plan 2012
42%
2012 2020
43% Current Path
60% Complete College Georgia
250,000 additional graduates
Georgia’s Young Workforce with a Certificate or College Degree
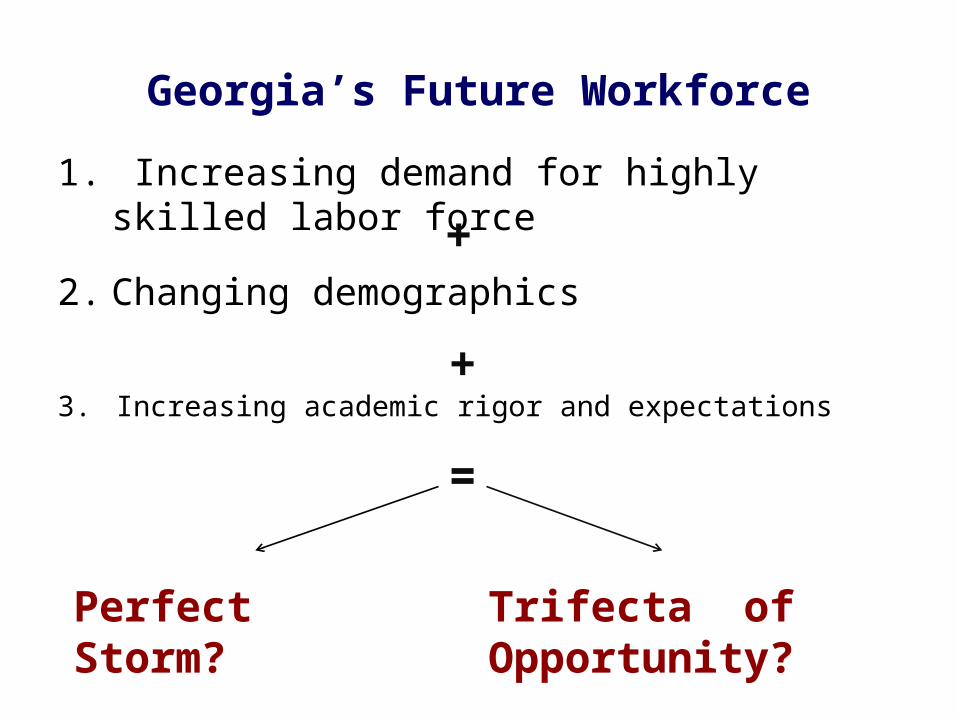
3. Increasing academic rigor and expectations
Georgia’s Future Workforce
1. Increasing demand for highly skilled labor force
2. Changing demographics+
+
=
Perfect Storm? Trifecta of Opportunity?

What can we do?
Profile of Child Wellbeing and Academic Achievement
2007 2008 2009 2010 20110
10
20
30
40
50
60
70
CherokeeClaytonCobbDekalbDouglasFayetteFultonGwinnettHenryRockdale
Source: Georgia Kids Count, Georgia Family Connection Partnership, http://www.gafcp.org

Teen Birth Rates Per 1,000
2007 2008 2009 2010 20110
10
20
30
40
50
60
70
CherokeeClaytonCobbDekalbDouglasFayetteFultonGwinnettHenryRockdale
Source: Georgia Kids Count, Georgia Family Connection Partnership, http://www.gafcp.org
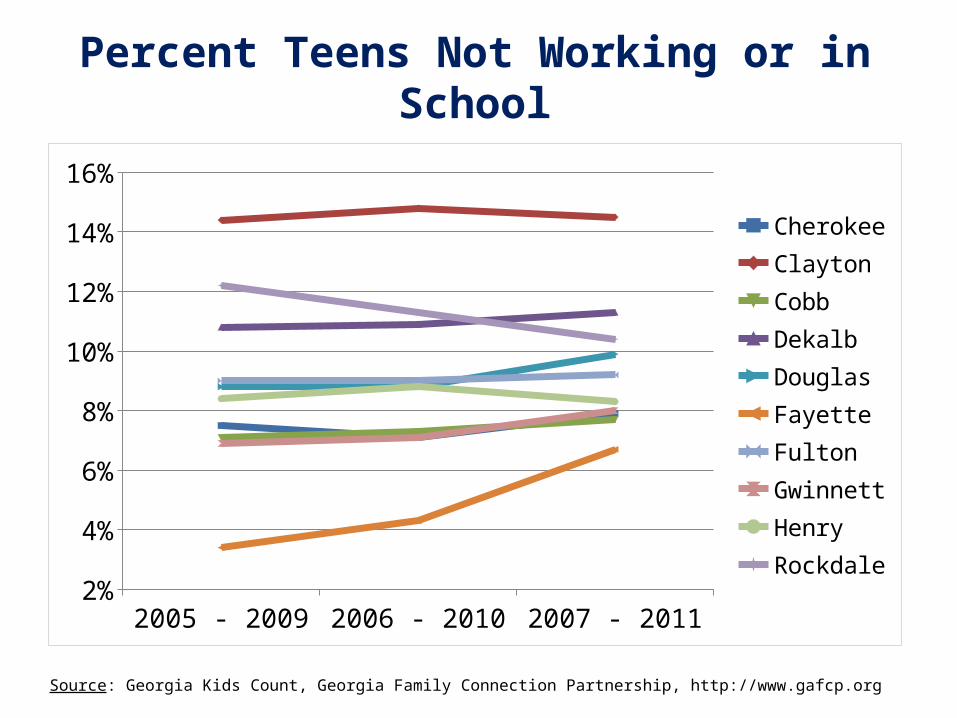
Percent Teens Not Working or in School
Source: Georgia Kids Count, Georgia Family Connection Partnership, http://www.gafcp.org
2005 - 2009 2006 - 2010 2007 - 20112%
4%
6%
8%
10%
12%
14%
16%
CherokeeClaytonCobbDekalbDouglasFayetteFultonGwinnettHenryRockdale

Percent Low-Income by School District
Clayto
n
DeKalb
Rockdale
Douglas
GwinnettHenry
CobbFu
lton
Cheroke
e
Faye
tte0
10
20
30
40
50
60
70
80
90
10087
7166
6156
5245 45
3225
Source: The Governor’s Office of Student Achievement, State Report Cards.

Percent Low-Income and Exceeds 3rd Grade Reading CRCT
Clayto
n
DeKalb
Rockdale
Douglas
GwinnettHenry
CobbFu
lton
Cheroke
e
Faye
tte0
10
20
30
40
50
60
70
80
90
100
87
7166
6156
5245 45
3225
3443
50 5159
5360 59
67 70
% Low-Income % ExceedsSource: The Governor’s Office of Student Achievement, State Report Cards.

Percent Low-Income by School District
Clayto
n
DeKalb
Rockdale
Douglas
GwinnettHenry
CobbFu
lton
Cheroke
e
Faye
tte0
10
20
30
40
50
60
70
80
90
10087
7166
6156
5245 45
3225
Source: The Governor’s Office of Student Achievement, State Report Cards.

Percent Low-Income and Exceeds 8th Grade Math CRCT
Clayto
n
DeKalb
Rockdale
Douglas
GwinnettHenry
CobbFu
lton
Cheroke
e
Faye
tte0
10
20
30
40
50
60
70
80
90
100
87
7166
6156
5245 45
3225
20 2027
21
45
28
42 40 43
54
% Low-Income % ExceedsSource: The Governor’s Office of Student Achievement, State Report Cards.

Percent Low-Income by School District
Clayto
n
DeKalb
Rockdale
Douglas
GwinnettHenry
CobbFu
lton
Cheroke
e
Faye
tte0
10
20
30
40
50
60
70
80
90
10087
7166
6156
5245 45
3225
Source: The Governor’s Office of Student Achievement, State Report Cards.

Percent Low-Income and HS Graduation
Clayto
n
DeKalb
Rockdale
Douglas
GwinnettHenry
CobbFu
lton
Cheroke
e
Faye
tte0
10
20
30
40
50
60
70
80
90
100
87
7166
6156
5245 45
3225
56 59
7871 73
79 77 76 7887
% Low-Income % HS GraduationSource: The Governor’s Office of Student Achievement, State Report Cards.

How Will You Insulate the Birth to Work Pipeline?
LEARNING & SOCIAL SUPPORTS
Childcare Providers
Afterschool Programs
Academic Supports
Job Training
Civic Opportunities
Early Childhood
K – 12 SystemPost Secondary
Work & Career
ESSENTIAL COMMUNITY SERVICES
Transportation Health Housing Financial
Source: The Forum for Youth Investment

Help Insulate the Pipeline
Post Secondary
Read to children every day: “Talk to Me Baby”
Encourage participation of your early learning centers: “Quality Rated”
Leverage partnerships with business and post-secondary – internships and mentoring
Volunteer: “Georgia Apply to College”
Pay for Advanced Placement (AP) exams
Provide internships/ apprenticeships
Help recruit candidates: “Woodrow Wilson Georgia Teaching Fellows “ (WWGTF)
Participate and support: “Go Back. Move Ahead.”
Early Childhood
K – 12 System

Aligning Educational Strategies for Collective Impact
Aligned Acts of Improvement
Random Acts of Improvement
GOALS
Partially Aligned Acts of Improvement
GOALS
GOALS

Connect with us
Twitter: @GAPartnership Facebook: Georgia Partnership for Excellence in Education Instagram: @GAPARTNERSHIP
LinkedIn: Georgia Partnership for Excellence in Education
Website: www.gpee.org