Regional guidelines for ecological assessments of ...
43
Waikato Regional Council Technical Report 2014/03 Regional guidelines for ecological assessments of freshwater environments Aquatic plant cover in wadeable streams – version 2 www.waikatoregion.govt.nz ISSN 2230-4355 (Print) ISSN 2230-4363 (Online)
Transcript of Regional guidelines for ecological assessments of ...

Waikato Regional Council Technical Report 2014/03
Regional guidelines for ecological assessments of freshwater environments Aquatic plant cover in wadeable streams – version 2 www.waikatoregion.govt.nz ISSN 2230-4355 (Print) ISSN 2230-4363 (Online)

Prepared by: Kevin Collier; Mark Hamer (Waikato Regional Council) Paul Champion (National Institute of Water and Atmospheric Research (NIWA)) For: Waikato Regional Council PO Box 4010 HAMILTON EAST 10 June 2014 Document #: 2938322

Doc # 2938322 Page i
Peer reviewed by: Date June 2014 Bruno David
Approved for release by: Date June 2014 Dominique Noiton
Disclaimer
This technical report has been prepared for the use of Waikato Regional Council as a reference document and as such does not constitute Council’s policy. Council requests that if excerpts or inferences are drawn from this document for further use by individuals or organisations, due care should be taken to ensure that the appropriate context has been preserved, and is accurately reflected and referenced in any subsequent spoken or written communication. While Waikato Regional Council has exercised all reasonable skill and care in controlling the contents of this report, Council accepts no liability in contract, tort or otherwise, for any loss, damage, injury or expense (whether direct, indirect or consequential) arising out of the provision of this information or its use by you or any other party.

Doc # 2938322

Doc # 2938322 Page i
Acknowledgements Rohan Wells, John Clayton, Aleki Taumoepeau and Tracey Edwards at NIWA kindly provided many photos for the field identification guide. Cathy Kilroy kindly assisted with clarifying calculations of the PEI. This revision is based on the original methods developed in association with Johlene Kelly. Several current and former WRC staff have contributed to data collection, in particular Nathan Singleton.

Page ii Doc # 2938322

Doc # 2938322 Page iii
Table of contents
1 Acknowledgements i
2 Executive summary v
3 Introduction 1
4 Periphyton cover rapid assessment protocol 2
4.1 Protocol 2
4.2 Indices 4
4.2.1 Nutrient enrichment index 4 4.2.2 Biomass indices 5 4.3 Example 8
5 Macrophyte cover rapid assessment protocol 10
5.1 Protocol 10
5.2 Indices 11
5.3 Example 14
References 16
Appendix 1: Datasheet for periphyton rapid assessment. 17
Appendix 2: Datasheet for macrophyte rapid assessment. 18
Appendix 3: Pictorial guide to some macrophyte species found in Waikato streams and rivers. 20
Appendix 4: Pictorial guide to some macrophyte species that are considered biosecurity threats and may be found in Waikato streams and rivers (report these to the Biosecurity officer). 30
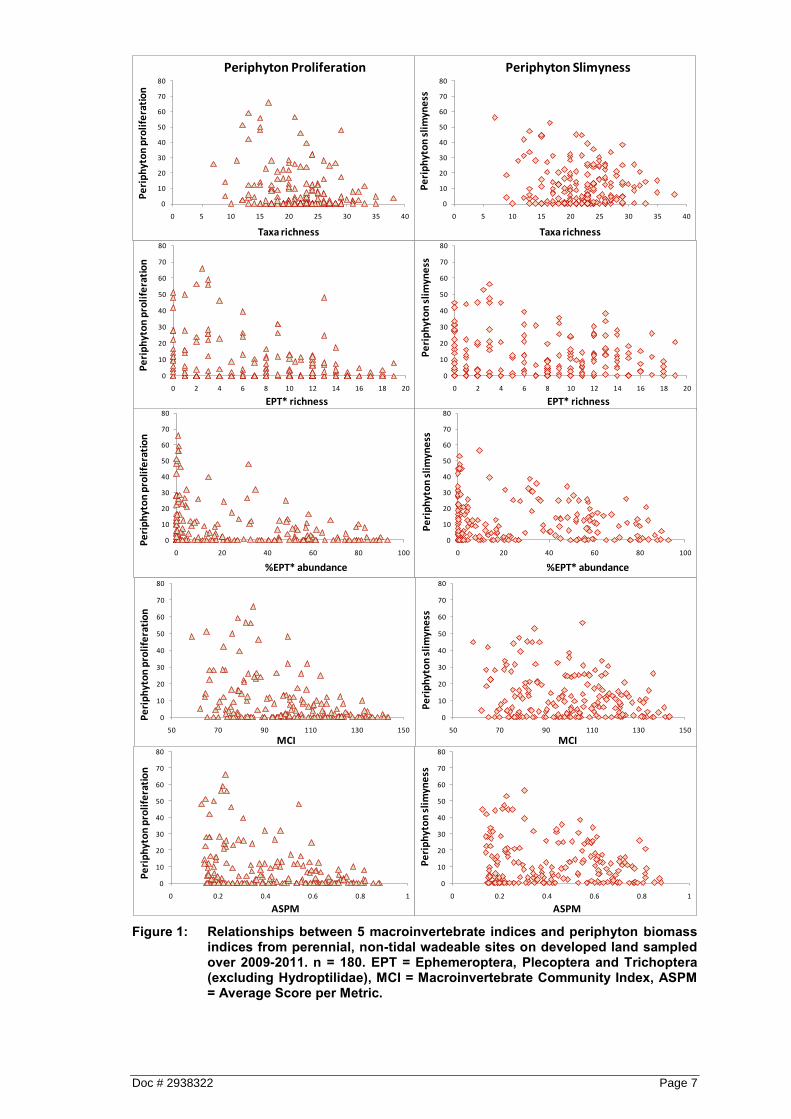
List of figures Figure 1: Relationships between 5 macroinvertebrate indices and periphyton biomass
indices from perennial, non-tidal wadeable sites on developed land sampled over 2009-2011. n = 180. EPT = Ephemeroptera, Plecoptera and Trichoptera (excluding Hydroptilidae), MCI = Macroinvertebrate Community Index, ASPM = Average Score per Metric. 7
Figure 2: Hypothetical transect (one of five) for assessing periphyton cover in a wadeable stream. 8
Figure 3: Relationships between 5 macroinvertebrate indices and two macrophyte indices from perennial, non-tidal wadeable sites on developed land sampled over 2009-2011. n = 180. EPT = Ephemeroptera, Plecoptera and Trichoptera (excluding Hydroptilidae), MCI = Macroinvertebrate Community Index, ASPM = Average Score per Metric. 13
Figure 4: Hypothetical transect (one of five) for assessing macrophyte cover in a wadeable stream. 14

Page iv Doc # 2938322
List of tables Table 1: Enrichment indicator scores for different thickness and colour categories for
periphyton. 4 Table 2: Regional statistics (percentiles and mean) for periphyton biomass indices in
perennial, non-tidal wadeable streams on developed land. 6 Table 3: Results of a hypothetical assessment of periphyton cover based on an
adaptation of RAM-2 (Biggs & Kilroy 2000) at five transects (A-E) on a wadeable stream. 9
Table 4: Regional statistics (percentiles and mean) for three macrophyte indices in perennial, non-tidal wadeable streams on developed land. 12
Table 5: Results of a hypothetical assessment of macrophyte cover at five transects (A-E) on a wadeable stream 15
Doc # 2938322 Page v
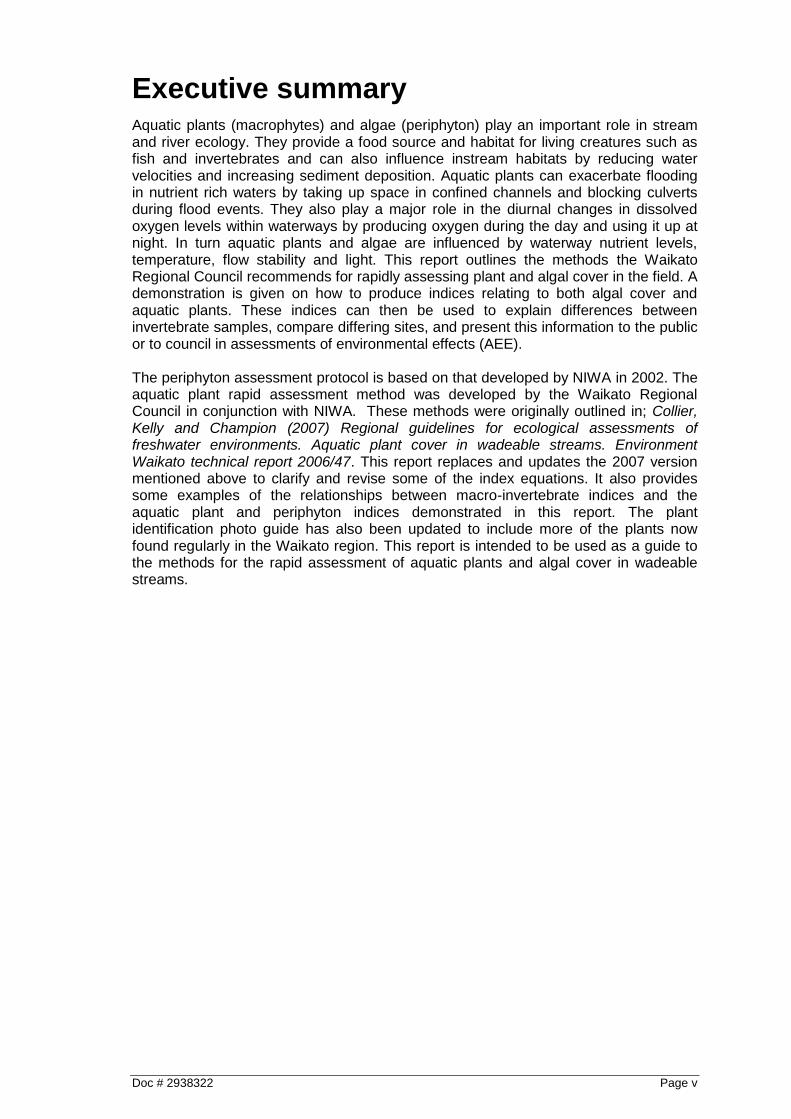
Executive summary Aquatic plants (macrophytes) and algae (periphyton) play an important role in stream and river ecology. They provide a food source and habitat for living creatures such as fish and invertebrates and can also influence instream habitats by reducing water velocities and increasing sediment deposition. Aquatic plants can exacerbate flooding in nutrient rich waters by taking up space in confined channels and blocking culverts during flood events. They also play a major role in the diurnal changes in dissolved oxygen levels within waterways by producing oxygen during the day and using it up at night. In turn aquatic plants and algae are influenced by waterway nutrient levels, temperature, flow stability and light. This report outlines the methods the Waikato Regional Council recommends for rapidly assessing plant and algal cover in the field. A demonstration is given on how to produce indices relating to both algal cover and aquatic plants. These indices can then be used to explain differences between invertebrate samples, compare differing sites, and present this information to the public or to council in assessments of environmental effects (AEE). The periphyton assessment protocol is based on that developed by NIWA in 2002. The aquatic plant rapid assessment method was developed by the Waikato Regional Council in conjunction with NIWA. These methods were originally outlined in; Collier, Kelly and Champion (2007) Regional guidelines for ecological assessments of freshwater environments. Aquatic plant cover in wadeable streams. Environment Waikato technical report 2006/47. This report replaces and updates the 2007 version mentioned above to clarify and revise some of the index equations. It also provides some examples of the relationships between macro-invertebrate indices and the aquatic plant and periphyton indices demonstrated in this report. The plant identification photo guide has also been updated to include more of the plants now found regularly in the Waikato region. This report is intended to be used as a guide to the methods for the rapid assessment of aquatic plants and algal cover in wadeable streams.


Doc # 2938322 Page 1
1 Introduction This report should be used as the minimum level of assessment expected by the Waikato Regional Council for plant cover in wadeable streams in the Waikato Region. It provides an update of the original report:
Collier K, Kelly J, Champion P 2007. Regional guidelines for ecological assessments of freshwater environments. Aquatic plant cover in wadeable streams. Environment Waikato technical report 2006/47.
The following changes/additions to the original report have been made:
Regional statistics for periphyton and macrophyte indices for perennial non-tidal wadeable streams on developed land
Revised equation for the Periphyton Enrichment Index
Updated relationships with macroinvertebrate metrics
Updated pictorial macrophyte identification sheets Macrophytes can be particularly important as habitat over spring-summer in streams dominated by fine sediments where other stable substrates are uncommon, but few invertebrates eat macrophytes directly (with the exception of the koura Paranephrops and the moth larva Hygraula nitens). Algae growing on stones, wood, macrophytes or any other stable surfaces can be an important food source for invertebrates, especially in more open streams. Some invertebrates pierce the cells of algal filaments and suck out their contents (e.g., Oxyethira albiceps), whereas other invertebrates can scrape (e.g., Potamopyrgus antipodarum) or sweep (leptophlebiid mayflies) algae such as diatoms from substrate surfaces. Although some plant cover increases habitat diversity (especially where streambeds are dominated by fine sediments) and can provide food, too much can cause ecological problems by impeding water flow, trapping more fine sediments, smothering benthic habitats, and causing wide fluctuations in dissolved oxygen and pH due to plant respiration and photosynthesis. This set of guidelines describes the procedures used in Waikato Regional Council’s Regional Ecological Monitoring of Streams (REMS) State of the Environment (SOE) monitoring programme to assess cover by aquatic plants (typically algae and rooted macrophytes) in wadeable streams. These methods should be used in association with reach-scale cover assessments (e.g., as described in the REMS Field Assessment Cover Form) to enable comparisons with the transect methods which capture more detailed information at a few locations within the reach. An expanded algal assessment protocol for the REMS programme was introduced for streams dominated by stony substrates in 2002 using an adaptation of Rapid Assessment Method 2 (RAM-2) from the Stream Periphyton Monitoring Manual (Biggs & Kilroy 2000). Waikato Regional Council’s initial application of this method involved selecting five stones per reach, but this was altered in 2005 to bring the method in line with the RAM-2 approach of selecting five stones at each of several transects (although some modifications to the RAM-2 method exist; see Section 2). A new rapid macrophyte assessment protocol (RMAP), developed for Environment Waikato by NIWA, was introduced to the REMS programme in 2004 (see Section 3). Both the modified RAM-2 method and the RMAP method allow indices to be calculated, as well as providing information that assists with the interpretation of patterns in invertebrate community structure. Indices reflect nutrient enrichment (periphyton), proliferation (periphyton and macrophytes) and naturalness (macrophytes). The revised equation for the Periphyton Enrichment Index (PEI) should be used to re-calculate historical PEI values. Both macrophyte and periphyton assessments for the REMS programme are carried out over January to March. Rivers should not be surveyed for aquatic plants if visibility is insufficient to enable a reliable assessment. In slightly-moderately turbid streams, a viewer may assist with assessments. Surveys should be conducted at baseflow as water levels much higher than this could affect assessments of macrophyte height and

Page 2 Doc # 2938322
may lead to inclusion of terrestrial grasses in assessments by inexperienced observers. A stand down period of two weeks is applied by Waikato Regional Council once flood flows exceed a level considered likely to mobilise bed sediments at representative flow monitoring sites. This stand down period is intended to allow some recovery of macroinvertebrate communities, but may not be sufficient to enable recovery of macrophytes. Some factors that may constrain macrophyte growth at certain sites are recorded on the Field Assessment Cover Form (e.g., shade, turbidity), but additional constraining factors should also be noted (e.g., evidence of macrophyte removal or recent drain clearance, artificial bed substrates). These are rapid assessment approaches, and are therefore recommended for broadscale surveys of wadeable streams with adequate clarity, such as for SOE monitoring, but may not be appropriate for targeted assessments aimed at addressing specific questions, such as compliance monitoring where more detailed analyses may be required (e.g., chlorophyll a concentration, biomass in replicate samples). It is recognised that each study will have its own set of questions and requirements, and that variations to any guidelines or recommended methods may be necessary to address specific questions. These guidelines should not constrain the scope of work that is carried out but should be used to ensure that, where appropriate, the approaches applied are consistent with recommended methods and meet or exceed the minimum level of effort.
2 Periphyton cover rapid assessment protocol As noted earlier, the periphyton protocol is based on the RAM-2 approach described by Biggs & Kilroy (2000). The main points of difference in the approach used by Waikato Regional Council are:
The use of five transects along 100 m long reaches instead of the four transects in the original method to keep consistency with the macrophyte protocol (Section 3).
The substrates assessed along a transect include not only sediments but also wood and macrophytes where they occur at sampling points in all types of stream.
There is no distinction between the different types/colours of (i) “thin” (<0.5 mm thick) periphyton mats or films as we found the colour of thin algal coverings difficult to distinguish from the background rock colour, or (ii) “short-filament” periphyton as they have the same enrichment indicator score (Biggs & Kilroy 2000).
The enrichment scores used in Biggs & Kilroy (2000) was subtracted from 10 so that colour/thickness categories more indicative of enriched conditions score more highly than those less typical of enriched conditions, to maintain consistency with the other periphyton metrics used here.
2.1 Protocol
The purpose of this protocol is to describe the procedures used in Waikato Regional Council’s REMS programme and to enable consultants conducting similar studies to employ complementary methodologies.
Select five evenly-spaced transects along the sampling reach (100 m long). Do not start at 0 m because this point has been selected to define the bottom of the

Doc # 2938322 Page 3
reach and may be biased in some way (e.g., tributary confluence, availability of a post or tree to attach tape).
Working from the downstream end of the sample reach, move across each transect and randomly remove or assess substrates within a 10 cm diameter circle centred on sampling points at 10%, 30%, 50%, 70% and 90% across the wetted width.
Assess periphyton on whatever substrate occurs at the sampling point – periphyton adheres to surfaces so if in doubt give the substrate a gentle shake to remove non-adhering material such as detritus or flocculants. In stony streams, aim for stones bigger than around 4 cm across. Place stones on a white tray or similar. If stones are not available, make an in-situ assessment on large substrate elements (e.g., boulder, bedrock) or finer sediments (a viewer may be useful), or remove a scoop of sediment from the stream. A tea strainer is recommended by Biggs & Kilroy (2000) for removing scoops of fine sediments.
If inorganic sediments are not available around the sampling point but macrophytes or wood occur there, make an assessment of periphyton cover on the habitat that is available in an area of around 10 cm diameter.
Record average percentage cover of upper surfaces at the 5 points across each transect by the different periphyton categories described in Table 1 (see Appendix 1 for data sheet). If cover is patchy for some categories (e.g., nodules which are classified under mats), make an estimate of the average amount of surface area covered as if they all occurred together. Include senescing algae and record it as the colour that it most likely was (look at fresh algal growths nearby for clues); if the original colour isn’t apparent record the colour you see.
Repeat the process at the remaining transects.
Calculate the mean percent cover for each transect and then the average for all transects for each periphyton thickness and colour category to provide an average for the reach. Calculate indices as described in Section 2.2.
As a general rule, if the periphyton is <0.5 mm thick but can be scraped by a fingernail, we consider it to be “thin”. If a stone feels rough we record it as not present. Sometimes mineral particles will be removed by a fingernail scrape from soft rocks and can be mistaken for periphyton. If the particles feel gritty they are probably mineral, although scrapes from soft clay rocks can feel slippery. The length of filaments is best determined by covering the rock with water. A field identification sheet is provided to assist with colour and biomass assessments in the Stream Periphyton Monitoring Manual (Biggs & Kilroy 2000). For convenience, the periphyton data sheet (Appendix 1) also provides fields to record cover by bryophytes (mosses and liverworts) and iron bacterial growths. These are not algae and so are not used in the calculation of the indices below, although prolific iron bacteria may have implications for aesthetics and ecology. Iron bacteria form orange-coloured growths that resemble jelly-like slime and filaments, and occur where there are high concentrations of dissolved iron in the water. Waikato Regional Council do not record iron-flocs as they do not adhere to stones, or orange precipitates (not slimy) which may form in association with iron bacteria because they are not organic.

Page 4 Doc # 2938322
Table 1: Enrichment indicator scores for different thickness and colour categories for periphyton. NA = not applicable
Thickness category Colour category Enrichment indicator score1
Thin mat/film (<0.5 mm thick)
NA 1
Medium mat (0.5-3 mm thick)
Green
Light brown
Black/dark brown
5
3
1
Thick mat (>3 mm thick)
Green/light brown
Black/dark brown
6
3
Short filaments (<2 cm long)
NA
5
Long filaments (>2 cm long)
Green
Brown/reddish
9
6 1 Higher scores indicate categories more indicative of enrichment (note these differ from the
scores in Biggs & Kilroy (2000) because they have been subtracted from 10 so that higher PEI values indicate greater enrichment).
2.2 Indices
2.2.1 Nutrient enrichment index
Table 1 provides indicator scores for various periphyton biomass and colour categories to reflect enrichment. These scores differ from those in Biggs & Kilroy (2000) so that higher values of the Periphyton Enrichment Index (PEI) indicate greater algal cover by periphyton categories indicative of enrichment to maintain consistency with other indices. Biggs & Kilroy (2000) indicate that their scores provided were preliminary, but there has been no subsequent work that suggests they should be modified in terms of their relative sensitivity to enrichment (B. Biggs, NIWA, personal communication). As we do not discriminate colour of thin periphyton films/mats, we give this category a score of 1 to reflect the average of all scores in that thickness category. To derive PEI you need to do the following:
Sum all values per transect to provide total periphyton % cover (a);
Multiply % cover for each category in each transect by the enrichment score to produce b;
Sum b for each transect to provide c;
Divide c by a to provide d (average cover).
Sum the values for d to provide total weighted coverage (e);
Divide e by total number of transects with periphyton cover (i.e., maximum value of 5) (h) to provide f.
Multiply by 11 (g) as a scaling factor (so that the values range up to 100) to yield PEI.
Thus:
PEI = {[∑(% cover in each category per transect * Indicator score) / Total % cover per transect] / No. transects with periphyton} * 11 Or following the notation below PEI = {[∑(c / a)] / h} * 11

Doc # 2938322 Page 5
A worked example is provided in section 2.3 of this report. The PEI is adapted from Biggs & Kilroy (2000) to provide values on a similar scale to other periphyton indices with higher scores reflecting higher enrichment. Note that the equation for (f) in the bottom table on p. 44 of Biggs & Kilroy should read “total average periphyton scores (e)/no. transects with periphyton”. It is important to note that transects without periphyton are ignored in the calculation. The PEI was originally developed for stony streams so caution needs to be exercised in interpreting this index if the substrates assessed were sandy or wood and macrophytes. The PEI is not recommended if a large proportion of the periphyton recorded is senescing and the original colour is not apparent. The revised equation (included here) for the Periphyton Enrichment Index (PEI) should be used to re-calculate historical PEI values.
2.2.2 Biomass indices
Calculate a Periphyton Filamentous Index (PFI) as percent of total cover by long filaments, and Periphyton Mat Index (PMI) as percent cover by thick mats. The periphyton guidelines (Biggs 2000) recommend an upper level 30% cover by long filamentous algae or 60% cover by thick mats of diatoms and cyanobacteria for aesthetic and recreational purposes. These thresholds were originally developed for stony streams and should be applied to these streams as cover of the visible streambed. Calculate a Periphyton Proliferation Index (PPI) as a percent of total cover by long filaments and thick mats. Calculate a Periphyton Slimyness Index (PSI) using the following formula based on percent cover for each thickness category (i.e., all colour categories combined):
PSI = {(%Thin mat/film) + (%Short filaments * 2) + (%Medium mat * 3) + (%Long filaments * 4) + (%Thick mat * 5)} / 5
Regional statistics for periphyton indices are shown in Table 2 and relationships with macroinvertebrate indices are shown in Figure 2. The regional statistics were derived from a probability sampling network of 180 non-tidal perennial wadeable streams on developed land sampled on a 3-year rotating panel (60 per year; see Collier & Hamer 2012; Collier & Olsen 2013). The statistics presented therefore represent this population of wadeable streams and can be used to benchmark results from other perennial, non-tidal wadeable streams on developed land (e.g., the 50th percentile represents the median or ‘typical” state).

Page 6 Doc # 2938322
Table 2: Regional statistics (percentiles and mean) for periphyton biomass indices in perennial, non-tidal wadeable streams on developed land. 50Pct = median. Statistics not available for PEI.
N Estimate StdError LCB95Pct UCB95Pct
Peripyhton Proliferation Index 5Pct 73 0.00
0.00 0.00
10Pct 73 0.00
0.00 0.00
25Pct 73 0.00
0.00 0.00
50Pct 85 1.44
0.00 2.81
75Pct 128 9.96
7.53 14.22
90Pct 163 26.42
23.04 31.89
95Pct 171 44.47
27.51 56.04
Mean 180 8.25 1.03 6.24 10.27
Periphyton Slimyness Index 5Pct 37 0.00
0.00 0.00
10Pct 37 0.00
0.00 0.00
25Pct 37 0.00
0.00 1.49
50Pct 84 5.84
4.44 8.64
75Pct 128 16.02
13.06 20.74
90Pct 158 28.08
24.94 34.90
95Pct 171 40.42
31.09 44.90
Mean 180 10.75 0.89 9.01 12.49
Doc # 2938322 Page 7
0
10
20
30
40
50
60
70
80
50 70 90 110 130 150
Pe
rip
hyt
on
pro
life
rati
on
MCI
0
10
20
30
40
50
60
70
80
0 2 4 6 8 10 12 14 16 18 20
Pe
rip
hyt
on
pro
life
rati
on
EPT* richness
0
10
20
30
40
50
60
70
80
0 20 40 60 80 100
Pe
rip
hyt
on
pro
life
rati
on
%EPT* abundance
0
10
20
30
40
50
60
70
80
0 0.2 0.4 0.6 0.8 1
ASPM
Pe
rip
hyt
on
pro
life
rati
on
0
10
20
30
40
50
60
70
80
0 5 10 15 20 25 30 35 40
Pe
rip
hyt
on
pro
life
rati
on
Taxa richness
Periphyton Proliferation
0
10
20
30
40
50
60
70
80
50 70 90 110 130 150
Pe
rip
hyt
on
slim
yne
ss
MCI
0
10
20
30
40
50
60
70
80
0 2 4 6 8 10 12 14 16 18 20
Pe
rip
hyt
on
slim
yne
ss
EPT* richness
0
10
20
30
40
50
60
70
80
0 20 40 60 80 100
Pe
rip
hyt
on
slim
yne
ss
%EPT* abundance
0
10
20
30
40
50
60
70
80
0 0.2 0.4 0.6 0.8 1
ASPM
Pe
rip
hyt
on
slim
yne
ss
0
10
20
30
40
50
60
70
80
0 5 10 15 20 25 30 35 40
Pe
rip
hyt
on
slim
yne
ss
Taxa richness
Periphyton Slimyness
Figure 1: Relationships between 5 macroinvertebrate indices and periphyton biomass indices from perennial, non-tidal wadeable sites on developed land sampled over 2009-2011. n = 180. EPT = Ephemeroptera, Plecoptera and Trichoptera (excluding Hydroptilidae), MCI = Macroinvertebrate Community Index, ASPM = Average Score per Metric.
Page 8 Doc # 2938322
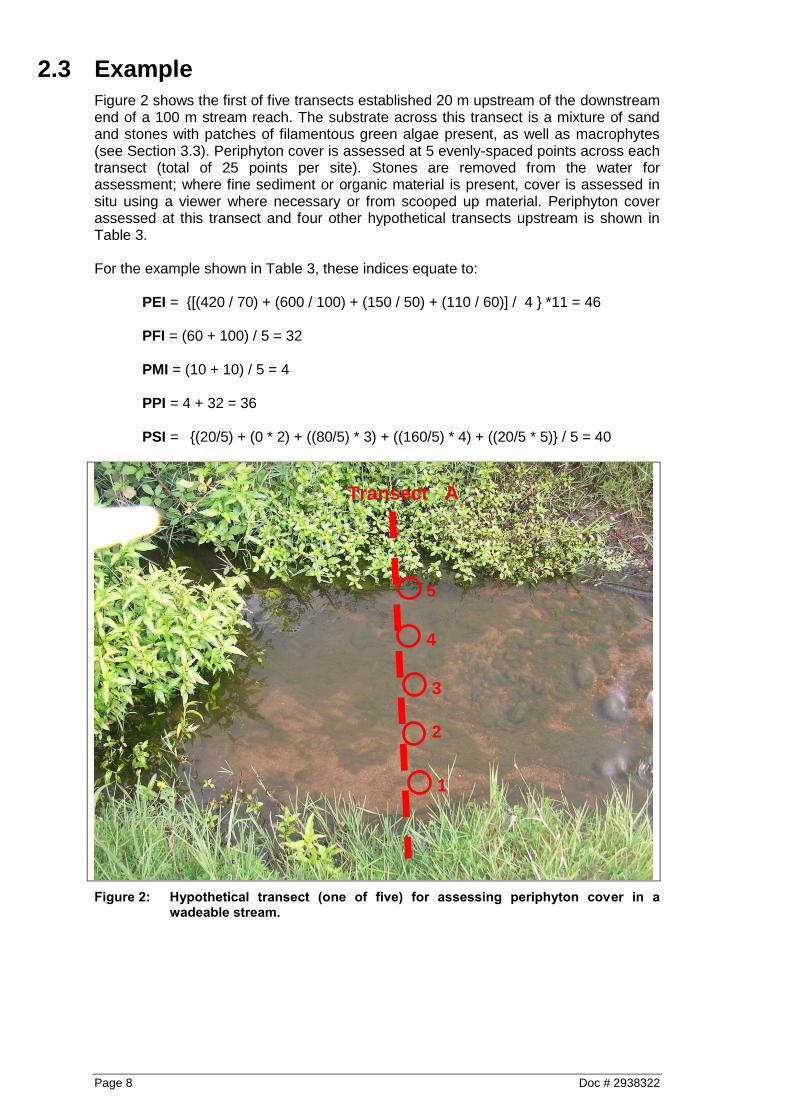
2.3 Example
Figure 2 shows the first of five transects established 20 m upstream of the downstream end of a 100 m stream reach. The substrate across this transect is a mixture of sand and stones with patches of filamentous green algae present, as well as macrophytes (see Section 3.3). Periphyton cover is assessed at 5 evenly-spaced points across each transect (total of 25 points per site). Stones are removed from the water for assessment; where fine sediment or organic material is present, cover is assessed in situ using a viewer where necessary or from scooped up material. Periphyton cover assessed at this transect and four other hypothetical transects upstream is shown in Table 3. For the example shown in Table 3, these indices equate to:
PEI = {[(420 / 70) + (600 / 100) + (150 / 50) + (110 / 60)] / 4 } *11 = 46 PFI = (60 + 100) / 5 = 32 PMI = (10 + 10) / 5 = 4 PPI = 4 + 32 = 36
PSI = {(20/5) + (0 * 2) + ((80/5) * 3) + ((160/5) * 4) + ((20/5 * 5)} / 5 = 40
Figure 2: Hypothetical transect (one of five) for assessing periphyton cover in a wadeable stream.
1
3
4
5
2
Transect A 11
Doc # 2938322 Page 9
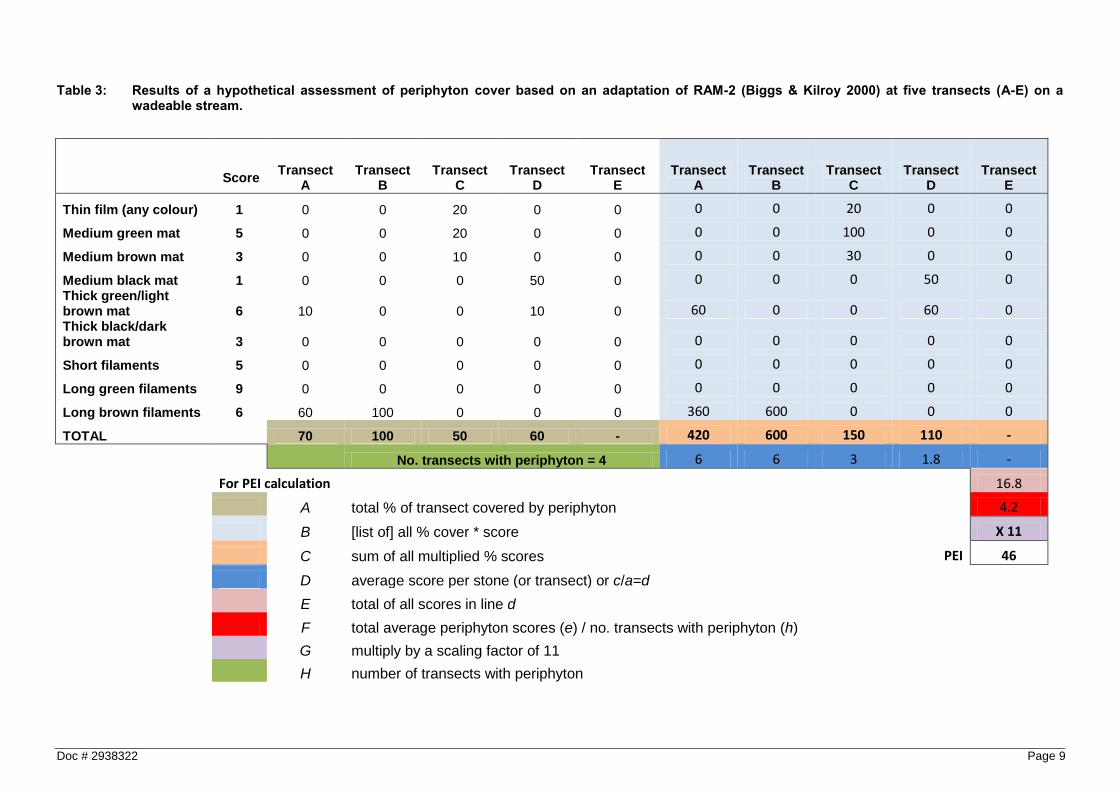
Table 3: Results of a hypothetical assessment of periphyton cover based on an adaptation of RAM-2 (Biggs & Kilroy 2000) at five transects (A-E) on a wadeable stream.
Score Transect
A Transect
B Transect
C Transect
D Transect
E Transect
A Transect
B Transect
C Transect
D Transect
E
Thin film (any colour) 1 0 0 20 0 0 0 0 20 0 0
Medium green mat 5 0 0 20 0 0 0 0 100 0 0
Medium brown mat 3 0 0 10 0 0 0 0 30 0 0
Medium black mat 1 0 0 0 50 0 0 0 0 50 0 Thick green/light brown mat 6 10 0 0 10 0 60 0 0 60 0 Thick black/dark brown mat 3 0 0 0 0 0 0 0 0 0 0
Short filaments 5 0 0 0 0 0 0 0 0 0 0
Long green filaments 9 0 0 0 0 0 0 0 0 0 0
Long brown filaments 6 60 100 0 0 0 360 600 0 0 0
TOTAL 70 100 50 60 - 420 600 150 110 -
No. transects with periphyton = 4 6 6 3 1.8 -
For PEI calculation
16.8
A total % of transect covered by periphyton
4.2
B [list of] all % cover * score
X 11
C sum of all multiplied % scores
PEI 46
D average score per stone (or transect) or c/a=d
E total of all scores in line d
F total average periphyton scores (e) / no. transects with periphyton (h)
G multiply by a scaling factor of 11
H number of transects with periphyton

Page 10 Doc # 2938322
3 Macrophyte cover rapid assessment protocol This protocol is designed to give only a general picture of reach-scale cover and composition by rooted macrophytes as only 5% of a 100 m reach is assessed. It assesses macrophytes growing in or emerging from the wetted channel only; floating macrophytes are not used in the calculation of indices because their impact on 'clogginess' is minimal and a high density of floating plants would skew measures of total cover and %native cover. Generally, free-floating macrophytes only accumulate on top of surface reaching submerged vegetation or amongst emergent plants, although they can build up enough to completely smother slower flowing streams. Include senescing or dying macrophytes in estimates of cover if they can be identified (although surveys should be done before the onset macrophyte senescence). The protocol requires some training or experience in macrophyte identification; an annual refresher is recommended. If an unknown plant is found and it is of interest or it represents more than 5% of the cover present, a sample (preferably including flowers) should be retained for identification or a photo should be taken. Plants allocated to the “other” category should not exceed 5% without further identification.
3.1 Protocol
Select five evenly-spaced transects along the sampling reach (100 m long). Do not start at 0 m because this point has been selected to define the bottom of the reach and may be biased in some way (e.g., tributary confluence, availability of a post or tree to attach tape).
Facing upstream, estimate aquatic vegetation cover from a plan view (i.e., looking down) occupying a 1 m wide belt upstream of the transect and across the entire wetted width of the stream, and record this figure (see Appendix 2 for datasheet).
Divide the 1 m swathe into emergent macrophytes and submerged macrophytes. Emergent macrophytes are those with parts clearly rising above the water. Submerged macrophytes are those that occur beneath the water surface or extend to the surface. Write down total submerged and total emergent percent cover in appropriate columns on the datasheet. The sum of percent emergent and submerged cover should add up to the total cover figure if floating species are not present. Note floating taxa (i.e. Azolla and duckweed) as present but do not include them in any formula.
Identify emergent species using the guide in Appendix 3, and allocate a percent cover to each. The total of these should add up to the total emergent cover.
Divide the submerged macrophytes into “Below surface” and “Surface reaching”. “Below surface” is defined as anything growing beneath the top of the water. “Surface reaching” is defined as breaking the surface of the water column. Write down percent cover for each – the sum of these should add up to the total submerged figure.
Identify surface-reaching submerged species using the identification guide in Appendix 3, and allocate a percent cover to each. Enter these figures in the appropriate column. Repeat for below-surface submerged species. The total of these should add up to the total submerged cover.

Doc # 2938322 Page 11
Repeat the process at the remaining transects. Remember you are looking at a plan view so if emergent macrophytes are growing at the edge but cover the whole stream it is 100% cover. If a species has two forms (e.g., some is surface reaching and some is below surface) record this separately in the appropriate column.
Calculate indices as described below.
3.2 Indices
The macrophyte indices described below reflect the extent of cover over the bottom (MTC) and through the water column (MCC), as well as the naturalness (MNC) of the rooted macrophyte community. Macrophyte Total Cover (MTC) = {∑(%emergent + %submerged)} / 5 Macrophyte Channel Clogginess (MCC) = {∑ (%emergent + %surface-reaching)
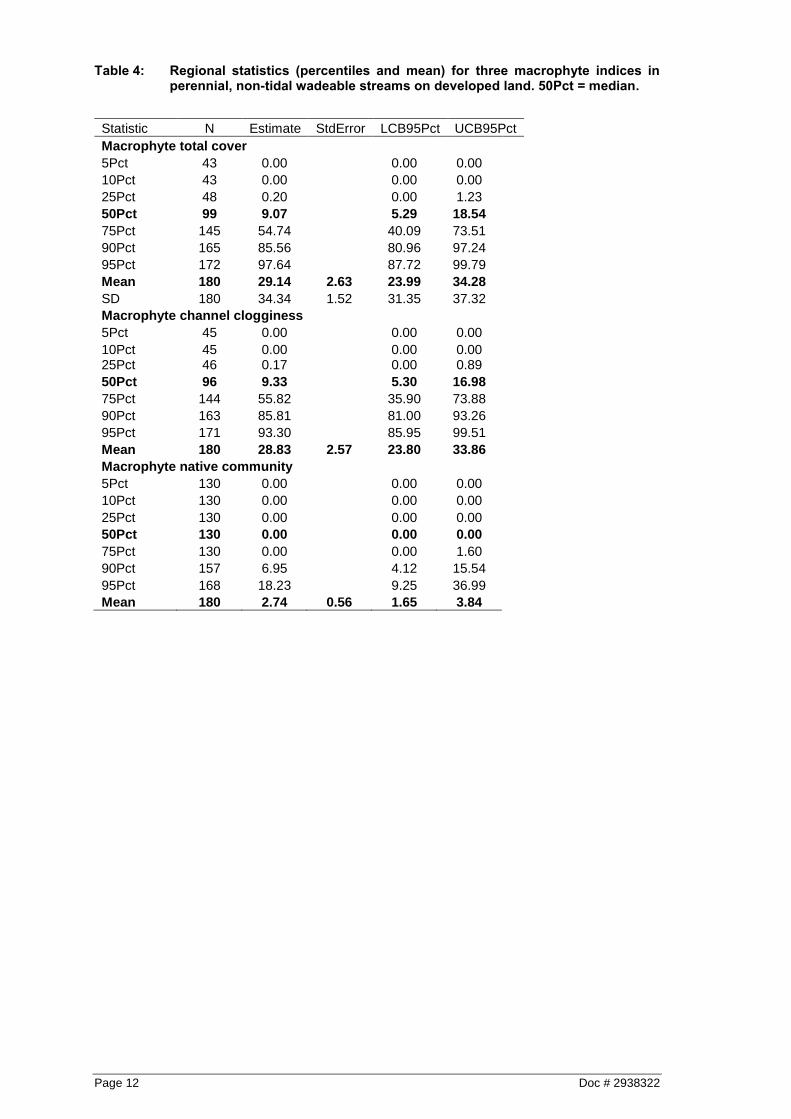
+ (% below surface * 0.5)} / 5 Macrophyte Native Cover (MNC) = (∑% native species) / 5 Although the MTC and MCC indices had similar distributions in the sites sampled in 2006 and their rank order was highly correlated (rs = 0.99), a stream could conceivably have a high MTC score and a low MCC score. For example, if 100% of all transects are covered by “below surface” macrophytes MTC will be 100 but MCC will be 50. Regional statistics for macrophyte indices are shown in Table 4 and relationships with macroinvertebrate indices are shown in Figure 3. The regional statistics were derived from a probability sampling network of 180 non-tidal perennial wadeable streams on developed land sampled on a 3-year rotating panel (60 per year; see Collier & Hamer 2012; Collier & Olsen 2013). The statistics presented therefore represent this population of wadeable streams and can be used to benchmark results from other perennial, non-tidal wadeable streams on developed land (e.g., the 50th percentile represents the median or ‘typical” state).
Page 12 Doc # 2938322
Table 4: Regional statistics (percentiles and mean) for three macrophyte indices in perennial, non-tidal wadeable streams on developed land. 50Pct = median.
Statistic N Estimate StdError LCB95Pct UCB95Pct
Macrophyte total cover 5Pct 43 0.00
0.00 0.00
10Pct 43 0.00
0.00 0.00
25Pct 48 0.20
0.00 1.23
50Pct 99 9.07
5.29 18.54
75Pct 145 54.74
40.09 73.51
90Pct 165 85.56
80.96 97.24
95Pct 172 97.64
87.72 99.79
Mean 180 29.14 2.63 23.99 34.28
SD 180 34.34 1.52 31.35 37.32
Macrophyte channel clogginess 5Pct 45 0.00
0.00 0.00
10Pct 45 0.00
0.00 0.00 25Pct 46 0.17
0.00 0.89
50Pct 96 9.33
5.30 16.98
75Pct 144 55.82
35.90 73.88
90Pct 163 85.81
81.00 93.26
95Pct 171 93.30
85.95 99.51
Mean 180 28.83 2.57 23.80 33.86
Macrophyte native community 5Pct 130 0.00
0.00 0.00
10Pct 130 0.00
0.00 0.00
25Pct 130 0.00
0.00 0.00
50Pct 130 0.00
0.00 0.00
75Pct 130 0.00
0.00 1.60
90Pct 157 6.95
4.12 15.54
95Pct 168 18.23
9.25 36.99
Mean 180 2.74 0.56 1.65 3.84

Doc # 2938322 Page 13
0
10
20
30
40
50
60
70
80
90
100
50 70 90 110 130 150
MCI
Mac
rop
hyt
e c
han
el c
logg
ine
ss
0
10
20
30
40
50
60
70
80
90
100
0 2 4 6 8 10 12 14 16 18 20
EPT* richness
Mac
rop
hyt
e c
han
el c
logg
ine
ss
0
10
20
30
40
50
60
70
80
90
100
0 20 40 60 80 100
Mac
rop
hyt
e c
han
el c
logg
ine
ss
%EPT* abundance
0
10
20
30
40
50
60
70
80
90
100
0 0.2 0.4 0.6 0.8 1
ASPM
Mac
rop
hyt
e c
han
el c
logg
ine
ss
0
10
20
30
40
50
60
70
80
90
100
0 5 10 15 20 25 30 35 40
Macrophyte Channel Clogginess
Taxa richness
Mac
rop
hyt
e c
han
el c
logg
ine
ss
0
10
20
30
40
50
60
70
80
90
100
50 70 90 110 130 150
MCI
Mac
rop
hyt
e t
ota
l co
ver
0
10
20
30
40
50
60
70
80
90
100
0 2 4 6 8 10 12 14 16 18 20
EPT* richness
Mac
rop
hyt
e t
ota
l co
ver
0
10
20
30
40
50
60
70
80
90
100
0 20 40 60 80 100
Mac
rop
hyt
e t
ota
l co
ver
%EPT* abundance
0
10
20
30
40
50
60
70
80
90
100
0 0.2 0.4 0.6 0.8 1
ASPM
Mac
rop
hyt
e t
ota
l co
ver
0
10
20
30
40
50
60
70
80
90
100
0 5 10 15 20 25 30 35 40
Macrophyte Total Cover
Taxa richness
Mac
rop
hyt
e t
ota
l co
ver
Figure 3: Relationships between 5 macroinvertebrate indices and two macrophyte
indices from perennial, non-tidal wadeable sites on developed land sampled over 2009-2011. n = 180. EPT = Ephemeroptera, Plecoptera and Trichoptera (excluding Hydroptilidae), MCI = Macroinvertebrate Community Index, ASPM = Average Score per Metric.

Page 14 Doc # 2938322
3.3 Example
In Figure 4 below, the rectangle indicates the 1 m wide band upstream of one of five evenly-spaced transects in which macrophyte cover is assessed. Macrophytes cover around 35% of the area (plan view). The dashed lines show emergent macrophytes which are estimated to cover around 25% of the area looking down. These comprise around 12% starwort, 10% Persicaria hydropiper, and 3% Ludwigia palustris. Submerged macrophytes, indicated by the dotted line, cover around 10% of the area, and all are classed as surface-reaching. These comprise 5% Ludwigia and 5% Persicaria. None of these species are native. Macrophyte cover assessed at this transect and four hypothetical transects upstream is shown in Table 5. For the example shown in Table 5 these indices equate to: MTC = (35 + 100 + 60 + 20 + 70) / 5 = 57 MCC = {(135 + 105) + (45 * 0.5)} / 5 = 53 MNC = (5 + 10 + 15 + 10 + 5) / 5 = 9
Figure 4: Hypothetical transect (one of five) for assessing macrophyte cover in a wadeable stream.
Flow

Doc # 2938322 Page 15
Table 5: Results of a hypothetical assessment of macrophyte cover at five transects (A-E) on a wadeable stream
(See Appendix 3 for species codes – those underlined are native species). No floating macrophytes were present.
Vegetation cover (% wetted area)
Submerged plants Emergent plants
Transect Total cover
Total submerged
Surface-reaching
Below surface
Sub-total
Species Sub-total
Species Total emergent
Species
A 35% 10% 10% Lp 5% Ph 5%
0 - 25% St 12% Ph 10% Lp 3%
B 100% 20% 10% Ed 5% Pk 5%
10% Nh 10% 80% Ph 70% Ps 10%
C 60% 60% 50% Ed 50% 10% Pk 10% 0% -
D 20% 15% 0 - 15% Nh 15% 5% St 5%
E 70% 45% 35% Ed 25% Lp 2% Ps 5% Other 3%
10% Pk 10% 25% Mp 5% Lp 3% Mg 15% Other 2%

Page 16 Doc # 2938322
References Biggs BJF 2000. New Zealand periphyton guideline: Detecting, monitoring and
managing enrichment of streams. Wellington, Ministry for the Environment. Biggs BJF, Kilroy C 2000. Stream periphyton monitoring manual. Published by NIWA
for the Ministry for the Environment. Christchurch, National Institute of Water and Atmospheric Research Ltd (NIWA).
Collier KJ, Kelly J 2005. Regional guidelines for ecological assessments of freshwater
environments: Macroinvertebrate sampling in wadeable streams. Environment Waikato Technical Report 2005/02. Hamilton, Waikato Regional Council (Environment Waikato).
Collier K, Hamer M 2012. The ecological condition of Waikato wadeable streams based
on the Regional Ecological Monitoring of Streams (REMS) programme. Waikato Regional Council Technical Report 2012/27. Hamilton, Waikato Regional Council.
Collier KJ, Olsen AR 2013. Monitoring network-design influence on assessment of
ecological condition in wadeable streams. Marine and Freshwater Research 64: 146–156

Doc # 2938322 Page 17
Appendix 1: Datasheet for periphyton rapid assessment.
Bryophytes and iron bacterial growths are recorded here for convenience (NA = not applicable) Stream: Located number: Sample Number:_______________ Date:
Transect
Thickness category
Colour category
A B C D E Mean cover
Thin mat/film (<0.5 mm thick)
NA
Medium mat (0.5-3 mm thick)
Green
Light brown
Black/dark brown
Thick mat (>3 mm thick)
Green/light brown
Black/dark brown
Short filaments (≤2 mm long)
NA
Long filaments (>2 cm long)
Green
Brown/reddish
Submerged bryophytes
NA
Iron bacteria growths
NA

Page 18 Doc # 2938322
Appendix 2: Datasheet for macrophyte rapid assessment.
Channel and wetted widths and depths are recorded here for convenience but are not used in the calculation of indices.

Doc # 2938322 Page 19
Stream: Located number: Sample Number:_______________ Date:
Transect
Wetted width (m)
Channel width (m)
Thalweg
depth (m)
Vegetation cover (% wetted area)
Total cover
Submerged plants Emergent plants
Total
submerged
Surface-reaching
Below surface
Sub-total
Species Sub-total
Species Total emergent
Species
1
2
3
4
5
SUBMERGED SPECIES EMERGENT SPECIES EMERGENT SPECIES
Cd Ceratophyllum demersum - HORNWORT As Agrostis stolonifera – CREEPING BENT Me Mentha spp. – WILD MINT Native Ec Elodea canadensis - CANADIAN PONDWEED An Apium nodiflorum - WATER CELERY Mep Mentha pulegium – PENNYROYAL Introduced Ed Egeria densa Apa Alisma plantago-aquatica – WATER PLANTAIN Mpc Mentha x piperita var. citrata - BERGAMOT MINT St Callitriche stagnalis - STARWORT Ap Alternanthera philoxeroides – ALLIGATOR WEED Ml Myosotis laxa – WATER FORGET-ME-NOT Lm Lagarosiphon major Eg Erythranthe guttata - MONKEY MUSK Ma Myriophyllum aquaticum - PARROTS FEATHER Mp Myriophyllum propinquum Gd Glyceria declinata – FLOATINGSWEET GRASS Na Nasturtium officinale/microphyllum - WATERCRESS Mt Myriophyllum triphyllum Gm Glyceria maxima - REED SWEET GRASS Gr Other grass spp Nh Nitella hookeri/cristata Ip Iris pseudacorus – YELLOW FLAG Pd Paspalum distichum – MERCER GRASS Pc Potamogeton cheesemanii – RED PONDWEED Ipr Isolepis prolifera – JUMPING RUSH Ps Persicaria decipiens - SWAMP WILLOW WEED Pk Potamogeton crispus - CURLED PONDWEED Ja Juncus articulatus – JOINTED RUSH Ph Persicaria hydropiper - WATER PEPPER Po Potamogeton ochreatus -BLUNT PONDWEED Lop Lotus pedunculatus - LOTUS Rf Ranunculus flamula – LESSER SPEARWORT PoS Potamogeton subolongus – MUD PONDWEED Lp Ludwigia palustris - WATER PURSLANE Ve Veronica anagallis-aquatica/Americana - WATER SPEEDWELL Rt Ranunculus tricophyllus – WATER BUTTERCUP Lup Ludwigia peploides – PIMROSE WILLOW Uid Unidentified Other species Uid Unidentified Other species Le Lycopus europaeus - GYPSYWORT

Page 20 Doc # 2938322
Appendix 3: Pictorial guide to some macrophyte species found in Waikato streams and rivers.

Doc # 2938322 Page 21
Lagarosiphon major (Lm)EXOTIC
Canadian pondweed (Ec)
Elodea canadensisEXOTIC
Egeria densa (Eg)EXOTIC
Nitella sp. aff. cristata (Nh)NATIVE
Leaves not in whorls
Usually bend downwards
Leaves in whorls of 3
Usually < 1 cm long
Much smaller than Egeria
Leaves in whorls of 4+
Usually > 1 cm long
White flowers
Stems leafy – oxygen weeds Stems of single cells –
charophytesBranches in whorls
Green or black
Easily crushedSUBMERGED
SPECIES
Starwort (St)
Callitriche stagnalisEXOTIC
Leaves opposite,
Upper leaves a rosette

Page 22 Doc # 2938322
Curled pondweed (Pk)
Potamogeton crispusEXOTIC
Blunt pondweed (Po)
Potamogeton ochreatusNATIVE
Leaves alternate
Leaves crimped, red
veined, short
Stems flattened
Leaves flat, veins
not red, leaves long
Stems round
SUBMERGED SPECIES
Submerged form:
Leaves wavy almost
transparent, veins not
red, leaves broader
with leaf stalk
Red pondweed (Pc)
Potamogeton
cheesemaniiNATIVE
Mud pondweed (PoS)
Potamogeton suboblongusNATIVE
Leaves
alternate,
pointed at tip,
13-21 veins
Surface-
reaching
form: Leaves
alternate,
blunt-ended,
5-11 veins

Doc # 2938322 Page 23
Water milfoil (Mp) NATIVE
Myriophyllum propinquum
Leaves lance-
shaped
feather-like.
Collapsing
around stem
when removed
from water
Water milfoil (Mt) NATIVE
Myriophyllum triphyllum
Leaves oval
feather-like.
Not collapsing
around stem
when removed
from water
Water buttercup (Rt)
Ranunculus trichophyllusEXOTIC
Leaves divided into
soft linear segments
Hornwort (Cd)
Ceratophyllum demersumEXOTIC
Leaves toothed
Rough to touch
No roots
SUBMERGED
SPECIES
Leaves divided
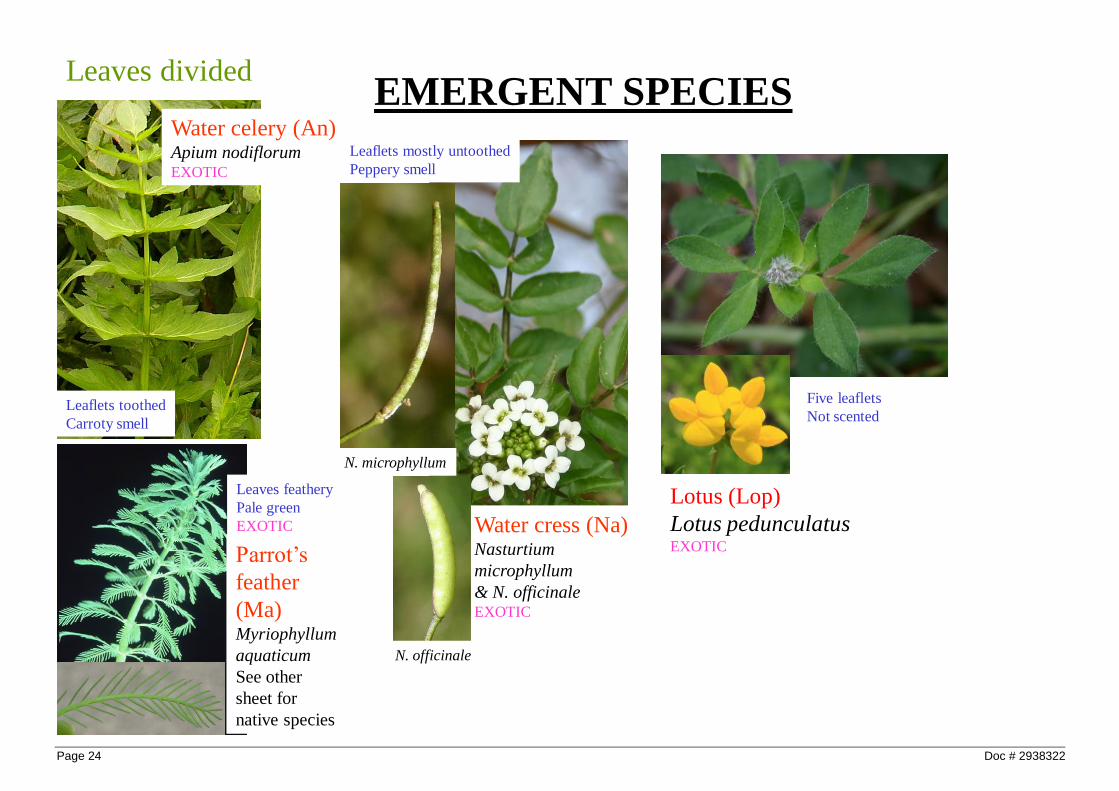
Page 24 Doc # 2938322
Parrot’s
feather
(Ma)Myriophyllum
aquaticum
See other
sheet for
native species
Water celery (An)Apium nodiflorumEXOTIC
Water cress (Na)Nasturtium
microphyllum
& N. officinaleEXOTIC
Leaves divided
Leaflets toothed
Carroty smell
Leaflets mostly untoothed
Peppery smell
Leaves feathery
Pale green
EXOTIC
EMERGENT SPECIES
N. microphyllum
N. officinale
Lotus (Lop)
Lotus pedunculatusEXOTIC
Five leaflets
Not scented

Doc # 2938322 Page 25
Leaves alternate, undivided
Primrose willow (Lup)
Ludwigia peploides EXOTIC
Spearwort (Rf)Ranunculus
flammulaEXOTIC
Stem with a
black or dark
green scale
beneath each
leaf
Leaves lance-shaped,
plants fleshy
Water pepper (Ph)Persicaria hydropiperEXOTIC
Leaves wrinkled, not shiny
Veins obvious
Swamp willow weed (Ps)Persicaria decipiens - NATIVE
Leaves smooth & shiny
Veins not obvious
Water forget-me-not (Ml) Myosotis laxa EXOTIC
Leaves long and
narrow, bristly hairy
EMERGENT SPECIES

Page 26 Doc # 2938322
Leaves undivided opposite
EMERGENT
SPECIES
V. anagallis-aquatica
Veronica americana
Water speedwell (Ve)Veronica americana/
anagallis-aquaticaEXOTIC
Leaves toothed,
lance-shaped
Short stalks
Water purslane (Lp)
Ludwigia palustris - EXOTIC
Monkey musk (Mg)Erythanthe guttata - EXOTIC
(formerly Mimulus guttatus)
Leaves not
joined across
stem, not
toothed
(can also be submerged)
Almost
circular,
toothed

Doc # 2938322 Page 27
Leaves grass-like (true grasses)
Floating sweet grass (Gd)
Glyceria declinata EXOTIC
Leaves <1 cm across
Leaf tips like prow of boat
Mercer grass (Pd)
Paspalum distichum EXOTIC
Leaves <1 cm across
Leaf tips pointed, bases hairy
Creeping bent (As)Agrostis stolonifera
Leaves <1 cm acrossLeaf tips pointed, bases not hairy
Reed sweet grass (Gm)Glyceria maximaEXOTIC
Leaves over 1 cm across
Plants ~ 1m tall
Leaf tips like prow of boat
EMERGENT SPECIES
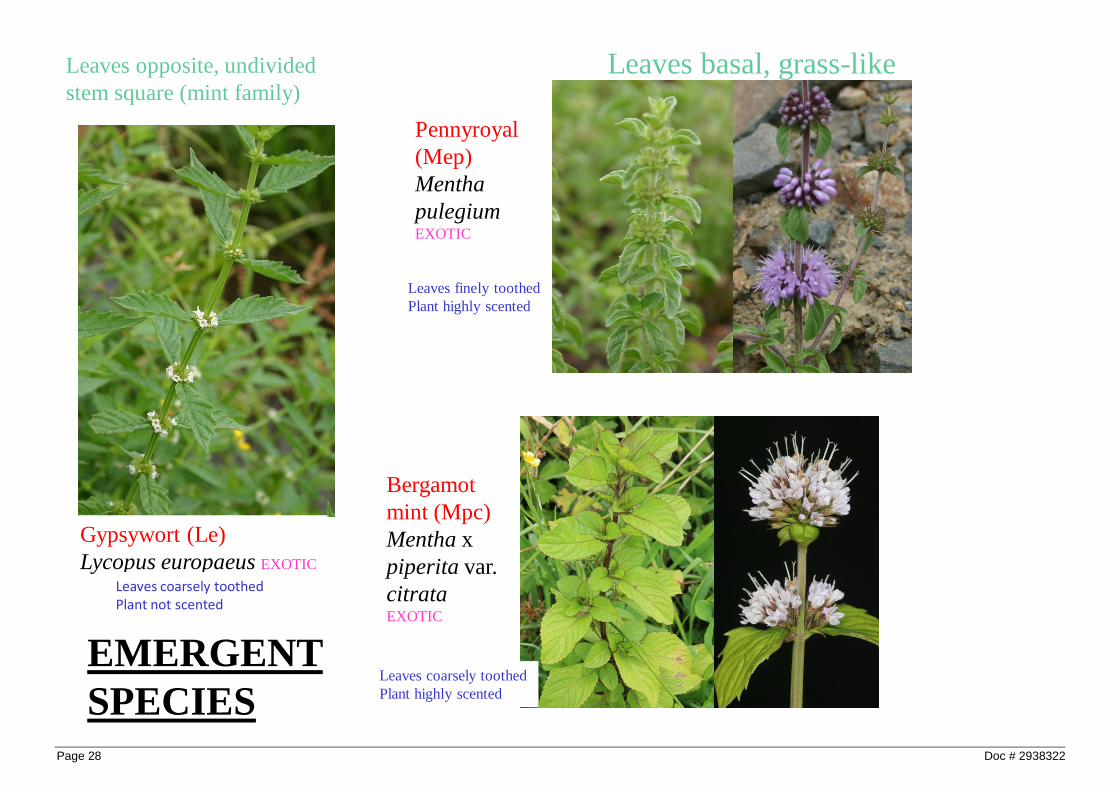
Page 28 Doc # 2938322
Leaves opposite, undivided
stem square (mint family)
Gypsywort (Le)
Lycopus europaeus EXOTIC
Leaves coarsely toothedPlant not scented
Pennyroyal
(Mep)
Mentha
pulegiumEXOTIC
Leaves finely toothed
Plant highly scented
Bergamot
mint (Mpc)
Mentha x
piperita var.
citrataEXOTIC
Leaves coarsely toothed
Plant highly scented
EMERGENT
SPECIES
Leaves basal, grass-like

Doc # 2938322 Page 29
Leaves grass or rush-like
(other plants)
Leaves upright, basal,
broad lance-shaped
Water plantain (Apa)
Alisma plantago-aquaticaEXOTIC
Leaves tubular with
cross-wallsJointed rush (Ja)
Juncus articulatusEXOTIC
Leaves reduced to sheaths,
stems
arch to form tangled mats
Jumping rush (Ipr)
Isolepis prolifera NATIVE
EMERGENT
SPECIES

Page 30 Doc # 2938322
Appendix 4: Pictorial guide to some macrophyte species that are considered biosecurity threats and may be found in Waikato streams and rivers (report these to the Biosecurity officer).

Doc # 2938322 Page 31
Water poppyFlowers Nov-April
NATIONALLY
BANNED
MarshwortFlowers Nov-April
NATIONALLY BANNED Fringed waterlilyFlowers Oct-April
NATIONALLY
BANNED
Water hyacinth
NOTIFIABLE
ORGANISM
Salvinia
NOTIFIABLE ORGANISM
NASTIES – KEEP AN EYE OUT FOR – REPORT SIGHTINGS!!
Water poppyFlowers Nov-April
NATIONALLY
BANNED
MarshwortFlowers Nov-April
NATIONALLY BANNED Fringed waterlilyFlowers Oct-April
NATIONALLY
BANNED
Water hyacinth
NOTIFIABLE
ORGANISM
Salvinia
NOTIFIABLE ORGANISM
NASTIES – KEEP AN EYE OUT FOR – REPORT SIGHTINGS!!

Page 32 Doc # 2938322
Purple loosestrifeFlowers during summer
NATIONALLY BANNED
Yellow flagFlowers Oct-Dec
NATIONALLY BANNEDPresent in Lower Waikato
ArrowheadFlowers Oct-April
NATIONALLY BANNED
Alligator weed
NATIONALLY
BANNED
Senegal teaFlowers Nov-April
NATIONALLY BANNED
SagittariaFlowers Nov-March
NATIONALLY BANNED
NASTIES – KEEP AN EYE OUT FOR – REPORT SIGHTINGS!!

Doc # 2938322 Page 33