Regional Employment Report by ADP: June 2013
1
Breakdown of Selected States Region New England Mid-Atlantic East North Central West North Central East South Central South Atlantic West South Central Mountain Pacific State 6 Month Avg. Employment Change Difference Current Month - / + 1,170 2,600 2,540 6,720 5,340 4,280 5,660 2,770 3,420 3,050 2,030 1,530 3,510 930 11,470 4,710 2,610 4,930 2,680 4,660 23,420 4,920 3,430 1,290 2,440 2,760 18,190 2,550 4,020 -1,890 -510 -210 -450 -2,180 -310 -120 1,540 3,550 2,890 10,000 9,370 6,560 8,500 4,370 4,760 2,540 3,380 3,220 3,690 720 12,910 4,880 2,160 2,750 3,420 5,730 23,420 5,210 4,400 1,300 3,070 2,450 31,040 2,430 6,190 CT MA NJ NY PA IN IL MI OH MN AL KY TN DC FL GA MD NC SC VA TX AZ CO ID NV UT CA OR WA 2,870 980 WI 170 1,440 950 370 350 2,840 2,280 1,340 1,600 1,690 1,350 180 740 1,070 970 - 290 10 630 12,850 2,170 4,030 3,280 California 31,040 Illinois 8,500 New York 10,000 New Jersey 2,890 Florida 12,910 Texas 23,420 Employment Change in Key States Employment Change by Region * * Sum of components may not equal total due to rounding. West South Central 29,000 Mountain 16,000 East South Central 10,000 West North Central 11,000 Pacific 33,000 East North Central 25,000 New England 7,000 Mid-Atlantic 22,000 South Atlantic 36,000 Change in U.S. nonfarm private sector employment. 188,000 JUNE 2013 ADP and the ADP logo are registered trademarks of ADP, Inc. The ADP Regional Employment Report is a service mark of ADP, Inc. Copyright © 2013 ADP, Inc. Employment by state is determined by the state location of the worker’s payroll. In most cases, this approach aligns with the Bureau of Labor Statistics’ measure of establishment employment, reflecting the state where an employee works. In some cases, a payroll located in a certain state may include employees from one or more states outside that state. Regional Employment Report
Transcript of Regional Employment Report by ADP: June 2013
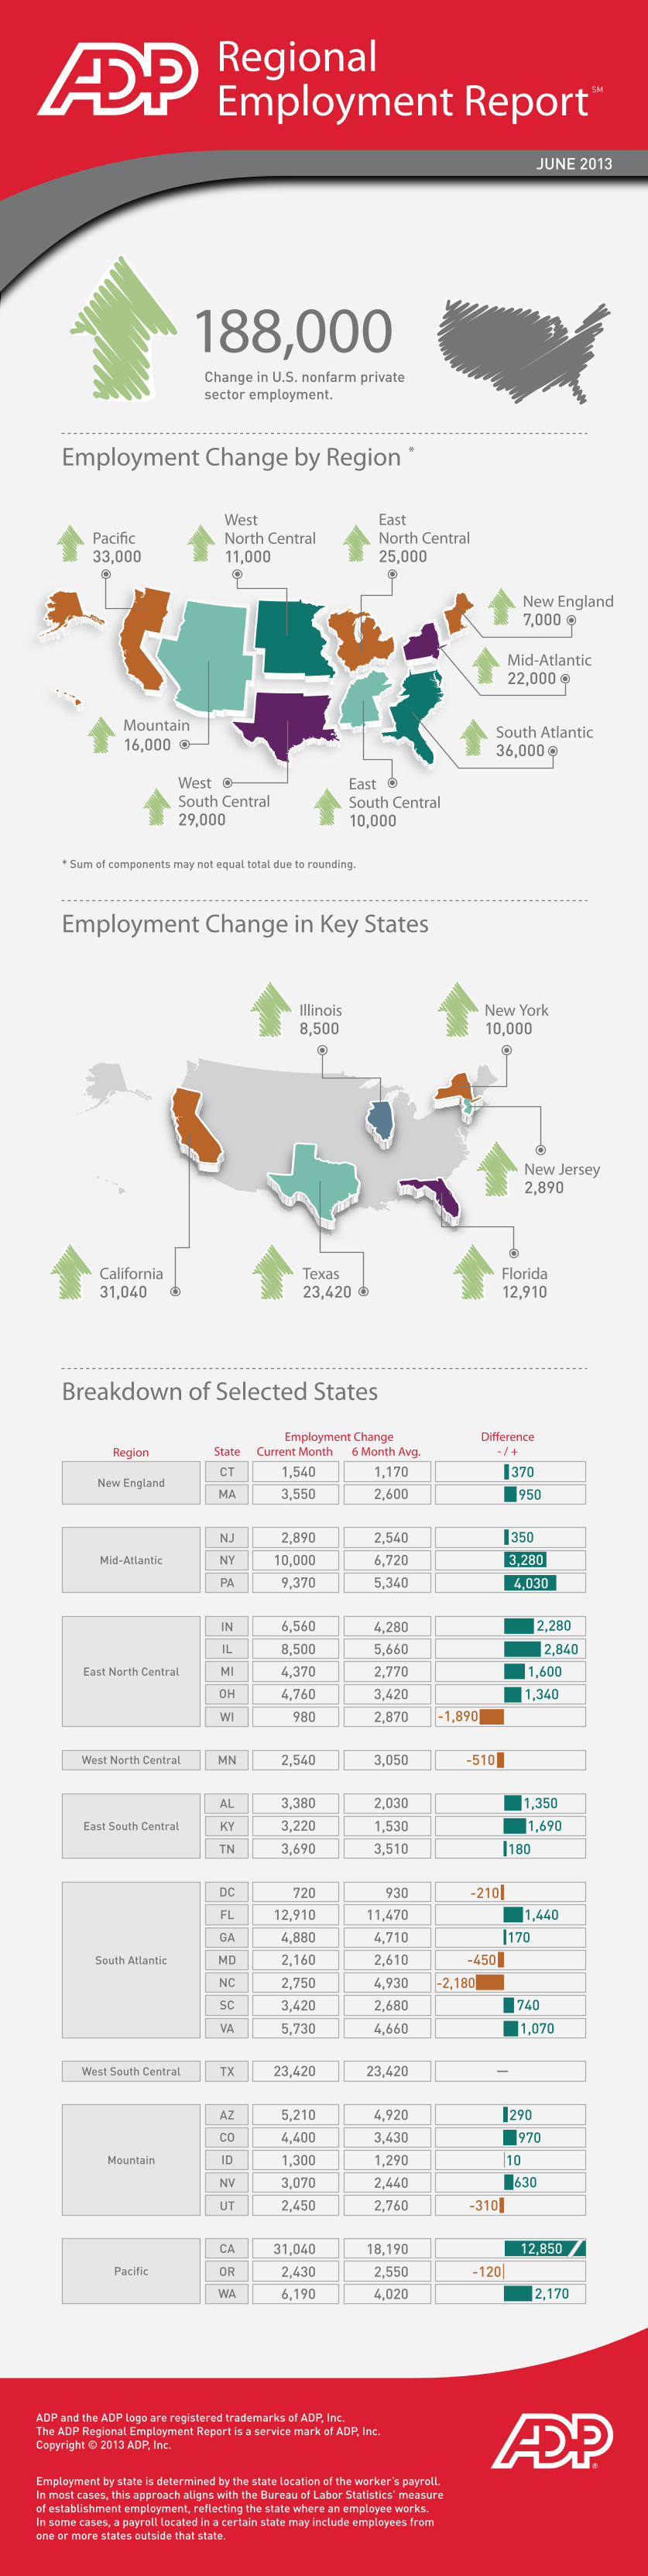
Breakdown of Selected States
Region
New England
Mid-Atlantic
East North Central
West North Central
East South Central
South Atlantic
West South Central
Mountain
Pacific
State 6 Month Avg.Employment Change Di�erence
Current Month - / +
1,1702,600
2,540
6,720
5,340
4,2805,660
2,770
3,420
3,050
2,030
1,530
3,510
93011,470
4,710
2,610
4,930
2,680
4,660
23,420
4,920
3,430
1,290
2,440
2,760
18,190
2,550
4,020
-1,890
-510
-210
-450
-2,180
-310
-120
1,5403,550
2,890
10,000
9,370
6,560
8,500
4,370
4,760
2,540
3,380
3,220
3,690
72012,910
4,880
2,160
2,750
3,420
5,730
23,420
5,210
4,400
1,300
3,070
2,450
31,040
2,430
6,190
CT
MA
NJ
NY
PA
IN
IL
MI
OH
MN
AL
KY
TN
DC
FL
GA
MD
NC
SC
VA
TX
AZ
CO
ID
NV
UT
CA
OR
WA
2,870980WI
170
1,440
950
370
350
2,840
2,280
1,340
1,600
1,690
1,350
180
740
1,070
970
-
290
10630
12,850
2,170
4,030
3,280
California31,040
Illinois8,500
New York10,000
New Jersey2,890
Florida12,910
Texas23,420
Employment Change in Key States
Employment Change by Region *
* Sum of components may not equal total due to rounding.
WestSouth Central 29,000
Mountain16,000
EastSouth Central 10,000
WestNorth Central 11,000
Paci�c33,000
EastNorth Central 25,000
New England7,000
Mid-Atlantic22,000
South Atlantic36,000
Change in U.S. nonfarm privatesector employment.
188,000
JUNE 2013
ADP and the ADP logo are registered trademarks of ADP, Inc. The ADP Regional Employment Report is a service mark of ADP, Inc. Copyright © 2013 ADP, Inc.
Employment by state is determined by the state location of the worker’s payroll. In most cases, this approach aligns with the Bureau of Labor Statistics’ measure of establishment employment, reflecting the state where an employee works. In some cases, a payroll located in a certain state may include employees from one or more states outside that state.
Regional Employment Report