Regional Economic Integration and Global Value Chains: An ... · Regional Economic Integration and...
45
Regional Economic Integration and Global Value Chains: An International Input-Output Analysis Bo MENG 1 , Yong FANG 2 and Norihiko YAMANO 3 Abstract The expanding cross-border activities of firms, like the so-called vertical specialization, outsourcing and fragmentation production, have boosted dramatic changes in the international economic interdependence among countries during the last two decades. In an attempt to understand the evolution of the interaction between countries, many trade statistics based indicators have been developed. However, most of them focus on showing the direct trade-specific-relationship between countries, rather than considering the roles that inter-country and inter-industrial production networks play in the international economic interdependence. Based the concept of Trade in Value Added measured by the OECD input-output tables and the end-use-level bilateral trade data, this paper provides some alternative indicators to show the evolution of regional economic integration and global value chains for more than 40 main economies at detailed industrial level from both demander and supplier’s perspectives. In addition, this paper also provides an idea about how to evaluate the roles of intermediate goods and final goods separately in the measurement of global value chains by using an international input-output model. Keywords: Global value chain, trade in value added, economic interdependence, input-output 1. Research fellow, IDE-JETRO. 2. Associate professor, School of Business, Nanjing University, China. 3. Administrator, STI, OECD.
Transcript of Regional Economic Integration and Global Value Chains: An ... · Regional Economic Integration and...

Regional Economic Integration and Global Value Chains:
An International Input-Output Analysis
Bo MENG1, Yong FANG
2 and Norihiko YAMANO
3
Abstract
The expanding cross-border activities of firms, like the so-called vertical specialization, outsourcing
and fragmentation production, have boosted dramatic changes in the international economic
interdependence among countries during the last two decades. In an attempt to understand the
evolution of the interaction between countries, many trade statistics based indicators have been
developed. However, most of them focus on showing the direct trade-specific-relationship between
countries, rather than considering the roles that inter-country and inter-industrial production
networks play in the international economic interdependence. Based the concept of Trade in Value
Added measured by the OECD input-output tables and the end-use-level bilateral trade data, this
paper provides some alternative indicators to show the evolution of regional economic integration
and global value chains for more than 40 main economies at detailed industrial level from both
demander and supplier’s perspectives. In addition, this paper also provides an idea about how to
evaluate the roles of intermediate goods and final goods separately in the measurement of global
value chains by using an international input-output model.
Keywords: Global value chain, trade in value added, economic interdependence, input-output
1. Research fellow, IDE-JETRO.
2. Associate professor, School of Business, Nanjing University, China.
3. Administrator, STI, OECD.

1. Introduction
The increasing presence of Global Value Chinas (GVCs) has been considered one of the most
important features of the rapid economic globalization. The representative phenomenon relating to
the context of GVCs includes the so-called “Vertical Specialization”, “Fragmentation Production”,
“Outsourcing”, “Supply Chains” and so on. Namely, much more intermediate goods and services,
like parts and components are produced in sub-sequential stages or processes across different
countries, and then exported to other countries for further production. The production systems of
Apple’s products (see Linden et al., 2009; Dedrick et al., 2010 and Xing and Detert, 2010) and
Boeing’s commercial airplanes Dream 787 are the most famous and widely quoted cases in the
explanation of the rapidly spreading GVCs.
On the other hand, given the current difficulties and challenges of the WTO Doha Round
negotiations, the discussion on regional economic integration, regional trade agreements (RTAs) and
its impact has got much more attention from both academic and governmental sides (Murray, 2011,
Neffke and Boschma, 2011, Sierra, 2011). Such movement is mainly due to the fact that, the
interaction among countries within the same region or the interdependence in regional trade and
production networks has very important implications not only for economic development, but also
for the location of international business activity.
Given the importance of understanding the mechanism and structure of regional integration, a
number of researches have been done in this field using different approaches and data sources. One
of them is the politically based approach that employs macro-data to study the influence of
harmonized laws and regulations (Murray, 2010, Cherry, 2011). The other approaches focus on the
economic impacts when countries or economies are integrated by normalized economic agreements,
like FTA, EPA and RATs (Dunning, 2007, Hiratsuka and Kimura, 2008, Volz, 2011, Batra, 2012). In
addition, the data sources used in the previous studies vary according to the difference of model
requirements and analysis purpose. For example, UNCTAD (2009), Pula and Peltonen (2009) use
FDI and trade statistics to show the economic rationales of regional integration; Rugman and
Verbeke (2004), Piekkari, et al. (2010) utilize firm-based data, such as foreign MNEs sales to
analyze the regional integration from the viewpoint of firm’s perspective. However, just a few
researches concentrate on the structural change of production networks, GVCs and industry cluster
by using the international Input-Output (I-O) data when considering the impacts of regional
integration (Kuroiwa and Heng, 2008).
This paper follows Kuroiwa and Heng’s (2008) approach, but much more newly developed measures

based on the I-O model are used for measuring the evolution of regional integration from the
viewpoint of GVCs. For the recent I-O based GVCs indicators, one can refer to Hummels et al.
(2001), Koopman et al. (2008, 2010), Uchida and Inomata (2009), Yang et al. (2009), Timmer (2010),
Johnson and Noguera (2011), Yamano et al. (2011), Meng et al. (2011), Abdul et al. (2011), Sterher
(2012) and so on.
The main objective of the paper is to use the newly developed I-O based GVCs indicators to show
the mechanism and structure of the deepening regional economic integration of such as NAFTA,
Europe and Asia from the viewpoint of production networks and international spillover effects.
Comparing and measuring the process and degree of regional economic integration between these
regions can provide us very constructive opinions for the future policy design concerning the
economic development of Asian region.
The rest of the paper is organized as follows: Section 2 uses the up-to-date OECD Bilateral Trade
Database by Industry and End-use, (BTD, 1988-2010) to show the evolution of global trade structure
at both detailed industrial (ISIC 3.0 with 37 sectors) level and end-use category (separated as
intermediate goods, final consumption goods, capital goods) level. We also use a simple model to
show the contribution share of different countries and category in the growth of total international
trade. In addition, grouping countries into different regions, detailed intra and inter-regional trade
structure can be easily illustrated. Section 3 first explains how to use the international I-O framework
to measure the Trade in Value Added (TiVA) from both “demander’s perspective” and “supplier’s
perspective”. Then we propose an alternative measurement of comparative advantage based on the
concept of TiVA. In addition, we also show how to use the I-O framework to measure “who
produces intermediate goods for whom”. In Section 4, based on the calculation results of the
measurement proposed in Section 3, we discuss the features and changing pattern of regional
integration and global value chains. The conclusion remarks are given in Section 5.
2. Evolution of global trade and regional economic interdependence
2.1 Historical evolution of international merchandise trade
In the OECD Bilateral Trade Database by Industry and End-use (BTDIxE), commodities are grouped
into the following categories: intermediate goods, household consumption goods, capital goods,
passenger cars, personal computers, packed medicaments, personal phones, valuables and others. It
should be noted that goods like passenger cars, personal computers, packed medicaments and
personal phones can be used by firms as intermediated inputs or directly can be consumed by

households. Therefore, in the OECD BTDIxE, these items are grouped as individual category. In
addition, since the price change of fuel related sectors is very unstable, we just use the non-fuel
merchandise trade data in this section.
Figure 1 illustrates the historical evolution of trade in goods by different end-use category. It is
apparent from the chart that the entire evolution from 1995-2010 can be divided into 3 main phases.
In the first phase of 1995-2002, total trade in goods shows slow growth and a small peak in 2000. In
the second phase of 2002-2008, world trade has significantly increased comparing with the first
phase. In the third phase of 2008-2010, due to the financial crisis and the later world economic crisis
(the Great Trade Collapse), world trade was heavily damaged but showed a “V” shaped quick
recovery.
Comparing the movement of trade by category, it’s easy to see that the trade in intermediated goods
can be considered as a main driving power of world total trade in goods. Especially during the Crisis,
it seems that trade in intermediate goods shows very sensitive changing pattern, which can be used
to explain the main source that causes the “V” shaped recovery for the total trade. The movement of
intermediate goods also clearly reflects increased globalization and the development of
fragmentation productions in the manufacturing sectors. However, when we calculate the share of
every category in total trade (see Figure 2), it’s easy to confirm that all categories have remained
very stable over the last 15 years. This fact indicates that at the absolute level of the contribution by
different category in total trade is stable, but given the difference of their shares and growth rates, the
relative level by category may show different pattern.
In order to provide much more detailed information on the contribution by category, we use the
following simple model to calculate the relative contribution rate. The model gives the contribution
of different category to the growth of total trade in goods by considering the absolute share of
individual category in total trade and their growth rate together.
For simplicity, the growth rate of total trade in goods is given as the following form:
(2.1)
where represents the growth rate of total trade q from the year of t-1 to t. is the trade value
for year t. The above equation can be easily rewritten as follows:

(2.2)
where represents the trade value in terms of category i for year t. Further re-arranging the right
side of the above equation, the growth rate of total trade can be given as follows:
(2.3)
(2.4)
(2.5)
where, represents the share of category i in total trade for year t,
is exactly the growth rate
of trade in terms of category i from year t-1 to year t. Then we can easily define the contribution rate
of trade by category i to the growth of total trade as
(2.6)
Obviously,
and the relative contribution rate by category ( ) not only depends on its
share in total trade ( ) but also on its growth rate (
).
Based on the above equations, the relative contribution by category is calculated and the result is
shown in Figure 3. Clearly, trade in intermediated goods provides the dominant contribution to the
growth of total trade for both periods (1996-2002 and 2002-2008) followed by household
consumption and capital goods. When looking at the shares by different category over time, great
changes can be observed. Intermediate goods enhanced their presence from 40.43% to 57.01%. This
means that the rapid growth of global trade after 2002 mainly depends on the increasing
performance of trade in intermediate goods. Comparing to the relatively stable tendency for
household consumption goods, the contribution from capital goods doubled over time from 9.6% to
16.47%. This makes the capital goods become the second main source of the rapid growth of total
trade in goods during 2002-2008. On the other hand, contributions from all the other categories, such
as passenger cars, packed medicaments, personal computers went down over time.
There are several facts which can be used to explain the above dynamic changes in global trade. First,
the continuous reduction of international trade cost including tariff and non-tariff costs is one of the

most important facts. Especially, it should be pointed that tariffs on intermediate goods, like parts
and components, are usually lower than the tariffs on final goods during the last 20 years. This
boosts the volume and diversity of parts and components being exchanged all over the world. The
second fact is the free movement of capital, such as the foreign direct investment (FDI) which has
played an important role in the expansion of trade in intermediated goods. At the same time, related
to the first and second facts, the increasing fragmentation of value chains, especially the so-called
intra-firm trade becomes possible to spread globally, and has led to an increase of trade flows in
intermediate goods. Finally, domestic market-oriented economic reforms undertaken in some
developing economies, such as China should also be considered a very important factor. Since their
domestic economic reforms provide large opportunities for the countries or the multinational
enterprises located there to be involved in global production networks.
Using the same method shown in the previous equations (let subscript i represent country name), the
country-specific contribution rate can be also computed. Before we show the calculation results, we
need give a short introduction on the trade data used here. It should be noted that trade data can be
collected from two ways. One is from export statistics, the other one is from import statistics. Since
in principle, import statistics follow the “rule of origin”, it is supposed that the so-called “mirror
problem” (a country’s exports may not equal its partner’s imports) caused by re-export can be
avoided by using import data. Therefore, in this chapter, the trade data (export or import) are both
from c.i.f. price based import statistics.
The country-specific contribution can be illustrated from supply (export) and demand (import) sides
respectively. For the supply side, the top 30 contributors are listed on the left side of Table 1. For
both periods, without considering the contribution from the rest of the world, the top 30
countries/regions account for more than 90% of the total contribution. Looking at country-specific
contributions, China shows the largest figure followed by Germany and the USA. Japan also
enhanced its presence over time from 1.54% to 5.36%. This fact indicates that China, Germany,
USA, Japan and France have played the most important role as exporters to make the global trade
increase rapidly. On the other hand, the similar pattern can also be found on the right side of Table 2.
Namely these main countries also make the dominant contribution to the growth of global trade as
importers. However, comparing to supply side, much more dynamic changes can be found at the
demand side. For example, the USA lost its dominant role from 34.59% to 9.15%; China’s figure
also went down from 14.23% to 9.61% over the two periods. The lost shares by the USA and China
have been occupied by other economics. This makes the distribution of country-specific contribution
much flatter across countries. Especially, the fact that the contribution from the rest of the world
increased rapidly from 5.54% to 12.88% over the two periods also can be considered the evidence

that much more small economies have been involved in global trade networks.
2.2 Global supply and demand centers
This section focuses on evaluating the movement of global trade hubs by using the “dominant links”
(see Yamano et al., 2011) of trade flows in goods by different end-use categories. As a dominant link
we consider a country’s exports in goods to a particular partner country exceeding a given threshold
percentage of that country’s total imports. In the current exercise we use 10% as a threshold when
exploring trade nodes. If relatively a large number of countries’ imports depend on the exports
(supply of goods for foreign use) of a specific country, this country can be considered the supply
center in global trade. In the same way, if a large number of countries’ exports depend on the imports
(domestic demand on goods produced outside) of a specific country, this country can be considered
the demand center.
Given the bilateral trade data for 65 countries by end-use categories, the supply and demand centers
can be easily identified (see Figure 4). Obviously, larger industrialized economies are expected to be
identified as dominant trade partners for smaller ones in respective regions, as differentiation and
specialization take place around these larger economies. When looking closely at the figure, some
features can be summarized below: (1) Germany maintains the leading position of trade center from
both viewpoints of supply and demand sides during the last 15 years. For example, more than 35
countries heavily depend on Germany’s supply of intermediated goods. At the same time, more than
25 countries heavily depend on Germany’s demand of intermediated goods. The most important
feature for Germany is that its leading position can be kept very stably over time. (2) The United
States is one of the most important trade centers, but its presence decreased rapidly in the last 15
years. For example, there were more than 25 countries, whose over 10% exports of intermediated
goods were shipped to the United States in 2000. However, the number of this kind of partner
countries for the United States goes down rapidly to 10 in 2010. (3) Comparing with the United
States, China shows very different movement. Especially China’s supply power increased
dramatically after its accession of WTO in 2001. This situation can be easily confirmed from the
supply of final consumption goods. In 1995, just 10 countries have relatively high dependency on
China’s products of final goods. However, in 2010, more than 45 countries, whose more than 10%
imports are from China. This fact also reflects why China has been called “world factory”. The
increasing presence of China’s supply power can also be seen for intermediated goods and capital
goods. In 2010, China has been the largest supply center for final consumption goods, and second
largest supply center for intermediated and capital goods. On the other hand, China also has been the
second largest demand center for intermediate goods. It is not a surprise since China has been deeply

involved in the global supply chains by the way of using much more imported intermediate goods to
produce exporting goods for all over the world. However, unlike the case of Germany, China is not
an important demand center yet for final consumption goods comparing with its supply power. There
are several reasons which can be used to explain this phenomenon. This first one is that China’s
purchasing power on foreign consumption goods is still low because of its relatively lower per
capital GDP. The second reason is that much more demand of consumption goods for China’s
domestic consumers can be satisfied by its domestic supply because of the relatively cheaper price
and large production capacity of goods made domestically. (4) Japan’s movement is similar to
Germany, but its presence has decreased slowly over time.
In general, the United States and Japan’s positions in global trade have been replaced by China to
some extent. The United States lost its leading position for both supply and demand centers in terms
of trade in goods is mainly because its economic (supply and demand) structure has become much
service-oriented or service-specialized. The United Kingdom also lost its supply and demand power
rapidly in global trade with very similar reason as pointed for the case of the United States. For the
case of Japan, including the same reason shown above, its production capacity has moved to its
neighbor countries, such as China by the way of FDI due to the increasing domestic labor cost and
other market related reasons.
2.3 Inter and intra-regional trade pattern
In order to investigate the evolution of inter and intra-regional trade, we divide the whole countries
covered in the OECD bilateral trade database into several groups. They are EU27 (including EU15
and the rest of EU27), NAFTA, South America, ERIA+ (including ASEAN, East Asia, and the rest
of ERIA+), the rest of the world (ROW). For the detail of the member in region groups, one can
refer to Appendix 1.
The upper and middle parts in Table 3 show the percentage share of inter and intra-regional trade in
the global merchandise trade for 1995 and 2010 respectively. The bottom part of Table 3 shows the
change rate of interregional trade share between 1995 and 2010. Obviously, the intra-regional trade
flow within EU27, NAFTA and ERIA+ accounts for almost 50% of the total global trade. This fact
clearly reflects the situation of deepening regional integration or a blocked world economy. However,
when looking at the change rate of the intra-regional trade, it’s easy to see that EU27 (from 26% to
20.7%) and NAFTA’s (from 7.3% to 6.0%) figures decreased but ERIA+ (from 18% to 23%)
increased in the last 15 years. According to this fact, it can be concluded that, although there is not
any common custom union in ERIA+, but this region has experienced rapid economic integration by

the way of quickly expanded intra-regional production networks. In addition, although the absolute
share of intra-regional trade within the rest of EU27 is still small, but its dramatic change (185.1%)
over the last 15 years indicates that this region has been enhancing its intra-regional linkages rapidly.
When looking at the changing pattern of interregional trade, some interesting features can be
summarized as follows: (1) the presence of EU15 and NAFTA as both a supplier and demander in
global trade decreased rapidly. This fact can be easily confirmed from Table 3. For example, the
share of EU 15’s exports deceased from 37.7% to 28.2% over the 15 years. A very similar situation
can be found for NAFTA; (2) ERIA+ tends to import much more goods from the rest of EU27,
South America, ROW and ERIA+ itself rather than from EU15 and NAFTA. ERIA+’s exports also
show increasing tendency for almost all its partners except NAFTA; (3) ASEAN has been deeply
involved in the production networks of ERIA+ region, since its interdependence on EU15 and
NAFTA for both exports and imports has decreased over the last 15 years; (4) the global trade
structure has become much flatter because of the increasing presence of the rest of EU27, South
America, ERIA+ and ROW. Especially the expanding South-South trade has been an important
symbol of the ongoing globalization and regional integration. For more detailed information on the
evolution of interregional trade by end-use category, one can refer to the Appendix 2, 3 and 4.
3. Input-Output based measure of global value chains
3.1 The concept and measurement of trade in value added in a single national I-O framework
The TiVA can be simply defined as “domestic value added embodied in trade (export or import)”. If
the “trade” mentioned here indicates a home country’s export, the TiVA measures the home
country’s domestic value added embodied in its export. In turn, if the “trade” indicates a home
country’s import, the TiVA means its partner country’s domestic value added embodied in home
country’s import.
For the ease of explanation on the concept of TiVA, we model a closed economy with just two
countries (r and s) and n sectors for each country. At the first step, let’s assume that we just know the
information of country r’s national I-O table with separate import matrix (see Figure 5). In this
single national I-O framework, country r’s total value added can be given as the following form
based on the traditional I-O theory.
, (3.1)

where, VAr represents country r’s total value added (scalar), V
r is the (1×n) row vector of value
added ratio (the share of domestic value added in total output) by sector for country r, Arr is the (n×n)
matrix of country r’s domestic input coefficients, FDr is the (n×1) column vector of country r’s total
final demand, Lr is country r’s domestic Leontief inverse in a single national I-O
framework, FDrr is the column vector of country r’s domestic final demand, EX
rs is the (n×1) vector
of exports from country r to country s. Since there are just two countries in this economy, naturally,
EXrs is the total exports of country r.
Clearly, a country’s total value added can be expressed by two parts. Namely, the value added
induced by domestic final demand ( ), and the value added induced by total exports
( ). The second part can be tentatively considered a measurement of the TiVA for
country r when just a single national I-O table is available for us. In addition, it should be noted that
in a single national I-O framework, the following equation always holds:
(3.2)
where, u is a 1×n unity vector, M is the n×n matrix constructed by intermediate import coefficients.
Multiplying country r’s export vector to both sides of the above equation yields:
(3.3)
It’s easy to see that the second term on the left side of the above equation indicates the “import
contents of export” (Hummel et al., 2001). Clearly, a country’s domestic value added embodied in its
export can be measured by the difference of its total exports ( ) and its import contents of
export. In other words, if country r does not need any intermediate imports for production of exports,
the measurement result of TiVA for country r should be the same figure of exports itself.
In addition, if the end-use based international trade statistics is available, country r’s total exports
can be separated by intermediate and final goods as shown below:
, (3.4)
where, and are respectively country r’s exports of final goods (n*1 column vector)
and exports of intermediate goods (n*n matrix) shipped to country s. Still using the single national
I-O framework, country r’s TiVA in terms of its exports of final goods and intermediate goods can be

tentatively defined as follows:
(3.5)
(3.6)
where, and represents the value added induced by country r’s exports of final
goods ( ) and intermediate exports ( ) respectively.
3.2 Measuring the TiVA in an international I-O framework
When we adopt the single national I-O framework for the measurement of TiVA, can be
easily measured since country r’s exports of intermediate goods are treated as exogenous variable.
Here, an important question arises. Namely, if an international I-O framework is given, the export of
intermediate goods should be considered endogenous variable, at this situation, how can we measure
the trade in value added for intermediate goods? In order to answer this question, we extend the
single national I-O framework of a closed economy used in Figure 5 to a two-country international
I-O framework (see Figure 6) in which the trade of intermediate goods between these two countries
is treated as an endogenous variable. Based on traditional I-O model, the total value added can be
given as the following form:
, (3.7)
, ,
,
.
where, VAr is the (n×1) column vector representing country r’s value added by sector, V
r is the (1×n)
row vector of value added ratio by sector for country r, L is the international Leontief inverse
constructed by its sub-matrix Lrs. A
rs represents the (n×n) matrix of international input coefficients
from country r to country s, FDrs is the (n×1) column vector representing country s’s final demand on
the goods and services produced in country r. Following the definition of TiVA proposed by Johnson
and Noguera (2009), it’s easy to formulate country r’s value added exported to country s as shown
below:
(3.8)

Namely,
(3.9)
Since, the above concept represents country r’s value added induced by country s’s final demands,
we call this type measure as demand-based TiVA. In order to understand the spatial structure of TiVA
across countries in detail, the following decomposition technique can be applied to equation (3.9):
(3.9’)
The first term on the right side of the above equation indicates the induced TiVA through domestic
production networks when a single national I-O framework is used; the second term can be
considered the achieved TiVA through international feedback effect; the third term is clearly the
induced TiVA through international spillover effect. The second and third terms can be aggregately
regarded the induced TiVA through international production networks.
In addition, according to Miller and Blair (1985), the international Leontief inverse can be expressed
by the following terms:
Using the above equations, can be rewritten as follows:
]
(3.10)
Obviously, can be separated into two parts. The first part is exactly equal to
(see Equation 3.5). This part represents country r’s value added induced by its exports of
final goods shipped to country s (measured by the single national I-O model). The remaining part

may be defined as the value added induced by the trade flow of intermediates from
country r to s. This trade flow is the indirectly induced intermediate goods by country s’s final
demand in the international I-O framework. Therefore, using this measurement, the contribution of
trade in final goods and intermediate goods can be separately evaluated within the international I-O
model.
Furthermore, at the product (sector) level, we can regard the induced value added in a specific sector
j by a specific trade flow of final product i from country r to country s as “an individual TiVA
linkage” which is defined as follows:
(3.11)
Based on the above definition, country r’s export of sector j’s value added to country s ( ) and
country r’s export of value added to country s in terms of the trade flow of product i ( ) can
be measured respectively as follows:
(3.12)
(3.13)
On the other hands, when considering the equation again from the supply-based aspect, country r’s
export of value added to country s can be defined as follows:
(3.14)
Namely,
(3.15)
Using Miller and Blair’s equation, can also be re-written as
(3.16)
The above represents the induced value added in country r when country s provides final
products to all over the world. With the same manner as shown in equation 3.11, the individual

supply-based TiVA can be written as follows:
(3.17)
(3.18)
(3.19)
3.3 TiVA based indicator for the measurement of Revealed Comparative Advantage
The concept of RCA is mainly based on the theory of Ricardian comparative advantage. It represents
the relative advantage or disadvantage of a certain country in international economics for a certain
class of goods or services. The most widely used indicator of RCA (see Béla Balassa, 1965) is given
as follows:
, (3.20)
where, represents country r’s exports of good i. is the total exports of country r. When all
countries’ exports just include their domestic contents, the above RCA can be considered a
reasonable indicator of Comparative Advantage. However, as mentioned before, when much more
intermediate imports are embodied in exports, this indicator may lose its original interpretability.
Using the concept of sector-level or product-level TiVA proposed in the paper, a country’s
comparative advantage can be measured as the following two ways:
(3.21)
(3.22)
(3.23)
(3.24)
where,
,
,

,
,
In the above definition, represents the TiVA based comparative advantage of country r’s
sector j from the aspect of global consumption on products produced in country r. The other
indicators proposed here can also be easily explained by using the concept of TiVA.
3.4 Who produces intermediate products for whom?
In the previous section, we proposed some TiVA based indicators to measure spatial economic
interdependency. These indicators are based on international I-O model. In this kind of model, both
final demand item and value added item are treated as exogenous variables; trade of intermediate
goods and services among countries is treated as an endogenous variable. That’s why we can
measure how a country’s final demand affects other country’s value added by the way of transaction
of intermediate trade. However, the above indicator cannot show us how the intermediate trade plays
what kind of role in international production networks in detail. Still using international I-O model,
we propose a simply way to measure the function of intermediate trade in production networks.
Given the same two-country I-O model as shown in Figure 6, according to traditional demand-driven
I-O model, the intermediate transaction from country 1 to country 2 ( : country 1’s export of
intermediate goods and services to country 2) can be formulated as follows:
. (3.25)
Rearranging the above equation yields
1=
+
+
+
. (3.26)
Obviously, a’, b’, c’ and d’ provide us the information about how the intermediate exports from
country 1 to country 2 end up or contribute to which country’s final demand. This information can
not only help us answer the question, like “who produces what for whom?”, but also show us the
spatial economic interdependence among countries from the viewpoint of the relationship between

intermediate and final products. The following equation gives the general form for calculating how
the trade in intermediate products directly and indirectly contributes to different type of final
demands across countries by the way of international supply chains.
(3.26’)
where, shows the contribution rate of induced trade in intermediate products shipped from
country R to S by country s’s final demands on country r’s products in total intermediate transaction
from country R to S. When changing our viewpoint, the following indicator can also show us some
alternative information on the aspect of “who produces intermediate goods for whom”.
(3.26’’)
where, shows the contribution rate of induced trade in intermediate products from country R
to S by country s’s final demands on country r’s products in total induced global trade by the same
final demands.
If we pay more attention on the international transactions (without considering the domestic trade in
intermediate and final products), the following two indicators can help us understand how
inter-country trade in intermediate products are induced by inter-country trade in final products.
(3.27)
(3.28)
where, shows the contribution rate of country r’s export of final products to country s in the
inducement of international trade in intermediate products shipped from country R to S.
shows the share of induced international trade in intermediate products shipped from country R to S
in total inducement of international intermediate trade in terms of country s’s final demand on the
products made in country r.
4. Empirical results in measuring GVCs and regional integration
4.1 Demand and supply-based TiVA share across regions

Table 4 shows the share of demand-based transaction of embodied value added across regions For
1995 and 2005. From the column way, each figure shows how a specific region’s domestic final
demand contributes to (impacts on) other regions’ value added. In other words, the figure seen
column wise can be considered the imported value added of a specific region from other regions.
While, each figure seen row wise shows how a specific region exports value added to others.
Obviously, for most region or sub-region, the intra-regional transaction of value added accounts for
relatively large share comparing with the inter-regional figure. Just focusing on the intra-regional
transaction, EU27 accounts for almost 20.7% in global TiVA, followed by ERIA+’s 13.6%,
NAFTA’s 6.3% in 1995. This figure decreased for EU27, EU15, but increased for all the other
regions, especially, for the rest of EU27, the rest of ERIA+ and East Asia between 1995 and 2005.
This fact indicates that the relative presence of intra-regional value chains for most regions have
become much more important. (For countries coverage in the OECD I-O database see Appendix 5)
When looking at the inter-regional TiVA, some interesting features can be summarized as follows:
(1) EU15 lost both gain potential (see figures row wise) and give-out potential (see figure column
wise) from other regions except for the rest of EU27. This clearly indicates that EU15’s relative
presence in global value chains has decreased, but its linkage with the rest of EU27 in terms of TiVA
has become much stronger. (2) NAFTA lost its gain potential of TiVA, but enhanced it give-out
potential over time. On one hand, this fact reflects the relative presence of NAFTA in the export of
value added decreased rapidly. On the other hand it represents the increasing value added gain in
developing economies by the way of TiVA with NAFTA. (3) The rest of EU27 shows rapid
increasing tendency in both gain and give-out potential of TiVA with other regions. Although, the
absolute share of the rest of EU27 in global TiVA is still small, but its good performance clearly
illustrates how this region is benefited by the regional integration of EU. (4) ASEAN and East Asia,
in general, lost both gain and give-out potentials over time in global TiVA. It seems that this fact
cannot be supported by the conclusion obtained in Section 2, namely the increasing presence of
ASEAN in global merchandise trade. Recalling the concept of TiVA, it is easy to know that even if a
country has large scale of foreign trade, there is no guarantee that the country can get much more
TiVA. This is because that the TiVA depends on not only the scale of trade but also the value added
ratio and the position of a country in international production networks. (5) The presence of the rest
of EU27, the rest of ERIA+ and the rest of the world in global TiVA shows strong increasing trend.
This can be considered a strong piece of evidence that the distribution of TiVA at worldwide level
has become much flatter with larger diversity.
When looking at the supply-based TiVA share (Table 5), very similar tendency as seen in the
demand-based TiVA can be found. In general, the main finding is that the intra-regional economic

interdependency has become much more important with the comparison of interregional relationship
in terms of TiVA in global production networks. In other words, the creation and distribution of
value added by way of production networks has become more global at regional level (across
regions), and more block-oriented within an integrated region.
4.2 Consumption and supply-based TiVA at country level
Figure 7 and 8 show the consumption and supply-based TiVA at country level for 2005. The main
features of this figure can be summarized as follows: (1) the main sources of both give-out and gain
potentials for most countries originate from the intra-regional TiVA. It’s no surprise since the cost of
organizing production networks depends on the geographic distance, the neighbor country should
always be the first choice when looking for trade patterns if other conditions remain unchanged. This
feature also reflects the magnitude of a country’s participation degree in global value chains. (2)
When comparing both potentials, it’s easy to see that most countries export more value added to
NAFTA than their imports from NAFTA. In other words, NAFTA’s give-out potential is much
stronger than its gain potential. This is mainly because that some of the USA’s production capacity
on merchandize goods has moved to developing economies by the way of FDI. (3) In addition,
NAFTA has relatively closer relationship in terms of TiVA with ERIA countries with the comparison
to EU27. This clearly reflects the strong linkage of production networks with the Asia-Pacific region
(ERIA+ NAFTA). (4) ERIA has the similar or larger performance in EU27’s value chains system
comparing with NATFA.
If we just focus on the demand and supply of foreign goods without considering the influence of a
country’s domestic demand or supply on the goods produced by itself, the structure of international
TiVA (induced value added) can be illustrated by Figure 9 and 10 Clearly, there are not large
difference between Figure 7 and 9 in terms of demand-based TiVA. However, when comparing
Figure 8 to Figure 10, it’s easy to see that the presence of NAFTA in Asia’s give-out and gain
potential in terms of foreign supply-based TiVA is very small. This implies that Asian economies get
much more value added by the way of their intra-regional production networks, in other words,
when Asia countries produce much more exporting goods, much value added may remained inside
the Asian region. In the same sense, it’s easy to confirm from Figure 10, NAFTA’s production of
exporting goods brings relatively large value added to itself.
4.3 TiVA in terms of trade in final goods and intermediate goods
As mentioned in previous section, using an I-O based decomposition technique, the TiVA induced by

trade of final goods and intermediate goods can be measured separately. Table 6 and 7 show the
interregional and intra-regional shares in total TiVA for final goods and intermediate goods
respectively. The main features can be summarized as follows: 1) the TiVA in terms of trade in
intermediate goods account for more than 60% in the total international TiVA, its presence also
increased between 1995 and 2005. This indicates that the trade in intermediate goods has been
playing an increasing and dominant role in the value creation system by the way of international
trade. 2) for the exception of the rest of EU27 and the rest of ERIA, the gain and give-out potentials
for most regions decreased rapidly not only for interregional, but also for intra-regional TiVA in
terms of trade in final goods. On the other hand, for the exception of EU15 and NAFTA, both
potential for most regions increased rapidly from both inter and intra-regional aspect concerning the
TiVA induced by trade in intermediate goods. This clearly implies that the deepening regional
integration is mainly driven by the expansion of intra-regional trade in intermediate goods from the
view point of value creation and distribution, especially for the case of the rest of EU 27 and East
Asia region. 3) Although, in total, the ERIA+ area shows increasing presence of intra-regional TiVA,
the linkages between ASEAN and East Asia decreased between 1995 and 2005. This phenomenon
indicates that the regional integration seen from trade flow can just provide us very direct and
intuitive image, when considering the whole international production network, say, using TiVA
measurement, we may have different results. ASEAN and East Asia have been linked by the way of
international trade, but their relative interaction in terms of trade in value added shows lower
performance. Comparing with the interaction between EU15 and the rest of EU27, it is easily to
confirm how different the performance of regional integration between EU and Asia.
4.4 Who produces intermediate goods for whom?
As shown in previous sections, international trade data provides us very direct image of the
evolution of regional integration. In order to measure the degree of regional integration from not
only the direct but also indirect linkages, we propose to use the concept of TiVA. All the above
measurements give us a kind of final image of regional integration, rather than show us the step by
step interaction among countries within a target region. Using the measure proposed in section 3.4,
more detailed image of regional integration can be captured.
Figure 11 and 12 show how the international trade in intermediated goods is induced by what kind of
bilateral trade in final goods. In other words, these figures provide us detailed information about who
produces intermediate goods for whom. For example, when France imports goods from Germany in
1995, the induced international trade in intermediate goods is concentrated in EU27 area surrounding
some trade hubs, such as UK, Belgium, Netherlands and Luxembourg. In addition, this trade in final

goods happed inside EU27 (between France and Germany) also gives relatively large impacts on
Japan and USA. Namely, when France imports much more final goods from Germany, more
international trade in intermediate goods produced in Japan and USA will be induced. When
comparing this situation with 2005, very dramatic change can be easily confirmed. For example,
France’s imports of final goods from Germany cause much more international trade in intermediate
goods inside EU27, especially between EU15 and the rest of EU27. This clearly indicates the
evolution of the ongoing regional integration inside EU. In addition, comparing to 1995, France’s
imports from Germany give much larger impacts on China’s exports of intermediate goods to all
over the world, especially to the intra-East Asia trade. This also provides us some additional
information about the worldwide production networks, namely when with the deepening regional
integration, the inter-regional relationship also shifts at the same time. Another example is about the
impacts of Japan’s imports of final goods from China (see Figure 12). Obviously, in 1995, when
Japan imports final goods from China, the East Asia region tends to import much more intermediate
goods from NAFTA, EU and East Asia itself. However, in 2005, the situation changed, the
international trade inside Asian region (ERIA+) becomes much flatter. At the same time, the induced
interregional trade in intermediate goods between Asia and EU decreased.
4.5 An alternative measurement of Revealed Comparative Advantage
As explained in previous section, the traditional indicator of comparative advantage proposed by
Balassa (1965) is only based on international trade data. Since the increasing vertical specialization
trade, fragmentation production in international production networks, this measure can no longer
provides significant information since a country’s exports tend to embody much more other
country’s contents (value added). Using the newly proposed measure of RCA based on the concept
of TiVA, a new ranking of RCA across countries can be calculated. The main results for selected
industries are shown in Table 8-11. It is easy to confirm, the new measure of RCA by TiVA provides
very different information comparing with the traditional measure. For example, China ranks 9th
using traditional indicator in 1995. However, TiVA based RCA for China shows lower ranking. This
exactly reflects the fact that almost half of the exports of Office, accounting & computing machinery
sector made in China is processing goods with large share of import contents. Therefore, if using the
traditional RCA indicator, the relative ranking of China in terms of its comparative advantage maybe
overestimated. When looking at the figure for 2005, the difference of China’s ranking between these
two measures narrowed. This may implies that China has been able to export much more domestic
contents or gain more value added by exporting Office and computing machinery goods. In other
words, this may reflects a kind of industrial upgrade in China has been achieved for the production
of computing machinery.

5 Conclusion remarks
Given the increasing economic interdependence across countries caused by the extension of
globalization and regional integration, international IO tables have been considered a very useful
data source for the analyses of production networks, international fragmentation production, Global
Value Chains and so on. This chapter uses a new concept of Trade in Value Added to provide some
alternative measurements of regional integration. Comparing with the traditional measure based on
international trade statistics, the TiVA based measure can provide us much more detailed image not
only from the direct but also indirect interaction of countries in international production networks. In
addition, using the I-O based decomposition technique, the TiVA measurement can be separated by
the factor of trade in final goods and intermediate goods. This helps us understand how intermediate
goods function and drive the evolution of regional integration. Furthermore, based on the traditional
international I-O model, induced international trade in intermediate goods can be identified by
different transaction of trade in final goods. This helps us capture more detailed information about
who produces what for whom, and also provide us additional information which has been masked by
the traditional trade statistics about regional integration.
Based on the empirical analysis, the main findings can be summarized as follows: 1) EU27 has been
an high-level integrated region in terms of not only international trade but also the trade in value
added. Especially, the emergence of the rest of EU27 brings very dynamic and dramatic impacts on
EU’s regional integration. The deepening and strengthening interaction between EU15 and the rest
of EU27 has been the most important feature of the ongoing regional integration of EU area. 2) On
the other hand, as a whole, the ERIA+ shows increasing presence of regional integration in terms of
both real trade flow and trade in value added. When tracing more detailed interaction inside ERIA,
the intra-regional interaction for ASEAN and East Asia shows increasing performance, but the
interregional dependency in terms of Trade in Value Added between the two regions shows a
decreasing tendency comparing with the situation of EU15 and the rest of EU27. This is one of the
most important findings which can’t be easily observed by the traditional measure based on trade
statistics. 3) In the total international trade in value added, contribution coming from the trade in
intermediate goods accounts for more than 65% in 2005. This clearly implies that the deepening
regional integration is mainly driven by the expansion of intra-regional trade in intermediate goods
from the view point of value creation and distribution. 4) From the structure change measured by the
induced international trade in intermediate goods by selected bilateral trade in final goods, it is easy
to confirm that integrated production networks within EU and Asia area have been enhanced
between 1995 and 2005.

Reference
Balassa, B. (1965), “Trade Liberalization and Revealed Comparative Advantage”, The Manchester School,
33, 99-123.
Cherry, J. (2011). “Making Friends with the Hydra European Expectations of the EU–Korea Free Trade
Agreement”, European Journal of East Asian Studies, 10.1: 59 – 83.
Dedrick, J., K.L.Kraemer and G. Linden (2010), "Who profits from innovation in global value chains?: A
study of the iPod and notebook PCs", Industrial and Corporate Change, 19 (1): 81-116.
Dunning, J. H., Fujita, M., & Yakova, N. (2007). “Some macro-data on the regionalisation/globalisation
debate: A comment on the Rugman/Verbeke analysis”. Journal of International Business Studies, 38(1):
177–199
Foster, N., R. Stehrer and G. Vries (2012), “Trade in value added and factors: A comprehensive approach”,
WIOD Working Paper, 1-22.
Hiratsuka, D., and F. Kimura (2008). East Asia's Economic Integration - Progress and Benefit -, Palgrave
Macmillan IDE-JETRO Series.
Hummels, D., J. Ishii and K.M. Yi (2001), “The nature and growth of vertical specialization in world
trade”. Journal of International Economics, 54(1), pp. 75 - 96.
Johnson R.C. and G. Noguera (2011) “Accounting for intermediates: Production sharing and trade in
value added,” Journal of International Economics.
Koopman, R., Z. Wang and S.J. Wei (2008), “How much of Chinese exports is really made in China?
Assessing domestic value-added when processing trade is pervasive”, NBER Working Paper, no. 14109:
Koopman, R., W. Powers, Z. Wang and S.J. Wei (2010), “Give credit where credit is due: Tracing value
added in global production chains”, NBER Working Paper, no. 16426.
Kuroiwa, I., and T.M., Heng (2008). Production Networks and Industrial Clusters: Integrating Economies
in Southeast Asia, Institute of Southeast Asian Studies.

Linden, G., J. Dedrick, and K.L.Kraemer (2009), “Innovation and job creation in a global economy: The
case of Apple's iPod”, Working Paper, Personal Computing Industry Center, UC Irvine.
Meng, B., N. Yamano and C. Webb (2011), "Application of factor decomposition techniques to vertical
specialisation measurements", Journal of Applied Input-Output Analysis, Vol.16.
Miller, R.E. and Blair, P.D., (1985), Input-Output Analysis: Foundations and Extensions, Prentice hall, pp.
385.
Murray, Ph. (2010) “Comparative regional integration in the EU and East Asia: Moving beyond
integration snobbery”, International Politics, 47, pp. 308–323.
Neffke, M. H. and Boschma, R. (2011). “How Do Regions Diversify over Time? Industry
Relatedness and the Development of New Growth Paths in Regions”. Economic Geography, 87: 237–265.
Piekkari, R., Nell, P. and Ghauri, P. (2010). “Regional management as a system”. Management
International Review, 50 (4): 513-532.
Sierra, O. (2011). “Shaping the Neighbourhood? The EU's Impact on Georgia”, Europe-Asia Studies,
63:8, 1377-1398.
Rugman, A.M.and Verbeke, A. (2004). “A perspective on regional and global strategies of multinational
enterprises”, Journal of International Business Studies, 35: 3-18.
Uchida, Y. and S. Inomata (2009), “Vertical specialization in the time of the Economic Crisis”, in Inomata
S. and Y. Uchida (eds), Asia Beyond the Crisis: Visions from International Input-Output Analyses, IDE
Spot Survey 31, pp. 70-83.
UNCTAD/ Investment Report (2009). Transnational Corporation, agricultural production and
development, Investment Report 2009, Geneva.
Xing, Y., and N., Detert (2010), “How the iPhone widens the United States trade deficit with the People’s
Republic of China”, Asian Development Bank, ADBI Working paper No. 257.
Yamano, N., B. Meng and K. Fukasaku, 2011. "Fragmentation and Changes in the Asian Trade Network,"
Papers PB-2011-01, Economic Research Institute for ASEAN and East Asia.

Figure 1 Evolution of global trade in goods
Figure 2 Share of different category in global trade
Figure 3 Relative contributions to the growth of total trade by end-use category
0
2,000
4,000
6,000
8,000
10,000
12,000
14,000
1995
1996
1997
1998
1999
2000
2001
2002
2003
2004
2005
2006
2007
2008
2009
2010
unit: billion US$
Total trade in goods
Intermediate goods
Household consumptionCapital investment
Passenger cars
Personal computers
Packed medicaments
Personal phones
0%
10%
20%
30%
40%
50%
60%
1995
1996
1997
1998
1999
2000
2001
2002
2003
2004
2005
2006
2007
2008
2009
2010
Intermediate goods
Household
consumptionCapital investment
Passenger cars
Personal computers
Packed medicaments
Personal phones
Valuables
Others
0% 10% 20% 30% 40% 50% 60%
Intermediate goods
Household consumption
Capital investment
Passenger cars
Packed medicaments
Personal computers
Personal phones
Valuables
Others 2002-2008
1996-2002

Table 1 Contribution by country on the growth of world trade (in terms of export)
Table 2 Contribution by country on the growth of world trade (in terms of import)
Rank 1996-2002 2002-2008 Rank 1996-2002 2002-2008
1 China 24.84% 17.86% 16 Thailand 1.42% 1.64%
2 Germany 8.30% 11.52% 17 Canada 3.96% 1.58%
3 USA 5.80% 6.91% 18 India 1.24% 1.54%
4 Rest of world 4.28% 5.60% 19 Poland 1.69% 1.53%
5 Japan 1.54% 5.36% 20 Mexico 6.97% 1.46%
6 France 2.89% 4.05% 21 Malaysia 2.46% 1.39%
7 Italy 0.14% 3.57% 22 Sweden -0.10% 1.36%
8 Korea 4.90% 3.50% 23 Czech Rep. 1.90% 1.32%
9 Netherlands 1.66% 3.09% 24 Austria 1.44% 1.28%
10 Belgium, Luxembourg 0.63% 2.45% 25 Australia -0.10% 1.23%
11 Chinese Taipei 3.47% 2.26% 26 Singapore -0.11% 1.11%
12 United Kingdom 0.61% 2.23% 27 Ireland 6.68% 1.00%
13 Spain 2.37% 2.01% 28 Russian Federation 0.56% 0.94%
14 Brazil 1.14% 1.94% 29 Turkey 1.46% 0.92%
15 Switzerland 0.06% 1.87% 30 Indonesia 1.13% 0.87%
Sum 93.23% 93.39%
Rank Country name 1996-2002 2002-2008 Rank Country name 1996-2002 2002-2008
1 Rest of world 5.54% 12.88% 16 India 1.38% 2.28%
2 China 14.23% 9.61% 17 Poland 1.81% 2.14%
3 USA 34.59% 9.15% 18 Singapore -1.99% 1.98%
4 Germany 5.93% 8.33% 19 Mexico 8.62% 1.84%
5 France 2.43% 4.86% 20 Turkey 0.60% 1.55%
6 Netherlands 0.17% 3.68% 21 Brazil -0.89% 1.55%
7 United Kingdom 6.52% 3.67% 22 Australia 0.73% 1.53%
8 Italy 3.43% 3.59% 23 Czech Rep. 1.53% 1.48%
9 Japan -1.65% 3.55% 24 Switzerland 0.48% 1.43%
10 Belgium, Luxembourg 4.05% 3.41% 25 Austria 0.43% 1.42%
11 Russian Federation 0.47% 3.17% 26 Thailand -1.03% 1.35%
12 Spain 3.85% 3.01% 27 Sweden 0.15% 1.31%
13 Hong Kong SAR of China 0.93% 2.87% 28 Chinese Taipei 0.76% 1.21%
14 Korea -0.26% 2.77% 29 Indonesia -1.70% 1.19%
15 Canada 5.49% 2.28% 30 Malaysia -0.13% 1.00%
Sum 96.47% 100.09%

Figure 4 Evolution of global trade hubs
0
5
10
15
20
25
30
35
1995
1996
1997
1998
1999
2000
2001
2002
2003
2004
2005
2006
2007
2008
2009
2010
nu
mb
er o
f co
un
trie
s
Demand centers for trade in intermediate goods
Germany
China
USA
Japan
France
Italy
United Kingdom
0
5
10
15
20
25
30
35
40
1995
1996
1997
1998
1999
2000
2001
2002
2003
2004
2005
2006
2007
2008
2009
2010
nu
mb
er o
f co
un
trie
s
Demand centers for trade in final consumption goods
Germany
China
USA
Japan
France
Italy
United Kingdom
0
5
10
15
20
25
30
35
1995
1996
1997
1998
1999
2000
2001
2002
2003
2004
2005
2006
2007
2008
2009
2010
nu
mb
er o
f co
un
trie
s
Demand centers for trade in captial goods
Germany
China
USA
Japan
France
Italy
United Kingdom
Russian Federation
0
5
10
15
20
25
30
35
40
1995
1996
1997
1998
1999
2000
2001
2002
2003
2004
2005
2006
2007
2008
2009
2010
nu
mb
er o
f co
un
trie
s
Supply centers for trade in intermediate goods
Germany
China
USA
Japan
France
Italy
United Kingdom
0
5
10
15
20
25
30
35
40
45
50
1995
1996
1997
1998
1999
2000
2001
2002
2003
2004
2005
2006
2007
2008
2009
2010
nu
mb
er o
f co
un
trie
s
Supply centers for trade in final consumption goods
Germany
China
USA
Japan
France
Italy
United Kingdom
0
5
10
15
20
25
30
35
40
45
50
1995
1996
1997
1998
1999
2000
2001
2002
2003
2004
2005
2006
2007
2008
2009
2010
nu
mb
er o
f co
un
trie
s
Supply centers for trade in captial goods
Germany
China
USA
Japan
France
Italy
United Kingdom

Table 3 Evolution of inter and intra-regional trade flow (%)
EU27 NAFTA ERIA+ ROW World
EU15Rest of
EU27ASEAN
East
Asia
Rest of
ERIA+
EU27 26.0 24.6 1.4 3.3 0.5 4.6 1.0 3.2 0.4 5.3 40.4
EU15 24.5 23.3 1.2 3.2 0.5 4.4 1.0 3.1 0.4 5.0 38.2
Rest of EU27 1.5 1.3 0.2 0.1 0.0 0.1 0.0 0.1 0.0 0.4 2.2
NAFTA 3.1 3.0 0.1 7.3 0.3 6.9 1.4 5.3 0.3 2.0 19.6
0.5 0.5 0.0 0.5 0.3 0.3 0.0 0.2 0.0 0.2 1.7
ERIA+ 4.1 4.0 0.1 5.0 0.4 14.6 3.3 10.1 1.2 2.8 27.0
ASEAN 1.1 1.0 0.0 1.0 0.1 4.3 1.3 2.8 0.2 0.5 7.0
East Asia 2.5 2.5 0.0 3.5 0.3 9.5 1.9 6.8 0.8 2.1 17.9
Rest of ERIA+ 0.5 0.5 0.0 0.4 0.0 0.8 0.2 0.5 0.1 0.3 2.1
ROW 5.9 5.6 0.3 1.6 0.3 2.4 0.4 1.7 0.3 0.9 11.2
World 39.6 37.7 1.9 17.6 1.8 28.8 6.2 20.5 2.1 11.3 100.0
EU27 NAFTA ERIA+ ROW World
EU15Rest of
EU27ASEAN
East
Asia
Rest of
ERIA+
EU27 20.7 17.9 2.8 2.1 0.5 5.6 0.9 4.3 0.5 5.7 35.0
EU15 18.0 15.8 2.1 2.0 0.5 5.0 0.8 3.8 0.4 5.0 30.8
Rest of EU27 2.7 2.1 0.7 0.1 0.0 0.6 0.1 0.5 0.0 0.7 4.2
NAFTA 2.7 2.6 0.1 6.0 0.3 6.4 0.9 5.1 0.3 2.7 18.1
0.4 0.4 0.0 0.4 0.3 0.6 0.1 0.5 0.1 0.3 2.0
ERIA+ 3.2 3.1 0.2 3.0 0.8 18.0 4.6 11.6 1.7 6.1 31.1
ASEAN 0.6 0.6 0.0 0.6 0.1 4.3 1.5 2.5 0.3 0.9 6.5
East Asia 2.1 2.0 0.1 2.0 0.7 12.2 2.7 8.2 1.3 4.2 21.2
Rest of ERIA+ 0.5 0.5 0.0 0.3 0.0 1.5 0.4 0.9 0.2 1.0 3.4
ROW 4.9 4.3 0.5 1.6 0.5 4.8 0.7 3.4 0.8 1.9 13.8
World 31.8 28.2 3.6 13.1 2.5 35.4 7.2 24.9 3.4 16.7 100.0
EU27 NAFTA ERIA+ ROW World
EU15Rest of
EU27ASEAN
East
Asia
Rest of
ERIA+
EU27 -20.5 -27.3 96.1 -35.2 0.6 22.8 -11.2 34.7 10.9 6.3 -13.3
EU15 -26.8 -32.2 78.6 -36.2 0.0 12.9 -16.6 22.5 8.0 0.8 -19.3
Rest of EU27 81.9 63.0 185.1 1.2 11.1 362.3 204.2 425.0 130.0 77.8 88.4
NAFTA -14.0 -15.9 74.6 -17.9 12.1 -7.2 -33.2 -2.4 33.5 37.4 -7.5
-23.1 -25.1 77.8 -19.8 14.2 128.0 85.7 130.4 200.0 25.0 12.8
ERIA+ -21.7 -24.1 108.1 -40.4 102.3 23.0 38.4 14.9 49.2 115.3 15.1
ASEAN -44.1 -45.6 15.4 -40.1 11.1 0.4 20.3 -10.4 22.6 72.0 -7.1
East Asia -15.8 -18.6 161.5 -42.3 124.0 27.9 39.5 20.5 64.6 105.7 18.2
Rest of ERIA+ -4.8 -7.2 133.3 -24.4 114.3 88.7 166.5 85.1 11.0 260.6 62.7
ROW -17.0 -22.3 79.7 1.0 52.1 98.6 57.4 94.4 195.1 106.1 22.7
World -19.6 -25.2 93.2 -25.7 35.9 23.1 16.3 21.4 59.5 47.7 0.0
South
America
South
America
South
America
South America
1995
2010
1995-2010
South America
South America

Figure 5 A single national I-O framework
Figure 6 An international I-O framework (two-country case)
country 1 country 1 country 2
country 1 IMD11
FD11
EX12
X1
coutnry 2 IMD21
FD21
VA1
X1
country 1 country 2 country 1 country 2
country 1 IMD11
IMD12
FD11
FD12
X1
coutnry 2 IMD21
IMD22
FD21
FD22
X2
VA1
VA2
X1
X2

Table 4 Demand-based TiVA share across regions (%)
EU27 NAFTA ERIA+ ROW World
EU15Rest of
EU27ASEAN
East
Asia
Rest of
ERIA+
EU27 20.7 19.6 1.2 5.7 0.7 7.0 1.3 5.0 0.7 3.1 37.2
EU15 19.7 18.7 1.0 5.6 0.7 6.8 1.2 4.8 0.7 2.9 35.7
Rest of EU27 1.0 0.9 0.1 0.1 0.0 0.2 0.0 0.1 0.0 0.1 1.4
NAFTA 4.3 4.2 0.1 6.3 0.5 4.5 0.6 3.5 0.3 0.6 16.2
0.5 0.5 0.0 0.5 0.3 0.5 0.1 0.4 0.0 0.1 1.9
ERIA+ 5.8 5.6 0.2 7.7 0.5 13.6 3.2 9.5 1.0 1.1 28.7
ASEAN 0.9 0.9 0.0 0.9 0.1 2.5 0.5 1.9 0.1 0.2 4.6
East Asia 4.4 4.3 0.1 6.5 0.4 10.0 2.5 6.9 0.7 0.7 22.0
Rest of ERIA+ 0.4 0.4 0.0 0.3 0.0 1.1 0.2 0.8 0.1 0.1 1.9
ROW 6.8 6.2 0.5 2.9 0.4 4.2 0.7 3.1 0.4 1.5 15.8
World 38.1 36.1 2.0 23.1 2.4 29.8 5.9 21.5 2.4 6.4 100.0
EU27 NAFTA ERIA+ ROW World
EU15Rest of
EU27ASEAN
East
Asia
Rest of
ERIA+
EU27 19.3 17.6 1.7 4.9 0.5 4.3 0.5 3.0 0.8 3.5 32.5
EU15 17.6 16.1 1.5 4.7 0.5 4.2 0.5 2.9 0.7 3.3 30.3
Rest of EU27 1.7 1.4 0.3 0.2 0.0 0.2 0.0 0.1 0.0 0.2 2.3
NAFTA 3.3 3.1 0.2 6.4 0.4 3.7 0.4 2.8 0.4 0.6 14.4
0.7 0.6 0.0 0.7 0.3 0.6 0.1 0.4 0.1 0.2 2.5
ERIA+ 6.0 5.6 0.4 8.2 0.4 13.9 2.1 10.3 1.6 1.4 29.9
ASEAN 0.8 0.8 0.0 0.9 0.0 2.4 0.5 1.6 0.3 0.2 4.3
East Asia 4.4 4.1 0.3 6.7 0.3 10.3 1.4 7.8 1.1 1.1 22.8
Rest of ERIA+ 0.8 0.8 0.0 0.6 0.0 1.3 0.2 0.8 0.2 0.2 2.9
ROW 8.0 7.4 0.6 4.9 0.4 5.9 0.7 4.1 1.1 1.6 20.8
World 37.3 34.3 2.9 25.1 2.0 28.4 3.8 20.6 4.0 7.3 100.0
EU27 NAFTA ERIA+ ROW World
EU15Rest of
EU27ASEAN
East
Asia
Rest of
ERIA+
EU27 -6.8 -10.2 41.7 -14.0 -28.6 -38.6 -61.5 -40.0 14.3 12.9 -12.6
EU15 -10.7 -13.9 50.0 -16.1 -28.6 -38.2 -58.3 -39.6 0.0 13.8 -15.1
Rest of EU27 70.0 55.6 200.0 100.0 0.0 0.0 0.0 0.0 0.0 100.0 64.3
NAFTA -23.3 -26.2 100.0 1.6 -20.0 -17.8 -33.3 -20.0 33.3 0.0 -11.1
40.0 20.0 0.0 40.0 0.0 20.0 0.0 0.0 0.0 100.0 31.6
ERIA+ 3.4 0.0 100.0 6.5 -20.0 2.2 -34.4 8.4 60.0 27.3 4.2
ASEAN -11.1 -11.1 0.0 0.0 -100.0 -4.0 0.0 -15.8 200.0 0.0 -6.5
East Asia 0.0 -4.7 200.0 3.1 -25.0 3.0 -44.0 13.0 57.1 57.1 3.6
Rest of ERIA+ 100.0 100.0 0.0 100.0 0.0 18.2 0.0 0.0 100.0 100.0 52.6
ROW 17.6 19.4 20.0 69.0 0.0 40.5 0.0 32.3 175.0 6.7 31.6
World -2.1 -5.0 45.0 8.7 -16.7 -4.7 -35.6 -4.2 66.7 14.1 0.0
South
America
South
America
South
America
South America
1995
2005
1995-2005
South America
South America

Table 5 Supply-based TiVA share across regions (%)
EU27 NAFTA ERIA+ ROW World
EU15Rest of
EU27ASEAN
East
Asia
Rest of
ERIA+
EU27 21.2 20.0 1.2 5.1 0.6 6.6 1.2 4.7 0.7 2.4 35.9
EU15 20.1 19.1 1.1 5.0 0.6 6.4 1.1 4.6 0.7 2.3 34.4
Rest of EU27 1.1 0.9 0.2 0.1 0.0 0.2 0.0 0.1 0.0 0.1 1.5
NAFTA 5.1 5.0 0.1 6.3 0.4 4.6 0.7 3.7 0.3 0.5 16.9
0.5 0.5 0.0 0.4 0.3 0.6 0.1 0.5 0.0 0.1 1.9
ERIA+ 5.7 5.6 0.2 5.7 0.4 14.5 3.2 10.5 0.8 0.8 27.1
ASEAN 1.0 1.0 0.0 0.6 0.0 2.9 0.6 2.2 0.1 0.2 4.7
East Asia 4.2 4.1 0.1 4.7 0.3 10.3 2.4 7.3 0.5 0.5 20.0
Rest of ERIA+ 0.5 0.5 0.0 0.3 0.0 1.2 0.2 0.9 0.1 0.1 2.1
ROW 8.1 7.5 0.7 3.0 0.5 5.3 0.8 4.0 0.5 1.3 18.2
World 40.6 38.6 2.2 20.5 2.2 31.6 6.0 23.4 2.3 5.1 100.0
EU27 NAFTA ERIA+ ROW World
EU15Rest of
EU27ASEAN
East
Asia
Rest of
ERIA+
EU27 19.0 17.2 1.8 4.0 0.5 4.5 0.6 3.2 0.7 2.9 30.9
EU15 17.4 15.8 1.5 3.9 0.5 4.4 0.6 3.1 0.7 2.7 28.9
Rest of EU27 1.6 1.3 0.3 0.2 0.0 0.2 0.0 0.1 0.0 0.2 2.2
NAFTA 3.5 3.3 0.2 6.2 0.3 3.9 0.5 3.1 0.4 0.5 14.4
0.6 0.6 0.0 0.6 0.3 0.7 0.1 0.6 0.1 0.1 2.3
ERIA+ 4.9 4.5 0.4 5.8 0.3 15.9 2.4 12.0 1.4 1.0 27.9
ASEAN 0.7 0.6 0.0 0.6 0.0 2.8 0.6 1.9 0.3 0.1 4.2
East Asia 3.6 3.2 0.3 4.7 0.2 11.6 1.6 9.1 0.9 0.7 20.8
Rest of ERIA+ 0.6 0.6 0.0 0.4 0.0 1.5 0.2 1.0 0.2 0.1 2.6
ROW 9.0 8.3 0.8 5.1 0.4 8.3 1.0 5.9 1.4 1.7 24.5
World 37.0 33.9 3.2 21.7 1.8 33.3 4.6 24.8 4.0 6.2 100.0
EU27 NAFTA ERIA+ ROW World
EU15Rest of
EU27ASEAN
East
Asia
Rest of
ERIA+
EU27 -10.4 -14.0 50.0 -21.6 -16.7 -31.8 -50.0 -31.9 0.0 20.8 -13.9
EU15 -13.4 -17.3 36.4 -22.0 -16.7 -31.3 -45.5 -32.6 0.0 17.4 -16.0
Rest of EU27 45.5 44.4 50.0 100.0 0.0 0.0 0.0 0.0 0.0 100.0 46.7
NAFTA -31.4 -34.0 100.0 -1.6 -25.0 -15.2 -28.6 -16.2 33.3 0.0 -14.8
20.0 20.0 0.0 50.0 0.0 16.7 0.0 20.0 0.0 0.0 21.1
ERIA+ -14.0 -19.6 100.0 1.8 -25.0 9.7 -25.0 14.3 75.0 25.0 3.0
ASEAN -30.0 -40.0 0.0 0.0 0.0 -3.4 0.0 -13.6 200.0 -50.0 -10.6
East Asia -14.3 -22.0 200.0 0.0 -33.3 12.6 -33.3 24.7 80.0 40.0 4.0
Rest of ERIA+ 20.0 20.0 0.0 33.3 0.0 25.0 0.0 11.1 100.0 0.0 23.8
ROW 11.1 10.7 14.3 70.0 -20.0 56.6 25.0 47.5 180.0 30.8 34.6
World -8.9 -12.2 45.5 5.9 -18.2 5.4 -23.3 6.0 73.9 21.6 0.0
1995-2005
South
America
South America
1995
South
America
South America
2005
South
America
South America

Figure 7 Demand-based TiVA share at country level (%)
Figure 8 Supply-based TiVA share at country level (%)
0% 20% 40% 60% 80% 100%
Austria
Belgium
Denmark
FinlandFrance
Germany
Greece
Ireland
ItalyLuxembourgNetherlands
Portugal
Spain
SwedenUnited KingdomCzech Republic
Hungary
Iceland
NorwayPolandSlovak Republic
Switzerland
Turkey
EstoniaSloveniaRomania
Japan
Korea
ChinaChinese TaipeiIndonesia
Singapore
Malaysia
PhilippinesThailandViet Nam
Brunei
Australia
New ZealandIndiaCanada
Mexico
United States
ArgentinaBrazilChile
Israel
Russia
South Africa
Give-out potential
EU27 NAFTA SouthAM ERIA ROW
0%20%40%60%80%100%
Austria
Belgium
Denmark
Finland
FranceGermany
GreeceIreland
ItalyLuxembourg
NetherlandsPortugal
SpainSweden
United KingdomCzech Republic
HungaryIceland
NorwayPoland
Slovak RepublicSwitzerland
TurkeyEstonia
SloveniaRomania
JapanKorea
ChinaChinese Taipei
IndonesiaSingapore
MalaysiaPhilippines
ThailandViet Nam
BruneiAustralia
New ZealandIndia
CanadaMexico
United StatesArgentina
BrazilChile
Israel
Russia
South Africa
Gain potential
EU27 NAFTA SouthAM ERIA ROW
EU15
The rest of EU27
East Asia
ASEAN
The rest of ERIA
NAFTA
SouthAmerica
Others
0% 20% 40% 60% 80% 100%
Austria
Belgium
DenmarkFinlandFrance
Germany
Greece
IrelandItalyLuxembourg
Netherlands
Portugal
SpainSwedenUnited Kingdom
Czech Republic
Hungary
IcelandNorwayPoland
Slovak Republic
Switzerland
TurkeyEstonia
Slovenia
Romania
JapanKoreaChina
Chinese Taipei
Indonesia
SingaporeMalaysiaPhilippines
Thailand
Viet Nam
BruneiAustraliaNew Zealand
India
Canada
MexicoUnited States
Argentina
Brazil
ChileIsraelRussia
South Africa
Give-out potential
EU27 NAFTA SouthAM ERIA ROW
0%20%40%60%80%100%
Austria
Belgium
DenmarkFinlandFrance
Germany
Greece
IrelandItaly
Luxembourg
Netherlands
Portugal
SpainSweden
United Kingdom
Czech Republic
Hungary
IcelandNorway
Poland
Slovak Republic
Switzerland
TurkeyEstonia
Slovenia
Romania
JapanKoreaChina
Chinese Taipei
Indonesia
SingaporeMalaysia
Philippines
Thailand
Viet Nam
BruneiAustralia
New Zealand
India
Canada
MexicoUnited States
Argentina
Brazil
ChileIsrael
Russia
South Africa
Gain potential
EU27 NAFTA SouthAM ERIA ROW
EU15
The rest of EU27
East Asia
ASEAN
The rest of ERIA
NAFTA
SouthAmerica
Others
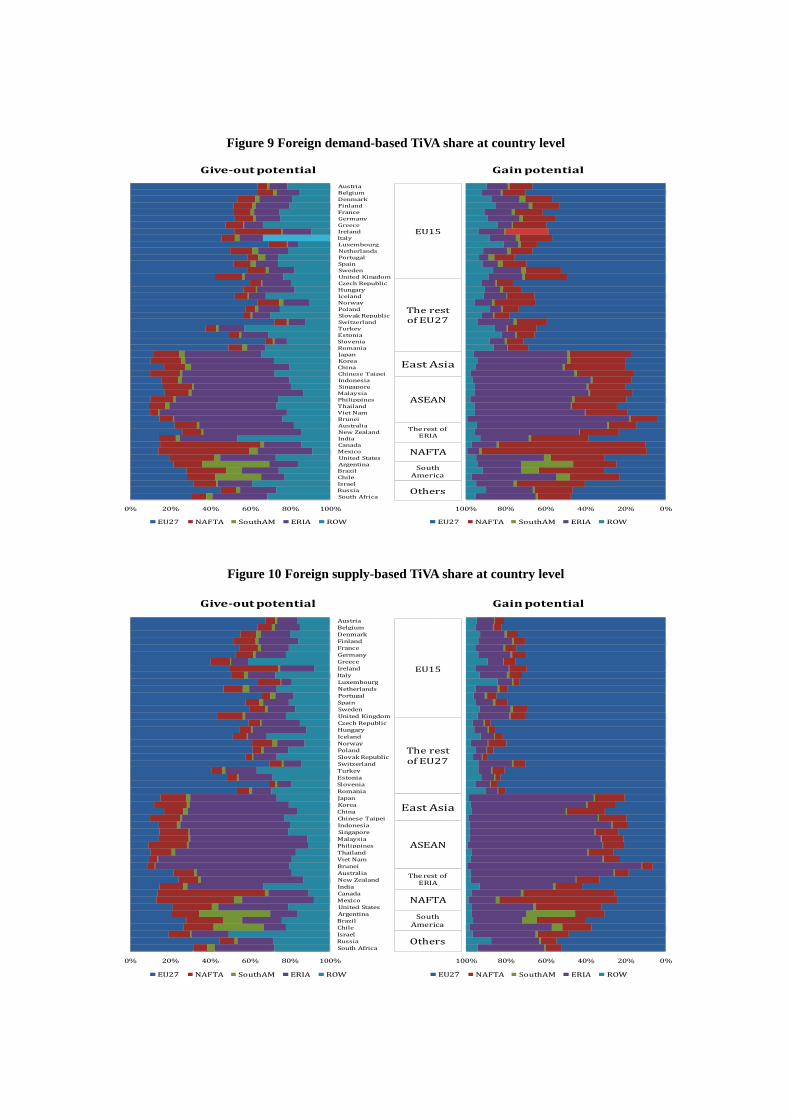
Figure 9 Foreign demand-based TiVA share at country level
Figure 10 Foreign supply-based TiVA share at country level
0% 20% 40% 60% 80% 100%
Austria
Belgium
DenmarkFinlandFrance
Germany
Greece
IrelandItalyLuxembourg
Netherlands
Portugal
SpainSwedenUnited Kingdom
Czech Republic
Hungary
IcelandNorwayPoland
Slovak Republic
Switzerland
TurkeyEstonia
Slovenia
Romania
JapanKoreaChina
Chinese Taipei
Indonesia
SingaporeMalaysiaPhilippines
Thailand
Viet Nam
BruneiAustraliaNew Zealand
India
Canada
MexicoUnited States
Argentina
Brazil
ChileIsraelRussia
South Africa
Give-out potential
EU27 NAFTA SouthAM ERIA ROW
0%20%40%60%80%100%
Austria
Belgium
DenmarkFinlandFrance
Germany
Greece
IrelandItaly
Luxembourg
Netherlands
Portugal
SpainSweden
United Kingdom
Czech Republic
Hungary
IcelandNorway
Poland
Slovak Republic
Switzerland
TurkeyEstonia
Slovenia
Romania
JapanKoreaChina
Chinese Taipei
Indonesia
SingaporeMalaysia
Philippines
Thailand
Viet Nam
BruneiAustralia
New Zealand
India
Canada
MexicoUnited States
Argentina
Brazil
ChileIsrael
Russia
South Africa
Gain potential
EU27 NAFTA SouthAM ERIA ROW
EU15
The rest of EU27
East Asia
ASEAN
The rest of ERIA
NAFTA
SouthAmerica
Others

Table 6 TiVA in terms of trade in final goods across regions (%)
EU27 NAFTA ERIA+ ROW World
EU15Rest of
EU27ASEAN
East
Asia
Rest of
ERIA+
EU27 8.2 7.8 0.4 1.9 0.3 2.5 0.5 1.7 0.2 1.4 14.3
EU15 7.8 7.4 0.4 1.9 0.3 2.4 0.5 1.7 0.2 1.3 13.8
Rest of EU27 0.4 0.3 0.1 0.0 0.0 0.1 0.0 0.0 0.0 0.1 0.5
NAFTA 1.1 1.1 0.0 2.9 0.2 1.6 0.3 1.2 0.1 0.3 6.1
0.2 0.2 0.0 0.2 0.1 0.1 0.0 0.1 0.0 0.1 0.7
ERIA+ 2.0 1.9 0.1 3.5 0.2 5.2 1.5 3.3 0.4 0.5 11.5
ASEAN 0.3 0.3 0.0 0.4 0.0 0.8 0.2 0.5 0.1 0.1 1.5
East Asia 1.6 1.6 0.1 3.1 0.2 4.1 1.2 2.6 0.3 0.4 9.3
Rest of ERIA+ 0.1 0.1 0.0 0.1 0.0 0.3 0.1 0.2 0.0 0.1 0.6
ROW 1.8 1.6 0.2 0.8 0.1 0.8 0.2 0.6 0.1 0.7 4.2
World 13.3 12.6 0.7 9.4 0.9 10.2 2.5 6.9 0.9 2.9 36.7
EU27 NAFTA ERIA+ ROW World
EU15Rest of
EU27ASEAN
East
Asia
Rest of
ERIA+
EU27 7.2 6.5 0.7 1.6 0.2 1.2 0.2 0.8 0.2 1.4 11.5
EU15 6.5 6.0 0.6 1.5 0.2 1.2 0.2 0.8 0.2 1.3 10.7
Rest of EU27 0.7 0.5 0.1 0.1 0.0 0.0 0.0 0.0 0.0 0.1 0.8
NAFTA 0.9 0.9 0.0 2.6 0.1 1.2 0.2 0.8 0.2 0.2 5.0
0.2 0.2 0.0 0.2 0.1 0.1 0.0 0.1 0.0 0.1 0.7
ERIA+ 2.3 2.2 0.1 3.5 0.1 4.3 0.9 2.8 0.6 0.6 10.9
ASEAN 0.3 0.3 0.0 0.4 0.0 0.6 0.2 0.4 0.1 0.1 1.4
East Asia 1.7 1.6 0.1 2.9 0.1 3.3 0.6 2.3 0.4 0.5 8.5
Rest of ERIA+ 0.3 0.3 0.0 0.3 0.0 0.3 0.1 0.2 0.1 0.1 1.1
ROW 1.9 1.8 0.1 1.0 0.1 0.5 0.1 0.3 0.1 0.5 3.9
World 12.5 11.5 1.0 8.9 0.6 7.2 1.3 4.8 1.1 2.8 32.0
EU27 NAFTA ERIA+ ROW World
EU15Rest of
EU27ASEAN
East
Asia
Rest of
ERIA+
EU27 -12.2 -16.3 60.5 -18.1 -38.5 -52.8 -66.7 -55.2 -4.2 -1.4 -19.6
EU15 -16.5 -20.0 52.6 -19.5 -38.5 -52.5 -67.9 -54.8 -4.3 -3.0 -22.4
Rest of EU27 80.6 71.0 120.0 66.7 0.0 -60.0 0.0 -50.0 0.0 50.0 58.8
NAFTA -21.9 -23.4 33.3 -10.0 -35.0 -26.6 -40.7 -30.3 33.3 -20.0 -17.8
22.2 23.5 0.0 22.2 -21.4 -15.4 -33.3 -22.2 0.0 33.3 7.2
ERIA+ 15.4 12.9 85.7 -0.8 -38.1 -17.1 -42.8 -13.5 48.8 21.6 -5.1
ASEAN 11.1 7.7 0.0 0.0 0.0 -17.1 -21.7 -28.6 100.0 -22.2 -8.6
East Asia 4.3 0.6 100.0 -7.2 -38.9 -18.7 -50.8 -10.5 37.5 30.6 -9.4
Rest of ERIA+ 183.3 175.0 0.0 163.6 0.0 3.1 0.0 -19.0 75.0 50.0 69.4
ROW 7.3 9.2 -6.7 18.5 -45.5 -41.7 -35.3 -52.5 25.0 -31.8 -7.8
World -5.8 -8.6 46.4 -5.1 -35.9 -29.3 -47.0 -30.4 29.1 -5.5 -12.9
1995-2005
South
America
South America
1995
South
America
South America
2005
South
America
South America

Table 7 TiVA in terms of trade in intermediate goods across regions (%)
EU27 NAFTA ERIA+ ROW World
EU15Rest of
EU27ASEAN
East
Asia
Rest of
ERIA+
EU27 12.5 11.8 0.7 3.8 0.5 4.5 0.7 3.2 0.5 1.7 22.9
EU15 11.9 11.3 0.6 3.7 0.5 4.3 0.7 3.2 0.5 1.6 22.0
Rest of EU27 0.7 0.6 0.1 0.1 0.0 0.1 0.0 0.1 0.0 0.1 1.0
NAFTA 3.2 3.1 0.1 3.4 0.3 2.9 0.4 2.3 0.2 0.3 10.2
0.3 0.3 0.0 0.3 0.2 0.4 0.1 0.3 0.0 0.1 1.3
ERIA+ 3.8 3.7 0.1 4.1 0.3 8.4 1.6 6.3 0.5 0.6 17.2
ASEAN 0.7 0.6 0.0 0.5 0.0 1.8 0.3 1.4 0.1 0.1 3.1
East Asia 2.8 2.7 0.1 3.4 0.2 5.9 1.2 4.3 0.4 0.4 12.8
Rest of ERIA+ 0.3 0.3 0.0 0.2 0.0 0.8 0.1 0.6 0.1 0.1 1.4
ROW 5.0 4.6 0.4 2.1 0.3 3.4 0.5 2.6 0.3 0.9 11.7
World 24.9 23.5 1.3 13.8 1.5 19.6 3.3 14.7 1.6 3.6 63.3
EU27 NAFTA ERIA+ ROW World
EU15Rest of
EU27ASEAN
East
Asia
Rest of
ERIA+
EU27 12.1 11.1 1.0 3.3 0.4 3.1 0.4 2.2 0.5 2.1 21.1
EU15 11.1 10.2 0.9 3.2 0.4 3.0 0.3 2.1 0.5 2.0 19.6
Rest of EU27 1.1 0.9 0.2 0.1 0.0 0.1 0.0 0.1 0.0 0.2 1.5
NAFTA 2.4 2.3 0.1 3.8 0.2 2.5 0.2 2.0 0.3 0.4 9.3
0.4 0.4 0.0 0.5 0.2 0.4 0.0 0.4 0.0 0.1 1.6
ERIA+ 3.7 3.4 0.2 4.7 0.2 9.6 1.2 7.4 1.0 0.8 19.0
ASEAN 0.5 0.5 0.0 0.5 0.0 1.7 0.3 1.2 0.2 0.1 2.9
East Asia 2.7 2.5 0.2 3.8 0.2 7.0 0.8 5.5 0.6 0.6 14.3
Rest of ERIA+ 0.4 0.4 0.0 0.3 0.0 0.9 0.1 0.7 0.1 0.1 1.8
ROW 6.1 5.6 0.5 3.9 0.3 5.4 0.6 3.8 1.0 1.2 16.9
World 24.7 22.8 1.9 16.2 1.3 21.1 2.4 15.9 2.9 4.6 68.0
EU27 NAFTA ERIA+ ROW World
EU15Rest of
EU27ASEAN
East
Asia
Rest of
ERIA+
EU27 -3.5 -6.3 41.4 -10.8 -20.5 -29.8 -50.5 -30.8 5.7 24.7 -8.1
EU15 -7.0 -9.5 36.3 -12.8 -21.0 -31.0 -50.5 -32.0 3.5 21.3 -10.9
Rest of EU27 59.8 57.1 76.7 81.0 0.0 13.1 0.0 21.3 0.0 88.6 57.7
NAFTA -25.1 -27.4 81.0 11.7 -18.2 -14.5 -39.2 -14.7 27.2 7.3 -8.4
31.0 28.4 0.0 62.9 -11.9 13.7 -36.0 15.0 0.0 59.1 27.7
ERIA+ -2.9 -6.1 92.2 12.9 -13.4 14.3 -26.7 18.8 84.5 41.5 10.6
ASEAN -22.8 -24.3 0.0 4.2 0.0 -1.0 1.7 -11.0 133.3 -7.9 -5.5
East Asia -2.9 -6.7 110.6 11.0 -12.5 17.6 -37.1 28.6 71.0 54.2 11.9
Rest of ERIA+ 38.8 37.2 0.0 68.0 0.0 23.4 13.1 17.4 90.1 53.1 34.7
ROW 22.5 22.2 25.4 82.8 0.9 60.2 16.3 50.3 206.7 35.2 44.8
World -0.5 -3.0 43.9 18.0 -13.4 7.9 -26.9 8.0 77.3 28.8 7.4
1995-2005
South
America
South America
1995
South
America
South America
2005
South
America
South America

Figure 11 Induced trade in intermediate goods by France’s imports from Germany (1995, 2005)
Austria
Belgium
Denmark
Finland
France
Germany
Greece
Ireland
Italy
Luxembourg
Netherlands
Portugal
Spain
Sweden
United Kingdom
Czech Republic
Hungary
Iceland
Norway
Poland
Slovak Republic
Switzerland
Turkey
Estonia
Slovenia
Romania
Japan
Korea
China
Chinese Taipei
Indonesia
Singapore
Malaysia
Philippines
Thailand
Viet Nam
Australia
New Zealand
India
Canada
Mexico
United States
Argentina
Brazil
Chile
Israel
Russia
South Africa
Au
stri
a
Bel
giu
m
Den
mar
k
Fin
lan
d
Fra
nce
Ger
man
y
Gre
ece
Irel
and
Ital
y
Lu
xem
bo
urg
Net
her
lan
ds
Po
rtu
gal
Sp
ain
Sw
eden
Un
ited
Kin
gd
om
Cze
ch R
epu
bli
c
Hu
ng
ary
Icel
and
No
rway
Po
lan
d
Slo
vak
Rep
ub
lic
Sw
itze
rlan
d
Tu
rkey
Est
on
ia
Slo
ven
ia
Ro
man
ia
Jap
an
Ko
rea
Ch
ina
Ch
ines
e T
aip
ei
Ind
on
esia
Sin
gap
ore
Mal
aysi
a
Ph
ilip
pin
es
Th
aila
nd
Vie
t N
am
Au
stra
lia
New
Zea
lan
d
Ind
ia
Can
ada
Mex
ico
Un
ited
Sta
tes
Arg
enti
na
Bra
zil
Ch
ile
Isra
el
Ru
ssia
So
uth
Afr
ica
FROM
TO
ROW
SouthAmerica
NAFTA
Rest ofERIA
ASEAN
East Asia
Rest ofEurope
EU15

Figure 12 Induced trade in intermediate goods by Japan’s imports from China (1995, 2005)
Austria
Belgium
Denmark
Finland
France
Germany
Greece
Ireland
Italy
Luxembourg
Netherlands
Portugal
Spain
Sweden
United Kingdom
Czech Republic
Hungary
Iceland
Norway
Poland
Slovak Republic
Switzerland
Turkey
Estonia
Slovenia
Romania
Japan
Korea
China
Chinese Taipei
Indonesia
Singapore
Malaysia
Philippines
Thailand
Viet Nam
Australia
New Zealand
India
Canada
Mexico
United States
Argentina
Brazil
Chile
Israel
Russia
South Africa
Au
stri
a
Bel
giu
m
Den
mar
k
Fin
lan
d
Fra
nce
Ger
man
y
Gre
ece
Irel
and
Ital
y
Lu
xem
bo
urg
Net
her
lan
ds
Po
rtu
gal
Sp
ain
Sw
eden
Un
ited
Kin
gd
om
Cze
ch R
epu
bli
c
Hu
ng
ary
Icel
and
No
rway
Po
lan
d
Slo
vak
Rep
ub
lic
Sw
itze
rlan
d
Tu
rkey
Est
on
ia
Slo
ven
ia
Ro
man
ia
Jap
an
Ko
rea
Ch
ina
Ch
ines
e T
aip
ei
Ind
on
esia
Sin
gap
ore
Mal
aysi
a
Ph
ilip
pin
es
Th
aila
nd
Vie
t N
am
Au
stra
lia
New
Zea
lan
d
Ind
ia
Can
ada
Mex
ico
Un
ited
Sta
tes
Arg
enti
na
Bra
zil
Ch
ile
Isra
el
Ru
ssia
So
uth
Afr
ica
FROM
TO
ROW
SouthAmerica
NAFTA
Rest ofERIA
ASEAN
East Asia
Rest ofEurope
EU15

Table 8 Competitive advantage indicator based on TiVA concept for selected industries (1995)
1995
Rank Country RCA Country RCA by TiVA Country RCA Country RCA by TiVA Country RCA Country RCA by TiVA
1 Portugal 4.13 Portugal 4.99 Singapore 6.80 Ireland 9.55 Korea 3.88 Korea 4.44
2 Hong Kong 3.82 Hong Kong 4.64 Ireland 5.27 Singapore 6.50 Singapore 3.36 Singapore 3.62
3 China 3.54 Romania 3.77 Chinese Taipei 3.60 Chinese Taipei 3.21 United States 1.89 United States 2.00
4 Romania 3.41 China 3.19 Mexico 3.16 Mexico 2.86 Japan 1.45 Japan 1.46
5 Turkey 3.26 Turkey 3.18 Japan 2.13 Poland 1.95 Mexico 1.34 Germany 1.38
6 India 2.85 Thailand 3.04 United States 1.59 Japan 1.81 Portugal 1.14 Slovenia 1.22
7 Philippines 2.65 Philippines 2.55 Hong Kong 1.49 United Kingdom 1.52 Germany 1.12 Portugal 1.04
8 Thailand 2.38 Italy 2.31 United Kingdom 1.47 United States 1.52 Hong Kong 1.12 Mexico 1.03
9 Viet Nam 2.19 India 2.17 China 1.06 Hong Kong 1.47 Czech Republic 1.07 Austria 0.95
10 Korea 2.17 Indonesia 2.17 Poland 0.92 RoW 1.03 Slovenia 1.00 Hong Kong 0.88
11 Italy 2.09 Korea 2.14 Korea 0.83 France 0.97 Canada 0.91 Canada 0.85
12 Indonesia 2.07 Slovenia 1.87 France 0.80 Korea 0.53 Malaysia 0.91 China 0.83
13 Estonia 2.04 Estonia 1.75 Canada 0.57 Australia 0.47 Austria 0.87 Hungary 0.81
14 RoW 1.71 Chinese Taipei 1.58 Australia 0.46 Spain 0.47 Chinese Taipei 0.84 Finland 0.80
15 Slovenia 1.67 Poland 1.42 Spain 0.39 China 0.47 China 0.83 Romania 0.77
16 Chinese Taipei 1.57 Hungary 1.37 Finland 0.33 Germany 0.42 Finland 0.82 France 0.75
17 Argentina 1.27 Viet Nam 1.36 Netherlands 0.32 Netherlands 0.34 France 0.80 United Kingdom 0.74
18 Poland 1.11 Argentina 1.29 Italy 0.31 Romania 0.33 Romania 0.74 Chinese Taipei 0.73
19 Greece 1.09 Mexico 1.19 Germany 0.28 Italy 0.31 Ireland 0.71 Czech Republic 0.69
20 Austria 0.96 Greece 1.07 Romania 0.28 Sweden 0.27 Italy 0.70 Italy 0.66
21 Brazil 0.95 Austria 1.00 Sweden 0.15 Finland 0.24 Hungary 0.69 Spain 0.65
22 Czech Republic 0.91 Brazil 0.97 Norway 0.13 Argentina 0.19 Thailand 0.66 Belgium 0.62
23 Mexico 0.89 Czech Republic 0.92 Argentina 0.13 Canada 0.17 United Kingdom 0.63 Malaysia 0.58
24 Belgium 0.86 Spain 0.90 RoW 0.13 Slovak Republic 0.14 Spain 0.61 Sweden 0.56
25 Hungary 0.84 Belgium 0.87 Hungary 0.10 Norway 0.12 Sweden 0.61 Denmark 0.53
26 Spain 0.79 Slovak Republic 0.85 Czech Republic 0.08 Slovenia 0.11 Slovak Republic 0.55 Thailand 0.50
27 Israel 0.69 RoW 0.81 Switzerland 0.08 Denmark 0.10 Denmark 0.52 Slovak Republic 0.45
28 New Zealand 0.64 Israel 0.80 Estonia 0.08 Estonia 0.10 Estonia 0.46 Estonia 0.45
29 Slovak Republic 0.63 Luxembourg 0.63 Denmark 0.06 Czech Republic 0.09 New Zealand 0.45 Ireland 0.37
30 France 0.60 France 0.61 Brazil 0.06 Hungary 0.09 Belgium 0.44 Brazil 0.35
Textiles, textile products, leather and footwear Office, accounting & computing machinery Electrical machinery & apparatus, nec

Table 9 Competitive advantage indicator based on TiVA concept for selected industries (1995)
1995
Rank Country RCA Country RCA by TiVA Country RCA Country RCA by TiVA Country RCA Country RCA by TiVA
1 Malaysia 7.64 Malaysia 7.65 Switzerland 5.68 Israel 5.40 Mexico 3.01 Mexico 4.50
2 Thailand 3.65 Japan 3.27 Israel 4.50 Switzerland 4.63 Spain 2.69 Japan 2.47
3 Chinese Taipei 2.94 Chinese Taipei 2.99 Hong Kong 2.41 United States 2.22 Canada 2.45 Germany 2.42
4 Japan 2.84 Hong Kong 2.56 United States 2.01 Hong Kong 2.09 Japan 2.19 Spain 2.30
5 Philippines 2.47 Thailand 2.53 Japan 1.59 Ireland 1.72 Germany 2.00 Canada 2.05
6 Hong Kong 2.42 Israel 2.11 Slovenia 1.34 United Kingdom 1.36 Belgium 1.76 Sweden 1.80
7 Estonia 1.78 Philippines 1.73 Sweden 1.30 Sweden 1.34 Sweden 1.61 Belgium 1.47
8 Finland 1.63 Singapore 1.67 Ireland 1.28 Slovenia 1.33 Slovenia 1.32 Korea 1.27
9 Singapore 1.61 Finland 1.50 United Kingdom 1.27 Denmark 1.27 France 1.20 Poland 1.14
10 Sweden 1.44 China 1.17 Denmark 1.20 Hungary 1.27 Austria 1.17 Austria 1.10
11 Israel 1.39 Austria 1.15 Germany 1.11 Germany 1.20 Portugal 1.06 France 0.99
12 China 1.31 Sweden 0.96 France 1.00 France 1.19 Poland 0.98 Hungary 0.97
13 Austria 1.00 United Kingdom 0.88 Hungary 0.96 Japan 1.15 Hungary 0.94 Brazil 0.90
14 Korea 0.95 Netherlands 0.85 Italy 0.81 Austria 0.82 United States 0.94 United Kingdom 0.83
15 United Kingdom 0.95 Korea 0.67 Thailand 0.80 Thailand 0.80 Italy 0.84 Argentina 0.77
16 Hungary 0.86 Romania 0.62 Finland 0.77 Finland 0.79 Korea 0.84 Italy 0.72
17 Portugal 0.82 France 0.60 Austria 0.72 Italy 0.78 Brazil 0.84 Slovenia 0.64
18 Netherlands 0.67 Hungary 0.56 Estonia 0.65 Estonia 0.68 United Kingdom 0.81 Portugal 0.63
19 France 0.64 United States 0.53 Chinese Taipei 0.63 Singapore 0.61 Argentina 0.78 South Africa 0.57
20 Ireland 0.59 Ireland 0.49 China 0.61 Slovak Republic 0.56 South Africa 0.72 United States 0.50
21 Indonesia 0.51 Slovenia 0.49 Slovak Republic 0.51 Netherlands 0.52 Czech Republic 0.56 Czech Republic 0.44
22 Romania 0.46 Portugal 0.47 Argentina 0.50 Portugal 0.52 Slovak Republic 0.49 Turkey 0.43
23 United States 0.45 Belgium 0.46 Korea 0.47 Chinese Taipei 0.45 Netherlands 0.35 China 0.42
24 Slovenia 0.44 Denmark 0.46 Netherlands 0.47 Korea 0.44 Turkey 0.32 Chinese Taipei 0.41
25 Germany 0.40 Germany 0.38 Portugal 0.46 China 0.42 India 0.28 Slovak Republic 0.37
26 Spain 0.40 Italy 0.38 Singapore 0.43 Czech Republic 0.38 Chinese Taipei 0.26 India 0.31
27 Denmark 0.39 Estonia 0.37 Spain 0.39 Argentina 0.38 China 0.21 Netherlands 0.30
28 Italy 0.37 Spain 0.34 Australia 0.31 Brazil 0.37 Australia 0.19 Thailand 0.28
29 RoW 0.37 Switzerland 0.32 Czech Republic 0.30 Spain 0.33 Romania 0.18 Finland 0.27
30 Belgium 0.35 Indonesia 0.29 RoW 0.29 Belgium 0.27 Finland 0.17 Malaysia 0.27
Radio, television & communication equipment Medical, precision & optical instruments Motor vehicles, trailers & semi-trailers

Table 10 Competitive advantage indicator based on TiVA concept for selected industries (2005)
2005
Rank Country RCA Country RCA by TiVA Country RCA Country RCA by TiVA Country RCA Country RCA by TiVA
1 Turkey 4.47 Turkey 5.59 Mexico 5.48 Singapore 7.93 Japan 4.43 Japan 4.29
2 Viet Nam 3.50 Portugal 4.09 Singapore 4.49 Thailand 5.81 China 2.57 Hungary 3.12
3 Hong Kong 2.99 Romania 3.61 Ireland 4.03 Mexico 4.84 Hungary 1.91 Romania 1.96
4 Romania 2.97 China 2.81 China 4.01 Hong Kong 4.65 Hong Kong 1.60 China 1.84
5 China 2.94 Hong Kong 2.78 Thailand 3.88 Ireland 3.81 Czech Republic 1.58 Czech Republic 1.74
6 Portugal 2.88 Greece 2.53 Hong Kong 3.71 China 2.66 Romania 1.57 Slovak Republic 1.74
7 India 2.36 Viet Nam 2.50 Czech Republic 1.91 Hungary 2.24 Slovak Republic 1.47 Germany 1.67
8 Indonesia 2.05 Indonesia 2.48 Hungary 1.72 Philippines 1.92 Mexico 1.38 Slovenia 1.51
9 Italy 1.97 Thailand 2.22 Japan 1.26 Japan 1.24 Slovenia 1.25 Hong Kong 1.21
10 Greece 1.85 Italy 2.14 Philippines 1.04 United States 0.86 Germany 1.16 Estonia 1.14
11 RoW 1.72 Philippines 2.11 Chinese Taipei 0.83 United Kingdom 0.67 Estonia 1.05 Malaysia 1.14
12 Estonia 1.60 Estonia 1.97 United States 0.69 Korea 0.55 Poland 1.03 Thailand 1.05
13 Thailand 1.44 India 1.89 Korea 0.47 Germany 0.48 Malaysia 1.00 Finland 1.03
14 Slovenia 1.26 Slovenia 1.41 United Kingdom 0.41 Chinese Taipei 0.48 Denmark 0.92 Mexico 1.01
15 Philippines 1.05 Slovak Republic 1.30 Germany 0.30 RoW 0.46 Austria 0.90 Poland 1.01
16 Mexico 0.95 Brunei 1.21 India 0.30 India 0.39 Thailand 0.90 Italy 0.99
17 Spain 0.85 Mexico 1.16 Netherlands 0.26 Czech Republic 0.35 Italy 0.87 Austria 0.98
18 Korea 0.83 Korea 1.11 France 0.25 Sweden 0.31 Finland 0.86 Korea 0.89
19 Poland 0.80 Spain 1.05 Canada 0.23 France 0.30 Portugal 0.85 Portugal 0.87
20 Slovak Republic 0.80 RoW 1.01 Spain 0.20 Spain 0.27 France 0.82 France 0.80
21 Chinese Taipei 0.79 Argentina 1.00 Sweden 0.17 Netherlands 0.25 Switzerland 0.80 Denmark 0.75
22 Argentina 0.77 Poland 0.98 Italy 0.13 Canada 0.20 Spain 0.70 Spain 0.68
23 Brunei 0.74 Czech Republic 0.89 Brazil 0.13 Denmark 0.19 Sweden 0.62 Sweden 0.61
24 Czech Republic 0.72 Chinese Taipei 0.89 Portugal 0.12 Italy 0.16 United Kingdom 0.55 United Kingdom 0.61
25 Brazil 0.67 Brazil 0.88 Denmark 0.09 Portugal 0.16 Chinese Taipei 0.53 Belgium 0.60
26 Belgium 0.63 Belgium 0.72 Poland 0.08 Poland 0.15 Korea 0.50 United States 0.54
27 France 0.60 Hungary 0.72 RoW 0.08 Slovenia 0.15 Turkey 0.49 Chinese Taipei 0.52
28 Hungary 0.59 France 0.64 Austria 0.07 Slovak Republic 0.14 United States 0.45 Brazil 0.50
29 Austria 0.53 Austria 0.63 Slovenia 0.06 Austria 0.10 Indonesia 0.43 Turkey 0.49
30 New Zealand 0.51 Luxembourg 0.61 Slovak Republic 0.05 Switzerland 0.10 Belgium 0.37 Indonesia 0.49
Textiles, textile products, leather and footwear Office, accounting & computing machinery Electrical machinery & apparatus, nec

Table 11 Competitive advantage indicator based on TiVA concept for selected industries (2005)
2005
Rank Country RCA Country RCA by TiVA Country RCA Country RCA by TiVA Country RCA Country RCA by TiVA
1 Chinese Taipei 6.30 Chinese Taipei 9.10 Switzerland 6.78 Switzerland 6.36 Mexico 2.75 Mexico 3.83
2 Philippines 6.12 Philippines 8.60 Philippines 4.79 Philippines 6.27 Japan 2.46 Japan 3.02
3 Korea 4.60 Finland 5.44 Israel 3.66 Israel 6.01 Germany 2.44 Germany 2.85
4 Malaysia 3.89 Korea 5.29 Ireland 2.44 Ireland 4.00 Spain 2.33 Hungary 2.49
5 Finland 3.78 Singapore 4.62 Hong Kong 2.32 Hong Kong 2.20 Slovak Republic 2.18 Czech Republic 2.30
6 Hong Kong 3.56 Malaysia 4.32 United States 1.61 Germany 1.95 Canada 2.13 Korea 2.14
7 Hungary 3.22 Hong Kong 3.80 Germany 1.55 Denmark 1.82 Hungary 2.06 Spain 2.11
8 Singapore 3.00 Israel 3.13 United Kingdom 1.44 United Kingdom 1.62 Czech Republic 1.93 Turkey 1.72
9 Estonia 2.61 Hungary 2.40 China 1.36 France 1.60 Poland 1.79 Sweden 1.67
10 Thailand 1.59 Sweden 1.47 Denmark 1.28 Finland 1.47 France 1.76 Slovak Republic 1.60
11 Israel 1.42 United States 1.27 France 1.26 Singapore 1.46 Sweden 1.66 Austria 1.58
12 Sweden 1.26 Austria 0.97 Sweden 1.21 Sweden 1.45 Austria 1.65 Canada 1.57
13 United States 1.13 Ireland 0.97 Slovenia 1.20 United States 1.45 Turkey 1.52 Poland 1.48
14 Portugal 1.04 Indonesia 0.87 Finland 1.15 Slovenia 1.41 Korea 1.51 France 1.23
15 Slovak Republic 1.00 Estonia 0.80 Italy 1.10 Italy 1.08 Portugal 1.43 Belgium 1.18
16 Indonesia 0.81 Thailand 0.79 Japan 1.07 Austria 0.99 Belgium 1.41 Portugal 1.13
17 Czech Republic 0.76 China 0.69 Singapore 0.78 Japan 0.91 Slovenia 1.38 Romania 1.09
18 China 0.76 Czech Republic 0.62 Chinese Taipei 0.75 Hungary 0.89 Brazil 1.30 Slovenia 0.96
19 Turkey 0.58 France 0.59 Czech Republic 0.74 Czech Republic 0.86 United States 1.01 Argentina 0.91
20 France 0.57 Canada 0.58 Estonia 0.74 China 0.84 Argentina 0.93 Brazil 0.89
21 Austria 0.53 Germany 0.56 Iceland 0.73 Netherlands 0.77 South Africa 0.91 Thailand 0.89
22 Poland 0.51 Italy 0.53 Malaysia 0.70 Estonia 0.77 Thailand 0.83 South Africa 0.80
23 Japan 0.49 Portugal 0.52 Austria 0.64 Iceland 0.72 Italy 0.80 United States 0.69
24 Canada 0.46 Slovak Republic 0.45 Korea 0.63 Korea 0.69 Romania 0.58 Italy 0.67
25 Ireland 0.46 Turkey 0.44 Netherlands 0.60 Malaysia 0.64 Netherlands 0.49 Philippines 0.57
26 Netherlands 0.46 Slovenia 0.43 Thailand 0.57 Thailand 0.60 United Kingdom 0.49 Netherlands 0.48
27 India 0.46 Switzerland 0.40 Hungary 0.51 Luxembourg 0.59 Philippines 0.47 United Kingdom 0.47
28 Germany 0.45 United Kingdom 0.37 Greece 0.50 Greece 0.53 India 0.33 Estonia 0.43
29 Spain 0.38 Japan 0.36 Spain 0.48 Slovak Republic 0.53 Australia 0.28 New Zealand 0.35
30 Brazil 0.37 Belgium 0.33 Australia 0.44 Poland 0.51 Estonia 0.27 Finland 0.29
Radio, television & communication equipment Medical, precision & optical instruments Motor vehicles, trailers & semi-trailers

41
Appendix 1 Country groups
EU27 EU15the rest
of EU27NAFTA
South
AmericaERIA+ ASEAN East Asia
the rest
of ERIA+ROW World
1 Australia 1 12 Austria 1 13 Belgium, 1 14 Canada 15 Chile 16 Czech Rep. 1 17 Denmark 1 18 Estonia 1 19 Finland 1 1
10 France 1 111 Germany 1 112 Greece 1 113 Hungary 1 114 Iceland 115 Ireland 1 116 Israel 117 Italy 1 118 Japan 1 119 Korea 1 120 Luxembourg 1 121 Mexico 122 Netherlands 1 123 New Zealand 1 124 Norway 125 Poland 1 126 Portugal 1 127 Slovakia 1 128 Slovenia 1 129 Spain 1 130 Sweden 1 131 Switzerland 132 Turkey 133 United Kingdom 1 134 USA 135 Argentina 136 Brazil 137 China 1 138 Chinese Taipei 1 139 India 1 140 Indonesia 1 141 Russian Federation 142 Singapore 1 143 South Africa 144 Hong Kong 1 145 Malaysia 1 146 Philippines 1 147 Thailand 1 148 Romania 1 149 Viet Nam 1 150 Saudi Arabia 151 Brunei Darussalam 1 152 Bulgaria 1 153 Cyprus 1 154 Latvia 1 155 Lithuania 1 156 Malta 1 157 Cambodia 1 158 Albania 159 Bosnia & Herzegovina 160 Croatia 161 Macedonia, The Fmr. 162 Moldova, Rep. of 163 Montenegro 164 Serbia 165 Serbia & Montenegro 166 Unspecified67 Rest of world 168 World 1
Sum 27 15 12 3 3 16 8 5 3 17 1

42
Appendix 2 Evolution of inter and intra-regional trade in intermediate goods (%)
EU27 NAFTA ERIA+ ROW World
EU15Rest of
EU27ASEAN
East
Asia
Rest of
ERIA+
EU27 25.5 23.9 1.6 3.6 0.7 3.4 0.8 2.3 0.4 6.6 40.6
EU15 23.9 22.7 1.3 3.6 0.6 3.3 0.8 2.2 0.4 6.1 38.2
Rest of EU27 1.6 1.3 0.3 0.1 0.0 0.1 0.0 0.1 0.0 0.5 2.4
NAFTA 2.9 2.8 0.1 7.7 0.3 5.0 1.0 3.9 0.2 2.3 18.3
0.4 0.4 0.0 0.5 0.3 0.2 0.0 0.2 0.0 0.3 1.8
ERIA+ 3.4 3.3 0.1 5.4 0.6 15.7 4.0 10.4 1.4 4.2 29.6
ASEAN 1.0 1.0 0.0 1.2 0.1 5.1 1.5 3.3 0.3 0.7 8.2
East Asia 2.0 1.9 0.1 3.8 0.4 9.9 2.2 6.7 1.0 3.0 19.2
Rest of ERIA+ 0.5 0.4 0.0 0.4 0.0 0.7 0.2 0.4 0.2 0.4 2.1
ROW 5.0 4.7 0.3 1.6 0.4 1.7 0.4 1.1 0.2 1.0 9.8
World 37.2 35.2 2.0 18.8 2.3 26.2 6.2 17.7 2.3 14.5 100.0
EU27 NAFTA ERIA+ ROW World
EU15Rest of
EU27ASEAN
East
Asia
Rest of
ERIA+
EU27 19.0 16.5 2.5 2.0 0.6 4.0 0.8 2.8 0.4 7.2 33.4
EU15 16.2 14.4 1.8 1.9 0.6 3.5 0.7 2.3 0.4 6.3 29.0
Rest of EU27 2.7 2.1 0.7 0.1 0.0 0.6 0.1 0.5 0.0 0.9 4.4
NAFTA 2.3 2.2 0.1 6.0 0.4 3.9 0.6 3.1 0.2 3.5 16.2
0.4 0.3 0.0 0.4 0.3 0.6 0.1 0.4 0.1 0.4 2.0
ERIA+ 2.6 2.5 0.1 3.2 1.2 20.6 5.9 12.4 2.4 8.7 36.5
ASEAN 0.6 0.6 0.0 0.8 0.1 5.3 1.9 3.0 0.4 1.3 8.1
East Asia 1.7 1.6 0.1 2.2 1.0 14.0 3.4 8.7 1.8 6.0 25.0
Rest of ERIA+ 0.3 0.3 0.0 0.2 0.1 1.3 0.5 0.6 0.2 1.4 3.5
ROW 4.0 3.6 0.4 1.4 0.5 3.8 0.6 2.5 0.6 2.1 11.9
World 28.3 25.1 3.2 13.0 3.0 32.9 8.0 21.2 3.7 22.0 100.0
EU27 NAFTA ERIA+ ROW World
EU15Rest of
EU27ASEAN
East
Asia
Rest of
ERIA+
EU27 -25.5 -31.0 56.3 -44.4 -14.3 17.6 0.0 21.7 0.0 9.1 -17.7
EU15 -32.2 -36.6 38.5 -47.2 0.0 6.1 -12.5 4.5 0.0 3.3 -24.1
Rest of EU27 68.8 61.5 133.3 0.0 0.0 500.0 0.0 400.0 0.0 80.0 83.3
NAFTA -20.7 -21.4 0.0 -22.1 33.3 -22.0 -40.0 -20.5 0.0 52.2 -11.5
0.0 -25.0 0.0 -20.0 0.0 200.0 0.0 100.0 0.0 33.3 11.1
ERIA+ -23.5 -24.2 0.0 -40.7 100.0 31.2 47.5 19.2 71.4 107.1 23.3
ASEAN -40.0 -40.0 0.0 -33.3 0.0 3.9 26.7 -9.1 33.3 85.7 -1.2
East Asia -15.0 -15.8 0.0 -42.1 150.0 41.4 54.5 29.9 80.0 100.0 30.2
Rest of ERIA+ -40.0 -25.0 0.0 -50.0 0.0 85.7 150.0 50.0 0.0 250.0 66.7
ROW -20.0 -23.4 33.3 -12.5 25.0 123.5 50.0 127.3 200.0 110.0 21.4
World -23.9 -28.7 60.0 -30.9 30.4 25.6 29.0 19.8 60.9 51.7 0.0
South
America
South
America
South
America
South America
1995
2010
1995-2010
South America
South America

43
Appendix 3 Evolution of inter and intra-regional trade in consumption goods (%)
EU27 NAFTA ERIA+ ROW World
EU15Rest of
EU27ASEAN
East
Asia
Rest of
ERIA+
EU27 28.6 26.5 2.0 1.7 0.6 6.5 1.4 4.3 0.8 5.4 43.0
EU15 27.3 25.5 1.8 1.6 0.5 6.4 1.4 4.2 0.8 5.2 41.2
Rest of EU27 1.3 1.1 0.2 0.1 0.0 0.2 0.0 0.1 0.0 0.2 1.8
NAFTA 2.7 2.6 0.1 4.6 0.5 9.4 2.0 6.9 0.5 2.5 19.7
0.2 0.2 0.0 0.3 0.4 0.3 0.0 0.2 0.0 0.2 1.3
ERIA+ 3.1 3.0 0.0 3.4 0.2 15.2 3.0 11.1 1.1 1.3 23.2
ASEAN 0.5 0.5 0.0 0.5 0.0 2.4 1.0 1.1 0.2 0.2 3.5
East Asia 2.3 2.2 0.0 2.7 0.2 12.1 1.8 9.6 0.6 0.9 18.2
Rest of ERIA+ 0.3 0.3 0.0 0.3 0.0 0.8 0.1 0.4 0.2 0.1 1.5
ROW 6.3 5.9 0.4 1.5 0.4 3.5 0.9 2.1 0.5 1.0 12.7
World 40.9 38.3 2.6 11.5 2.0 34.9 7.3 24.6 3.0 10.4 100.0
EU27 NAFTA ERIA+ ROW World
EU15Rest of
EU27ASEAN
East
Asia
Rest of
ERIA+
EU27 25.0 21.1 3.8 1.3 0.5 10.1 1.4 7.8 0.9 4.9 41.9
EU15 22.0 19.2 2.9 1.2 0.5 9.5 1.3 7.3 0.9 4.6 37.9
Rest of EU27 2.9 2.0 1.0 0.1 0.0 0.6 0.1 0.5 0.0 0.4 4.0
NAFTA 2.2 2.1 0.1 5.2 0.4 11.9 2.0 9.2 0.7 2.2 21.8
0.2 0.2 0.0 0.2 0.3 0.6 0.1 0.5 0.0 0.1 1.3
ERIA+ 2.5 2.4 0.1 2.0 0.4 13.1 2.9 9.2 1.0 1.6 19.5
ASEAN 0.4 0.4 0.0 0.3 0.0 2.5 1.1 1.2 0.3 0.2 3.5
East Asia 1.7 1.7 0.1 1.4 0.3 9.0 1.5 7.0 0.5 1.1 13.6
Rest of ERIA+ 0.4 0.4 0.0 0.3 0.0 1.5 0.3 1.0 0.2 0.2 2.4
ROW 5.0 4.4 0.6 1.3 0.9 6.1 1.2 3.7 1.1 2.2 15.5
World 34.9 30.2 4.7 9.9 2.4 41.7 7.6 30.4 3.8 11.0 100.0
EU27 NAFTA ERIA+ ROW World
EU15Rest of
EU27ASEAN
East
Asia
Rest of
ERIA+
EU27 -12.6 -20.4 90.0 -23.5 -16.7 55.4 0.0 81.4 12.5 -9.3 -2.6
EU15 -19.4 -24.7 61.1 -25.0 0.0 48.4 -7.1 73.8 12.5 -11.5 -8.0
Rest of EU27 123.1 81.8 400.0 0.0 0.0 200.0 0.0 400.0 0.0 100.0 122.2
NAFTA -18.5 -19.2 0.0 13.0 -20.0 26.6 0.0 33.3 40.0 -12.0 10.7
0.0 0.0 0.0 -33.3 -25.0 100.0 0.0 150.0 0.0 -50.0 0.0
ERIA+ -19.4 -20.0 0.0 -41.2 100.0 -13.8 -3.3 -17.1 -9.1 23.1 -15.9
ASEAN -20.0 -20.0 0.0 -40.0 0.0 4.2 10.0 9.1 50.0 0.0 0.0
East Asia -26.1 -22.7 0.0 -48.1 50.0 -25.6 -16.7 -27.1 -16.7 22.2 -25.3
Rest of ERIA+ 33.3 33.3 0.0 0.0 0.0 87.5 200.0 150.0 0.0 100.0 60.0
ROW -20.6 -25.4 50.0 -13.3 125.0 74.3 33.3 76.2 120.0 120.0 22.0
World -14.7 -21.1 80.8 -13.9 20.0 19.5 4.1 23.6 26.7 5.8 0.0
South
America
South
America
South
America
South America
1995
2010
1995-2010
South America
South America

44
Appendix 4 Evolution of inter and intra-regional trade in capital goods (%)
EU27 NAFTA ERIA+ ROW World
EU15Rest of
EU27ASEAN
East
Asia
Rest of
ERIA+
EU27 21.6 20.9 0.7 3.9 0.1 4.7 0.6 4.0 0.1 2.2 32.9
EU15 19.7 19.1 0.6 3.8 0.1 4.5 0.6 3.9 0.1 2.1 30.5
Rest of EU27 1.9 1.8 0.1 0.1 0.0 0.2 0.0 0.1 0.0 0.1 2.4
NAFTA 4.1 4.1 0.0 7.5 0.1 6.9 0.9 5.9 0.1 0.5 19.3
0.9 0.9 0.0 0.8 0.2 0.4 0.0 0.3 0.0 0.1 2.4
ERIA+ 7.6 7.5 0.1 6.2 0.0 14.9 2.2 12.5 0.3 0.8 29.7
ASEAN 2.3 2.3 0.0 1.5 0.0 5.5 1.0 4.4 0.1 0.2 9.6
East Asia 4.4 4.4 0.0 4.0 0.0 8.5 1.0 7.4 0.1 0.5 17.6
Rest of ERIA+ 0.9 0.9 0.0 0.7 0.0 0.9 0.1 0.7 0.1 0.1 2.6
ROW 8.3 8.1 0.2 2.0 0.2 4.4 0.4 3.9 0.1 0.7 15.6
World 42.6 41.5 1.1 20.4 0.7 31.4 4.1 26.7 0.6 4.4 100.0
EU27 NAFTA ERIA+ ROW World
EU15Rest of
EU27ASEAN
East
Asia
Rest of
ERIA+
EU27 17.7 15.8 2.0 2.8 0.2 7.0 0.7 6.2 0.2 1.9 29.7
EU15 15.3 13.7 1.6 2.6 0.2 6.3 0.6 5.5 0.1 1.7 26.1
Rest of EU27 2.4 2.1 0.4 0.2 0.0 0.7 0.1 0.7 0.0 0.2 3.6
NAFTA 3.4 3.2 0.2 6.4 0.2 7.7 1.0 6.5 0.2 0.6 18.3
0.7 0.7 0.0 0.6 0.4 0.8 0.1 0.7 0.0 0.1 2.6
ERIA+ 5.7 5.6 0.2 4.2 0.1 18.0 2.6 15.2 0.3 2.1 30.2
ASEAN 1.0 0.9 0.0 0.8 0.0 4.1 1.0 3.0 0.1 0.2 6.1
East Asia 3.9 3.8 0.1 2.8 0.0 12.4 1.2 11.1 0.1 1.8 20.9
Rest of ERIA+ 0.8 0.8 0.0 0.6 0.0 1.6 0.4 1.1 0.1 0.2 3.2
ROW 7.9 7.3 0.6 2.3 0.4 7.4 0.7 6.3 0.4 1.2 19.2
World 35.5 32.7 2.9 16.3 1.1 41.0 5.0 34.9 1.0 5.9 100.0
EU27 NAFTA ERIA+ ROW World
EU15Rest of
EU27ASEAN
East
Asia
Rest of
ERIA+
EU27 -18.1 -24.4 185.7 -28.2 100.0 48.9 16.7 55.0 100.0 -13.6 -9.7
EU15 -22.3 -28.3 166.7 -31.6 100.0 40.0 0.0 41.0 0.0 -19.0 -14.4
Rest of EU27 26.3 16.7 300.0 100.0 0.0 250.0 0.0 600.0 0.0 100.0 50.0
NAFTA -17.1 -22.0 0.0 -14.7 100.0 11.6 11.1 10.2 100.0 20.0 -5.2
-22.2 -22.2 0.0 -25.0 100.0 100.0 0.0 133.3 0.0 0.0 8.3
ERIA+ -25.0 -25.3 0.0 -32.3 0.0 20.8 18.2 21.6 0.0 162.5 1.7
ASEAN -56.5 -60.9 0.0 -46.7 0.0 -25.5 0.0 -31.8 0.0 0.0 -36.5
East Asia -11.4 -13.6 0.0 -30.0 0.0 45.9 20.0 50.0 0.0 260.0 18.8
Rest of ERIA+ -11.1 -11.1 0.0 -14.3 0.0 77.8 300.0 57.1 0.0 100.0 23.1
ROW -4.8 -9.9 200.0 15.0 100.0 68.2 75.0 61.5 300.0 71.4 23.1
World -16.7 -21.2 163.6 -20.1 57.1 30.6 22.0 30.7 66.7 34.1 0.0
South
America
South
America
South
America
South America
1995
2010
1995-2010
South America
South America

45
Appendix 5 Country groups
EU27 EU15the rest
of EU27NAFTA
South
AmericaERIA+ ASEAN East Asia
the rest
of ERIA+ROW
1 Australia 1 12 Austria 1 13 Belgium 1 14 Canada 15 Czech Republic 1 16 Denmark 1 17 Finland 1 18 France 1 19 Germany 1 1
10 Greece 1 111 Hungary 1 112 Iceland 113 Ireland 1 114 Italy 1 115 Japan 1 116 Korea 1 117 Luxembourg 1 118 Mexico 119 Netherlands 1 120 New Zealand 1 121 Norway 122 Poland 1 123 Portugal 1 124 Slovak Republic 1 125 Spain 1 126 Sweden 1 127 Switzerland 128 Turkey 129 United Kingdom 1 130 United States 131 Argentina 132 Brazil 133 China 1 134 Chinese Taipei 1 135 India 1 136 Indonesia 1 137 Israel 138 Russia 139 Singapore 1 140 South Africa 141 Hong Kong 1 142 Chile 143 Estonia 1 144 Slovenia 1 145 Malaysia 1 146 Philippines 1 147 Thailand 1 148 Romania 1 149 Viet Nam 1 150 Saudi Arabia 151 Brunei 1 152 Bulgaria 1 153 Cyprus 1 154 Latvia 1 155 Lithuania 1 156 Malta 1 157 RoW 1
Sum 27 15 12 3 3 15 7 5 3 9