
Regional Economic Growth and Spatial Spillover Effects in ...
23
Iran. Econ. Rev. Vol. 21, No. 4, 2017. pp. 765-787 Regional Economic Growth and Spatial Spillover Effects in MENA Area Allah Morad Seif 1 , Hossein Panahi 2 , Davoud Hamidi Razi * 3 Received: February 6, 2017 Accepted: February 27, 2017 Abstract he main objective of this study is to estimate the spatial spillover effects of the economic growth among the selected countries of MENA region. For this purpose, the Spatial Durbin Model in the framework of spatial dynamic panel data was estimated during the period of 1970-2010. The spatial Diagnostic tests affirmed the occurrence of spatial positive autocorrelation phenomenon for the real per capita income. The obtained results indicated the positive spatial spillover of the economic growth among the MENA countries and the spatial elasticity of per capita GDP was estimated 0.39 percent. Also, according to visualization results, Iran has been surrounded by countries with high per capita income; so opportunity to benefit through the creation of artificial growth poles and economic collaboration with their adjacent countries is available for Iran. Other policy implications are discussed. Keywords: Real Per Capita GDP, Convergence, Regional Spillover, MENA. JEL Classification: R12, O47, O33. 1. Introduction The Middle East region and North of Africa (abbreviated to MENA), have the geo-economic, geopolitical and geostrategic importance, and the energy resources existed in this area culminating in the focus of other countries on this region. According to the World Bank report, the Middle East and North of Africa regions are included in three groups of countries in terms of natural resources and labor force: A) countries that lack natural resources, but have abundant labor force, for instance Djibouti, 1. Department of Economics, Imam Hussein Comprehensive University, Tehran, Iran ([email protected]). 2. Department of Economics, Tabriz University, Tabriz, Iran ([email protected]). 3. Department of Economics, Tabriz University, Tabriz, Iran (Corresponding Author: [email protected]). T
Transcript of Regional Economic Growth and Spatial Spillover Effects in ...
Iran. Econ. Rev. Vol. 21, No. 4, 2017. pp. 765-787
Regional Economic Growth and Spatial Spillover
Effects in MENA Area
Allah Morad Seif1, Hossein Panahi
2, Davoud Hamidi Razi*
3
Received: February 6, 2017 Accepted: February 27, 2017
Abstract he main objective of this study is to estimate the spatial spillover
effects of the economic growth among the selected countries of MENA
region. For this purpose, the Spatial Durbin Model in the framework of
spatial dynamic panel data was estimated during the period of 1970-2010.
The spatial Diagnostic tests affirmed the occurrence of spatial positive
autocorrelation phenomenon for the real per capita income. The obtained
results indicated the positive spatial spillover of the economic growth
among the MENA countries and the spatial elasticity of per capita GDP
was estimated 0.39 percent. Also, according to visualization results, Iran
has been surrounded by countries with high per capita income; so
opportunity to benefit through the creation of artificial growth poles and
economic collaboration with their adjacent countries is available for Iran .
Other policy implications are discussed.
Keywords: Real Per Capita GDP, Convergence, Regional Spillover, MENA.
JEL Classification: R12, O47, O33.
1. Introduction
The Middle East region and North of Africa (abbreviated to MENA),
have the geo-economic, geopolitical and geostrategic importance, and the
energy resources existed in this area culminating in the focus of other
countries on this region. According to the World Bank report, the Middle
East and North of Africa regions are included in three groups of countries
in terms of natural resources and labor force: A) countries that lack
natural resources, but have abundant labor force, for instance Djibouti,
1. Department of Economics, Imam Hussein Comprehensive University, Tehran,
Iran ([email protected]). 2. Department of Economics, Tabriz University, Tabriz, Iran ([email protected]).
3. Department of Economics, Tabriz University, Tabriz, Iran (Corresponding
Author: [email protected]).
T
766/ Regional Economic Growth and Spatial …
Egypt, Jordan, Lebanon, Morocco and Tunisia, B) countries that are rich
in terms of natural resources and have abundant labor force, such as
Algeria, Iran, Iraq, Syria, and Yemen, and C) countries that are rich of
natural resources, but devoid of labor force: like Bahrain, Kuwait, Libya,
Oman, Qatar, Saudi Arabia, and United Arab Emirates. Furthermore,
these countries are consisted of three groups in terms of development and
economic efficiency: A) countries whose growth continuity is directly
dependent on the price of their hydrocarbon materials, B) countries that
belong to the non-oil society and are dependent on their food
productions, C) countries which had been affected by the global financial
market fluctuations, especially the US economic crisis. Tensions and
regional unrest in the Arab spring and the Syrian civil war and their
spillover to neighboring countries including Iraq have influenced the
economic growth of the regional countries (Devarajan et al., 2014). In
this regard, many studies exist to verify this entry that the economic
situation of a country is affected not only by its inner performance, but
also the performance of its neighboring countries (Pfaffermayr, 2009.
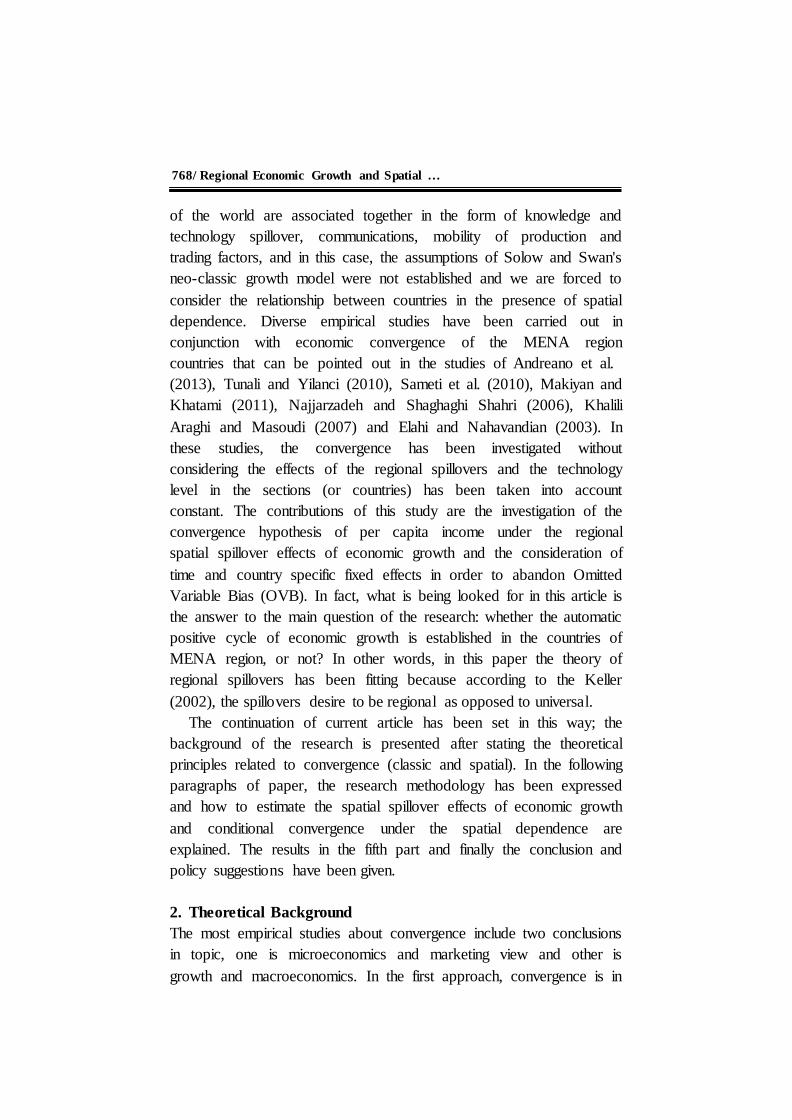
Najafi Alamdarloo et al., 2013). Figure 1 demonstrates the spatial
distribution of real per capita income of 27 countries of MENA region
during 2012-2014. As observed, the distribution of real per capita GDP
of these countries was heterogeneous in the two areas of Persian Gulf
margin and North Africa. The countries in the margin of Persian Gulf had
on average more real per capita income, whereas the countries of
Northern Africa have on average less real per capita income.
Figure 1: The Spatial Distribution of Per Capita GDP of 27 MENA Countries
in 2012-2014(Averaging), Data Retrieved from Word Bank Online Database
GDP per capita, PPP
(Constant 2011 international S )
284-6841 (9)
10054-18997 (9)
28546-136171 (8)
No value (1)

Iran. Econ. Rev. Vol. 21, No.4, 2017 /767
Since the empirical works of Mankiw et al. (1992), many
investigations have been conducted concerning the determinant
factors of growth among countries. One of the factors which has been
taken into account in recent years as an explaining factor of economic
growth is adjacency and spatial position the countries. There is a fact
that in the empirical investigations about the regional growth process,
a region cannot be considered independent from other ones, because
according to the Tobler's first law of geography that "Everything is
related to everything else, but near things are more related than
distant things"(Tobler, 1970). When we use in the research with data
that has a local component, two issues are taking place, one for spatial
dependence between the observations and the latter for the spatial
heterogeneity in relationships intended to be modeling (Akbari, 2004).
This subject later received the attention of many researchers in the
social sciences, economics, geography, and biological sciences.
Calculating the inter-unit (inter-regional) interactions in economic
sciences is achieved through the creation of spatial weight matrices
and considering of them in the classic econometric models. According
to the econometric theories, not taking into account the spatial
dependence and the spatial heterogeneity leads to the error of fitting
estimation and thereby false statistical elicitation (Anselin, 1988).
The basics of growth models was firstly formed by Ramsey in
1928, and then developed by Solow and Swan in 1956. Exogenous
growth models identified as a neoclassical growth model which is
considered the basis for the growth models. In the neoclassical growth
models with a diminishing marginal returns such as Solow and Swan
(1956) and Cass and Koopmans (1965) models, the growth rate of per
capita income of a country is reversely associated with the initial level
of per capita income. Therefore in the absence of external shocks,
poor and rich countries will be converged in terms of per capita
income levels, and it can be expected that the other variables related to
per capita income comply roughly with this rule (Makiyan and
Khatami, 2011). On the other hand, the economy has assumed two
parts in the neo-classic exogenous growth models, and a homogeneous
commodity is produced and distributed between consumption and
investment, therefore, in this model, the economies are independent of
each other and would not affect each other, while the various regions
768/ Regional Economic Growth and Spatial …
of the world are associated together in the form of knowledge and
technology spillover, communications, mobility of production and
trading factors, and in this case, the assumptions of Solow and Swan's
neo-classic growth model were not established and we are forced to
consider the relationship between countries in the presence of spatial
dependence. Diverse empirical studies have been carried out in
conjunction with economic convergence of the MENA region
countries that can be pointed out in the studies of Andreano et al.
(2013), Tunali and Yilanci (2010), Sameti et al. (2010), Makiyan and
Khatami (2011), Najjarzadeh and Shaghaghi Shahri (2006), Khalili
Araghi and Masoudi (2007) and Elahi and Nahavandian (2003). In
these studies, the convergence has been investigated without
considering the effects of the regional spillovers and the technology
level in the sections (or countries) has been taken into account
constant. The contributions of this study are the investigation of the
convergence hypothesis of per capita income under the regional
spatial spillover effects of economic growth and the consideration of
time and country specific fixed effects in order to abandon Omitted
Variable Bias (OVB). In fact, what is being looked for in this article is
the answer to the main question of the research: whether the automatic
positive cycle of economic growth is established in the countries of
MENA region, or not? In other words, in this paper the theory of
regional spillovers has been fitting because according to the Keller
(2002), the spillovers desire to be regional as opposed to universal.
The continuation of current article has been set in this way; the
background of the research is presented after stating the theoretical
principles related to convergence (classic and spatial). In the following
paragraphs of paper, the research methodology has been expressed
and how to estimate the spatial spillover effects of economic growth
and conditional convergence under the spatial dependence are
explained. The results in the fifth part and finally the conclusion and
policy suggestions have been given.
2. Theoretical Background
The most empirical studies about convergence include two conclusions
in topic, one is microeconomics and marketing view and other is
growth and macroeconomics. In the first approach, convergence is in
Iran. Econ. Rev. Vol. 21, No.4, 2017 /769
the form of purchasing power parity (PPP) and law of one price
(LOOP) that is generated from market performance. In the second
approach, convergence in the form of growth models and marginal
diminishing return law and learning effects is presented. According to
the law of one price, if there are no costs of transportation and trading
obstacles, common goods in calculating with one unit joint currency
ought to have common price in diverse countries or in provinces of one
country. From theoretical point of view, profit searching and arbitrage
operation equalize the price of common good in different countries.
Convergence in the literature of growth economy is generated from the
concepts of neoclassical growth model. Neoclassical growth theory
predicts a long-run tendency toward convergence of output and income
per capita across the world economy, because: (a) Technology is a
global public good, so all countries should experience the same long-
run rates of technical progress, (b) Diminishing returns imply that
investment in rich countries should slow down while poor countries
continue to accumulate, (c) International mobility of capital and labor,
combined with commodity trade, should reinforce the market forces
driving convergence toward common worldwide wage rates and profit
rates, and hence common living standards (Bertram, 2004: 343-344). In
endogenous growth models, even if the law of diminishing marginal
returns is true, its effect is insignificant and the balanced growth path of
the developed and developing countries is being divergent from each
other. But, however the occurrence of convergence is feasible. In the
endogenous growth model, the convergence is discussed in the form of
technology absorption effects, or "learning effects". That means the
imitation of technology is faster and less costly in comparison with the
invention of technology. Based on endogenous growth models, the
countries that have sufficient potential for technology attraction grow
faster than other countries with high technology. Adam Smith who is a
classic economist, mentioned in his endogenous growth theory that the
new technology knowledge is either a public commodity or will be a
public commodity, namely its essence is such that the usage of one does
not preclude the use other and they are not refusal from others. In
empirical studies, convergence concept is applicable for economical
variants of per capita CO2 emissions, Carbon Dioxide intensity, real per
capita GDP, total factor productivity (TFP), consumer price index
770/ Regional Economic Growth and Spatial …
(CPI), inflation, retail price of energy sources and energy intensity (or
energy productivity). Making decisions about establishing or breakup
regional blocs, market segmentation and fair environmental policies are
important applications of convergence concept for governmental
decision-makers and international organizations (Hamidi Razi and
Feshari, 2015).
Among various tests of convergence hypothesis (such as σ-
convergence, β-convergence, stochastic convergence, and distribution
dynamics) only the β-convergence can provide comprehensive
information regarding the future distribution of per capita GDP. β
convergence (conditional and absolute) is one of the important and at
the same time more attractive concepts in the context of the growth
economy. Barro (1991) was the first person who estimated the growth
model in the field of the cross-country econometrics and in this
model; he fitted the factors effective on the economic growth in
different countries. One of the factors that he applied in his study was
the initial level effect of per capita income, which is known to the
Beta convergence in the literature of growth economics. The
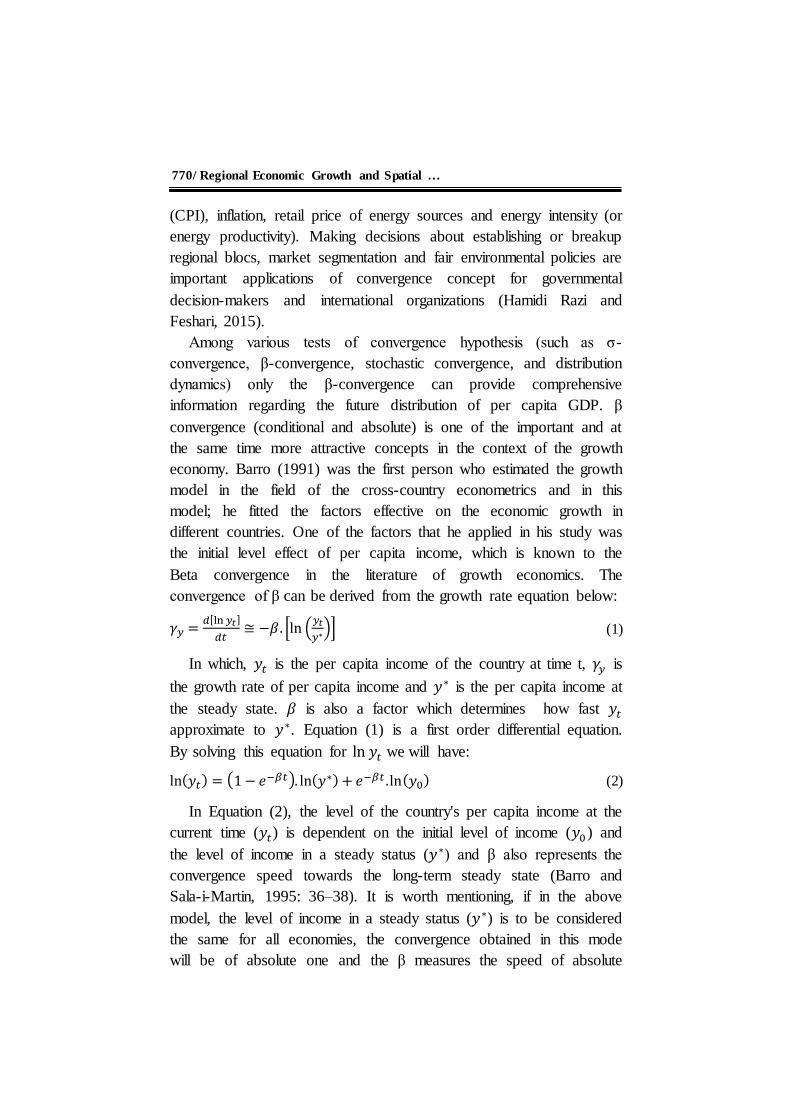
convergence of β can be derived from the growth rate equation below:
(1) 𝛾𝑦 =𝑑[ln 𝑦𝑡]
𝑑𝑡≅ −𝛽. [ln (
𝑦𝑡
𝑦∗)]
In which, 𝑦𝑡 is the per capita income of the country at time t, 𝛾𝑦 is
the growth rate of per capita income and 𝑦∗ is the per capita income at
the steady state. 𝛽 is also a factor which determines how fast 𝑦𝑡
approximate to 𝑦∗. Equation (1) is a first order differential equation.
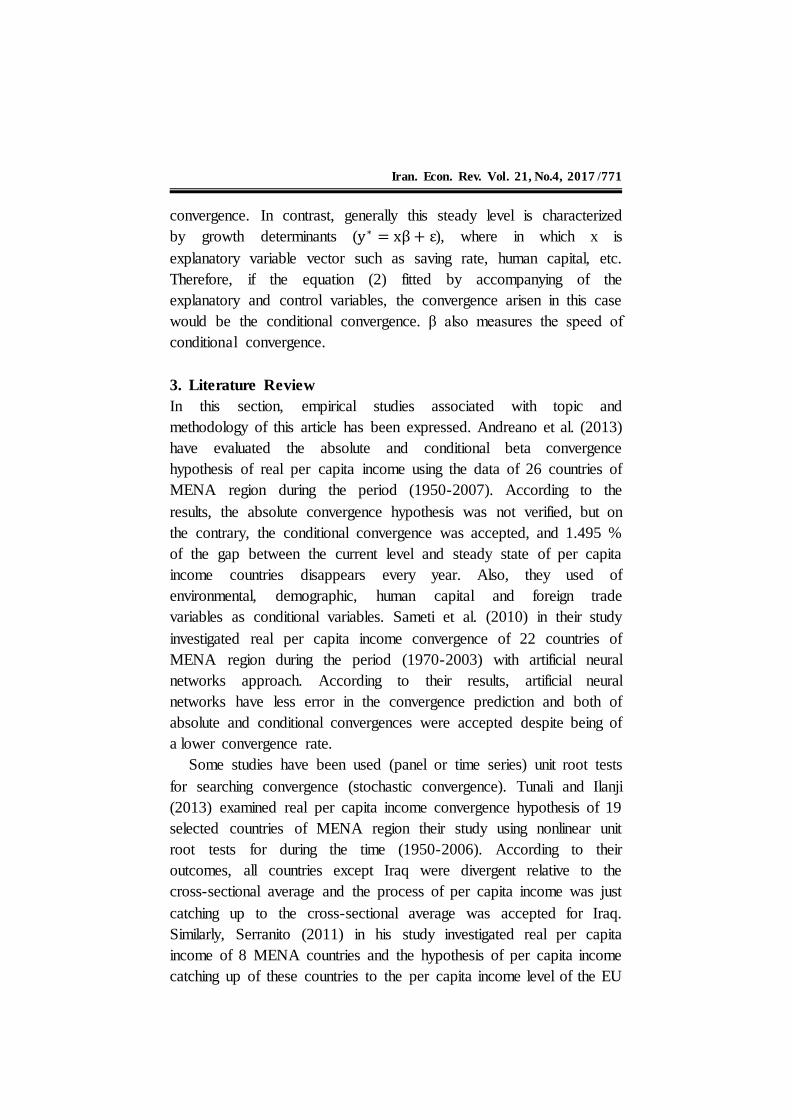
By solving this equation for ln 𝑦𝑡 we will have:
(2) ln(𝑦𝑡) = (1 − 𝑒−𝛽𝑡). ln(𝑦∗) + 𝑒−𝛽𝑡 .ln(𝑦0)
In Equation (2), the level of the country's per capita income at the
current time (𝑦𝑡) is dependent on the initial level of income (𝑦0 ) and
the level of income in a steady status (𝑦∗) and β also represents the
convergence speed towards the long-term steady state (Barro and
Sala-i-Martin, 1995: 36–38). It is worth mentioning, if in the above
model, the level of income in a steady status (𝑦∗) is to be considered
the same for all economies, the convergence obtained in this mode
will be of absolute one and the β measures the speed of absolute
Iran. Econ. Rev. Vol. 21, No.4, 2017 /771
convergence. In contrast, generally this steady level is characterized
by growth determinants (y∗ = xβ + ε), where in which x is
explanatory variable vector such as saving rate, human capital, etc.
Therefore, if the equation (2) fitted by accompanying of the
explanatory and control variables, the convergence arisen in this case
would be the conditional convergence. β also measures the speed of
conditional convergence.
3. Literature Review
In this section, empirical studies associated with topic and
methodology of this article has been expressed. Andreano et al. (2013)
have evaluated the absolute and conditional beta convergence
hypothesis of real per capita income using the data of 26 countries of
MENA region during the period (1950-2007). According to the
results, the absolute convergence hypothesis was not verified, but on
the contrary, the conditional convergence was accepted, and 1.495 %
of the gap between the current level and steady state of per capita
income countries disappears every year. Also, they used of
environmental, demographic, human capital and foreign trade
variables as conditional variables. Sameti et al. (2010) in their study
investigated real per capita income convergence of 22 countries of
MENA region during the period (1970-2003) with artificial neural
networks approach. According to their results, artificial neural
networks have less error in the convergence prediction and both of
absolute and conditional convergences were accepted despite being of
a lower convergence rate.
Some studies have been used (panel or time series) unit root tests
for searching convergence (stochastic convergence). Tunali and Ilanji
(2013) examined real per capita income convergence hypothesis of 19
selected countries of MENA region their study using nonlinear unit
root tests for during the time (1950-2006). According to their
outcomes, all countries except Iraq were divergent relative to the
cross-sectional average and the process of per capita income was just
catching up to the cross-sectional average was accepted for Iraq.
Similarly, Serranito (2011) in his study investigated real per capita
income of 8 MENA countries and the hypothesis of per capita income
catching up of these countries to the per capita income level of the EU

772/ Regional Economic Growth and Spatial …
during the time interval (1960-2008) using panel unit root test with
structural break. According to the results, firstly, the periods which
divergence has occurred in those are more than of those in which the
convergence happened. Secondly, from 2000 year, all countries have
been converged except Syria to the per capita income level of the EU.
Table 1: Summary of the Most Important Interior (in Persian) Studies Related
to the Topic and Methodology of the Article
Author(s),
(Year)
Statistical
population
(time reach)
Methodology Summary the most important
results
Makiyan &
Khatami
(2011)
15 selected
MENA
countries
(1980-2008)
Stochastic
convergence
and unit root
tests
Existing two convergence groups of to
the cross-sectional average based on
time series unit root time, convergence
of whole sample to the cross-sectional
average based on panel unit root tests .
Akbari and
Movayyedfar
(2004)
Provinces of
Iran (1991-
2001)
Cross-sectional
spatial
econometric
-Existing absolute convergence in per
capita income between the provinces
of Iran – 31% reduction in economic
growth gap each year – positive spatial
spillover of economic growth in the
provinces of Iran.
Kasraie,
(2007)
38 countries
member of the
Organization
of Islamic
Conference
(OIC) (1980-
2000)
Cross-sectional
spatial
Econometric
Conditional convergence speed equal
to 0.44 for each year. Lack of spatial
spillover, Necessity for establishing of
artificial poles of growth and
economic common markets in order to
the convergence of these countries.
Khalili Araqi
and Masoudi
(2007)
10 selected
MENA
countries
(1975-2002)
stochastic
convergence
and Chow test
Increasing the income gap of all
countries from the income of the Japan
as a leading country, except from
Israel, Lebanon, Oman and Malta,
Structural break of 1990 as the year of
gap change to Islamic Republic of
Iran.
There are rich empirical studies that considered spatial dimension
in growth modes. Tian et al. (2010) conducted a study applying
Solow’s growth model with technology spillover and Spatial Durbin
Model (SDM) over the period of 1991-2007 affirmed the positive
spatial dependency between different regions of China. In this study,
the absolute convergence was rejected, but in contrast, the conditional
Iran. Econ. Rev. Vol. 21, No.4, 2017 /773
convergence among the economic regions of China was accepted.
Also, they stated that by discovering the club convergence that spatial
interactions and regional economic growth have different behaviors.
In the same way, Seya et al. (2012) in their empirical work by using
Spatial Durbin Model (SDM) in the Bayesian statistics framework
investigated the per capita income convergence in the regions of Japan
in time reach of 1989-2007. The results showed that by considering
spatial dependency, Sigma (σ) convergence and per capita income
distribution reduction income have not occurred, but the occurrence of
beta convergence was confirmed during the years of 1990-2007. Also,
Ho et al. (2013) in a study using spatial econometric models in panel
data structure and stipulating fixed and dynamic weighted matrices,
have assessed the effects of economic growth spillover through
trading and neighborhood between 26 countries member of the
Organization of Economic Cooperation and Development (OECD)
during the time 1970-2005. In this study, the spillover impacts through
trading and the neighborhood were positively and significantly
estimated, and the convergence rate of economic growth were
upgraded after considering the spatial dependence.
In summing up the empirical studies, it could be said that the
majority of studies the convergence has been estimated in cross-
sectional where the level of technology has been intended the same for
all countries. Also, cross-sectional convergence models used in these
studies suffered from omitted variable bias (OVB). The contribution
of this study is to investigate the spatial convergence in the form of
dynamic panel data accompanying with country and temporal constant
effects. Also, by reviewing the empirical studies, no study has been
carried out titled with “spatial convergence and economic growth
spillover in the countries of MENA region” to date. Political
instability and unrests caused by the presence of terrorist groups in the
MENA region, energy security and geopolitics in the region require
the necessity of discussing regional convergence and deepening
relations between the countries of the Middle East and North Africa.
4. Methodology and Research Pattern
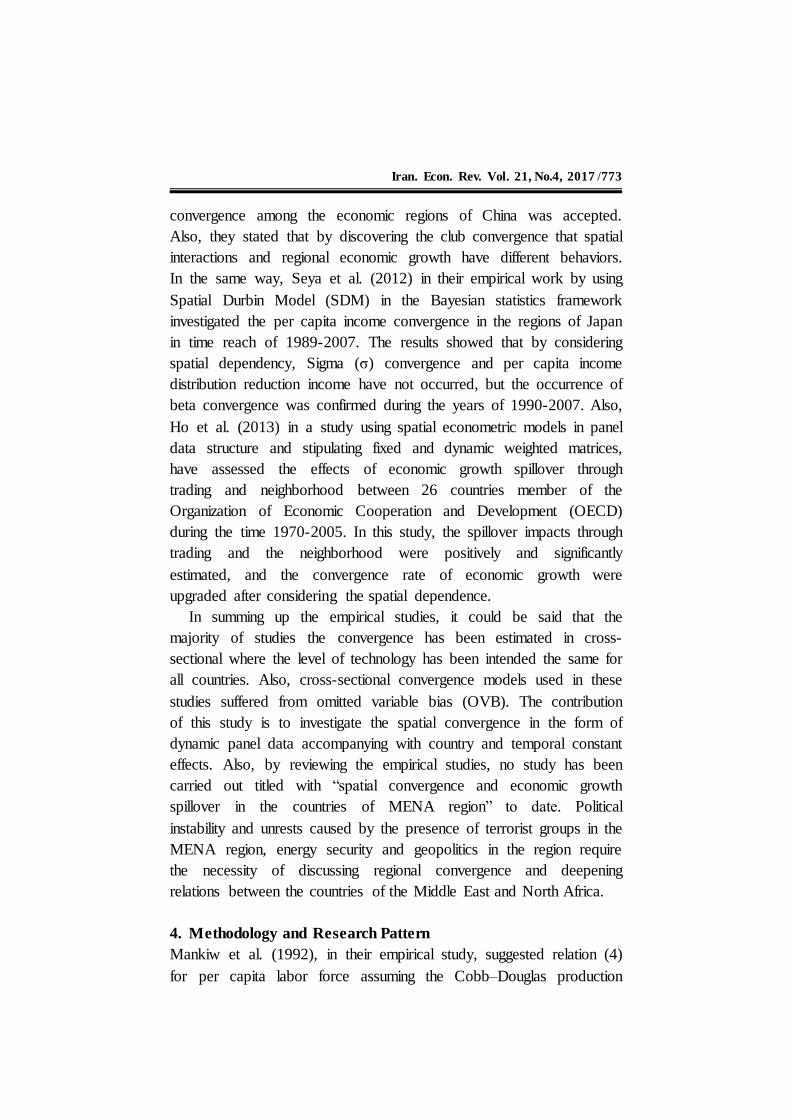
Mankiw et al. (1992), in their empirical study, suggested relation (4)
for per capita labor force assuming the Cobb–Douglas production
774/ Regional Economic Growth and Spatial …
function with exogenous growth for technical progress (A) and labor
force (L):
(3) Yt = Ktα(AtLt)1−α, 0 < 𝛼 < 1, At = A0egt, Lt = L0ent
(4) ∆ ln Yit = −(1 − eβt)ln Yi0 −
α(1−eβt)
1−αln(nit + g + δ) +
α(1−eβt)
1−αln(Sit) + (1 − eβt) ln Ai0 + gt
In which, β is the cross-sectional convergence rate and the
explanatory variables are included: growth rate of labor force (n),
exogenous technical progress rate (g), capital depreciation rate (δ),
saving rate (S) and per capita income of labor force in the beginning
of the period(Yi0). In most empirical studies concerning regional
growth, the sum of technical progress rate and depreciation rate of
constant capital is considered to be about 5% (Mankiw et al., 1992,
Islam, 1995a, 2003b., Ertur and Koch, 2007). In empirical studies of
growth econometrics, relation (4) is often fitted cross-sectional. The
principal disadvantage of cross-sectional approach is that in this
method, the technology dispersion between cross sections (or
countries) is considered the same. This leads to the omitted variable
bias. In integrated data, this problem is fixed by taking into account
cross-sectional (country) constant effects and the level of technology
between countries is variously intended and is appeared in the fixed
effects.
In the methodology of spatial econometric, depending on the
dependent variable or explanatory variables, or the error term has
spatial dependency, different spatial model are introduced. In this
study, to investigate the spatial convergence of real per capita income,
and to estimate the spatial spillover effects of economic growth
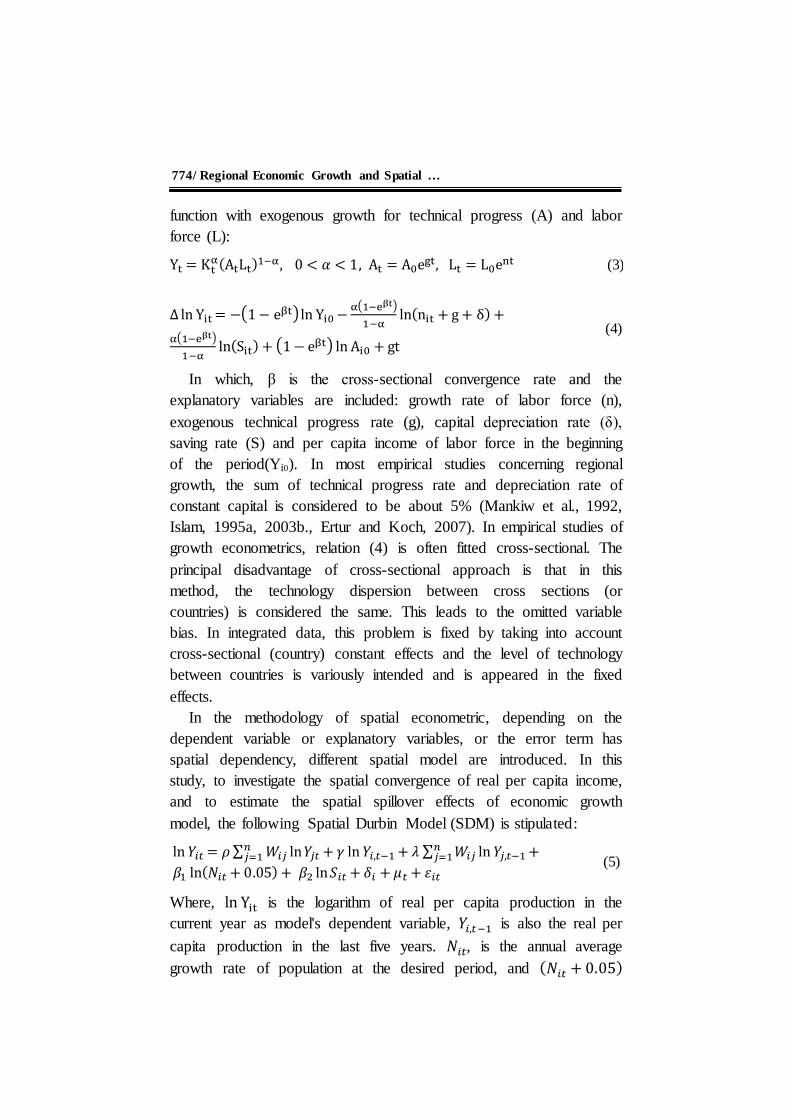
model, the following Spatial Durbin Model (SDM) is stipulated:
(5) ln 𝑌𝑖𝑡 = 𝜌 ∑ 𝑊𝑖𝑗 ln 𝑌𝑗𝑡 + 𝛾 ln 𝑌𝑖,𝑡−1 + 𝜆 ∑ 𝑊𝑖𝑗 ln 𝑌𝑗,𝑡−1
𝑛𝑗=1 +𝑛
𝑗=1
𝛽1 ln(𝑁𝑖𝑡 + 0.05) + 𝛽2 ln 𝑆𝑖𝑡 + 𝛿𝑖 + 𝜇𝑡 + 휀𝑖𝑡
Where, ln Yit is the logarithm of real per capita production in the
current year as model's dependent variable, 𝑌𝑖,𝑡−1 is also the real per
capita production in the last five years. 𝑁𝑖𝑡, is the annual average
growth rate of population at the desired period, and (𝑁𝑖𝑡 + 0.05)

Iran. Econ. Rev. Vol. 21, No.4, 2017 /775
represents the sum of average growth rate of population, exogenous
technical progress rate and capital depreciation rate. The variable that
we used in the research as the saving rate, 𝑆𝑖𝑡, is the annual share of
the investment volume in real GDP. As noted above, the relation (5) is
fitted in panel framework accompanying with temporal and cross-
sectional fixed effects, and 𝛿𝑖 represents the individual fixed effects,
and 𝜇𝑡 shows temporal constant effects. Time fixed effects, indeed,
the unobservable and immeasurable effects which are the same for all
countries, but vary during the year, and affect per capita production.
On the other hand, in most studies due to the decrease in annual
fluctuations effect over the estimation results, the entire temporal
period of the study is divided to the five-year non-overlapping sub-
periods, that for this purpose, the averages of the mentioned variables
in these five years are used (Islam, 2003., Elmi and Ranjbar, 2012.,
Cuaresma et al., 2013). It should be noted that in relation (5), γ is the
cross-country convergence rate of and the convergence speed in the
period of research is equal to 𝛽 =− ln 𝛾
𝑇 (Islam, 2003). T also expresses
the considered sub-period which is five-year in this research.
Spatial Durbin Model makes the possibility of spatial interactions
for both dependent variable (per capita production of current year) and
explanatory variable (e.g. per capita production of the beginning
period). Considering ∑ 𝑊𝑖𝑗 ln 𝑌𝑗,𝑡−1𝑛𝑗=1 term in relation (5) leads to
versatile stipulation of convergence equation, and not considering it
according to the study of Tau and Yu (2012) causes to the significant
bias in the results obtained from spatial regression. Expression
∑ 𝑊𝑖𝑗 ln 𝑌𝑗𝑡𝑛𝑗=1 is spatial auto-regression in order to fit the spillover
effects and ρ, is spatial coefficient. In fact, the spatial auto-regression
term models the spillover effects, and in the majority of empirical
studies of regional growth is called as spatial lag (delay) variable or
the Right-Hand-Side variable (RHS) which is spatially weighted
average of the dependent variable (per capita production in this
research) on the panel. As mentioned, the coefficient of spatial auto-
regression (ρ) indicates that the dependent variable in a country how
much is influenced by the dependent variable of neighboring countries
(Drukker et al., 2013). W is spatially geographical weighted matrix, in
which the countries that are adjacent and neighboring contain the most
776/ Regional Economic Growth and Spatial …
weight, and the ones which are far from each other have the lowest
weight. Components of wij in the weight matrix show how the spatial
relation of country i with country j is considered from the distance
point of view which are defined as 1
dij and
1
dij 2 . In order to determine
the distance between two units (or countries) two Euclidean and
Minkowski functions are used. In this study, the Euclidean function
has been used in order to calculate the distance between two country i
and j.
(6) dij = √(xi − xj)2
+ (yi − yj)2
In which, xi and yi , are respectively the latitude and longitude of i
country and xj and yj, indicate the latitude and longitude of j country,
respectively. In this study, firstly the spatial weighted matrix was
made based on the relationship, 1
dij , and then being the row normal. In
the row normal, each element in the row is divided to the sum of row,
so that, after normalization the summed matrix of each row is being
equal to one. However, if we define w∗ij the elements of spatial
weighted matrix after normalization, then:
(7) w∗ij =
wij
∑ wijNj=1
By multiplying this normal rowed matrix in dependent variable, the
spatial lag variable is achieved. Also, according to the relationship, 1
dij , whatever the distance dimension between two countries is getting
farther or the economic distance is becoming further, this relative
weight gets less and implies that with increasing distance the spillover
effects is reduced. On the other hand, in spatial econometrics due to
the inefficiency of conventional methods (OLS) in ignoring the spatial
heterogeneity and spatial dependency, the methods of Maximum
Likelihood Estimator (MLE) and Quasi Maximum Likelihood
Estimator (QMLE) are used. In this research owing to the lowness of
time series observations (resulting from averaging) of Quasi
Maximum Likelihood Estimator method has been used to estimate the
coefficients of spatial Durbin model (Lee and Yu, 2010).
Iran. Econ. Rev. Vol. 21, No.4, 2017 /777
4.1 Spatial Diagnostic Tests
As cited in the introduction section, according to the Tobler's first
geographical law "each location is dependent to another location, and
locations that are closer to each other, mostly affect together
compared to places farther away". Spatial correlation means that
observations on the interactions process such as technology transfer,
commercial exchanges, different social, economic, political etc.,
relations correlate together. In order to diagnose this dependency,
diagnostic tests of globally and locally spatial autocorrelation of
Moran's I, Geary's C and Getis and Ord's G were applied in studies.
The zero hypotheses in each of these spatial autocorrelation tests are
zero or spatial independency of each of the variables are under
investigation.
A. Moran's I statistic test is defined below:
(8) I =
N
∑ ∑ wijji
∑ ∑ wijji (Yi−Y̅)(Yj−Y̅)
∑ (Yi−Y̅)2i
In equation (8), N is the number of spatial units (country) which are
displayed by i and j. Y is the studied variable (real per capita GDP)
and Y̅ is the average of variable Y; and wij is the elements of the
spatial weighted matrix. Negative value of this statistic expresses the
negative spatial autocorrelation and positive value indicates positive
spatial autocorrelation.
B. Geary's C index is defined as following:
(9) C =(N−1) ∑ ∑ wijji (Yi−Yj)
2
2W ∑ (Yi−Y̅)2i
In this index, W is the sum of spatial weighted matrix
elements(wij). The statistic amount of this test is a number between 0
and 2. Value 1 means the lack of spatial autocorrelation; the values
less than one indicate spatially increasing positive autocorrelation and
the higher values show spatially increasing negative autocorrelation.
C. Based on the Getis and Ord's G index, the existence of spatial
clustering of per capita income between the per capita incomes of the
countries in the MENA region is investigated. The difference between
this indicator with two previous indicator is either in the type of
spatial weighted matrix applied in this index because in this index, the
778/ Regional Economic Growth and Spatial …
global correlation of binary spatial weighted matrix has been used, or
spatial positive diagnostic autocorrelation because this index is only
able to diagnose the spatial positive autocorrelation (Getis, 2010).
Spatial clustering comprises hot and cold spots. The order of hot spots
is the values that have exceptionally high values and the cold spots are
the ones that have an exceptionally have too low value. Getis and
Ord's G index is defined as below:
(10) G =∑ ∑ wijYiYj
nj
ni
∑ ∑ YiYjnj
ni
, ∀ j ≠ i
Although globally spatial diagnostic tests examine the existence or
lack of existence of globally spatial autocorrelation phenomenon, but
these tests cannot show which region has greater spatial integration
intensity. To this end, local statistics of mentioned spatial
autocorrelation indices are used (YU, 2012). Moran's local scatter plot
is also plotted in order to recognize the type and how the spatial
distribution of per capita income in geographical locations. If the
maximum distribution is at the first and third quarters of scattering
plot, it means that the spatial positive dependence had been
established, and the regions with high per capita income have been
surrounded by the regions with low per capita income (first quarter of
the scattering plot) and vice versa, the countries with low per capita
income have been surrounded through countries with low income
(third quarter of scattering plot). In contrast if the more of distribution
is at second and fourth quarters, representing the negativity of spatial
autocorrelation (Anselin, 1995). In the spatial negative autocorrelation,
the countries with low per capita income have been encompassed by
the ones with high per capita income (countries located at second
quarter of Moran's local scattering plot), or the countries with high per
capita income have been surrounded by countries with low per capita
income (the countries located at fourth quarter of Moran's local
scattering plot).
5. Empirical Results
5.1 Data and Descriptive Statistics
According to the studies conducted by the paper authors, there is no
single definition for MENA region. Based on the definition of League
Iran. Econ. Rev. Vol. 21, No.4, 2017 /779
of Arab States (LAS) and economic and social Commission of
Western Asia located at United Nations (UN-ESCWA), MENA region
includes 22 countries. According to the World Bank definition,
MENA region covers 21 countries which the countries of Somalia,
Sudan, Mauritania and the islands of Comoros have been excluded
this definition, but in return the countries of Iran, Israel, and Malta
have been included. In this study, in order to access to more
observations like Nugent and Pesaran (2007) and Andrew et al.
(2013), there has been an expanded definition of MENA region which
comprises 27 countries. These countries include: Oman, Tunisia,
Libya, UAE, Israel, Turkey, Egypt, Yemen, Palestine, Iran,
Mauritania, Syria, Morocco, Saudi Arabia, Bahrain, Algeria, Iraq,
Sudan, Comoros, Jordan, Eritrea, Qatar, Lebanon, Djibouti, Somalia,
Kuwait, and Malta. The country of Palestine (West Bank and Gaza)
has not been included in the estimated model because of lacking full
time series data. All statistics related to real per capita GDP to
international dollars, population and savings rate has been extracted
from Penn World Table 8.0 and 8.1 from 1970 to 2010.
Table 2 represents the results of spatial diagnostic tests. All three
tests affirm the existence of globally spatial autocorrelation of real per
capita income among the countries of MENA region1.
Table 2: Results of the Spatial Diagnostic Tests for 2012-2014 Real Per
Capita GDP Averaging
Test type Test statistics Z statistics Probability (PV)
Moran's I 0.266 3.516 ***0.000
Geary's c 0.811 -1.424 *0.077
Getis and Ord's G 0.657 2.352 ***0.009
Source: findings: ***: significance at the level of 1%. **:significance at the level of
5%. *:significance at the level of 10%. Data Source: Word Bank online database.
The amount of Moran's I statistics is positive and significant at the
level of 1%. Also, the amount of Geary's C statistics is less than one
which expresses the spatial positive autocorrelation. As mentioned, Getis
and Ord's G test was solely able to diagnose positive spatial
1. It is worth noting that globally and locally spatial autocorrelation have just been
computed for 2012-2014 averaging real per capita GDP. For the rest of the years, it
can be put at disposal in the case of requesting from the corresponding author.
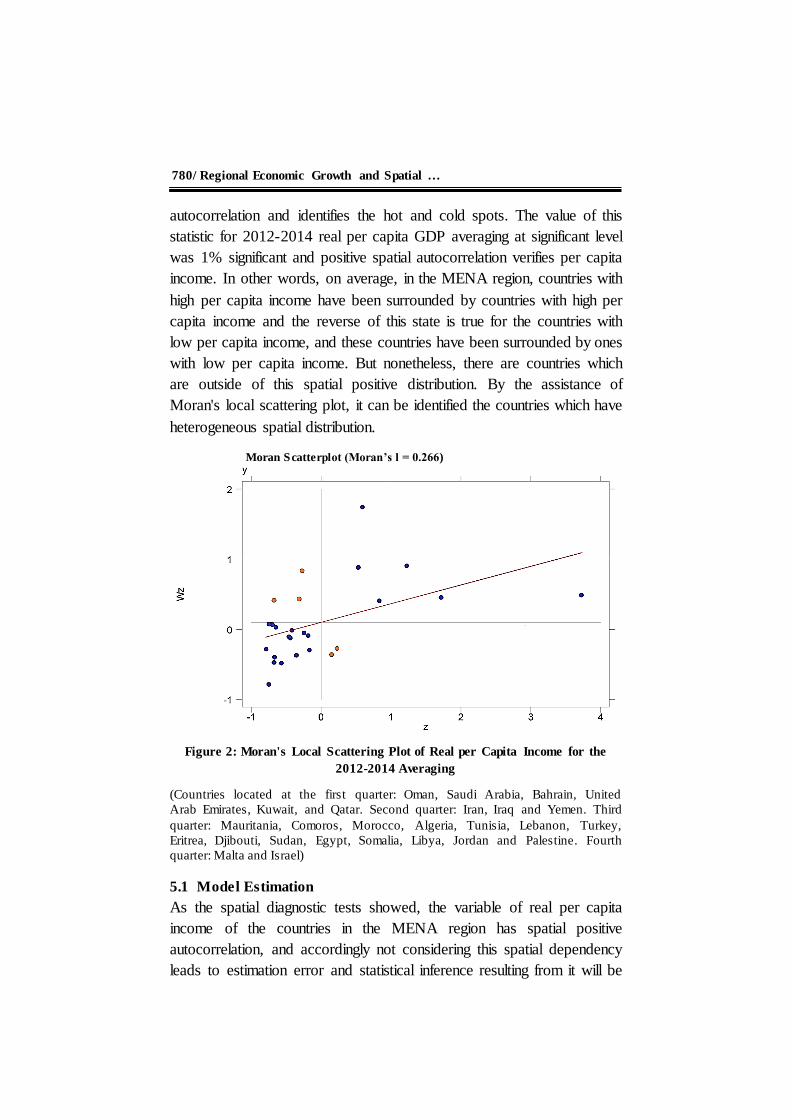
780/ Regional Economic Growth and Spatial …
autocorrelation and identifies the hot and cold spots. The value of this
statistic for 2012-2014 real per capita GDP averaging at significant level
was 1% significant and positive spatial autocorrelation verifies per capita
income. In other words, on average, in the MENA region, countries with
high per capita income have been surrounded by countries with high per
capita income and the reverse of this state is true for the countries with
low per capita income, and these countries have been surrounded by ones
with low per capita income. But nonetheless, there are countries which
are outside of this spatial positive distribution. By the assistance of
Moran's local scattering plot, it can be identified the countries which have
heterogeneous spatial distribution.
Moran Scatterplot (Moran’s l = 0.266)
Figure 2: Moran's Local Scattering Plot of Real per Capita Income for the
2012-2014 Averaging
(Countries located at the first quarter: Oman, Saudi Arabia, Bahrain, United
Arab Emirates, Kuwait, and Qatar. Second quarter: Iran, Iraq and Yemen. Third
quarter: Mauritania, Comoros, Morocco, Algeria, Tunisia, Lebanon, Turkey,
Eritrea, Djibouti, Sudan, Egypt, Somalia, Libya, Jordan and Palestine. Fourth
quarter: Malta and Israel)
5.1 Model Estimation
As the spatial diagnostic tests showed, the variable of real per capita
income of the countries in the MENA region has spatial positive
autocorrelation, and accordingly not considering this spatial dependency
leads to estimation error and statistical inference resulting from it will be
Iran. Econ. Rev. Vol. 21, No.4, 2017 /781
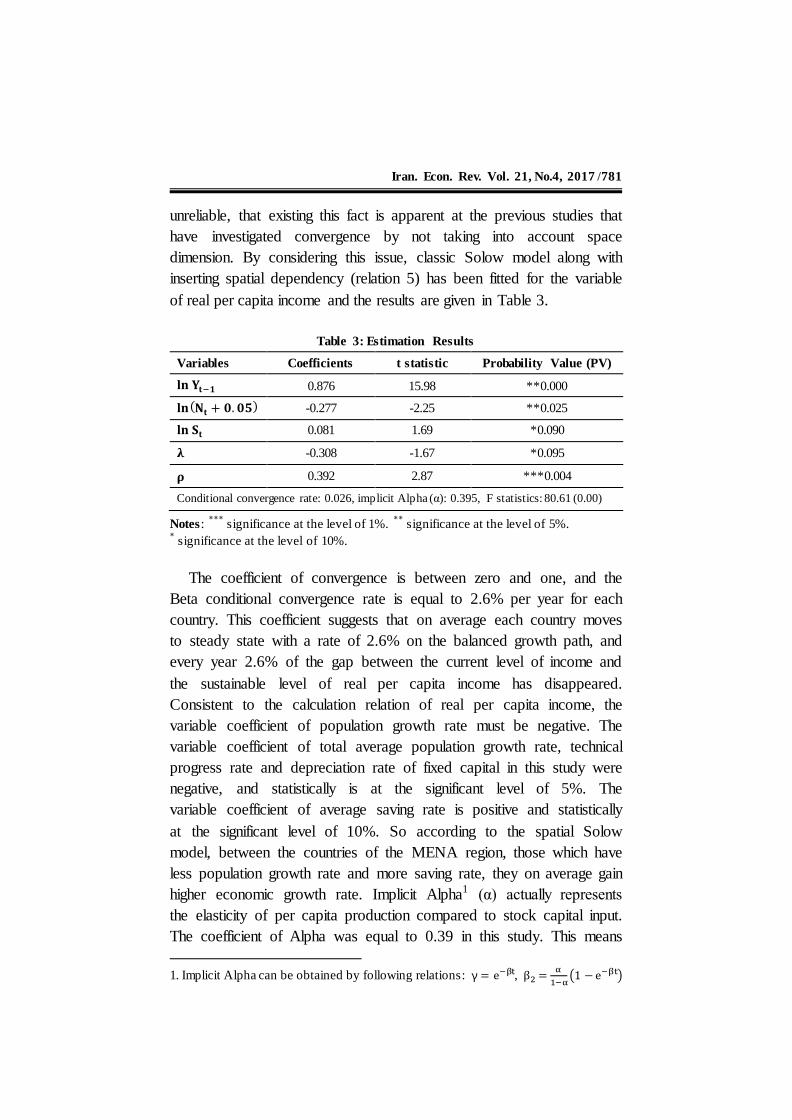
unreliable, that existing this fact is apparent at the previous studies that
have investigated convergence by not taking into account space
dimension. By considering this issue, classic Solow model along with
inserting spatial dependency (relation 5) has been fitted for the variable
of real per capita income and the results are given in Table 3.
Table 3: Estimation Results
Variables Coefficients t statistic Probability Value (PV)
𝐥𝐧 𝐘𝐭−𝟏 0.876 15.98 **0.000
𝐥𝐧(𝐍𝐭 + 𝟎. 𝟎𝟓) -0.277 -2.25 **0.025
𝐥𝐧 𝐒𝐭 0.081 1.69 *0.090
𝛌 -0.308 -1.67 *0.095
𝛒 0.392 2.87 ***0.004
Conditional convergence rate: 0.026, implicit Alpha (α): 0.395, F statistics: 80.61 (0.00)
Notes: ***
significance at the level of 1%. **
significance at the level of 5%. * significance at the level of 10%.
The coefficient of convergence is between zero and one, and the
Beta conditional convergence rate is equal to 2.6% per year for each
country. This coefficient suggests that on average each country moves
to steady state with a rate of 2.6% on the balanced growth path, and
every year 2.6% of the gap between the current level of income and
the sustainable level of real per capita income has disappeared.
Consistent to the calculation relation of real per capita income, the
variable coefficient of population growth rate must be negative. The
variable coefficient of total average population growth rate, technical
progress rate and depreciation rate of fixed capital in this study were
negative, and statistically is at the significant level of 5%. The
variable coefficient of average saving rate is positive and statistically
at the significant level of 10%. So according to the spatial Solow
model, between the countries of the MENA region, those which have
less population growth rate and more saving rate, they on average gain
higher economic growth rate. Implicit Alpha1 (α) actually represents
the elasticity of per capita production compared to stock capital input.
The coefficient of Alpha was equal to 0.39 in this study. This means
1. Implicit Alpha can be obtained by following relations: γ = e−βt, β2 =
α
1−α(1 − e−βt)
782/ Regional Economic Growth and Spatial …
that, by assuming constant of other inputs, if the inventory of physical
capital increases one percent between the countries in the MENA
region, on average it contributes an increasing of real per capita
production to the size of 0.39%.
As pointed out in the methodology of research, Spatial Durbin Model
(SDM) gives the feasibility of spatial interactions either to the dependent
variable of per capita income or to the variable control of current per
capita income at the beginning of each sub-period. The spatial coefficient
of per capita income variable was negative at the beginning of each sub-
period () and at a significant level of 10%. Also, the coefficient of
spatial autocorrelation (ρ) is positive and statistically significant at the
level of 1%. This coefficient expresses the point that if the logarithmic
weighted the average of per capita production regarding the adjacent
countries of a country in the MENA region increases one percent, on
average the logarithmic per capita income of that country rises to the size
0.39%, in which the spillover from the economic growth of adjacent and
neighboring countries has the greatest amount and the density of these
spillover effects decreases on the distance. According to the obtained
results, the hypothesis of regional spillovers was right for the countries of
Middle East and North Africa, and an automatic cycle of positive
economic growth has been established in these countries. Furthermore,
Iran accompanying Yemen and Iraq have a less per real capita income
and have been surrounded by countries with high per capita income.
However, the most optimal growth policy for these countries is
commercial and economic collaboration through the creation of artificial
growth poles with their adjacent countries, because the commercial costs
have an inverse relationship with distance (Crozet & Koenig, 2004).
Hence, according to Getis and Ord's G (1992) test, the effect of real per
capita income shocks (e.g. war, political instability, etc.) decreases with
distance and influences mostly the adjacent countries.
6. Conclusions and Policy Suggestions
with consideration of spillover effects and spatial dependence, the
convergence in different regions of the world is related together, so that
in this case the growth rate (convergence speed) of a region is no longer
just depended on the initial level of income (production) of that region
and will be also dependent on the initial level of income of its

Iran. Econ. Rev. Vol. 21, No.4, 2017 /783
neighboring regions. Furthermore, the steady state of a region will
depend either on the structural parameters of its own region or on the
structural parameters of its neighboring regions. And as noted, this
relationship is achieved by spatial weighted matrix (Pfaffermayr,
2009:65). In this paper, the spatial Solow model was estimated for 26
countries in the MENA region during the period of 1970-2010. Spatial
diagnostic tests indicated that the existence of positive spatial
autocorrelation of real per capita income in the countries of MENA
region and it is required to carry out the modeling of real per capita
income of these countries at the presence of distance and space
dimension. The study is different to other studies in two important
aspects; first, the test of regional convergence hypothesis for the MENA
countries in under the spatial spillover effects of economic growth, and
second, avoiding omitted variable bias with the estimation of Solow
model in the framework of spatial dynamic panel data considering the
country and time fixed effects. The positive and significant value of
spatial autocorrelation coefficient implies that part of the economic
growth (0.39%) of each of the investigated countries had been through
the distance effect (adjacency) and regional spatial spillover. The most
important policy suggestion of this research for MENA countries is
strengthening the automotive positive cycle of economic growth by the
detailed and more efficient collaboration of economic and social
infrastructures. In addition, according to the status of a country in the
MENA region affecting by its adjacent countries, establishing regional
stable security requires the cooperation of all MENA countries in the
form of legal binding treaties.
References
Abramovitz, M. (1986). Catching Up, Forging Ahead and Falling
Behind. The Journal of Economic History, 46(2), 385-406.
Akbari, N. (2005). The Concept of Space and How to Measure It in
Regional Studies. Journal of Economic Research, 7(23), 39-68.
Akbari, N., & Farahmand, Sh. (2005). Economic Convergence of
Islamic Countries and Investigation of Regional Spillovers
Emphasizing on the Role of Selective Countries of Persian Gulf
Region: A Study Based on Spatial Econometrics. Iranian Journal of
Trade Studies Quarterly, 9(34), 1-32.

784/ Regional Economic Growth and Spatial …
Akbari, N., & Movayyedfar, R. (2004). Convergence Investigation of
Per Capita Income between Country's Provinces (A Spatial
Econometrics Approach). The Economic Research, 13, 1-13.
Andreano, M. S., Laureti, L., & Postiglione, P. (2013). Economic
Growth in MENA Countries: Is there Convergence of Per Capita
GDPs? Journal of Policy Modeling, 35, 669-683.
Anselin, L. (1988). Spatial Econometrics: Methods and Models
(Studies in Operational Regional Science). Netherlands: Springer.
---------- (1995). Local Indicators of Spatial Association-LISA.
Geographical Analysis, 27(2), 93-116.
Barro, R. J., & Sala-i-Martin, X. (1995). Economic Growth. New York:
McGraw-Hill.
Crozet, M., & Koenig, P. (2004). EU Enlargement and the Internal
Geography of Countries. Journal of Comparative Economics, 32 (2),
265-279.
Cuaresma, J. C, Havettová, M., & Lábaj, M. (2013). Income
Convergence Prospects in Europe: Assessing the Role of Human
Capital Dynamics. Economic Systems, 37(4), 493-507.
Devarajan, Sh., & Mottaghi, L. (2015). MENA Economic Monitor:
Towards a New Social Contract. Retrieved from:
http://documents.worldbank.org.
---------- (2014). Growth Slowdown Heightens the Need for Reforms.
Retrieved from http://documents.worldbank.org.
Drukker, D. M., Prucha, I. R., & Raciborski, R. (2013). Maximum-
Likelihood and Generalized Spatial Two-Stage Least-Squares
Estimators for A Spatial-Autoregressive Model with Spatial-
Autoregressive Disturbances. The Stata Journal, (13)2, 221-241.
Elahi, N., & Nahavandian, M. (2004). Globalization Effect on Per
Capita Income Convergence of Islamic Countries of MENA Region.
Mofid Nameh Journal, 10 (45), 81-110.
Elmi, Z., & Ranjbar, O. (2012). Trading Effects on the Growth of
Countries Member of Islamic Conference Organization Emphasizing
on Iran. Journal of Economic Research, 47(4), 97-115.

Iran. Econ. Rev. Vol. 21, No.4, 2017 /785
Ertur, C., & Koch, W. (2011). A Contribution to the Theory and
Empirics of Schumpeterian Growth with Worldwide Interactions.
Journal of Economic Growth, 16, 215-255.
---------- (2007). Growth, Technological Interdependence and Spatial
Externalities: Theory and Evidence. Journal of Applied Econometrics,
22, 1033-1062.
Feenstra, R. C., Inklaar, R., & Timmer, M. P. (2015). The Next
Generation of the Penn World Table. American Economic Review,
105(10), 3150-3182.
Geary, R. C. (1954). The Contiguity Ratio and Statistical Mapping.
The Incorporated Statistician, 5, 115-145.
Getis A. (2010). Spatial Filtering in a Regression Framework:
Examples Using Data on Urban Crime, Regional Inequality, and
Government Expenditures. In L. Anselin, & S. Rey (Eds.).
Perspectives on Spatial Data Analysis, Advances in Spatial Science
(The Regional Science Series). Berlin, Heidelberg: Springer.
Getis, A., & Ord, J. (1992). The Analysis of Spatial Association by
Use of Distance Statistics. Geographical Analysis, 24, 189-206.
Gorji, E., & Madani, Sh. (2009). Dynamic Macroeconomics (Growth
Theories) (1st Ed.) Tehran: SAMT.
Griffith, A. D., & Paelinck, H. P. J. (2011). Non-Standard Spatial-
Statistics and Spatial Econometrics. Heidelberg-Dordrecht: Springer.
Guetat, I., & Serranito, F. (2007). Income Convergence within the
MENA Countries: A Panel Unit Root Approach. The Quarterly
Review of Economics and Finance, 46, 685-706.
Hamidi Razi, D., & Feshari, M. (2015). The Investigation of Per
Capita CO2 Dynamics in OPEC Countries (β and σ Convergence
Approach). Journal of Environmental Science and Technology, 19(4),
87-99.
Ho, C. Y., Wang, W., & Yu, J. (2013). Growth Spillover through
Trade: A Spatial Dynamic Panel Data Approach. Economics Letters,
120(3), 450-453.
786/ Regional Economic Growth and Spatial …
Islam, N. (2003). What Have We Learnt from The Convergence
Debate? Journal of Economic Surveys, 17(3), 309-362.
----------- (1995). Growth Empirics: A Panel Data Approach.
Quarterly Journal of Economics, 110, 1127-1170.
Kasrayi, E. (2007). Convergence Theory, Spatial Dependency and
Regional Growth (Evidences from Countries Member of Islamic
Conference Organization to Apply). Journal of Economic Research,
77, 27-64.
Keller, W. (2002). Geographic Localization of International
Technology Diffusion. American Economic Review, 92, 120-142.
Khalili Araghi, S. M., & Masoudi, N. (2007). Investigating the Path of
Income GAP for MENA Countries to Japan with Respect to for the
Convergence Theory for the Period of 1972 - 2002. Journal of
Economic Research, 79, 77-89.
Lee, L. F., & Yu, J. (2010). Estimation of Spatial Autoregressive
Panel Data Models with Fixed Effects. Journal of Econometrics, 154,
165-185.
Makiyan, S. N., & Khatami, S. (2011). An Analysis of Economic
Integration among MENA Countries (1980-2008). The Economic
Research, 11(3), 135-157.
Mankiw, G., Romer, D., & Weil, D. (1992). A Contribution to the
Empirics of Economic Growth. Quarterly Journal of Economics, 107,
407-437.
Najafi Alamdarloo, H., Mortazavi, S. A., & Shemshadi Yazdi, K.
(2013). Application of Spatial Econometrics in Agricultural Exports in
ECO Members: Panel Data Approach. The Economic Research, 13(3),
49-62.
Najjarzadeh, R., & Shaghaghi Shahri, R. (2006). Regional
Convergence and Its Impact on Indirect Extrinsic Investment (Case
Study: MENA Member Islamic Countries). Journal of Economic
Research, 41(1), 337-362.
Nugent, J. B., & Pesaran, M. H. (2007). Introduction: Explaining
Growth in the Middle East, in Explaining Growth in the Middle East.
In J. B. Nugent, & M. H. Pesaran (Eds.), Contributions to Economic
Analysis (1-27). Amsterdam: Elsevier.
Iran. Econ. Rev. Vol. 21, No.4, 2017 /787
Pfaffermayr, M. (2009). Conditional β and σ-convergence in Space: A
Maximum Likelihood Approach. Regional Science and Urban
Economics, 39, 63-78.
Rahmani, T., & Hasanzadeh, E. (2011). Migration, Economic Growth
and Regional in Iran. Journal of Economic Modelling Research, 2(5),
1-19.
Ranjbar, O., & Elmi, Z. (2011). Which Countries' Income Gap is
about Decrease? New Evidences from Panel Unit Root Tests with
Multiple Endogenous Structural Breaks. Journal of Economic
Research, 46(2), 31-57.
Romer, D. (1985). Advanced Macroeconomics. New York: McGraw-Hill.
Sameti, M., & Farahmand, Sh. (2010). Inquiry into Income
Convergence in MENA Countries: A Neural Network Approach,
Topics in Middle Eastern and North African Economies. Retrieved
from http://www.luc.edu/orgs/meea.
Serranito, F. (2013). Heterogeneous Technology and the
Technological Catching-Up Hypothesis: Theory and Assessment in
the Case of MENA Countries. Economic Modelling, 30, 685-697.
Seya, H., Tsutsumi, M., & Yamagata, Y. (2012). Income Convergence
in Japan: A Bayesian Spatial Durbin Model Approach. Economic
Modeling, 29, 60-71.
Tao, J. & Yu, J. (2012). The Spatial Time Lag in Panel Data Models.
Economics Letters, 117, 544-547.
Tian, L., Wang, H. H., & Chen, Y. (2010). Spatial Externalities in China
Regional Economic Growth. China Economic Review, 21, S20- S31.
Tobler, W. (1970). A Computer Movie Simulating Urban Growth in
the Detroit Region. Economic Geography, 46(2), 234-240.
Tunali, Ç. B., & Yilanci, V. (2010). Are Per Capita Incomes of MENA
Countries Converging or Diverging? Physica A, 389, 4855-4862.
Yu, H. (2012). The Influential Factors of China’s Regional Energy
Intensity and Its Spatial Linkages: 1988–2007. Energy Policy, 45,
583-593.