Regional Disparities in Ghana: Policy ... - Africa Portal
64
IFPRI Discussion Paper No. 00693 March 2007 Regional Disparities in Ghana: Policy Options and Public Investment Implications Ramatu M. Al-Hassan, University of Ghana Xinshen Diao, International Food Policy Research Institute Development Strategy and Governance Division
Transcript of Regional Disparities in Ghana: Policy ... - Africa Portal

IFPRI Discussion Paper No. 00693 March 2007
Regional Disparities in Ghana:
Policy Options and Public Investment Implications
Ramatu M. Al-Hassan, University of Ghana Xinshen Diao, International Food Policy Research Institute
Development Strategy and Governance Division

INTERNATIONAL FOOD POLICY RESEARCH INSTITUTE.
The International Food Policy Research Institute (IFPRI) was established in 1975. IFPRI is one of 15 agricultural research centers that receive principal funding from governments, private foundations, and international and regional organizations, most of which are members of the Consultative Group on International Agricultural Research. Financial Contributors and Partners IFPRI’s research, capacity strengthening, and communications work is made possible by its financial contributors and partners. IFPRI gratefully acknowledges the generous unrestricted funding from Australia, Canada, China, Denmark, Finland, France, Germany, India, Ireland, Italy, Japan, Netherlands, Norway, Philippines, Sweden, Switzerland, United Kingdom, United States, and World Bank.

IFPRI Discussion Paper No. 00693 March 2007
Regional Disparities in Ghana:
Policy Options and Public Investment Implications
Ramatu M. Al-Hassan, University of Ghana
Xinshen Diao, International Food Policy Research Institute
Development Strategy and Governance Division

PUBLISHED BY
INTERNATIONAL FOOD POLICY RESEARCH INSTITUTE 2033 K Street, NW Washington, DC 20006-1002 USA Tel.: +1-202-862-5600 Fax: +1-202-467-4439 Email: [email protected]
www.ifpri.org
Notices: 1 Effective January 2007, the Discussion Paper series within each division and the Director General’s Office of IFPRI were merged into one IFPRI-wide Discussion Paper series. The new series begins with number 689, reflecting the prior publication of 688 discussion papers within the dispersed series. The earlier series are available on IFPRI’s website at www.ifpri.org/pubs/otherpubs.htm#dp. 2 IFPRI Discussion Papers contain preliminary material and research results. They have not been subject to formal external reviews managed by IFPRI’s Publications Review Committee, but have been reviewed by at least one internal and/or external reviewer. They are circulated in order to stimulate discussion and critical comment.
Copyright © 2007 International Food Policy Research Institute. All rights reserved. Sections of this material may be reproduced for personal and not-for-profit use without the express written permission of but with acknowledgment to IFPRI. To reproduce the material contained herein for profit or commercial use requires express written permission. To obtain permission, contact the Communications Division at [email protected].

iii
CONTENTS
Acknowledgements....................................................................................................................................... v
Abstract ..................................................................................................................................................vi
I. Introduction ............................................................................................................................... 1
II. Identifying the route to growth with reduced inequality ........................................................... 6
III. Methods and Data...................................................................................................................... 7
IV. Simulations.............................................................................................................................. 10
V. Summary and Conclusions...................................................................................................... 19
TABLES
Table 1. Poverty changes by region, model results from business-as-usual growth ............................. 11
Table 2. Poverty rate in northern Ghana from different sector growth (2015)...................................... 12
Table 3. Poverty rate for the poorest three regions: Staple-led growth vs. export-led growth scenarios................................................................................................................................................. 13
Table 4. Effects of growth in productivity of staples on absolute poverty incidence by 2015.............. 15
Table 5. Supply and demand for cowpeas in selected countries of West and Central Africa (1990 – 1999)........................................................................................................................................ 17

iv
FIGURES
Figure 1. Mean annual rainfall, Burkina Faso .......................................................................................... 2
Figure 2. Poverty Incidences by Administrative Region .......................................................................... 4
Figure 3. Poverty reductions in agriculture-led and nonagriculture-led growth scenarios ..................... 12
Figure 4. Poverty reductions in staple-led and agricultural export-led growth scenarios....................... 14
Figure 5. Poverty reduction in Northern Region under different scenarios............................................ 15
Figure 6. Poverty reduction in Upper East Region under different scenarios ........................................ 16
Figure 7. Poverty reduction in Upper West Region under different scenarios ....................................... 16

v
ACKNOWLEDGMENTS
This study was undertaken under IFPRI’s Ghana Strategy Support Program (GSSP) with financial
support of the United States Agency for International Development (USAID). The authors acknowledge
the research assistance provided by Marc Rockmore. The authors also thank participants at the
International Conference on Poverty Reduction held in Beijing on 23-24 May, 2006 and the workshop
held in Accra on 19-20 November, 2006 for their comments and suggestions. They also thank
Shashidhara Kolavalli, Shenggen Fan and the reviewer of the paper for their valuable suggestions.
vi
ABSTRACT
The development pattern in Ghana is characterised by a north-south divide in which the north
lags far behind the south. Ghana has achieved sustained growth and poverty reduction during the 1990s,
but such growth did not benefit the three poor northern regions and the development gap has increased
between the south and north. One of the most important reasons is that much of the growth has been
generated by export agriculture in which northern Ghana has little contribution if any.
This paper sets out to identify avenues for pro-poor growth in Ghana, focussing on agricultural
opportunities, particularly in northern Ghana. Using an economywide, multimarket model and based on
time series production data between 1991 and 2000 and Ghana Living Standards Survey data of 1991/92
and 1998/99, this paper analyzes the possible poverty reduction trends up to 2015 by assuming different
patterns of growth. The results show that agriculture-led growth has a larger poverty reducing effect than
nonagriculture-led growth. Within agriculture, growth in staple crop production reduces poverty more
than export crops. In northern Ghana, the staple crops whose growth exerts the largest effect on poverty
reduction are groundnut, cassava and cowpea. However, despite the large effects of the agriculture-led
growth, the projections of poverty rates in the regions, particularly Upper East are still high implying a
need for complementary avenues for poverty reduction. A review of the literature shows that while the
north generally is a net migration area, the rewards of migration have been limited because people who
migrate have no skills and are, therefore, limited to entering the informal job market where wages are
low. The implication is to enhance this labour with education and skills. Ultimately, the regions must
attract production investment to boost economic activity and generate local growth. The state must play a
leading role in investing in productive and social infrastructure as a way of facilitating the environment
for private sector operators.
Key Words: Ghana, Regional inequality, Poverty reduction, Agricultural growth, Economywide modeling
1
1. Introduction
Despite rapid economic growths for the last decade, northern Ghana continues to lag behind the
rest of the country in most development indicators (GSS, 2000); this is a source of concern in terms of
inequality in the country and its moral implications, as well as a challenge for achieving significant
poverty reduction in the country. The regional inequality deserves special attention as Ghana pursues the
attainment of the Millennium Development Goals (MDGs), particularly those on reducing poverty and
hunger. The attainment of the MDGs is consistent with the country’s developmental goal of raising per
capita income of Ghanaians to US$1,000 by 2015 (Republic of Ghana, 2005). The relevance of broad
based growth, complemented with appropriate social spending in poverty reduction, is the most obvious
and some researchers have already called for different policies which focus on excluded regions and
groups (Aryeetey and McKay, 2000).
Reasons often put forward to explain the poverty and underdevelopment of northern Ghana
compared to southern Ghana have included history, unfavourable climate and agricultural production
conditions, and post independence political neglect (ODI and CEPA, 2005). The historical underpinnings
of the north-south divide lies in the colonial policy which made northern Ghana subordinate to the south
in terms of economics and politics by actively promoting labour migration, and preventing investment.
The colonial government also “adopted a ‘protective’ attitude towards the population, which kept
northerners apart from the development which colonisation brought elsewhere [in the country]”
(Shepherd and Gyimah-Boadi, 2004, p.2).
The import substitution policies of the immediate post-independence period (1957-1966) and the
military regime of National Redemption Council (1972- 1979) made positive impacts on northern
Ghana’s development through capital investments, development of education, infrastructure, agricultural
production and processing. The latter regime is credited with the expansion of the cotton and rice
industry subsidies. However, these efforts did not transform the north largely because the import-
substitution policies and the supporting subsidy policies were themselves not sustainable. Also, a shift in
targeting from smallholders to large scale elite farmers in the rice and cotton interventions created
inequalities within the region.
From the late 1980s through the 1990s, extension of the electricity grid to the north, the
establishment of the University for Development Studies (with campuses spread throughout the three
northern regions), rehabilitation and development of physical and social infrastructure, and considerable
project aid from official donor agencies and international NGOs have been implemented. However, the
impacts of these efforts are limited because there has not been a concerted strategy and policy to create
regional balance in Ghana’s development (Shepherd et al, 2004).

2
Although agriculture is the main component of livelihood strategies, conditions for agricultural
production in many parts of northern Ghana are not the best, particularly when compared to the south.
Rainfall levels are lower (Figure 1), soils are poor in organic matter, and runoffs are high because of
concentration of rains in short periods (torrential rains). As Chamberlin puts it, ‘While there is variation
occasioned by both natural factors such as soil and topography, as well as human factors, such as land use
practices, the general trend is a south–to-north agro-climatic gradient corresponding with increasingly
arid environments offering fewer production potentials’ (Chamberlin, 2005, p.5).
Figure 1. Mean annual rainfall, Burkina Faso
Source: Centre for Geographic Information Systems, University of Ghana, Legon

3
Since neither history nor the natural climatic endowment can be changed, what is important today
is to identify the geographical capital of northern Ghana, and how this capital can be engineered for
growth. Agriculture is the mainstay of the Ghanaian economy and this is more so for northern Ghana
where over 70% of the population is in agriculture compared to a national average of 56%. The sector
therefore holds the key to poverty reduction in the region. The main source of growth and poverty
reduction in Ghana during the 1990s was expanded trade. However northern Ghana did not benefit from
this growth and poverty reduction because of the low representation of the region’s production in
international trade.
The living standards surveys of the 1990s showed significant decline in poverty at the national
level from a poverty incidence of 52% in 1992 to 40% in 1999 (GSS, 2000). The indicators of depth and
severity of poverty both declined by 25%. Disaggregation of the data by administrative region and agro-
ecological locality, however, reveals wide discrepancies between regions in poverty levels and the
progress made in poverty reduction during this period. In the three administrative regions of northern
Ghana (Upper East, Northern and Upper West regions), the head count poverty index either increased or
changed marginally. Moreover, poverty is generally high in the three northern regions. 90% of the
population in the Upper East region was poor, followed by the Upper West region with 84%, and the
Northern region with almost 70% incidence of poverty (GSS, 2000).
The present distribution of poverty in Ghana also portrays extreme inequality between the north
and south (Figure 2). For example, the 1999 survey shows that while the three northern regions together
had a population share of about 18%, they account for 43.5% of the total poor, and 59.2% to the severity
of the poverty index (GSS, 2000).

4
Figure 2: Poverty Incidences by Administrative Region
Another aspect of the unequal poverty distribution is the concentration of the poor in agriculture,
particularly food crop farming. With a population share of 39% in 1999, food crop farmers had a poverty
incidence of 59%; the average income of the poor in this group was 40% below the poverty line; and the
group contributed 58% and 67% to poverty incidence and poverty gap indices, respectively (Aryeetey and
McKay, 2000).
There is no question about the role of expanded markets in generating growth. Between 1985 and
2005, exports contributed 40% to the increase in Ghana’s GDP. The export growth was mainly through

5
traditional sources such as cocoa and gold, which means that regions that do not produce these
commodities would be unlikely to participate in the growth. Consequently, northern Ghana has benefited
much less from trade expansion (ODI and CEPA, 2005). What is not clear is whether the same path of
export-led growth can be pursued for the north, or whether a focus on sub-regional markets and internal
trade in staple crops can be equally beneficial.
This paper explores the effectiveness of expanding production for domestic and sub-regional
trade on the growth in northern Ghana. Expanded traditional staple production will also lead to the
achievement of food security faster, by improving the local availability of the food, in a region where
poor transport infrastructure makes dependence on external (outside the region) sources rather risky. The
specific objectives of this paper are to identify the crops with highest potential to contribute to household
income, and to estimate the effects of growth in these crops on paths of poverty reduction. This
exposition is most relevant because of the dominance of export-led growth in national development
policies. Much of the policy attention in agriculture is on cocoa and horticultural exports.
The poor in poor regions did not benefit from growth of the rest of the country. The common
denominator in slow growth and slow progress in poverty reduction has been agriculture, and particularly
food crop farming in the Guinea Savannah zone, which encompasses the Northern, Upper East, and
Upper West regions (Aryeetey and McKay, 2004). Food crop farming did not perform well from
structural adjustment policies, which focused more on raising incentives for export crops (exchange rate
liberalization, increased producer prices for cocoa and export incentives such as duty drawback, and
foreign exchange retention). On the contrary, food crop and livestock sub-sectors bore a disproportionate
share of the burden of removal of agricultural input subsidies. At the same time trade liberalization
opened the floodgates for cheap food imports, examples being rice and poultry products.
The high incidence of poverty in northern Ghana is therefore attributed to exclusion from trade
(Aryeetey and Mckay, 2004; ODI and CEPA, 2005) and the slow down of growth in the staple crop sub-
sector.

6
2. Identifying the Route to Growth with Reduced Inequality
Growth decomposition only partially captures the roles of agriculture in the overall economic
growth by directly looking at the share of agricultural growth in total increase in GDP. Agriculture and
non-agriculture are highly linked in the economy not only through the production process, e.g.
agricultural goods are intermediate inputs in non-agriculture and vice versa, but also through income that
is allocated to consumption and investment (Johnson and Mellor, 1961). For example, increased farmer
incomes will be spent on both agricultural and non-agricultural consumption goods, similar to increased
urban income. The linkage effects from agriculture to non-agriculture and from rural to urban also work
through price effects. Increases in agricultural productivities generally reduce food prices with increased
supply, which benefits urban consumers and rural people who are net buyers of food (Vogel, 1994).
Similarly, increases in non-agricultural productivities, especially in agricultural input production,
marketing services and other services, benefit farmers by lowering input prices and costs (Hazell and
Roell, 1983).
The role of agriculture in poverty reduction differs for different countries, different agricultural
structures, and at different stages of development. In general, at the early stages of development, the role
of agriculture is more important not only because agriculture accounts for the biggest share of economic
activities, but also the linkages effects from agricultural growth to non-agricultural growth and from rural
to urban are much stronger (Haggblade et al., 1989). Linkages effects are especially strong in an
economy where agricultural growth comes from a broad-base and domestic markets play a critical role in
such linkage effect. If a country’s agricultural growth is driven by the exportable sector, the linkage
effect in the economy would be relatively weak, because of leakage to the rest of the world (Diao et al.,
2006).
Even though growth generally benefits the poor by raising a country’s per capita income, broad-
based growth has a much stronger pro-poor effect due to its participation by a majority of the population,
which can reach the poor from both income and consumption sides.

7
3. Methods and Data
The analysis for identifying pro-poor channels of growth in Ghana is based on an economywide,
multi market (EMM) model developed for Ghana. The EMM model captures the detailed structure of
Ghana’s agricultural sectors together with thirteen nonagricultural subsectors. Specifically, there are
thirty-three agricultural commodities or commodity groups. Both agricultural and nonagricultural
production and consumption are further disaggregated into regions in order to capture the geographic
heterogeneity of sectors and households. The disaggregation is based on the ten administrative regions,
which are further disaggregated into rural and urban areas in the model. All supply and demand functions
thus are defined at the regional level for the rural and urban areas. Most data about agricultural
production at the regional level is from MoFA (2005) and GSS (2005), while the nonagricultural data is
from IMF (2005) and GSS (2005).
The EMM model is based on neoclassical microeconomic theory. In the model, an aggregate
producer represents a specific region’s production in either rural or urban location for a specific subsector.
There are 460 (forty-six agricultural and nonagricultural subsectors times ten regions) aggregate
producers in total. Consistent with the setup of many other multi-market models, the supply function,
instead of production function, is used to capture each representative producer’s response to market.
Specifically, the supply functions are derived under producer profit-maximization and based on the
producer prices of all commodities (including the prices for the nonagricultural commodities). Risk
factor and market imperfection are not taken into account and therefore do not affect producers’ profit-
maximization decision.
In the crop subsectors, the supply functions have two components: (1) yield functions that are
used to capture supply response to own prices given farm area allocated to this crop; and (2) land
allocations that are functions of all prices and hence are responsive to changing profitability across
different crops given the total available land within a region. The own-price elasticities employed in the
yield functions are the combination of authors’ best estimates and results drawn from other studies, while
the cross price elasticities in the area functions are calibrated according to the share of each commodity in
regional total production (see Appendix for the discussion about the supply elasticities in detail).
The demand function in the EMM model is also disaggregated to the region by rural and urban
households and defined at the individual level. A representative consumer’s demand for each of these
forty-six goods is derived from maximizing a Stone-Geary utility function, and the subsistence level of
consumption is calibrated to the households’ home consumption by rural and urban locations within each
region. Data used to calibrate the demand function are from 1998/99 GLSS IV (GSS, 2004), which is the
latest and most comprehensive household survey in Ghana. Income elasticity in the demand function is

8
estimated using a semi-log inverse function (RSLI) suggested by King and Byerlee (1978). Once we
know the income elasticity and subsistent consumption parameter, price elasticities in demand functions
(including own and cross price ones) can be derived by imposing homogeneity condition on the LES
function (see Appendix for the discussion of the estimation and calculation of the demand elasticities in
detail). Estimated income and induced price elasticities for any specific commodity vary across regions
and between rural and urban locations due to different consumption patterns and income levels. Such
differences not only imply that the aggregate effect of consumers’ market responses is often non-linear
and much more complicated than that in the case where demand is defined at the national level, but also
indicate the possible differential effect on poverty reduction with similar income increases.
Unlike most multimarket models that are usually partial equilibrium, the per capita income for
either rural or urban households within a region is an endogenous variable in the EMM model and is
determined by the regional production revenue. Because of this setup, the model has a general
equilibrium nature, which allows production and consumption decisions linked at the regional level by
rural and urban locations. Since intermediate inputs and their prices are not explicitly modelled, producer
prices are adjusted to represent value added, and therefore the aggregation of agricultural production at
the value added prices equals agricultural GDP (henceforth, AgGDP). For the nonagricultural sectors, the
sector level value-added is used to represent production output with unit price. Thus, national GDP (as
well as regional level GDP) comprises AgGDP and nonagricultural GDP, both of which are endogenous
in the model.
As the name of the model suggests, a multiple market structure is specified. There is perfect
substitution between domestically and internationally produced commodities. However, transportation
and other market costs distinguish trade in the domestic market from imports and exports. For example,
while imported maize is assumed to be perfectly substitutable with domestically produced maize in
consumers’ demand functions, maize may still not be profitable to import if its domestic price is lower
than the import parity price plus transactions costs. Maize imports can only occur when domestic demand
for maize grows faster than domestic supply and the local market price rises significantly. A similar
situation applies to exported commodities. Even though certain horticultural products are exportable, if
domestic production is not competitive in international markets, either due to low productivity or high
transactions costs, then exports will not be profitable. Only when domestic producer prices plus market
costs are lower than the export parity price of the same product does it become profitable to export.
The base year’s import and export data by commodity are from MoFA (2005) and FAO (2005),
and there are eight agricultural commodities that are in deficits in the base year and hence with positive
import value. There are also thirteen export agricultural commodities of which domestic prices are fully
linked with international ones. Besides these twenty-one agricultural commodities, twelve other
9
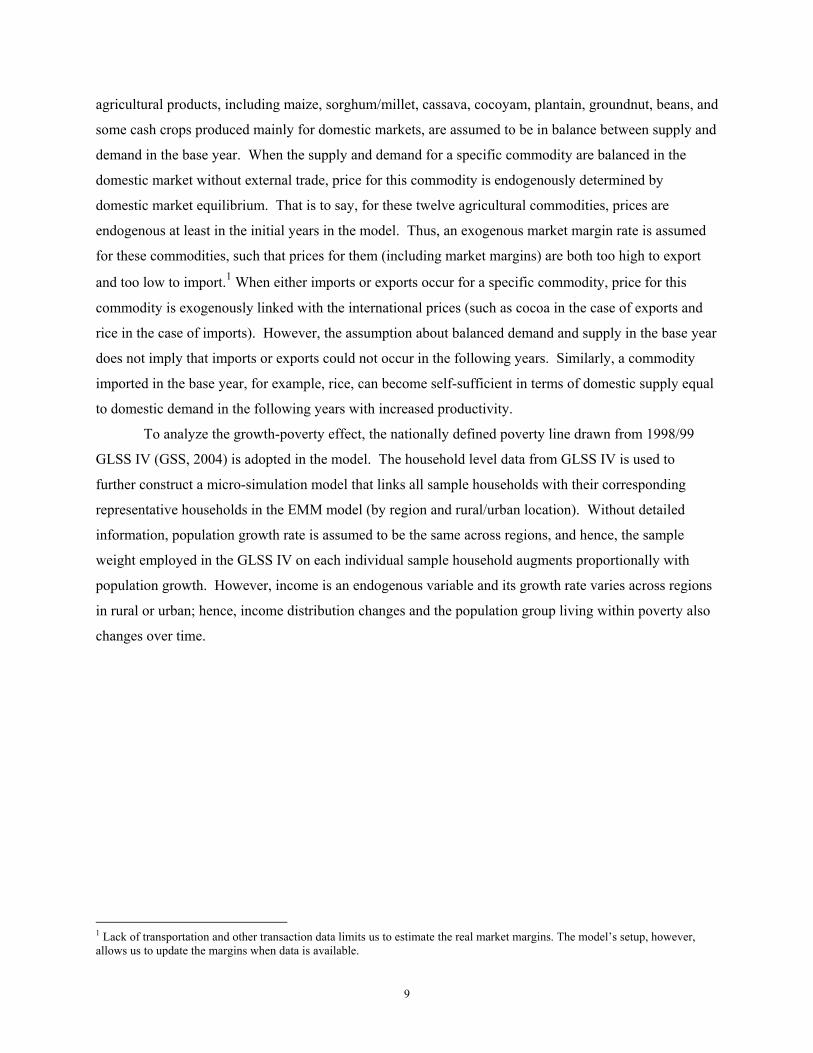
agricultural products, including maize, sorghum/millet, cassava, cocoyam, plantain, groundnut, beans, and
some cash crops produced mainly for domestic markets, are assumed to be in balance between supply and
demand in the base year. When the supply and demand for a specific commodity are balanced in the
domestic market without external trade, price for this commodity is endogenously determined by
domestic market equilibrium. That is to say, for these twelve agricultural commodities, prices are
endogenous at least in the initial years in the model. Thus, an exogenous market margin rate is assumed
for these commodities, such that prices for them (including market margins) are both too high to export
and too low to import.1 When either imports or exports occur for a specific commodity, price for this
commodity is exogenously linked with the international prices (such as cocoa in the case of exports and
rice in the case of imports). However, the assumption about balanced demand and supply in the base year
does not imply that imports or exports could not occur in the following years. Similarly, a commodity
imported in the base year, for example, rice, can become self-sufficient in terms of domestic supply equal
to domestic demand in the following years with increased productivity.
To analyze the growth-poverty effect, the nationally defined poverty line drawn from 1998/99
GLSS IV (GSS, 2004) is adopted in the model. The household level data from GLSS IV is used to
further construct a micro-simulation model that links all sample households with their corresponding
representative households in the EMM model (by region and rural/urban location). Without detailed
information, population growth rate is assumed to be the same across regions, and hence, the sample
weight employed in the GLSS IV on each individual sample household augments proportionally with
population growth. However, income is an endogenous variable and its growth rate varies across regions
in rural or urban; hence, income distribution changes and the population group living within poverty also
changes over time.
1 Lack of transportation and other transaction data limits us to estimate the real market margins. The model’s setup, however, allows us to update the margins when data is available.

10
4. Simulations
The growth-poverty linkage analysis is carried out in two stages and starts in 1999, the year of the
last living standards survey in Ghana. The first stage comprises a group of scenarios assessing the effects
of growth and different sources of growth on poverty reduction at the national level as well as in the poor
regions of the north. The scenarios included at this stage are:
1. ‘Business as usual’ in which total GDP and agricultural GDP will grow along their current
trends until 2015. Along this trend, agricultural GDP grows at 4.91%, nonagriculture at 4.76%, and total
GDP at 4.83% annually with an exogenous growth rate of 2.5% for population.
2. Agriculture-led versus non-agriculture-led growth, which compares the differential effects on
poverty reduction from similar overall growth driven by either agriculture or non-agriculture.
3. Broad-based versus export-led agricultural growth, which compares the differential effect on
poverty reduction from similar overall and agricultural growth driven by different agricultural subsectors.
The second stage of the analysis attempts to identify the commodities whose productivity growth
has the highest impact on poverty reduction in the three northern regions. The crops are pre-selected on
the basis of their impact on household income.
Ghana will meet with MDG One along the current growth path
According to MDG One, each country should halve their 1990’s poverty incidence by 2015. In
the case of Ghana the national poverty rate of 52% for 1991/92 is chosen because the household survey
conducted in 1991/92 is the closest to the 1990 base year of MDG One. The ‘business as usual’ scenario
results show that with the current patterns of growth, the national poverty rate will fall below 27% before
2015 (Table 1), indicating that the MDG One is achievable for Ghana. However, the MDG One regional
inequality will be worsened. The Northern, Upper East, Upper West and the Eastern regions will
experience only modest reductions in the poverty incidence. By 2015, more than half the population in
the Northern, 70% of populations in the Upper East and 67% in the Upper West regions will remain poor.
The poverty rates are far above the estimated national average of 33.1% for rural areas.

11
Table 1. Poverty changes by region, model results from business-as-usual growth
GLSS surveys Model projection
Poverty head count rate (P0) Poverty head count rate (P0)
1991/92 1998/99
% decline in 98/99 from
91/92 2003 2012 2015
% decline by 2015
from 1999 ACCRA 25.8 5.2 -79.8 4.0 2.3 2.1 -60.5 ASHANTI 41.2 27.7 -32.7 23.7 15.6 13.4 -51.6 BRONG_AHAFO 65.0 35.8 -44.9 27.8 14.7 12.9 -63.9 CENTRAL 44.3 48.4 9.4 40.2 26.8 20.4 -57.8 EASTERN 48.0 43.7 -9.0 41.1 33.1 30.4 -30.4 NORTHERN 63.4 69.2 9.1 65.7 59.3 56.5 -18.3 UPPER_EAST 66.9 88.2 31.8 86.3 77.8 69.9 -20.7 UPPER_WEST 88.4 83.9 -5.1 76.0 70.8 67.3 -19.9 VOLTA 57.0 37.7 -33.8 31.0 18.6 15.0 -60.2 WESTERN 59.6 27.3 -54.3 23.0 11.0 8.5 -69.0 National, rural 63.6 49.5 -22.2 44.2 33.1 30.1 -39.1 National, urban 27.7 19.4 -30.0 16.1 11.4 8.6 -55.5 National, total 52.0 39.5 -24.1 34.9 25.9 23.0 -41.8
Source: Model simulation results
Growth and poverty linkages at the sector level
Given that the regional inequality will increase with business-as-usual growth pattern, the
following simulations seek to compare the effects of growth driven by different sectors on poverty
reduction and regional inequality. We first compare the effect of growth driven by the agricultural sector
or by the nonagricultural sector. Given the same overall GDP growth, different sector level growth rate is
assumed. For example, in the agriculture-led growth scenario, a more rapid growth is assumed for the
agricultural sector, while the nonagriculture would grow along its current growth trend. Similar
assumptions are also employed in the nonagriuclture-led growth. The simulation results indicate that
agriculture-led growth reduces poverty more than the nonagricultural growth (Figure 3) and such pro-
poor growth is more effective in the poor region (Table 2).

12
Table 2: Poverty rate in northern Ghana from different sector growth (2015)
2015
1998/99 Agriculture-led
growth Non agriculture-led
growth GDP annual growth rate 5.8 5.8
AgGDP annual growth rate 6.8 4.4 NonagGDP annual growth rate 4.8 6.9
National poverty rate 39.5 17.7 22.5 NORTHERN 69.2 47.3 54.5 UPPER_EAST 88.2 59.0 73.2 UPPER_WEST 83.9 61.2 69.7 Source: Model simulation results
Figure 3: Poverty reductions in agriculture-led and nonagriculture-led growth scenarios
National Poverty Rate(with 5.8% of GDP growth)
17
19
21
23
25
27
29
31
33
35
2003 2005 2007 2009 2011 2013 2015
Pov
erty
rate
(%)
Ag-led growth Nonag-led growth
Source: Model simulation results
We now examine the agriculture-led model more closely and compare the effect of growth driven
by staple crops and livestock vs. growth driven by exportable agricultural commodities, including both
traditional and nontraditional. Similar to the previous scenario, different subsector level growth rate is
assumed, which results in a similar overall GDP and total agricultural GDP growth. The results show that
growth engendered by staple crops and livestock reduces poverty much more both at the national level
(Figure 4) and in the poor regions (Table 3).

13
The key conclusions from the above model simulations are:
• At the present rate of growth, it is possible for the country to halve poverty by 2015 at the national
level, but regional inequality will be worsened with the current patterns of growth.
• With a similar overall economic growth rate, growth led by the agricultural sector will be more
effective in reducing poverty both at the national level and in the poor regions because of strong
income and consumption linkages from agricultural growth.
• Within agriculture, growth in staple crops and livestock has more impact on poverty reduction
especially in poor regions than growth in export crops, due to the broad-based nature of production of
staple crops.
Table 3: Poverty rate for the poorest three regions: Staple-led growth vs. export-led growth scenarios
2015
1998/99 Staple-led growth Export-led
growth GDP annual growth rate 5.8 5.8 AgGDP annual growth rate 6.8 6.8 NonagGDP annual growth rate 4.8 4.8 National poverty rate 39.5 15.4 22.4 NORTHERN 69.2 41.7 56.7 UPPER_EAST 88.2 43.8 73.1 UPPER_WEST 83.9 51.4 68.9
Source: Model simulation results

14
Figure 4: Poverty reductions in staple-led and agricultural export-led growth scenarios
National Poverty Rate(with 5.8% of GDP growth and 6.8% of AgGDP growth)
1517192123252729313335
2003 2005 2007 2009 2011 2013 2015
Pov
erty
rate
(%)
Export-led growth Staple-led growth
Source: Model simulation results
We pursue the last result to determine specific staple crops, whose growth will stimulate the
highest poverty reduction in each of the three northern regions. The first step of the analysis is the
identification of crops that have significant impact on income using consumption income of the GLSS
surveys. This is done with a pooling of household data from the GLSS survey and time series data on
production from the Ministry of Food and Agriculture.2
The econometric analysis shows that growth in maize, yam and groundnuts has large and
significant positive effects on household income in the north. Based on such information, the model
simulates the potential impact of rapid growth in these crops on the poverty reduction in the north. The
regional level growth rate of the last five years for these crops (2000-04) is used in simulations. As a
result, growth in groundnut generates the largest reduction in poverty in each of the three northern regions
compared to growth in staples at the national level. Growth in groundnut output reduces poverty to
35.3% in the Northern region, 41.1% in the Upper East region and 50.2% in the Upper West region, by
2015 (Table 4 and Figures 5-7) . No other crop in the Upper East region reduces poverty more than the
generalized growth in national staples. In the Northern region, cassava growth reduces poverty more than
a nationwide growth in staples; while in the Upper West region, cowpea is the crop that can influence
poverty reduction more than a general increase in staples.
2 The econometric regressions are done by Marc Rockmore of IFPRI and the authors acknowledge and thank him for his help in this study.

15
Table 4: Effects of growth in productivity of staples on absolute poverty incidence by 2015
2015
1998/99 Base Groundnut Cassava Cowpea National Staples
AgGDP annual growth rate 4.9 5.5 5.6 5.6 5.6 National poverty rate 23.0 18.2 22.6 19.5 20.0 NORTHERN 69.2 65.7 35.3 49.2 - 49.3 UPPER_EAST 88.2 86.3 41.1 - 66.4 66.4 UPPER_WEST 83.9 76.0 50.2 68.3 55.2 63.4
Source: Model simulation results
Figure 5: Poverty reduction in Northern Region under different scenarios
Simulations of Poverty Trends in Northern Region(with 5.6% of national AgGDP growth)
38
43
48
53
58
63
68
1999 2001 2003 2005 2007 2009 2011 2013 2015
Pov
erty
rate
(%)
Base-run National StapleNorthern Groundnut Northern Cassava
Source: Model simulation results

16
Figure 6: Poverty reduction in Upper East Region under different scenarios
Simulations of Poverty Trendsin Upper East Region(with 5.6% of national AgGDP growth)
45
50
55
60
65
70
75
80
85
90
1999 2001 2003 2005 2007 2009 2011 2013 2015
Pov
erty
rate
(%)
Base-run National Staple UpperEast Groundnut
Source: Model simulation results
Figure 7: Poverty reduction in Upper West Region under different scenarios
Simulations of Poverty Trends in Upper West Region(with 5.6% of national AgGDP growth)
55
60
65
70
75
80
85
1999 2001 2003 2005 2007 2009 2011 2013 2015
Pov
erty
rate
(%)
Base-run National StapleUpperWest Groundnut UpperWest Cowpea
Source: Model simulation results
The model simulations identify groundnut, cassava and cowpea as the crops to target for pro-poor
growth in northern Ghana. Both groundnut and cassava have significant forward linkage potentials
through processing. For example, there are two oil processing enterprises in the Northern region that use

17
groundnut but supply of raw material is a major constraint (ODI and CEPA, 2005). Cowpea, on the other
hand, is equally a high value crop with enormous demand within the country and across its borders.
There is buoyant intra-regional trade in cowpea from which Ghana supplements her domestic production
(Table 5). The importance of this trade is that the net inflow is towards Accra rather than the north
further intensifying the unsatisfied demand for the crop within Ghana.
Table 5: Supply and demand for cowpeas in selected countries of West and Central Africa (1990 – 1999)
Harvested Area
(‘000 ha)
Average yield
(t ha-1) Production
(‘000 t) Consumption (kg
capita-1 year-1) Demand1
(‘000 t)
Surplus/ Deficit2
(‘000 t) Nigeria 3,066 0.548 1,680 18 2,160 -480
Niger 3,254 0.116 377 1.5 16 361
Mali 326 0.236 77 1.5 16 61
Benin 100 0.620 62 9 55 7
Ghana 85 0.659 56 9 169 -113
Cameroon 58 0.759 44 1.5 22 22
Togo 132 0.242 32 9 41 -9
Senegal 103 0.301 31 1.5 14 17
Chad 44 0.477 21 1.5 11 10
Côte d’Ivoire 3 40 0.500 20 1.8 28 -8
Mauritania 52 0.327 17 2.5 25 -8
Burkina Faso 278 0.561 156 1.5 16 140
Total 7,538 - 2,573 2,573 0
World 12,763 - 7,562 - - -
Source: Langyintuo et al (n.d.). Department of Agricultural Economics, Purdue University, 1145 Krannert Building, West Lafayette, IN 47907, USA Notes: 1 Demand includes consumption demand and demand for seed. 2Negative figures imply demand exceeds supply 3 Estimate available for only 1999 cropping season from Nestle, Côte d’Ivoire. Total may differ from the sum of country estimates because of rounding. Over 570,000 ha are cultivated in other parts of Africa.
While cassava is widely known as a food security crop (Prudencio and Al-Hassan, 1994), the
importance of groundnut and cowpea in bridging the hunger gap in northern Ghana is less well known in
policy circles. Also, because they are high protein sources, they have an inherent value in enhancing
nutrition security. The potential of groundnut and cowpea to improve soil nitrogen and to generate
vegetative material for livestock feeding are additional benefits from increasing the production of these
crops. The link with livestock is very important because livestock rearing is an important aspect of
livelihood strategies in northern Ghana. They play both social and economic roles in livelihood
strategies. Livestock income finances the purchase of inputs for crop production, food purchases when
crops fail and serves as long-term investment capital. The diversification role of livestock is particularly
important in reducing the vulnerability of households to food insecurity. The social capital function is

18
most prominent in the Upper East region where cattle are used as dowry. Whitehead’s study of poverty in
North East Ghana has identified large family sizes and large livestock populations as distinguishing the
wealthy and secure household from the poor and destitute (Whitehead, n.d.).

19
V. Summary and Conclusions
The development pattern in Ghana is characterised by a north-south divide in which the north
lags far behind the south. While Ghana has achieved sustained growth and poverty reduction during the
1990s, there was an increase in inequality because poverty rates in some regions, particularly the three
northern regions, changed little or even increased. Much of the growth has been generated by export
agriculture in which northern Ghana has little or no contribution. This paper has set out to identify
avenues for pro-poor growth in Ghana, focussing on agricultural opportunities, particularly in northern
Ghana.
Using an economy-wide multimarket model, and based on time series production data and Ghana
Living Standards Survey data of 1991/92 and 1998/99, simulations are made of the poverty reduction
trends up to 2015 using different assumptions of sources of growth. The results show that agriculture-led
growth has a larger poverty reducing effect than nonagriculture-led growth. Within agriculture, growth in
staple crop production reduces poverty more than export crops. In northern Ghana, the staple crops
whose growth exerts the largest effect on poverty reduction are groundnut, cassava and cowpea. The
conclusion from both of these is that pro-poor growth is generated from activities and crops in which the
poor in particular engage. The growth in agriculture led by export crops, which is concentrated in certain
localities, has not trickled down to non-export crop producing areas in form of higher incomes. As
Shepherd and Gyimah-Boadi (2004) have noted, liberalization is usually perceived as an international
process, but for land-locked under-developed regions such as northern Ghana, which do not have
advantages of ‘core’ exporting regions, there could be more significant benefits of regional liberalization
than of international liberalization. In this regard, the commodities identified from the present analysis
offer avenues for this regional liberalisation as a strategy for northern Ghana, which points to investments
in infrastructure and institutional development to remove barriers to regional trade, including trade
between northern Ghana and southern Ghana.
While the effects of the agriculture-led growth on poverty reduction are large, the projected
poverty rates in the regions, particularly the Upper East, are still high. This implies a need for
complementary avenues for poverty reduction, such as improved migration outcomes and private
investment in economic production within northern Ghana. Ultimately, the regions must attract
production investment to boost economic activity and generate local growth. The state must play a
leading role in investing in productive and social infrastructure, as a way of facilitating the environment
for private sector operators. The call for investments in economic infrastructure, though obvious and not
new, is worth repeating because of the tendency for public agencies to assess the provision of that
infrastructure in terms of financial benefits and measures of efficiency.

20
The main production constraints of the legumes are field and storage pests. Further investments
in crop improvement and methods of crop management in the field are needed. The uneducated unskilled
labour enters the informal job market where wages are low. The implication is for the enhancement of
this labour with education and skills.

21
References
Aryeetey, Ernest and Andrew McKay (2004). Operationalizing Pro-Poor Growth: Ghana Case Study. Department for
International Development, London, UK.
Chamberlin, Jordan (2005). Spatial Perspectives on Development Opportunities in Ghana Draft. International Food Policy
Research Institute, Washington D.C., USA.
Diao, Xinshen, Peter Hazell, Danielle Resnick, and James Thurlow (2006). The Role of Agriculture in Development:
Implications for Sub-Saharan Africa. Development Strategy and Governance Division Discussion Ppaer No. 29.
International Food Policy Research Institute, Washington D.C, USA.
Diao, Xinshen (2005). Analysing Growth Options and Poverty Reduction in Ghana: Preliminary Results of an Economy-wide,
Multi-market Model of Ghana (1999-2015). Draft. International Food Policy Research Institute, Washington D.C,
USA.
Department for International Development (2004). Migration and pro-poor policy in sub-Saharan Africa. Briefing paper,
Development Research Centre on Migration and Poverty.
FAO (Food and Agriculture Organization of the United Nation). 2005. FAOSTAT. http://www. Faostat.fao.org/ last time access:
December 2005.
GSS (Ghana Statistical Service). 2005. Quarterly Digest of Statistics, 2001 – 2005. Accra, Ghana.
GSS (Ghana Statistical Service). 2004. Ghana Living Standard Survey Report, 1989/99. Accra, Ghana.
Haggblade, S., Hazell P. and Brown, J. 1989. “Farm-Nonfarm Linkages in Rural Sub-Saharan Africa.” World Development,
17(8): 1173-1202.
Hazell, P. and Roell, A. 1983. “Rural Growth Linkages: Household Expenditure Patterns in Malaysia and Nigeria.” IFPRI
Research Report 41. Washington, DC: IFPRI.
IMF (International Monetary Fund). 2005. Ghana: Statistics Appendix. IMF Country Report No 05/286. Washington, DC: IMF.
Johnson, D.G. and Mellor, J.W. 1961. “The Role of Agriculture in Economic Development.” American Economic Review, 51(4):
566-593.
King, Robert P. and Derek Byerlee (1978). “Factor Intensities and Locational Linkages of Rural Consumption Patterns in Sierra
Leone,” American Journal of Agricultural Economics May 1978: 197-206.
Langyintuo, A. S. Lowenberg-DeBoer, J., Faye, M., Lambert, D., Ibro, G., Moussa, B, Kergna, A., Kushwaha, S, Musa, S., and
Ntoukam, G. (n.d.). Cowpea Supply and Demand in West Africa. Purdue University.
MoFA (Ministry of Food and Agriculture). 2005. Average Yield for Major Crops in Ghana. Accra, Ghana.
Overseas Development Institute (ODI) and Center for Policy Analysis (CEPA) (2005). Economic Growth in Northern Ghana.
Revised Report for DfID. Accra, Ghana.
Prudencio, C.Y. and Ramatu Al-Hassan (1994). “The Food Security Stabilisation Roles of Cassava in Africa.’ Food Policy
Journal Vol. No. 19, 57-64 Butterswoth-Heinemann.
Republic of Ghana (2005). Implementation of the Ghana Poverty Reduction Strategy, 2004 Annual Progress Report. National
Development Planning Commission, Accra.
Republic of Ghana (2005). Growth and Poverty Reduction Strategy (GPRS II). Coordinated programme for the Economic and
Social Development of Ghana (2006 – 2009). Final Draft. National Development Planning Commission, Accra.
Shepherd Andrew and E. Gyimah-Boadi (2004). Bridging the north south divide? Background Paper for the 2005 World
Development Report. Draft 23/12/04.
http://siteresources.worldbank.org/INTWDR2006/

22
Vogel, S.J. 1994. “Structural Changes in Agriculture: Production Linkages and Agricultural Demand-Led Industrialization.”
Oxford Economic Papers. New Series, 46(1): 136-156.
Whitehead, Ann (n.d.). Persistent Poverty in North East Ghana. Institute of Development Studies, University of Sussex.

23
Appendix
A1. List of agricultural commodities and nonagricultural sub-sectors in the EMM model
Agriculture: Cereals: maize, rice, wheat, sorghum/millet; Roots and tubers: cassava, yam, cocoyam; Oilseeds and pulses: groundnut, beans and other pulses; Cash crops: sugar, tobacco, vegetables for export, vegetables for domestic, pineapple; Tree crops: cocoa, coffee, plantains, coconut, tree nuts, oil palm, fruits for export, fruits for domestic; Livestock: beef, goat and sheep meats, poultry, pork, other meats, milk, eggs, fish; Industrial crops and agricultural processing: cotton, rubber, wood, cocoa processing, fish processing, other processing;
Nonagriculture:
Mining, agriculture-related manufacturing, other manufacturing, electric and water, construction, transport, trade, finance, government, community and other services
A2. Estimation and calculation of elasticities in the demand functions
Elasticities applied in the consumption demand functions are from the combination of econometric estimation and calculation based on a structural utility function, the Stone-Geary utility function, defined as the following:
(1) ( ) ( )1 21
, ,...,iI
I i ii
U c c c cβ
γ=
= −∏
Where ci is demand for good i, γi is subsistence level of i, and βi is the marginal budget share of good i. Demand function for ci derived from this utility function is called a linear expenditure system (LES) that has the following function form:
(2) ( )1
Ii j jj
i ii
Y pc
p
β γγ=
−= +
∑
Where Y is household’s total income, pi is the price for good i.
Let si be the average budget (expenditure) share of good i, i.e., i ii
p csY
= , and assume that 1
Ii ii
p c Y=
=∑ , the income
elasticity of demand for good i can be derived from (2) as following:
(3) Y i ii
i i
c YY c s
βε ∂= ⋅ =∂
,
i.e., the ratio between marginal and average budget share. The cross price elasticity of the demand is:
(4) ,j i j j j jp i iij
j i i i i
p p pc i jp c p c s Y
β γ γβε ∂= ⋅ = − = − ⋅ ≠∂
,
while the own price elasticity of the demand is:
(5) ( )I Ij jp Y pi i i iii i ijj i j i
i i i i
pc pp c s s Y
γβ βε ε ε≠ ≠
∂= ⋅ = − + = − +∂ ∑ ∑ .
Commodity expenditure share, si, is given by data, data about the home consumption is used to define iγ , and the income elasticity of the demand is econometrically estimated by the authors using a semi-log inverse function (RSLI) suggested by King

24
and Byerlee (1978). With this information, marginal budget share, iβ , can be derived from (3), as Yi i isβ ε= , while
can be derived from (4).pijε In order to derive a non-zero cross price elasticity, p
ijε , iγ has to be non-zero for
commodities i and j. Because of a positive value of jγ , pijε is negative. Finally, the homogeneity condition (Equation (5)) gives
piiε .
With all these elasticities, the demand function can also be written as a function of the income and price elasticities only, i.e.,
(6) 1
pYiji
Ii j
c Y pεε=
= ∏
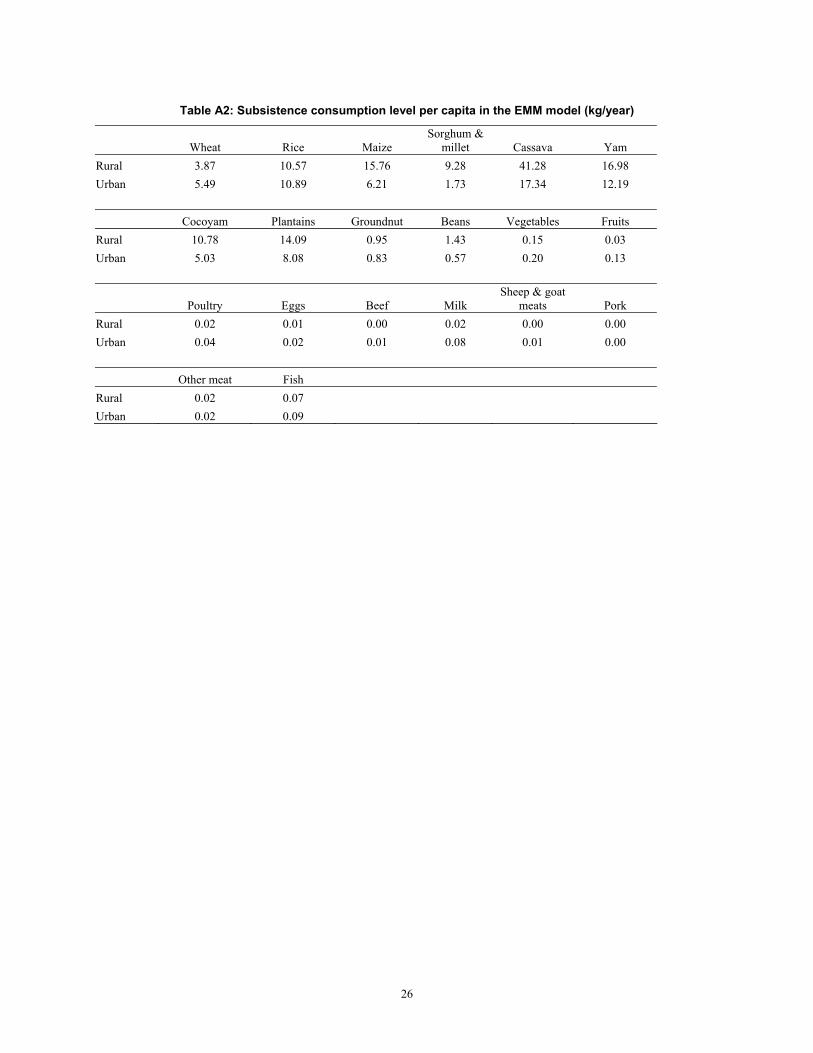
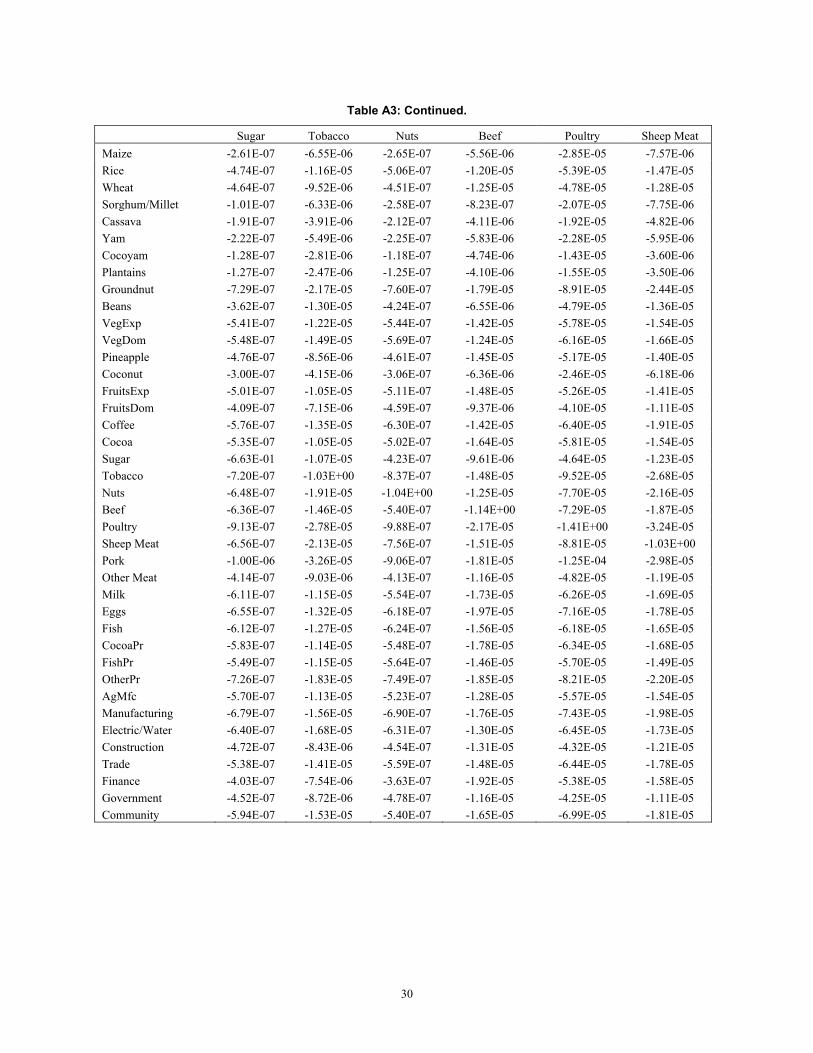
Equation (6) is the one used in the model. Price elasticties in this equation vary across regions and household groups (rural vs. urban), and are different for different commodities due to the differences in si and iγ . Table A1 presents income elasticities,
Table A2 is the selected iγ in the function used to derive the elasticities, while the price elasticities presented in tables A3 and A4 are the average over all regions for the rural and urban respectively.

25
Table A1: Income elasticities in the EMM model
Wheat Rice Maize Sorghum &
millet Cassava Yam Rural 0.90 0.91 0.42 0.21 0.36 0.40 Urban 0.80 0.82 0.20 0.12 0.10 0.20
Cocoyam Plantains Groundnut Beans Vegetables for
export Vegetables domestic
Rural 0.30 0.30 1.22 0.51 1.04 0.91 Urban 0.10 0.10 1.20 0.30 1.00 0.90 Fruits for export Fruits domestic Pineapple Nuts Coconut Oil Palm Rural 1.03 0.81 1.03 1.10 0.60 0.60 Urban 1.00 0.80 1.00 1.10 0.50 0.50 Sugar Cocoa Coffee Tobacco Poultry Eggs Rural 0.71 1.10 1.10 1.10 1.52 1.30 Urban 0.50 1.20 1.20 1.10 1.60 1.20
Beef Milk Sheep & goat
meats Pork Other meat Fish Rural 1.21 1.20 1.11 1.04 0.90 1.20 Urban 1.45 1.30 1.00 1.00 0.80 1.30
Other ag
manufacturing Other
Manufacturing Electric & water Construction Transport Trade Rural 1.00 1.30 1.00 1.00 1.00 1.00 Urban 1.00 1.30 1.00 1.00 1.00 1.00 Transport Trade Finance Government Community Rural 1.00 1.00 1.00 1.10 1.00 Urban 1.00 1.00 1.00 1.30 1.00
26
Table A2: Subsistence consumption level per capita in the EMM model (kg/year)
Wheat Rice Maize Sorghum &
millet Cassava Yam Rural 3.87 10.57 15.76 9.28 41.28 16.98 Urban 5.49 10.89 6.21 1.73 17.34 12.19 Cocoyam Plantains Groundnut Beans Vegetables Fruits Rural 10.78 14.09 0.95 1.43 0.15 0.03 Urban 5.03 8.08 0.83 0.57 0.20 0.13
Poultry Eggs Beef Milk Sheep & goat
meats Pork Rural 0.02 0.01 0.00 0.02 0.00 0.00 Urban 0.04 0.02 0.01 0.08 0.01 0.00 Other meat Fish Rural 0.02 0.07 Urban 0.02 0.09

27
Table A3: Average price elasticity in demand, rural
Maize Rice Wheat Sorghum/Millet Cassava Yam Maize -3.99E-01 -5.68E-03 -1.55E-03 -7.91E-03 -2.41E-03 -2.06E-03 Rice -9.36E-03 -8.65E-01 -3.72E-03 -7.97E-03 -5.60E-03 -4.07E-03 Wheat -9.28E-03 -1.31E-02 -8.58E-01 -3.24E-03 -5.66E-03 -3.98E-03 Sorghum/Millet -2.80E-03 -3.44E-03 -1.76E-04 -1.98E-01 -3.30E-04 -4.97E-04 Cassava -3.77E-03 -5.54E-03 -1.54E-03 -1.20E-03 -3.47E-01 -1.75E-03 Yam -4.68E-03 -5.53E-03 -1.54E-03 -2.72E-03 -2.70E-03 -3.81E-01 Cocoyam -2.59E-03 -3.96E-03 -1.19E-03 -1.07E-04 -1.81E-03 -1.72E-03 Plantains -2.43E-03 -4.32E-03 -1.20E-03 -7.78E-05 -2.02E-03 -1.37E-03 Groundnut -1.58E-02 -1.75E-02 -4.53E-03 -2.02E-02 -6.63E-03 -6.20E-03 Beans -8.26E-03 -7.61E-03 -1.69E-03 -1.69E-02 -2.38E-03 -2.17E-03 VegExp -1.09E-02 -1.50E-02 -4.31E-03 -6.16E-03 -6.54E-03 -4.95E-03 VegDom -1.19E-02 -1.30E-02 -3.53E-03 -1.27E-02 -5.28E-03 -4.52E-03 Pineapple -9.30E-03 -1.48E-02 -4.52E-03 -8.77E-04 -6.62E-03 -4.62E-03 Coconut -5.77E-03 -8.89E-03 -2.80E-03 -3.32E-04 -4.05E-03 -1.76E-03 FruitsExp -9.97E-03 -1.48E-02 -4.43E-03 -4.93E-03 -6.22E-03 -4.47E-03 FruitsDom -9.21E-03 -1.15E-02 -3.26E-03 -1.26E-02 -4.93E-03 -2.98E-03 Coffee -1.30E-02 -1.57E-02 -4.63E-03 -1.37E-02 -6.29E-03 -4.39E-03 Cocoa -1.03E-02 -1.61E-02 -4.79E-03 -2.85E-03 -6.86E-03 -4.92E-03 Sugar -9.22E-03 -1.01E-02 -2.81E-03 -7.88E-03 -4.26E-03 -3.49E-03 Tobacco -1.57E-02 -1.67E-02 -3.89E-03 -2.43E-02 -6.03E-03 -5.81E-03 Nuts -1.38E-02 -1.65E-02 -4.19E-03 -1.90E-02 -7.21E-03 -5.41E-03 Beef -1.32E-02 -1.69E-02 -5.03E-03 -6.80E-03 -6.72E-03 -6.07E-03 Poultry -1.98E-02 -2.26E-02 -5.70E-03 -2.43E-02 -8.70E-03 -7.05E-03 Sheep Meat -1.42E-02 -1.68E-02 -4.14E-03 -2.05E-02 -6.02E-03 -5.01E-03 Pork -2.46E-02 -1.37E-02 -3.26E-03 -3.80E-02 -4.72E-03 -5.31E-03 Other Meat -8.52E-03 -1.27E-02 -3.53E-03 -2.85E-03 -5.83E-03 -4.33E-03 Milk -1.20E-02 -1.76E-02 -5.37E-03 -3.64E-03 -7.18E-03 -4.86E-03 Eggs -1.34E-02 -1.88E-02 -5.64E-03 -4.60E-03 -8.11E-03 -5.68E-03 Fish -1.22E-02 -1.75E-02 -5.09E-03 -4.29E-03 -7.99E-03 -5.98E-03 CocoaPr -1.12E-02 -1.76E-02 -5.23E-03 -3.11E-03 -7.48E-03 -5.37E-03 FishPr -1.08E-02 -1.61E-02 -4.66E-03 -3.89E-03 -7.29E-03 -5.35E-03 OtherPr -1.52E-02 -1.91E-02 -5.29E-03 -1.54E-02 -7.73E-03 -6.00E-03 AgMfc -1.19E-02 -1.44E-02 -4.22E-03 -5.22E-03 -6.37E-03 -4.96E-03 Manufacturing -1.39E-02 -1.88E-02 -5.36E-03 -8.95E-03 -8.13E-03 -6.17E-03 Electric/Water -1.42E-02 -1.41E-02 -3.81E-03 -1.56E-02 -5.64E-03 -4.99E-03 Construction -9.12E-03 -1.41E-02 -4.34E-03 -5.19E-04 -6.30E-03 -4.56E-03 Trade -1.13E-02 -1.48E-02 -4.02E-03 -1.33E-02 -5.67E-03 -4.23E-03 Finance -7.24E-03 -1.47E-02 -4.62E-03 -7.10E-05 -5.91E-03 -4.20E-03 Government -9.53E-03 -1.27E-02 -3.92E-03 -4.19E-04 -6.47E-03 -4.79E-03 Community -1.28E-02 -1.43E-02 -4.08E-03 -1.08E-02 -5.57E-03 -4.50E-03

28
Table A3: Continued. Cocoyam Plantains Groundnut Beans VegExp VegDom Maize -1.02E-03 -8.58E-04 -6.48E-04 -7.05E-04 -1.80E-06 -3.50E-05 Rice -2.65E-03 -2.60E-03 -1.17E-03 -1.01E-03 -4.13E-06 -6.27E-05 Wheat -2.79E-03 -2.54E-03 -1.06E-03 -7.90E-04 -4.17E-06 -5.97E-05 Sorghum/Millet -1.63E-05 -4.40E-06 -5.04E-04 -9.34E-04 -5.43E-07 -2.16E-05 Cassava -1.05E-03 -1.14E-03 -3.84E-04 -2.88E-04 -1.79E-06 -2.36E-05 Yam -1.56E-03 -1.12E-03 -5.61E-04 -3.93E-04 -1.85E-06 -2.95E-05 Cocoyam -2.86E-01 -1.12E-03 -3.47E-04 -1.40E-04 -1.37E-06 -1.71E-05 Plantains -1.25E-03 -2.86E-01 -3.02E-04 -1.39E-04 -1.36E-06 -1.55E-05 Groundnut -3.48E-03 -2.73E-03 -1.13E+00 -2.08E-03 -5.30E-06 -1.01E-04 Beans -7.05E-04 -6.28E-04 -1.04E-03 -4.71E-01 -2.11E-06 -5.20E-05 VegExp -3.33E-03 -2.99E-03 -1.28E-03 -1.02E-03 -9.80E-01 -7.02E-05 VegDom -2.37E-03 -1.93E-03 -1.39E-03 -1.44E-03 -4.01E-06 -8.51E-01 Pineapple -3.71E-03 -3.57E-03 -1.05E-03 -6.50E-04 -4.89E-06 -5.89E-05 Coconut -1.30E-03 -1.60E-03 -4.95E-04 -4.55E-04 -2.83E-06 -3.73E-05 FruitsExp -3.51E-03 -2.88E-03 -1.19E-03 -8.79E-04 -4.73E-06 -6.75E-05 FruitsDom -2.06E-03 -2.03E-03 -8.78E-04 -8.29E-04 -3.55E-06 -5.49E-05 Coffee -2.70E-03 -2.47E-03 -1.40E-03 -1.43E-03 -4.75E-06 -7.96E-05 Cocoa -3.81E-03 -3.55E-03 -1.27E-03 -8.15E-04 -5.14E-06 -6.79E-05 Sugar -1.83E-03 -1.63E-03 -1.04E-03 -1.03E-03 -3.17E-06 -5.62E-05 Tobacco -2.70E-03 -2.13E-03 -2.08E-03 -2.48E-03 -4.81E-06 -1.03E-04 Nuts -2.58E-03 -2.46E-03 -1.65E-03 -1.84E-03 -4.88E-06 -8.95E-05 Beef -4.47E-03 -3.48E-03 -1.69E-03 -1.23E-03 -5.53E-06 -8.39E-05 Poultry -4.00E-03 -3.92E-03 -2.49E-03 -2.67E-03 -6.67E-06 -1.24E-04 Sheep Meat -2.75E-03 -2.41E-03 -1.86E-03 -2.07E-03 -4.83E-06 -9.13E-05 Pork -6.48E-04 -5.71E-04 -2.75E-03 -3.96E-03 -4.36E-06 -1.32E-04 Other Meat -3.69E-03 -3.64E-03 -1.00E-03 -5.68E-04 -4.11E-06 -5.21E-05 Milk -3.65E-03 -3.42E-03 -1.39E-03 -1.01E-03 -5.54E-06 -7.81E-05 Eggs -4.43E-03 -3.99E-03 -1.55E-03 -1.07E-03 -6.02E-06 -8.53E-05 Fish -3.85E-03 -3.59E-03 -1.38E-03 -9.51E-04 -5.57E-06 -7.84E-05 CocoaPr -4.15E-03 -3.88E-03 -1.39E-03 -8.90E-04 -5.60E-06 -7.41E-05 FishPr -3.69E-03 -3.43E-03 -1.26E-03 -8.55E-04 -5.12E-06 -7.04E-05 OtherPr -3.74E-03 -3.32E-03 -1.83E-03 -1.74E-03 -5.92E-06 -9.72E-05 AgMfc -2.44E-03 -2.77E-03 -1.25E-03 -1.05E-03 -4.43E-06 -7.11E-05 Manufacturing -4.11E-03 -3.89E-03 -1.64E-03 -1.33E-03 -5.88E-06 -8.86E-05 Electric/Water -2.40E-03 -1.80E-03 -1.54E-03 -1.75E-03 -4.53E-06 -8.64E-05 Construction -3.51E-03 -2.96E-03 -1.02E-03 -6.01E-04 -4.65E-06 -6.02E-05 Trade -3.01E-03 -2.68E-03 -1.43E-03 -1.36E-03 -4.53E-06 -7.26E-05 Finance -4.29E-03 -3.65E-03 -1.17E-03 -4.25E-04 -4.71E-06 -4.98E-05 Government -3.76E-03 -3.09E-03 -9.99E-04 -5.62E-04 -4.30E-06 -5.95E-05 Community -2.96E-03 -2.58E-03 -1.56E-03 -1.50E-03 -4.55E-06 -7.79E-05

29
Table A3: Continued. Pineapple Coconut FruitsExp FruitsDom Coffee Cocoa Maize -1.40E-06 -2.69E-05 -3.43E-06 -5.25E-06 -9.82E-08 -7.76E-06 Rice -3.81E-06 -7.05E-05 -8.45E-06 -9.12E-06 -1.86E-07 -2.06E-05 Wheat -4.08E-06 -7.82E-05 -8.86E-06 -9.07E-06 -1.93E-07 -2.15E-05 Sorghum/Millet -1.41E-08 -5.19E-07 -1.44E-06 -6.56E-06 -8.75E-08 -8.47E-07 Cassava -1.64E-06 -3.60E-05 -3.40E-06 -4.12E-06 -6.19E-08 -8.12E-06 Yam -1.61E-06 -1.90E-05 -3.45E-06 -3.20E-06 -7.08E-08 -8.52E-06 Cocoyam -1.42E-06 -1.54E-05 -2.99E-06 -2.44E-06 -4.79E-08 -7.27E-06 Plantains -1.52E-06 -2.11E-05 -2.73E-06 -2.67E-06 -4.89E-08 -7.54E-06 Groundnut -4.06E-06 -5.89E-05 -1.01E-05 -1.04E-05 -2.49E-07 -2.43E-05 Beans -1.25E-06 -2.71E-05 -3.76E-06 -4.93E-06 -1.28E-07 -7.81E-06 VegExp -4.56E-06 -8.17E-05 -9.79E-06 -1.02E-05 -2.05E-07 -2.38E-05 VegDom -3.14E-06 -6.14E-05 -7.99E-06 -9.04E-06 -1.97E-07 -1.80E-05 Pineapple -9.82E-01 -8.91E-05 -1.04E-05 -1.11E-05 -2.16E-07 -2.68E-05 Coconut -2.88E-06 -5.71E-01 -6.82E-06 -8.17E-06 -1.58E-07 -1.46E-05 FruitsExp -4.67E-06 -9.51E-05 -9.81E-01 -1.19E-05 -2.28E-07 -2.45E-05 FruitsDom -3.59E-06 -8.18E-05 -8.57E-06 -7.62E-01 -2.01E-07 -1.73E-05 Coffee -4.67E-06 -1.05E-04 -1.09E-05 -1.34E-05 -1.04E+00 -2.44E-05 Cocoa -5.39E-06 -9.06E-05 -1.09E-05 -1.07E-05 -2.28E-07 -1.04E+00 Sugar -2.60E-06 -5.07E-05 -6.08E-06 -6.91E-06 -1.46E-07 -1.45E-05 Tobacco -3.15E-06 -4.72E-05 -8.60E-06 -8.12E-06 -2.31E-07 -1.92E-05 Nuts -3.86E-06 -7.93E-05 -9.49E-06 -1.19E-05 -2.45E-07 -2.09E-05 Beef -5.25E-06 -7.12E-05 -1.19E-05 -1.05E-05 -2.39E-07 -2.95E-05 Poultry -5.57E-06 -8.18E-05 -1.25E-05 -1.36E-05 -3.19E-07 -3.11E-05 Sheep Meat -4.09E-06 -5.59E-05 -9.14E-06 -9.99E-06 -2.60E-07 -2.24E-05 Pork -1.65E-06 -1.57E-05 -4.25E-06 -5.88E-06 -1.88E-07 -1.35E-05 Other Meat -4.30E-06 -5.62E-05 -7.91E-06 -8.64E-06 -1.48E-07 -2.11E-05 Milk -5.77E-06 -1.10E-04 -1.21E-05 -1.26E-05 -2.75E-07 -3.04E-05 Eggs -6.03E-06 -1.08E-04 -1.34E-05 -1.40E-05 -2.78E-07 -3.21E-05 Fish -5.28E-06 -9.92E-05 -1.14E-05 -1.21E-05 -2.38E-07 -2.77E-05 CocoaPr -5.88E-06 -9.88E-05 -1.19E-05 -1.17E-05 -2.48E-07 -3.09E-05 FishPr -4.96E-06 -8.95E-05 -1.06E-05 -1.10E-05 -2.13E-07 -2.58E-05 OtherPr -5.21E-06 -9.44E-05 -1.21E-05 -1.35E-05 -2.81E-07 -2.85E-05 AgMfc -4.09E-06 -8.32E-05 -8.30E-06 -9.18E-06 -2.36E-07 -2.27E-05 Manufacturing -5.55E-06 -9.77E-05 -1.20E-05 -1.27E-05 -2.71E-07 -2.95E-05 Electric/Water -3.16E-06 -7.91E-05 -8.75E-06 -1.08E-05 -2.02E-07 -1.80E-05 Construction -4.77E-06 -9.09E-05 -1.02E-05 -1.04E-05 -1.97E-07 -2.39E-05 Trade -4.05E-06 -6.92E-05 -9.32E-06 -1.02E-05 -2.24E-07 -2.26E-05 Finance -5.75E-06 -5.12E-05 -1.03E-05 -7.38E-06 -2.16E-07 -3.02E-05 Government -4.25E-06 -8.20E-05 -9.68E-06 -1.02E-05 -1.90E-07 -2.12E-05 Community -3.95E-06 -6.13E-05 -8.79E-06 -8.09E-06 -2.11E-07 -2.28E-05
30
Table A3: Continued. Sugar Tobacco Nuts Beef Poultry Sheep Meat Maize -2.61E-07 -6.55E-06 -2.65E-07 -5.56E-06 -2.85E-05 -7.57E-06 Rice -4.74E-07 -1.16E-05 -5.06E-07 -1.20E-05 -5.39E-05 -1.47E-05 Wheat -4.64E-07 -9.52E-06 -4.51E-07 -1.25E-05 -4.78E-05 -1.28E-05 Sorghum/Millet -1.01E-07 -6.33E-06 -2.58E-07 -8.23E-07 -2.07E-05 -7.75E-06 Cassava -1.91E-07 -3.91E-06 -2.12E-07 -4.11E-06 -1.92E-05 -4.82E-06 Yam -2.22E-07 -5.49E-06 -2.25E-07 -5.83E-06 -2.28E-05 -5.95E-06 Cocoyam -1.28E-07 -2.81E-06 -1.18E-07 -4.74E-06 -1.43E-05 -3.60E-06 Plantains -1.27E-07 -2.47E-06 -1.25E-07 -4.10E-06 -1.55E-05 -3.50E-06 Groundnut -7.29E-07 -2.17E-05 -7.60E-07 -1.79E-05 -8.91E-05 -2.44E-05 Beans -3.62E-07 -1.30E-05 -4.24E-07 -6.55E-06 -4.79E-05 -1.36E-05 VegExp -5.41E-07 -1.22E-05 -5.44E-07 -1.42E-05 -5.78E-05 -1.54E-05 VegDom -5.48E-07 -1.49E-05 -5.69E-07 -1.24E-05 -6.16E-05 -1.66E-05 Pineapple -4.76E-07 -8.56E-06 -4.61E-07 -1.45E-05 -5.17E-05 -1.40E-05 Coconut -3.00E-07 -4.15E-06 -3.06E-07 -6.36E-06 -2.46E-05 -6.18E-06 FruitsExp -5.01E-07 -1.05E-05 -5.11E-07 -1.48E-05 -5.26E-05 -1.41E-05 FruitsDom -4.09E-07 -7.15E-06 -4.59E-07 -9.37E-06 -4.10E-05 -1.11E-05 Coffee -5.76E-07 -1.35E-05 -6.30E-07 -1.42E-05 -6.40E-05 -1.91E-05 Cocoa -5.35E-07 -1.05E-05 -5.02E-07 -1.64E-05 -5.81E-05 -1.54E-05 Sugar -6.63E-01 -1.07E-05 -4.23E-07 -9.61E-06 -4.64E-05 -1.23E-05 Tobacco -7.20E-07 -1.03E+00 -8.37E-07 -1.48E-05 -9.52E-05 -2.68E-05 Nuts -6.48E-07 -1.91E-05 -1.04E+00 -1.25E-05 -7.70E-05 -2.16E-05 Beef -6.36E-07 -1.46E-05 -5.40E-07 -1.14E+00 -7.29E-05 -1.87E-05 Poultry -9.13E-07 -2.78E-05 -9.88E-07 -2.17E-05 -1.41E+00 -3.24E-05 Sheep Meat -6.56E-07 -2.13E-05 -7.56E-07 -1.51E-05 -8.81E-05 -1.03E+00 Pork -1.00E-06 -3.26E-05 -9.06E-07 -1.81E-05 -1.25E-04 -2.98E-05 Other Meat -4.14E-07 -9.03E-06 -4.13E-07 -1.16E-05 -4.82E-05 -1.19E-05 Milk -6.11E-07 -1.15E-05 -5.54E-07 -1.73E-05 -6.26E-05 -1.69E-05 Eggs -6.55E-07 -1.32E-05 -6.18E-07 -1.97E-05 -7.16E-05 -1.78E-05 Fish -6.12E-07 -1.27E-05 -6.24E-07 -1.56E-05 -6.18E-05 -1.65E-05 CocoaPr -5.83E-07 -1.14E-05 -5.48E-07 -1.78E-05 -6.34E-05 -1.68E-05 FishPr -5.49E-07 -1.15E-05 -5.64E-07 -1.46E-05 -5.70E-05 -1.49E-05 OtherPr -7.26E-07 -1.83E-05 -7.49E-07 -1.85E-05 -8.21E-05 -2.20E-05 AgMfc -5.70E-07 -1.13E-05 -5.23E-07 -1.28E-05 -5.57E-05 -1.54E-05 Manufacturing -6.79E-07 -1.56E-05 -6.90E-07 -1.76E-05 -7.43E-05 -1.98E-05 Electric/Water -6.40E-07 -1.68E-05 -6.31E-07 -1.30E-05 -6.45E-05 -1.73E-05 Construction -4.72E-07 -8.43E-06 -4.54E-07 -1.31E-05 -4.32E-05 -1.21E-05 Trade -5.38E-07 -1.41E-05 -5.59E-07 -1.48E-05 -6.44E-05 -1.78E-05 Finance -4.03E-07 -7.54E-06 -3.63E-07 -1.92E-05 -5.38E-05 -1.58E-05 Government -4.52E-07 -8.72E-06 -4.78E-07 -1.16E-05 -4.25E-05 -1.11E-05 Community -5.94E-07 -1.53E-05 -5.40E-07 -1.65E-05 -6.99E-05 -1.81E-05

31
Table A3: Continued. Pork Other meat Milk Eggs Fish CocoaPr Maize -5.79E-06 -1.83E-05 -5.90E-06 -8.46E-06 -2.79E-06 -8.03E-07 Rice -5.24E-06 -4.52E-05 -1.47E-05 -1.99E-05 -6.76E-06 -2.13E-06 Wheat -4.38E-06 -4.42E-05 -1.58E-05 -2.10E-05 -6.90E-06 -2.23E-06 Sorghum/Millet -2.75E-06 -4.25E-06 -5.85E-07 -1.14E-06 -4.76E-07 -8.77E-08 Cassava -1.45E-06 -2.04E-05 -5.43E-06 -8.04E-06 -3.04E-06 -8.41E-07 Yam -2.76E-06 -2.10E-05 -5.51E-06 -8.18E-06 -3.13E-06 -8.82E-07 Cocoyam -3.71E-07 -1.97E-05 -4.57E-06 -7.03E-06 -2.22E-06 -7.52E-07 Plantains -3.63E-07 -2.16E-05 -4.75E-06 -7.04E-06 -2.30E-06 -7.80E-07 Groundnut -1.58E-05 -5.38E-05 -1.74E-05 -2.47E-05 -7.98E-06 -2.52E-06 Beans -1.14E-05 -1.52E-05 -6.36E-06 -8.51E-06 -2.76E-06 -8.09E-07 VegExp -6.06E-06 -5.33E-05 -1.69E-05 -2.32E-05 -7.81E-06 -2.47E-06 VegDom -1.05E-05 -3.86E-05 -1.36E-05 -1.88E-05 -6.28E-06 -1.86E-06 Pineapple -2.46E-06 -5.98E-05 -1.88E-05 -2.49E-05 -7.94E-06 -2.78E-06 Coconut -7.56E-07 -2.53E-05 -1.16E-05 -1.45E-05 -4.82E-06 -1.51E-06 FruitsExp -2.85E-06 -4.95E-05 -1.78E-05 -2.49E-05 -7.70E-06 -2.54E-06 FruitsDom -2.84E-06 -3.89E-05 -1.33E-05 -1.88E-05 -5.90E-06 -1.79E-06 Coffee -6.05E-06 -4.44E-05 -1.94E-05 -2.49E-05 -7.73E-06 -2.53E-06 Cocoa -4.06E-06 -5.90E-05 -2.00E-05 -2.67E-05 -8.37E-06 -2.93E-06 Sugar -8.16E-06 -3.15E-05 -1.09E-05 -1.48E-05 -5.03E-06 -1.51E-06 Tobacco -1.79E-05 -4.62E-05 -1.38E-05 -2.02E-05 -7.01E-06 -1.99E-06 Nuts -1.13E-05 -4.81E-05 -1.51E-05 -2.14E-05 -7.85E-06 -2.17E-06 Beef -9.76E-06 -5.86E-05 -2.04E-05 -2.96E-05 -8.48E-06 -3.05E-06 Poultry -2.00E-05 -7.20E-05 -2.19E-05 -3.19E-05 -9.99E-06 -3.22E-06 Sheep Meat -1.30E-05 -4.86E-05 -1.61E-05 -2.16E-05 -7.25E-06 -2.32E-06 Pork -9.45E-01 -2.47E-05 -1.16E-05 -1.75E-05 -4.51E-06 -1.40E-06 Other Meat -2.64E-06 -8.54E-01 -1.36E-05 -2.01E-05 -6.83E-06 -2.18E-06 Milk -5.31E-06 -5.82E-05 -1.14E+00 -2.92E-05 -9.06E-06 -3.15E-06 Eggs -6.29E-06 -6.74E-05 -2.30E-05 -1.23E+00 -9.71E-06 -3.32E-06 Fish -4.47E-06 -6.32E-05 -1.96E-05 -2.67E-05 -1.14E+00 -2.87E-06 CocoaPr -4.42E-06 -6.43E-05 -2.18E-05 -2.91E-05 -9.13E-06 -1.14E+00 FishPr -4.03E-06 -5.98E-05 -1.80E-05 -2.50E-05 -8.64E-06 -2.67E-06 OtherPr -1.17E-05 -6.03E-05 -2.07E-05 -2.88E-05 -9.30E-06 -2.95E-06 AgMfc -7.17E-06 -4.54E-05 -1.77E-05 -2.08E-05 -7.72E-06 -2.35E-06 Manufacturing -7.70E-06 -6.72E-05 -2.11E-05 -2.87E-05 -9.72E-06 -3.05E-06 Electric/Water -1.34E-05 -3.96E-05 -1.42E-05 -1.93E-05 -6.92E-06 -1.86E-06 Construction -1.36E-06 -5.26E-05 -1.74E-05 -2.26E-05 -7.87E-06 -2.47E-06 Trade -8.69E-06 -4.79E-05 -1.59E-05 -2.23E-05 -6.93E-06 -2.34E-06 Finance -1.85E-06 -5.59E-05 -1.91E-05 -2.67E-05 -7.49E-06 -3.13E-06 Government -1.08E-06 -5.60E-05 -1.50E-05 -2.13E-05 -7.43E-06 -2.20E-06 Community -1.35E-05 -4.56E-05 -1.64E-05 -2.29E-05 -6.73E-06 -2.36E-06

32
Table A3: Continued. FishPr OtherPr AgMfc Manufacturing Electric/Water Construction Maize -1.19E-06 -5.36E-06 -9.94E-06 -2.86E-04 -5.82E-05 -8.58E-05 Rice -2.99E-06 -1.08E-05 -2.05E-05 -6.41E-04 -9.35E-05 -2.26E-04 Wheat -3.05E-06 -1.05E-05 -2.11E-05 -6.42E-04 -8.86E-05 -2.44E-04 Sorghum/Millet -2.22E-07 -3.50E-06 -9.89E-07 -1.10E-04 -3.60E-05 -5.21E-07 Cassava -1.34E-06 -4.20E-06 -7.58E-06 -2.57E-04 -3.99E-05 -9.87E-05 Yam -1.35E-06 -4.61E-06 -9.56E-06 -2.85E-04 -4.48E-05 -9.90E-05 Cocoyam -1.03E-06 -3.16E-06 -5.19E-06 -2.09E-04 -2.37E-05 -8.40E-05 Plantains -1.06E-06 -3.12E-06 -6.54E-06 -2.20E-04 -1.98E-05 -7.89E-05 Groundnut -3.52E-06 -1.56E-05 -2.67E-05 -8.38E-04 -1.53E-04 -2.46E-04 Beans -1.19E-06 -7.40E-06 -1.12E-05 -3.40E-04 -8.68E-05 -7.22E-05 VegExp -3.47E-06 -1.22E-05 -2.28E-05 -7.29E-04 -1.09E-04 -2.71E-04 VegDom -2.72E-06 -1.14E-05 -2.10E-05 -6.28E-04 -1.19E-04 -2.00E-04 Pineapple -3.60E-06 -1.15E-05 -2.26E-05 -7.37E-04 -8.15E-05 -2.98E-04 Coconut -2.10E-06 -6.74E-06 -1.49E-05 -4.20E-04 -6.59E-05 -1.83E-04 FruitsExp -3.45E-06 -1.20E-05 -2.07E-05 -7.18E-04 -1.02E-04 -2.87E-04 FruitsDom -2.58E-06 -9.67E-06 -1.65E-05 -5.46E-04 -8.98E-05 -2.11E-04 Coffee -3.34E-06 -1.34E-05 -2.82E-05 -7.76E-04 -1.13E-04 -2.66E-04 Cocoa -3.76E-06 -1.26E-05 -2.53E-05 -7.87E-04 -9.32E-05 -3.00E-04 Sugar -2.18E-06 -8.76E-06 -1.72E-05 -4.93E-04 -9.03E-05 -1.61E-04 Tobacco -3.08E-06 -1.49E-05 -2.30E-05 -7.63E-04 -1.59E-04 -1.94E-04 Nuts -3.43E-06 -1.38E-05 -2.42E-05 -7.68E-04 -1.36E-04 -2.38E-04 Beef -3.83E-06 -1.48E-05 -2.57E-05 -8.47E-04 -1.21E-04 -2.96E-04 Poultry -4.45E-06 -1.95E-05 -3.32E-05 -1.06E-03 -1.79E-04 -2.90E-04 Sheep Meat -3.17E-06 -1.42E-05 -2.50E-05 -7.69E-04 -1.31E-04 -2.20E-04 Pork -1.96E-06 -1.74E-05 -2.66E-05 -6.86E-04 -2.31E-04 -5.68E-05 Other Meat -3.12E-06 -9.57E-06 -1.81E-05 -6.42E-04 -7.34E-05 -2.36E-04 Milk -4.00E-06 -1.40E-05 -3.01E-05 -8.58E-04 -1.13E-04 -3.33E-04 Eggs -4.38E-06 -1.53E-05 -2.78E-05 -9.21E-04 -1.20E-04 -3.41E-04 Fish -4.17E-06 -1.36E-05 -2.84E-05 -8.59E-04 -1.19E-04 -3.27E-04 CocoaPr -4.10E-06 -1.38E-05 -2.75E-05 -8.58E-04 -1.02E-04 -3.27E-04 FishPr -1.04E+00 -1.25E-05 -2.44E-05 -7.84E-04 -1.05E-04 -2.99E-04 OtherPr -4.12E-06 -1.23E+00 -2.87E-05 -9.14E-04 -1.51E-04 -3.09E-04 AgMfc -3.19E-06 -1.14E-05 -9.48E-01 -7.37E-04 -1.10E-04 -2.54E-04 Manufacturing -4.28E-06 -1.52E-05 -3.07E-05 -1.23E+00 -1.32E-04 -3.30E-04 Electric/Water -2.94E-06 -1.29E-05 -2.36E-05 -6.78E-04 -9.47E-01 -2.34E-04 Construction -3.47E-06 -1.09E-05 -2.25E-05 -7.03E-04 -9.65E-05 -9.51E-01 Trade -3.12E-06 -1.26E-05 -2.08E-05 -6.99E-04 -1.09E-04 -2.32E-04 Finance -3.53E-06 -1.17E-05 -1.94E-05 -7.34E-04 -3.23E-05 -2.72E-04 Government -3.29E-06 -9.89E-06 -2.09E-05 -6.72E-04 -9.19E-05 -2.81E-04 Community -3.02E-06 -1.30E-05 -2.30E-05 -7.06E-04 -1.19E-04 -2.19E-04

33
Table A3: Continued. Transport Trade Finance Government Community Maize -7.30E-06 -1.05E-04 -9.91E-06 -1.14E-04 -1.53E-05 Rice -2.14E-05 -2.17E-04 -3.42E-05 -2.65E-04 -2.88E-05 Wheat -2.23E-05 -2.08E-04 -3.78E-05 -2.90E-04 -2.88E-05 Sorghum/Millet -3.06E-08 -8.89E-05 -1.03E-08 -5.01E-07 -4.61E-06 Cassava -1.09E-05 -7.96E-05 -1.07E-05 -1.15E-04 -9.88E-06 Yam -7.18E-06 -8.45E-05 -1.33E-05 -1.22E-04 -1.23E-05 Cocoyam -6.56E-06 -6.63E-05 -1.49E-05 -1.12E-04 -8.91E-06 Plantains -7.37E-06 -6.55E-05 -1.41E-05 -1.06E-04 -8.61E-06 Groundnut -2.10E-05 -3.16E-04 -4.10E-05 -3.08E-04 -4.71E-05 Beans -5.95E-06 -1.50E-04 -7.43E-06 -8.80E-05 -2.26E-05 VegExp -2.50E-05 -2.42E-04 -3.99E-05 -3.22E-04 -3.33E-05 VegDom -1.69E-05 -2.22E-04 -2.41E-05 -2.53E-04 -3.25E-05 Pineapple -2.63E-05 -2.32E-04 -5.22E-05 -3.47E-04 -3.10E-05 Coconut -1.87E-05 -1.28E-04 -1.50E-05 -2.16E-04 -1.55E-05 FruitsExp -2.55E-05 -2.41E-04 -4.20E-05 -3.53E-04 -3.11E-05 FruitsDom -1.88E-05 -1.90E-04 -2.17E-05 -2.69E-04 -2.06E-05 Coffee -2.50E-05 -2.77E-04 -4.24E-05 -3.36E-04 -3.57E-05 Cocoa -2.84E-05 -2.60E-04 -5.51E-05 -3.50E-04 -3.58E-05 Sugar -1.41E-05 -1.69E-04 -2.00E-05 -1.98E-04 -2.54E-05 Tobacco -1.64E-05 -2.97E-04 -2.52E-05 -2.50E-04 -4.41E-05 Nuts -2.02E-05 -2.69E-04 -2.76E-05 -3.13E-04 -3.54E-05 Beef -2.79E-05 -3.08E-04 -6.31E-05 -3.45E-04 -4.70E-05 Poultry -2.81E-05 -3.97E-04 -5.26E-05 -3.71E-04 -5.89E-05 Sheep Meat -2.03E-05 -2.99E-04 -4.20E-05 -2.68E-04 -4.16E-05 Pork -5.13E-06 -3.35E-04 -1.13E-05 -6.23E-05 -7.08E-05 Other Meat -2.10E-05 -1.98E-04 -3.65E-05 -3.19E-04 -2.57E-05 Milk -2.97E-05 -2.79E-04 -5.33E-05 -3.87E-04 -3.94E-05 Eggs -3.28E-05 -3.09E-04 -5.87E-05 -4.21E-04 -4.34E-05 Fish -2.95E-05 -2.64E-04 -4.52E-05 -3.95E-04 -3.51E-05 CocoaPr -3.10E-05 -2.84E-04 -6.01E-05 -3.82E-04 -3.91E-05 FishPr -2.75E-05 -2.47E-04 -4.42E-05 -3.63E-04 -3.27E-05 OtherPr -2.89E-05 -3.29E-04 -4.83E-05 -3.65E-04 -4.61E-05 AgMfc -2.03E-05 -2.16E-04 -3.19E-05 -3.10E-04 -3.26E-05 Manufacturing -2.90E-05 -3.02E-04 -5.02E-05 -4.09E-04 -4.16E-05 Electric/Water -1.91E-05 -2.44E-04 -1.14E-05 -2.80E-04 -3.61E-05 Construction -2.48E-05 -2.13E-04 -3.96E-05 -3.64E-04 -2.76E-05 Trade -2.36E-05 -9.48E-01 -4.41E-05 -2.71E-04 -3.68E-05 Finance -2.99E-05 -2.79E-04 -9.52E-01 -2.82E-04 -3.86E-05 Government -1.96E-05 -1.89E-04 -2.91E-05 -9.24E-01 -2.42E-05 Community -2.18E-05 -2.70E-04 -4.47E-05 -2.56E-04 -9.48E-01

34
Table A4: Average price elasticity in demand, urban Maize Rice Wheat Sorghum/Millet Cassava Yam Maize -1.96E-01 -1.52E-03 -5.31E-04 -1.73E-04 -3.05E-04 -3.83E-04 Rice -1.83E-03 -8.09E-01 -2.24E-03 -6.70E-04 -1.13E-03 -1.45E-03 Wheat -1.57E-03 -5.61E-03 -7.87E-01 -2.67E-04 -9.54E-04 -1.22E-03 Sorghum/Millet -2.47E-04 -1.05E-03 -7.42E-05 -1.22E-01 -6.66E-05 -3.70E-04 Cassava -2.51E-04 -7.74E-04 -2.67E-04 -5.10E-05 -9.80E-02 -1.93E-04 Yam -4.85E-04 -1.51E-03 -5.24E-04 -2.35E-04 -2.96E-04 -1.96E-01 Cocoyam -2.09E-04 -7.50E-04 -2.65E-04 -2.81E-05 -1.54E-04 -1.83E-04 Plantains -1.75E-04 -7.25E-04 -2.77E-04 -2.09E-05 -1.34E-04 -1.70E-04 Groundnut -2.81E-03 -8.59E-03 -3.30E-03 -1.09E-03 -1.52E-03 -2.10E-03 Beans -1.02E-03 -2.25E-03 -7.57E-04 -1.44E-03 -3.77E-04 -6.05E-04 VegExp -2.10E-03 -7.25E-03 -2.72E-03 -9.73E-04 -1.31E-03 -1.73E-03 VegDom -2.51E-03 -6.66E-03 -2.37E-03 -1.85E-03 -1.19E-03 -1.67E-03 Pineapple -1.88E-03 -6.83E-03 -2.82E-03 -1.59E-04 -1.19E-03 -1.59E-03 Coconut -1.40E-03 -3.80E-03 -1.37E-03 -1.47E-04 -7.26E-04 -8.11E-04 FruitsExp -1.63E-03 -6.83E-03 -2.85E-03 -6.18E-04 -1.12E-03 -1.46E-03 FruitsDom -1.38E-03 -5.43E-03 -2.28E-03 -1.27E-04 -9.02E-04 -1.06E-03 Coffee -2.35E-03 -8.95E-03 -3.68E-03 -2.68E-04 -1.44E-03 -1.80E-03 Cocoa -2.52E-03 -8.45E-03 -3.41E-03 -6.25E-04 -1.43E-03 -1.82E-03 Sugar -1.49E-03 -3.67E-03 -1.38E-03 -3.46E-04 -6.70E-04 -8.68E-04 Tobacco -3.86E-03 -8.46E-03 -3.15E-03 -1.22E-03 -1.60E-03 -2.00E-03 Nuts -2.90E-03 -8.12E-03 -3.00E-03 -1.71E-03 -1.45E-03 -1.98E-03 Beef -3.36E-03 -1.06E-02 -4.00E-03 -1.38E-03 -1.87E-03 -2.62E-03 Poultry -2.57E-03 -1.12E-02 -4.55E-03 -7.28E-04 -1.83E-03 -2.30E-03 Sheep Meat -2.18E-03 -7.16E-03 -2.67E-03 -1.90E-03 -1.15E-03 -1.53E-03 Pork -1.59E-03 -7.22E-03 -2.45E-03 -6.66E-03 -1.05E-03 -1.79E-03 Other Meat -1.51E-03 -5.55E-03 -2.19E-03 -1.51E-04 -1.06E-03 -1.45E-03 Milk -2.66E-03 -9.04E-03 -3.70E-03 -3.27E-04 -1.54E-03 -1.98E-03 Eggs -2.29E-03 -8.33E-03 -3.41E-03 -5.41E-04 -1.40E-03 -1.75E-03 Fish -2.93E-03 -9.34E-03 -3.55E-03 -7.82E-04 -1.74E-03 -2.24E-03 CocoaPr -2.52E-03 -8.45E-03 -3.41E-03 -6.25E-04 -1.43E-03 -1.82E-03 FishPr -2.42E-03 -7.89E-03 -3.01E-03 -6.73E-04 -1.46E-03 -1.89E-03 OtherPr -2.58E-03 -9.14E-03 -3.59E-03 -9.75E-04 -1.58E-03 -2.12E-03 AgMfc -2.12E-03 -7.00E-03 -2.84E-03 -8.43E-04 -1.18E-03 -1.60E-03 Manufacturing -2.75E-03 -9.25E-03 -3.62E-03 -9.35E-04 -1.62E-03 -2.13E-03 Electric/Water -2.58E-03 -7.48E-03 -2.68E-03 -1.43E-03 -1.36E-03 -1.82E-03 Construction -1.81E-03 -7.08E-03 -2.79E-03 -1.60E-04 -1.25E-03 -1.63E-03 Trade -2.17E-03 -7.00E-03 -2.74E-03 -7.50E-04 -1.23E-03 -1.64E-03 Finance -1.27E-03 -6.41E-03 -2.82E-03 -4.78E-05 -9.96E-04 -1.28E-03 Government -1.94E-03 -6.40E-03 -2.45E-03 -2.03E-04 -1.20E-03 -1.46E-03 Community -2.35E-03 -7.17E-03 -2.68E-03 -1.61E-03 -1.28E-03 -1.77E-03

35
Table A4: Continued. Cocoyam Plantains Groundnut Beans VegExp VegDom Maize -1.46E-04 -1.35E-04 -1.22E-04 -1.15E-04 -8.34E-07 -1.23E-05 Rice -6.64E-04 -6.70E-04 -4.51E-04 -3.01E-04 -3.46E-06 -3.91E-05 Wheat -5.46E-04 -6.31E-04 -4.23E-04 -2.51E-04 -3.19E-06 -3.44E-05 Sorghum/Millet -1.98E-05 -2.97E-06 -7.90E-05 -4.29E-04 -8.57E-07 -2.23E-05 Cassava -8.89E-05 -8.56E-05 -5.44E-05 -3.50E-05 -4.29E-07 -4.80E-06 Yam -1.62E-04 -1.66E-04 -1.16E-04 -8.63E-05 -8.70E-07 -1.04E-05 Cocoyam -9.80E-02 -9.81E-05 -5.88E-05 -2.91E-05 -4.53E-07 -4.58E-06 Plantains -8.87E-05 -9.81E-02 -5.26E-05 -2.58E-05 -4.19E-07 -4.17E-06 Groundnut -9.46E-04 -9.34E-04 -1.18E+00 -4.86E-04 -4.96E-06 -5.86E-05 Beans -1.81E-04 -1.77E-04 -1.87E-04 -2.92E-01 -1.31E-06 -2.14E-05 VegExp -7.95E-04 -8.14E-04 -5.42E-04 -3.72E-04 -9.79E-01 -4.73E-05 VegDom -6.51E-04 -6.56E-04 -5.19E-04 -4.91E-04 -3.83E-06 -8.79E-01 Pineapple -6.83E-04 -8.30E-04 -5.18E-04 -2.80E-04 -4.01E-06 -4.23E-05 Coconut -3.07E-04 -3.98E-04 -2.40E-04 -1.72E-04 -2.11E-06 -2.43E-05 FruitsExp -6.74E-04 -7.83E-04 -5.13E-04 -3.11E-04 -4.01E-06 -4.21E-05 FruitsDom -5.37E-04 -5.74E-04 -4.04E-04 -2.21E-04 -3.21E-06 -3.25E-05 Coffee -7.86E-04 -9.48E-04 -6.27E-04 -3.86E-04 -4.94E-06 -5.18E-05 Cocoa -7.10E-04 -8.81E-04 -6.17E-04 -4.19E-04 -4.83E-06 -5.36E-05 Sugar -3.49E-04 -3.63E-04 -2.85E-04 -2.20E-04 -2.04E-06 -2.57E-05 Tobacco -7.23E-04 -7.47E-04 -6.48E-04 -6.46E-04 -4.55E-06 -5.98E-05 Nuts -7.12E-04 -7.76E-04 -6.13E-04 -5.48E-04 -4.56E-06 -5.73E-05 Beef -1.32E-03 -1.21E-03 -8.53E-04 -6.03E-04 -6.10E-06 -7.21E-05 Poultry -1.16E-03 -1.35E-03 -8.41E-04 -4.26E-04 -6.38E-06 -6.61E-05 Sheep Meat -6.05E-04 -6.57E-04 -5.85E-04 -4.79E-04 -3.99E-06 -5.02E-05 Pork -6.58E-04 -7.42E-04 -5.39E-04 -8.92E-04 -4.57E-06 -6.72E-05 Other Meat -7.12E-04 -7.15E-04 -4.37E-04 -2.21E-04 -3.41E-06 -3.48E-05 Milk -8.52E-04 -9.82E-04 -6.88E-04 -4.10E-04 -5.18E-06 -5.62E-05 Eggs -8.57E-04 -9.55E-04 -6.31E-04 -3.78E-04 -4.81E-06 -5.19E-05 Fish -1.01E-03 -1.07E-03 -6.91E-04 -4.47E-04 -5.44E-06 -6.06E-05 CocoaPr -7.10E-04 -8.81E-04 -6.17E-04 -4.19E-04 -4.83E-06 -5.36E-05 FishPr -8.63E-04 -9.16E-04 -5.86E-04 -3.75E-04 -4.61E-06 -5.08E-05 OtherPr -9.27E-04 -1.01E-03 -7.02E-04 -4.65E-04 -5.25E-06 -5.85E-05 AgMfc -6.80E-04 -8.00E-04 -5.41E-04 -3.91E-04 -3.98E-06 -4.59E-05 Manufacturing -9.58E-04 -1.03E-03 -7.06E-04 -4.68E-04 -5.32E-06 -5.97E-05 Electric/Water -6.15E-04 -7.28E-04 -5.51E-04 -4.68E-04 -4.02E-06 -5.07E-05 Construction -8.52E-04 -8.24E-04 -5.42E-04 -2.73E-04 -4.15E-06 -4.28E-05 Trade -6.67E-04 -7.58E-04 -5.48E-04 -3.75E-04 -3.94E-06 -4.51E-05 Finance -5.11E-04 -7.30E-04 -4.72E-04 -2.25E-04 -3.70E-06 -3.63E-05 Government -6.43E-04 -7.23E-04 -4.48E-04 -2.48E-04 -3.71E-06 -3.92E-05 Community -7.74E-04 -7.90E-04 -5.61E-04 -4.69E-04 -4.15E-06 -5.11E-05

36
Table A4: Continued. Pineapple Coconut FruitsExp FruitsDom Coffee Cocoa Maize -7.896E-07 -1.122E-05 -2.506E-06 -2.675E-06 -5.95E-08 -5.935E-06 Rice -3.397E-06 -3.546E-05 -1.234E-05 -1.25E-05 -2.646E-07 -2.335E-05 Wheat -3.505E-06 -3.236E-05 -1.29E-05 -1.306E-05 -2.758E-07 -2.372E-05 Sorghum/Millet -1.006E-08 -9.164E-07 -2.127E-06 -2.043E-07 -1.021E-09 -2.772E-06 Cassava -4.134E-07 -4.804E-06 -1.419E-06 -1.442E-06 -3.013E-08 -2.783E-06 Yam -8.488E-07 -8.231E-06 -2.832E-06 -2.592E-06 -5.766E-08 -5.437E-06 Cocoyam -4.121E-07 -3.525E-06 -1.483E-06 -1.489E-06 -2.858E-08 -2.396E-06 Plantains -4.532E-07 -4.133E-06 -1.558E-06 -1.442E-06 -3.117E-08 -2.689E-06 Groundnut -5.027E-06 -4.436E-05 -1.813E-05 -1.801E-05 -3.662E-07 -3.344E-05 Beans -1.049E-06 -1.228E-05 -4.236E-06 -3.811E-06 -8.697E-08 -8.782E-06 VegExp -4.247E-06 -4.262E-05 -1.546E-05 -1.563E-05 -3.152E-07 -2.862E-05 VegDom -3.632E-06 -3.968E-05 -1.318E-05 -1.283E-05 -2.68E-07 -2.575E-05 Pineapple -0.9809161 -4.231E-05 -1.618E-05 -1.566E-05 -3.167E-07 -2.877E-05 Coconut -2.223E-06 -0.4895132 -7.479E-06 -8.562E-06 -1.765E-07 -1.757E-05 FruitsExp -4.439E-06 -3.906E-05 -0.9809241 -1.712E-05 -3.516E-07 -2.96E-05 FruitsDom -3.404E-06 -3.542E-05 -1.356E-05 -0.7852423 -2.825E-07 -2.587E-05 Coffee -5.259E-06 -5.58E-05 -2.128E-05 -2.158E-05 -1.176002 -3.988E-05 Cocoa -5.143E-06 -5.979E-05 -1.929E-05 -2.128E-05 -4.293E-07 -1.176381 Sugar -2.055E-06 -2.33E-05 -7.291E-06 -7.657E-06 -1.676E-07 -1.489E-05 Tobacco -4.059E-06 -5.525E-05 -1.565E-05 -1.723E-05 -4.354E-07 -3.6E-05 Nuts -4.306E-06 -4.498E-05 -1.641E-05 -1.692E-05 -3.69E-07 -3.252E-05 Beef -6.254E-06 -4.679E-05 -2.202E-05 -2.031E-05 -4.461E-07 -3.824E-05 Poultry -7.175E-06 -5.569E-05 -2.613E-05 -2.371E-05 -4.999E-07 -4.391E-05 Sheep Meat -3.637E-06 -3.418E-05 -1.465E-05 -1.593E-05 -2.603E-07 -2.892E-05 Pork -3.811E-06 -3.064E-05 -1.677E-05 -1.166E-05 -2.867E-07 -2.654E-05 Other Meat -3.734E-06 -3.2E-05 -1.235E-05 -1.253E-05 -2.23E-07 -2.183E-05 Milk -5.635E-06 -5.422E-05 -2.084E-05 -2.225E-05 -4.429E-07 -3.957E-05 Eggs -5.331E-06 -5.001E-05 -1.958E-05 -1.987E-05 -3.959E-07 -3.547E-05 Fish -5.679E-06 -6.113E-05 -1.983E-05 -2.001E-05 -4.14E-07 -3.778E-05 CocoaPr -5.143E-06 -5.979E-05 -1.929E-05 -2.128E-05 -4.293E-07 -3.966E-05 FishPr -4.813E-06 -5.034E-05 -1.686E-05 -1.689E-05 -3.516E-07 -3.169E-05 OtherPr -5.539E-06 -4.906E-05 -2.04E-05 -2.061E-05 -3.903E-07 -3.696E-05 AgMfc -4.441E-06 -3.391E-05 -1.601E-05 -1.438E-05 -3.358E-07 -2.759E-05 Manufacturing -5.588E-06 -5.235E-05 -2.028E-05 -2.028E-05 -4.22E-07 -3.756E-05 Electric/Water -3.942E-06 -4.133E-05 -1.432E-05 -1.386E-05 -2.855E-07 -2.789E-05 Construction -4.366E-06 -3.873E-05 -1.605E-05 -1.7E-05 -3.222E-07 -2.893E-05 Trade -4.149E-06 -3.681E-05 -1.515E-05 -1.504E-05 -2.785E-07 -2.753E-05 Finance -4.516E-06 -3.606E-05 -1.713E-05 -1.812E-05 -2.751E-07 -2.951E-05 Government -3.892E-06 -4.691E-05 -1.379E-05 -1.49E-05 -2.882E-07 -2.728E-05 Community -4.156E-06 -3.719E-05 -1.505E-05 -1.366E-05 -2.871E-07 -2.676E-05

37
Table A4: Continued. Sugar Tobacco Nuts Beef Poultry Sheep Meat Maize -9.998E-08 -1.341E-06 -7.45E-08 -5.601E-06 -1.017E-05 -4.164E-06 Rice -2.935E-07 -3.475E-06 -2.463E-07 -2.156E-05 -5.213E-05 -1.622E-05 Wheat -2.747E-07 -3.23E-06 -2.269E-07 -1.972E-05 -5.319E-05 -1.502E-05 Sorghum/Millet -2.792E-08 -7.238E-07 -1.005E-07 -5.085E-06 -4.285E-06 -7.165E-06 Cassava -3.722E-08 -4.58E-07 -3.071E-08 -2.577E-06 -6E-06 -1.806E-06 Yam -7.399E-08 -8.781E-07 -6.439E-08 -5.547E-06 -1.156E-05 -3.683E-06 Cocoyam -3.362E-08 -3.601E-07 -2.618E-08 -3.164E-06 -6.602E-06 -1.652E-06 Plantains -3.163E-08 -3.363E-07 -2.582E-08 -2.618E-06 -6.953E-06 -1.624E-06 Groundnut -4.417E-07 -5.186E-06 -3.626E-07 -3.277E-05 -7.677E-05 -2.568E-05 Beans -1.315E-07 -1.996E-06 -1.251E-07 -8.94E-06 -1.5E-05 -8.124E-06 VegExp -3.454E-07 -3.977E-06 -2.944E-07 -2.561E-05 -6.36E-05 -1.915E-05 VegDom -3.522E-07 -4.234E-06 -3E-07 -2.453E-05 -5.339E-05 -1.95E-05 Pineapple -3.283E-07 -3.349E-06 -2.625E-07 -2.479E-05 -6.755E-05 -1.646E-05 Coconut -1.956E-07 -2.396E-06 -1.441E-07 -9.744E-06 -2.755E-05 -8.131E-06 FruitsExp -3.197E-07 -3.544E-06 -2.744E-07 -2.395E-05 -6.75E-05 -1.82E-05 FruitsDom -2.66E-07 -3.09E-06 -2.242E-07 -1.75E-05 -4.851E-05 -1.567E-05 Coffee -4.446E-07 -5.966E-06 -3.735E-07 -2.936E-05 -7.815E-05 -1.957E-05 Cocoa -4.252E-07 -5.31E-06 -3.544E-07 -2.71E-05 -7.389E-05 -2.341E-05 Sugar -0.4892243 -2.643E-06 -1.649E-07 -1.295E-05 -2.895E-05 -1.03E-05 Tobacco -5.118E-07 -1.0744844 -4.504E-07 -2.823E-05 -5.447E-05 -2.458E-05 Nuts -4.321E-07 -6.097E-06 -1.0757068 -2.758E-05 -6.356E-05 -2.418E-05 Beef -5.221E-07 -5.878E-06 -4.243E-07 -1.4189658 -9.514E-05 -2.66E-05 Poultry -4.914E-07 -4.774E-06 -4.116E-07 -4.006E-05 -1.5695323 -3.095E-05 Sheep Meat -3.634E-07 -4.48E-06 -3.256E-07 -2.329E-05 -6.436E-05 -0.9788359 Pork -2.875E-07 -3.815E-06 -3.584E-07 -2.958E-05 -6.756E-05 -2.365E-05 Other Meat -2.579E-07 -2.6E-06 -2.078E-07 -2.161E-05 -5.207E-05 -1.269E-05 Milk -4.567E-07 -5.32E-06 -3.752E-07 -3.121E-05 -8.307E-05 -2.53E-05 Eggs -4.011E-07 -4.414E-06 -3.223E-07 -3.001E-05 -8.045E-05 -2.206E-05 Fish -4.605E-07 -5.097E-06 -3.73E-07 -3.245E-05 -8.13E-05 -2.297E-05 CocoaPr -4.252E-07 -5.31E-06 -3.544E-07 -2.71E-05 -7.389E-05 -2.341E-05 FishPr -3.852E-07 -4.319E-06 -3.149E-07 -2.76E-05 -6.926E-05 -1.944E-05 OtherPr -4.443E-07 -5.249E-06 -3.797E-07 -3.275E-05 -8.285E-05 -2.635E-05 AgMfc -3.478E-07 -4.367E-06 -2.988E-07 -2.721E-05 -6.651E-05 -1.803E-05 Manufacturing -4.558E-07 -5.321E-06 -3.803E-07 -3.341E-05 -8.471E-05 -2.52E-05 Electric/Water -3.885E-07 -5.137E-06 -3.406E-07 -2.432E-05 -5.925E-05 -2.265E-05 Construction -3.274E-07 -3.328E-06 -2.664E-07 -2.613E-05 -6.695E-05 -1.832E-05 Trade -3.569E-07 -4.506E-06 -3.044E-07 -2.421E-05 -6.11E-05 -2.224E-05 Finance -2.906E-07 -2.687E-06 -2.517E-07 -2.09E-05 -6.555E-05 -1.928E-05 Government -3.088E-07 -3.28E-06 -2.495E-07 -1.951E-05 -5.653E-05 -1.525E-05 Community -3.61E-07 -4.329E-06 -3.113E-07 -2.744E-05 -6.25E-05 -2.041E-05

38
Table A4: Continued. Pork Other Meat Milk Eggs Fish CocoaPr Maize -2.33E-07 -5.32E-06 -5.56E-06 -5.98E-06 -9.89E-07 -6.14E-07 Rice -1.24E-06 -2.39E-05 -2.23E-05 -2.58E-05 -3.75E-06 -2.42E-06 Wheat -1.07E-06 -2.28E-05 -2.28E-05 -2.63E-05 -3.54E-06 -2.46E-06 Sorghum/Millet -2.88E-06 -2.28E-07 -1.03E-07 -2.23E-06 -4.72E-07 -2.87E-07 Cassava -1.28E-07 -3.09E-06 -2.65E-06 -3.03E-06 -4.83E-07 -2.88E-07 Yam -3.34E-07 -6.50E-06 -5.24E-06 -5.80E-06 -9.57E-07 -5.63E-07 Cocoyam -1.39E-07 -3.60E-06 -2.55E-06 -3.21E-06 -4.87E-07 -2.48E-07 Plantains -1.41E-07 -3.27E-06 -2.66E-06 -3.24E-06 -4.69E-07 -2.78E-07 Groundnut -1.82E-06 -3.55E-05 -3.31E-05 -3.80E-05 -5.37E-06 -3.46E-06 Beans -1.17E-06 -6.92E-06 -7.62E-06 -8.80E-06 -1.34E-06 -9.09E-07 VegExp -1.69E-06 -3.03E-05 -2.72E-05 -3.16E-05 -4.62E-06 -2.96E-06 VegDom -2.01E-06 -2.50E-05 -2.40E-05 -2.77E-05 -4.17E-06 -2.67E-06 Pineapple -1.33E-06 -3.13E-05 -2.80E-05 -3.31E-05 -4.55E-06 -2.98E-06 Coconut -5.62E-07 -1.41E-05 -1.41E-05 -1.63E-05 -2.57E-06 -1.82E-06 FruitsExp -1.61E-06 -2.84E-05 -2.84E-05 -3.34E-05 -4.36E-06 -3.06E-06 FruitsDom -8.85E-07 -2.28E-05 -2.40E-05 -2.68E-05 -3.49E-06 -2.68E-06 Coffee -1.66E-06 -3.10E-05 -3.65E-05 -4.08E-05 -5.51E-06 -4.13E-06 Cocoa -1.66E-06 -3.27E-05 -3.51E-05 -3.94E-05 -5.41E-06 -4.11E-06 Sugar -6.28E-07 -1.35E-05 -1.42E-05 -1.56E-05 -2.31E-06 -1.54E-06 Tobacco -1.61E-06 -2.64E-05 -3.20E-05 -3.32E-05 -4.95E-06 -3.73E-06 Nuts -2.05E-06 -2.86E-05 -3.06E-05 -3.28E-05 -4.90E-06 -3.37E-06 Beef -2.60E-06 -4.57E-05 -3.91E-05 -4.70E-05 -6.56E-06 -3.96E-06 Poultry -2.51E-06 -4.64E-05 -4.38E-05 -5.31E-05 -6.92E-06 -4.55E-06 Sheep Meat -1.82E-06 -2.35E-05 -2.78E-05 -3.03E-05 -4.07E-06 -2.99E-06 Pork -9.74E-01 -2.53E-05 -2.20E-05 -3.11E-05 -4.36E-06 -2.75E-06 Other Meat -1.05E-06 -7.84E-01 -2.17E-05 -2.61E-05 -3.83E-06 -2.26E-06 Milk -1.55E-06 -3.66E-05 -1.27E+00 -4.24E-05 -5.74E-06 -4.10E-06 Eggs -1.75E-06 -3.53E-05 -3.39E-05 -1.18E+00 -5.35E-06 -3.67E-06 Fish -1.90E-06 -4.01E-05 -3.56E-05 -4.15E-05 -1.27E+00 -3.91E-06 CocoaPr -1.66E-06 -3.27E-05 -3.51E-05 -3.94E-05 -5.41E-06 -1.18E+00 FishPr -1.63E-06 -3.43E-05 -3.00E-05 -3.52E-05 -5.22E-06 -3.28E-06 OtherPr -1.99E-06 -3.72E-05 -3.61E-05 -4.14E-05 -5.68E-06 -3.83E-06 AgMfc -1.82E-06 -2.84E-05 -2.75E-05 -3.26E-05 -4.37E-06 -2.86E-06 Manufacturing -2.01E-06 -3.80E-05 -3.62E-05 -4.18E-05 -5.86E-06 -3.89E-06 Electric/Water -1.69E-06 -2.52E-05 -2.69E-05 -2.96E-05 -4.41E-06 -2.89E-06 Construction -1.23E-06 -3.16E-05 -2.82E-05 -3.28E-05 -4.52E-06 -2.99E-06 Trade -1.37E-06 -2.68E-05 -2.76E-05 -3.09E-05 -4.30E-06 -2.85E-06 Finance -1.19E-06 -2.60E-05 -2.90E-05 -3.29E-05 -4.03E-06 -3.05E-06 Government -1.03E-06 -2.72E-05 -2.49E-05 -2.86E-05 -4.31E-06 -2.82E-06 Community -2.12E-06 -2.81E-05 -2.63E-05 -3.10E-05 -4.50E-06 -2.77E-06

39
Table A4: Continued. FishPr OtherPr AgMfc Manufacturing Electric/Water Construction Maize -4.44E-07 -2.71E-06 -7.82E-06 -1.31E-04 -8.68E-06 -2.44E-05 Rice -1.72E-06 -1.14E-05 -3.04E-05 -5.24E-04 -2.94E-05 -1.16E-04 Wheat -1.63E-06 -1.11E-05 -3.09E-05 -5.10E-04 -2.67E-05 -1.11E-04 Sorghum/Millet -2.23E-07 -1.96E-06 -7.31E-06 -8.25E-05 -8.94E-06 -3.23E-07 Cassava -2.21E-07 -1.37E-06 -3.60E-06 -6.37E-05 -3.78E-06 -1.39E-05 Yam -4.40E-07 -2.81E-06 -7.50E-06 -1.28E-04 -7.78E-06 -2.77E-05 Cocoyam -2.27E-07 -1.39E-06 -3.60E-06 -6.54E-05 -2.97E-06 -1.64E-05 Plantains -2.18E-07 -1.37E-06 -3.83E-06 -6.39E-05 -3.18E-06 -1.44E-05 Groundnut -2.48E-06 -1.69E-05 -4.60E-05 -7.75E-04 -4.27E-05 -1.68E-04 Beans -6.10E-07 -4.33E-06 -1.28E-05 -1.99E-04 -1.40E-05 -3.27E-05 VegExp -2.12E-06 -1.38E-05 -3.70E-05 -6.38E-04 -3.41E-05 -1.41E-04 VegDom -1.90E-06 -1.25E-05 -3.46E-05 -5.80E-04 -3.49E-05 -1.17E-04 Pineapple -2.10E-06 -1.38E-05 -3.90E-05 -6.33E-04 -3.16E-05 -1.39E-04 Coconut -1.15E-06 -6.41E-06 -1.56E-05 -3.11E-04 -1.74E-05 -6.50E-05 FruitsExp -2.01E-06 -1.39E-05 -3.85E-05 -6.30E-04 -3.14E-05 -1.41E-04 FruitsDom -1.60E-06 -1.12E-05 -2.74E-05 -4.99E-04 -2.41E-05 -1.18E-04 Coffee -2.54E-06 -1.61E-05 -4.89E-05 -7.93E-04 -3.79E-05 -1.71E-04 Cocoa -2.47E-06 -1.64E-05 -4.33E-05 -7.60E-04 -3.99E-05 -1.65E-04 Sugar -1.05E-06 -6.92E-06 -1.91E-05 -3.23E-04 -1.95E-05 -6.54E-05 Tobacco -2.28E-06 -1.58E-05 -4.64E-05 -7.30E-04 -4.98E-05 -1.29E-04 Nuts -2.25E-06 -1.55E-05 -4.30E-05 -7.06E-04 -4.47E-05 -1.40E-04 Beef -3.03E-06 -2.06E-05 -6.02E-05 -9.54E-04 -4.91E-05 -2.11E-04 Poultry -3.20E-06 -2.19E-05 -6.20E-05 -1.02E-03 -5.04E-05 -2.27E-04 Sheep Meat -1.87E-06 -1.45E-05 -3.49E-05 -6.30E-04 -4.00E-05 -1.29E-04 Pork -2.04E-06 -1.42E-05 -4.58E-05 -6.52E-04 -3.87E-05 -1.12E-04 Other Meat -1.78E-06 -1.10E-05 -2.98E-05 -5.14E-04 -2.40E-05 -1.20E-04 Milk -2.63E-06 -1.81E-05 -4.87E-05 -8.25E-04 -4.34E-05 -1.81E-04 Eggs -2.46E-06 -1.66E-05 -4.60E-05 -7.63E-04 -3.81E-05 -1.69E-04 Fish -2.84E-06 -1.76E-05 -4.78E-05 -8.28E-04 -4.41E-05 -1.80E-04 CocoaPr -2.47E-06 -1.64E-05 -4.33E-05 -7.60E-04 -3.99E-05 -1.65E-04 FishPr -1.08E+00 -1.50E-05 -4.08E-05 -7.01E-04 -3.70E-05 -1.53E-04 OtherPr -2.62E-06 -1.27E+00 -4.99E-05 -8.22E-04 -4.56E-05 -1.78E-04 AgMfc -2.03E-06 -1.42E-05 -9.80E-01 -6.44E-04 -3.52E-05 -1.31E-04 Manufacturing -2.70E-06 -1.81E-05 -4.99E-05 -1.27E+00 -4.48E-05 -1.79E-04 Electric/Water -2.01E-06 -1.42E-05 -3.85E-05 -6.33E-04 -9.78E-01 -1.20E-04 Construction -2.08E-06 -1.39E-05 -3.60E-05 -6.36E-04 -2.99E-05 -9.81E-01 Trade -1.98E-06 -1.44E-05 -3.88E-05 -6.27E-04 -3.85E-05 -1.28E-04 Finance -1.85E-06 -1.44E-05 -3.75E-05 -6.00E-04 -3.18E-05 -1.36E-04 Government -1.97E-06 -1.18E-05 -3.00E-05 -5.57E-04 -2.93E-05 -1.25E-04 Community -2.07E-06 -1.41E-05 -4.05E-05 -6.41E-04 -3.77E-05 -1.30E-04

40
Table A4: Continued. Transport Trade Finance Government Community Maize -7.95E-06 -4.91E-05 -2.95E-05 -7.84E-05 -3.37E-05 Rice -4.42E-05 -1.87E-04 -1.73E-04 -3.20E-04 -1.23E-04 Wheat -4.86E-05 -1.83E-04 -1.94E-04 -3.17E-04 -1.14E-04 Sorghum/Millet -5.82E-08 -2.25E-05 -1.67E-07 -1.23E-06 -5.55E-05 Cassava -4.81E-06 -2.31E-05 -1.92E-05 -4.08E-05 -1.52E-05 Yam -9.31E-06 -4.71E-05 -3.79E-05 -7.60E-05 -3.21E-05 Cocoyam -4.69E-06 -2.17E-05 -1.71E-05 -3.94E-05 -1.59E-05 Plantains -5.64E-06 -2.23E-05 -2.21E-05 -4.04E-05 -1.47E-05 Groundnut -6.44E-05 -2.86E-04 -2.53E-04 -4.49E-04 -1.85E-04 Beans -1.23E-05 -7.56E-05 -4.66E-05 -9.28E-05 -6.00E-05 VegExp -5.47E-05 -2.25E-04 -2.17E-04 -3.98E-04 -1.50E-04 VegDom -4.37E-05 -2.09E-04 -1.73E-04 -3.37E-04 -1.50E-04 Pineapple -6.08E-05 -2.23E-04 -2.50E-04 -4.03E-04 -1.42E-04 Coconut -2.69E-05 -1.04E-04 -1.05E-04 -2.33E-04 -6.67E-05 FruitsExp -6.36E-05 -2.24E-04 -2.60E-04 -3.97E-04 -1.41E-04 FruitsDom -5.25E-05 -1.76E-04 -2.18E-04 -3.34E-04 -1.01E-04 Coffee -7.82E-05 -2.49E-04 -2.53E-04 -4.96E-04 -1.63E-04 Cocoa -7.41E-05 -2.65E-04 -2.92E-04 -4.96E-04 -1.63E-04 Sugar -2.55E-05 -1.20E-04 -1.01E-04 -1.94E-04 -7.71E-05 Tobacco -5.27E-05 -2.94E-04 -1.80E-04 -3.92E-04 -1.79E-04 Nuts -5.67E-05 -2.69E-04 -2.28E-04 -4.12E-04 -1.74E-04 Beef -7.72E-05 -3.29E-04 -2.92E-04 -5.18E-04 -2.36E-04 Poultry -9.78E-05 -3.49E-04 -3.85E-04 -6.48E-04 -2.27E-04 Sheep Meat -5.57E-05 -2.65E-04 -2.36E-04 -3.53E-04 -1.54E-04 Pork -5.03E-05 -2.12E-04 -1.89E-04 -3.16E-04 -2.07E-04 Other Meat -4.41E-05 -1.72E-04 -1.72E-04 -3.31E-04 -1.14E-04 Milk -7.94E-05 -2.99E-04 -3.23E-04 -5.18E-04 -1.81E-04 Eggs -7.37E-05 -2.68E-04 -2.93E-04 -4.79E-04 -1.71E-04 Fish -7.06E-05 -2.89E-04 -2.78E-04 -5.39E-04 -1.92E-04 CocoaPr -7.41E-05 -2.65E-04 -2.92E-04 -4.96E-04 -1.63E-04 FishPr -6.00E-05 -2.45E-04 -2.35E-04 -4.54E-04 -1.62E-04 OtherPr -7.57E-05 -3.12E-04 -3.20E-04 -4.90E-04 -1.94E-04 AgMfc -5.94E-05 -2.38E-04 -2.36E-04 -3.63E-04 -1.57E-04 Manufacturing -7.40E-05 -2.98E-04 -2.93E-04 -5.08E-04 -1.93E-04 Electric/Water -4.94E-05 -2.59E-04 -2.20E-04 -3.66E-04 -1.61E-04 Construction -5.97E-05 -2.16E-04 -2.36E-04 -4.05E-04 -1.39E-04 Trade -5.63E-05 -9.80E-01 -2.50E-04 -3.62E-04 -1.54E-04 Finance -7.06E-05 -2.43E-04 -9.83E-01 -3.81E-04 -1.33E-04 Government -4.99E-05 -1.90E-04 -1.99E-04 -8.75E-01 -1.20E-04 Community -5.18E-05 -2.43E-04 -2.15E-04 -3.60E-04 -9.78E-01

41
A3: Estimated and calculated elasticities in the supply functions Given the size and number of agricultural subsector in the model, it is impossible to estimate
supply elasticities using any data set available. Thus, the price elasticities in the yield function and direct
price elasticities in the area function are drawn from other studies and are chosen to be 0.2 for all sectors
across the 10 regions. Using this information, we calculate cross price elasticities in the area functions (or
supply function in the non-crop production) from the following equation:
,R R Rij j iis i jε ε= ⋅ ≠ ,
where 1
R RR i ii I R R
j jj
p xsp x
=
=∑
, and Rix is output of i in region R. R
ijε is constrained by the homogeneity
condition such that 1
0.I Rijjε
==∑ Considering land constraint in a given year, the supply elasticities in the
area function are further constrained by 1
0.CROP Rijiε
==∑ That is, if price for crop j falls, the aggregate
response of all crops in terms of area changes in region R should be zero, though the farming area for crop
j may fall and increase in the other crops. The price elasticities in the area functions (for the crops) and
supply functions (for the non-crops) are in table A5.

42
Table A5: Average price elasticity in area or supply function Maize Rice Sorghum/Millet Cassava Yam Maize 1.96E-01 -2.22E-03 -3.76E-03 -1.63E-02 -1.11E-02 Rice -5.80E-03 1.37E-01 -1.12E-02 -1.56E-02 -1.46E-02 Sorghum/Millet -5.71E-03 -8.37E-03 2.10E-01 -2.67E-03 -1.66E-02 Cassava -9.84E-03 -3.60E-03 -6.90E-04 1.35E-01 -1.65E-02 Yam -8.84E-03 -4.50E-03 -6.77E-03 -2.24E-02 1.69E-01 Cocoyam -8.32E-03 -7.00E-04 -1.16E-05 -1.46E-02 -8.86E-03 Plantains -8.12E-03 -1.31E-03 -1.19E-05 -1.58E-02 -1.24E-02 Groundnut -5.67E-03 -8.20E-03 -2.77E-02 -5.91E-03 -1.76E-02 Beans -6.85E-03 -9.91E-03 -3.21E-02 -4.27E-03 -2.14E-02 VegExp -6.90E-03 -9.45E-04 0.00E+00 -1.38E-02 -4.07E-03 VegDom -4.72E-03 -2.09E-03 -4.29E-03 -9.04E-03 -6.28E-03 Pineapple -9.26E-03 -1.05E-03 -1.56E-05 -1.85E-02 -5.83E-03 Coconut -5.81E-03 -7.95E-04 0.00E+00 -1.46E-02 -5.41E-04 FruitsExp -8.67E-03 -1.21E-03 -1.72E-05 -1.74E-02 -5.94E-03 FruitsDom -7.68E-03 -1.22E-03 -3.22E-05 -1.63E-02 -4.69E-03 Coffee -3.66E-03 -7.48E-04 0.00E+00 -6.34E-03 -9.41E-04 Cocoa bean -4.73E-03 -1.22E-03 -2.02E-05 -1.09E-02 -5.92E-03 Sugar -7.57E-03 -1.41E-03 -3.18E-04 -1.78E-02 -1.72E-02 Tobacco -4.33E-03 -5.15E-03 -1.24E-02 -9.50E-03 -8.52E-03 Nuts -7.83E-03 -4.14E-04 0.00E+00 -1.59E-02 -1.20E-02 Oil palm -7.09E-03 -1.30E-03 0.00E+00 -1.28E-02 -5.83E-03 Beef -5.27E-03 -4.20E-03 -1.05E-02 -2.64E-03 -4.34E-03 Poultry -1.71E-02 -2.82E-03 -6.28E-05 -4.83E-03 -1.06E-03 Sheep meat -5.43E-03 -4.15E-03 -1.04E-02 -2.68E-03 -4.70E-03 Pork -1.68E-02 -3.01E-03 -1.54E-04 -6.96E-03 -1.18E-03 Other meat -1.76E-02 -2.32E-03 -1.06E-04 -6.77E-03 -1.20E-03 Milk -7.07E-03 -5.08E-03 -7.86E-03 -5.08E-03 -6.73E-03 Eggs -1.42E-02 -5.76E-03 -6.36E-05 -5.61E-03 -1.06E-03 Fish -1.79E-02 -1.43E-03 -6.92E-04 -4.93E-03 -1.20E-03 CocoaPr 8.36E-05 7.91E-06 3.70E-07 6.14E-04 1.89E-04 FishPr 6.32E-05 5.20E-06 0.00E+00 4.88E-04 6.29E-05 OtherPr 5.58E-05 1.46E-05 2.59E-05 3.90E-04 1.14E-04 Cotton -5.27E-03 -1.32E-02 -3.55E-02 -4.69E-03 -1.66E-02 Rubber -6.45E-03 -1.02E-03 0.00E+00 -1.38E-02 -3.37E-03 Wood 0.00E+00 0.00E+00 0.00E+00 0.00E+00 0.00E+00 Mines -1.88E-03 -1.19E-04 -1.72E-07 -3.49E-04 -7.27E-05 AgMfc -1.75E-03 -1.84E-04 -6.46E-05 -3.49E-04 -1.11E-04 Manufacturing -1.81E-03 -1.23E-04 -6.92E-05 -2.39E-04 -9.18E-05 Electric/water -1.86E-03 -1.37E-04 -3.05E-06 -3.24E-04 -3.93E-05 Construction -1.84E-03 -1.53E-04 -5.96E-06 -4.01E-04 -8.71E-05 Transport -1.94E-03 -5.93E-05 -1.34E-06 -2.12E-04 -5.18E-05 Trade -1.77E-03 -1.54E-04 -7.84E-05 -3.43E-04 -1.11E-04 Finance -1.97E-03 -2.84E-05 -1.45E-06 -1.17E-04 -2.64E-05 Government -1.85E-03 -1.44E-04 -5.30E-06 -3.83E-04 -1.01E-04 Community -1.86E-03 -8.27E-05 -5.91E-05 -2.88E-04 -9.68E-05

43
Table A5: Continued. Cocoyam Plantains Groundnut Beans VegExp Maize -4.61E-03 -3.80E-03 -3.81E-03 -1.06E-03 -6.38E-05 Rice -1.40E-03 -1.87E-03 -1.26E-02 -3.07E-03 -2.06E-05 Sorghum/Millet -2.03E-06 -1.78E-07 -3.27E-02 -6.41E-03 0.00E+00 Cassava -5.35E-03 -4.76E-03 -1.92E-03 -3.58E-04 -1.08E-04 Yam -4.26E-03 -5.05E-03 -7.95E-03 -2.20E-03 -1.77E-05 Cocoyam 1.54E-01 -6.03E-03 -4.56E-04 0.00E+00 -1.44E-04 Plantains -7.50E-03 1.36E-01 -3.72E-04 0.00E+00 -6.22E-05 Groundnut -8.19E-04 -4.69E-04 1.52E-01 -5.69E-03 -6.62E-06 Beans 0.00E+00 0.00E+00 -2.90E-02 1.49E-01 0.00E+00 VegExp -3.18E-03 -2.52E-03 -1.16E-04 0.00E+00 1.54E-01 VegDom -3.53E-03 -2.57E-03 -4.34E-03 -5.60E-04 -2.78E-04 Pineapple -5.52E-03 -4.24E-03 -2.79E-04 0.00E+00 -1.94E-04 Coconut -3.02E-03 -2.36E-03 -5.43E-05 0.00E+00 -1.78E-04 FruitsExp -4.04E-03 -3.52E-03 -3.02E-04 0.00E+00 -3.72E-04 FruitsDom -5.02E-03 -4.66E-03 -3.24E-04 0.00E+00 -1.18E-04 Coffee -6.11E-03 -3.36E-03 -1.17E-03 0.00E+00 0.00E+00 Cocoa bean -5.88E-03 -7.34E-03 -3.51E-04 0.00E+00 -6.33E-06 Sugar -5.76E-03 -3.98E-03 -2.11E-03 -4.13E-05 -2.46E-05 Tobacco -1.91E-03 -1.88E-03 -1.06E-02 -2.56E-03 0.00E+00 Nuts -8.66E-03 -1.46E-02 -2.26E-05 0.00E+00 -7.15E-05 Oil palm -6.66E-03 -6.60E-03 -9.49E-06 0.00E+00 -2.96E-05 Beef -8.71E-05 -1.02E-04 -1.89E-03 -8.59E-04 0.00E+00 Poultry -1.08E-03 -1.24E-03 -6.99E-05 0.00E+00 0.00E+00 Sheep meat -7.93E-05 -8.97E-05 -1.79E-03 -8.26E-04 0.00E+00 Pork -1.46E-03 -1.79E-03 -5.55E-05 0.00E+00 0.00E+00 Other meat -1.69E-03 -1.96E-03 -8.20E-05 0.00E+00 0.00E+00 Milk -1.62E-04 -1.96E-04 -6.99E-04 -6.05E-04 0.00E+00 Eggs -1.09E-03 -1.26E-03 -1.28E-04 0.00E+00 0.00E+00 Fish -7.36E-04 -1.08E-03 -1.12E-04 -5.14E-05 0.00E+00 CocoaPr 1.68E-04 1.77E-04 9.11E-06 0.00E+00 1.05E-06 FishPr 7.53E-05 1.16E-04 8.36E-07 0.00E+00 9.54E-06 OtherPr 9.17E-05 1.02E-04 2.22E-05 7.78E-06 7.79E-06 Cotton 0.00E+00 0.00E+00 -3.15E-02 -7.87E-03 0.00E+00 Rubber -3.92E-03 -4.96E-03 -1.43E-04 0.00E+00 -2.38E-04 Wood 0.00E+00 0.00E+00 0.00E+00 0.00E+00 0.00E+00 Mines -1.78E-04 -1.81E-04 -6.52E-06 0.00E+00 -2.92E-05 AgMfc -9.84E-05 -1.14E-04 -2.26E-05 -6.39E-06 -2.61E-04 Manufacturing -5.70E-05 -6.73E-05 -9.68E-06 -5.30E-06 -3.42E-04 Electric/water -9.18E-05 -1.08E-04 -4.28E-06 0.00E+00 -1.72E-04 Construction -1.01E-04 -1.09E-04 -5.83E-06 0.00E+00 -1.98E-04 Transport -7.37E-05 -6.86E-05 -3.98E-06 0.00E+00 -2.67E-04 Trade -8.25E-05 -8.63E-05 -2.13E-05 -6.37E-06 -1.86E-04 Finance -5.23E-05 -4.62E-05 -2.93E-06 0.00E+00 -2.57E-04 Government -8.62E-05 -1.03E-04 -4.82E-06 0.00E+00 -2.29E-04 Community -8.53E-05 -8.53E-05 -2.22E-05 -6.50E-06 -2.00E-04

44
Table A5: Continued. VegDom Pineapple Coconut FruitsExp FruitsDom Maize -1.10E-03 -6.03E-04 -1.84E-03 -5.41E-04 -2.91E-04 Rice -1.55E-03 -3.78E-04 -7.96E-04 -4.22E-04 -1.48E-04 Sorghum/Millet -1.38E-03 -3.79E-06 0.00E+00 -5.07E-06 -4.93E-06 Cassava -1.16E-03 -1.13E-03 -3.06E-03 -1.27E-03 -4.20E-04 Yam -1.10E-03 -3.48E-04 -1.87E-04 -4.42E-04 -1.17E-04 Cocoyam -7.38E-04 -7.86E-04 -1.56E-03 -6.07E-04 -2.99E-04 Plantains -5.88E-04 -7.92E-04 -1.50E-03 -7.21E-04 -2.33E-04 Groundnut -1.96E-03 -8.25E-05 -6.06E-05 -6.46E-05 -6.67E-05 Beans -1.64E-03 0.00E+00 0.00E+00 0.00E+00 0.00E+00 VegExp -3.71E-03 -1.36E-03 -3.11E-03 -1.77E-03 -2.16E-04 VegDom 1.53E-01 -1.08E-03 -6.59E-04 -9.79E-04 -2.35E-04 Pineapple -2.96E-03 1.62E-01 -5.44E-03 -1.84E-03 -3.60E-04 Coconut -4.24E-04 -1.90E-03 1.46E-01 -1.63E-03 -6.65E-04 FruitsExp -2.08E-03 -1.60E-03 -3.84E-03 1.53E-01 -2.86E-04 FruitsDom -1.30E-03 -1.45E-03 -4.28E-03 -1.15E-03 1.59E-01 Coffee -6.17E-04 -2.38E-04 -5.64E-04 -2.77E-04 -4.06E-04 Cocoa bean -5.82E-04 -2.99E-04 -3.33E-03 -2.51E-04 -4.19E-04 Sugar -1.17E-03 -4.00E-04 -1.11E-03 -4.00E-04 -2.49E-04 Tobacco -1.50E-03 -1.62E-04 -1.78E-03 -1.99E-04 -3.04E-04 Nuts -1.89E-04 -2.35E-03 -6.92E-03 -1.46E-03 -3.63E-04 Oil palm -3.00E-04 -8.43E-04 -2.50E-03 -7.55E-04 -4.79E-04 Beef 0.00E+00 0.00E+00 0.00E+00 0.00E+00 0.00E+00 Poultry 0.00E+00 0.00E+00 0.00E+00 0.00E+00 0.00E+00 Sheep meat 0.00E+00 0.00E+00 0.00E+00 0.00E+00 0.00E+00 Pork 0.00E+00 0.00E+00 0.00E+00 0.00E+00 0.00E+00 Other meat 0.00E+00 0.00E+00 0.00E+00 0.00E+00 0.00E+00 Milk 0.00E+00 0.00E+00 0.00E+00 0.00E+00 0.00E+00 Eggs 0.00E+00 0.00E+00 0.00E+00 0.00E+00 0.00E+00 Fish 0.00E+00 0.00E+00 0.00E+00 0.00E+00 0.00E+00 CocoaPr 3.30E-05 7.00E-06 1.09E-05 8.80E-06 7.56E-06 FishPr 5.49E-05 1.35E-05 4.16E-05 1.95E-05 1.28E-05 OtherPr 6.66E-05 1.01E-05 1.37E-05 1.51E-05 7.57E-06 Cotton -2.64E-03 0.00E+00 0.00E+00 0.00E+00 0.00E+00 Rubber -3.40E-04 -7.48E-04 -7.45E-03 -8.05E-04 -4.35E-04 Wood 0.00E+00 0.00E+00 0.00E+00 0.00E+00 0.00E+00 Mines -4.11E-03 -2.22E-03 -2.98E-03 -2.67E-03 -6.84E-04 AgMfc -4.20E-03 -1.89E-03 -9.64E-04 -2.25E-03 -8.74E-04 Manufacturing -3.97E-03 -7.91E-04 -2.67E-04 -1.15E-03 -6.05E-04 Electric/water -5.42E-03 -1.38E-03 -1.29E-03 -2.32E-03 -6.00E-04 Construction -5.44E-03 -1.53E-03 -1.02E-03 -2.08E-03 -8.55E-04 Transport -3.34E-03 -1.51E-03 -9.39E-04 -1.92E-03 -4.27E-04 Trade -4.99E-03 -1.43E-03 -1.03E-03 -1.75E-03 -7.14E-04 Finance -3.00E-03 -1.23E-03 -2.92E-04 -1.69E-03 -1.38E-04 Government -4.92E-03 -1.54E-03 -1.11E-03 -2.16E-03 -8.04E-04 Community -5.11E-03 -1.96E-03 -6.99E-04 -2.74E-03 -4.13E-04

45
Table A5: Continued. Coffee Cocoa bean Sugar Tobacco Nuts Maize -4.64E-06 -6.70E-03 -3.31E-05 -1.03E-04 -4.49E-05 Rice -1.43E-05 -6.25E-03 -3.21E-05 -1.52E-04 -1.92E-05 Sorghum/Millet 0.00E+00 -7.22E-05 -6.30E-06 -2.31E-04 0.00E+00 Cassava -2.29E-05 -9.30E-03 -2.33E-05 -7.57E-05 -5.72E-05 Yam -1.79E-05 -7.13E-03 -4.36E-05 -1.28E-04 -2.07E-05 Cocoyam -9.22E-05 -1.40E-02 -7.80E-05 -1.14E-04 -8.06E-05 Plantains -6.79E-05 -2.03E-02 -7.73E-05 -1.18E-04 -1.10E-04 Groundnut -1.72E-05 -1.35E-03 -2.61E-05 -2.54E-04 -5.92E-07 Beans 0.00E+00 0.00E+00 -3.86E-06 -4.02E-04 0.00E+00 VegExp 0.00E+00 -1.88E-03 -1.57E-05 0.00E+00 -9.04E-05 VegDom -6.90E-06 -6.53E-03 -4.12E-05 -1.76E-04 -1.66E-05 Pineapple -1.84E-05 -4.01E-03 -2.85E-05 -1.87E-05 -1.16E-04 Coconut -1.12E-05 -1.46E-02 -3.53E-05 -7.78E-05 -4.46E-05 FruitsExp -1.81E-05 -3.07E-03 -2.83E-05 -1.90E-05 -4.92E-05 FruitsDom -6.39E-05 -1.77E-02 -4.87E-05 -1.48E-04 -1.09E-04 Coffee 1.69E-01 -1.67E-02 -1.44E-04 -3.14E-04 -4.13E-05 Cocoa bean -1.17E-04 1.22E-01 -6.19E-05 -1.17E-04 -6.14E-05 Sugar -1.09E-04 -9.22E-03 1.70E-01 -1.28E-04 -3.26E-05 Tobacco -8.61E-05 -1.19E-02 -1.15E-04 1.68E-01 -3.91E-05 Nuts -3.33E-05 -3.00E-02 -2.85E-05 -1.27E-04 1.52E-01 Oil palm -9.79E-05 -2.26E-02 -4.49E-05 -1.83E-04 -1.18E-04 Beef 0.00E+00 0.00E+00 0.00E+00 0.00E+00 0.00E+00 Poultry 0.00E+00 0.00E+00 0.00E+00 0.00E+00 0.00E+00 Sheep meat 0.00E+00 0.00E+00 0.00E+00 0.00E+00 0.00E+00 Pork 0.00E+00 0.00E+00 0.00E+00 0.00E+00 0.00E+00 Other meat 0.00E+00 0.00E+00 0.00E+00 0.00E+00 0.00E+00 Milk 0.00E+00 0.00E+00 0.00E+00 0.00E+00 0.00E+00 Eggs 0.00E+00 0.00E+00 0.00E+00 0.00E+00 0.00E+00 Fish 0.00E+00 0.00E+00 0.00E+00 0.00E+00 0.00E+00 CocoaPr 3.52E-07 2.00E-02 1.41E-06 7.39E-08 7.29E-07 FishPr 3.51E-08 3.20E-05 2.87E-07 2.17E-08 1.97E-06 OtherPr 1.84E-07 2.15E-05 7.46E-07 6.63E-08 6.64E-07 Cotton 0.00E+00 0.00E+00 -2.10E-06 -2.50E-04 0.00E+00 Rubber -4.26E-05 -2.74E-02 -2.41E-05 -2.26E-04 -1.65E-04 Wood 0.00E+00 0.00E+00 0.00E+00 0.00E+00 0.00E+00 Mines -4.56E-05 -6.09E-03 -3.97E-04 -6.67E-06 -3.87E-05 AgMfc -1.23E-05 -2.66E-03 -2.47E-04 -1.49E-05 -3.70E-05 Manufacturing -1.71E-05 -1.18E-03 -7.71E-05 -2.44E-05 -9.40E-06 Electric/water -1.40E-05 -2.54E-03 -2.23E-04 -4.89E-06 -7.24E-05 Construction -2.38E-05 -2.81E-03 -2.71E-04 -8.49E-06 -3.04E-05 Transport -9.33E-06 -1.78E-03 -2.15E-04 -2.42E-06 -7.20E-06 Trade -1.81E-05 -2.38E-03 -2.55E-04 -1.73E-05 -4.12E-05 Finance -9.37E-06 -1.29E-03 -1.81E-04 -2.38E-06 -2.38E-05 Government -6.43E-06 -2.63E-03 -2.67E-04 -6.06E-06 -4.34E-05 Community -5.54E-06 -1.92E-03 -3.39E-04 -6.99E-06 -3.67E-05

46
Table A5: Continued. Oil palm Beef Poultry Sheep meat Pork Maize -5.13E-05 -1.38E-02 -1.38E-02 -1.38E-02 -1.38E-02 Rice -4.48E-05 -4.91E-03 -4.91E-03 -4.91E-03 -4.91E-03 Sorghum/Millet 0.00E+00 -1.07E-02 -1.07E-02 -1.07E-02 -1.07E-02 Cassava -2.48E-05 -6.71E-03 -6.71E-03 -6.71E-03 -6.71E-03 Yam -5.30E-05 -4.05E-03 -4.05E-03 -4.05E-03 -4.05E-03 Cocoyam -1.27E-04 -2.94E-04 -2.94E-04 -2.94E-04 -2.94E-04 Plantains -1.26E-04 -1.19E-03 -1.19E-03 -1.19E-03 -1.19E-03 Groundnut -8.81E-06 -1.02E-03 -1.02E-03 -1.02E-03 -1.02E-03 Beans 0.00E+00 -4.36E-04 -4.36E-04 -4.36E-04 -4.36E-04 VegExp -1.08E-04 0.00E+00 0.00E+00 0.00E+00 0.00E+00 VegDom -4.49E-05 0.00E+00 0.00E+00 0.00E+00 0.00E+00 Pineapple -1.18E-04 0.00E+00 0.00E+00 0.00E+00 0.00E+00 Coconut -9.53E-05 0.00E+00 0.00E+00 0.00E+00 0.00E+00 FruitsExp -8.63E-05 0.00E+00 0.00E+00 0.00E+00 0.00E+00 FruitsDom -1.75E-04 0.00E+00 0.00E+00 0.00E+00 0.00E+00 Coffee -2.09E-04 0.00E+00 0.00E+00 0.00E+00 0.00E+00 Cocoa bean -8.45E-05 0.00E+00 0.00E+00 0.00E+00 0.00E+00 Sugar -7.46E-05 0.00E+00 0.00E+00 0.00E+00 0.00E+00 Tobacco -1.02E-04 0.00E+00 0.00E+00 0.00E+00 0.00E+00 Nuts -1.69E-04 0.00E+00 0.00E+00 0.00E+00 0.00E+00 Oil palm 1.54E-01 0.00E+00 0.00E+00 0.00E+00 0.00E+00 Beef 0.00E+00 4.85E-02 -1.64E-04 -5.27E-03 0.00E+00 Poultry 0.00E+00 -5.98E-05 4.81E-02 -6.72E-05 -4.74E-04 Sheep meat 0.00E+00 -4.29E-03 -1.50E-04 4.85E-02 0.00E+00 Pork 0.00E+00 0.00E+00 -2.81E-03 0.00E+00 5.14E-02 Other meat 0.00E+00 -4.36E-05 -2.91E-03 -1.08E-04 -7.23E-04 Milk 0.00E+00 -1.64E-03 -3.03E-04 -2.02E-03 0.00E+00 Eggs 0.00E+00 -6.12E-05 -3.80E-03 -6.69E-05 -4.76E-04 Fish 0.00E+00 -2.45E-04 -2.08E-03 -3.10E-04 -3.32E-04 CocoaPr 2.63E-06 1.68E-07 7.39E-06 2.86E-07 1.69E-06 FishPr 2.10E-06 0.00E+00 1.26E-05 0.00E+00 1.45E-06 OtherPr 1.64E-06 2.42E-06 1.32E-05 2.81E-06 1.16E-06 Cotton 0.00E+00 0.00E+00 0.00E+00 0.00E+00 0.00E+00 Rubber -2.40E-04 0.00E+00 0.00E+00 0.00E+00 0.00E+00 Wood 0.00E+00 0.00E+00 0.00E+00 0.00E+00 0.00E+00 Mines -4.13E-04 0.00E+00 -2.84E-04 0.00E+00 -6.86E-05 AgMfc -3.13E-04 -5.79E-05 -2.53E-04 -5.92E-05 -3.99E-05 Manufacturing -1.96E-04 -1.90E-05 -2.98E-04 -2.24E-05 -2.40E-05 Electric/water -1.42E-04 -4.01E-07 -2.71E-04 -9.97E-07 -3.35E-05 Construction -2.13E-04 -3.84E-06 -2.87E-04 -6.30E-06 -4.45E-05 Transport -1.44E-04 -1.54E-06 -2.95E-04 -2.83E-06 -3.25E-05 Trade -1.96E-04 -4.58E-05 -2.68E-04 -6.22E-05 -3.27E-05 Finance -1.08E-04 0.00E+00 -3.29E-04 0.00E+00 -1.75E-05 Government -1.71E-04 -6.24E-06 -2.57E-04 -8.70E-06 -3.99E-05 Community -1.35E-04 -5.23E-05 -2.47E-04 -5.94E-05 -2.64E-05

47
Table A5: Continued. Other meat Milk Eggs Fish CocoaPr Maize -1.38E-02 -1.38E-02 -1.38E-02 -1.38E-02 0.00E+00 Rice -4.91E-03 -4.91E-03 -4.91E-03 -4.91E-03 0.00E+00 Sorghum/Millet -1.07E-02 -1.07E-02 -1.07E-02 -1.07E-02 0.00E+00 Cassava -6.71E-03 -6.71E-03 -6.71E-03 -6.71E-03 0.00E+00 Yam -4.05E-03 -4.05E-03 -4.05E-03 -4.05E-03 0.00E+00 Cocoyam -2.94E-04 -2.94E-04 -2.94E-04 -2.94E-04 0.00E+00 Plantains -1.19E-03 -1.19E-03 -1.19E-03 -1.19E-03 0.00E+00 Groundnut -1.02E-03 -1.02E-03 -1.02E-03 -1.02E-03 0.00E+00 Beans -4.36E-04 -4.36E-04 -4.36E-04 -4.36E-04 0.00E+00 VegExp 0.00E+00 0.00E+00 0.00E+00 0.00E+00 0.00E+00 VegDom 0.00E+00 0.00E+00 0.00E+00 0.00E+00 0.00E+00 Pineapple 0.00E+00 0.00E+00 0.00E+00 0.00E+00 0.00E+00 Coconut 0.00E+00 0.00E+00 0.00E+00 0.00E+00 0.00E+00 FruitsExp 0.00E+00 0.00E+00 0.00E+00 0.00E+00 0.00E+00 FruitsDom 0.00E+00 0.00E+00 0.00E+00 0.00E+00 0.00E+00 Coffee 0.00E+00 0.00E+00 0.00E+00 0.00E+00 0.00E+00 Cocoa bean 0.00E+00 0.00E+00 0.00E+00 0.00E+00 2.00E-02 Sugar 0.00E+00 0.00E+00 0.00E+00 0.00E+00 0.00E+00 Tobacco 0.00E+00 0.00E+00 0.00E+00 0.00E+00 0.00E+00 Nuts 0.00E+00 0.00E+00 0.00E+00 0.00E+00 0.00E+00 Oil palm 0.00E+00 0.00E+00 0.00E+00 0.00E+00 0.00E+00 Beef -1.72E-04 -6.90E-03 -1.36E-04 -2.70E-03 0.00E+00 Poultry -4.18E-03 -4.65E-04 -3.08E-03 -8.37E-03 0.00E+00 Sheep meat -3.48E-04 -6.92E-03 -1.21E-04 -2.77E-03 0.00E+00 Pork -6.16E-03 0.00E+00 -2.28E-03 -7.90E-03 0.00E+00 Other meat 5.11E-02 0.00E+00 -2.37E-03 -3.63E-03 0.00E+00 Milk 0.00E+00 4.94E-02 -2.56E-04 -1.86E-03 0.00E+00 Eggs -4.21E-03 -4.86E-04 4.86E-02 -4.45E-03 0.00E+00 Fish -1.30E-03 -7.12E-04 -8.97E-04 2.69E-02 0.00E+00 CocoaPr 1.65E-05 7.56E-07 5.78E-06 2.22E-05 2.00E-01 FishPr 8.73E-06 0.00E+00 6.23E-06 1.88E-02 1.26E-06 OtherPr 9.11E-06 6.45E-06 6.70E-06 5.57E-05 2.54E-06 Cotton 0.00E+00 0.00E+00 0.00E+00 0.00E+00 0.00E+00 Rubber 0.00E+00 0.00E+00 0.00E+00 0.00E+00 0.00E+00 Wood 0.00E+00 0.00E+00 0.00E+00 0.00E+00 0.00E+00 Mines -3.62E-04 0.00E+00 -2.14E-04 -1.07E-03 -6.83E-06 AgMfc -2.19E-04 -5.27E-05 -1.31E-04 -1.19E-03 -3.90E-06 Manufacturing -2.05E-04 -9.93E-05 -8.59E-05 -1.25E-03 -1.35E-06 Electric/water -3.59E-04 0.00E+00 -1.43E-04 -1.19E-03 -4.10E-06 Construction -4.02E-04 -1.86E-05 -1.63E-04 -1.07E-03 -3.82E-06 Transport -1.46E-04 -5.78E-06 -1.09E-04 -1.41E-03 -3.56E-06 Trade -2.73E-04 -7.73E-05 -1.36E-04 -1.11E-03 -3.26E-06 Finance -9.44E-05 0.00E+00 -7.12E-05 -1.49E-03 -2.82E-06 Government -2.99E-04 -3.90E-05 -1.23E-04 -1.23E-03 -3.78E-06 Community -3.00E-04 -3.46E-05 -1.02E-04 -1.18E-03 -4.78E-06
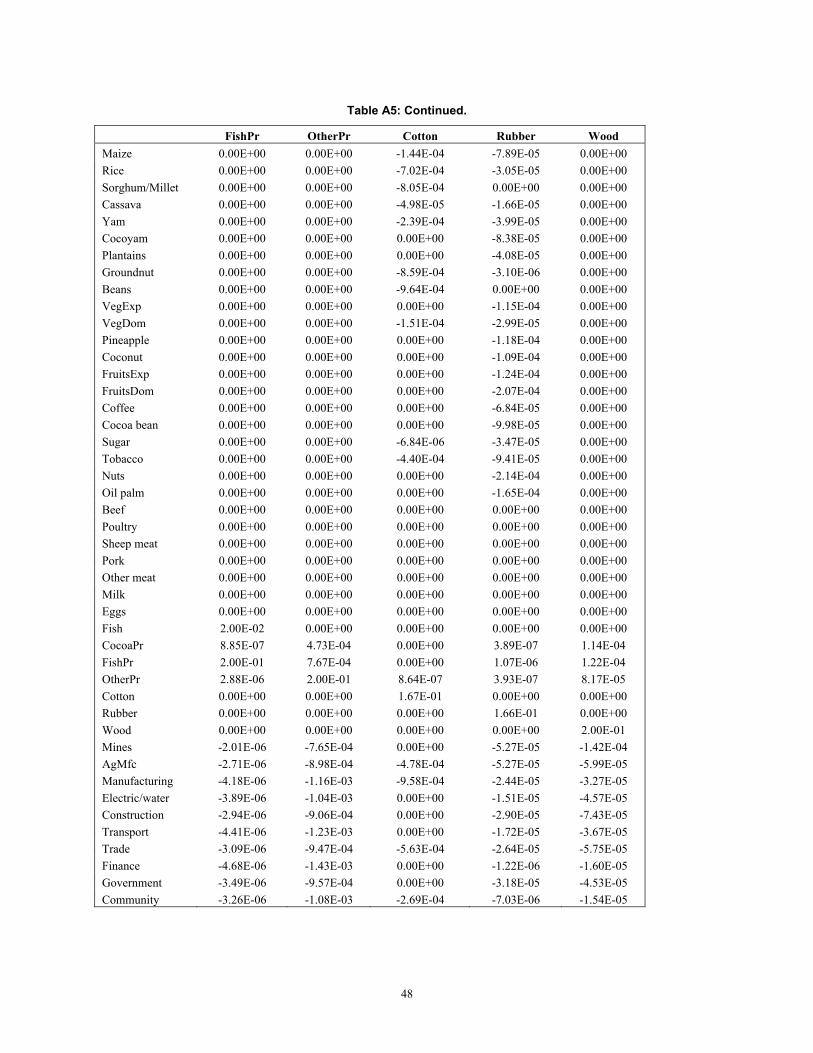
48
Table A5: Continued. FishPr OtherPr Cotton Rubber Wood Maize 0.00E+00 0.00E+00 -1.44E-04 -7.89E-05 0.00E+00 Rice 0.00E+00 0.00E+00 -7.02E-04 -3.05E-05 0.00E+00 Sorghum/Millet 0.00E+00 0.00E+00 -8.05E-04 0.00E+00 0.00E+00 Cassava 0.00E+00 0.00E+00 -4.98E-05 -1.66E-05 0.00E+00 Yam 0.00E+00 0.00E+00 -2.39E-04 -3.99E-05 0.00E+00 Cocoyam 0.00E+00 0.00E+00 0.00E+00 -8.38E-05 0.00E+00 Plantains 0.00E+00 0.00E+00 0.00E+00 -4.08E-05 0.00E+00 Groundnut 0.00E+00 0.00E+00 -8.59E-04 -3.10E-06 0.00E+00 Beans 0.00E+00 0.00E+00 -9.64E-04 0.00E+00 0.00E+00 VegExp 0.00E+00 0.00E+00 0.00E+00 -1.15E-04 0.00E+00 VegDom 0.00E+00 0.00E+00 -1.51E-04 -2.99E-05 0.00E+00 Pineapple 0.00E+00 0.00E+00 0.00E+00 -1.18E-04 0.00E+00 Coconut 0.00E+00 0.00E+00 0.00E+00 -1.09E-04 0.00E+00 FruitsExp 0.00E+00 0.00E+00 0.00E+00 -1.24E-04 0.00E+00 FruitsDom 0.00E+00 0.00E+00 0.00E+00 -2.07E-04 0.00E+00 Coffee 0.00E+00 0.00E+00 0.00E+00 -6.84E-05 0.00E+00 Cocoa bean 0.00E+00 0.00E+00 0.00E+00 -9.98E-05 0.00E+00 Sugar 0.00E+00 0.00E+00 -6.84E-06 -3.47E-05 0.00E+00 Tobacco 0.00E+00 0.00E+00 -4.40E-04 -9.41E-05 0.00E+00 Nuts 0.00E+00 0.00E+00 0.00E+00 -2.14E-04 0.00E+00 Oil palm 0.00E+00 0.00E+00 0.00E+00 -1.65E-04 0.00E+00 Beef 0.00E+00 0.00E+00 0.00E+00 0.00E+00 0.00E+00 Poultry 0.00E+00 0.00E+00 0.00E+00 0.00E+00 0.00E+00 Sheep meat 0.00E+00 0.00E+00 0.00E+00 0.00E+00 0.00E+00 Pork 0.00E+00 0.00E+00 0.00E+00 0.00E+00 0.00E+00 Other meat 0.00E+00 0.00E+00 0.00E+00 0.00E+00 0.00E+00 Milk 0.00E+00 0.00E+00 0.00E+00 0.00E+00 0.00E+00 Eggs 0.00E+00 0.00E+00 0.00E+00 0.00E+00 0.00E+00 Fish 2.00E-02 0.00E+00 0.00E+00 0.00E+00 0.00E+00 CocoaPr 8.85E-07 4.73E-04 0.00E+00 3.89E-07 1.14E-04 FishPr 2.00E-01 7.67E-04 0.00E+00 1.07E-06 1.22E-04 OtherPr 2.88E-06 2.00E-01 8.64E-07 3.93E-07 8.17E-05 Cotton 0.00E+00 0.00E+00 1.67E-01 0.00E+00 0.00E+00 Rubber 0.00E+00 0.00E+00 0.00E+00 1.66E-01 0.00E+00 Wood 0.00E+00 0.00E+00 0.00E+00 0.00E+00 2.00E-01 Mines -2.01E-06 -7.65E-04 0.00E+00 -5.27E-05 -1.42E-04 AgMfc -2.71E-06 -8.98E-04 -4.78E-04 -5.27E-05 -5.99E-05 Manufacturing -4.18E-06 -1.16E-03 -9.58E-04 -2.44E-05 -3.27E-05 Electric/water -3.89E-06 -1.04E-03 0.00E+00 -1.51E-05 -4.57E-05 Construction -2.94E-06 -9.06E-04 0.00E+00 -2.90E-05 -7.43E-05 Transport -4.41E-06 -1.23E-03 0.00E+00 -1.72E-05 -3.67E-05 Trade -3.09E-06 -9.47E-04 -5.63E-04 -2.64E-05 -5.75E-05 Finance -4.68E-06 -1.43E-03 0.00E+00 -1.22E-06 -1.60E-05 Government -3.49E-06 -9.57E-04 0.00E+00 -3.18E-05 -4.53E-05 Community -3.26E-06 -1.08E-03 -2.69E-04 -7.03E-06 -1.54E-05

49
Table A5: Continued. Mines AgMfc Manufacturing Electric/water Construction Maize -4.01E-04 -5.36E-04 -5.39E-04 -2.70E-04 -5.27E-04 Rice -9.72E-05 -1.84E-04 -1.84E-04 -1.21E-04 -1.37E-04 Sorghum/Millet -1.91E-04 -4.46E-04 -4.46E-04 -1.91E-04 -1.91E-04 Cassava -1.66E-04 -2.31E-04 -2.29E-04 -1.50E-04 -2.34E-04 Yam -1.60E-04 -1.79E-04 -1.76E-04 -1.63E-04 -1.90E-04 Cocoyam -9.68E-05 -1.07E-04 -1.03E-04 -8.69E-05 -1.07E-04 Plantains -1.27E-04 -1.35E-04 -1.39E-04 -7.31E-05 -1.35E-04 Groundnut -8.71E-05 -8.06E-05 -8.03E-05 -8.75E-05 -8.79E-05 Beans -4.36E-05 -7.85E-05 -7.85E-05 -4.36E-05 -4.36E-05 VegExp -5.89E-04 -5.23E-04 -5.23E-04 -5.69E-04 -5.23E-04 VegDom -8.38E-03 -9.99E-03 -9.94E-03 -8.18E-03 -9.28E-03 Pineapple -1.31E-03 -1.61E-03 -1.61E-03 -9.03E-04 -1.61E-03 Coconut -6.30E-03 -6.42E-03 -6.39E-03 -4.07E-03 -6.39E-03 FruitsExp -1.03E-03 -1.51E-03 -1.45E-03 -8.70E-04 -1.50E-03 FruitsDom -7.25E-04 -1.10E-03 -1.14E-03 -5.49E-04 -1.14E-03 Coffee -1.43E-04 -1.43E-04 -1.43E-04 -1.42E-04 -1.43E-04 Cocoa bean -6.75E-03 -7.02E-03 -7.02E-03 -3.75E-03 -7.02E-03 Sugar -3.27E-04 -3.70E-04 -3.49E-04 -3.56E-04 -3.70E-04 Tobacco -5.12E-05 -7.02E-05 -7.06E-05 -5.40E-05 -5.47E-05 Nuts -1.30E-04 -1.31E-04 -1.38E-04 -6.57E-05 -1.38E-04 Oil palm -4.52E-04 -3.84E-04 -3.84E-04 -3.48E-04 -3.84E-04 Beef -2.33E-04 -4.63E-04 -4.63E-04 -2.33E-04 -2.36E-04 Poultry -3.07E-04 -3.27E-04 -3.29E-04 -2.79E-04 -3.31E-04 Sheep meat -2.70E-04 -5.14E-04 -5.13E-04 -2.71E-04 -2.73E-04 Pork -7.20E-05 -8.46E-05 -8.40E-05 -7.46E-05 -8.46E-05 Other meat -7.74E-04 -1.02E-03 -8.38E-04 -9.70E-04 -1.02E-03 Milk -6.96E-04 -1.39E-03 -1.39E-03 -6.96E-04 -7.45E-04 Eggs -5.97E-04 -6.14E-04 -6.44E-04 -4.10E-04 -6.45E-04 Fish -9.66E-04 -1.41E-03 -1.41E-03 -1.04E-03 -1.40E-03 CocoaPr -3.41E-04 -1.99E-05 -6.31E-06 -3.95E-05 -1.45E-04 FishPr -1.47E-04 -2.29E-05 -1.42E-05 -6.13E-05 -1.45E-04 OtherPr -2.05E-04 -2.42E-05 -1.53E-05 -5.29E-05 -1.50E-04 Cotton -3.38E-03 -7.34E-03 -7.34E-03 -3.38E-03 -3.38E-03 Rubber -1.87E-04 -2.05E-04 -2.05E-04 -1.09E-04 -2.05E-04 Wood 0.00E+00 0.00E+00 0.00E+00 0.00E+00 0.00E+00 Mines 5.99E-02 -1.31E-03 -2.64E-04 -2.34E-03 -7.73E-03 AgMfc -1.56E-02 8.38E-02 -1.05E-03 -2.62E-03 -8.65E-03 Manufacturing -6.20E-03 -2.07E-03 7.96E-02 -3.20E-03 -9.44E-03 Electric/water -1.22E-02 -1.15E-03 -7.10E-04 7.86E-02 -1.04E-02 Construction -1.43E-02 -1.34E-03 -7.42E-04 -3.70E-03 7.36E-02 Transport -1.36E-02 -1.35E-03 -8.97E-04 -3.11E-03 -9.20E-03 Trade -1.23E-02 -1.83E-03 -1.02E-03 -3.13E-03 -9.46E-03 Finance -9.01E-03 -1.32E-03 -1.12E-03 -3.72E-03 -8.89E-03 Government -1.12E-02 -1.43E-03 -7.53E-04 -3.85E-03 -1.06E-02 Community -1.18E-02 -1.77E-03 -8.02E-04 -3.76E-03 -8.98E-03

50
Table A5: Continued.
Transport Trade Finance Government Community Maize -5.43E-04 -5.37E-04 -2.95E-04 -2.32E-02 -5.37E-04 Rice -1.37E-04 -1.85E-04 -9.40E-05 -1.97E-02 -1.85E-04 Sorghum/Millet -1.91E-04 -4.48E-04 -1.91E-04 -4.66E-02 -4.48E-04 Cassava -1.93E-04 -2.32E-04 -1.37E-04 -2.02E-02 -2.32E-04 Yam -1.90E-04 -1.79E-04 -1.49E-04 -6.33E-02 -1.79E-04 Cocoyam -1.03E-04 -1.07E-04 -9.43E-05 -9.26E-02 -1.07E-04 Plantains -1.31E-04 -1.35E-04 -1.00E-04 -5.54E-02 -1.35E-04 Groundnut -8.76E-05 -8.23E-05 -8.70E-05 -6.64E-02 -8.23E-05 Beans -4.36E-05 -7.90E-05 -4.36E-05 -3.89E-02 -7.90E-05 VegExp -5.23E-04 -5.23E-04 -5.69E-04 -1.05E-01 -5.23E-04 VegDom -9.07E-03 -1.00E-02 -7.92E-03 -2.27E-02 -1.00E-02 Pineapple -1.61E-03 -1.61E-03 -8.99E-04 -8.92E-02 -1.61E-03 Coconut -6.42E-03 -6.42E-03 -3.56E-03 -4.66E-02 -6.42E-03 FruitsExp -1.51E-03 -1.51E-03 -8.62E-04 -8.82E-02 -1.51E-03 FruitsDom -1.10E-03 -1.14E-03 -5.74E-04 -8.35E-02 -1.14E-03 Coffee -1.43E-04 -1.43E-04 -1.43E-04 -1.26E-01 -1.43E-04 Cocoa bean -6.90E-03 -7.02E-03 -6.59E-03 -4.14E-02 -7.02E-03 Sugar -3.06E-04 -3.70E-04 -3.29E-04 -9.81E-02 -3.70E-04 Tobacco -5.43E-05 -7.02E-05 -5.09E-05 -9.39E-02 -7.02E-05 Nuts -1.31E-04 -1.31E-04 -1.06E-04 -4.93E-02 -1.31E-04 Oil palm -3.84E-04 -3.84E-04 -3.97E-04 -8.17E-02 -3.84E-04 Beef -2.34E-04 -4.66E-04 -2.33E-04 -2.36E-04 -4.66E-04 Poultry -3.23E-04 -3.31E-04 -2.81E-04 -3.31E-04 -3.31E-04 Sheep meat -2.72E-04 -5.40E-04 -2.70E-04 -2.73E-04 -5.40E-04 Pork -8.46E-05 -8.46E-05 -6.65E-05 -8.46E-05 -8.46E-05 Other meat -1.02E-03 -1.02E-03 -8.71E-04 -1.02E-03 -1.02E-03 Milk -6.96E-04 -1.39E-03 -6.96E-04 -7.45E-04 -1.39E-03 Eggs -6.10E-04 -6.45E-04 -4.11E-04 -6.45E-04 -6.45E-04 Fish -1.40E-03 -1.41E-03 -1.11E-03 -1.40E-03 -1.41E-03 CocoaPr -7.24E-05 -1.45E-04 -4.52E-05 -2.20E-04 -5.75E-05 FishPr -1.38E-04 -1.77E-04 -1.23E-04 -2.83E-04 -6.04E-05 OtherPr -1.35E-04 -1.99E-04 -1.35E-04 -2.55E-04 -7.21E-05 Cotton -3.38E-03 -7.34E-03 -3.38E-03 0.00E+00 -7.34E-03 Rubber -2.05E-04 -2.05E-04 -1.40E-04 0.00E+00 -2.05E-04 Wood 0.00E+00 0.00E+00 0.00E+00 0.00E+00 0.00E+00 Mines -6.09E-03 -7.96E-03 -3.50E-03 -2.23E-03 -2.98E-03 AgMfc -7.18E-03 -1.41E-02 -6.07E-03 -3.37E-03 -5.29E-03 Manufacturing -9.44E-03 -1.55E-02 -1.02E-02 -3.51E-03 -4.74E-03 Electric/water -7.25E-03 -1.05E-02 -7.52E-03 -3.98E-03 -4.93E-03 Construction -7.61E-03 -1.13E-02 -6.36E-03 -3.90E-03 -4.17E-03 Transport 7.26E-02 -1.11E-02 -9.36E-03 -3.36E-03 -4.38E-03 Trade -7.67E-03 7.01E-02 -6.96E-03 -3.40E-03 -5.08E-03 Finance -1.08E-02 -1.16E-02 6.84E-02 -3.20E-03 -4.80E-03 Government -7.58E-03 -1.11E-02 -6.24E-03 7.68E-02 -4.46E-03 Community -7.81E-03 -1.31E-02 -7.39E-03 -3.52E-03 7.85E-02

51
Related Publications
Agricultural Growth and Investment Options for Poverty Reduction in Rwanda by Xinshen Diao, Shenggen Fan,
Sam Kanyarukiga, and Bingxin Yu, January 2007
Comparing the Evolution of Spatial Inequality in China and India: A Fifty-Year Perspective by Kiran Gajwani,
Ravi Kanbur and Xiaobo Zhang, December 2006
Development Domains for Ethiopia: Capturing the Geographical Context of Smallholder Development Options
by Jordan Chamberlin, John Pender and Bingxin Yu, November 2006
Exploring Growth Linkages and Market Opportunities for Agriculture in Southern Africa by Alejandro Nin Pratt
and Xinshen Diao, September 2006
A Multilevel Analysis of Public Spending, Growth and Poverty Reduction in Egypt by Shenggen Fan, Perrihan Al-
Riffai, Moataz El-Said, Bingxin Yu, and Ahmed Kamaly, September 2006
Assessing Potential Impact of Avian Influenza on Poultry in West Africa – A Spatial Equilibrium Model Analysis
by Liangzhi You and Xinshen Diao, September 2006
Agricultural Trade Liberalization Under Doha: The Risks Facing African Countries by Ousmane Badiane,
September 2006
Shocks, Livestock Asset Dynamics and Social Capital in Ethiopia by Tewodaj Mogues, August 2006
From “Best Practice” to “Best Fit”: A Framework for Analyzing Pluralistic Agricultural Advisory Services
Worldwide by Regina Birner, Kristin Davis, John Pender, Ephraim Nkonya, Ponniah Anandajayasekeram,
Javier Ekboir, Adiel Mbabu, David J. Spielman, Daniela Horna, Samuel Benin, and Marc Cohen, August
2006
Has Trade Liberalization in South Africa Affected Men and Women Differently? by James Thurlow, July 2006
Public Investment to Reverse Dutch Disease: The Case of Chad by Stephanie Levy, June 2006
Moving Up and Down: A New Way of Examining Country Growth Dynamics by Marc* Rockmore and Xiaobo
Zhang, June 2006
Trade Liberalization under CAFTA: An Analysis of the Agreement with Special Reference to Agriculture and
Smallholders in Central America by Sam Morley, May 2006
Shocks, Sensitivity and Resilience: Tracking the Economic Impacts of Environmental Disaster on Assets in
Ethiopia and Honduras by Michael R. Carter, Peter D. Little, Tewodaj Mogues, and Workneh Negatu,
April 2006
Village Inequality in Western China: Implications for Development Strategy in Lagging Regions by Li Xing,
Shenggen Fan, Xiaopeng Luo, and Xiaobo Zhang, February 2006
Does Good Governance Contribute to Pro-poor Growth?: A Review of the Evidence from Cross-Country Studies
by Danielle Resnick and Regina Birner (February 2006)
The Role of Agriculture in Development: Implications for Sub-Saharan Africa by Xinshen Diao, Peter Hazell,
Danielle Resnick, and James Thurlow, February 2006
Asymmetric Property Rights in China’s Economic Growth by Xiaobo Zhang, January 2006

52
Determinants of Change in Household-Level Consumption and Poverty in Uganda, 1992/93-1999/00 by Sam
Benin and Samuel Mugarura, January 2006
Geographic Space, Assets, Livelihoods and Well-being in Rural Central America: Empirical Evidence from
Guatemala, Honduras and Nicaragua by Jeffrey Alwang, Hans G.P. Jansen, Paul B. Siegel and Francisco
Pichon, November 2005
Social Capital and the Reproduction of Economic Inequality in Polarized Societies by Tewodaj Mogues and
Michael R. Carter, November 2005
Rural Nonfarm Development in China and India: The Role of Policies and Institutions by Anit Mukherjee and
Xiaobo Zhang, September 2005
Rural and Urban Dynamics and Poverty: Evidence from China and India by Shenggen Fan, Connie Chan-Kang
and Anit Mukherjee, August 2005
The Dragon and the Elephant: Agricultural and Rural Reforms in China and India by Ashok Gulati, Shenggen
Fan and Sara Dalafi, August 2005
Fiscal Decentralization and Political Centralization in China: Implications for Regional Inequality by Xiaobo
Zhang, July 2005
Growth Options and Poverty Reduction in Ethiopia: A Spatial, Economywide Model Analysis for 2004-15 by
Xinshen Diao and Alejandro Nin Pratt with Madhur Gautam, James Keough, Jordan Chamberlin, Liangzhi
You, Detlev Puetz, Danille Resnick and Bingxi Yu, May 2005
Identifying the Drivers of Sustainable Rural Growth and Poverty Reduction in Honduras by Hans G.P. Jansen,
Paul B. Siegel and Francisco Pichón, April 2005
Public Investment and Poverty Reduction in Tanzania: Evidence from Household Survey Data by Shenggen Fan,
David Nyange and Neetha Rao, April 2005
Achieving Regional Growth Dynamics in African Agriculture by Awudu Abdulai, Xinshen Diao and Michael
Johnson, January 2005
The Road to Pro-poor Growth in Zambia: Past Lessons and Future Challenges by James Thurlow and Peter
Wobst, December 2004
Institutions and Economic Policies for Pro-poor Agricultural Growth by Andrew Dorward, Shenggen Fan,
Jonathan Kydd, Hans Lofgren, Jamie Morrison, Colin Poulton, Neetha Rao, Laurence Smith, Hardwick
Tchale, Sukhadeo Thorat, Ian Urey, and Peter Wobst, November 2004
Strategic Analysis and Knowledge Support Systems for Rural Development Strategies in Sub-Saharan Africa by
Michael Johnson and Danielle Resnick, with Simon Bolwig, Jordan Chamberlin, Liangzhi You, Stanley
Wood, and Peter Hazell, October 2004
Blunt to Sharpened Razor: Incremental Reform and Distortions in the Product and Capital Markets in China by
Xiaobo Zhang and Kong-Yam Tan, August 2004
Road Development, Economic Growth, and Poverty Reduction in China by Shenggen Fan and Connie Chan-
Kang, August 2004

53
Prospects for Growth and Poverty Reduction in Zambia, 2001-2015 by Hans Lofgren, James Thurlow, and
Sherman Robinson, August 2004
Bridging Research, Policy, and Practice in African Agriculture by Steven Were Omamo, July 2004
Smallholder African Agriculture: Progress and Problems in Confronting Hunger and Poverty by Danielle
Resnick, July 2004
Cross-Country Typologies and Development Strategies to End Hunger in Africa by Xiaobo Zhang, Michael
Johnson, Danielle Resnick, and Sherman Robinson, June 2004
The Importance of Public Investment for Reducing Rural Poverty in Middle-income Countries: The Case of
Thailand by Shenggen Fan, Somchai Jitsuchon, and Nuntaporn Methakunnavut, June 2004
Security Is Like Oxygen: Evidence from Uganda by Xiaobo Zhang, May 2004
Food Aid for Market Development in Sub-Saharan Africa by Awudu Abdulai, Christopher B. Barrett, and Peter
Hazell, April 2004
Public Expenditure, Growth, and Poverty Reduction in Rural Uganda by Shenggen Fan, Xiaobo Zhang, and
Neetha Rao, March 2004
The Effect of WTO and FTAA on Agriculture and the Rural Sector in Latin America by Samuel Morley and
Valeria Piñeiro, February 2004
Exploring Regional Dynamics in Sub-Saharan African Agriculture by Xinshen Diao and Yukitsugu Yanoma,
October 2003
Market Opportunities for African Agriculture: An Examination of Demand-Side Constraints on Agricultural
Growth by Xinshen Diao, Paul Dorosh, and Shaikh Mahfuzur Rahman with Siet Meijer, Mark Rosegrant,
Yukitsugu Yanoma, and Weibo Li, September 2003

54

55

INTERNATIONAL FOOD POLICY RESEARCH INSTITUTE
www.ifpri.org
IFPRI HEADQUARTERS
2033 K Street, NW Washington, DC 20006-1002 USA Tel.: +1-202-862-5600 Fax: +1-202-467-4439 Email: [email protected]
IFPRI ADDIS ABABA
P. O. Box 5689 Addis Ababa, Ethiopia Tel.: +251 11 6463215 Fax: +251 11 6462927 Email: [email protected]
IFPRI NEW DELHI
CG Block, NASC Complex, PUSA New Delhi 110-012 India Tel.: 91 11 2584-6565 Fax: 91 11 2584-8008 / 2584-6572 Email: [email protected]