Regional Competitiveness and the Role of Business Files/2012-0427---Michael... · Power Knowledge...
45
Professor Michael E. Porter Harvard Business School Sintonía Puebla, Mexico April 27, 2012 Regional Competitiveness and the Role of Business This presentation was prepared with the assistance of Professors Jorge Ramirez-Vallejo and Niels Ketelhohn. The author is grateful for their important contribution to this research. This presentation draws on ideas from Professor Porter’s articles and books, in particular, The Competitive Advantage of Nations (The Free Press, 1990), “Building the Microeconomic Foundations of Competitiveness,” in The Global Competitiveness Report (World Economic Forum), “Clusters and the New Competitive Agenda for Companies and Governments” in On Competition (Harvard Business School Press, 2008), and ongoing research on clusters and competitiveness. No part of this publication may be reproduced, stored in a retrieval system, or transmitted in any form or by any means - electronic, mechanical, photocopying, recording, or otherwise - without the permission of Michael E. Porter. Further information on Professor Porter’s work and the Institute for Strategy and Competitiveness is available at www.isc.hbs.edu
Transcript of Regional Competitiveness and the Role of Business Files/2012-0427---Michael... · Power Knowledge...

1 Copyright 2012 © Professor Michael E. Porter
Professor Michael E. Porter Harvard Business School
Sintonía
Puebla, Mexico April 27, 2012
Regional Competitiveness
and the Role of Business
This presentation was prepared with the assistance of Professors Jorge Ramirez-Vallejo and Niels Ketelhohn. The author is grateful for their important
contribution to this research. This presentation draws on ideas from Professor Porter’s articles and books, in particular, The Competitive Advantage of Nations
(The Free Press, 1990), “Building the Microeconomic Foundations of Competitiveness,” in The Global Competitiveness Report (World Economic Forum),
“Clusters and the New Competitive Agenda for Companies and Governments” in On Competition (Harvard Business School Press, 2008), and ongoing research
on clusters and competitiveness. No part of this publication may be reproduced, stored in a retrieval system, or transmitted in any form or by any means -
electronic, mechanical, photocopying, recording, or otherwise - without the permission of Michael E. Porter. Further information on Professor Porter’s work and
the Institute for Strategy and Competitiveness is available at www.isc.hbs.edu
2 Copyright © 2012 Professor Michael E. Porter
Agenda
I. Regional Competitiveness: The New Learning
II. The Role of Business in Economic and Social Development

3 Copyright © 2012 Professor Michael E. Porter
Agenda
I. Regional Competitiveness: The New Learning
II. The Role of Business in Economic and Social Development

4 Copyright © 2012 Professor Michael E. Porter
What is Competitiveness?
• Nations and regions compete to offer a more productive environment for business
• Competitiveness is not a zero sum game
• Competitiveness depends on the long term productivity with which a nation or region
uses its human, capital, and natural resources
− Productivity sets sustainable wages, job growth, and standard of living
− It is not what industries a nation or region competes in that matters for prosperity, but
how productively it competes in those industries
− Productivity in a national or regional economy benefits from a combination of
domestic and foreign firms
A nation or region is competitive to the extent that firms operating there are able
to compete successfully in the global economy while supporting rising wages
and living standards for the average citizen
5 Copyright © 2012 Professor Michael E. Porter
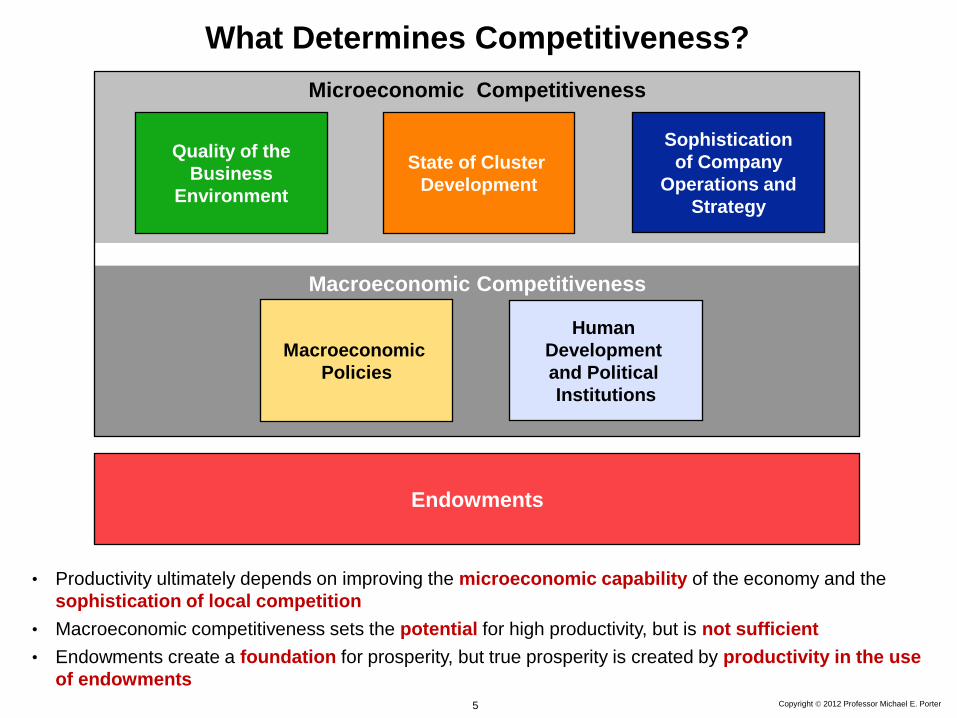
• Productivity ultimately depends on improving the microeconomic capability of the economy and the
sophistication of local competition
• Macroeconomic competitiveness sets the potential for high productivity, but is not sufficient
• Endowments create a foundation for prosperity, but true prosperity is created by productivity in the use
of endowments
What Determines Competitiveness?
Macroeconomic Competitiveness
Microeconomic Competitiveness
Sophistication
of Company
Operations and
Strategy
Quality of the
Business
Environment
Human
Development
and Political
Institutions
Macroeconomic
Policies
State of Cluster
Development
Endowments
6 Copyright © 2012 Professor Michael E. Porter
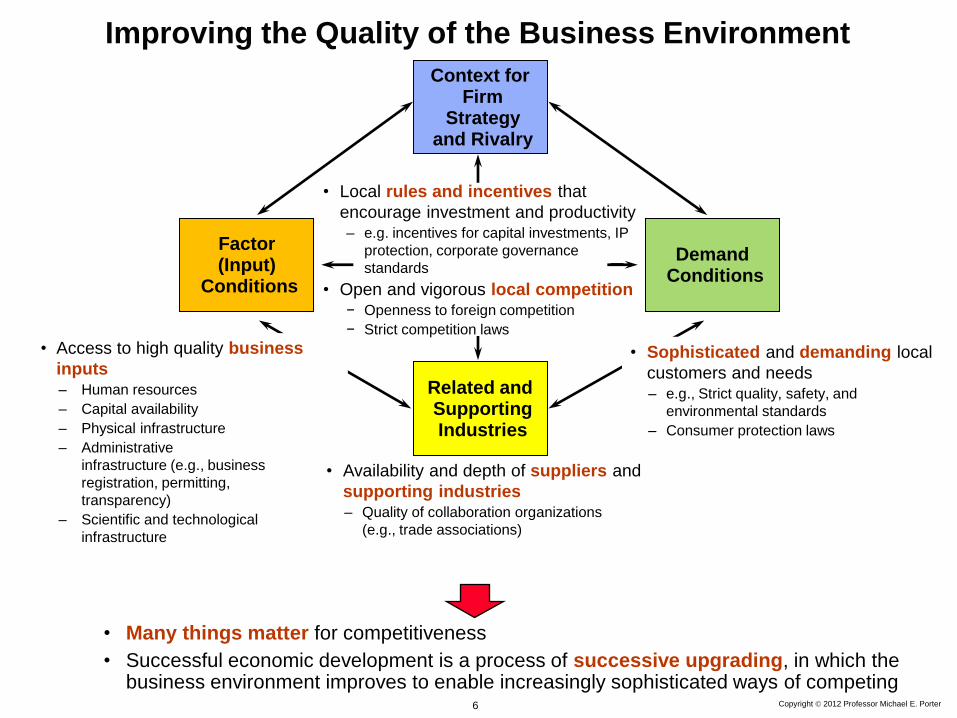
Improving the Quality of the Business Environment
Context for Firm
Strategy and Rivalry
Related and Supporting Industries
Factor (Input)
Conditions
Demand Conditions
• Sophisticated and demanding local
customers and needs – e.g., Strict quality, safety, and
environmental standards
– Consumer protection laws
• Many things matter for competitiveness
• Successful economic development is a process of successive upgrading, in which the business environment improves to enable increasingly sophisticated ways of competing
• Local rules and incentives that
encourage investment and productivity – e.g. incentives for capital investments, IP
protection, corporate governance
standards
• Open and vigorous local competition − Openness to foreign competition
− Strict competition laws
• Access to high quality business
inputs – Human resources
– Capital availability
– Physical infrastructure
– Administrative
infrastructure (e.g., business
registration, permitting,
transparency)
– Scientific and technological
infrastructure
• Availability and depth of suppliers and
supporting industries – Quality of collaboration organizations
(e.g., trade associations)
7 Copyright 2012 © Professor Michael E. Porter
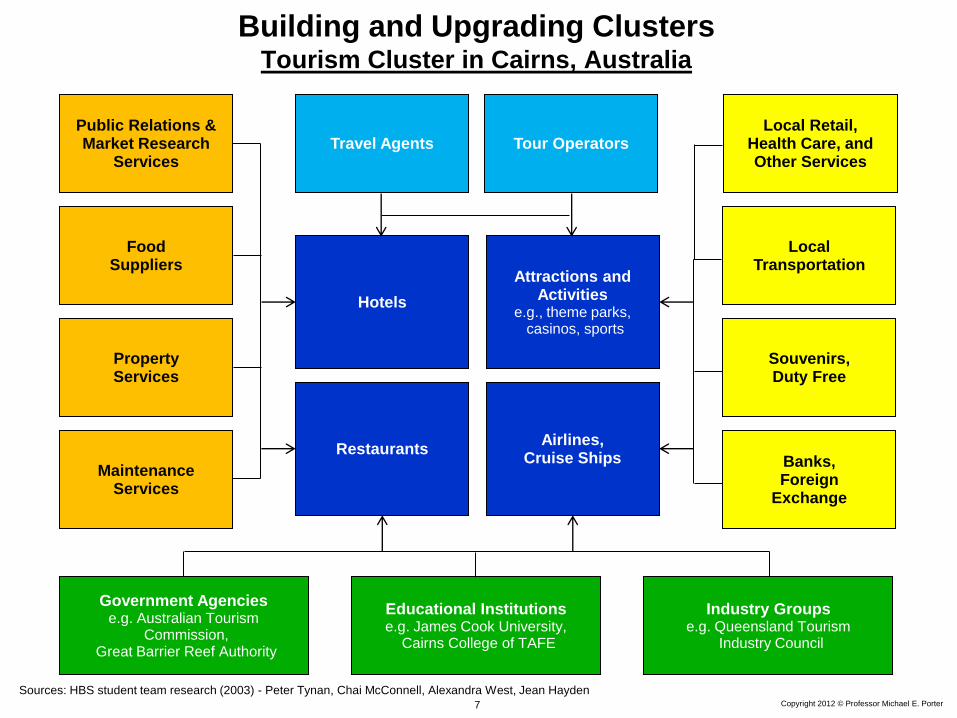
Sources: HBS student team research (2003) - Peter Tynan, Chai McConnell, Alexandra West, Jean Hayden
Restaurants
Attractions and Activities
e.g., theme parks, casinos, sports
Airlines, Cruise Ships
Travel Agents Tour Operators
Hotels
Property Services
Maintenance Services
Government Agencies e.g. Australian Tourism
Commission, Great Barrier Reef Authority
Educational Institutions e.g. James Cook University,
Cairns College of TAFE
Industry Groups e.g. Queensland Tourism
Industry Council
Food Suppliers
Public Relations & Market Research
Services
Local Retail, Health Care, and Other Services
Souvenirs, Duty Free
Banks, Foreign
Exchange
Local Transportation
Building and Upgrading Clusters Tourism Cluster in Cairns, Australia

8 Copyright 2012 © Professor Michael E. Porter
How Clusters Emerge and Develop The Australian Wine Cluster
1955
Australian Wine
Research
Institute founded
1970
Winemaking
school at Charles
Sturt University
founded
1980
Australian Wine
and Brandy
Corporation
established
1965
Australian Wine
Bureau
established
1930
First oenology
course at
Roseworthy
Agricultural
College
1950s
Import of
European winery
technology
1960s
Recruiting of
experienced
foreign investors,
e.g. Wolf Bass
1990s and 2000s
Surge in exports
and international
acquisitions
1980s
Creation of
large number of
new wineries
1970s
Continued inflow
of foreign capital
and
management
1990
Winemaker’s
Federation of
Australia
established
1991 to 1998
New organizations
created for education,
research, market
information, and
export promotions
Source: Michael E. Porter and Örjan Sölvell, The Australian Wine Cluster – Supplement, Harvard Business School Case Study, 2002

9 Copyright 2012 © Professor Michael E. Porter
Furniture Building
Fixtures,
Equipment &
Services
Fishing &
Fishing
Products
Hospitality
& Tourism Agricultural
Products
Transportation
& Logistics
Clusters and Economic Diversification
Plastics
Oil &
Gas
Chemical
Products
Biopharma-
ceuticals
Power
Generation
Aerospace
Vehicles &
Defense
Lightning &
Electrical
Equipment
Financial
Services
Publishing
& Printing
Entertainment
Information
Tech.
Communi-
cations
Equipment
Aerospace
Engines
Business
Services
Distribution
Services
Forest
Products
Heavy
Construction
Services
Construction
Materials
Prefabricated
Enclosures
Heavy
Machinery
Sporting
& Recreation
Goods
Automotive
Production
Technology Motor Driven
Products
Mining & Metal
Manufacturing
Apparel
Leather &
Related
Products
Jewelry &
Precious
Metals
Textiles
Footwear
Processed
Food
Tobacco
Medical
Devices
Analytical
Instruments Education &
Knowledge
Creation
Note: Clusters with overlapping borders or identical shading have at least 20% overlap (by number of industries) in both directions.
10 Mexico Cluster Mapping – Rich Bryden Copyright © 2011 Professor Michael E. Porter
Furniture Building
Fixtures,
Equipment &
Services
Fishing &
Fishing
Products
Hospitality
& Tourism Agricultural
Products
Transportation
& Logistics
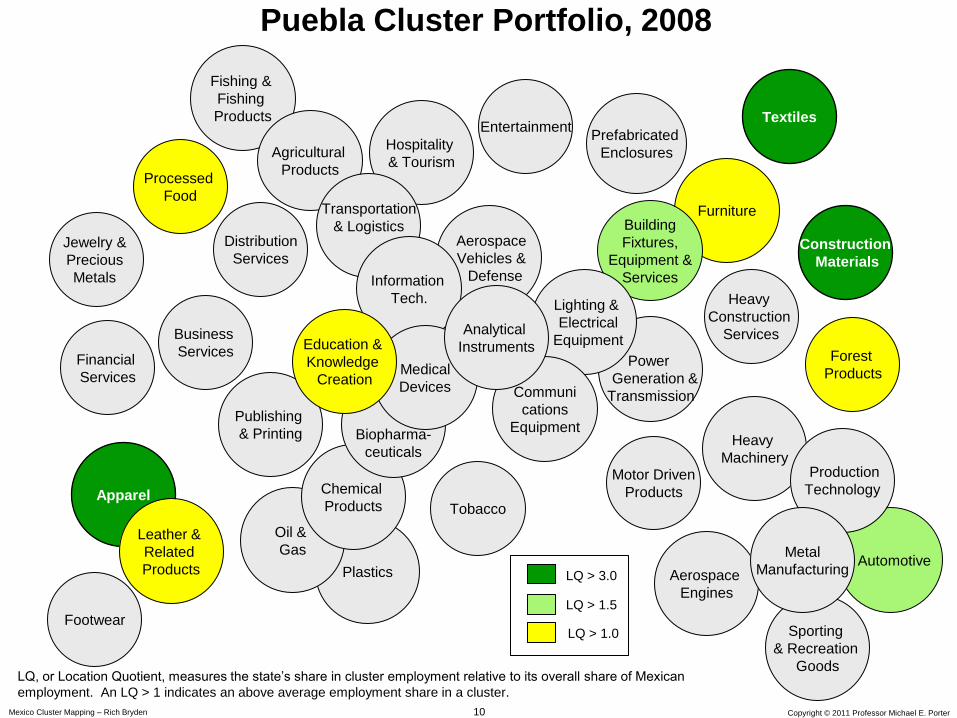
Puebla Cluster Portfolio, 2008
Plastics
Oil &
Gas
Chemical
Products
Biopharma-
ceuticals
Power
Generation &
Transmission
Aerospace
Vehicles &
Defense
Lighting &
Electrical
Equipment
Financial
Services
Publishing
& Printing
Entertainment
Information
Tech.
Communi
cations
Equipment
Aerospace
Engines
Business
Services
Distribution
Services
Forest
Products
Heavy
Construction
Services
Construction
Materials
Prefabricated
Enclosures
Heavy
Machinery
Sporting
& Recreation
Goods
Automotive
Production
Technology Motor Driven
Products
Metal
Manufacturing
Apparel
Leather &
Related
Products
Jewelry &
Precious
Metals
Textiles
Footwear
Processed
Food
Tobacco
Medical
Devices
Analytical
Instruments Education &
Knowledge
Creation
LQ > 3.0
LQ > 1.5
LQ > 1.0
LQ, or Location Quotient, measures the state’s share in cluster employment relative to its overall share of Mexican
employment. An LQ > 1 indicates an above average employment share in a cluster.
11 Copyright 2011 © Professor Michael E. Porter
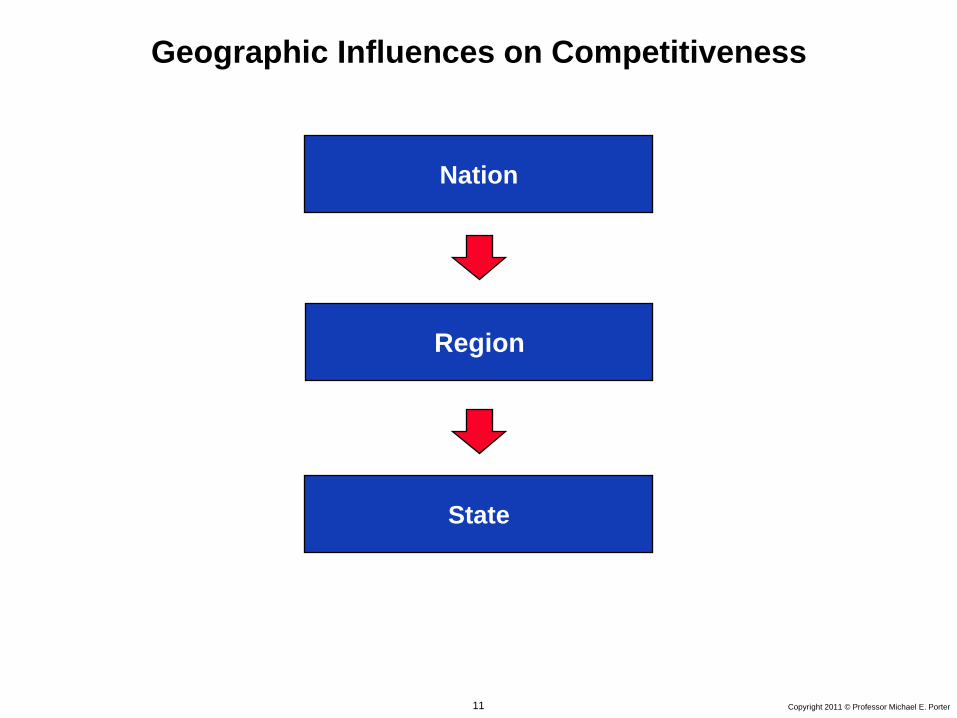
Geographic Influences on Competitiveness
Nation
State
Region
12 Copyright © 2012 Professor Michael E. Porter
Regions and Competitiveness
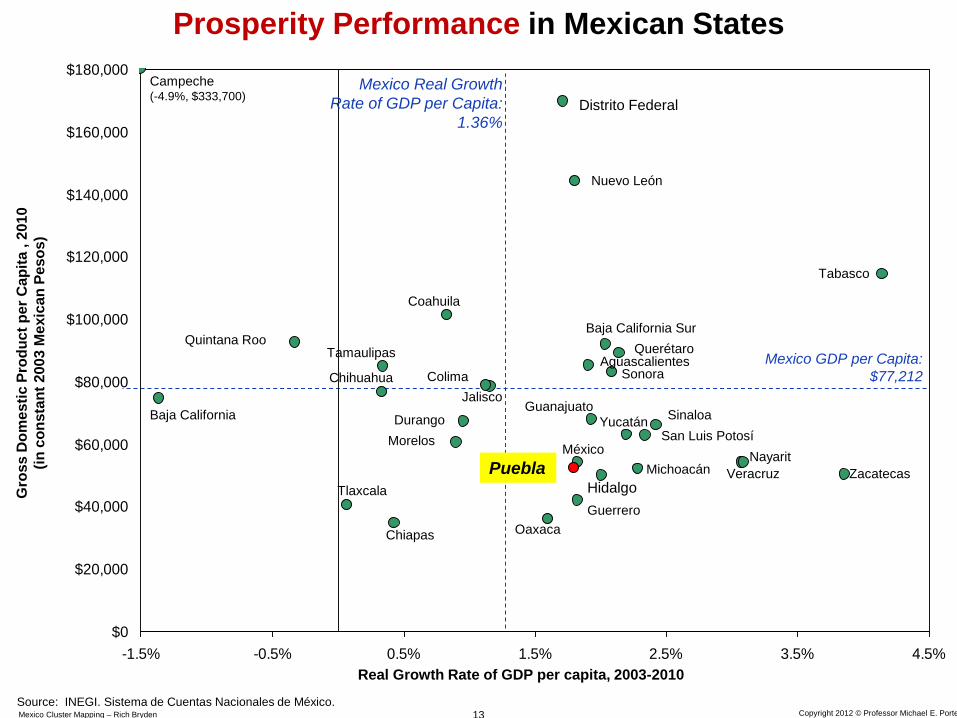
• Economic performance varies significantly across sub-national
regions (e.g., provinces, states, metropolitan areas)
13 Copyright 2012 © Professor Michael E. Porter Mexico Cluster Mapping – Rich Bryden
$0
$20,000
$40,000
$60,000
$80,000
$100,000
$120,000
$140,000
$160,000
$180,000
-1.5% -0.5% 0.5% 1.5% 2.5% 3.5% 4.5%
Prosperity Performance in Mexican States
Real Growth Rate of GDP per capita, 2003-2010
Gro
ss D
om
esti
c P
rod
uc
t p
er
Ca
pit
a , 2
01
0
(in
co
nsta
nt
200
3 M
exic
an
Pe
so
s)
Source: INEGI. Sistema de Cuentas Nacionales de México.
Mexico Real Growth
Rate of GDP per Capita:
1.36%
Mexico GDP per Capita:
$77,212
Campeche (-4.9%, $333,700)
Baja California Sur
Distrito Federal
Nuevo León
Tabasco
Baja California
Querétaro Aguascalientes
Sonora
Zacatecas
Nayarit
Veracruz Puebla
Coahuila
Chiapas
Tlaxcala
Quintana Roo
Tamaulipas
Chihuahua
Durango
Morelos
Colima
Jalisco
Sinaloa
San Luis Potosí Yucatán
Guanajuato
México
Hidalgo
Michoacán
Oaxaca
Guerrero
14 Copyright © 2012 Professor Michael E. Porter
Regions and Competitiveness
• Economic performance varies significantly across sub-national
regions (e.g., provinces, states, metropolitan areas)
• Many essential levers of competitiveness reside at the regional level

15 Copyright 2012 © Professor Michael E. Porter Mexico Cluster Mapping – Rich Bryden
Puebla
$0
$20,000
$40,000
$60,000
$80,000
$100,000
$120,000
$140,000
$160,000
$180,000
25 30 35 40 45 50 55 60
Competitiveness in Mexican States
Competitiveness Index, 2008
Gro
ss D
om
esti
c P
rod
uc
t p
er
Ca
pit
a , 2
01
0
(in
co
nsta
nt
200
3 M
exic
an
Pe
so
s)
Mexico GDP per Capita:
$77,212
Campeche ($333,700)
Baja California Sur
Distrito Federal
Nuevo León
Tabasco
Baja California
Querétaro
Aguascalientes Sonora
Zacatecas
Nayarit Veracruz
Coahuila
Chiapas
Tlaxcala
Quintana Roo
Tamaulipas
Chihuahua Durango
Morelos
Colima Jalisco
Sinaloa San Luis Potosí
Yucatán Guanajuato
México
Hidalgo Michoacán
Oaxaca
Guerrero
Source: INEGI. Sistema de Cuentas Nacionales de México.

16 Copyright © 2012 Professor Michael E. Porter
Regions and Competitiveness
• Economic performance varies significantly across sub-national
regions (e.g., provinces, states, metropolitan areas)
• Many essential levers of competitiveness reside at the regional level
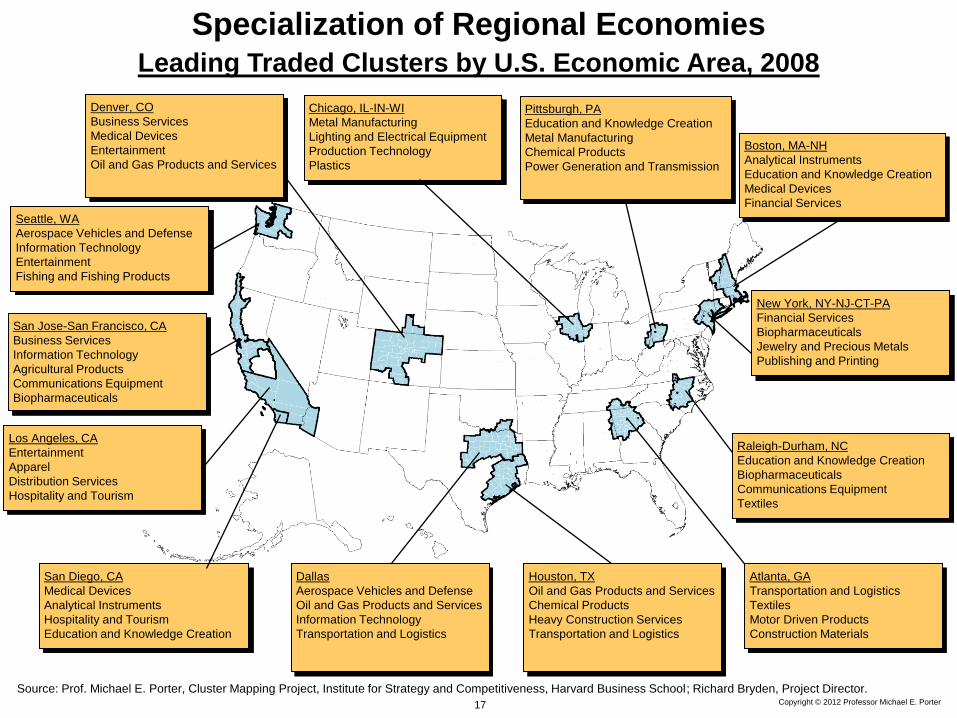
• Regions specialize in different sets of clusters
17 Copyright © 2012 Professor Michael E. Porter
Specialization of Regional Economies Leading Traded Clusters by U.S. Economic Area, 2008
Boston, MA-NH
Analytical Instruments
Education and Knowledge Creation
Medical Devices
Financial Services
Los Angeles, CA
Entertainment
Apparel
Distribution Services
Hospitality and Tourism
San Jose-San Francisco, CA
Business Services
Information Technology
Agricultural Products
Communications Equipment
Biopharmaceuticals
New York, NY-NJ-CT-PA
Financial Services
Biopharmaceuticals
Jewelry and Precious Metals
Publishing and Printing
Seattle, WA
Aerospace Vehicles and Defense
Information Technology
Entertainment
Fishing and Fishing Products
San Diego, CA
Medical Devices
Analytical Instruments
Hospitality and Tourism
Education and Knowledge Creation
Chicago, IL-IN-WI
Metal Manufacturing
Lighting and Electrical Equipment
Production Technology
Plastics
Denver, CO
Business Services
Medical Devices
Entertainment
Oil and Gas Products and Services
Raleigh-Durham, NC
Education and Knowledge Creation
Biopharmaceuticals
Communications Equipment
Textiles
Atlanta, GA
Transportation and Logistics
Textiles
Motor Driven Products
Construction Materials
Dallas
Aerospace Vehicles and Defense
Oil and Gas Products and Services
Information Technology
Transportation and Logistics
Source: Prof. Michael E. Porter, Cluster Mapping Project, Institute for Strategy and Competitiveness, Harvard Business School; Richard Bryden, Project Director.
Houston, TX
Oil and Gas Products and Services
Chemical Products
Heavy Construction Services
Transportation and Logistics
Pittsburgh, PA
Education and Knowledge Creation
Metal Manufacturing
Chemical Products
Power Generation and Transmission
18 Mexico Cluster Mapping – Rich Bryden Copyright © 2011 Professor Michael E. Porter
0.0%
2.0%
4.0%
6.0%
8.0%
10.0%
12.0%
14.0%
16.0%
-2.0% -1.0% 0.0% 1.0% 2.0% 3.0%
Change in Puebla’s share of National Employment, 2003 to 2008
Pu
eb
la’s
nati
on
al
em
plo
ym
en
t s
hare
, 2
00
8
Employees 5,000 =
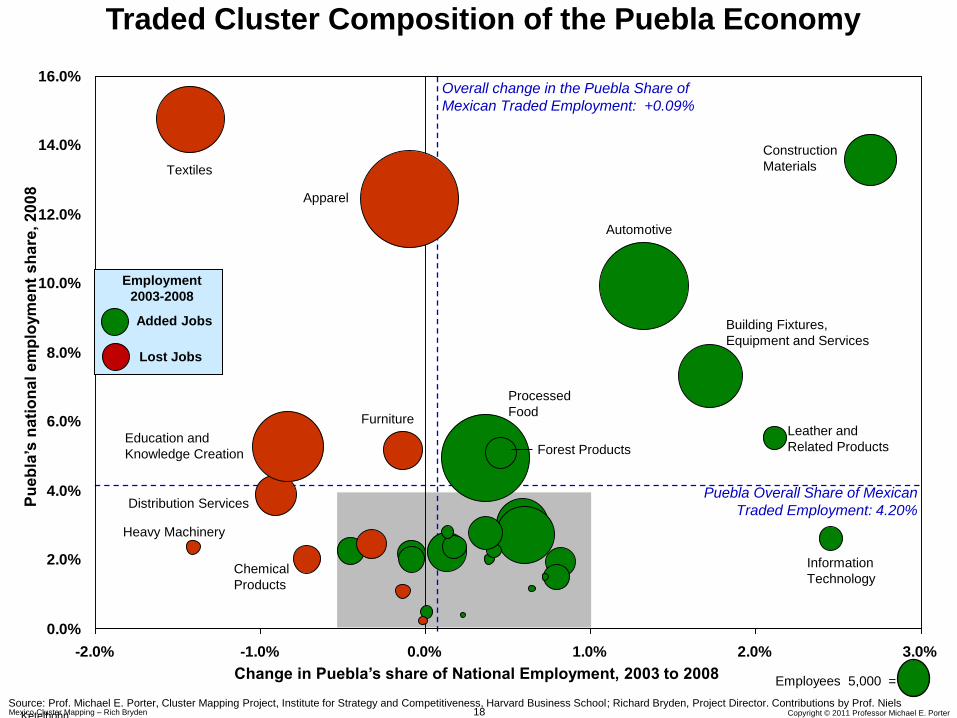
Traded Cluster Composition of the Puebla Economy
Overall change in the Puebla Share of
Mexican Traded Employment: +0.09%
Source: Prof. Michael E. Porter, Cluster Mapping Project, Institute for Strategy and Competitiveness, Harvard Business School; Richard Bryden, Project Director. Contributions by Prof. Niels
Ketelhohn.
Puebla Overall Share of Mexican
Traded Employment: 4.20%
Added Jobs
Lost Jobs
Employment
2003-2008
Education and
Knowledge Creation
Textiles
Apparel
Information
Technology
Construction
Materials
Automotive
Processed
Food
Building Fixtures,
Equipment and Services
Distribution Services
Heavy Machinery
Furniture Leather and
Related Products
Forest Products
Chemical
Products
19 Mexico Cluster Mapping – Rich Bryden Copyright © 2011 Professor Michael E. Porter
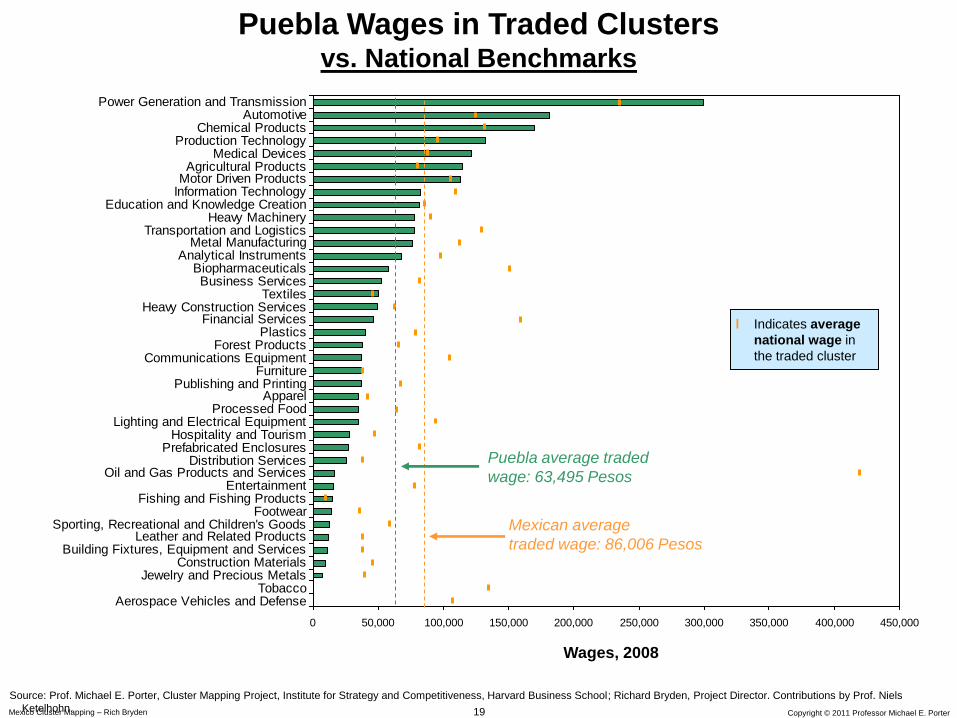
0 50,000 100,000 150,000 200,000 250,000 300,000 350,000 400,000 450,000
Aerospace Vehicles and DefenseTobacco
Jewelry and Precious MetalsConstruction Materials
Building Fixtures, Equipment and ServicesLeather and Related Products
Sporting, Recreational and Children's GoodsFootwear
Fishing and Fishing ProductsEntertainment
Oil and Gas Products and ServicesDistribution Services
Prefabricated EnclosuresHospitality and Tourism
Lighting and Electrical EquipmentProcessed Food
ApparelPublishing and Printing
FurnitureCommunications Equipment
Forest ProductsPlastics
Financial ServicesHeavy Construction Services
TextilesBusiness Services
BiopharmaceuticalsAnalytical Instruments
Metal ManufacturingTransportation and Logistics
Heavy MachineryEducation and Knowledge Creation
Information TechnologyMotor Driven ProductsAgricultural Products
Medical DevicesProduction Technology
Chemical ProductsAutomotive
Power Generation and Transmission
Puebla Wages in Traded Clusters vs. National Benchmarks
Wages, 2008
Puebla average traded
wage: 63,495 Pesos
Source: Prof. Michael E. Porter, Cluster Mapping Project, Institute for Strategy and Competitiveness, Harvard Business School; Richard Bryden, Project Director. Contributions by Prof. Niels
Ketelhohn.
Mexican average
traded wage: 86,006 Pesos
l Indicates average
national wage in
the traded cluster

20 Copyright © 2012 Professor Michael E. Porter
Regions and Competitiveness
• Economic performance varies significantly across sub-national
regions (e.g., provinces, states, metropolitan areas)
• Many essential levers of competitiveness reside at the regional level
• Regions specialize in different sets of clusters
• Cluster strength strongly impacts regional performance

21 Copyright 2012 © Professor Michael E. Porter
Strong Clusters Drive Regional Performace Research Findings
Source: “Cluster and Entrepreneurship” by Mercedes Delgado, Michael E. Porter, and Scott Stern (2010); “The Economic Performance of Regions” by Michael E. Porter (2003)
• Presence of strong clusters
• Breadth of industries within each
cluster
• Strength in related clusters
• Presence of a region‘s clusters in
neighboring regions
• Job growth
• Higher wages
• Higher patenting rates
• Greater new business formation,
growth and survival
• Build on the region’s existing and emerging clusters rather than chase hot fields
• Economic diversification usually occurs within clusters and across related clusters
22 Copyright © 2012 Professor Michael E. Porter
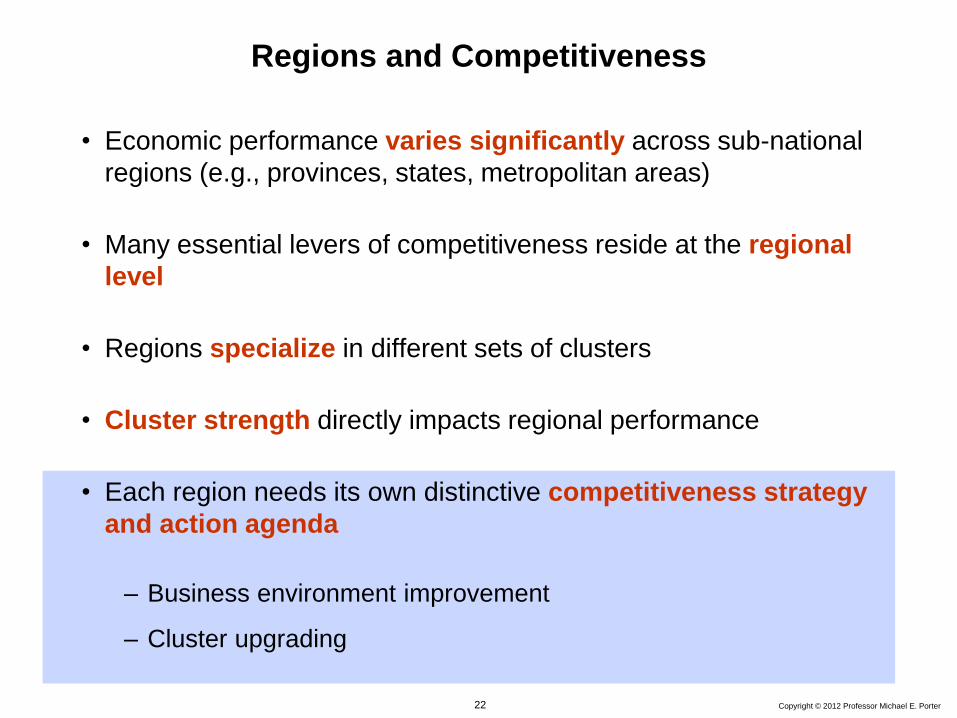
Regions and Competitiveness
• Economic performance varies significantly across sub-national
regions (e.g., provinces, states, metropolitan areas)
• Many essential levers of competitiveness reside at the regional
level
• Regions specialize in different sets of clusters
• Cluster strength directly impacts regional performance
• Each region needs its own distinctive competitiveness strategy
and action agenda
– Business environment improvement
– Cluster upgrading

23 Copyright 2012 © Professor Michael E. Porter
Regional Value Proposition
Creating a Regional Economic Strategy
• What is the distinctive competitive position of a geographic area
given its location, legacy, existing strengths, and potential strengths? – What unique strengths as a business location?
– For what types of activities and clusters?
– And what roles with the surrounding regions, nation, and the broader world?
Developing Unique Strengths Achieving and Maintaining Parity
with Peers
• What elements of the business
environment can be unique strengths
relative to peers/neighbors?
• What existing and emerging clusters
can be built upon?
• What weaknesses must be addressed to
remove key constraints and achieve parity
with peer locations?
• Priorities and sequencing are necessity in economic development
24 Copyright 2012 © Professor Michael E. Porter
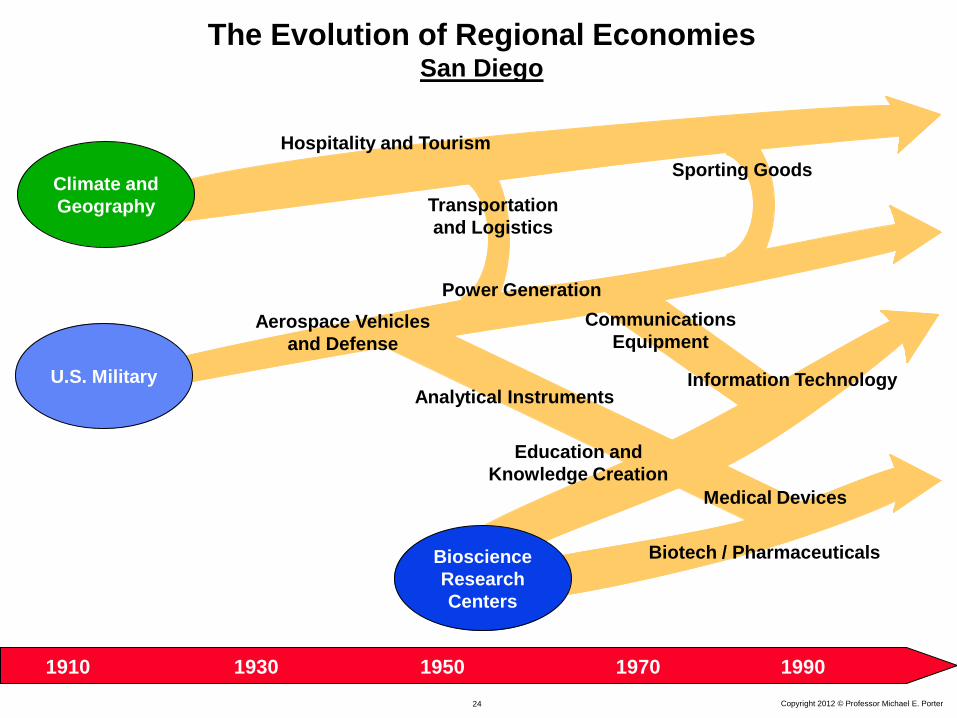
The Evolution of Regional Economies San Diego
U.S. Military
Communications
Equipment
Sporting Goods
Analytical Instruments
Power Generation
Aerospace Vehicles
and Defense
Transportation
and Logistics
Information Technology
1910 1930 1950 1990 1970
Bioscience
Research
Centers
Climate and
Geography
Hospitality and Tourism
Medical Devices
Biotech / Pharmaceuticals
Education and
Knowledge Creation

25 Copyright 2011 © Professor Michael E. Porter
Harnessing the New Process of Economic Development
Old Model
• Government drives economic
development through policy
decisions and incentives
New Model
• Economic development is a
collaborative process involving
government at multiple levels,
companies, teaching and
research institutions, and private
sector organizations
Competitiveness is the result of both top-down and bottom-up
processes in which many companies and institutions take responsibility

26 Copyright 2011 © Professor Michael E. Porter
Puebla´s Regional Competitiveness Initiative

27 Copyright © 2012 Professor Michael E. Porter
Agenda
I. Regional Competitiveness: The New Learning
II. The Role of Business in Economic and Social Development

Copyright 2012 © Professor Michael E. Porter
• Creating a unique and
sustainable competitive
position
• Assimilating, attaining, and
extending best practices
Operational
Effectiveness
Strategic
Positioning
Company Sophistication and Economic Development
Do the same thing better Do things differently to
achieve a different purpose

Copyright 2012 © Professor Michael E. Porter
Competing on Strategy IKEA, Sweden
• Young, first time, or price-sensitive buyers with
design sophistication
• Stylish, space efficient and compatible furniture
lines and accessories at very low price points.
• Modular, ready-to-assemble, easy to ship furniture
designs
• In-house design of all products
• Wide range of styles which are all displayed in
huge warehouse stores with large on-site
inventories
• Self-selection by the customer
• Extensive customer information in the form of
catalogs, explanatory ticketing, do-it-yourself
videos, and assembly instructions
• IKEA designer names attached to related products
to inform coordinated purchases
• Suburban locations with large parking lots
• Long hours of operation
• On-site, low-cost, restaurants
• Child care provided in the store
• Self-delivery by most customers
Value Proposition Distinctive Activities
Copyright 2012 © Professor Michael E. Porter 30
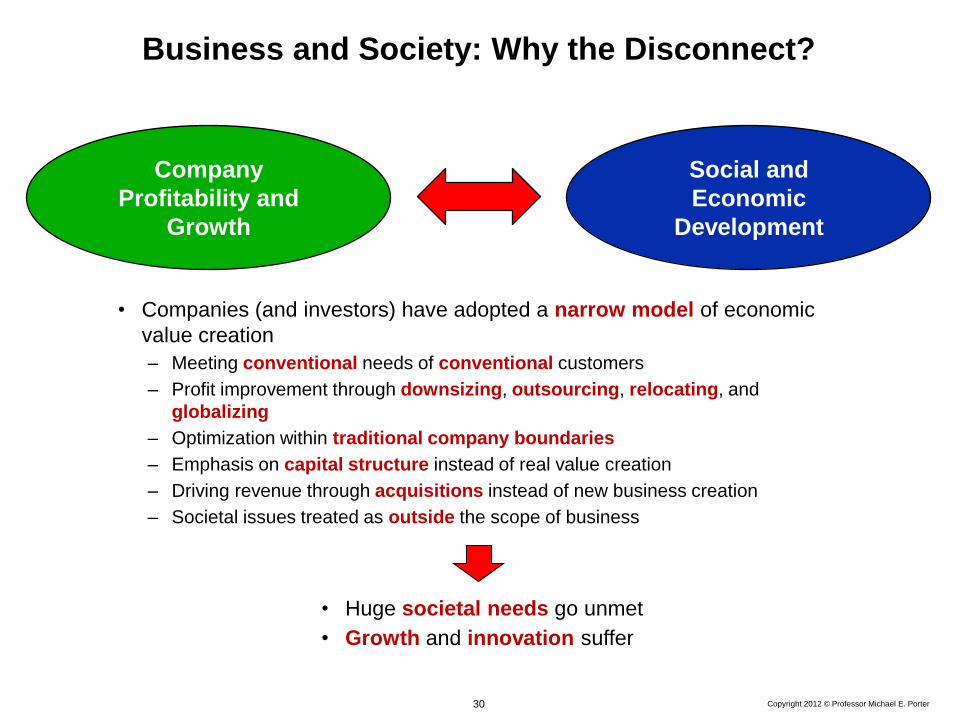
Business and Society: Why the Disconnect?
• Companies (and investors) have adopted a narrow model of economic
value creation
– Meeting conventional needs of conventional customers
– Profit improvement through downsizing, outsourcing, relocating, and
globalizing
– Optimization within traditional company boundaries
– Emphasis on capital structure instead of real value creation
– Driving revenue through acquisitions instead of new business creation
– Societal issues treated as outside the scope of business
• Huge societal needs go unmet
• Growth and innovation suffer
Social and
Economic
Development
Company
Profitability and
Growth

Copyright 2012 © Professor Michael E. Porter 31
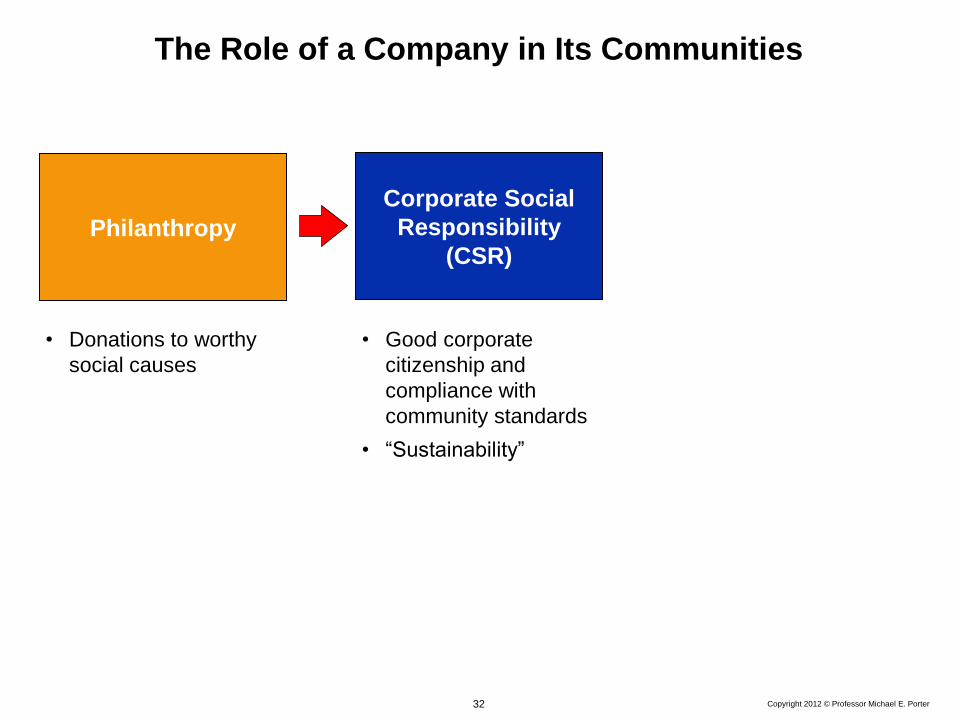
Philanthropy
• Donations to worthy
social causes
The Role of a Company in Its Communities
Copyright 2012 © Professor Michael E. Porter 32
Corporate Social
Responsibility
(CSR) Philanthropy
• Donations to worthy
social causes
• Good corporate
citizenship and
compliance with
community standards
• “Sustainability”
The Role of a Company in Its Communities

Copyright 2012 © Professor Michael E. Porter 33
Societal Needs and Economic Value Creation
• Social deficits create economic cost
• External conditions shape internal company productivity
• Social needs represent the largest market opportunities
• There is a growing congruence between economic value creation and societal objectives
Company
Productivity Employee
Skills
Worker
Safety
Environmental
Impact
Supplier
Access and
Viability
Water Use
Energy Use
Gender and
Racial Equity
Employee
Health

Copyright 2012 © Professor Michael E. Porter 34
Corporate Social
Responsibility
(CSR)
Creating Shared
Value
(CSV) Philanthropy
• Donations to worthy
social causes
• Good corporate
citizenship and
compliance with
community standards
• “Sustainability”
• Integrating societal
improvement into
economic value
creation itself
The Role of a Company in Its Communities

Copyright 2012 © Professor Michael E. Porter 35
The Concept of Shared Value
• Create economic value by creating societal value
– What is good for the community is good for business
• Use capitalism to address social problems
• All profit is not equal. Profit involving shared value enables society to advance
and companies to grow faster
• Incorporating societal issues into strategy and operations is the next major
transformation in management thinking
Shared Value: Corporate policies and practices that
enhance the competitiveness of the company while
simultaneously advancing social and economic conditions
in the communities in which it sells and operates
Copyright 2012 © Professor Michael E. Porter 36
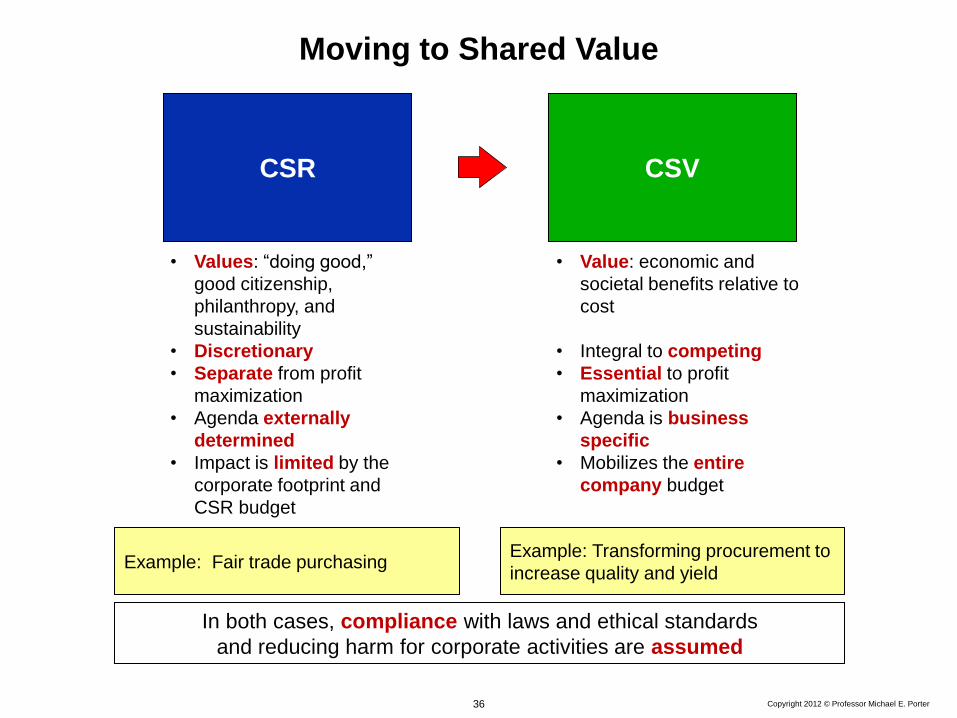
Example: Transforming procurement to
increase quality and yield Example: Fair trade purchasing
CSR CSV
• Values: “doing good,”
good citizenship,
philanthropy, and
sustainability
• Discretionary
• Separate from profit
maximization
• Agenda externally
determined
• Impact is limited by the
corporate footprint and
CSR budget
• Value: economic and
societal benefits relative to
cost
• Integral to competing
• Essential to profit
maximization
• Agenda is business
specific
• Mobilizes the entire
company budget
In both cases, compliance with laws and ethical standards
and reducing harm for corporate activities are assumed
Moving to Shared Value
Copyright 2012 © Professor Michael E. Porter 37
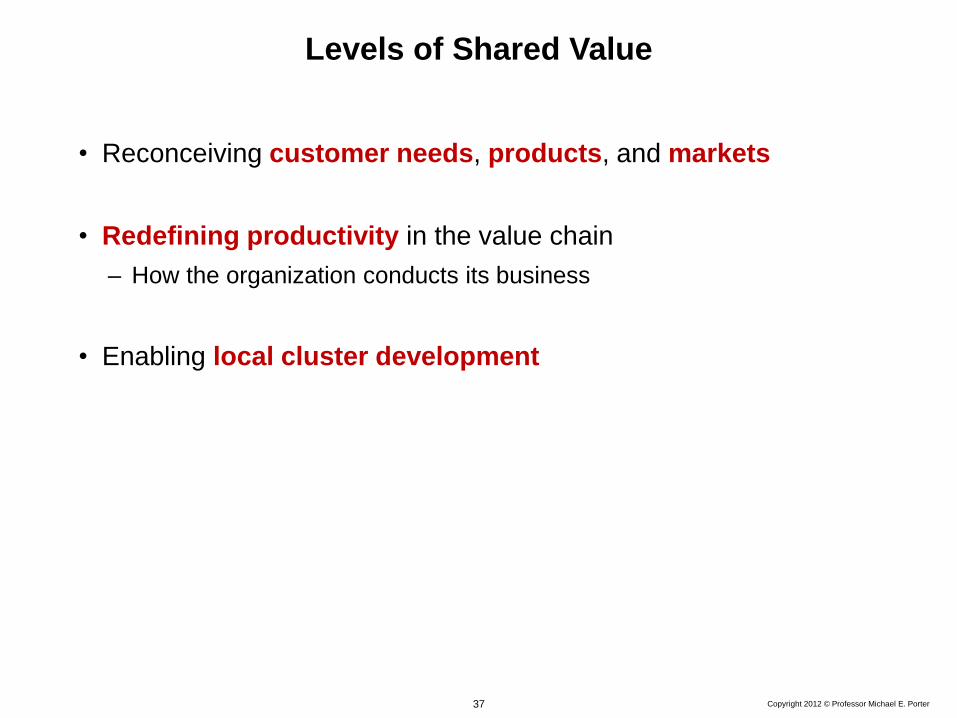
Levels of Shared Value
• Reconceiving customer needs, products, and markets
• Redefining productivity in the value chain
– How the organization conducts its business
• Enabling local cluster development

Copyright 2012 © Professor Michael E. Porter 38
Creating Shared Value in Products and Markets Novo Nordisk in China
• Diabetes training programs for physicians in partnership with government, NGOs, and opinion leaders
to promote the latest thinking on diabetes prevention, screening, treatment, and patient communication
– The program has trained 55,000 physicians to date, each treating approximately 230 patients
• Diabetes education programs for patients focusing on prevention, lifestyle changes, and effective use
of insulin products
– Television, radio, and print media campaigns about diabetes prevention, detection, and treatment
– Changing Diabetes Bus program to raise patient awareness and provide on-site advice
– NovoCare telephone hotline and NovoCare Club providing ongoing support to members
• Product design that reflects Chinese patient demographic and culture
– Formulation with appropriate insulin dosage to reflect lighter body weight
– Product name Nuo He Ling means “commitment, harmony, and effectiveness” in Chinese
• Since 1994, Novo Nordisk market share increased from 0% to 63% and China became the Company’s
third largest market, with revenues of $935 million in 2011
• Company efforts saved China 140,000 life years by 2010 and $2,317 of total lifetime costs per patient

Copyright 2012 © Professor Michael E. Porter 39
Redefining Productivity in the Value Chain
Marketing
& Sales
(e.g., Sales
Force,
Promotion,
Advertising,
Proposal
Writing, Web
site)
Inbound
Logistics
(e.g., Incoming
Material
Storage, Data
Collection,
Service,
Customer
Access)
Operations
(e.g., Assembly,
Component
Fabrication,
Branch
Operations)
Outbound
Logistics
(e.g., Order
Processing,
Warehousing,
Report
Preparation)
After-Sales
Service
(e.g., Installation,
Customer
Support,
Complaint
Resolution,
Repair)
M
a
r
g
i
n
Firm Infrastructure (e.g., Financing, Planning, Investor Relations)
Procurement (e.g., Components, Machinery, Advertising, Services)
Technology Development (e.g., Product Design, Testing, Process Design, Material Research, Market Research)
Human Resource Management (e.g., Recruiting, Training, Compensation System)
• Purchasing
• Energy use
• Resource use
• Logistical efficiency
• Employee productivity
• Location of facilities / supply chain
Copyright 2012 © Professor Michael E. Porter 40
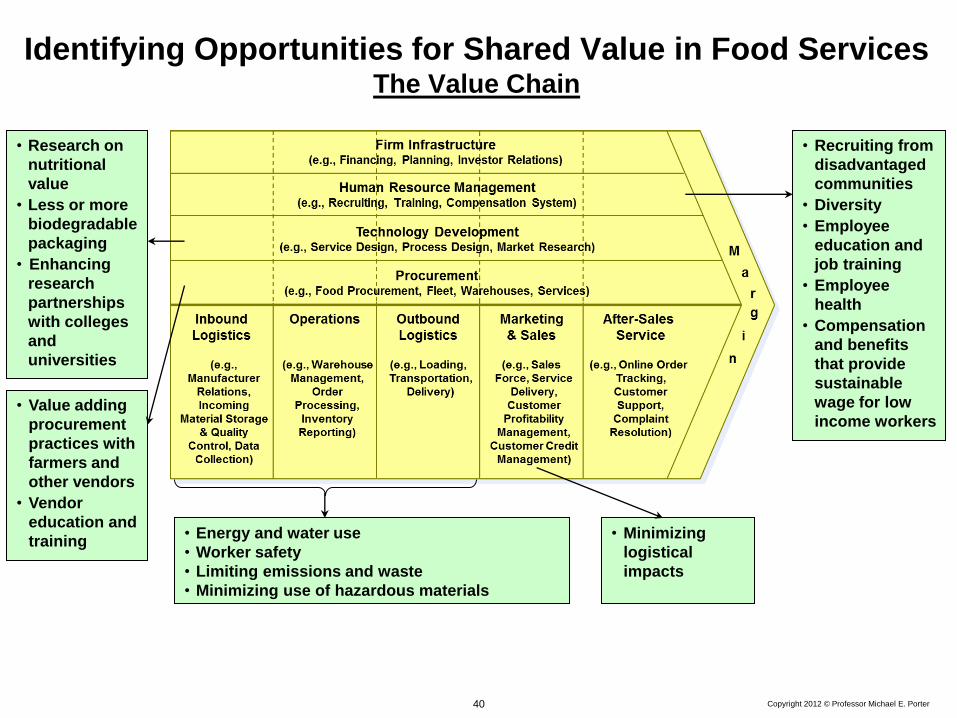
Identifying Opportunities for Shared Value in Food Services The Value Chain
• Research on
nutritional
value
• Less or more
biodegradable
packaging
• Enhancing
research
partnerships
with colleges
and
universities
• Value adding
procurement
practices with
farmers and
other vendors
• Vendor
education and
training
• Energy and water use
• Worker safety
• Limiting emissions and waste
• Minimizing use of hazardous materials
• Recruiting from
disadvantaged
communities
• Diversity
• Employee
education and
job training
• Employee
health
• Compensation
and benefits
that provide
sustainable
wage for low
income workers
• Minimizing
logistical
impacts
Copyright 2012 © Professor Michael E. Porter 41
Cluster Development in the Company’s
Major Locations
• A strong local cluster improves company growth and productivity
– Local suppliers
– Supporting institutions and infrastructure
– Related businesses
• Companies, working collaboratively, can catalyze major improvements in
the cluster and the local business environment
• Local cluster development strengthens the link between a company’s
success and community success

Copyright 2012 © Professor Michael E. Porter 42
• Implementing shared value in sourcing premium coffees from farmers in Costa Rica,
Guatemala, Colombia, and Ghana
• Upgrading the cluster
– Supporting local cluster development in coffee growing regions, including establishment of
cluster institutions
– Partnering with stakeholders
• The three levels of shared value are often mutually reinforcing
Enhancing Cluster and Community Development Nespresso
• Better yields
• Better prices
• Better processing
• Economic development
• Environmental sustainability
• Stable supply
• Better quality
• Reinforces strategic positioning
FARMS COMMUNITY NESPRESSO
SHARED VALUE
Copyright 2012 © Professor Michael E. Porter 43
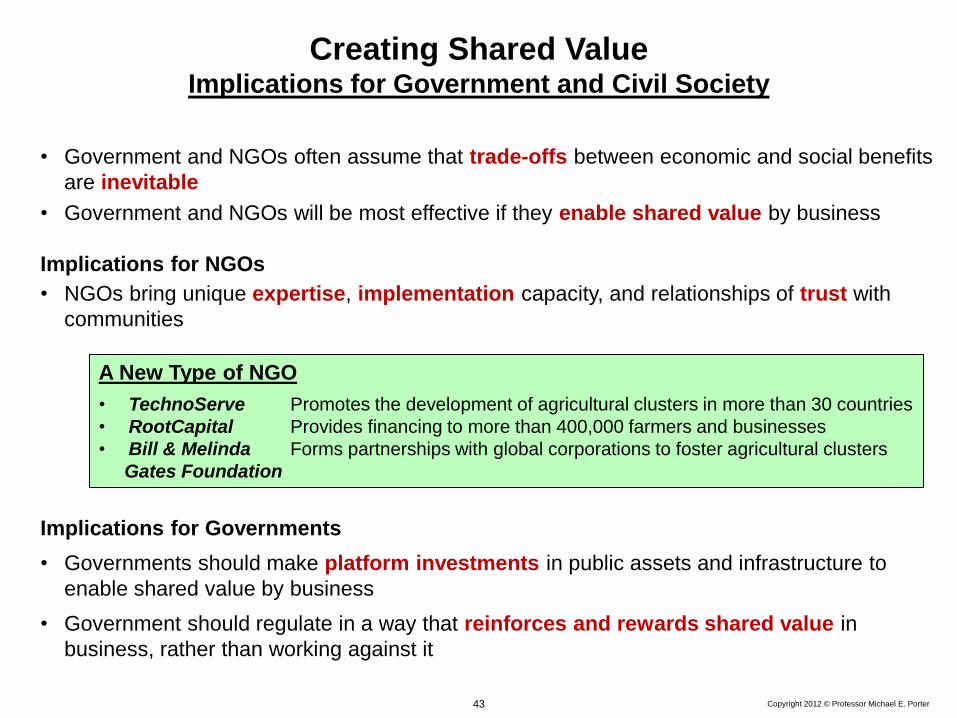
Creating Shared Value Implications for Government and Civil Society
• Government and NGOs often assume that trade-offs between economic and social benefits
are inevitable
• Government and NGOs will be most effective if they enable shared value by business
Implications for NGOs
• NGOs bring unique expertise, implementation capacity, and relationships of trust with
communities
Implications for Governments
• Governments should make platform investments in public assets and infrastructure to
enable shared value by business
• Government should regulate in a way that reinforces and rewards shared value in
business, rather than working against it
A New Type of NGO
• TechnoServe Promotes the development of agricultural clusters in more than 30 countries
• RootCapital Provides financing to more than 400,000 farmers and businesses
• Bill & Melinda Forms partnerships with global corporations to foster agricultural clusters
Gates Foundation
Copyright 2012 © Professor Michael E. Porter 44
The Purpose of Business
• There is an opportunity to transform thinking and practice about the role of the
corporation in society
• Shared value gives rise to far broader approaches to economic value creation
• Shared value thinking will drive the next wave of innovation, productivity
growth, and economic growth
• Businesses acting as businesses, not as charitable givers, are arguably the most
powerful force for addressing many of the pressing issues facing our society
• A transformation of business practice around shared value will give purpose to the
corporation and represents our best chance to legitimize business again

45 Copyright 2011 © Professor Michael E. Porter
Summary and Next Steps
• Create a shared understanding of competitiveness
- Productivity driven
- Cluster-centric
• Develop a second-generation strategy for Puebla which identifies
the unique competitive position of the state as a platform for
competitiveness
- Sequence and prioritize action items
• Establish Sintonía as the coordinating organization to develop an
overall strategy, action priorities, and ensure effective
implementation
• Engage the private sector more effectively in cluster development
and improving the state business environment
• Embrace the creating shared value model as a way to engage
business to addressing the social and environmental problems of
the state
• Develop metrics for assessing and reporting progress