Regional changes in extreme heat events in China under ...
12
Regional changes in extreme heat events in China under stabilized 1.5 C and 2.0 C global warming ZHANG Gu-Wei a , ZENG Gang a, *, Vedaste IYAKAREMYE a , YOU Qing-Long b a Key Laboratory of Meteorological Disasterof Ministry of Education (KLME), Collaborative Innovation Center on Forecast and Evaluation of Meteorological Disasters (CIC-FEMD), Nanjing University of Information Science and Technology, Nanjing, 210044, China b Department of Atmospheric and Oceanic Sciences, Institute of Atmospheric Sciences, Fudan University, Shanghai, 200433, China Received 1 March 2020; revised 29 May 2020; accepted 31 August 2020 Abstract Extreme heat events (EHEs) have a significant impact on the social economy and human health. China is a country with a large population and diverse terrain, and it is necessary to project future extreme heat changes in the sub-regions. This study used a specially designed dataset, the Community Earth System Model (CESM) simulations, namely CESM low-warming, to investigate the EHEs in China under 1.5 C and 2.0 C global warming. The results indicate that the regional mean warming over China will exceed the global average, about 1.63 C and 2.24 C in 1.5 C and 2.0 C warmer futures. Compared to the present-day (1976e2005), the frequency and duration of the EHEs in South China are projected to increase the most among the sub-regions. For example, the frequency of EHEs in South China at 1.5 C and 2.0 C warming will exceed 3 and 3.5 times the present-day level. However, when global warming rises from 1.5 C to 2.0 C, the increased impacts relative to the 1.5 C warming level will be the lowest in South China (less than 40%), and the highest increased impacts are projected to appear in Northeast China (53%e84%) and Northwest China (53%e107%). The main reason for this situation is that compared with the 1.5 C scenario, the upper zonal westerly in northern China weakens and the continental high pressure enhances under the 2.0 C scenario. Therefore, limiting global warming at 1.5 C instead of 2.0 C is beneficial for eliminating extreme heat events, especially for Northeast China and Northwest China. Keywords: China; Regional changes; Extreme heat events; 1.5 C and 2.0 C global warming; CESM low-warming 1. Introduction The Intergovernmental Panel on Climate Change (IPCC, 2013) reported that the global mean temperature (GMT) had risen about 0.85 C (0.65e1.06 C) from 1880 to 2012. Seven years later in 2020, the World Meteorological Organization (WMO) declared that global warming had reached 1.1 C in 2019 and 2010e2019 was the hottest decade on record (WMO, 2020). Rapid global warming will likely have huge negative impacts on the social economy and human health (Robine et al., 2008; Seneviratne et al., 2016; Zhang et al., 2020). To reduce these adverse impacts, in December 2015, the United Nations Framework Convention on Climate Change (UNFCCC) adopted the Paris Agreement, which provides a framework for global action to address climate change. At this meeting, the Paris Agreement set a target to keep global warming below 2.0 C and to persist with efforts to hold the warming under 1.5 C above preindustrial days (UNFCCC, 2015). Furthermore, the Special Report on Global Warming of 1.5 C released in 2018 also claimed that limiting global warming to 1.5 C instead of 2 C, could “reduce the number of people both exposed to climate-related risks and susceptible to poverty by up to several hundred million by 2050” (IPCC, 2018). Consequently, the 1.5 C and 2 C issues have become major research (Schleussner et al., 2016; Sanderson et al., 2017; Shi et al., 2018; Fu et al., 2018; Hu et al., 2019). * Corresponding author. E-mail address: [email protected] (ZENG G.). Peer review under responsibility of National Climate Center (China Meteorological Administration). Please cite this article as: ZHANG, G.-W., et al., Regional changes in extreme heat events in China under stabilized 1.5 C and 2.0 C global warming, Advances in Climate Change Research, https://doi.org/10.1016/j.accre.2020.08.003 Available online at www.sciencedirect.com ScienceDirect Advances in Climate Change Research xxx (xxxx) xxx www.keaipublishing.com/en/journals/accr/ + MODEL https://doi.org/10.1016/j.accre.2020.08.003 1674-9278/Copyright © 2020, National Climate Center (China Meteorological Administration). Production and hosting by Elsevier B.V. on behalf of KeAi. This is an open access article under the CC BY-NC-ND license (http://creativecommons.org/licenses/by-nc-nd/4.0/).
Transcript of Regional changes in extreme heat events in China under ...
Available online at www.sciencedirect.com
+ MODEL
ScienceDirect
Advances in Climate Change Research xxx (xxxx) xxxwww.keaipublishing.com/en/journals/accr/
Regional changes in extreme heat events in China under stabilized 1.5 �Cand 2.0 �C global warming
ZHANG Gu-Weia, ZENG Ganga,*, Vedaste IYAKAREMYEa, YOU Qing-Longb
a Key Laboratory of Meteorological Disaster of Ministry of Education (KLME), Collaborative Innovation Center on Forecast and Evaluation of Meteorological
Disasters (CIC-FEMD), Nanjing University of Information Science and Technology, Nanjing, 210044, Chinab Department of Atmospheric and Oceanic Sciences, Institute of Atmospheric Sciences, Fudan University, Shanghai, 200433, China
Received 1 March 2020; revised 29 May 2020; accepted 31 August 2020
Abstract
Extreme heat events (EHEs) have a significant impact on the social economy and human health. China is a country with a large populationand diverse terrain, and it is necessary to project future extreme heat changes in the sub-regions. This study used a specially designed dataset, theCommunity Earth System Model (CESM) simulations, namely CESM low-warming, to investigate the EHEs in China under 1.5 �C and 2.0 �Cglobal warming. The results indicate that the regional mean warming over China will exceed the global average, about 1.63 �C and 2.24 �C in1.5 �C and 2.0 �C warmer futures. Compared to the present-day (1976e2005), the frequency and duration of the EHEs in South China areprojected to increase the most among the sub-regions. For example, the frequency of EHEs in South China at 1.5 �C and 2.0 �C warming willexceed 3 and 3.5 times the present-day level. However, when global warming rises from 1.5 �C to 2.0 �C, the increased impacts relative to the1.5 �C warming level will be the lowest in South China (less than 40%), and the highest increased impacts are projected to appear in NortheastChina (53%e84%) and Northwest China (53%e107%). The main reason for this situation is that compared with the 1.5 �C scenario, the upperzonal westerly in northern China weakens and the continental high pressure enhances under the 2.0 �C scenario. Therefore, limiting globalwarming at 1.5 �C instead of 2.0 �C is beneficial for eliminating extreme heat events, especially for Northeast China and Northwest China.
Keywords: China; Regional changes; Extreme heat events; 1.5 �C and 2.0 �C global warming; CESM low-warming
1. Introduction
The Intergovernmental Panel on Climate Change (IPCC,2013) reported that the global mean temperature (GMT) hadrisen about 0.85 �C (0.65e1.06 �C) from 1880 to 2012. Sevenyears later in 2020, the World Meteorological Organization(WMO) declared that global warming had reached 1.1 �C in2019 and 2010e2019 was the hottest decade on record(WMO, 2020). Rapid global warming will likely have hugenegative impacts on the social economy and human health(Robine et al., 2008; Seneviratne et al., 2016; Zhang et al.,
* Corresponding author.
E-mail address: [email protected] (ZENG G.).
Peer review under responsibility of National Climate Center (China
Meteorological Administration).
Please cite this article as: ZHANG, G.-W., et al., Regional changes in extreme heat
in Climate Change Research, https://doi.org/10.1016/j.accre.2020.08.003
https://doi.org/10.1016/j.accre.2020.08.003
1674-9278/Copyright © 2020, National Climate Center (China Meteorological A
This is an open access article under the CC BY-NC-ND license (http://creativec
2020). To reduce these adverse impacts, in December 2015,the United Nations Framework Convention on ClimateChange (UNFCCC) adopted the Paris Agreement, whichprovides a framework for global action to address climatechange. At this meeting, the Paris Agreement set a target tokeep global warming below 2.0 �C and to persist with effortsto hold the warming under 1.5 �C above preindustrial days(UNFCCC, 2015). Furthermore, the Special Report on GlobalWarming of 1.5 �C released in 2018 also claimed that limitingglobal warming to 1.5 �C instead of 2 �C, could “reduce thenumber of people both exposed to climate-related risks andsusceptible to poverty by up to several hundred million by2050” (IPCC, 2018). Consequently, the 1.5 �C and 2 �C issueshave become major research (Schleussner et al., 2016;Sanderson et al., 2017; Shi et al., 2018; Fu et al., 2018; Huet al., 2019).
events in China under stabilized 1.5 �C and 2.0 �C global warming, Advances
dministration). Production and hosting by Elsevier B.V. on behalf of KeAi.
ommons.org/licenses/by-nc-nd/4.0/).

2 ZHANG G.-W. et al. / Advances in Climate Change Research xxx (xxxx) xxx
+ MODEL
The extreme heat events (EHEs) have significantlyincreased with global warming over the past decades (Smithet al., 2013; Yu et al., 2017; Zhang et al., 2020). Long-termEHEs will destroy infrastructure and overburdened elec-tricity and water facilities, which will have a major impact onthe social economy (Wilbanks et al., 2012). In developingcountries, when global warming rises by 2 �C, elevated heatstress will cause work productivity loss by one month per year(Yu et al., 2019). While most importantly, exposure to extremeheat increases morbidity and mortality (Robine et al., 2008;Grumm, 2011; Fischer and Knutti, 2015). The 2003 heatwavebroke the record for the hottest summer in Europe and killedmore than 4000 people (Barriopedro et al., 2011). In 2010,about 55,000 people in Russia died as a result of the heatwave(Hoag, 2014).
China is a huge energy consumer and the most populouscountry in the world and its surface air temperature (SAT) hasincreased by 0.9e1.5 �C since 1909, which is higher than theglobal average (CTNARCC, 2015). Due to an aging popula-tion, high density and high mobility, and weak infrastructurefor disaster prevention and mitigation, China is vulnerable toextreme climate events (Ding et al., 2010; Qin, 2015). Sincethis century, China has experienced several EHEs. In thesummer of 2013, East China experienced the hottest August,and Shanghai broke the high-temperature record, whichcaused dozens of deaths (Sun, 2014). Ye et al. (2014) showedthat EHEs in China have generally increased significantly, andthe areas affected by severe events had expanded significantlysince the 1990s. Due to the EHEs, the labor force during thesummer's peak period could be reduced by more than 60% inChina (Wang and Zhang, 2019). Thus, to formulate policiesand adapt to climate change, it is necessary to quantify thepotential impact of 1.5 �C and 2 �C warming on China.
Previous studies have extracted the output simulationsfrom the Coupled Model Intercomparison Program Phase 5(CMIP5) and selected the periods when global warmingreached 1.5 �C and 2 �C under the specific RepresentativeConcentration Pathway scenarios (Wang et al., 2017; Xuet al., 2017). For instance, the future changes in surfacetemperature in many areas in China will exceed the 1.5 �Cand 2.0 �C thresholds earlier than the global warming (Chenet al., 2013; Fu et al., 2018; Shi et al., 2018). Huang et al.(2017) investigated the impacts of 1.5 �C and 2 �C warm-ing on global drylands by using CMIP5 results and pointedout that the rising rate of surface temperature increases withthe decrease in vegetation coverage. However, there are somedrawbacks in using CMIP5 model outputs (James et al.,2017; Lin et al., 2018). In the CMIP5 simulation, globalwarming will only briefly reach 1.5 �C and 2 �C, and thencontinue to rise, which cause the impacts between the short-term and stable warming periods quite different, especiallyfor regional investigations (James et al., 2017). The NationalCenter for Atmospheric Research (NCAR) has released a setof climate simulations focused on the 1.5 �C and 2.0 �C is-sues, named Community Earth System Model (CESM) low-warming, which is based on a fully coupled model withequilibrium climates in 1.5 �C and 2.0 �C world. Unlike the
Please cite this article as: ZHANG, G.-W., et al., Regional changes in extreme heat
in Climate Change Research, https://doi.org/10.1016/j.accre.2020.08.003
warming periods derived from CMIP5 were increasing, theCESM low-warming simulations were designed particularlyfor 1.5 �C and 2.0 �C issues, which contain a 30-year period(2071e2100) that the global warming stabled at the specificthresholds. Based on the CESM low-warming datasets, someresearchers have provided the future projections in EHEsover China (Li et al., 2018; Yang et al., 2018; Lin et al., 2018;Chen and Sun, 2019), and they found that the increasedtemperature in 1.5 �C and 2.0 �C periods over China wereprojected to be about 10% higher than the global average, andthe EHEs would increase significantly with stronger impactsunder 2.0 �C warming. However, a major problem is that theymostly consider China as a whole region and rarely discussthe projections in sub-regions in China. Since ecologicalenvironments and economies in different regions couldrespond differently to global warming, it is necessary toinvestigate the future changes in EHEs over sub-regions inChina.
This study mainly focuses on the regional future pro-jections in the EHEs in China under 1.5 �C and 2.0 �C globalwarming and tends to address the following questions: 1) Howwill the EHEs change in different sub-regions in China? 2)Comparing 2.0 �C with 1.5 �C warming scenario, in whichsub-region the EHEs will increase the most and how will theassociated key atmospheric circulations change?
2. Data and methods
2.1. Observed data
China's daily observed SAT data (CN05, Wu and Gao,2013) from 1961 to 2014, with 0.5� horizontal resolution, isused to correct the bias of simulated EHEs (Xu et al., 2009).
2.2. Model data
The NCAR CESM large-ensemble (CESM-LE) simulationsare used to represent the historical data in 1850e2005 (Kayet al., 2015). All the simulations are conducted using theCommunity Atmosphere Model version 5 in CESM 1(CESM1-CAM5) (Hurrell et al., 2013). The CESM1-CAM5consists of coupled land, atmosphere, sea ice, and oceancomponent models (Lawrence et al., 2012; Moore et al., 2013;Kay et al., 2015). CESM-LE simulations include forty-twoensemble members, one of which is from 1850 to 2005, andthe other 41 members are from 1920 to 2005. Details onCESM-LE can be found in Kay et al. (2015).
The NCAR CESM low-warming projections are used toanalyze changes in 1.5 �C and 2.0 �C warmer futures. TheMinimal Complexity Earth Simulator model (MiCES, 2016) isused to simulate the pathways of greenhouse gas to obtain aperiod of stable 1.5 �C and 2 �C above the preindustrial level(1850e1919). From 2006 to 2100, the emission pathwaysderived from MiCES are used in the 11 members of the futureprojections. All the forcings, such as ozone and aerosolemissions, follow the representative concentration pathway8.5. The projections show a long period (2071e2100) of the
events in China under stabilized 1.5 �C and 2.0 �C global warming, Advances
3ZHANG G.-W. et al. / Advances in Climate Change Research xxx (xxxx) xxx
+ MODEL
global mean temperature stabilized at 1.5 �C and 2.0 �C abovethe preindustrial level. Details of the simulations can be foundin Sanderson et al. (2017).
2.3. Period of preindustrial, present-day, 1.5 �C, and 2 �C
The years 1976e2005 represent present-day, and the pre-industrial period is 1850e1919. The years 2071e2100 arereferred to as the stable period for 1.5 �C and 2.0 �C globalwarming (Sanderson et al., 2017).
2.4. Extreme heat indices
Six extreme heat indices (Meehl and Tebaldi, 2004; Smithet al., 2013; Li et al., 2018) of 1976e2100 simulations arecalculated (Table 1).
2.5. Bias-correction
The method described in Jung (2005) is adopted to correctbias in EHEs indices relative to CN05 data.
RBC¼RModel �DR ð1Þ
DR¼R0Model �R0
Obs ð2ÞHere, RModel and RBC are the projected and bias-corrected
daily SAT, respectively; R0Obs and R0
Model represent theaverage value of observed and projected data in 1976e2005,respectively; and DR represents the biases.
2.6. Probability ratio
The following formula is used to calculate the probabilityratios (PR) (Yu et al., 2017; Li et al., 2018) of EHEs indifferent regions:
PR¼P1=P0 ð3ÞHere, P0 is the probability for the present-day
(1976e2005), and P1 is the probability for the future days(2071e2100).
Table 1
Definitions of extreme heat indices.
Acronym Indicator Definition
TXx Warmest day Maximum Tmax in
TNx Warmest night Maximum Tmin in
TX90p Warm days Annual number of
TN90p Warm nights Annual number of
WSDI Warm spell duration indicator Annual number of d
90% percentile of t
HW Heatwave A heatwave is defin
1) at least three con
level in summer (Ju
95% percentile of t
the period exceeds
Note: Tmax (Tmin) means daily maximum (minimum) SAT.
Please cite this article as: ZHANG, G.-W., et al., Regional changes in extreme heat
in Climate Change Research, https://doi.org/10.1016/j.accre.2020.08.003
2.7. Increased impacts
The increased impacts (IC ) of EHEs caused by an addi-tional 0.5 �C warming is investigated by using the following:
IC¼½ðC2:0�C1:5Þ=C1:5� � 100% ð4Þwhere C2.0 and C1.5 represent the changes in 2.0 �C and 1.5 �Cwarming, respectively, relative to the present-day level.
2.8. Sub-regions
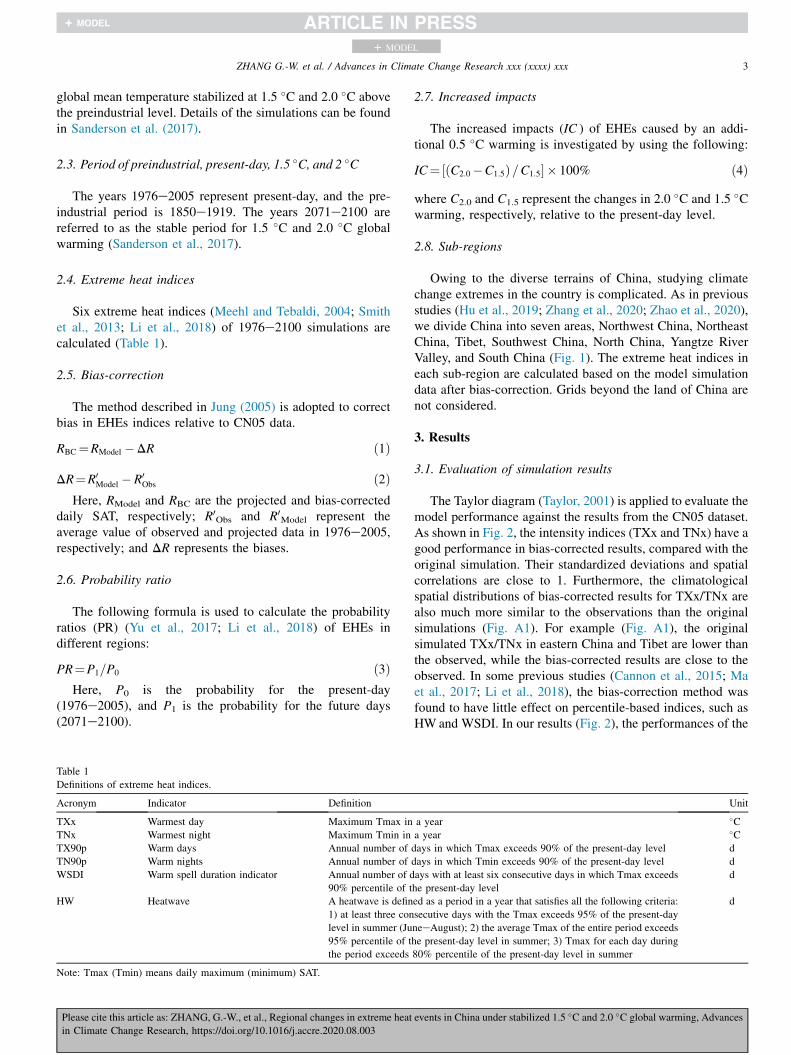
Owing to the diverse terrains of China, studying climatechange extremes in the country is complicated. As in previousstudies (Hu et al., 2019; Zhang et al., 2020; Zhao et al., 2020),we divide China into seven areas, Northwest China, NortheastChina, Tibet, Southwest China, North China, Yangtze RiverValley, and South China (Fig. 1). The extreme heat indices ineach sub-region are calculated based on the model simulationdata after bias-correction. Grids beyond the land of China arenot considered.
3. Results
3.1. Evaluation of simulation results
The Taylor diagram (Taylor, 2001) is applied to evaluate themodel performance against the results from the CN05 dataset.As shown in Fig. 2, the intensity indices (TXx and TNx) have agood performance in bias-corrected results, compared with theoriginal simulation. Their standardized deviations and spatialcorrelations are close to 1. Furthermore, the climatologicalspatial distributions of bias-corrected results for TXx/TNx arealso much more similar to the observations than the originalsimulations (Fig. A1). For example (Fig. A1), the originalsimulated TXx/TNx in eastern China and Tibet are lower thanthe observed, while the bias-corrected results are close to theobserved. In some previous studies (Cannon et al., 2015; Maet al., 2017; Li et al., 2018), the bias-correction method wasfound to have little effect on percentile-based indices, such asHW and WSDI. In our results (Fig. 2), the performances of the
Unit
a year �Ca year �Cdays in which Tmax exceeds 90% of the present-day level d
days in which Tmin exceeds 90% of the present-day level d
ays with at least six consecutive days in which Tmax exceeds
he present-day level
d
ed as a period in a year that satisfies all the following criteria:
secutive days with the Tmax exceeds 95% of the present-day
neeAugust); 2) the average Tmax of the entire period exceeds
he present-day level in summer; 3) Tmax for each day during
80% percentile of the present-day level in summer
d
events in China under stabilized 1.5 �C and 2.0 �C global warming, Advances
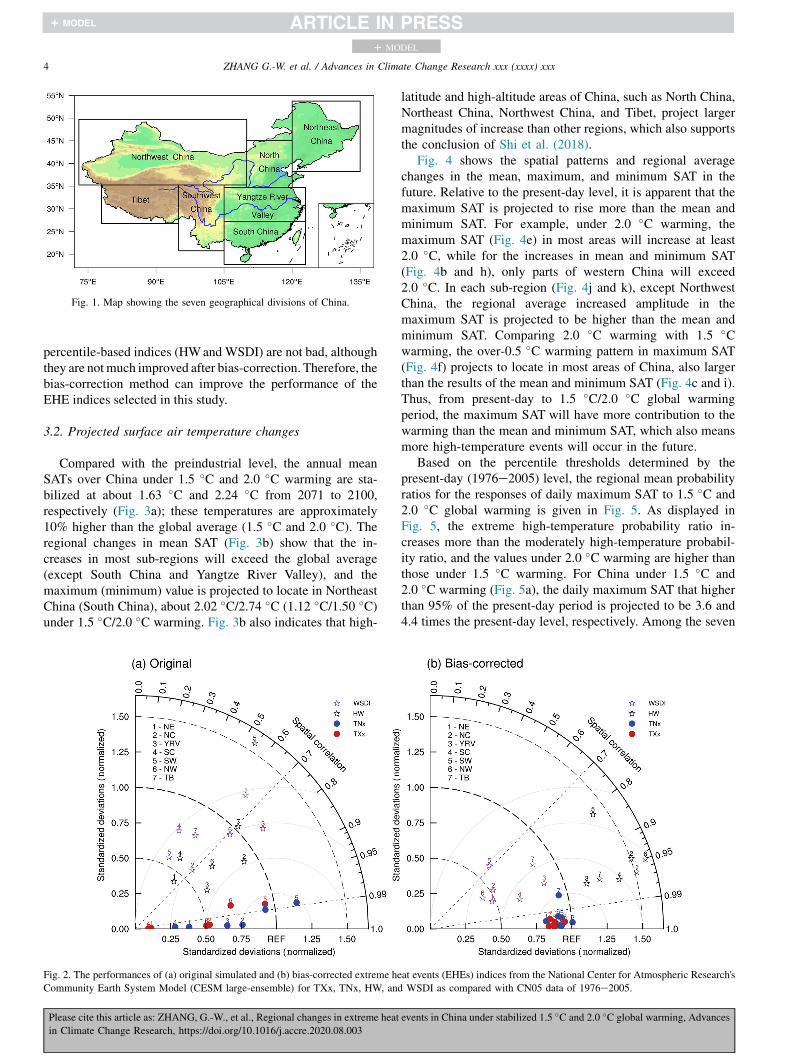
Fig. 1. Map showing the seven geographical divisions of China.
4 ZHANG G.-W. et al. / Advances in Climate Change Research xxx (xxxx) xxx
+ MODEL
percentile-based indices (HWand WSDI) are not bad, althoughthey are notmuch improved after bias-correction. Therefore, thebias-correction method can improve the performance of theEHE indices selected in this study.
3.2. Projected surface air temperature changes
Compared with the preindustrial level, the annual meanSATs over China under 1.5 �C and 2.0 �C warming are sta-bilized at about 1.63 �C and 2.24 �C from 2071 to 2100,respectively (Fig. 3a); these temperatures are approximately10% higher than the global average (1.5 �C and 2.0 �C). Theregional changes in mean SAT (Fig. 3b) show that the in-creases in most sub-regions will exceed the global average(except South China and Yangtze River Valley), and themaximum (minimum) value is projected to locate in NortheastChina (South China), about 2.02 �C/2.74 �C (1.12 �C/1.50 �C)under 1.5 �C/2.0 �C warming. Fig. 3b also indicates that high-
Fig. 2. The performances of (a) original simulated and (b) bias-corrected extreme he
Community Earth System Model (CESM large-ensemble) for TXx, TNx, HW, and
Please cite this article as: ZHANG, G.-W., et al., Regional changes in extreme heat
in Climate Change Research, https://doi.org/10.1016/j.accre.2020.08.003
latitude and high-altitude areas of China, such as North China,Northeast China, Northwest China, and Tibet, project largermagnitudes of increase than other regions, which also supportsthe conclusion of Shi et al. (2018).
Fig. 4 shows the spatial patterns and regional averagechanges in the mean, maximum, and minimum SAT in thefuture. Relative to the present-day level, it is apparent that themaximum SAT is projected to rise more than the mean andminimum SAT. For example, under 2.0 �C warming, themaximum SAT (Fig. 4e) in most areas will increase at least2.0 �C, while for the increases in mean and minimum SAT(Fig. 4b and h), only parts of western China will exceed2.0 �C. In each sub-region (Fig. 4j and k), except NorthwestChina, the regional average increased amplitude in themaximum SAT is projected to be higher than the mean andminimum SAT. Comparing 2.0 �C warming with 1.5 �Cwarming, the over-0.5 �C warming pattern in maximum SAT(Fig. 4f) projects to locate in most areas of China, also largerthan the results of the mean and minimum SAT (Fig. 4c and i).Thus, from present-day to 1.5 �C/2.0 �C global warmingperiod, the maximum SAT will have more contribution to thewarming than the mean and minimum SAT, which also meansmore high-temperature events will occur in the future.
Based on the percentile thresholds determined by thepresent-day (1976e2005) level, the regional mean probabilityratios for the responses of daily maximum SAT to 1.5 �C and2.0 �C global warming is given in Fig. 5. As displayed inFig. 5, the extreme high-temperature probability ratio in-creases more than the moderately high-temperature probabil-ity ratio, and the values under 2.0 �C warming are higher thanthose under 1.5 �C warming. For China under 1.5 �C and2.0 �C warming (Fig. 5a), the daily maximum SAT that higherthan 95% of the present-day period is projected to be 3.6 and4.4 times the present-day level, respectively. Among the seven
at events (EHEs) indices from the National Center for Atmospheric Research'sWSDI as compared with CN05 data of 1976e2005.
events in China under stabilized 1.5 �C and 2.0 �C global warming, Advances
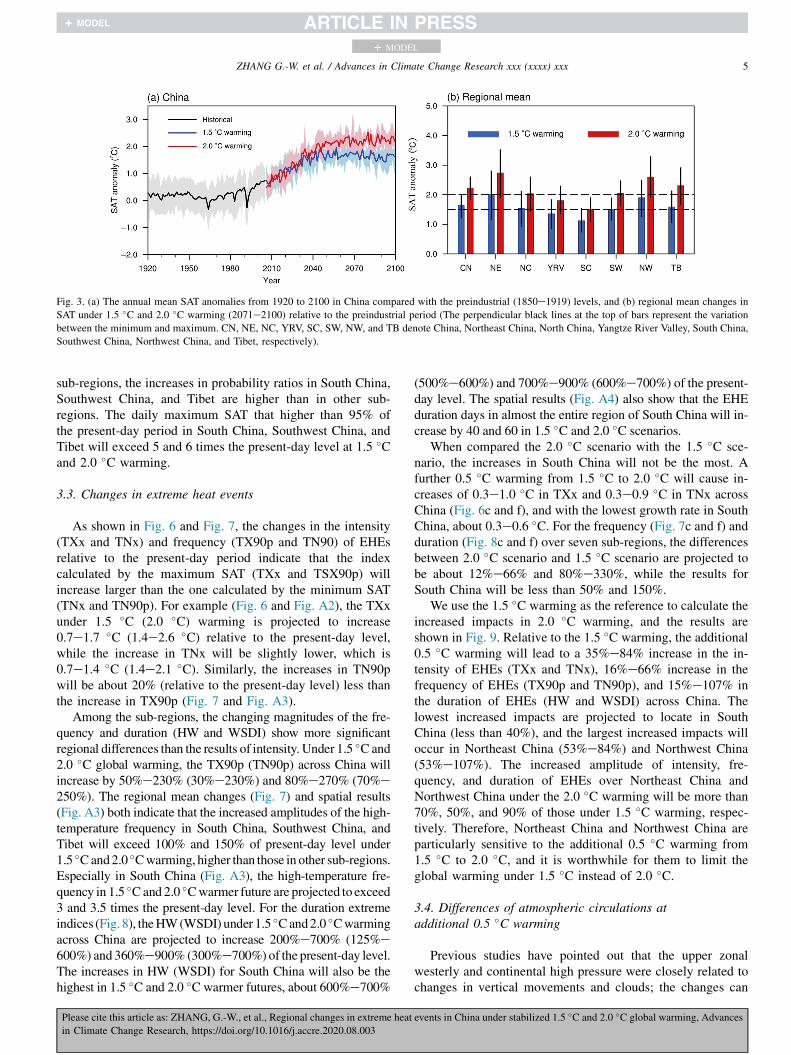
Fig. 3. (a) The annual mean SAT anomalies from 1920 to 2100 in China compared with the preindustrial (1850e1919) levels, and (b) regional mean changes in
SAT under 1.5 �C and 2.0 �C warming (2071e2100) relative to the preindustrial period (The perpendicular black lines at the top of bars represent the variation
between the minimum and maximum. CN, NE, NC, YRV, SC, SW, NW, and TB denote China, Northeast China, North China, Yangtze River Valley, South China,
Southwest China, Northwest China, and Tibet, respectively).
5ZHANG G.-W. et al. / Advances in Climate Change Research xxx (xxxx) xxx
+ MODEL
sub-regions, the increases in probability ratios in South China,Southwest China, and Tibet are higher than in other sub-regions. The daily maximum SAT that higher than 95% ofthe present-day period in South China, Southwest China, andTibet will exceed 5 and 6 times the present-day level at 1.5 �Cand 2.0 �C warming.
3.3. Changes in extreme heat events
As shown in Fig. 6 and Fig. 7, the changes in the intensity(TXx and TNx) and frequency (TX90p and TN90) of EHEsrelative to the present-day period indicate that the indexcalculated by the maximum SAT (TXx and TSX90p) willincrease larger than the one calculated by the minimum SAT(TNx and TN90p). For example (Fig. 6 and Fig. A2), the TXxunder 1.5 �C (2.0 �C) warming is projected to increase0.7e1.7 �C (1.4e2.6 �C) relative to the present-day level,while the increase in TNx will be slightly lower, which is0.7e1.4 �C (1.4e2.1 �C). Similarly, the increases in TN90pwill be about 20% (relative to the present-day level) less thanthe increase in TX90p (Fig. 7 and Fig. A3).
Among the sub-regions, the changing magnitudes of the fre-quency and duration (HW and WSDI) show more significantregional differences than the results of intensity. Under 1.5 �C and2.0 �C global warming, the TX90p (TN90p) across China willincrease by 50%e230% (30%e230%) and 80%e270% (70%e250%). The regional mean changes (Fig. 7) and spatial results(Fig. A3) both indicate that the increased amplitudes of the high-temperature frequency in South China, Southwest China, andTibet will exceed 100% and 150% of present-day level under1.5 �Cand2.0 �Cwarming, higher than those in other sub-regions.Especially in South China (Fig. A3), the high-temperature fre-quency in 1.5 �Cand 2.0 �Cwarmer future are projected to exceed3 and 3.5 times the present-day level. For the duration extremeindices (Fig. 8), theHW(WSDI) under 1.5 �Cand2.0 �Cwarmingacross China are projected to increase 200%e700% (125%e600%) and 360%e900% (300%e700%) of the present-day level.The increases in HW (WSDI) for South China will also be thehighest in 1.5 �C and 2.0 �C warmer futures, about 600%e700%
Please cite this article as: ZHANG, G.-W., et al., Regional changes in extreme heat
in Climate Change Research, https://doi.org/10.1016/j.accre.2020.08.003
(500%e600%) and 700%e900% (600%e700%) of the present-day level. The spatial results (Fig. A4) also show that the EHEduration days in almost the entire region of South China will in-crease by 40 and 60 in 1.5 �C and 2.0 �C scenarios.
When compared the 2.0 �C scenario with the 1.5 �C sce-nario, the increases in South China will not be the most. Afurther 0.5 �C warming from 1.5 �C to 2.0 �C will cause in-creases of 0.3e1.0 �C in TXx and 0.3e0.9 �C in TNx acrossChina (Fig. 6c and f), and with the lowest growth rate in SouthChina, about 0.3e0.6 �C. For the frequency (Fig. 7c and f) andduration (Fig. 8c and f) over seven sub-regions, the differencesbetween 2.0 �C scenario and 1.5 �C scenario are projected tobe about 12%e66% and 80%e330%, while the results forSouth China will be less than 50% and 150%.
We use the 1.5 �C warming as the reference to calculate theincreased impacts in 2.0 �C warming, and the results areshown in Fig. 9. Relative to the 1.5 �C warming, the additional0.5 �C warming will lead to a 35%e84% increase in the in-tensity of EHEs (TXx and TNx), 16%e66% increase in thefrequency of EHEs (TX90p and TN90p), and 15%e107% inthe duration of EHEs (HW and WSDI) across China. Thelowest increased impacts are projected to locate in SouthChina (less than 40%), and the largest increased impacts willoccur in Northeast China (53%e84%) and Northwest China(53%e107%). The increased amplitude of intensity, fre-quency, and duration of EHEs over Northeast China andNorthwest China under the 2.0 �C warming will be more than70%, 50%, and 90% of those under 1.5 �C warming, respec-tively. Therefore, Northeast China and Northwest China areparticularly sensitive to the additional 0.5 �C warming from1.5 �C to 2.0 �C, and it is worthwhile for them to limit theglobal warming under 1.5 �C instead of 2.0 �C.
3.4. Differences of atmospheric circulations atadditional 0.5 �C warming
Previous studies have pointed out that the upper zonalwesterly and continental high pressure were closely related tochanges in vertical movements and clouds; the changes can
events in China under stabilized 1.5 �C and 2.0 �C global warming, Advances
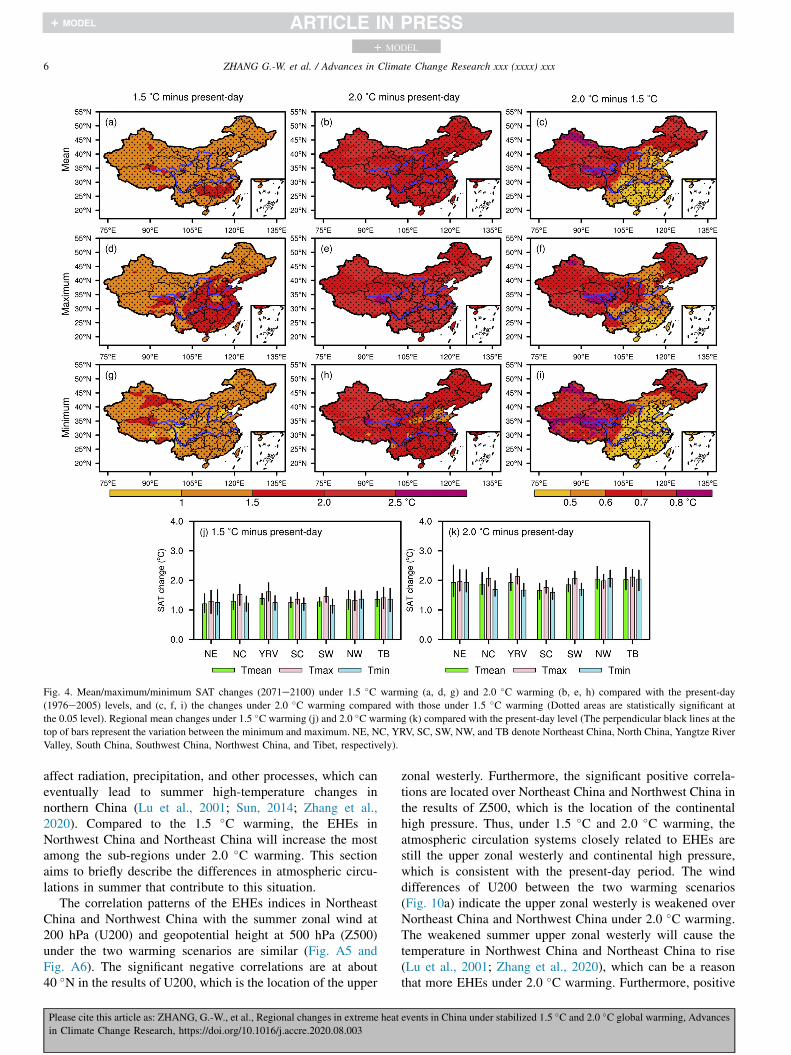
Fig. 4. Mean/maximum/minimum SAT changes (2071e2100) under 1.5 �C warming (a, d, g) and 2.0 �C warming (b, e, h) compared with the present-day
(1976e2005) levels, and (c, f, i) the changes under 2.0 �C warming compared with those under 1.5 �C warming (Dotted areas are statistically significant at
the 0.05 level). Regional mean changes under 1.5 �C warming (j) and 2.0 �C warming (k) compared with the present-day level (The perpendicular black lines at the
top of bars represent the variation between the minimum and maximum. NE, NC, YRV, SC, SW, NW, and TB denote Northeast China, North China, Yangtze River
Valley, South China, Southwest China, Northwest China, and Tibet, respectively).
6 ZHANG G.-W. et al. / Advances in Climate Change Research xxx (xxxx) xxx
+ MODEL
affect radiation, precipitation, and other processes, which caneventually lead to summer high-temperature changes innorthern China (Lu et al., 2001; Sun, 2014; Zhang et al.,2020). Compared to the 1.5 �C warming, the EHEs inNorthwest China and Northeast China will increase the mostamong the sub-regions under 2.0 �C warming. This sectionaims to briefly describe the differences in atmospheric circu-lations in summer that contribute to this situation.
The correlation patterns of the EHEs indices in NortheastChina and Northwest China with the summer zonal wind at200 hPa (U200) and geopotential height at 500 hPa (Z500)under the two warming scenarios are similar (Fig. A5 andFig. A6). The significant negative correlations are at about40 �N in the results of U200, which is the location of the upper
Please cite this article as: ZHANG, G.-W., et al., Regional changes in extreme heat
in Climate Change Research, https://doi.org/10.1016/j.accre.2020.08.003
zonal westerly. Furthermore, the significant positive correla-tions are located over Northeast China and Northwest China inthe results of Z500, which is the location of the continentalhigh pressure. Thus, under 1.5 �C and 2.0 �C warming, theatmospheric circulation systems closely related to EHEs arestill the upper zonal westerly and continental high pressure,which is consistent with the present-day period. The winddifferences of U200 between the two warming scenarios(Fig. 10a) indicate the upper zonal westerly is weakened overNortheast China and Northwest China under 2.0 �C warming.The weakened summer upper zonal westerly will cause thetemperature in Northwest China and Northeast China to rise(Lu et al., 2001; Zhang et al., 2020), which can be a reasonthat more EHEs under 2.0 �C warming. Furthermore, positive
events in China under stabilized 1.5 �C and 2.0 �C global warming, Advances
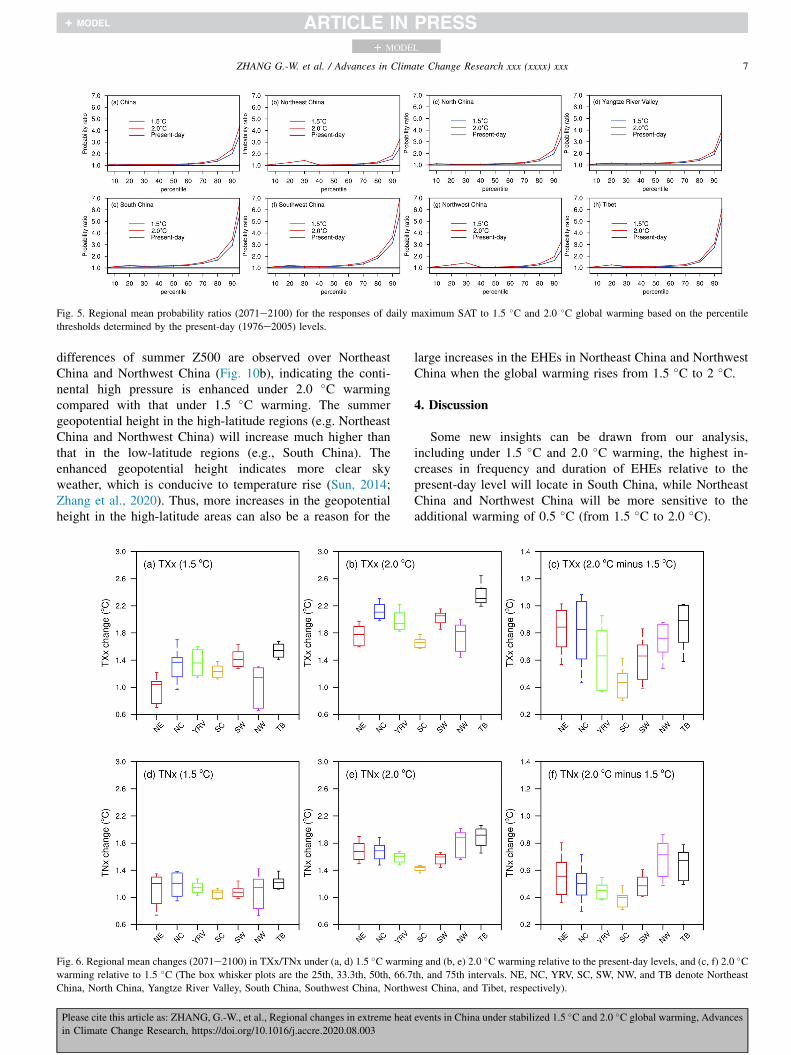
Fig. 5. Regional mean probability ratios (2071e2100) for the responses of daily maximum SAT to 1.5 �C and 2.0 �C global warming based on the percentile
thresholds determined by the present-day (1976e2005) levels.
7ZHANG G.-W. et al. / Advances in Climate Change Research xxx (xxxx) xxx
+ MODEL
differences of summer Z500 are observed over NortheastChina and Northwest China (Fig. 10b), indicating the conti-nental high pressure is enhanced under 2.0 �C warmingcompared with that under 1.5 �C warming. The summergeopotential height in the high-latitude regions (e.g. NortheastChina and Northwest China) will increase much higher thanthat in the low-latitude regions (e.g., South China). Theenhanced geopotential height indicates more clear skyweather, which is conducive to temperature rise (Sun, 2014;Zhang et al., 2020). Thus, more increases in the geopotentialheight in the high-latitude areas can also be a reason for the
Fig. 6. Regional mean changes (2071e2100) in TXx/TNx under (a, d) 1.5 �C warmi
warming relative to 1.5 �C (The box whisker plots are the 25th, 33.3th, 50th, 66.7
China, North China, Yangtze River Valley, South China, Southwest China, Northw
Please cite this article as: ZHANG, G.-W., et al., Regional changes in extreme heat
in Climate Change Research, https://doi.org/10.1016/j.accre.2020.08.003
large increases in the EHEs in Northeast China and NorthwestChina when the global warming rises from 1.5 �C to 2 �C.
4. Discussion
Some new insights can be drawn from our analysis,including under 1.5 �C and 2.0 �C warming, the highest in-creases in frequency and duration of EHEs relative to thepresent-day level will locate in South China, while NortheastChina and Northwest China will be more sensitive to theadditional warming of 0.5 �C (from 1.5 �C to 2.0 �C).
ng and (b, e) 2.0 �C warming relative to the present-day levels, and (c, f) 2.0 �Cth, and 75th intervals. NE, NC, YRV, SC, SW, NW, and TB denote Northeast
est China, and Tibet, respectively).
events in China under stabilized 1.5 �C and 2.0 �C global warming, Advances
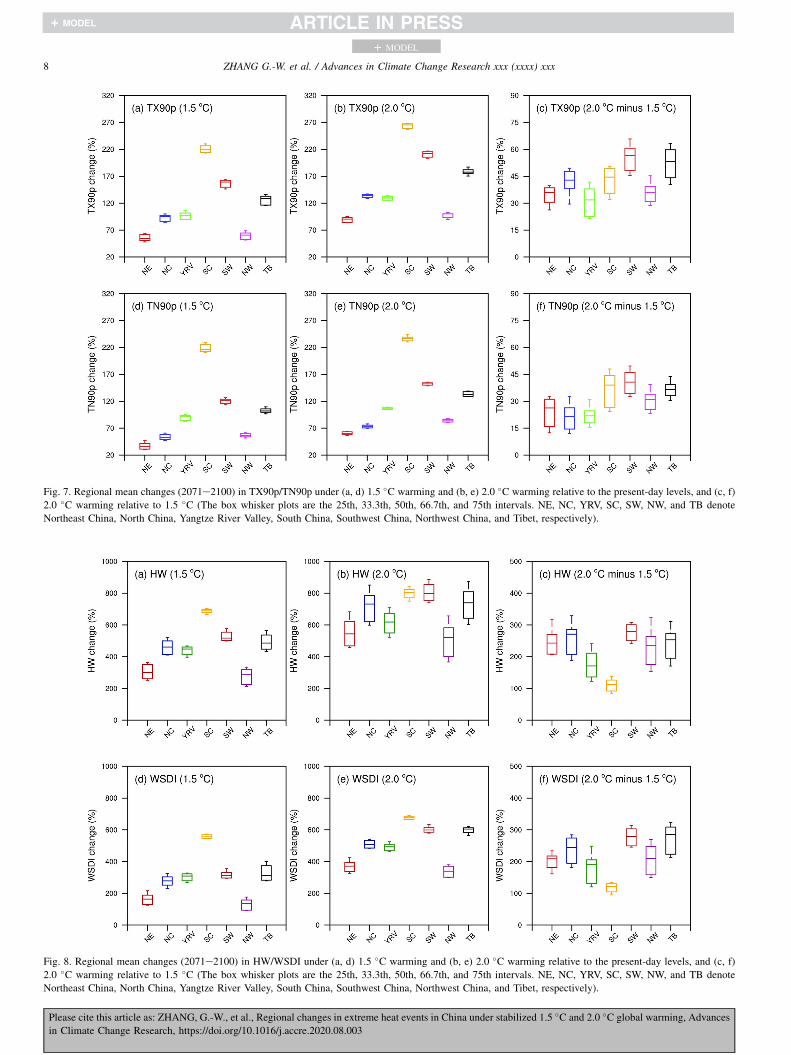
Fig. 7. Regional mean changes (2071e2100) in TX90p/TN90p under (a, d) 1.5 �C warming and (b, e) 2.0 �C warming relative to the present-day levels, and (c, f)
2.0 �C warming relative to 1.5 �C (The box whisker plots are the 25th, 33.3th, 50th, 66.7th, and 75th intervals. NE, NC, YRV, SC, SW, NW, and TB denote
Northeast China, North China, Yangtze River Valley, South China, Southwest China, Northwest China, and Tibet, respectively).
Fig. 8. Regional mean changes (2071e2100) in HW/WSDI under (a, d) 1.5 �C warming and (b, e) 2.0 �C warming relative to the present-day levels, and (c, f)
2.0 �C warming relative to 1.5 �C (The box whisker plots are the 25th, 33.3th, 50th, 66.7th, and 75th intervals. NE, NC, YRV, SC, SW, NW, and TB denote
Northeast China, North China, Yangtze River Valley, South China, Southwest China, Northwest China, and Tibet, respectively).
8 ZHANG G.-W. et al. / Advances in Climate Change Research xxx (xxxx) xxx
+ MODEL
Please cite this article as: ZHANG, G.-W., et al., Regional changes in extreme heat events in China under stabilized 1.5 �C and 2.0 �C global warming, Advances
in Climate Change Research, https://doi.org/10.1016/j.accre.2020.08.003

Fig. 9. The increased impacts of EHEs in sub-regions at 2.0 �C compared with those at 1.5 �C warming.
9ZHANG G.-W. et al. / Advances in Climate Change Research xxx (xxxx) xxx
+ MODEL
However, there are still some limitations. For instance, thebias-correction method used in this study has not improvedmuch performance on the duration extreme indices (WSDI andHW), and this is also in line with Li et al. (2018). To obtainmore reliable results in future projection, it is important toreduce the bias of the model. Thus, various bias-correctionmethods (e.g., machine learning; Grover et al., 2019) anddynamic downscaling method (e.g., CWRF; Liang et al.,2019) should be used to further study. Additionally, thewarming over China under 1.5 �C and 2.0 �C this scenario inour study are 1.63 �C and 2.24 �C, relatively lower than thosestudies using CMIP5 outputs (1.7e2.0 �C and 2.4e2.7 �C, Fuet al., 2018). It's probably caused by different model designs.As concluded in Lin et al. (2018), the CESM low-warmingsimulations were more in line with the scenario set by theParis Agreement. However, only one fully coupled climatemodel (CESM) simulation is not enough. More climatemodels are needed to perform stable warming projections, andthe multi-model results will be more convincing. Furthermore,it is worth studying the impacts of extreme high temperatureson humans, nature, and social economy (Fischer et al., 2012;Lee and Min, 2018; He et al., 2017). We have found that SouthChina would face the frequency of EHEs exceeding 600%/700% of the present-day level under 1.5 �C/2.0 �C warming.As a densely populated and economically developed area(Jiang et al., 2017, 2018; Zhu et al., 2020), it is necessary toinvestigate the impacts on the population and the economycaused by high temperatures in South China. Meanwhile, forNortheast China and Northwest China, as the largest forestryarea and the arid areas in China (Tao et al., 2013; Huang et al.,2017), the EHEs under 2.0 �C warming will be hugelydifferent with those under 1.5 �C warming. Continuousexposure to high temperatures may increase the frequency andintensity of forest fires, and the likelihood of tree deathscaused by droughts and high temperatures worldwide mayincrease (Allen et al., 2004). Moreover, warming will also
Please cite this article as: ZHANG, G.-W., et al., Regional changes in extreme heat
in Climate Change Research, https://doi.org/10.1016/j.accre.2020.08.003
boost evaporation, which dries out the soil and exacerbatesdrought (Chai et al., 2018; Miralles et al., 2018). Increasingdrought will affect agricultural products in Northwest China,such as wheat and cotton (Wang et al., 2008). Thus, quanti-fying the future risks caused by high temperatures in NortheastChina and Northwest China, such as forest fires (Li et al.,2019) and drought (Huang et al., 2017), are also worthwhile.
In summary, this study projected future EHE changes inChina's sub-regions under 1.5 �C and 2.0 �C warming, whichcan provide the basis for an in-depth regional study.
5. Conclusions
For climate change adaption and international climate ne-gotiations, it is essential to understand how the regionalclimate responds to the 1.5 �C and 2.0 �C global warming.Here, we used the CESM low-warming simulations to projectfuture changes in extreme heat events (EHEs) over China'ssub-regions. The conclusions are summarized as follows:
(1) Under 1.5 �C and 2.0 �C warming scenarios, our resultsshow that warming over China (1.63 �C and 2.24 �C)will exceed the global average, especially in NortheastChina (2.02 �C and 2.74 �C). The simulations alsoproject that the extreme temperature indices calculatedby maximum temperature (e.g. TXx and TX90p) willincrease more than those calculated by minimum tem-perature (e.g. TNx and TN90p).
(2) Compared to the present-day period (1976e2005), theEHEs across China will increase about 0.7e1.7 �C(1.4e2.6 �C) in intensity, 30%e230% (70%e270%) infrequency, and 125%e700% (360%e900%) in durationunder 1.5 �C (2.0 �C) global warming. Besides, theincreased magnitudes of the frequency and duration inSouth China will be the largest. The high-temperaturefrequency in South China is projected to exceed 3 and
events in China under stabilized 1.5 �C and 2.0 �C global warming, Advances
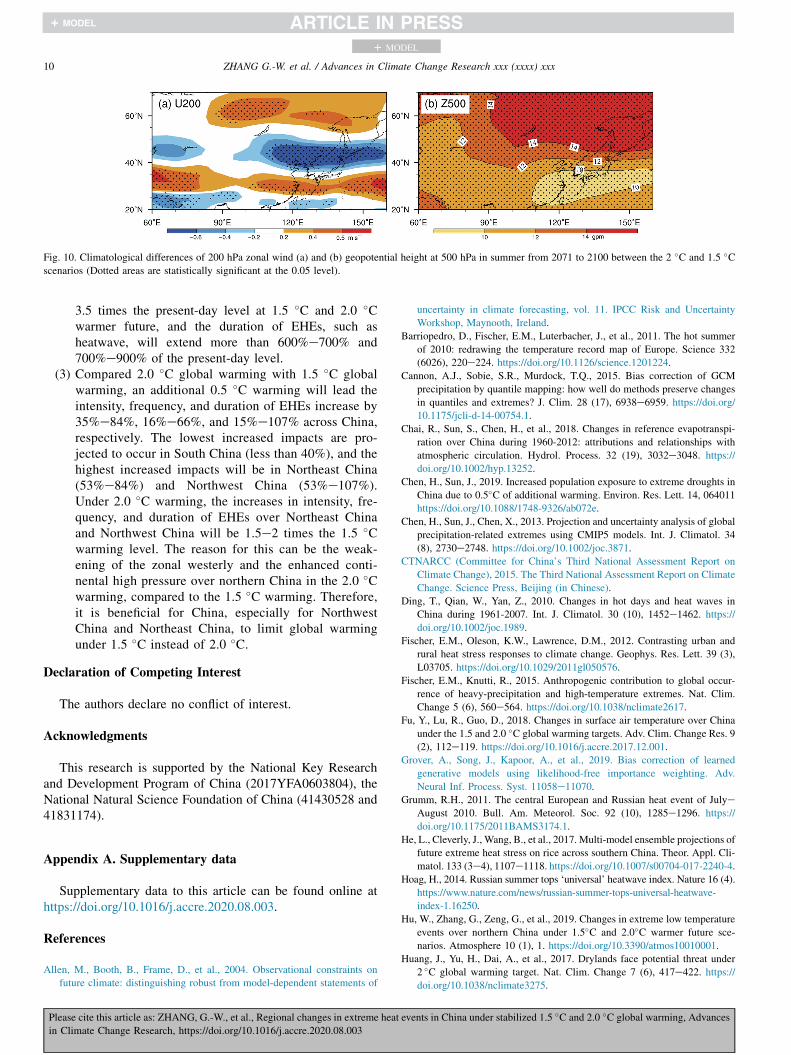
Fig. 10. Climatological differences of 200 hPa zonal wind (a) and (b) geopotential height at 500 hPa in summer from 2071 to 2100 between the 2 �C and 1.5 �Cscenarios (Dotted areas are statistically significant at the 0.05 level).
10 ZHANG G.-W. et al. / Advances in Climate Change Research xxx (xxxx) xxx
+ MODEL
3.5 times the present-day level at 1.5 �C and 2.0 �Cwarmer future, and the duration of EHEs, such asheatwave, will extend more than 600%e700% and700%e900% of the present-day level.
(3) Compared 2.0 �C global warming with 1.5 �C globalwarming, an additional 0.5 �C warming will lead theintensity, frequency, and duration of EHEs increase by35%e84%, 16%e66%, and 15%e107% across China,respectively. The lowest increased impacts are pro-jected to occur in South China (less than 40%), and thehighest increased impacts will be in Northeast China(53%e84%) and Northwest China (53%e107%).Under 2.0 �C warming, the increases in intensity, fre-quency, and duration of EHEs over Northeast Chinaand Northwest China will be 1.5e2 times the 1.5 �Cwarming level. The reason for this can be the weak-ening of the zonal westerly and the enhanced conti-nental high pressure over northern China in the 2.0 �Cwarming, compared to the 1.5 �C warming. Therefore,it is beneficial for China, especially for NorthwestChina and Northeast China, to limit global warmingunder 1.5 �C instead of 2.0 �C.
Declaration of Competing Interest
The authors declare no conflict of interest.
Acknowledgments
This research is supported by the National Key Researchand Development Program of China (2017YFA0603804), theNational Natural Science Foundation of China (41430528 and41831174).
Appendix A. Supplementary data
Supplementary data to this article can be found online athttps://doi.org/10.1016/j.accre.2020.08.003.
References
Allen, M., Booth, B., Frame, D., et al., 2004. Observational constraints on
future climate: distinguishing robust from model-dependent statements of
Please cite this article as: ZHANG, G.-W., et al., Regional changes in extreme heat
in Climate Change Research, https://doi.org/10.1016/j.accre.2020.08.003
uncertainty in climate forecasting, vol. 11. IPCC Risk and Uncertainty
Workshop, Maynooth, Ireland.
Barriopedro, D., Fischer, E.M., Luterbacher, J., et al., 2011. The hot summer
of 2010: redrawing the temperature record map of Europe. Science 332
(6026), 220e224. https://doi.org/10.1126/science.1201224.
Cannon, A.J., Sobie, S.R., Murdock, T.Q., 2015. Bias correction of GCM
precipitation by quantile mapping: how well do methods preserve changes
in quantiles and extremes? J. Clim. 28 (17), 6938e6959. https://doi.org/10.1175/jcli-d-14-00754.1.
Chai, R., Sun, S., Chen, H., et al., 2018. Changes in reference evapotranspi-
ration over China during 1960-2012: attributions and relationships with
atmospheric circulation. Hydrol. Process. 32 (19), 3032e3048. https://
doi.org/10.1002/hyp.13252.
Chen, H., Sun, J., 2019. Increased population exposure to extreme droughts in
China due to 0.5�C of additional warming. Environ. Res. Lett. 14, 064011
https://doi.org/10.1088/1748-9326/ab072e.
Chen, H., Sun, J., Chen, X., 2013. Projection and uncertainty analysis of global
precipitation-related extremes using CMIP5 models. Int. J. Climatol. 34
(8), 2730e2748. https://doi.org/10.1002/joc.3871.CTNARCC (Committee for China’s Third National Assessment Report on
Climate Change), 2015. The Third National Assessment Report on Climate
Change. Science Press, Beijing (in Chinese).
Ding, T., Qian, W., Yan, Z., 2010. Changes in hot days and heat waves in
China during 1961-2007. Int. J. Climatol. 30 (10), 1452e1462. https://
doi.org/10.1002/joc.1989.
Fischer, E.M., Oleson, K.W., Lawrence, D.M., 2012. Contrasting urban and
rural heat stress responses to climate change. Geophys. Res. Lett. 39 (3),
L03705. https://doi.org/10.1029/2011gl050576.
Fischer, E.M., Knutti, R., 2015. Anthropogenic contribution to global occur-
rence of heavy-precipitation and high-temperature extremes. Nat. Clim.
Change 5 (6), 560e564. https://doi.org/10.1038/nclimate2617.
Fu, Y., Lu, R., Guo, D., 2018. Changes in surface air temperature over China
under the 1.5 and 2.0 �C global warming targets. Adv. Clim. Change Res. 9
(2), 112e119. https://doi.org/10.1016/j.accre.2017.12.001.Grover, A., Song, J., Kapoor, A., et al., 2019. Bias correction of learned
generative models using likelihood-free importance weighting. Adv.
Neural Inf. Process. Syst. 11058e11070.
Grumm, R.H., 2011. The central European and Russian heat event of Julye
August 2010. Bull. Am. Meteorol. Soc. 92 (10), 1285e1296. https://
doi.org/10.1175/2011BAMS3174.1.
He, L., Cleverly, J., Wang, B., et al., 2017. Multi-model ensemble projections of
future extreme heat stress on rice across southern China. Theor. Appl. Cli-
matol. 133 (3e4), 1107e1118. https://doi.org/10.1007/s00704-017-2240-4.
Hoag, H., 2014. Russian summer tops ‘universal’ heatwave index. Nature 16 (4).
https://www.nature.com/news/russian-summer-tops-universal-heatwave-
index-1.16250.
Hu, W., Zhang, G., Zeng, G., et al., 2019. Changes in extreme low temperature
events over northern China under 1.5�C and 2.0�C warmer future sce-
narios. Atmosphere 10 (1), 1. https://doi.org/10.3390/atmos10010001.
Huang, J., Yu, H., Dai, A., et al., 2017. Drylands face potential threat under
2 �C global warming target. Nat. Clim. Change 7 (6), 417e422. https://
doi.org/10.1038/nclimate3275.
events in China under stabilized 1.5 �C and 2.0 �C global warming, Advances

11ZHANG G.-W. et al. / Advances in Climate Change Research xxx (xxxx) xxx
+ MODEL
Hurrell, J.W., Holland, M.M., Gent, P.R., et al., 2013. The community earth
system model: a framework for collaborative research. Bull. Am. Mete-
orol. Soc. 94, 1339e1360. https://doi.org/10.1175/bams-d-12-00121.1.
IPCC, 2013. Climate Change 2013: The Physical Sciences Basis. Contribution
of Working Group I to the Fifth Assessment Report of the Intergovern-
mental Panel on Climate Change. Cambridge University Press, Cambridge
and New York.
IPCC, 2018. Warming of 1.5�C. http://www.ipcc.ch/Sr15.James, R., Washington, R., Schleussner, C.F., et al., 2017. Characterizing half-
a-degree difference: a review of methods for identifying regional climate
responses to global warming targets. Climatic Change 8 (2), e457. https://
doi.org/10.1002/wcc.457.
Jiang, T., Zhao, J., Jing, C., et al., 2017. National and provincial population
projected to 2100 under the shared socioeconomic pathways in China.
Clim. Change. Res. 13 (2), 128e137 (in Chinese).
Jiang, T., Zhao, J., Cao, G.L., et al., 2018. Projection of national and provincial
economy under the shared socioeconomic pathways in China. Clim.
Change. Res. 14 (1), 50e58 (in Chinese).
Jung, T., 2005. Systematic errors of the atmospheric circulation in the
ECMWF forecasting system. Q. J. R. Meteorol. Soc. 131 (607),
1045e1073. https://doi.org/10.1256/qj.04.93.
Kay, J.E., Deser, C., Phillips, A., et al., 2015. The community earth system
model (CESM) large ensemble project: a community resource for studying
climate change in the presence of internal climate variability. Bull. Am.
Meteorol. Soc. 96 (8), 1333e1349. https://doi.org/10.1175/bams-d-13-
00255.1.
Lawrence, P.J., Feddema, J.J., Bonan, G.B., et al., 2012. Simulating the
biogeochemical and bio geophysical impacts of transient land cover
change and wood harvest in the Community Climate System Model
(CCSM4) from 1850 to 2100. J. Clim. 25 (9), 3071e3095. https://doi.org/10.1175/JCLI-D-11-00256.1.
Lee, S.M., Min, S.K., 2018. Heat stress changes over East Asia under 1.5 and
2.0 C global warming targets. J. Clim. 31 (7), 2819e2831. https://doi.org/
10.1175/JCLI-D-17-0449.s1.
Li, D., Zhou, T., Zou, L., et al., 2018. Extreme high-temperature events over
East Asia in 1.5�C and 2�C warmer futures: analysis of NCAR CESM low-
warming experiments. Geophys. Res. Lett. 45, 1541e1550. https://doi.org/
10.1002/2017gl076753.
Li, X., Jin, H., He, R., et al., 2019. Effects of forest fires on the permafrost
environment in the northern Da Xing’anling (Hinggan) Mountains,
Northeast China. Permafr. Periglac. Process. 30 (3), 163e177. https://
doi.org/10.1002/ppp.2001.
Liang, X.Z., Sun, C., Zheng, X., et al., 2019. CWRF performance at down-
scaling China climate characteristics. Clim. Dynam. 52 (3e4),
2159e2184. https://doi.org/10.1007/s00382-018-4257-5.Lin, L., Wang, Z., Xu, Y., et al., 2018. Additional intensification of seasonal heat
and flooding extreme over China in a 2�C warmer world compared to 1.5�C.Earth’s Future 6 (7), 968e978. https://doi.org/10.1029/2018ef000862.
Lu, R., Oh, J.H., Kim, B.J., et al., 2001. Associations with the interannual
variations of onset and withdrawal of the Changma. Adv. Atmos. Sci. 18
(6), 1066e1080. https://doi.org/10.1007/s00376-001-0023-3.
Ma, S., Zhou, T., Ang�elil, et al., 2017. Increased chances of drought in
southeastern periphery of the Tibetan Plateau induced by anthropogenic
warming. J. Clim. 30 (16), 6543e6560. https://doi.org/10.1175/jcli-d-16-
0636.1.
Meehl, G.A., Tebaldi, C., 2004. More intense, more frequent, and longer
lasting heat waves in the 21st century. Science 305 (5686), 994e997.
https://doi.org/10.1126/science.1098704.
MiCES (Minimal Complexity Earth Simulator), 2016. GitHub repository.
https://github.com/benmsanderson/mices.
Miralles, D.G., Gentine, P., Seneviratne, S.I., et al., 2018. Land-atmospheric
feedbacks during droughts and heatwaves: state of the science and cur-
rent challenges. Ann. N. Y. Acad. Sci. https://doi.org/10.1111/
nyas.13912.
Moore, J.K., Lindsay, K., Doney, S.C., et al., 2013. Marine ecosystem dy-
namics and biogeochemical cycling in the community earth system model
[CESM1(BGC)]: comparison of the 1990s with the 2090s under the
Please cite this article as: ZHANG, G.-W., et al., Regional changes in extreme heat
in Climate Change Research, https://doi.org/10.1016/j.accre.2020.08.003
RCP4.5 and RCP8.5 scenarios. J. Clim. 26 (23), 9291e9312. https://
doi.org/10.1175/jcli-d-12-00566.1.
Qin, D., 2015. China National Assessment Report on Risk Management and
Adaptation of Climate Extremes and Disasters. Science Press, Beijing.
Robine, J.M., Cheung, S.L.K., Le Roy, S., et al., 2008. Death toll exceeded
70,000 in Europe during the summer of 2003. Comptes Rendus Biol. 331
(2), 171e178. https://doi.org/10.1016/j.crvi.2007.12.001.
Sanderson, B.M., Xu, Y., Tebaldi, C., et al., 2017. Community climate sim-
ulations to assess avoided impacts in 1.5 and 2�C futures. Earth. Syst. Dyn.
8 (3), 827e847. https://doi.org/10.3929/ethz-b-000191578.
Schleussner, C., Lissner, T., Fischer, E., et al., 2016. Differential climate im-
pacts for policy-relevant limits to global warming: the case of 1.5�C and
2�C. Earth. Syst. Dyn. 7 (2), 327e351. https://doi.org/10.5194/esd-7-327-
2016.
Seneviratne, S.I., Donat, M.G., Pitman, A.J., et al., 2016. Allowable CO2
emissions based on regional and impact-related climate targets. Nature 529
(7587), 477e483. https://doi.org/10.1038/nature16542.
Shi, C., Jiang, Z., Chen, W., et al., 2018. Changes in temperature extremes
over China under 1.5�C and 2�C global warming targets. Adv. Clim.
Change Res. 9 (2), 120e129. https://doi.org/10.1016/j.accre.2017.11.003.
Smith, T.T., Zaitchik, B.F., Gohlke, J.M., 2013. Heat waves in the United
States: definitions, patterns and trends. Climatic Change 118 (3e4),
811e825. https://doi.org/10.1007/s10584-012-0659-2.Sun, J., 2014. Record-breaking SST over mid-North Atlantic and extreme high
temperature over the Jianghuai-Jiangnan region of China in 2013. Chin.
Sci. Bull. 59 (27), 3465e3470 (in Chinese).
Tao, J., Zhang, Y., Yuan, X., et al., 2013. Analysis of forest fires in Northeast
China from 2003 to 2011. Int. J. Rem. Sens. 34 (22), 8235e8251. https://
doi.org/10.1080/01431161.2013.837229.
Taylor, K.E., 2001. Summarizing multiple aspects of model performance in a
single diagram. J. Geophys. Res. 106 (D7), 7183e7192. https://doi.org/
10.1029/2000JD900719.
UNFCCC (United Nations Framework Convention Climate Change), 2015.
Adoption of the Paris Agreement. https://unfccc.int/sites/default/files/
resource/docs/2015/cop21/eng/l09r01.pdf.
Wang, F., Zhang, J., 2019. Heat stress response to national-committed emis-
sion reductions under the Paris Agreement. Int. J. Environ. Health Res. 16
(12), 2202. https://doi.org/10.3390/ijerph16122202.
Wang, H.L., Gan, Y.T., Wang, R.Y., et al., 2008. Phenological trends in winter
wheat and spring cotton in response to climate changes in Northwest
China. Agric. For. Meteorol. 148 (8e9), 1242e1251. https://doi.org/
10.1016/j.agrformet.2008.03.003.
Wang, Z., Lin, L., Zhang, X., et al., 2017. Scenario dependence of future
changes in climate extremes under 1.5 �C and 2 �C global warming. Sci.
Rep. 7 (1) https://doi.org/10.1038/srep46432.
Wilbanks, T., Fernandez, S., Backus, G., et al., 2012. Climate change and
infra- structure, urban systems, and vulnerabilities: technical report for the
U.S. Department of Energy in support of the national climate assessment.
https://www.esd.ornl.gov/eess/Infrastructure.pdf.
WMO (World Meteorological Organization), 2020. WMO statement on the
state of the global glimate in 2019.
Wu, J., Gao, X., 2013. A gridded daily observation dataset over China region
and comparison with the other datasets. Chin. J. Geophys. 56, 1102e1111.https://doi.org/10.6038/cjg20130406 (in Chinese).
Xu, Y., Gao, X., Shen, Y., et al., 2009. A daily temperature dataset over China
and its application in validating a RCM simulation. Adv. Atmos. Sci. 26
(4), 763e772. https://doi.org/10.1007/s00376-009-9029-z.
Xu, Y., Zhou, B., Wu, J., et al., 2017. Asian climate change under 1.5-4�Cwarming targets. Adv. Clim. Change Res. 8, 99e107. https://doi.org/
10.1016/j.accre.2017.05.004.
Yang, Y., Tang, J., Wang, S., et al., 2018. Differential impacts of 1.5�C and
2�C warming on extreme events over China using statistically downscaled
and bias-corrected CESM low-warming experiment. Geophys. Res. Lett.
45 (18), 9852e9860. https://doi.org/10.1029/2018gl079272.Ye, D., Yin, J., Chen, Z., et al., 2014. Spatial and temporal variations of heat
waves in China from 1961 to 2010. Adv. Clim. Change Res. 5 (2), 66e73.
https://doi.org/10.3724/SP.J.1248.2014.066.
events in China under stabilized 1.5 �C and 2.0 �C global warming, Advances
12 ZHANG G.-W. et al. / Advances in Climate Change Research xxx (xxxx) xxx
+ MODEL
Yu, R., Zhai, P., Lu, Y., 2017. Implications of differential effects between 1.5
and 2 �C global warming on temperature and precipitation extremes in
China's urban agglomerations. Int. J. Climatol. 38, 2374e2385. https://
doi.org/10.1002/joc.5340.
Yu, S., Xia, J., Yan, Z., et al., 2019. Loss of work productivity in a warming
world: differences between developed and developing countries. J. Clean.
Prod. 208, 1219e1225. https://doi.org/10.1016/j.jclepro.2018.10.067.
Zhang, G., Zeng, G., Li, C., et al., 2020. Impact of PDO and AMO on
interdecadal variability in extreme high temperatures in North China over
Please cite this article as: ZHANG, G.-W., et al., Regional changes in extreme heat
in Climate Change Research, https://doi.org/10.1016/j.accre.2020.08.003
the most recent 40-year period. Clim. Dynam. 54, 3003e3020. https://doi.org/10.1007/s00382-020-05155-z.
Zhao, S., Zhou, T., Chen, X., 2020. Consistency of extreme temperature
changes in China under a historical half-degree warming increment across
different reanalysis and observational datasets. Clim. Dynam. 54 (3),
2465e2479. https://doi.org/10.1007/s00382-020-05128-2.
Zhu, M., Zhang, Z., Zhu, B., et al., 2020. Population and economic projections
in the Yangtze River Basin based on shared socioeconomic pathways.
Sustainability 12, 4202. https://doi.org/10.3390/su12104202.
events in China under stabilized 1.5 �C and 2.0 �C global warming, Advances


![The Effect of Extreme Climatic Events on Extreme Runoff in ...[12]-[15] analyzed extreme precipitation events in China, east China, south China, and the Yangtze River basin. Yang[16]](https://static.fdocuments.us/doc/165x107/5fce0e1e01d9110392754b71/the-effect-of-extreme-climatic-events-on-extreme-runoff-in-12-15-analyzed.jpg)