Region and Cell Type Distribution of TCF4 in the Postnatal ...
19
1 2 3 4 5 6 7 8 9 10 11 12 13 14 15 16 17 18 19 20 21 22 23 24 25 26 27 28 29 30 31 32 33 34 35 36 37 38 39 40 41 42 43 44 45 46 47 48 49 50 51 52 53 54 55 56 57 58 59 60 61 62 63 64 65 66 67 68 69 70 71 72 73 74 75 76 77 78 79 80 81 82 83 84 85 86 87 88 89 90 91 92 93 94 95 96 97 98 99 100 101 102 103 104 105 106 107 108 109 110 111 112 113 114 ORIGINAL RESEARCH published: xx July 2020 doi: 10.3389/fnana.2020.00042 Edited by: Emmanuel Valjent, Centre National de la Recherche Scientifique (CNRS), France Reviewed by: Tonis Timmusk, Tallinn University of Technology, Estonia José L. Ferran, University of Murcia, Spain Q4 *Correspondence: Benjamin Philpot [email protected] Received: 20 April 2020 Accepted: 22 June 2020 Published: xx July 2020 Citation: Kim H, Berens NC, Ochandarena NE and Philpot BD (2020) Region and Cell Type Distribution of TCF4 in the Postnatal Mouse Brain. Front. Neuroanat. 14:42. doi: 10.3389/fnana.2020.00042 Region and Cell Type Distribution of TCF4 in the Postnatal Mouse Brain Q1 Q2 Q3 Hyojin Kim 1,2 , Noah C. Berens 3 , Nicole E. Ochandarena 4 and Benjamin D. Philpot 1,2,5 * 1 Department of Cell Biology & Physiology, University of North Carolina at Chapel Hill, Chapel Hill, NC, United States, 2 Neuroscience Center, University of North Carolina at Chapel Hill, Chapel Hill, NC, United States, 3 Department of Biology, University of North Carolina at Chapel Hill, Chapel Hill, NC, United States, 4 MD-Ph.D. Program, University of North Carolina at Chapel Hill, Chapel Hill, NC, United States, 5 Carolina Institute for Developmental Disabilities, University of North Carolina at Chapel Hill, Chapel Hill, NC, United States Transcription factor 4 is a class I basic helix-loop-helix transcription factor regulating gene expression. Altered TCF4 gene expression has been linked to non-syndromic intellectual disability, schizophrenia, and a severe neurodevelopmental disorder known as Pitt-Hopkins syndrome. An understanding of the cell types expressing TCF4 protein in the mouse brain is needed to help identify potential pathophysiological mechanisms and targets for therapeutic delivery in TCF4-linked disorders. Here we developed a novel green fluorescent protein reporter mouse to visualize TCF4-expressing cells throughout the brain. Using this TCF4 reporter mouse, we observed prominent expression of TCF4 in the pallial region and cerebellum of the postnatal brain. At the cellular level, both glutamatergic and GABAergic neurons express TCF4 in the cortex and hippocampus, while only a subset of GABAergic interneurons express TCF4 in the striatum. Among glial cell groups, TCF4 is present in astrocytes and immature and mature oligodendrocytes. In the cerebellum, cells in the granule and molecular layer express TCF4. Our findings greatly extend our knowledge of the spatiotemporal and cell type-specific expression patterns of TCF4 in the brain, and hence, lay the groundwork to better understand TCF4-linked neurological disorders. Any effort to restore TCF4 functions through small molecule or genetic therapies should target these brain regions and cell groups to best recapitulate TCF4 expression patterns. Keywords: transcription factor 4, Pitt-Hopkins syndrome, schizophrenia, autism spectrum disorder, neurodevelopmental disorder, intellectual disability INTRODUCTION Transcription factor 4 (TCF4, Gene ID 6925) is a basic helix-loop-helix (bHLH) transcription factor, acting as both a repressor and activator of gene expression (Massari and Murre, 2000). The protein’s functional domains include a first activation domain, a nuclear localization signal, a second activation domain, and a bHLH domain. The bHLH domain consists of a basic region that directly mediates DNA binding and amphipathic helices that provide a dimerization interface. TCF4 can form homo- and hetero-dimers with cell type-specific bHLH proteins, which modulate its function (Murre et al., 1994). The human TCF4 gene can be transcribed from multiple promoters, and the usage of alternative 5 0 exons and splicing produces protein isoforms with 18 different N 0 -termini and variable functional domains (Sepp et al., 2011). Genomic alterations that affect TCF4 function or levels increase the risk of neurodevelopmental or psychiatric Frontiers in Neuroanatomy | www.frontiersin.org 1 July 2020 | Volume 14 | Article 42
Transcript of Region and Cell Type Distribution of TCF4 in the Postnatal ...

fnana-14-00042 June 28, 2020 Time: 19:30 # 1
1
2
3
4
5
6
7
8
9
10
11
12
13
14
15
16
17
18
19
20
21
22
23
24
25
26
27
28
29
30
31
32
33
34
35
36
37
38
39
40
41
42
43
44
45
46
47
48
49
50
51
52
53
54
55
56
57
58
59
60
61
62
63
64
65
66
67
68
69
70
71
72
73
74
75
76
77
78
79
80
81
82
83
84
85
86
87
88
89
90
91
92
93
94
95
96
97
98
99
100
101
102
103
104
105
106
107
108
109
110
111
112
113
114
ORIGINAL RESEARCHpublished: xx July 2020
doi: 10.3389/fnana.2020.00042
Edited by:Emmanuel Valjent,
Centre National de la RechercheScientifique (CNRS), France
Reviewed by:Tonis Timmusk,
Tallinn University of Technology,Estonia
José L. Ferran,University of Murcia, Spain
Q4 *Correspondence:Benjamin Philpot
Received: 20 April 2020Accepted: 22 June 2020Published: xx July 2020
Citation:Kim H, Berens NC,
Ochandarena NE and Philpot BD(2020) Region and Cell Type
Distribution of TCF4 in the PostnatalMouse Brain.
Front. Neuroanat. 14:42.doi: 10.3389/fnana.2020.00042
Region and Cell Type Distribution ofTCF4 in the Postnatal Mouse Brain
Q1
Q2Q3
Hyojin Kim1,2, Noah C. Berens3, Nicole E. Ochandarena4 and Benjamin D. Philpot1,2,5*
1 Department of Cell Biology & Physiology, University of North Carolina at Chapel Hill, Chapel Hill, NC, United States,2 Neuroscience Center, University of North Carolina at Chapel Hill, Chapel Hill, NC, United States, 3 Department of Biology,University of North Carolina at Chapel Hill, Chapel Hill, NC, United States, 4 MD-Ph.D. Program, University of North Carolinaat Chapel Hill, Chapel Hill, NC, United States, 5 Carolina Institute for Developmental Disabilities, University of North Carolinaat Chapel Hill, Chapel Hill, NC, United States
Transcription factor 4 is a class I basic helix-loop-helix transcription factor regulatinggene expression. Altered TCF4 gene expression has been linked to non-syndromicintellectual disability, schizophrenia, and a severe neurodevelopmental disorder knownas Pitt-Hopkins syndrome. An understanding of the cell types expressing TCF4 proteinin the mouse brain is needed to help identify potential pathophysiological mechanismsand targets for therapeutic delivery in TCF4-linked disorders. Here we developed a novelgreen fluorescent protein reporter mouse to visualize TCF4-expressing cells throughoutthe brain. Using this TCF4 reporter mouse, we observed prominent expression of TCF4in the pallial region and cerebellum of the postnatal brain. At the cellular level, bothglutamatergic and GABAergic neurons express TCF4 in the cortex and hippocampus,while only a subset of GABAergic interneurons express TCF4 in the striatum. Among glialcell groups, TCF4 is present in astrocytes and immature and mature oligodendrocytes.In the cerebellum, cells in the granule and molecular layer express TCF4. Our findingsgreatly extend our knowledge of the spatiotemporal and cell type-specific expressionpatterns of TCF4 in the brain, and hence, lay the groundwork to better understandTCF4-linked neurological disorders. Any effort to restore TCF4 functions through smallmolecule or genetic therapies should target these brain regions and cell groups to bestrecapitulate TCF4 expression patterns.
Keywords: transcription factor 4, Pitt-Hopkins syndrome, schizophrenia, autism spectrum disorder,neurodevelopmental disorder, intellectual disability
INTRODUCTION
Transcription factor 4 (TCF4, Gene ID 6925) is a basic helix-loop-helix (bHLH) transcriptionfactor, acting as both a repressor and activator of gene expression (Massari and Murre, 2000).The protein’s functional domains include a first activation domain, a nuclear localization signal,a second activation domain, and a bHLH domain. The bHLH domain consists of a basic regionthat directly mediates DNA binding and amphipathic helices that provide a dimerization interface.TCF4 can form homo- and hetero-dimers with cell type-specific bHLH proteins, which modulateits function (Murre et al., 1994). The human TCF4 gene can be transcribed from multiplepromoters, and the usage of alternative 5′ exons and splicing produces protein isoforms with18 different N′-termini and variable functional domains (Sepp et al., 2011). Genomic alterationsthat affect TCF4 function or levels increase the risk of neurodevelopmental or psychiatric
Frontiers in Neuroanatomy | www.frontiersin.org 1 July 2020 | Volume 14 | Article 42

fnana-14-00042 June 28, 2020 Time: 19:30 # 2
115
116
117
118
119
120
121
122
123
124
125
126
127
128
129
130
131
132
133
134
135
136
137
138
139
140
141
142
143
144
145
146
147
148
149
150
151
152
153
154
155
156
157
158
159
160
161
162
163
164
165
166
167
168
169
170
171
172
173
174
175
176
177
178
179
180
181
182
183
184
185
186
187
188
189
190
191
192
193
194
195
196
197
198
199
200
201
202
203
204
205
206
207
208
209
210
211
212
213
214
215
216
217
218
219
220
221
222
223
224
225
226
227
228
Q7
Q11
Kim et al. TCF4 Distribution
disorders (Sepp et al., 2012; Bedeschi et al., 2017). For example,haploinsufficiency of TCF4 is the main pathogenic mechanismin Pitt-Hopkins syndrome (PTHS), which is characterized byintellectual disability, sensory processing deficits, anxiety, andspeech and motor delay (Amiel et al., 2007; Zweier et al.,2007). PTHS is associated with enlarged ventricles, cerebellaratrophy, and hippocampal and corpus callosum hypoplasia(Peippo et al., 2006; Amiel et al., 2007; Zweier et al., 2008;Goodspeed et al., 2018; Zollino et al., 2019), suggesting thatgross brain development is sensitive to dramatic changes inTCF4 expression and function. More subtle alterations in TCF4gene expression have been linked to non-syndromic intellectualdisability, schizophrenia, and bipolar diseases (Pickard et al.,2005; Kharbanda et al., 2016; Maduro et al., 2016; Forrest et al.,2018; Ma et al., 2018; Mary et al., 2018). These structural andbehavioral phenotypes emphasize the importance of TCF4 generegulation for normal brain function.
Mouse models carrying mutations or deletions of the bHLHregion of Tcf4 display many PTHS-like phenotypes, includingmemory and learning deficits, anxiety, hyperactivity, and sensorydysfunction. Perturbations of Tcf4 disrupt synaptic function inthe hippocampus and cortex, likely contributing to impairedlearning and memory (Kennedy et al., 2016; Rannals et al.,2016; Thaxton et al., 2018). At the cellular level, reduced TCF4protein levels impair dendritic development, neuronal migration,and cortical laminar organization (Chen et al., 2016; Li et al.,2019; Wang et al., 2020). In glial cells, TCF4 loss leads todelayed differentiation of oligodendrocyte progenitors (Fu et al.,2009). Thus, evidence from mouse studies implicates TCF4 in avariety of critical processes in brain development and function,including progenitor cell differentiation, neuronal migration andmorphogenesis, and synaptic plasticity.
Human TCF4 is expressed in the prosencephalon and theventricular zone of the central nervous system during fetaldevelopment, and its expression remains sustained in the adultforebrain (de Pontual et al., 2009). Similarly, mouse Tcf4 isprominently expressed in the isocortex and hippocampus duringdevelopment and in adulthood (Chen et al., 2016; Jung et al.,2018). While these studies highlight broad regions in whichTCF4 is particularly active, much less is known regarding thespecific identity of cell types in which TCF4 is expressed. TCF4expression has been reported in a subset of cortical neurons(Jung et al., 2018). However, it is not yet characterized whichcortical neurons express TCF4, and whether brain regions outsidethe cortex contain TCF4-expressing cells. Moreover, TCF4-expressing hippocampal cell groups are largely unknown despitethe prominent expression in the hippocampus.
Eventual pharmacological or genetic approaches to treatPTHS and other TCF4-linked disorders require knowledge ofTCF4 distribution at the resolution of discrete brain areasand specific cell lineages and types. This is particularly truefor gene therapy strategies that are attempting to addressTCF4 haploinsufficiency in PTHS by normalizing levels of geneexpression. In order to facilitate these therapeutic efforts andfurther contextualize roles for TCF4 in brain development, wedeveloped and validated a novel mouse model incorporating aCre-dependent TCF4 green fluorescent protein (GFP) reporter.
Using this line, we track TCF4-expressing brain regions andcell groups throughout postnatal development, with greaterreliability and resolution than could previously be achieved usingavailable antibodies (Jung et al., 2018).
MATERIALS AND METHODS
AnimalsWe generated Tcf4LGSL/+ mice through the University of NorthCarolina, Chapel Hill (UNC) Animal Models Core facility. Weutilized CRISPR/Cas9-mediated homologous recombination togenerate Tcf4-LoxP-GFP-Stop-LoxP (Tcf4LGSL) knock-in mice onthe C57BL/6J background. The Tcf4LGSL allele was generatedby inserting a cassette, comprised of a LoxP site, adenovirussplice acceptor, porcine teschovirus-1 2A (P2A) site, EGFPcoding sequence, 3 copies of SV40 polyadenylation sequence(Stop), FRT site, and another LoxP site (Figure 1A). Thiscassette was inserted into Tcf4 intron 17. The sequence of theguide RNA (gRNA) was 5′- GTCGTGCCTTACGTAGCTGGG-3.′ Mouse embryos were injected with a mixture of 400 nMCas9 protein, 50 ng/µl in vitro transcribed gRNA, and 20 ng/µlsupercoiled donor plasmid. The donor plasmid was constructedwith 1017 bp 5′ homology arm, the LoxP-GFP-Stop-LoxPcassette, and 884 bp 3′ homology arm. Potential founder animalswere screened for the presence of the insertion event by 5′ and 3′polymerase chain reaction (PCR) assays consisting of one primeroutside the targeting vector homology arms and one primerunique to the insertion event. The 5′ assay primers were Tcf4-5ScF1 (5′-GCACTTCAGGGATCGCTTA-3′) and AdSA-R2 (5′-GGGACAGGATAAGTATGACATCATC-3′), which produceda 1224 bp band. The 3′ assay primers were SV40pA-F2 (5′-GCTGATCCGGAACCCTTAAGC-3′) and Tcf4-3ScR1(5′-CCGCCCTAATTGTTCAAAGAG-3′), which produced a1109 bp band. Two chosen founders were checked for off-targetmutations at 10 predicted off-target sites. No mutations weredetected at the off-target sites screened in two founder animals.The Tcf4LGSL/+ knock-in mice were genotyped via PCR. Theprimer set of Tcf4-5ScF1 and Tcf4-3ScR1 or SV40pA-F2 and Tcf4-3ScR1 was, respectively, used to amplify the wildtype or LGSLknock-in allele.
The female Tcf4LGSL/+ mice were mated with heterozygousmales from one of three Cre-expressing lines: Nex-Cre(Goebbels et al., 2006), which Klaus-Armin Nave generouslyprovided, Actin-Cre (RRID:IMSR_JAX:019099), and Gad2-Cre(RRID:IMSR_JAX:010802). All mice were maintained on acongenic C57BL/6J background. All research procedures usingmice were approved by the Institutional Animal Care and UseCommittee at the UNC and conformed to National Institutes ofHealth guidelines.
Western BlottingEmbryonic day 16.5–18.5 brains were dissected in ice-coldphosphate-buffered saline (PBS, pH = 7.3) and then immediatelyfrozen with dry ice. Frozen brain samples were homogenizedin glass homogenizers with ice-cold RIPA buffer [50 mMTris–HCl, pH 7.4, 150 mM NaCl, 1% Triton X-100, 0.1%
Frontiers in Neuroanatomy | www.frontiersin.org 2 July 2020 | Volume 14 | Article 42
bphilpot
Highlight

fnana-14-00042 June 28, 2020 Time: 19:30 # 3
229
230
231
232
233
234
235
236
237
238
239
240
241
242
243
244
245
246
247
248
249
250
251
252
253
254
255
256
257
258
259
260
261
262
263
264
265
266
267
268
269
270
271
272
273
274
275
276
277
278
279
280
281
282
283
284
285
286
287
288
289
290
291
292
293
294
295
296
297
298
299
300
301
302
303
304
305
306
307
308
309
310
311
312
313
314
315
316
317
318
319
320
321
322
323
324
325
326
327
328
329
330
331
332
333
334
335
336
337
338
339
340
341
342
Kim et al. TCF4 Distribution
FIGURE 1 | ValidationQ5 of
Q6
Tcf4-LGSL mice that faithfully report TCF4 expression. A Schematic of the strategy to generate C57BL/6J mice carrying theLoxP-P2A-GFP-STOP-LoxP cassette upstream of the basic helix-loop- helix region. Adenovirus splicing acceptor is shown by the blue box. B RepresentativeWestern blot for TCF4, GFP, and GAPDH loading control protein in embryonic brain lysates from Tcf4+/+ (WT), Tcf4LGSL/+ (Het), and Tcf4LGSL/LGSL (Homo) mice.The TCF4 antibody (recognizes mouse TCF4 aa 50–150) is designed to detect a long isoform of TCF4. We detected a TCF4 full length protein (TCF4-FL) band atapproximately 76 kDa that corresponds to the long isoform in WT lysates. A TCF4 truncated protein (TCF4-Trunc.) was detected at approximately 65 kDa in Hetlysates. A band for GFP or GAPDH protein was detected at approximately 26 or 35 kDa, respectively. C Quantification of Western blotting for TCF4-FL and for GFP.D–F Dual fluorescence ISH for Tcf4 (magenta) and GFP (green) from PFC of P80 WT and Tcf4LGSL/+, and CA1 of Tcf4LGSL/+ mice. Asterisk indicates a cellexpressing only Tcf4, and arrows indicate cells co-expressing Tcf4 and GFP. Insets are higher magnifications. Scale bars = 10 µm. G, H Quantification ofGFP-positive and -negative cells in Tcf4-expressing cells in the PFC and CA1 region (n = 3 mice). Data represent mean ± SEM.
Frontiers in Neuroanatomy | www.frontiersin.org 3 July 2020 | Volume 14 | Article 42

fnana-14-00042 June 28, 2020 Time: 19:30 # 4
343
344
345
346
347
348
349
350
351
352
353
354
355
356
357
358
359
360
361
362
363
364
365
366
367
368
369
370
371
372
373
374
375
376
377
378
379
380
381
382
383
384
385
386
387
388
389
390
391
392
393
394
395
396
397
398
399
400
401
402
403
404
405
406
407
408
409
410
411
412
413
414
415
416
417
418
419
420
421
422
423
424
425
426
427
428
429
430
431
432
433
434
435
436
437
438
439
440
441
442
443
444
445
446
447
448
449
450
451
452
453
454
455
456
Kim et al. TCF4 Distribution
sodium dodecyl sulfate (SDS), and 0.5% Na deoxycholate]supplemented with 2 mM EDTA pH 8.0 and a protease inhibitorcocktail (Sigma, Saint Louis, MO). Tissue homogenates werecleared by centrifugation at 4◦C for 20 min. Protein sampleswere mixed with 4x protein loading buffer (Li-COR, Lincoln,NE) and 2-mercaptoethanol (Sigma) and incubated in 95◦Cfor 5–7 min. They were resolved by SDS-polyacrylamide gelelectrophoresis and transferred to nitrocellulose membranes.Membranes were blocked for 1 h at room temperaturein Odyssey blocking buffer (Li-COR) prior to incubationovernight at 4◦C with primary antibodies diluted 1:500with blocking buffer. Membranes were subsequently washedrepeatedly with PBS (0.1 M Phosphate, 1.5 M NaCl) containing0.1% Tween-20 (PBSTween) prior to incubation for 1 h atroom temperature with secondary antibodies prepared in thedilution of 1:5000 in blocking buffer. The following secondaryantibodies were used: donkey anti-mouse 800CW (Li-COR, 926-32212) or donkey anti-rabbit Alexa 680 (Invitrogen, A10043).Finally, blots were washed repeatedly in PBSTween followedby PBS alone prior to imaging with the Odyssey imagingsystem (Li-COR).
Tissue PreparationPostnatal mice were anesthetized with sodium pentobarbital(60 mg/kg i.p.) before transcranial perfusion with 25 mlof PBS immediately followed by phosphate-buffered 4%paraformaldehyde (pH 7.4). Brains were postfixed overnight at4◦C before 24-h incubations in PBS with 30% sucrose. Brainswere sectioned coronally or sagittally at 40 µm using a freezingsliding microtome (Thermo Scientific, Kalamazoo, MI). Sectionswere stored at −20◦C in a cryopreservative solution (45% PBS,30% ethylene glycol, and 25% glycerol by volume).
Histology and ImmunostainingFor chromogenic staining, sections were rinsed several timeswith PBS, and endogenous peroxidases were quenched byincubating for 5 min in 1.0% H2O2 in MeOH, followedby PBS rinsing. Sections were washed with PBS containing0.2% Triton X-100 (PBST) several times. Then sections wereblocked with 5% normal goat serum in PBST (NGST) for1 h at room temperature. Blocked sections were incubated inprimary antibodies diluted in NGST for 24 h at 4◦C. Afterincubation in primary antibodies, sections were rinsed severaltimes in PBST and incubated for 1 h at room temperaturein biotinylated goat anti-rabbit secondary antibodies (VectorBA-1000, Burlingame, CA) diluted 1:500 in NGST. Sectionswere then rinsed in PBST prior to tertiary amplificationfor 1 h with the ABC elite avidin-biotin-peroxidase system(Vector PK-7100). Further rinsing with PBST preceded a 3-min incubation at room temperature in 3,3′-diaminobenzidine(DAB) chromogenic substrate (0.02% DAB and 0.01% H2O2in PBST) to visualize immune complexes amplified by avidin-biotin-peroxidase.
For immunofluorescent staining, sections were rinsedseveral times with PBS and PBST before blocking withNGST or 5% bovine serum albumin (BSA) in PBST for1 h at room temperature. Sections were then incubated
with primary antibodies diluted in NGST or BSA at 4◦Covernight. The list of primary antibodies used is providedin Table 1. Sections were rinsed several times with PBSTand then incubated with secondary antibodies for 1 h atroom temperature. The following secondary antibodies fromInvitrogen (Carlsbad, CA) were used at a 1:1000 dilution:goat anti-mouse Alexa 568 (A11031); goat anti-mouse Alexa647 (A21240); goat anti-rabbit Alexa 568 (A11011); goat anti-chicken Alexa 488 (A11039); or donkey anti-goat Alexa 568(A11057). In all experiments, 4′,6-diamidino-2-phenylindole(DAPI; Invitrogen D1306) was added during the secondaryantibody incubation at a concentration of 700 ng/ml fornuclear counterstaining. Brain sections compared withinfigures were stained within the same experiment, underidentical conditions.
In situ HybridizationRNAscope Fluorescent Multiplex Assay, designed to visualizemultiple cellular RNA targets in fresh frozen tissues (Wang et al.,2012), was used to detect Tcf4 (Cat No. 423691), EGFP (CatNo. 400281-C2), vGat (Cat No. 319191-C3), and vGlut1 (CatNo. 416631-C2) in mouse brain (Advanced Cell Diagnostics,Newark, CA). The target region of the Tcf4 probe is 1120–2020 bp of mouse Tcf4 mRNA (NM_001083967.1). Brainswere extracted and frozen in dry ice. Sections were taken ata thickness of 16 µm. Staining procedure was completed tomanufacturer’s specifications.
Imaging and Figure ProductionImages of brain sections stained with DAB histochemistrywere obtained with a Nikon Ti2 Eclipse Color andWidefield Microscope (Nikon, Melville, NY). Images ofbrain sections stained by using fluorophore-conjugatedsecondary antibodies were obtained with Zeiss LSM 710Confocal Microscope, equipped with ZEN imaging software(Zeiss, Jena, Germany). Images compared within the samefigures were taken within the same imaging session usingidentical imaging parameters. Images within figure panelswent through identical modification for brightness andcontrast by using Fiji Image J software. Figures were preparedusing Adobe Illustrator software (Adobe Systems, San Jose,CA, United States).
Data AnalysisImages for in situ hybridization (ISH) colocalization analysiswere captured from consistent coronal section planes acrossdifferent mouse brains (PFC, STR: ∼ 1.10 mm; CA1, BLA,TH: ∼ −2.06 mm; VC: ∼ −2.70 mm from bregma). TheDAPI image from each brain region (265.69 × 265.69 µm) wasconverted to 8-bit in black and white, and its threshold wasadjusted using the Huang method built into Fiji software. Forthe image with Tcf4 or GFP staining, the ISODATA thresholdmethod was consistently applied. To identify mean Tcf4 or GFPfluorescence intensity level for each nucleus (DAPI), we usedCellProfiler software, which is a free open-source software thatallows one to measure and analyze cell images automatically(Kamentsky et al., 2011).
Frontiers in Neuroanatomy | www.frontiersin.org 4 July 2020 | Volume 14 | Article 42

fnana-14-00042 June 28, 2020 Time: 19:30 # 5
457
458
459
460
461
462
463
464
465
466
467
468
469
470
471
472
473
474
475
476
477
478
479
480
481
482
483
484
485
486
487
488
489
490
491
492
493
494
495
496
497
498
499
500
501
502
503
504
505
506
507
508
509
510
511
512
513
514
515
516
517
518
519
520
521
522
523
524
525
526
527
528
529
530
531
532
533
534
535
536
537
538
539
540
541
542
543
544
545
546
547
548
549
550
551
552
553
554
555
556
557
558
559
560
561
562
563
564
565
566
567
568
569
570
Kim et al. TCF4 Distribution
TABLE 1 | Primary antibodies used.
Antigen Manufacturer Dilution
APC Millipore (Billerica, MA, United States), mouse monoclonal, clone CC-1, OP80 1:500
Calbindin Santa Cruz (Dallas, TX, United States), goat polyclonal, sc-7691 1:500
ChAT Millipore, goat polyclonal, AB144P 1:1,000
DARPP-32 Millipore, rabbit polyclonal, AB10518 1:1,000
GAPDH Millipore, mouse monoclonal, clone 6C5, MAB374 1:5,000
GFAP Dako (Glostrup, Denmark), rabbit polyclonal, Z0334 1:1,000
GFP Novus (Centennial, CO), rabbit polyclonal, NB600-308 1:1,000
GFP Aves Labs (Tigard, OR), chicken polyclonal, GFP-1020 1:10,000
IBA1 Wako (Osaka, Japan), rabbit polyclonal, 019-19741 1:500
NeuN Millipore, mouse monoclonal, clone A60, MAB377 1:1,000
Olig2 Millipore, rabbit polyclonal, AB9610 1:1,000
PV Swant (Marly, Switzerland), mouse monoclonal, PV235 1:1,000
SOM Peninsula Laboratories (San Carlos, CA), rabbit polyclonal, T-4103 1:1,000
TCF4 Abcam (Cambridge, United Kingdom), rabbit polyclonal, ab130014. Synthetic peptide corresponds to Mouse TCF4 aa 50–150. 1:500 or 1,000
VIP Immunostar (Hudson, WI), rabbit polyclonal, 20077 1:1,000
RESULTS
Validation of Tcf4-LGSL Mouse ModelTo investigate the spatiotemporal profile of TCF4-expressingcells, we engineered mice with a LoxP-GFP-STOP-LoxP (LGSL)cassette introduced into intron 17 of the Tcf4 allele (Figure 1A).An adenovirus splicing acceptor was included in the cassetteto avoid alternative splicing of intron 17 (Figure 1A). Thisdesign allowed us to examine TCF4-expressing cells withhigh confidence, as GFP can be detected by commercialantibodies. Moreover, the insertion of a 2A self-cleaving peptide(P2A) enables GFP molecules to freely diffuse throughout thecytoplasm, making it possible to track axonal projections fromTCF4-expressing neurons, though at the cost of not being able touse it to identify the subcellular localization of TCF4. The GFPand STOP cassette is flanked by LoxP sites, enabling their Cre-mediated deletion, and in turn, reinstating the capacity to expressfull-length, functional TCF4 from the locus.
As predicted from our design, brain lysates from Tcf4+/+
(WT) mice produced a single full-length TCF4 band by Westernblot, whereas lysates from Tcf4LGSL/+ (Het) mice produced boththe full-length and truncated TCF4 protein, and lysates fromTcf4LGSL/LGSL (Homo) mice produced only a truncated TCF4band (Figure 1B). GFP was present only in Tcf4LGSL/+ andTcf4LGSL/LGSL lysates (Figure 1B). The band intensity of full-length TCF4 was reduced by approximately half in lysates fromTcf4LGSL/+ compared to WT mice (Figure 1C: WT: 1.00 ± 0.02,n = 5; Het: 0.54 ± 0.03, n = 11; Homo: 0.00 ± 0.00, n = 3).GFP levels were higher in lysates from Tcf4LGSL/LGSL comparedto Tcf4LGSL/+ mice (Figure 1C: WT: 0.00 ± 0.00; n = 5,Het: 0.36 ± 0.01, n = 11; Homo: 1.00 ± 0.00, n = 3). Theseresults validated that the LGSL cassette produced GFP andtruncated TCF4 protein.
To verify that GFP faithfully reports TCF4 expression, weperformed dual ISH using probes specific to Tcf4 or GFPmRNA. GFP signals were detected in cells from adult Tcf4LGSL/+mice, but absent in cells from WT mice (Figure 1D), proving
the specificity of the GFP probe detection. Tcf4 signals wereobserved in both WT and Tcf4LGSL/+ mice (Figures 1E,F).Quantification of cells expressing both GFP and Tcf4 revealedan approximate 97% overlap (Figures 1G,H: prefrontal cortex(PFC): 97.56 ± 0.31 %; CA1: 97.58 ± 0.13 %), as only2.4 % of Tcf4-expressing cells lacked detectable GFP mRNA(Figures 1F,H: PFC: 2.44 ± 0.32 %; CA1, 2.42 ± 0.13 %).These results verify that the GFP expression in Tcf4LGSL/+ micefaithfully reports Tcf4 expression.
Comparison of GFP Reporter and TCF4AntibodiesOf commercially available TCF4 antibodies, only one has beenvalidated for immunostaining using homozygous Tcf4 knock-outtissues (Jung et al., 2018). We used this antibody to visualizeTCF4-expressing cells in WT brain. We observed weak proteinsignals in brain cell nuclei at postnatal day (P) 7 (Figure 2A).Under identical experimental conditions, we failed to detectappreciable TCF4 protein signals at P15 and P80 (Figures 2B,C).TCF4 expression may dwindle to undetectable levels, or ceasealtogether, over the course of brain maturation. To distinguishbetween these possibilities, we performed ISH for Tcf4 in age-matched WT brains. We observed comparable numbers of Tcf4-expressing cells between neonatal and adult brains (Figures 2D–F), indicating expression of Tcf4 transcript persisted in mostcells across postnatal development, albeit likely at reduced levels.Thus, failure to immunodetect TCF4 protein in adult brain is dueto the limited sensitivity of the TCF4 antibody, not the absence ofthe target protein.
To directly compare sensitivities for detecting TCF4 andGFP antibodies, we performed double immunohistochemistry inbrain sections of Tcf4LGSL/+ mice, from birth into adulthood.GFP and TCF4 labeling patterns were similar across postnataldevelopment, though GFP labeling was of visually greaterintensity than TCF4 labeling (Figures 2G–I). The disparity inlabeling intensity was also apparent at P10 and was even morepronounced by adulthood when TCF4 labeling outside of the
Frontiers in Neuroanatomy | www.frontiersin.org 5 July 2020 | Volume 14 | Article 42

fnana-14-00042 June 28, 2020 Time: 19:30 # 6
571
572
573
574
575
576
577
578
579
580
581
582
583
584
585
586
587
588
589
590
591
592
593
594
595
596
597
598
599
600
601
602
603
604
605
606
607
608
609
610
611
612
613
614
615
616
617
618
619
620
621
622
623
624
625
626
627
628
629
630
631
632
633
634
635
636
637
638
639
640
641
642
643
644
645
646
647
648
649
650
651
652
653
654
655
656
657
658
659
660
661
662
663
664
665
666
667
668
669
670
671
672
673
674
675
676
677
678
679
680
681
682
683
684
Kim et al. TCF4 Distribution
FIGURE 2 | GFP reporter enhances sensitivity to detect TCF4 by immunohistochemistry. A–C Immunostaining and (D–F) ISH of TCF4/Tcf4 and DAPI from P7, P15,and P80 mouse cortex. Immunostaining shows decreased detection of TCF4 protein using TCF4 antibody, whereas ISH shows comparable number of Tcf4expressing cells during postnatal development. Scale bars = 20 µm. G–I Dual immunostaining of P0, P7, and P80 using TCF4 and GFP antibodies in coronalsections from Tcf4LGSL/+ mice. Image is taken from the same double-labeled section. Scale bar = 1 mm.
hippocampus was barely detectable (Figures 2H,I). We alsodetected GFP labeling within axonal projections (Figure 2G).These data highlight advantages of the GFP reporter — increasedsensitivity and the capacity to track the axonal projectionsof TCF4-expressing neurons—for mapping TCF4 expressionpatterns across all postnatal ages.
TCF4 Expression Patterns of the AdultMouse BrainTo examine adult patterns of TCF4 expression, we stained forGFP across the rostral to caudal extent in coronal sectionsfrom Tcf4LGSL/+ mice (Figures 3A–H). We observed themost prominent GFP labeling intensity in the pallial region,
which contains the olfactory bulb, cortex, and hippocampus(Figures 3B–G). Cells in the glomerular (gm), external plexiform(pl), and granule layers (gr) of the olfactory bulb (OLF) werestrongly labeled with GFP (Figure 3A). Throughout the entirecortex, intense GFP staining was seen in almost all areasand in every layer (Figures 3B–G,I). Expression was strongin the hippocampus, especially in the pyramidal cell layer ofAmmon’s horn (Figure 3J), and in the cerebellum, highlightedby concentrated GFP labeling in the molecular (mo) and granulecell (gl) layers (Figures 3H,M).
While the entire pallial region and cerebellum stainedintensely for GFP, subsets of other brain regions were lightlyand sparsely labeled for GFP. In the pallial derivatives, cellsin the basolateral amygdala nucleus (BLA) and claustrum
Frontiers in Neuroanatomy | www.frontiersin.org 6 July 2020 | Volume 14 | Article 42
fnana-14-00042 June 28, 2020 Time: 19:30 # 7
685
686
687
688
689
690
691
692
693
694
695
696
697
698
699
700
701
702
703
704
705
706
707
708
709
710
711
712
713
714
715
716
717
718
719
720
721
722
723
724
725
726
727
728
729
730
731
732
733
734
735
736
737
738
739
740
741
742
743
744
745
746
747
748
749
750
751
752
753
754
755
756
757
758
759
760
761
762
763
764
765
766
767
768
769
770
771
772
773
774
775
776
777
778
779
780
781
782
783
784
785
786
787
788
789
790
791
792
793
794
795
796
797
798
Kim et al. TCF4 Distribution
FIGURE 3 | TCF4 expression patterns of adult mouse brain. A–H DAB immunostaining of GFP (for TCF4) in coronal brain sections of adult Tcf4LGSL/+ mice. I–NHigh magnification view of CRX, CA1, CP, TH, and CBX. TCF4-expressing cells are prominently found in CRX, CA1, and CBX. Scale bars = 1 mm and 200 µm forhigher magnification insets. The list of abbreviations used is provided in Table 2.
(CLA) were stained for GFP. In the subpallial derivatives, wedetected GFP-positive cells in the central amygdala nucleus(CEA) and medial amygdala nucleus (MEA) (Figures 3C–E).We also noted GFP labeling of cells in the caudoputamen (CP),nucleus accumbens (ACB), lateral septal nucleus (LS), medial
septal complex (MS), and nucleus of the diagonal band (NDB)(Figures 3B,C,K), although this labeling was much lighter, andthe stained cell density was much lower than what we observedin the pallial region. In the hypothalamus, we observed thehighest density of GFP-expressing cells in posterior hypothalamic
Frontiers in Neuroanatomy | www.frontiersin.org 7 July 2020 | Volume 14 | Article 42

fnana-14-00042 June 28, 2020 Time: 19:30 # 8
799
800
801
802
803
804
805
806
807
808
809
810
811
812
813
814
815
816
817
818
819
820
821
822
823
824
825
826
827
828
829
830
831
832
833
834
835
836
837
838
839
840
841
842
843
844
845
846
847
848
849
850
851
852
853
854
855
856
857
858
859
860
861
862
863
864
865
866
867
868
869
870
871
872
873
874
875
876
877
878
879
880
881
882
883
884
885
886
887
888
889
890
891
892
893
894
895
896
897
898
899
900
901
902
903
904
905
906
907
908
909
910
911
912
Kim et al. TCF4 Distribution
TABLE 2 | Abbreviations.
ACB Nucleus accumbens
BLA Basolateral amygdalar nucleus
CA1 Cornu ammonis1
CA3 Cornu ammonis3
CBX Cerebellum
CC Corpus callosum
CEA Central amygdalar nucleus
CLA Claustrum
CP Caudate putamen
CRX Cortex
CS Superior central nucleus raphe
egl External granule layer of cerebellum
gl Granule layer of cerebellum
gm Glomerular layer of olfactory bulb
gr Granule layer of olfactory bulb
HY Hypothalamus
igl Inner granule layer of cerebellum
LSr Lateral septal nucleus, rostral (rostroventral) part
MB Midbrain
MEA Medial amygdalar nucleus
MH Medial habenula
ml Molecular layer of cerebellum
MM Medial mammillary nucleus
MS Medial septal nucleus
NDB Diagonal band nucleus
OLF Olfactory bulb
PAG Periaqueductal gray
PFC Prefrontal cortex
PG Pontine gray
PIR Piriform area
pl Plexiform layer of olfactory bulb
PRP Nucleus prepositus
SC Superior colliculus
SPV Spinal nucleus of the trigeminal
STR Striatum
TH Thalamus
VC Visual cortex
VNC Vestibular nuclei
ZI Zona incerta
nucleus (PH) (Figures 3D–E). In the diencephalic prosomeres,the medial habenula (MH) stood out for its strong GFPlabeling intensity (Figure 3D), contrasting sharply with otherthalamic nuclei that were generally devoid of detectable GFP(Figures 3D,E,L). In the prethalamic structure, we observed GFP-positive cells in zona incerta (ZI). In the midbrain, GFP labeledcells in periaqueductal gray (PAG) and superior colliculus (SC)(Figures 3E–G). In the hindbrain, we observed GFP-expressingcells in the superior central nucleus raphe (CS), pontine gray(PG), vestibular nuclei (VNC), nucleus prepositus (PRP), andspinal nucleus of the trigeminal (SPV) (Figures 3G,H).
The contrast in labeling intensity of GFP detected in the pallialregion along with cerebellum and the rest of the brain suggestsdifferences in TCF4-expressing cell densities. To compare theexpression across different brain regions, we fluorescently labeled
Tcf4 in adult WT tissues via ISH and quantified Tcf4-containingcells. We detected Tcf4 signals in all examined brain regions,including CA1, visual cortex (VC), BLA, PFC, CP, and TH(Figure 4). Consistent with our qualitative observations of GFPlabeling intensity (Figure 3), the percentage of cells expressingTcf4 transcript was dramatically higher in CA1, VC, BLA, andPFC compared to CP and TH (Figure 4).
TCF4 Expression Patterns of theNeonatal and Juvenile Mouse BrainWe investigated the spatial dynamics of TCF4 expressionduring postnatal brain development by examining GFP reporterexpression at P1, P10, P20, and P60. At P1, the pallial regionstood out with the strongest GFP staining. Other derivatives fromprosencephalon, mesencephalon, and rhombencephalon werealso stained for GFP. Cell densities were lower in these derivativesthan the pallial region. The lowest level of GFP expressionwas detected in the thalamus and inferior colliculus. Intenselylabeled axonal projections were unique to the P1 timepoint. Mostnotably, some GFP-stained axons were extended from the corticalneurons into discrete thalamic nuclei. Other GFP-stained corticalaxons were extended to invade the hypothalamus and pons(Figure 5A). We also detected the cerebral peduncle intenselystained for GFP. These labeling patterns demonstrate that, at anearly postnatal stage, corticothalamic and subcerebral projectionneurons expressed TCF4. Additionally, axons coursing throughthe corpus collosum, fimbria, internal capsule, fornix, andanterior commissure were labeled strongly for GFP (Figures 5A,2G). GFP expression remained high in the pallial regionand cerebellum at P10. We also detected GFP-expressingcells throughout the hypothalamus, midbrain, and hindbrain.Strikingly, GFP expression level was slightly increased in thethalamus at this age compared with P1 (Figure 5B). This slightincrease is potentially caused by axonal fibers spreading intothe midline nuclei. A similar pattern of corticothalamic fiberswas reported at this age in transgenic mice that drive GFP inearly cortical preplate and subplate neurons (Jacobs et al., 2007).At P20, GFP expression level was reduced in the thalamus,hypothalamus, midbrain, and hindbrain. The pallial region,cerebellum, and some hindbrain and hypothalamic nuclei wereintensely stained for GFP (Figure 5C). The expression patternobserved in P20 brain was conserved in P60 brain, althoughthe overall expression level of P60 brain was slightly decreasedcompared with P20 brain. Our data show that high levels ofGFP labeling were persistently detected in the pallial region andcerebellum in all ages (Figure 5). These data suggest that TCF4could be involved in early stages of neuronal development acrossthe entire brain, but as the brain matures, TCF4 function becomesincreasingly restricted to the pallial region and cerebellum.
Glutamatergic and GABAergic Cells,Astrocytes, and OligodendrocytesExpress TCF4 in the Prefrontal CortexWe used the GFP reporter line to characterize the cell type-specific expression of TCF4 in the PFC. GABAergic andglutamatergic neurons represent two major neuronal classes that
Frontiers in Neuroanatomy | www.frontiersin.org 8 July 2020 | Volume 14 | Article 42

fnana-14-00042 June 28, 2020 Time: 19:30 # 9
913
914
915
916
917
918
919
920
921
922
923
924
925
926
927
928
929
930
931
932
933
934
935
936
937
938
939
940
941
942
943
944
945
946
947
948
949
950
951
952
953
954
955
956
957
958
959
960
961
962
963
964
965
966
967
968
969
970
971
972
973
974
975
976
977
978
979
980
981
982
983
984
985
986
987
988
989
990
991
992
993
994
995
996
997
998
999
1000
1001
1002
1003
1004
1005
1006
1007
1008
1009
1010
1011
1012
1013
1014
1015
1016
1017
1018
1019
1020
1021
1022
1023
1024
1025
1026
Kim et al. TCF4 Distribution
FIGURE 4 | Quantification of Tcf4-expressing cells in multiple brain regions of adult WT brain. Representative ISH images of Tcf4 and DAPI and proportionality ofTcf4-positive (magenta) and -negative (white) cell populations in CA1, VC, BLA, PFC, STR, and TH. Tcf4 mRNA is present at high levels in the CA1, VC, BLA, andPFC. The total numbers in the pie chart center represent the quantified DAPI cells per brain region. Values represent the mean percentages. n = 3 mice. Scalebars = 20 µm.
we could more easily distinguish upon reciprocal Cre deletion,which succeeded in eliminating expression of the GFP reporterone class at a time. We generated LGSL::Gad2-Cre mice todelete GFP expression from GABAergic neurons (Taniguchiet al., 2011). We detected relatively light GFP staining inputative glutamatergic neurons throughout the cortical layers(Figure 6A). We also generated LGSL::Nex-Cre mice to deleteGFP selectively from forebrain glutamatergic neurons (Goebbelset al., 2006). We detected strong residual labeling in GABAergiccells (Figure 6B). To confirm that Tcf4 expression is ubiquitousin these neuronal classes, we performed double ISH in adultWT PFC for Tcf4 in combination with either vGlut1 or vGat,which encode the vesicular transporters for glutamate andGABA, respectively. We found almost all vGlut1- and vGat-expressing cells contained Tcf4 (Figures 6C–H). These findingssuggested that TCF4 may be ubiquitously expressed in corticalglutamatergic and GABAergic cell populations.
Nearly all cortical GABAergic interneurons belong to one ofthree groups defined by the expression of parvalbumin (PV),somatostatin (SOM), and the ionotropic serotonin receptor5HT3a (5HT3aR) (Rudy et al., 2011). Each group differsin its morphological and electrophysiological properties andplays unique roles in cortical circuit function (DeFelipe, 1993;Gonchar and Burkhalter, 1997; Markram et al., 2004). Todetermine whether TCF4 is expressed in specific GABAergic
interneuron subtypes, we performed coimmunostaining for GFPand representative subgroup-specific markers in the juvenileand adult LGSL::Nex-Cre mice. There are currently no suitableantibodies for staining 5HT3aR, so we chose vasoactive intestinalpeptide (VIP) as an alternative marker, which is expressed byapproximately half of all 5HT3aR-expressing neurons (Lee et al.,2010; Rudy et al., 2011). We found that nearly all SOM, PV, andVIP labeled interneurons were copositive with GFP in the PFC(Figures 6I–K) at P20 and P80, suggesting that TCF4-expressingGABAergic cells consist of SOM, PV, and VIP interneurons.
Over the course of our study, we observed that a subset ofGFP-stained cells did not stain positive for NeuN (data notshown), indicating that TCF4 may be expressed in glial cellpopulations. We costained for GFP and either the astrocytemarker glial fibrillary acid protein (GFAP), or the microgliamarker ionized calcium binding adaptor molecule 1 (IBA1),in LGSL::Nex-Cre mice. GFP/GFAP copositive astrocytes werepresent throughout the PFC of both juvenile and adult mice(Figure 6L). However, GFP-stained glia did not costain forIBA1 (Figure 6M). Due to the recently established rolefor TCF4 in regulating the maturation of oligodendrocyteprogenitors (Phan et al., 2020), we expected that TCF4 wouldbe expressed in oligodendrocyte lineage cells. Olig2 marks allstages of oligodendrocyte lineage, and APC (or CC1) marksthe maturational process (Bhat et al., 1996). The majority
Frontiers in Neuroanatomy | www.frontiersin.org 9 July 2020 | Volume 14 | Article 42

fnana-14-00042 June 28, 2020 Time: 19:30 # 10
1027
1028
1029
1030
1031
1032
1033
1034
1035
1036
1037
1038
1039
1040
1041
1042
1043
1044
1045
1046
1047
1048
1049
1050
1051
1052
1053
1054
1055
1056
1057
1058
1059
1060
1061
1062
1063
1064
1065
1066
1067
1068
1069
1070
1071
1072
1073
1074
1075
1076
1077
1078
1079
1080
1081
1082
1083
1084
1085
1086
1087
1088
1089
1090
1091
1092
1093
1094
1095
1096
1097
1098
1099
1100
1101
1102
1103
1104
1105
1106
1107
1108
1109
1110
1111
1112
1113
1114
1115
1116
1117
1118
1119
1120
1121
1122
1123
1124
1125
1126
1127
1128
1129
1130
1131
1132
1133
1134
1135
1136
1137
1138
1139
1140
Kim et al. TCF4 Distribution
FIGURE 5 | TCF4 expression patterns of the neonatal and juvenile mousebrain. A–D DAB immunostaining of GFP (for TCF4) in sagittal brain sections ofTcf4LGSL/+ mice at P1, P10, P20, and P60. A similar staining pattern largelypersists throughout postnatal development. Scale bars = 1 mm.
of Olig2/APC positive cells, reflecting mature, myelinatingoligodendrocytes, stained for GFP in the PFC and corpuscallosum at P20 (Figure 6N). Similarly, a subset of immatureoligodendrocytes, labeled only by Olig2, stained for GFP(Figure 6N). Our results show that among major glial cellpopulations in the brain, astrocytes and both immature andmature oligodendrocytes express TCF4, while microglia appearto lack TCF4 expression.
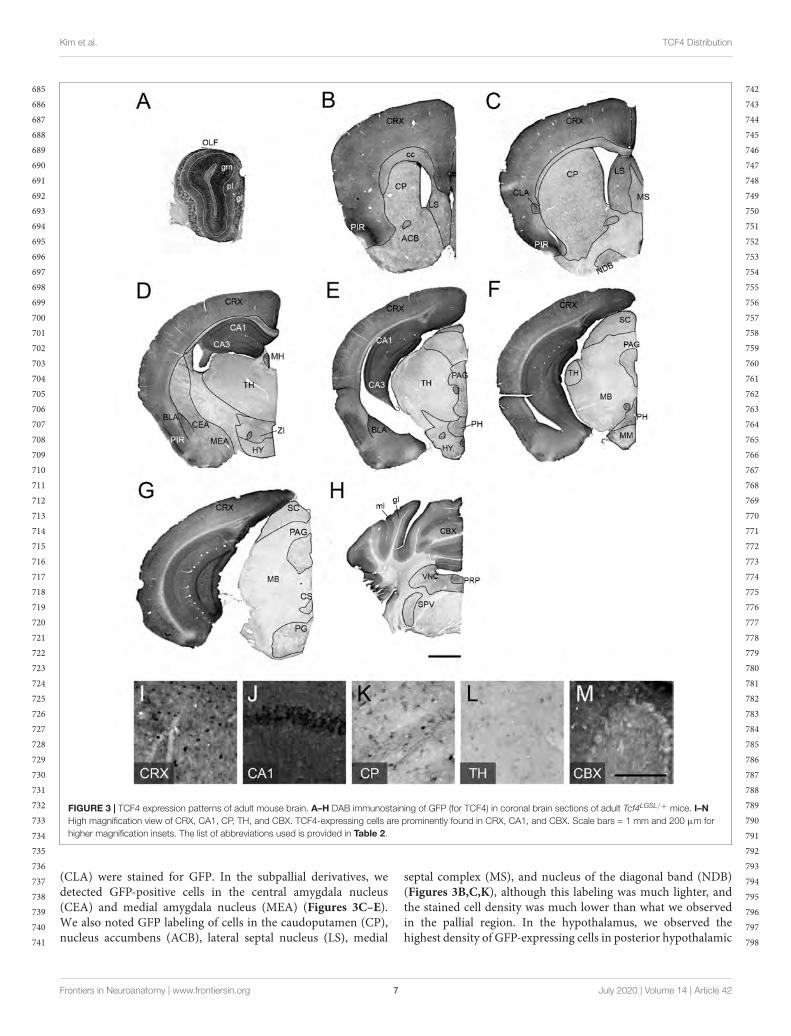
Pyramidal Cells, GABAergicInterneurons, and Astrocytes ExpressTCF4 in the HippocampusTcf4 deficient mice exhibited deficits in the behavioral tasksthat require proper hippocampal functions. Additionally, aform of hippocampal synaptic plasticity was altered in these
mice (Kennedy et al., 2016; Thaxton et al., 2018). Therefore,we characterized TCF4-expressing cell types in this brainregion to reveal which cell types might contribute to thesephenotypes. First, we examined glutamatergic and GABAergiccell populations by staining for GFP in LGSL::Gad2-Creand LGSL::Nex-Cre mice. As expected from our ISH data(CA1, Figure 4), glutamatergic pyramidal cells of the CA1region exhibited strong GFP labeling (Figure 7A). Moreover,we detected strong residual labeling in GABAergic cellsacross the layers (Figure 7B). The hippocampal GABAergicinhibitory circuits consist of SOM-, PV-, VIP-, neuropeptide Y-,calretinin-, and cholecystokinin-expressing interneurons (Pelkeyet al., 2017). We tested whether some of these inhibitoryinterneurons expressed TCF4 by performing coimmunostainingin LGSL::Nex-Cre brain. We found that SOM-, PV- andVIP-positive neurons stained for GFP at P20 and P80(Figures 7C–E). GFP staining in LGSL::Nex-Cre mice revealedclearly identifiable star-shaped cells (rad. layer, Figure 7B).Our coimmunostaining result showed that GFAP-positiveastrocytes stained for GFP (Figure 7F). But, IBA-positivemicroglial cells were devoid of GFP (Figure 7G). Our resultsdemonstrated that TCF4-expressing hippocampal cell groupsconsist of astrocytes, pyramidal cells, and SOM-, PV-, and VIP-containing interneurons.
SOM and PV Interneurons andAstrocytes Express TCF4 in the StriatumThe vast majority of striatal neurons signal through GABAto inhibit their target cells (Koos and Tepper, 1999; Gittiset al., 2010). Because we observed that only ∼19% of striatalcells express Tcf4 (STR, Figure 4), we speculated that thesewould comprise specific subgroups of GABAergic neurons. Usingdouble ISH, we detected Tcf4 signals in a subset of vGat-expressing cells (Figures 8A–C). We subsequently employeda double immunostaining approach in juvenile and adultTcf4LGSL/+ mice to further define TCF4-expressing GABAergicpopulation. We found that the GFP-labeled cells were notcolocalized with medium spiny neurons (MSNs), marked byDARPP32 (Figure 8D), indicating that GABAergic MSNsdo not express TCF4. Cholinergic interneurons, marked bycholine acetyltransferase (ChAT), represent another major cellGABAergic class in the striatum in which GFP was notexpressed (Figure 8E). SOM and PV expression characterizesother GABAergic interneuron types in the striatum (Munoz-Manchado et al., 2018). We detected GFP in SOM- and PV-positive interneurons at P20, and this colocalization persisted inthe adult striatum (Figures 8F,G). Interestingly, a few SOM orPV positive cells did not stain for GFP, raising the possibility thatTCF4 expression could confer unique functional properties tosubsets of PV and SOM interneurons. We showed earlier in thisstudy that TCF4 was expressed in astrocytes, but not microglialcells, in the cortex and hippocampus (Figures 6L,M, 7F,G).Thus, we asked whether this expression pattern also applied tothe striatum. We detected GFP in GFAP-positive cells, but notin IBA1-positive cells (Figures 8F,G). Collectively, these datasuggest that TCF4 expression in the striatum is restricted to PV
Frontiers in Neuroanatomy | www.frontiersin.org 10 July 2020 | Volume 14 | Article 42

fnana-14-00042 June 28, 2020 Time: 19:30 # 11
1141
1142
1143
1144
1145
1146
1147
1148
1149
1150
1151
1152
1153
1154
1155
1156
1157
1158
1159
1160
1161
1162
1163
1164
1165
1166
1167
1168
1169
1170
1171
1172
1173
1174
1175
1176
1177
1178
1179
1180
1181
1182
1183
1184
1185
1186
1187
1188
1189
1190
1191
1192
1193
1194
1195
1196
1197
1198
1199
1200
1201
1202
1203
1204
1205
1206
1207
1208
1209
1210
1211
1212
1213
1214
1215
1216
1217
1218
1219
1220
1221
1222
1223
1224
1225
1226
1227
1228
1229
1230
1231
1232
1233
1234
1235
1236
1237
1238
1239
1240
1241
1242
1243
1244
1245
1246
1247
1248
1249
1250
1251
1252
1253
1254
Kim et al. TCF4 Distribution
FIGURE 6 | Glutamatergic, GABAergic cells, astrocytes, and oligodendrocytes express TCF4 in the PFC. A, B DAB immunostaining of GFP (for TCF4) in coronalsections of P80 LGSL::Gad2-cre or LGSL::Nex-cre mice where GFP protein is deleted in inhibitory or excitatory neurons, respectively. Both glutamatergic andGABAergic cells express TCF4. Scale bars = 0.5 mm. C–E, F–H Dual ISH for vGult1 and Tcf4 and for vGat and Tcf4 in P80 WT brain tissue, confirming that Tcf4mRNA is present in vGlut1- and vGat-expressing cells. Scale bars = 20 µm. I–K Dual immunostaining of interneuron subtype-specific markers, SOM, PV, or VIP, andGFP (for TCF4) in P20 and P80 LGSL::Nex-cre mice. TCF4 is expressed in nearly all SOM-, PV-, and VIP-positive interneurons (arrows). Asterisk represents rareinterneuron that does not express GFP. Scale bars = 30 µm. L, M: Dual immunostaining of astrocyte marker, GFAP, or microglial marker, IBA1, and GFP (for TCF4) inP20 and P80 LGSL::Nex-cre mice. GFAP-labeled cells express GFP (arrows), but IBA1-labeled cells do not express GFP (asterisk). Scale bars = 30 or 10 µm forhigher magnification insets. N Triple immunostaining of APC, Olig2, and GFP (for TCF4) in the PFC (top panel) and corpus callosum (bottom panel) of P20LGSL::Nex-cre mice. TCF4 is expressed in mature (arrow) and immature (double arrow) oligodendrocytes. Scale bars = 20 µm.
Frontiers in Neuroanatomy | www.frontiersin.org 11 July 2020 | Volume 14 | Article 42
fnana-14-00042 June 28, 2020 Time: 19:30 # 12
1255
1256
1257
1258
1259
1260
1261
1262
1263
1264
1265
1266
1267
1268
1269
1270
1271
1272
1273
1274
1275
1276
1277
1278
1279
1280
1281
1282
1283
1284
1285
1286
1287
1288
1289
1290
1291
1292
1293
1294
1295
1296
1297
1298
1299
1300
1301
1302
1303
1304
1305
1306
1307
1308
1309
1310
1311
1312
1313
1314
1315
1316
1317
1318
1319
1320
1321
1322
1323
1324
1325
1326
1327
1328
1329
1330
1331
1332
1333
1334
1335
1336
1337
1338
1339
1340
1341
1342
1343
1344
1345
1346
1347
1348
1349
1350
1351
1352
1353
1354
1355
1356
1357
1358
1359
1360
1361
1362
1363
1364
1365
1366
1367
1368
Kim et al. TCF4 Distribution
FIGURE 7 | Pyramidal cells, GABAergic interneurons, and astrocytes express TCF4 in the hippocampus. A, B DAB immunostaining of GFP (for TCF4) in the CA1 ofP80 LGSL::Gad2-cre or LGSL::Nex-cre mice. Both pyramidal layer cells and GABAergic cells express TCF4. Scale bars = 0.5 mm. C–E Dual immunostaining ofinterneuron subtype-specific markers, SOM, PV, or VIP, and GFP (for TCF4) in P20 and P80 LGSL::Nex-cre mice. TCF4 is expressed nearly all SOM-, PV-, orVIP-positive interneurons (arrows). F, G Dual immunostaining of GFAP or IBA1, and GFP (for TCF4) in P20 and P80 LGSL::Nex-cre mice. GFAP-labeled cells expressGFP (arrow), but IBA1-labeled cells do not express GFP (asterisks). Scale bars = 30 or 10 µm for higher magnification insets.
and SOM interneurons and astrocytes, but not to medium spiny,cholinergic neurons, and microglial cells.
TCF4 Is Enriched in the Molecular andGranule Cell Layer of the CerebellarCortexWe consistently observed strong GFP immunoreactivity in thecerebellum across postnatal development (Figures 3M, 5). Thus,we further characterized TCF4 distribution in this structure,focusing on the molecular, Purkinje cell, and granule cell layers.At P10, a timepoint of ongoing cerebellar histogenesis (Altman,1969), we found that GFP was enriched in the extracellular areaof the molecular layer and inner granule layer, but absent in the
external granule layer and Purkinje cell layer (Figure 9A). NeuNstaining clearly marked neurons with a multipolar morphology,presumably traversing the molecular layer toward the innergranule layer (Figure 9B). These cells were negative for GFP(Figures 9A–C), suggesting that migrating granule cells donot express TCF4. In the inner granule layer, where post-migratory granule cells undergo maturation, we infrequentlyfound NeuN-positive cells that costained with GFP (Figures 9A–C). By adulthood, however, nearly all NeuN-positive neuronsin the granule layer costained for GFP (Figures 9E–G), leadingus to surmise that cerebellar granule cells only upregulateTCF4 expression as they mature. Regardless of age, GABAergicPurkinje cell bodies, labeled by calbindin, lacked GFP staining(Figures 9D,H). Consistent with our GFP immunostaining
Frontiers in Neuroanatomy | www.frontiersin.org 12 July 2020 | Volume 14 | Article 42

fnana-14-00042 June 28, 2020 Time: 19:30 # 13
1369
1370
1371
1372
1373
1374
1375
1376
1377
1378
1379
1380
1381
1382
1383
1384
1385
1386
1387
1388
1389
1390
1391
1392
1393
1394
1395
1396
1397
1398
1399
1400
1401
1402
1403
1404
1405
1406
1407
1408
1409
1410
1411
1412
1413
1414
1415
1416
1417
1418
1419
1420
1421
1422
1423
1424
1425
1426
1427
1428
1429
1430
1431
1432
1433
1434
1435
1436
1437
1438
1439
1440
1441
1442
1443
1444
1445
1446
1447
1448
1449
1450
1451
1452
1453
1454
1455
1456
1457
1458
1459
1460
1461
1462
1463
1464
1465
1466
1467
1468
1469
1470
1471
1472
1473
1474
1475
1476
1477
1478
1479
1480
1481
1482
Kim et al. TCF4 Distribution
FIGURE 8 | StriatalQ12 interneurons, but not medium spiny neurons, express TCF4. A Representative ISH images for Tcf4 and vGat from adult WT striatum, showingthat specific subtypes of interneurons express Tcf4 (arrows). Scale bar = 20 µm. D–G Dual immunostaining of DARPP32, ChAT, SOM, or PV and GFP (for TCF4) inP20 and P80 Tcf4LGSL/+ mice. The representative staining images reveal that SOM- and PV-positive subtype interneurons express TCF4 (arrow). Asterisks representonly GFP-positive neurons. Double arrows represent interneuron subtypes that do not express GFP. Scale bars = 20 µm. H, I Dual immunostaining of GFAP or IBA1,and GFP (for TCF4) in P20 and P80 Tcf4LGSL/+ mice. GFAP-labeled cells express GFP (arrow), but IBA1-labeled cells do not express GFP (asterisk). Scale bars = 30or 10 µm for higher magnification insets.
Frontiers in Neuroanatomy | www.frontiersin.org 13 July 2020 | Volume 14 | Article 42
bphilpot
Highlight

fnana-14-00042 June 28, 2020 Time: 19:30 # 14
1483
1484
1485
1486
1487
1488
1489
1490
1491
1492
1493
1494
1495
1496
1497
1498
1499
1500
1501
1502
1503
1504
1505
1506
1507
1508
1509
1510
1511
1512
1513
1514
1515
1516
1517
1518
1519
1520
1521
1522
1523
1524
1525
1526
1527
1528
1529
1530
1531
1532
1533
1534
1535
1536
1537
1538
1539
1540
1541
1542
1543
1544
1545
1546
1547
1548
1549
1550
1551
1552
1553
1554
1555
1556
1557
1558
1559
1560
1561
1562
1563
1564
1565
1566
1567
1568
1569
1570
1571
1572
1573
1574
1575
1576
1577
1578
1579
1580
1581
1582
1583
1584
1585
1586
1587
1588
1589
1590
1591
1592
1593
1594
1595
1596
Kim et al. TCF4 Distribution
results, ISH for Tcf4 in adult wildtype cerebellum confirmed thatmost granule cells expressed Tcf4, while GABAergic Purkinjecells did not (Figures 9I–K). We also detected Tcf4-expressingcells in most GABAergic interneurons of the molecular layer(Figures 9I–K).
DISCUSSION
It is imperative to understand the cellular distribution of TCF4during postnatal development in order to guide the delivery oftherapeutics for TCF4-linked disorders. Toward this goal, wedeveloped a mouse with a TCF4-GFP reporter that conferredgreater sensitivity for detecting TCF4 expression than existingantibody detection methods (Figure 2). We validated the TCF4-GFP reporter mouse model by using double in situ labelingto show that about 98% of Tcf4-containing cells express GFP,proving the mouse model as a faithful reporter for TCF4(Figures 1E–H). While the GFP reporter was designed to diffusefreely through the cytoplasm, and thus is not a marker of TCF4subcellular localization, the reporter offers the advantage thatit can label dendritic arborizations and axonal projections ofTCF4-expressing neurons (Figures 2G, 5A). To improve ourability to observe TCF4-expressing cell types, we conditionallydeleted the GFP reporter in a Cre-dependent manner. Thisallowed us to more easily observe the remaining GFP-positivecells with an improved signal to noise ratio (Figures 6A,B,7A,B). We used these approaches, coupled with double-labelingimmunohistochemistry and in situ hybridization, to characterizethe cell type-specific and spatiotemporal expression of TCF4 inthe postnatal mouse brain.
TCF4 Expression Patterns and TheirImplications in Pathology ofTCF4-Linked DisordersCommon genetic variants in and around TCF4 are associatedwith a range of neurodevelopmental and psychiatric disorders.Rare TCF4 single nucleotide variants have been described inschizophrenia patients whose symptoms include impairmentsof attention, memory, social cognition, and executive functions(Basmanav et al., 2015; Forrest et al., 2018). TCF4 mutationshave been found in large-scale genotyping studies in patientswith intellectual disability and autism spectrum disorder (ASD)(Kharbanda et al., 2016; Maduro et al., 2016). Haploinsufficiencyof TCF4 causes PTHS – a rare form of intellectual disabilityassociated with characteristic facial features and motor andspeech dysfunction (Goodspeed et al., 2018; Zollino et al.,2019). Collectively, these studies implicate TCF4 in a range ofbrain disorders that are commonly associated with cognitivedysfunction. The prefrontal cortex is linked with a rangeof cognition including cognitive control, lower-level sensoryprocessing, memory, and motor operations (Miller, 2000). Thehippocampus supports learning and memory functions in aspatiotemporal context (Dupret et al., 2010; Rubin et al., 2014).The prefrontal cortex and hippocampus are thus suspectedpathophysiological loci for TCF4-linked disorders. TCF4 isenriched in most cortical and hippocampal cells, including
excitatory and inhibitory neurons, as well as astrocytes, andoligodendrocytes, in the juvenile and adult mouse brain(Figures 5–7). These findings in TCF4-expressing cell groupssupport the idea that functions of the prefrontal cortex andhippocampus are particularly susceptible to subtle changes inTCF4 expression. TCF4 loss is associated with defects in corticalcell positioning, dendritic spines, and arborizations (Chen et al.,2016; Li et al., 2019). TCF4 haploinsufficiency results in reducedhippocampal volume and cortical thickness in mice (Jung et al.,2018). These structural phenotypes are likely linked to functionalconsequences, including abnormal neuronal excitability andsynaptic plasticity in the prefrontal cortex and hippocampus,which are consistently observed across multiple PTHS mousemodels (Kennedy et al., 2016; Rannals et al., 2016; Thaxton et al.,2018). These cell physiological defects in turn likely contribute tothe impairments in cognition and memory functions in patientswith TCF4-linked disorders.
Severe motor delay and stereotypic behavior are consistentphenotypes observed in patients with PTHS (Goodspeed et al.,2018; Zollino et al., 2019). However, the potential mechanismunderlying motor deficits and stereotypies remains unknown.The striatum is involved in translating cortical activity intoadaptive motor actions and controlled movement (Kreitzer andMalenka, 2008). At the circuit levels, some striatal interneuronsreceive direct cortical afferents. For example, activity of striatalPV interneurons, known to inhibit MSNs, are enhanced bycortical stimulation. Regardless of cortical projections, SOMinterneurons locally target MSNs and ChAT-positive neurons(Straub et al., 2016). TCF4 is expressed in PV and SOMinterneurons, but not in MSNs and ChAT-positive neurons(Figure 8), suggesting that TCF4 loss may alter striatal circuitfunctions through PV and SOM interneurons. Disruptionsin GABAergic circuits of the striatum have been found inneuropsychiatric disorders and autism (Maia and Frank, 2011;Rapanelli et al., 2017; Skene et al., 2018). Further experiments willbe required to determine whether GABAergic circuit dysfunctionoccurs with TCF4 loss, and if so, whether it is the direct cause ofmotor delay and stereotypic behaviors.
The cerebellum contributes to motor coordination, cognitiveprocessing and emotional control (Schmahmann and Caplan,2006). It is structurally and functionally abnormal in patientsdiagnosed with ASD and other neurodevelopmental disorders(Rogers et al., 2013). Cognitive functions are impaired inindividuals with developmental reductions in cerebellar volume.Also, the degree of volume reduction is correlated with the degreeof cognitive impairment (Steinlin, 2008; Bolduc et al., 2012).Patients with PTHS display reduced volume of the cerebellum(Peippo et al., 2006; Whalen et al., 2012), which may contributeto severity of cognitive and motor impairment. The adult humancerebellum expresses high levels of TCF4 (Jung et al., 2018).Similar to the human brain, TCF4 is prominently expressedin the mouse cerebellum during postnatal development andin adulthood (Figures 3H, 5). Our data thus suggest that thecerebellum is a candidate brain region that needs to be evaluatedto determine whether TCF4 regulates cerebellar structure, andperhaps function. We found that differentiated and migratinggranule cells repress TCF4 expression, while post-migratory
Frontiers in Neuroanatomy | www.frontiersin.org 14 July 2020 | Volume 14 | Article 42

fnana-14-00042 June 28, 2020 Time: 19:30 # 15
1597
1598
1599
1600
1601
1602
1603
1604
1605
1606
1607
1608
1609
1610
1611
1612
1613
1614
1615
1616
1617
1618
1619
1620
1621
1622
1623
1624
1625
1626
1627
1628
1629
1630
1631
1632
1633
1634
1635
1636
1637
1638
1639
1640
1641
1642
1643
1644
1645
1646
1647
1648
1649
1650
1651
1652
1653
1654
1655
1656
1657
1658
1659
1660
1661
1662
1663
1664
1665
1666
1667
1668
1669
1670
1671
1672
1673
1674
1675
1676
1677
1678
1679
1680
1681
1682
1683
1684
1685
1686
1687
1688
1689
1690
1691
1692
1693
1694
1695
1696
1697
1698
1699
1700
1701
1702
1703
1704
1705
1706
1707
1708
1709
1710
Kim et al. TCF4 Distribution
FIGURE 9 | Cerebellar granule and molecular layer cells, but not Purkinje cells, express TCF4. A–H Triple immunostaining of GFP (for TCF4), NeuN, and Purkinje cellmarker, calbindin, in P20 and P80 Tcf4LGSL/+ mouse cerebellum. The representative images confirm that migrating NeuN-positive granule cells in the molecular layer(ml) lack TCF4 (double arrows), and post-migratory granule cells in the inner granule layer (igl) express TCF4 (arrows). Purkinje cells do not express TCF4.egl = External granule layer. I–K Representative ISH images for Tcf4 and DAPI in WT adult cerebellum, showing that Tcf4 mRNA is present in granule and molecularlayer (gl and ml) cell nuclei, but it is absent in Purkinje cell nuclei (dashed line). Scale bars = 30 µm.
mature granule cells upregulate TCF4 expression (Figures 9A–C,E–G). Our findings indicate that TCF4 is positioned tomodulate maturation of the granule cells after migration. Futurestudy will need to address whether TCF4 loss or dysfunctionalters cerebellar anatomy and local circuit function, and if so,whether changes in cerebellar circuit directly cause motor andcognitive deficits.
Neurons are produced in the proliferative ventricular zone(VZ) and the subventricular zone (SVZ) of the embryonictelencephalon during development of the cortex (Bystron et al.,2008). These neurons migrate along radial glia fibers throughthe intermediate zone to form six-layer laminar structures(Rakic, 1972; Rakic et al., 2009). Differentiation and synapseformation occur once neurons are properly positioned (Katzand Shatz, 1996; Bystron et al., 2008; Frank and Tsai, 2009).Alterations in any of these processes are involved in pathogenesisof neurodevelopmental disorders such as autism, intellectualdisability, and schizophrenia (Fan et al., 2013; Fang et al., 2014;Stoner et al., 2014). TCF4 is present in the VZ/SVZ of the dorsaltelencephalon at an early embryonic stage in both humans andmice (de Pontual et al., 2009; Jung et al., 2018). The mouse
cortex produces TCF4 protein at the highest level during earlyembryonic and neonatal development (Chen et al., 2016). Ourpostnatal immunostaining study shows that TCF4 is upregulatedin the mouse cortex at birth, but as mice age, it is downregulated(Figure 5). After birth and through the first 7 to 10 days ofpostnatal development, cells undergo migration, differentiation,and maturation processes. Therefore, TCF4 is well positioned toinfluence these critical steps of corticogenesis. TCF4 loss delaysneuronal migration, resulting in a thin cortical upper layer (Liet al., 2019). Beyond migration, dendritic and synaptic formationare abnormal in Tcf4 haploinsufficient mice (Li et al., 2019).These previous and current findings suggest that TCF4 may bean upstream gene of the molecular network regulating migrationand maturation processes.
Spatial specificity of axonal projections across different brainregions is important for normal brain development and function(Abelson et al., 2005; Matsuda and Cepko, 2007; Mortazavi et al.,2008), and TCF4 could be positioned to affect such projections.The TCF4 reporter mouse allowed us to visualize projectingaxons, as the GFP reporter was free to diffuse throughoutthe cytoplasmic compartment (Figure 1A). The GFP reporter
Frontiers in Neuroanatomy | www.frontiersin.org 15 July 2020 | Volume 14 | Article 42

fnana-14-00042 June 28, 2020 Time: 19:30 # 16
1711
1712
1713
1714
1715
1716
1717
1718
1719
1720
1721
1722
1723
1724
1725
1726
1727
1728
1729
1730
1731
1732
1733
1734
1735
1736
1737
1738
1739
1740
1741
1742
1743
1744
1745
1746
1747
1748
1749
1750
1751
1752
1753
1754
1755
1756
1757
1758
1759
1760
1761
1762
1763
1764
1765
1766
1767
1768
1769
1770
1771
1772
1773
1774
1775
1776
1777
1778
1779
1780
1781
1782
1783
1784
1785
1786
1787
1788
1789
1790
1791
1792
1793
1794
1795
1796
1797
1798
1799
1800
1801
1802
1803
1804
1805
1806
1807
1808
1809
1810
1811
1812
1813
1814
1815
1816
1817
1818
1819
1820
1821
1822
1823
1824
Kim et al. TCF4 Distribution
revealed corticothalamic projections and what appeared to bethe corticospinal and corticobulbar tracts (Figure 5A). Becausecorticothalamic neurons are largely localized in layer 6, and thecorticospinal and corticobulbar tracts are largely localized tolayer 5 (Chen et al., 2005; Jacobs et al., 2007), our data suggestthat TCF4 may be expressed in both layer 5 and 6 projectionneurons, although additional experiments will be required todirectly confirm this. Several studies demonstrated that TCF4regulates the laminar pattern and structure of the cortex (Chenet al., 2016; Li et al., 2019), and our findings suggest thatTCF4 may also be critical to the development of corticofugalprojections. To test this possibility, the consequences of TCF4 losson axonal projections during embryonic development need to bethoroughly examined.
Insights Into Genetic NormalizationStrategies to Treat TCF4-RelatedDisordersTCF4 is a major transcription modulator that differentiallycontrols the expression of hundreds of genes (Forrest et al.,2013; Hill et al., 2017; Xia et al., 2018). Thus, it is whollyimpracticable to develop therapeutic tools that adjust thedosage of each impacted gene. Ideally, TCF4-linked disorderscan be treated by normalizing TCF4 gene expression levels.A slight upregulation of TCF4 rescues learning and memoryphenotypes in adult PTHS mouse model (Kennedy et al., 2016).Studies from similar neurodevelopmental disorders, includingRett and Angelman syndrome, show that reinstatement ofaffected gene expression can provide therapeutic benefits (Guyet al., 2007; Silva-Santos et al., 2015; Sinnett et al., 2017).These convergent lines of evidence support the idea thatTCF4-linked disorders can benefit from normalizing TCF4levels. Gene therapy using adeno-associated virus (AAV) hasbeen clinically tested as a potential therapeutic interventionfor genetic disorders (Deverman et al., 2018; Hudry andVandenberghe, 2019). In principle, disorders linked to the lossof TCF4 function should be amenable to correction followingtreatment with viral vectors coding for TCF4. Key experimentalparameters requiring AAV-mediated gene therapy strategiesinclude distribution of viral vector and the age at time oftreatment. TCF4 is distributed in nearly all neurons, astrocytes,and oligodendrocytes in the forebrain at all ages (Figures 6, 7). Incontrast, only selective cell types express TCF4 in the striatum,thalamus, midbrain, hindbrain, and cerebellum (Figures 3–5,8). Optimal design of viral vectors will thus require carefulchoice of promoter, capsid, and delivery method to promoteexpression in forebrain neurons over other brain regions.Moreover, microglial cells, medium spiny neurons, ChAT-positive striatal cells, and Purkinje cells lack TCF4 expression(Figures 6–9). Thus, a major challenge for successful therapyis avoiding upregulation of TCF4 in these cell types, as it isunclear how TCF4 expression in these cells will modify thetranscriptional machinery.
The other critical parameter that must be considered intreating TCF4-linked disorders is timing of TCF4 expression.Based on the expression profiling of TCF4 (Figure 5;
Jung et al., 2018), we predict that earlier interventions willhave a larger therapeutic impact on TCF4-linked disorders.After proliferation and maturation, which occur in the prenataland neonatal periods, there is no need to increase the numberof neurons in the brain, except for the hippocampal dentategyrus. Therefore, after the critical timepoint of neurogenesisand synaptogenesis, the brain undergoes limited plastic changes(Bystron et al., 2008; Budday et al., 2015). Late onset therapiesare unlikely to exert as dramatic a phenotypic improvementcompared to early intervention, yet partial improvement ofsome phenotypes in adults or prevention of disease progressionwould be significant achievements. Our novel TCF4 conditionalmouse model allows us to reinstate wildtype Tcf4 under itsown promoter and regulatory elements (Figure 1A). Usingthis powerful tool, future experiments must be performed todetermine the latest age by which normalizing TCF4 expressioncan improve or even rescue PTHS-associated phenotypes.
DATA AVAILABILITY STATEMENT
The Q8raw data supporting the conclusions of this article will bemade available by the authors, without undue reservation.
ETHICS STATEMENT
The Q9animal study was reviewed and approved by Colleen Fritsche,UNC at Chapel Hill.
AUTHOR CONTRIBUTIONS
HK Q10designed the experiments with guidance from BP, performedthe experiments and analyzed the data. NB and NO performedin situ hybridizations and provided histological assistance. HKand BP wrote the manuscript. All authors contributed scientificinsights and provided critical readings of the manuscript.
FUNDING
This work was supported by the Pitt Hopkins ResearchFoundation and NINDS grant R01NS114086 to BP Microscopywas performed at the Neuroscience Microscopy Core Facility,supported, in part, by funding from the NIH-NINDSNeuroscience Center Support Grant P30 NS045892 and theNIH-NICHD Intellectual and Developmental DisabilitiesResearch Center Support Grant U54 HD079124.
ACKNOWLEDGMENTS
We thank Matthew C. Judson, Mason T. Riley, and Alain C.Burette for critical readings of the manuscript, Dale Cowley atthe UNC Animal Models Core for designing and generating thenew mouse model, Bonnie Taylor-Blake for sharing some of theantibodies, and Klaus-Armin Nave for providing Nex-Cre mice.
Frontiers in Neuroanatomy | www.frontiersin.org 16 July 2020 | Volume 14 | Article 42
bphilpot
Highlight
fnana-14-00042 June 28, 2020 Time: 19:30 # 17
1825
1826
1827
1828
1829
1830
1831
1832
1833
1834
1835
1836
1837
1838
1839
1840
1841
1842
1843
1844
1845
1846
1847
1848
1849
1850
1851
1852
1853
1854
1855
1856
1857
1858
1859
1860
1861
1862
1863
1864
1865
1866
1867
1868
1869
1870
1871
1872
1873
1874
1875
1876
1877
1878
1879
1880
1881
1882
1883
1884
1885
1886
1887
1888
1889
1890
1891
1892
1893
1894
1895
1896
1897
1898
1899
1900
1901
1902
1903
1904
1905
1906
1907
1908
1909
1910
1911
1912
1913
1914
1915
1916
1917
1918
1919
1920
1921
1922
1923
1924
1925
1926
1927
1928
1929
1930
1931
1932
1933
1934
1935
1936
1937
1938
Kim et al. TCF4 Distribution
REFERENCESAbelson, J. F., Kwan, K. Y., O’Roak, B. J., Baek, D. Y., Stillman, A. A.,
Morgan, T. M., et al. (2005). Sequence variants in SLITRK1 are associatedwith Tourette’s syndrome. Science 310, 317–320. doi: 10.1126/science.1116502
Altman, J. (1969). Autoradiographic and histological studies of postnatalneurogenesis. IV. Cell proliferation and migration in the anteriorforebrain, with special reference to persisting neurogenesis in theolfactory bulb. J. Comp. Neurol. 137, 433–457. doi: 10.1002/cne.901370404
Amiel, J., Rio, M., de Pontual, L., Redon, R., Malan, V., Boddaert, N.,et al. (2007). Mutations in TCF4, encoding a class I basic helix-loop-helixtranscription factor, are responsible for Pitt-Hopkins syndrome, a severeepileptic encephalopathy associated with autonomic dysfunction. Am. J. Hum.Genet. 80, 988–993. doi: 10.1086/515582
Basmanav, F. B., Forstner, A. J., Fier, H., Herms, S., Meier, S., Degenhardt, F.,et al. (2015). Investigation of the role of TCF4 rare sequence variants inschizophrenia. Am. J. Med. Genet. B Neuropsychiatr. Genet. 168B, 354–362.doi: 10.1002/ajmg.b.32318
Bedeschi, M. F., Marangi, G., Calvello, M. R., Ricciardi, S., Leone, F. P. C., Baccarin,M., et al. (2017). Impairment of different protein domains causes variableclinical presentation within Pitt-Hopkins syndrome and suggests intragenicmolecular syndromology of TCF4. Eur. J. Med. Genet. 60, 565–571. doi: 10.1016/j.ejmg.2017.08.004
Bhat, R. V., Axt, K. J., Fosnaugh, J. S., Smith, K. J., Johnson, K. A., Hill, D. E., et al.(1996). Expression of the APC tumor suppressor protein in oligodendroglia.Glia 17, 169–174.
Bolduc, M. E., du Plessis, A. J., Sullivan, N., Guizard, N., Zhang, X., Robertson,R. L., et al. (2012). Regional cerebellar volumes predict functional outcome inchildren with cerebellar malformations. Cerebellum 11, 531–542. doi: 10.1007/s12311-011-0312-z
Budday, S., Steinmann, P., and Kuhl, E. (2015). Physical biology of humanbrain development. Front. Cell. Neurosci. 9:257. doi: 10.3389/fncel.2015.00257
Bystron, I., Blakemore, C., and Rakic, P. (2008). Development of the humancerebral cortex: Boulder Committee revisited. Nat. Rev. Neurosci. 9, 110–122.doi: 10.1038/nrn2252
Chen, B., Schaevitz, L. R., and McConnell, S. K. (2005). Fezl regulates thedifferentiation and axon targeting of layer 5 subcortical projection neurons incerebral cortex. Proc. Natl. Acad. Sci. U.S.A. 102, 17184–17189. doi: 10.1073/pnas.0508732102
Chen, T., Wu, Q., Zhang, Y., Lu, T., Yue, W., and Zhang, D. (2016). Tcf4 ControlsNeuronal Migration of the Cerebral Cortex through Regulation of Bmp7. Front.Mol. Neurosci. 9:94. doi: 10.3389/fnmol.2016.00094
de Pontual, L., Mathieu, Y., Golzio, C., Rio, M., Malan, V., Boddaert, N., et al.(2009). Mutational, functional, and expression studies of the TCF4 genein Pitt-Hopkins syndrome. Hum. Mutat. 30, 669–676. doi: 10.1002/humu.20935
DeFelipe, J. (1993). Neocortical neuronal diversity: chemical heterogeneityrevealed by colocalization studies of classic neurotransmitters, neuropeptides,calcium-binding proteins, and cell surface molecules. Cereb. Cortex 3, 273–289.doi: 10.1093/cercor/3.4.273
Deverman, B. E., Ravina, B. M., Bankiewicz, K. S., Paul, S. M., and Sah, D. W. Y.(2018). Gene therapy for neurological disorders: progress and prospects. Nat.Rev. Drug Discov. 17:767. doi: 10.1038/nrd.2018.158
Dupret, D., O’Neill, J., Pleydell-Bouverie, B., and Csicsvari, J. (2010). Thereorganization and reactivation of hippocampal maps predict spatialmemory performance. Nat. Neurosci. 13, 995–1002. doi: 10.1038/nn.2599
Fan, Y., Abrahamsen, G., Mills, R., Calderon, C. C., Tee, J. Y., Leyton, L., et al.(2013). Focal adhesion dynamics are altered in schizophrenia. Biol. Psychiatry74, 418–426. doi: 10.1016/j.biopsych.2013.01.020
Fang, W. Q., Chen, W. W., Jiang, L., Liu, K., Yung, W. H., Fu, A. K. Y., et al.(2014). Overproduction of upper-layer neurons in the neocortex leads toautism-like features in mice. Cell Rep. 9, 1635–1643. doi: 10.1016/j.celrep.2014.11.003
Forrest, M. P., Hill, M. J., Kavanagh, D. H., Tansey, K. E., Waite, A. J., andBlake, D. J. (2018). The psychiatric risk gene transcription factor 4 (TCF4)regulates neurodevelopmental pathways associated with schizophrenia, autism,and intellectual disability. Schizophr. Bull. 44, 1100–1110. doi: 10.1093/schbul/sbx164
Forrest, M. P., Waite, A. J., Martin-Rendon, E., and Blake, D. J. (2013). Knockdownof human TCF4 affects multiple signaling pathways involved in cell survival,epithelial to mesenchymal transition and neuronal differentiation. PLoS One8:e73169. doi: 10.1371/journal.pone.0073169
Frank, C. L., and Tsai, L. H. (2009). Alternative functions of core cell cycleregulators in neuronal migration, neuronal maturation, and synaptic plasticity.Neuron 62, 312–326. doi: 10.1016/j.neuron.2009.03.029
Fu, H., Cai, J., Clevers, H., Fast, E., Gray, S., Greenberg, R., et al. (2009). A genome-wide screen for spatially restricted expression patterns identifies transcriptionfactors that regulate glial development. J. Neurosci. 29, 11399–11408. doi: 10.1523/JNEUROSCI.0160-09.2009
Gittis, A. H., Nelson, A. B., Thwin, M. T., Palop, J. J., and Kreitzer, A. C. (2010).Distinct roles of GABAergic interneurons in the regulation of striatal outputpathways. J. Neurosci. 30, 2223–2234. doi: 10.1523/JNEUROSCI.4870-09.2010
Goebbels, S., Bormuth, I., Bode, U., Hermanson, O., Schwab, M. H., and Nave, K. A.(2006). Genetic targeting of principal neurons in neocortex and hippocampusof NEX-Cre mice. Genesis 44, 611–621. doi: 10.1002/dvg.20256
Gonchar, Y., and Burkhalter, A. (1997). Three distinct families of GABAergicneurons in rat visual cortex. Cereb. Cortex 7, 347–358. doi: 10.1093/cercor/7.4.347
Goodspeed, K., Newsom, C., Morris, M. A., Powell, C., Evans, P., and Golla,S. (2018). Pitt-Hopkins syndrome: a review of current literature, clinicalapproach, and 23-patient case series. J. Child Neurol. 33, 233–244. doi: 10.1177/0883073817750490
Guy, J., Gan, J., Selfridge, J., Cobb, S., and Bird, A. (2007). Reversal of neurologicaldefects in a mouse model of Rett syndrome. Science 315, 1143–1147. doi: 10.1126/science.1138389
Hill, M. J., Killick, R., Navarrete, K., Maruszak, A., McLaughlin, G. M., Williams,B. P., et al. (2017). Knockdown of the schizophrenia susceptibility gene TCF4alters gene expression and proliferation of progenitor cells from the developinghuman neocortex. J. Psychiatry Neurosci. 42, 181–188.
Hudry, E., and Vandenberghe, L. H. (2019). Therapeutic AAV gene transfer to thenervous system: a clinical reality. Neuron 102:263. doi: 10.1016/j.neuron.2019.03.020
Jacobs, E. C., Campagnoni, C., Kampf, K., Reyes, S. D., Kalra, V., Handley, V.,et al. (2007). Visualization of corticofugal projections during early corticaldevelopment in a tau-GFP-transgenic mouse. Eur. J. Neurosci. 25, 17–30. doi:10.1111/j.1460-9568.2006.05258.x
Jung, M., Haberle, B. M., Tschaikowsky, T., Wittmann, M. T., Balta, E. A., Stadler,V. C., et al. (2018). Analysis of the expression pattern of the schizophrenia-riskand intellectual disability gene TCF4 in the developing and adult brain suggestsa role in development and plasticity of cortical and hippocampal neurons. Mol.Autism 9:20. doi: 10.1186/s13229-018-0200-1
Kamentsky, L., Jones, T. R., Fraser, A., Bray, M. A., Logan, D. J., Madden, K. L.,et al. (2011). Improved structure, function and compatibility for CellProfiler:modular high-throughput image analysis software. Bioinformatics 27, 1179–1180. doi: 10.1093/bioinformatics/btr095
Katz, L. C., and Shatz, C. J. (1996). Synaptic activity and the construction of corticalcircuits. Science 274, 1133–1138. doi: 10.1126/science.274.5290.1133
Kennedy, A. J., Rahn, E. J., Paulukaitis, B. S., Savell, K. E., Kordasiewicz, H. B.,Wang, J., et al. (2016). Tcf4 regulates synaptic plasticity, DNA methylation, andmemory function. Cell Rep. 16, 2666–2685. doi: 10.1016/j.celrep.2016.08.004
Kharbanda, M., Kannike, K., Lampe, A., Berg, J., Timmusk, T., and Sepp, M.(2016). Partial deletion of TCF4 in three generation family with non-syndromicintellectual disability, without features of Pitt-Hopkins syndrome. Eur. J. Med.Genet. 59, 310–314. doi: 10.1016/j.ejmg.2016.04.003
Koos, T., and Tepper, J. M. (1999). Inhibitory control of neostriatal projectionneurons by GABAergic interneurons. Nat. Neurosci. 2, 467–472. doi: 10.1038/8138
Kreitzer, A. C., and Malenka, R. C. (2008). Striatal plasticity and basal gangliacircuit function. Neuron 60, 543–554. doi: 10.1016/j.neuron.2008.11.005
Frontiers in Neuroanatomy | www.frontiersin.org 17 July 2020 | Volume 14 | Article 42

fnana-14-00042 June 28, 2020 Time: 19:30 # 18
1939
1940
1941
1942
1943
1944
1945
1946
1947
1948
1949
1950
1951
1952
1953
1954
1955
1956
1957
1958
1959
1960
1961
1962
1963
1964
1965
1966
1967
1968
1969
1970
1971
1972
1973
1974
1975
1976
1977
1978
1979
1980
1981
1982
1983
1984
1985
1986
1987
1988
1989
1990
1991
1992
1993
1994
1995
1996
1997
1998
1999
2000
2001
2002
2003
2004
2005
2006
2007
2008
2009
2010
2011
2012
2013
2014
2015
2016
2017
2018
2019
2020
2021
2022
2023
2024
2025
2026
2027
2028
2029
2030
2031
2032
2033
2034
2035
2036
2037
2038
2039
2040
2041
2042
2043
2044
2045
2046
2047
2048
2049
2050
2051
2052
Kim et al. TCF4 Distribution
Lee, S., Hjerling-Leffler, J., Zagha, E., Fishell, G., and Rudy, B. (2010). The largestgroup of superficial neocortical GABAergic interneurons expresses ionotropicserotonin receptors. J. Neurosci. 30, 16796–16808. doi: 10.1523/JNEUROSCI.1869-10.2010
Li, H., Zhu, Y., Morozov, Y. M., Chen, X., Page, S. C., Rannals, M. D., et al.(2019). Disruption of TCF4 regulatory networks leads to abnormal corticaldevelopment and mental disabilities. Mol. Psychiatry 24, 1235–1246. doi: 10.1038/s41380-019-0353-0
Ma, C., Gu, C., Huo, Y., Li, X., and Luo, X. J. (2018). The integrated landscapeof causal genes and pathways in schizophrenia. Transl. Psychiatry 8:67. doi:10.1038/s41398-018-0114-x
Maduro, V., Pusey, B. N., Cherukuri, P. F., Atkins, P., du Souich, C., Rupps, R., et al.(2016). Complex translocation disrupting TCF4 and altering TCF4 isoformexpression segregates as mild autosomal dominant intellectual disability.Orphanet. J. Rare Dis. 11:62. doi: 10.1186/s13023-016-0439-6
Maia, T. V., and Frank, M. J. (2011). From reinforcement learning models topsychiatric and neurological disorders.Nat. Neurosci. 14, 154–162. doi: 10.1038/nn.2723
Markram, H., Toledo-Rodriguez, M., Wang, Y., Gupta, A., Silberberg, G., and Wu,C. (2004). Interneurons of the neocortical inhibitory system. Nat. Rev. Neurosci.5, 793–807. doi: 10.1038/nrn1519
Mary, L., Piton, A., Schaefer, E., Mattioli, F., Nourisson, E., Feger, C., et al. (2018).Disease-causing variants in TCF4 are a frequent cause of intellectual disability:lessons from large-scale sequencing approaches in diagnosis. Eur. J. Hum.Genet. 26, 996–1006. doi: 10.1038/s41431-018-0096-4
Massari, M. E., and Murre, C. (2000). Helix-loop-helix proteins: regulators oftranscription in eucaryotic organisms. Mol. Cell. Biol. 20, 429–440. doi: 10.1128/mcb.20.2.429-440.2000
Matsuda, T., and Cepko, C. L. (2007). Controlled expression of transgenesintroduced by in vivo electroporation. Proc. Natl. Acad. Sci. U.S.A. 104, 1027–1032. doi: 10.1073/pnas.0610155104
Miller, E. K. (2000). The prefrontal cortex and cognitive control. Nat. Rev. Neurosci.1, 59–65. doi: 10.1038/35036228
Mortazavi, A., Williams, B. A., McCue, K., Schaeffer, L., and Wold, B. (2008).Mapping and quantifying mammalian transcriptomes by RNA-Seq. Nat.Methods 5, 621–628. doi: 10.1038/nmeth.1226
Munoz-Manchado, A. B., Bengtsson Gonzales, C., Zeisel, A., Munguba, H.,Bekkouche, B., Skene, N. G., et al. (2018). Diversity of interneurons in the dorsalstriatum revealed by single-cell RNA Sequencing and PatchSeq. Cell Rep. 24,2179–2190.e7. doi: 10.1016/j.celrep.2018.07.053
Murre, C., Bain, G., van Dijk, M. A., Engel, I., Furnari, B. A., Massari, M. E., et al.(1994). Structure and function of helix-loop-helix proteins. Biochim. Biophys.Acta 1218, 129–135. doi: 10.1016/0167-4781(94)90001-9
Peippo, M. M., Simola, K. O., Valanne, L. K., Larsen, A. T., Kahkonen, M.,Auranen, M. P., et al. (2006). Pitt-Hopkins syndrome in two patients andfurther definition of the phenotype. Clin. Dysmorphol. 15, 47–54. doi: 10.1097/01.mcd.0000184973.14775.32
Pelkey, K. A., Chittajallu, R., Craig, M. T., Tricoire, L., Wester, J. C., and McBain,C. J. (2017). Hippocampal GABAergic Inhibitory Interneurons. Physiol. Rev. 97,1619–1747. doi: 10.1152/physrev.00007.2017
Phan, B. N., Bohlen, J. F., Davis, B. A., Ye, Z., Chen, H. Y., Mayfield, B., et al. (2020).A myelin-related transcriptomic profile is shared by Pitt-Hopkins syndromemodels and human autism spectrum disorder. Nat. Neurosci. 23, 375–385.doi: 10.1038/s41593-019-0578-x
Pickard, B. S., Malloy, M. P., Clark, L., Lehellard, S., Ewald, H. L., Mors, O.,et al. (2005). Candidate psychiatric illness genes identified in patients withpericentric inversions of chromosome 18. Psychiatr. Genet. 15, 37–44. doi:10.1097/00041444-200503000-00007
Rakic, P. (1972). Mode of cell migration to the superficial layers of fetal monkeyneocortex. J. Comp. Neurol. 145, 61–83. doi: 10.1002/cne.901450105
Rakic, P., Ayoub, A. E., Breunig, J. J., and Dominguez, M. H. (2009). Decision bydivision: making cortical maps. Trends Neurosci. 32, 291–301. doi: 10.1016/j.tins.2009.01.007
Rannals, M. D., Hamersky, G. R., Page, S. C., Campbell, M. N., Briley, A., Gallo,R. A., et al. (2016). Psychiatric risk gene transcription factor 4 regulates intrinsicexcitability of prefrontal neurons via repression of SCN10a and KCNQ1.Neuron 90, 43–55. doi: 10.1016/j.neuron.2016.02.021
Rapanelli, M., Frick, L. R., and Pittenger, C. (2017). The role of interneurons inautism and Tourette syndrome. Trends Neurosci. 40, 397–407. doi: 10.1016/j.tins.2017.05.004
Rogers, T. D., McKimm, E., Dickson, P. E., Goldowitz, D., Blaha, C. D., andMittleman, G. (2013). Is autism a disease of the cerebellum? An integration ofclinical and pre-clinical research. Front. Syst. Neurosci. 7:15. doi: 10.3389/fnsys.2013.00015
Rubin, R. D., Watson, P. D., Duff, M. C., and Cohen, N. J. (2014). The role of thehippocampus in flexible cognition and social behavior. Front. Hum. Neurosci.8:742. doi: 10.3389/fnhum.2014.00742
Rudy, B., Fishell, G., Lee, S., and Hjerling-Leffler, J. (2011). Three groups ofinterneurons account for nearly 100% of neocortical GABAergic neurons. Dev.Neurobiol. 71, 45–61. doi: 10.1002/dneu.20853
Schmahmann, J. D., and Caplan, D. (2006). Cognition, emotion and thecerebellum. Brain 129(Pt 2), 290–292. doi: 10.1093/brain/awh729
Sepp, M., Kannike, K., Eesmaa, A., Urb, M., and Timmusk, T. (2011). Functionaldiversity of human basic helix-loop-helix transcription factor TCF4 isoformsgenerated by alternative 5′ exon usage and splicing. PLoS One 6:e22138. doi:10.1371/journal.pone.0022138
Sepp, M., Pruunsild, P., and Timmusk, T. (2012). Pitt-Hopkins syndrome-associated mutations in TCF4 lead to variable impairment of the transcriptionfactor function ranging from hypomorphic to dominant-negative effects. Hum.Mol. Genet. 21, 2873–2888. doi: 10.1093/hmg/dds112
Silva-Santos, S., van Woerden, G. M., Bruinsma, C. F., Mientjes, E., Jolfaei, M. A.,Distel, B., et al. (2015). Ube3a reinstatement identifies distinct developmentalwindows in a murine Angelman syndrome model. J. Clin. Invest. 125, 2069–2076. doi: 10.1172/JCI80554
Sinnett, S. E., Hector, R. D., Gadalla, K. K. E., Heindel, C., Chen, D., Zaric, V., et al.(2017). Improved MECP2 gene therapy extends the survival of MeCP2-nullmice without apparent toxicity after intracisternal delivery. Mol. Ther. MethodsClin. Dev. 5, 106–115. doi: 10.1016/j.omtm.2017.04.006
Skene, N. G., Bryois, J., Bakken, T. E., Breen, G., Crowley, J. J., Gaspar, H. A., et al.(2018). Genetic identification of brain cell types underlying schizophrenia. Nat.Genet. 50, 825–833. doi: 10.1038/s41588-018-0129-5
Steinlin, M. (2008). Cerebellar disorders in childhood: cognitive problems.Cerebellum 7, 607–610. doi: 10.1007/s12311-008-0083-3
Stoner, R., Chow, M. L., Boyle, M. P., Sunkin, S. M., Mouton, P. R., Roy, S., et al.(2014). Patches of disorganization in the neocortex of children with autism.N. Engl. J. Med. 370, 1209–1219. doi: 10.1056/NEJMoa1307491
Straub, C., Saulnier, J. L., Begue, A., Feng, D. D., Huang, K. W., and Sabatini, B. L.(2016). Principles of synaptic organization of GABAergic interneurons in thestriatum. Neuron 92, 84–92. doi: 10.1016/j.neuron.2016.09.007
Taniguchi, H., He, M., Wu, P., Kim, S., Paik, R., Sugino, K., et al. (2011). A resourceof Cre driver lines for genetic targeting of GABAergic neurons in cerebralcortex. Neuron 71, 995–1013. doi: 10.1016/j.neuron.2011.07.026
Thaxton, C., Kloth, A. D., Clark, E. P., Moy, S. S., Chitwood, R. A., and Philpot,B. D. (2018). Common pathophysiology in multiple mouse models of pitt-hopkins syndrome. J. Neurosci. 38, 918–936. doi: 10.1523/JNEUROSCI.1305-17.2017
Wang, F., Flanagan, J., Su, N., Wang, L. C., Bui, S., Nielson, A., et al. (2012).RNAscope: a novel in situ RNA analysis platform for formalin-fixed, paraffin-embedded tissues. J. Mol. Diagn. 14, 22–29. doi: 10.1016/j.jmoldx.2011.08.002
Wang, Q13Y., Lu, Z., Zhang, Y., Cai, Y., Yun, D., Tang, T., et al. (2020). TranscriptionFactor 4 safeguards hippocampal dentate gyrus development by regulatingneural progenitor migration. Cereb. Cortex 30, 3102–3115. doi: 10.1093/cercor/bhz297
Whalen, S., Heron, D., Gaillon, T., Moldovan, O., Rossi, M., Devillard, F., et al.(2012). Novel comprehensive diagnostic strategy in Pitt-Hopkins syndrome:clinical score and further delineation of the TCF4 mutational spectrum. Hum.Mutat. 33, 64–72. doi: 10.1002/humu.21639
Xia, H., Jahr, F. M., Kim, N. K., Xie, L., Shabalin, A. A., Bryois, J., et al. (2018).Building a schizophrenia genetic network: transcription factor 4 regulates genesinvolved in neuronal development and schizophrenia risk.Hum.Mol. Genet. 27,3246–3256. doi: 10.1093/hmg/ddy222
Zollino, M., Zweier, C., Van Balkom, I. D., Sweetser, D. A., Alaimo, J., Bijlsma,E. K., et al. (2019). Diagnosis and management in Pitt-Hopkins syndrome: first
Frontiers in Neuroanatomy | www.frontiersin.org 18 July 2020 | Volume 14 | Article 42

fnana-14-00042 June 28, 2020 Time: 19:30 # 19
2053
2054
2055
2056
2057
2058
2059
2060
2061
2062
2063
2064
2065
2066
2067
2068
2069
2070
2071
2072
2073
2074
2075
2076
2077
2078
2079
2080
2081
2082
2083
2084
2085
2086
2087
2088
2089
2090
2091
2092
2093
2094
2095
2096
2097
2098
2099
2100
2101
2102
2103
2104
2105
2106
2107
2108
2109
2110
2111
2112
2113
2114
2115
2116
2117
2118
2119
2120
2121
2122
2123
2124
2125
2126
2127
2128
2129
2130
2131
2132
2133
2134
2135
2136
2137
2138
2139
2140
2141
2142
2143
2144
2145
2146
2147
2148
2149
2150
2151
2152
2153
2154
2155
2156
2157
2158
2159
2160
2161
2162
2163
2164
2165
2166
Kim et al. TCF4 Distribution
international consensus statement. Clin. Genet. 95, 462–478. doi: 10.1111/cge.13506
Zweier, C., Peippo, M. M., Hoyer, J., Sousa, S., Bottani, A., Clayton-Smith, J., et al.(2007). Haploinsufficiency of TCF4 causes syndromal mental retardation withintermittent hyperventilation (Pitt-Hopkins syndrome). Am. J. Hum. Genet. 80,994–1001. doi: 10.1086/515583
Zweier, C., Sticht, H., Bijlsma, E. K., Clayton-Smith, J., Boonen, S. E., Fryer, A.,et al. (2008). Further delineation of Pitt-Hopkins syndrome: phenotypic andgenotypic description of 16 novel patients. J. Med. Genet. 45, 738–744. doi:10.1136/jmg.2008.060129
Conflict of Interest: The authors declare that the research was conducted in theabsence of any commercial or financial relationships that could be construed as apotential conflict of interest.
Copyright © 2020 Kim, Berens, Ochandarena and Philpot. This is an open-accessarticle distributed under the terms of the Creative Commons Attribution License(CC BY). The use, distribution or reproduction in other forums is permitted, providedthe original author(s) and the copyright owner(s) are credited and that the originalpublication in this journal is cited, in accordance with accepted academic practice. Nouse, distribution or reproduction is permitted which does not comply with these terms.
Frontiers in Neuroanatomy | www.frontiersin.org 19 July 2020 | Volume 14 | Article 42