Region 2 UNIVERSITY TRANSPORTATION RESEARCH · PDF file · 2012-12-17This research...
59
Region 2 UNIVERSITY TRANSPORTATION RESEARCH CENTER Final Report Controlled Composite Action (C2A) to Eliminate Transverse Cracking in Concrete Bridge Decks Prepared by Amin Jamali Research Assistant Department of Civil and Environmental Engineering New Jersey Institute of Technology Newark, NJ M. Ala Saadeghvaziri Professor Department of Civil and Environmental Engineering New Jersey Institute of Technology Newark, NJ July 2010
Transcript of Region 2 UNIVERSITY TRANSPORTATION RESEARCH · PDF file · 2012-12-17This research...

Region 2
UNIVERSITY TRANSPORTATION RESEARCH CENTER
Final Report
Controlled Composite Action (C2A) to Eliminate Transverse Cracking in Concrete Bridge Decks
Prepared by
Amin Jamali Research Assistant
Department of Civil and Environmental Engineering New Jersey Institute of Technology
Newark, NJ
M. Ala Saadeghvaziri Professor
Department of Civil and Environmental Engineering New Jersey Institute of Technology
Newark, NJ
July 2010

Disclaimer The contents of this report reflect the views of the authors, who are responsible for the facts and the accuracy of the information presented herein. The contents do not necessarily reflect the official views or policies of the UTRC or the Federal Highway Administration. This report does not constitute a standard, specification or regulation. This document is disseminated under the sponsorship of the Department of Transportation, University Transportation Centers Program, in the interest of information exchange. The U.S. Government assumes no liability for the contents or use thereof.
1 . Re po r t No . 2. Government Accession No.
TECHNICAL REPORT STANDARD TITLE PAGE
3. Rec ip ient ’s Cata log No.
5 . Repor t Date
8. Performing Organization Report No.
6 . Performing Organizat ion Code
4. Ti t le and Subt i t le
7. Author(s)
9. Performing Organization Name and Address 10. Work Unit No.
11. Contract or Grant No.
13. Type of Report and Period Covered
14. Sponsoring Agency Code
12. Sponsoring Agency Name and Address
15. Supplementary Notes
1 6 . Abstract
1 7 . Key Words
1 9 . Security Classif (of this report)
F o r m D O T F 17 0 0 . 7 ( 8 - 6 9 )
2 0 . Security Classif. (of this page)
1 8 . Distribution Statement
21. No of Pages 2 2 . Price
Ju ly 2010
49777-21-19
F inal Repor t 12/31/07 – 12/31/09
New Jersey Inst i tu te of Technology Depar tment of Civi l and Environmental Engineer ing Universi ty Heights , Colton Hall , Sui te 200 Newark, NJ 07102-1982
Univers i ty Transpor ta t ion Research Center The City College of New York New York, NY 10031
Tens of thousands of b r idges in the US deve lop t r ansve r se deck c rack ing due to concre te sh r inkage . T ransve r se c racks a re obse rved on var ious types o f supe r s t ruc tu res and in mos t geograph ica l l oca t ions . They inc rease the ma in tenance cos t , reduce b r idge l i fe th rough acce le ra t ed co r ros ion , cause wa te r l eakage , and impac t aes the t i cs . Mos t r e sea rche r s have t r ied to tack le th i s p rob lem to da te by focus ing on changes in des ign and cons t ruc t ion t echn iques , many o f wh ich have been implemented , bu t the p rob lem s t i l l remains . Th i s s tudy focused ins tead on the poss ib i l i ty o f con t ro l l ing the compos i t e ac t ion th rough the deve lopment o f a mechan i sm to p reven t the ac t ion ( re s t r a in t ) du r ing ea r ly s t ages ( i . e . a s concre te sh r inks ) , wh i l e ac t iva t in g necessa ry ac t ion l a t e r on when se rv ice load was g rea te r . To ach ieve th i s ob jec t ive , t he connec to r s were wrapped in a ca re fu l ly se lec ted hype re la s t i c ma te r ia l , wh ich , unde r low leve l o f s t re s ses , wou ld no t p rov ide any re s i s tance . The re sea rch u t i l i zed f in i t e e l ement methods and exper imen t s , bu t the r e su l t s showed tha t the C2A idea in i t s p re l iminary fo rm may no t gua ran tee e l imina t ion o f t ransver se deck c rack ing i f s ign i f ican t sh r inkage happens in the concre te . Th is i s because when the hypere la s t i c l aye r pe rmi t s a f ree deck sh r inkage (which i s usua l ly s ign i f i can t ) , a gap deve lops be tween the shea r connec to r and the deck . Th i s was an t i c ipa ted du r ing o r ig ina l deve lopment o f the concep t , bu t i t was e s t ima ted tha t s e rv ice load s t ra in ing w i l l c lose th i s gap , wh ich d id no t ac tua l ly occur . The r e sea rche r s p ropose ano ther look by r e ly ing on a rev i sed approach which p roposes to use a de lay ing mechan i sm tha t w i l l pos tpone the compos i t e ac t ion to a t ime a f t e r the ma jo r por t ion o f the f r ee sh r inkage has happened . To accompl i sh th i s , i t i s p roposed tha t th readed bo l t s in s t ead o f we lded s tuds be ins ta l l ed on the top f l ange o f the g i rde r and remain loose ly f a s tened un t i l a s ign i f i can t pa r t o f the conc re te shr inkage t akes p lace . P re l imina ry re su l t s ind ica te tha t number o f shea r s tuds can be s ign i f i can t ly reduced to f ac i l i t a t e adop t ion o f th i s modi f ica t ion . However , a fu r the r feas ib i l i ty s tudy to inves t iga te the p rac t i ca l and economica l a spec t s o f such a r emedy i s r ecommended .
Cracking , Concre te , Transverse , Cont ro l l ed Composi te Ac t ion , Br idge Cons t ruc t ion .
Unclass if ied Unclass if ied
55
Amin Jamali , M. Ala Saadeghvazir i , New Jersey Inst i tu te of Technology
Control led Composi te Act ion (C2A) to El iminate Transverse Cracking in Concrete Br idge Decks
Controlled Composite Action (C2A) to Eliminate Transverse Cracking in Concrete Bridge Decks
Final Report July 2010
Submitted by
Amin Jamali M. Ala Saadeghvaziri Research Assistant Professor
Department of Civil and Environmental Engineering New Jersey Institute of Technology
Newark, NJ 07102

i
DISCLAIMER STATEMENT
“The content of this report reflects the views of the authors who are responsible for the facts and accuracy of data
presented herein.“

ii
ACKNOWLEDGEMENT
This research and development study was supported by the Region 2 University Transportation Research Center (UTRC) based at The City College of NY through the UTRC's Research Initiative program. The results and conclusions are those of the authors and do not necessarily reflect the views of the sponsors.

iii
TABLE OF CONTENTS
DISCLIAMER STATEMENT ............................................................................ i
ACKNOWLEDGEMENT ..................................................................................ii
TABLE OF CONTENTS .................................................................................. iii
LIST OF FIGURES ..........................................................................................iv
LIST OF TABLES ............................................................................................ v
LIST OF SYMBOLS.........................................................................................vi
SUMMARY....................................................................................................... 1
INTRODUCTION.............................................................................................. 3
LITERATURE REVIEW ................................................................................... 6
FINITE ELEMENT ANALYSES ..................................................................... 13
EXPERIMENTAL WORK ............................................................................... 19
CONCLUSION AND RECOMMENDATION .................................................. 30
REFERENCES............................................................................................... 31
APPENDIX .................................................................................................... 32

iv
LIST OF FIGURES
Figure 1. Corrosion due to transverse deck cracks in a bridge in New Jersey 4
Figure 2. Transverse deck cracks on a bridge deck in New Jersey 4
Figure 3. Mechanism of transverse shrinkage cracking, (a) after setting concrete starts shrinking, (b) deck tensile stresses are developed, causing transverse cracks
5
Figure 4. Use of portable semi-automatic welding machines to install headed shear connectors on girder flange
10
Figure 5. Typical cross-sections of Slab-on-Girder bridges, (a) T beam, (b) Haunched slab, (c) Box girder, (d) Precast decks
10
Figure 6. Slip and axial strain in composite sections 11
Figure 7. Typical shear-deformation behavior of headed stud connectors 11
Figure 8. (a) Controlled composite action through densification , (b) stress-strain curve for typical hyperelastic materials stress
12
Figure 9. Cross-section of the simply supported Slab-on-Girder bridge 15
Figure 10. (a) Finite element meshing of shear connectors embedded in concrete, (b) contact surfaces
15
Figure 11. Finite element modeling of Slab-on-Girder with no composite action (continuous contact layer is considered at the steel-concrete interface)
16
Figure 12. Finite element modeling of Slab-on-Girder with hyperelastic layers 16
Figure 13. Stress-strain behavior of the hyperelastic material 17
Figure 14. Stress-strain behavior of hyperelastic layer 17
Figure 15. (a) Deformation and stress longitudinal distribution in the Slab-on-Girder with no composite action, (b) closer view of stress in deck
18
Figure 16. Shear force transferred through the shear connectors 18
Figure 17. Sieve analysis of the fine aggregate used in concrete mixes 20
Figure 18. Set-up for restraint shrinkage test 21

v
Figure 19. (a) Restrained-shrinkage test moulds, (b) concrete strain gauge, (c) restrained-shrinkage specimen
22
Figure 20. Free shrinkage of the Normal-Strength concrete used in restrained-shrinkage test
22
Figure 21. Free shrinkage of the High-Strength concrete 24
Figure 22. History of tensile strains in the restrained-shrinkage experiment 25
Figure 23. Schematic of the first set of Slab-on-Girder shrinkage tests 25
Figure 24. Installation of shear connectors and strain gauge instrumentation 26
Figure 25. Slab-on-Girder with different stud configurations 26
Figure 26. Shrinkage cracking in Beam #1 26
Figure. 27. History of axial strain developed in the first set of Slab-on-Girder tests
27
Figure 28. Schematic of the second set of Slab-on Girder shrinkage tests 28
Figure 29. Transverse cracks in Beam #2 through #4 28
Figure 30.Shear transferred through the shear connectors 29
Figure 31. Stud connector locations (not to scale) 29
Figure 32. (a) A strip of the bridge under concentrated gravity load at mid-span, (b) stresses developed in the deck with no composite action 30
Figure 33. Deformed shape under the gravity load 31
Figure 34. Relative slip at deck-girder interface 32
Figure 35. Distribution of shear force at deck-girder interface 33
Figure 36. Bearing stresses on studs (psi) 34
Figure A1. Measuring change in the length of a concrete shrinkage bar 36
Figure A2. Electrical strain gauge installed on the girder flange 36
Figure A3. First set of Slab-on-Girder shrinkage tests 36
Figure A4. Second set of Slab-on-Girder shrinkage tests 37
vi
Figure A5. Companion steel plate to measure thermal strain 37
Figure A6. Strain history in second set of Slab-on-Girder tests 38

ii
LIST OF TABLES
Table 1. Geometric and design information for the Slab-on Girder bridge 14
Table 2. Contact element properties 16
Table 3. Results of FE modeling versus theoretical values 16
Table 4. Concrete mix design parameters 20
Table 5. Normal-Strength concrete mix design used in the restrained-shrinkage test
21
Table 6. High-Strength concrete mix design used in the Slab-on-Girder tests 24
Table 7. Shear Transfer (kips) and maximum deflection (in) 32
Table 8. Maximum Stresses in the girder (psi) 32
Table 1A. Sieve analysis data 43
Table 2A. Shear force (in kips) transferred through shear studs in the finite element analysis of SOG bridge under gravity load
44
Table 3A. Shear force (in kips) transferred through shear studs in the finite element analysis of SOG bridge under 550 microstrain shrinkage
45
Table 4A. Shrinkage readings for the normal-strength concrete 46
Table 5A. Shrinkage readings for the high-strength concrete 46
iii
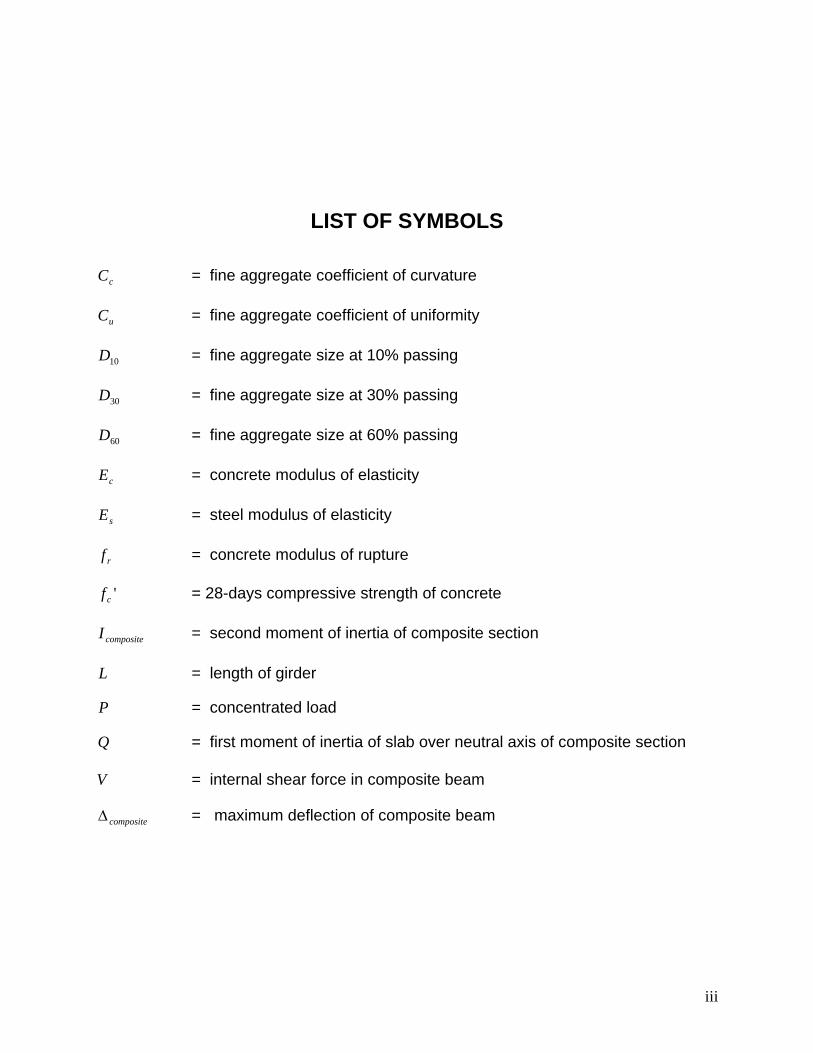
LIST OF SYMBOLS
cC = fine aggregate coefficient of curvature
uC = fine aggregate coefficient of uniformity
10D = fine aggregate size at 10% passing
30D = fine aggregate size at 30% passing
60D = fine aggregate size at 60% passing
cE = concrete modulus of elasticity
sE = steel modulus of elasticity
rf = concrete modulus of rupture
'cf = 28-days compressive strength of concrete
compositeI = second moment of inertia of composite section
L = length of girder
P = concentrated load
Q = first moment of inertia of slab over neutral axis of composite section
V = internal shear force in composite beam
composite = maximum deflection of composite beam

1
SUMMARY
A significant number of concrete bridge decks develop transverse cracking which can accelerate corrosion of reinforcing steel, deteriorate deck concrete and possibly cause damage to underneath components of the bridge and its esthetic. Shrinkage and thermal contraction of restraint concrete are main causes of such cracking which mostly develop at early ages.
There have been many studies on the cause of transverse deck cracking which mostly were focused on concrete mix design, construction practices and some on structural design factors to alleviate shrinkage problem and based on the results of these studies many recommendations have been made. The main recommendations made include:
Minimize the ratio of girder to deck stiffness, Use uniform reinforcement meshes, Reduce cement content, Limit water cement (w/c) ratio to 0.4-0.45, Consider using shrinkage compensating concrete when available, Reduce the cement paste, Start curing immediately after finishing.
Despite practicing these recommendations in design and construction of bridges, the problem still exists.
The restraining effect is basically due to the composite design of superstructure. Thus, the idea of this research work was that shrinkage cracking may be prevented if a mechanism can be developed to prevent the composite action during early ages (i.e. as concrete shrinks), while it is activated for higher service load and under ultimate loading condition. To achieve this objective, it was primarily suggested that the shear connectors could be wrapped in a carefully selected hyperelastic material. Under low level of stresses the material does not provide any resistance and it deforms easily with the concrete which is shrinking without any restraint. Upon development of shrinkage strains, the hyperelastic material will start to develop a higher level of resistance and will ultimately permit full engagement of concrete and shear connectors.
The research utilized finite element methods along with experiments to examine the idea of Controlled Composite Action (C2A). The results showed that the C2A idea in its preliminary form may not guarantee elimination of transverse deck cracking if significant shrinkage happens in the concrete. The reason for such a performance is the lack of stud-concrete engagement in the opposite direction of the shrinkage. In other words, since the hyperelastic layer permits a free deck shrinkage (which is usually significant) a gap develops between the shear connector and the deck. This was anticipated during original development of the concept but it was estimated that service load straining will close this gap. This was not; however, the case as before closer of the gap concrete deck may crack.
2
As a result of this initial investigation, an improvement to the C2A concept is proposed that can potentially remedy the gap issue and ensure composite action while shrinkage cracking is minimized or eliminated. In the modified idea a delaying mechanism is developed such that it postpones the composite action to the time which the major portion of the free shrinkage has happened. In this idea, instead of welded studs, threaded bolts are installed on the top flange of the girder. These bolts are not tightly fastened until a significant part of the concrete shrinkage takes place. This period may be limited to the time that the bridge is still not open to traffic. During this period, the studs are free to slide through the provided sluts and no tensile stresses are developed in the concrete deck. Upon completing the bridge construction, all the studs are tightened and full composite action is ensured.
Future Research Needs
The enhanced C2A concept has a high potential to eliminate, as opposed to minimizing, the problem of deck cracking. The proposed connector mechanism may have the potential to eliminate shrinkage deck cracking without jeopardizing the deck-girder composite action. A feasibility study investigating practical and economical aspects of such a remedy is recommended.
3
INTRODUCTION
This chapter very briefly introduces and explains transverse deck cracking in concrete bridge decks and its effects on the bridge performance. The reader is encouraged to refer to a very detailed study on the causes of transverse deck cracking by Saadeghvaziri and Hadidi (2002). The objectives and plan for this research study are also discussed in some detail. Finally, the report organization is presented. Problem Statement
A significant number of concrete bridge decks develop transverse cracking which can accelerate corrosion of reinforcing steel, deteriorate deck concrete and possibly cause damage to underneath components of the bridge and bridge esthetic and imposes high maintenance expenses on . Shrinkage and thermal contraction of restraint concrete are main causes of such cracking which mostly develop at early ages.
There have been many studies on the cause of transverse deck cracking which mostly were focused on concrete mix design, construction practices and structural design factors to alleviate shrinkage problem. However, the causes are not yet fully understood and the problem still exists and any practical solution to eliminate or reduce deck cracking is of great importance.
Literature indicates that a significant number of concrete bridge decks develop transverse cracking and most of these cracks develop at early ages; many, right after construction. These cracks are typically full-depth and spaced 3 to 10 feet apart along the length of the bridge and can accelerate corrosion of reinforcing steel, deteriorate deck concrete and possibly cause damage to underneath components of the bridge and bridge esthetic imposing high maintenance expenses and ultimately the service life of the bridge system will be considerably shortened.
A picture of a full width transverse crack in a bridge deck is shown in Figure 1. The crack has propagated all the way into the monolithic parapet. The arrow shows the location of the crack. As indicated by the dark water trace on the underneath girder the reinforcements are also corroded. Maintenance and repair costs associated with damage like this to our infrastructure put a significant burden on highway agencies’ resources. Figure 2 shows picture of another bridge deck crack that is quite wide and extends the full width of the deck.
Despite the large number of studies on concrete deck cracking, it is still a problem faced by many transportation agencies worldwide. Previous studies were mostly focused on (1) concrete mix design, (2) improvement through changes to construction practices and (3) structural design factors to alleviate shrinkage problem. A comprehensive review of these studies is performed by Saadeghvaziri and Hadidi (2002). Many recommendations have been made based on the results of these studies some of which were even controversial. For examples, Dakhil et al. (1975) report a direct relationship

4
between an increase in cracking and an increase in concrete slump while Cheng and Johnston (1985) have observed a decrease in transverse cracking in concrete bridge decks with increasing slump. Contradiction on the effect of girder type is another important example on the lack of full understanding of the causes of this phenomenon. Meyers (1982) indicates that structures supported on wide flange and composite steel-plate girders exhibited much more cracking than those constructed on other systems. However, in a survey done by Saadeghvaziri and Hadidi (2002) it is observed that the percentage of the cracked decks supported on prestressed concrete girders are higher. Apparently, in many instances there are major disagreements on the factors affecting transverse cracking indicating the need for further research.
Figure 1. Corrosion due to transverse deck cracks in a bridge in New Jersey. (Saadeghvaziri and Hadidi, 2002)
Figure 2. Transverse deck cracks on a bridge deck in New Jersey. (Saadeghvaziri and Hadidi, 2002)

5
Research Objectives
The overall objective of this research is to examine the idea of Controlled Composite Action (C2A) for possible implementation in design and construction of Slab-on-Girder (SOG) bridges in order to eliminate or alleviate transverse deck cracking. Thus, the tasks to achieve these objectives are as follows:
Literature review and evaluation of previous research recommendations for reducing transverse bridge deck cracking,
Development of finite element models and parametric study,
Conduct experiments to examine the C2A for design purposes,
Evaluation of the experimental results and finite element simulations for further enhancement to and implementation of the C2A concept.
This report discusses the results of the study. In the following section, the research approach for various tasks conducted under this project is briefly discussed. Research Approach
In order to study the performance of C2A concept to reduce or eliminate concrete deck cracking due to restraining effects of shear connectors, finite element simulations of Slab-on-Girder bridges were developed. The results of the finite element analyses were further examined through laboratory experiments, and necessary changes/enhancements in the current C2A idea were identified. Additional simulations were conducted to better understand the shear transfer mechanism and to provide a knowledge base for potential implementation of the proposed change to C2A concept. It should be noted that both finite element modeling and laboratory work required attention to details and were quite time consuming.
Report Organization
Results of this study are organized in four chapters and one appendix. Following this introductory chapter on the problem statement and research objective, a brief literature review is presented in Chapter Two. Chapter Three discusses the details of finite element simulations and presents the results as well. In Chapter Four, the laboratory experiments are discussed. Finally Chapter Five summarizes and discusses the results of the finite element simulations and experiments. This chapter presents the conclusions made over the entire research work and presents a recommendation to make the C2A concept work. In support of this recommendation, this chapter also includes results of detailed study on shear transfer mechanism and number of shear studs that is both important to proposed modification and also of great interest to practicing engineers in general. There is an appendix, which contains details of the simulations and experiments.
6
LITERATURE REVIEW
This chapter presents a brief review of the very comprehensive literature search performed by Saadeghvaziri and Hadidi (2002) on the cause of transverse deck cracking. In this work, causes are classified under three categories, namely: 1) material and mix design, 2) construction practice and ambient condition, 3) and 3) structural design.
Background
Many concrete bridge decks develop transverse cracking and most of these cracks develop at early ages; some right after construction, and some after the bridge has been opened to traffic for a period of time. These cracks have been observed in different geographical locations and on different superstructure. It is estimated that more than 100,000 bridges in the United States develop early transverse cracks. These cracks are typically full depth and are located 4-12 ft apart along the length of the span and are usually observed over transverse reinforcement (Krauss and Rogalla, 1996). These cracks reduce the service life of the structure and increase maintenance costs, which is of paramount importance in highway maintenance activities.
Cracks in concrete occur when a restraint mass of concrete tends to change volume. Volume change in concrete depends on the properties of its constituents and their proportions as well as environmental conditions such as ambient temperature changes and humidity. Restraint, which is basically due to composite action of deck and girder, depends on design characteristics of the bridge. Construction techniques also contribute to volume change and/or to degree of restraint of concrete mass.
Mechanism of transverse deck cracking
Mechanism of transverse cracking is shown in Figure 3. Volume change in a concrete bridge deck, as influenced by the properties of concrete, is caused by drying-shrinkage, autogenous shrinkage, plastic shrinkage, thermal shrinkage, and creep. Drying shrinkage is change in concrete volume due the change in water content during the time after exposure to atmosphere. Autogenous shrinkage is the change in concrete volume without change in its water content and usually occurs in very low w/c ratios. Plastic shrinkage is referred to shrinkage caused by excessive evaporation of surface water. Cooling of concrete after initial hydration is the cause of thermal shrinkage.

7
Figure 3. Mechanism of transverse shrinkage cracking, (a) after setting concrete starts shrinking, (b) deck tensile stresses are developed, causing transverse
cracks (Saadeghvaziri and Hadidi, 2002).
In the comprehensive literature review by Saadeghvaziri and Hadidi (2002), the state-of-the-art on the causes and control of transverse deck cracking are presented under three main categories of material and mix design, construction practice and ambient conditions, and structural design factors and recommendations are made as the followings:
Material and Mix Design Factors
Aggregate type and quantity
Type, size, volume and properties of aggregate have pronounced effects on concrete properties. In general, concrete mixes with good quality, clean, low shrinkage aggregate with high aggregate to paste ratio have been observed to perform better.
Water content and water to cement ratio
The water content should be limited. Any water in excess of the water required for cement hydration may increase the shrinkage. There are different recommendations on the amount of water content. For instance, Purvis et al (1995) recommended the maximum water content of 323 lb/yd3.
Cement type and content
It is accepted among researchers that use of type II cement reduces cracking (Krauss and Rogalla, 1996; Purvis et al, 1995). High amounts of cement content has an adverse effect on shrinkage cracking. The adverse effect of higher cement content is usually related to higher drying shrinkage, higher temperature
8
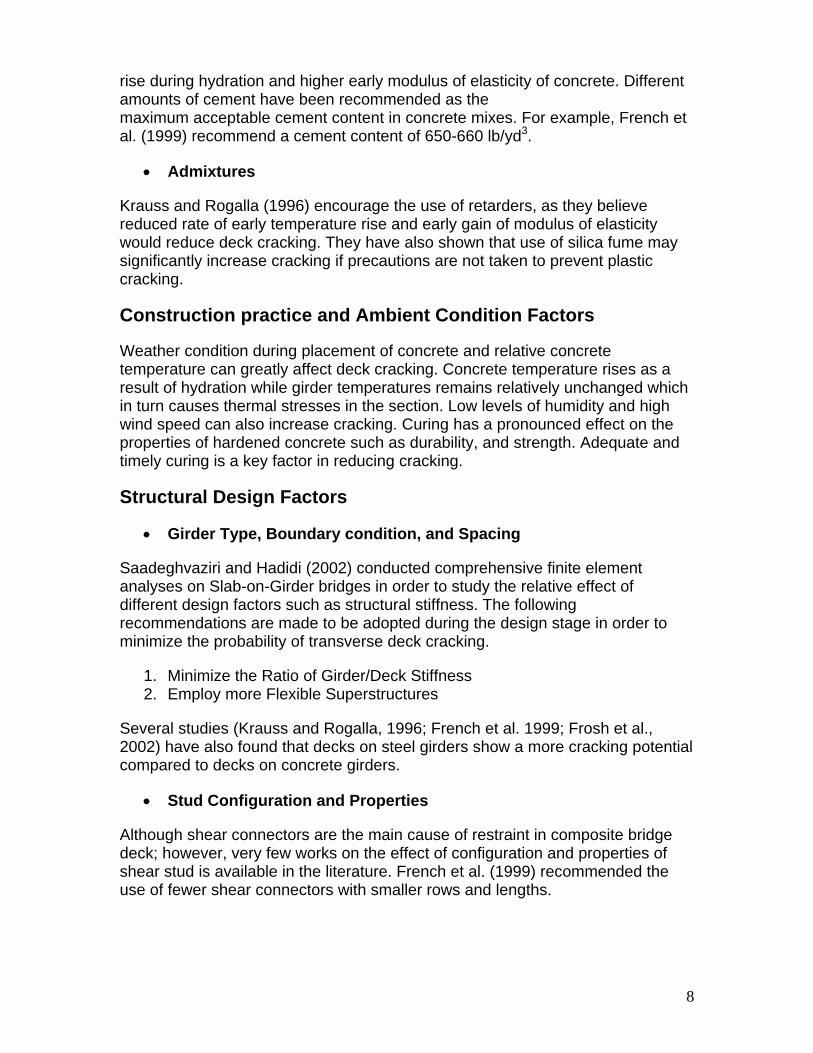
rise during hydration and higher early modulus of elasticity of concrete. Different amounts of cement have been recommended as the maximum acceptable cement content in concrete mixes. For example, French et al. (1999) recommend a cement content of 650-660 lb/yd3.
Admixtures
Krauss and Rogalla (1996) encourage the use of retarders, as they believe reduced rate of early temperature rise and early gain of modulus of elasticity would reduce deck cracking. They have also shown that use of silica fume may significantly increase cracking if precautions are not taken to prevent plastic cracking.
Construction practice and Ambient Condition Factors
Weather condition during placement of concrete and relative concrete temperature can greatly affect deck cracking. Concrete temperature rises as a result of hydration while girder temperatures remains relatively unchanged which in turn causes thermal stresses in the section. Low levels of humidity and high wind speed can also increase cracking. Curing has a pronounced effect on the properties of hardened concrete such as durability, and strength. Adequate and timely curing is a key factor in reducing cracking.
Structural Design Factors
Girder Type, Boundary condition, and Spacing
Saadeghvaziri and Hadidi (2002) conducted comprehensive finite element analyses on Slab-on-Girder bridges in order to study the relative effect of different design factors such as structural stiffness. The following recommendations are made to be adopted during the design stage in order to minimize the probability of transverse deck cracking.
1. Minimize the Ratio of Girder/Deck Stiffness 2. Employ more Flexible Superstructures
Several studies (Krauss and Rogalla, 1996; French et al. 1999; Frosh et al., 2002) have also found that decks on steel girders show a more cracking potential compared to decks on concrete girders.
Stud Configuration and Properties
Although shear connectors are the main cause of restraint in composite bridge deck; however, very few works on the effect of configuration and properties of shear stud is available in the literature. French et al. (1999) recommended the use of fewer shear connectors with smaller rows and lengths.

9
Deck Thickness
Thicker bridge decks show less cracking tendencies (French et al., 1999; Krauss and Rogalla, 1996; Saadeghvaziri and Hadidi, 2002). French et al. (1999) recommended decks with thickness greater than 16 cm (6 ¼ in.).
Reinforcement
Many researchers recommended limiting the rebar size of the deck (Krauss and Rogalla, 1996; French et al., 1999; Saadeghvaziri and Hadidi, 2002). Krauss and Rogalla (1996) recommended use of No. 4 rebars with maximum spacing of 6 inches.
Section Stiffness
It seems that increasing in the section stiffness results in more crackings (Krauss and Rogalla, 1996; French et al., 1999; Saadeghvaziri and Hadidi, 2002).
Composite Construction in Bridges
The most frequently encountered combination of construction materials is that of steel and concrete, with applications in buildings and bridges. These essentially different materials are completely compatible and complementary to each other. They have close coefficient of thermal expansion. They have an ideal combination of strengths with the concrete efficient in compression and the steel in tension. Furthermore, the concrete can protect the steel from corrosion and elevated temperatures.
Composite Slab-on-Girder (SOG) bridges, which are mainly subject to flexure, consist of steel sections (built of rolled) acting compositely with a concrete deck. The two materials are interconnected by means of mechanical devices called shear connectors. In the bridge construction industry in the US, it is current practice to achieve this connection by means of headed studs which are welded to the girder flange using semi-automatically welding machines, as shown in Figure 4. Figure 5 also shows typical cross-section of SOG bridges.
In composite design, it is intended to prevent any slip at the interface between the steel section and the concrete slab. If slip is free to occur, each component will act independently, as shown in Figure 6. If slip at the interface is eliminated, or at least reduced, the slab and the steel member will act together as a monolithic unit. The resulting increase in resistance will depend on the extent to which slip is prevented. The degree of interaction depends mainly on the degree of shear connection used.

10
Figure 4. Use of portable semi-automatic welding machines to install headed shear connectors on girder flange. (Stud Welding Product, Inc.)
Figure 5. Typical cross-sections of Slab-on-Girder bridges, (a) T beam, (b) Haunched slab, (c) Box girder, (d) Precast decks.
Mechanical connectors are used to develop the composite action between steel beams and concrete. The behavior and resistance of headed studs and other connectors are usually examined by means of "push-off" tests. For headed studs, these tests yield load-slip curves such as that shown in Figure 7. The behavior is characterized by great stiffness at low loading (under service conditions) and large deformations at high loadings up to failure. Such ductile behavior makes shear force redistribution at the steel-concrete interface possible and allows for partial shear connection. In addition, headed studs may be spaced uniformly along the beam length between critical cross-sections.

11
full compositeaction
no compositeaction
partial compositeaction
large slip small slipno slip
composite neutral axis
Figure 6. Slip and axial strain in composite sections (compare the stud
deformations).
Figure 7. Typical shear-deformation behavior of headed stud connectors.
Controlled Composite Action
Despite the large number of studies on concrete deck cracking, transverse deck cracking is still a problem faced by many transportation agencies worldwide. In this research work an innovative concept to eliminate deck cracking is introduced and will be examined in the following chapters.
While an economical design requires composite behavior under ultimate loads, under initial portion of service loads (such as dead load) the girders alone are generally capable of providing enough resistance to tolerate the entire load. Thus, shrinkage cracking can be prevented if a mechanism can be developed such that it prevents the composite action during early ages (i.e., as concrete shrinks), while it is activated for higher service load and under ultimate loading condition. To achieve this objective (i.e., no composite action initially and full composite action ultimately) it was proposed that the shear connectors be wrapped in carefully selected hyperelastic material, as shown in Figure 8(a).

12
A typical stress strain curve for hyperelastic materials is shown in Figure 8(b). Under low level of stresses the material does not provide any resistance against the applied loads and therefore it deforms easily. Thus, when the shear connectors are wrapped by such a material the concrete deck can shrink without any restraint. There might be a need for bond breaker between the deck and girder to further reduce bonding. Upon development of the shrinkage strains, the hyperelastic material provides enough room for the concrete to shrink by delaying engagement of the concrete and shear connectors. Thus, the behavior is quite similar to a free shrinkage of concrete. After a major portion of the shrinkage has occurred, the hyperelastic layer will start to develop higher level of resistance and eventually leads to a full concrete-stud engagement.
(a)
(b)
Figure 8. (a) Controlled composite action through densification , (b) stress-strain
curve for typical hyperelastic materials stress.
13
FINITE ELEMENT ANALYSIS
This chapter describes development of several finite element models to study C2A. Objectives and details of implementation for each model are presented. The performance of the C2A idea is examined through two-dimensional (2D) simulations.
Two-Dimensional Simulations
Geometric and design information (Table 1) used in development of the finite element model of the Slab-on-Girder corresponds to a bridge in Bergen County, New Jersey, which was built in 1998 and was surveyed by Saadeghvaziri and Hadidi (2002). It is a two-span simply supported bridge on steel girders. In this study, only a single girder and the corresponding portion of the deck are modeled and analyzed. The single girder and its tributary deck are considered separate from the rest of the structure.
The choice of two-dimensional (2D) plane-stress model is made because a detailed three-dimensional (3D) finite element analysis is computationally expensive and a two-dimensional simulation can sufficiently verify if the idea of C2A is efficient. Using ANSYS finite element code, the behavior of the Slab-on-Girder Bridge with C2A is studied. No attempt was made to simulated deck reinforcements as the concept of Controlled Composite Action (C2A) is independent of the amount of deck reinforcement. In creating the finite element model the shear connector pitch is considered at 9-inches all along the girder. Also, a modular mesh creation of the bridge was adopted. Therefore it was more convenient to consider a length of 1152” for the girder. This change can not have any adverse effect on examination of the C2A concept.
The maximum deflection in case of full composite interaction can be calculated as:
compositescomposite IE
PL
48
3
(1)
Where in this equation P is the applied concentrated load, Icomposite is the moment of inertia of the composite section, L is the length of the girder and Es is steel modulus of elasticity. The shear force in the case of full composite interaction between deck and girder is obtained using the equations of elastic beam theory:
LI
PQdx
I
VQ
composite
L
composite 4
2/
0 (2)
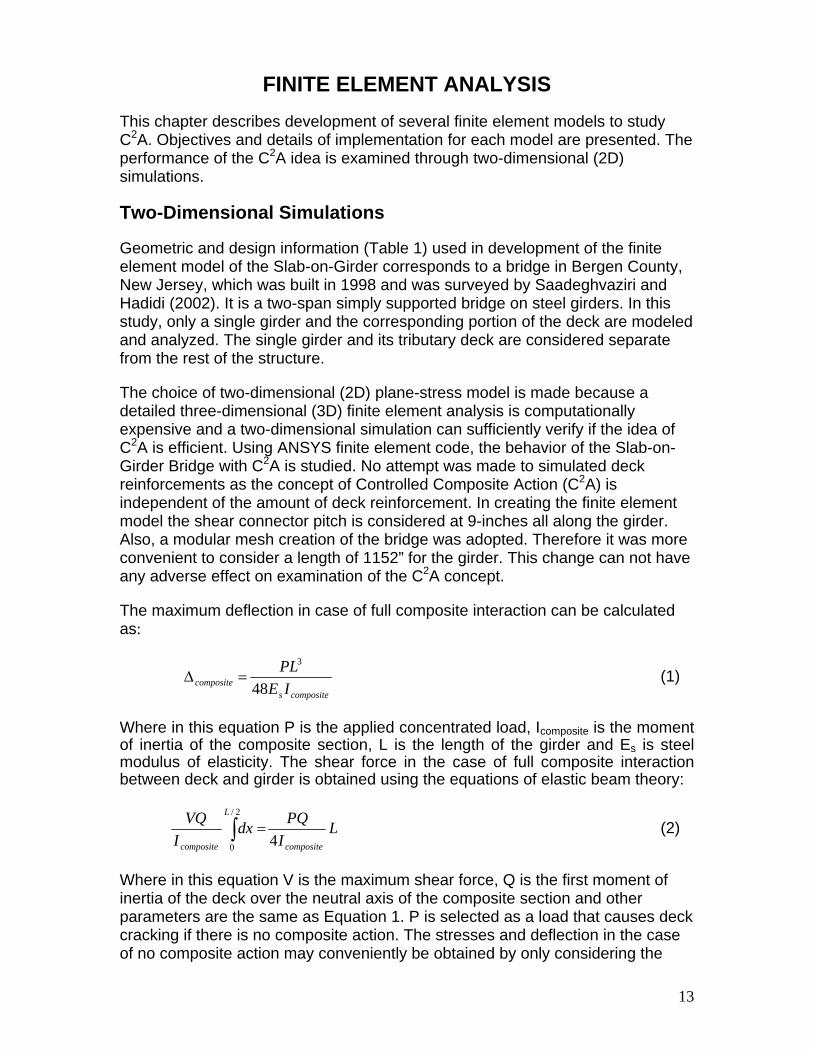
Where in this equation V is the maximum shear force, Q is the first moment of inertia of the deck over the neutral axis of the composite section and other parameters are the same as Equation 1. P is selected as a load that causes deck cracking if there is no composite action. The stresses and deflection in the case of no composite action may conveniently be obtained by only considering the
14
girder and deck as two layers with a contact element at their interface, as shown in Figure 8.
In the calculations Es and Ec are considered 29,000 ksi and 3,830 ksi, respectively. Also, Poisson ration of steel and concrete are assumed to be 0.3 and 0.2, respectively. Based on ACI recommendations and 28 days compressive strength of 4,500 psi for the concrete, the tensile strength of the deck concrete can be estimated as below:
50045005.7'5.7 cr ff (psi) (3)
The weight per unit volume of steel and concrete are considered to be 490 and 150 lb/ft3, respectively. The shrinkage is simulated by applying a negative temperature on the deck. Therefore, there is the need to specify the Coefficient of Thermal Expansion for the concrete. Winter and Nilson (1986) state that the concrete coefficient of thermal expansion should be in the range of 4 to 7 microstrain per degree of Fahrenheit. Khan, Cook, and Mitchell (1998) measure the values of 5.3 to 5.5 microstrain per degree of Fahrenheit for maturing normal weight concrete. In this study the values of 5.5 microstrain per degree of Fahrenheit is considered.
Table 1. Geometric and design information for the Slab-on Girder bridge. Span length 1082” Span width 564” Girder spacing 7 girder @ 7’-1” Deck thickness 8” Longitudinal rebars #5 @ 6” (bottom) & #5 @ 15” (top) Transverse rebars #6 @ 7” (bottom & top) Girder bottom flange 24”x2” Girder top flange 20”x1.25” Girder web 35.25”x1” Shear connector pitch 12” (mid-span @ 71’) and 9” (support @18’)
In the finite element meshing of the bridge, four-node 2D solid element PLANE42 for the deck-girder and eight-node PLANE82 solid element for shear connectors are used, respectively. PLANE82 is a higher order version of the 2-D four-node element PLANE42. It can tolerate irregular shapes and sharp edges without much loss of accuracy. The bridge-deck interface as well as stud-deck interface is simulated using the Surface-to-Surface contact elements. The surface of the steel which is referred to as “target” is modeled with TARGET 169 and the surface of the concrete or the “contact” is modeled with CONTA172. The interface is assumed frictionless which means it is assumed there is no bond strength at the steel-concrete interface. As it can be seen, meshing of the concrete deck especially adjacent to the studs is finer than other locations. Figure 7 shows the finite element meshing as well as location of the contact elements.

15
Figure 9. Cross-section of the simply supported Slab-on-Girder bridge
Before examining the performance of C2A in the bridge, it is beneficial to ascertain that the modeling assumptions are correct. This control is mostly needed because of the sensitivity of the contact elements used in the simulations as these elements have a highly nonlinear behavior and the defining parameters have to be carefully assigned (Table 2).
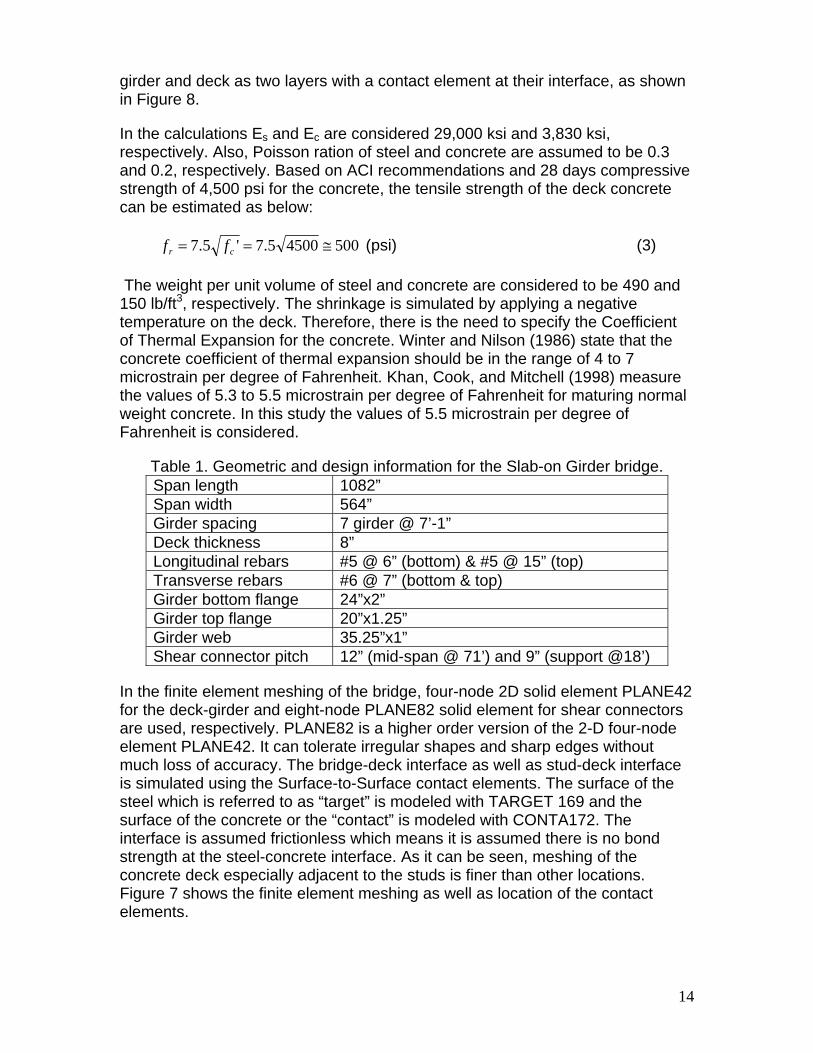
The maximum deflection and stresses of the girder are compared versus the expected theoretical values. As it can be seen from Table 3, the results show that the simulation is correct and successful. Therefore, this model can further be employed in examination of C2A performance by adding the hyperelastic layers around the shear connectors, as shown in Figure 12.
(a)
(b)
Figure 10. (a) Finite element meshing of shear connectors embedded in
concrete, (b) contact surfaces.
16
Table 2. contact element properties. contact type Deformable-deformable contact algorithm Augmented Lagrange method contact stiffness 2.40E+08 penetration tolerance 3.19E-02 average contact surface length 0.32759 average contact pair depth 0.31897
Table 3. Results of FE modeling versus theoretical values. Theoretical Detailed 2D modeling stress at Bottom flange 8,851 psi 8,769 psi stress at Top flange -3,412 psi -3,177 psi stress at bottom of the deck -450 psi -370 psi stress at top of the deck -787 psi -933 psi maximum deflection 1.21 in. 1.25 in. shear force transferred 421 kips 420 kips
Figure 11. Finite element modeling of Slab-on-Girder with no composite action (continuous contact layer is considered at the steel-concrete interface).
Figure 12. Finite element modeling of Slab-on-Girder with hyperelastic layers
17
0
200
400
600
800
1000
0 0.2 0.4 0.6 0.8 1
Strain
Str
es
s k
sii)
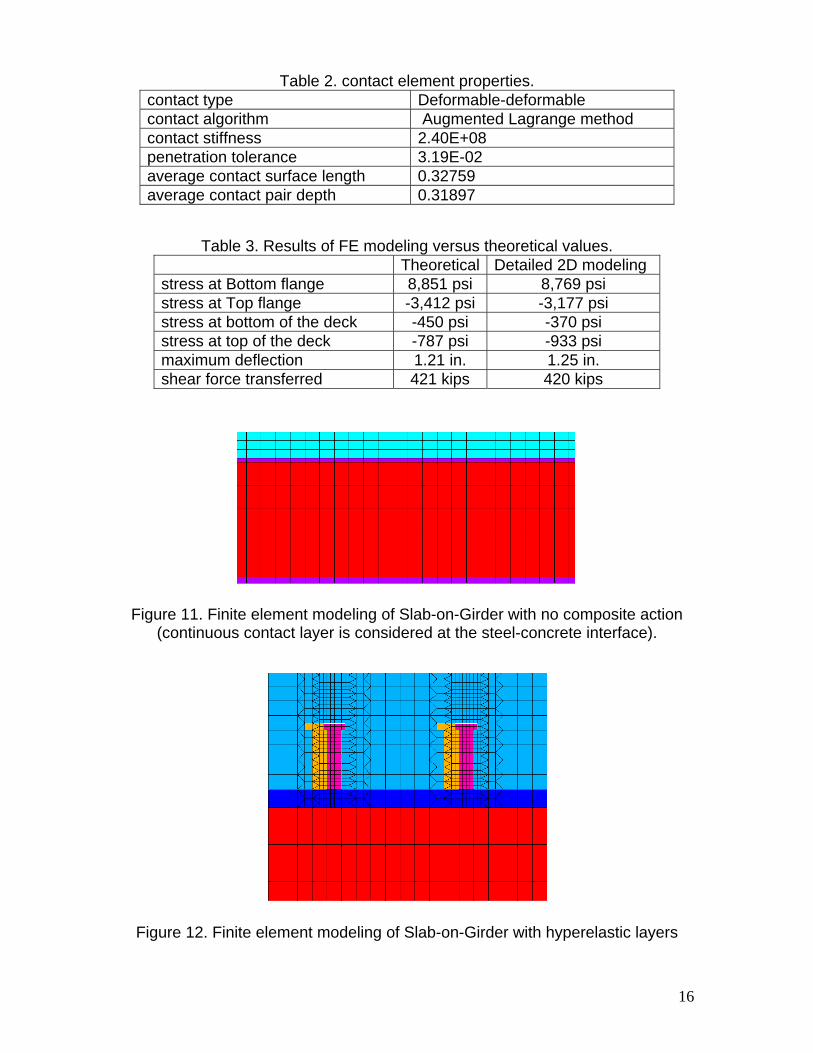
Figure 13. Stress-strain behavior of the hyperelastic material.
Now that adequacy and reliability of the finite element model is established, it will be further developed to consider the effect of hyperelastic layers which are placed on the shear connectors on the side which is against the shrinkage direction. The stress-strain behavior assumed for the hyperelastic material is shown in Figure 13. It is important to note that there is actually no need to “wrap” the hyperelastic layer all around the shear connector as the shrinkage direction is always toward the slab center. Therefore, placing the layer on only one side of the shear connector should be adequate for the C2A purpose.
-0.80
-0.60
-0.40
-0.20
0.00
0.20
0.40
0 25 50 75 100
Length Ratio (%)
Slip
(in
)
shrinkage slip (550 m.s) relative slip due to load P (in)
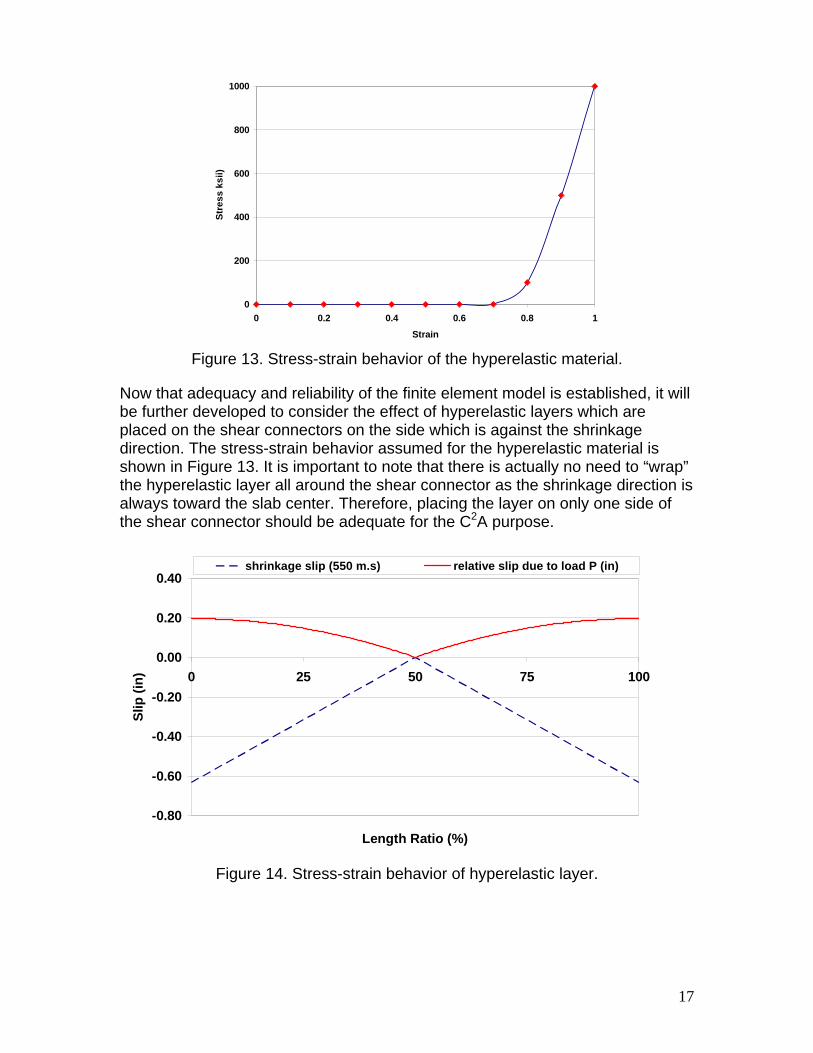
Figure 14. Stress-strain behavior of hyperelastic layer.

18
Figure 15. (a) Deformation and stress longitudinal distribution in the Slab-on-
Girder with no composite action, (b) closer view of stress in deck.
Finite element model of the Slab-on-Girder bridge with the C2A concept is conducted under 550 microstrain deck shrinkage and then a concentrated load of P = 70 kips is applied on the center of the bridge. Thickness of the hyperelastic layer is 1 inch. From Figure 14 it can be seen that the slip due to shrinkage is significantly more than the slip due to load P which has created tensile stresses in the deck. This is enough to cause deck cracking as there is no composite action in the bridge. The results of this analysis also indicate that under the gravity load shear studs uniformly contribute to transfer of shear stresses, while under shrinkage load, the end studs transfer the majority of the load.
-150
-100
-50
0
50
100
150
0 20 40 60 80 100
Length ratio (%)
Sh
ear
forc
e p
er s
tud
(ki
ps)
P=70 kips 550 m.s Shrinkage
Figure 16. Shear force transferred through the shear connectors.

19
LABORATORY EXPERIMENTS
This chapter describes the laboratory experiments performed in order to examine the performance of C2A concept. Although the results of the finite element analyses provide very good insights into improvement of the C2A, it is alsovery beneficial to study the transverse shrinkage cracking through experimental studies.
Design of a high shrinking concrete
The C2A experiments started off by conducting standard free shrinkage tests followed by a restrained-shrinkage test – specifically developed at NJIT – of normal strength concrete conducted at the Advanced Concrete Laboratory in the Department of Civil and Environmental Engineering at NJIT. It was very important to apply the C2A concept to a concrete-steel system where the concrete has high shrinking and cracking potential. For this purpose, by trial-and-adjustment a mix design was obtained that yielded an average of 600 microstrain free shrinkage.
ACI 211.1-91(2008) Standard Practice for Selecting Proportions for Normal, Heavyweight and Mass Concrete was adopted for the mix design. The concrete was proportioned to ensure that a significant free shrinkage will happen. Considering the literature review, the use of small size coarse aggregate increases the potential of concrete shrinkage. Therefore, the maximum aggregate size was restrained to 3/8”.
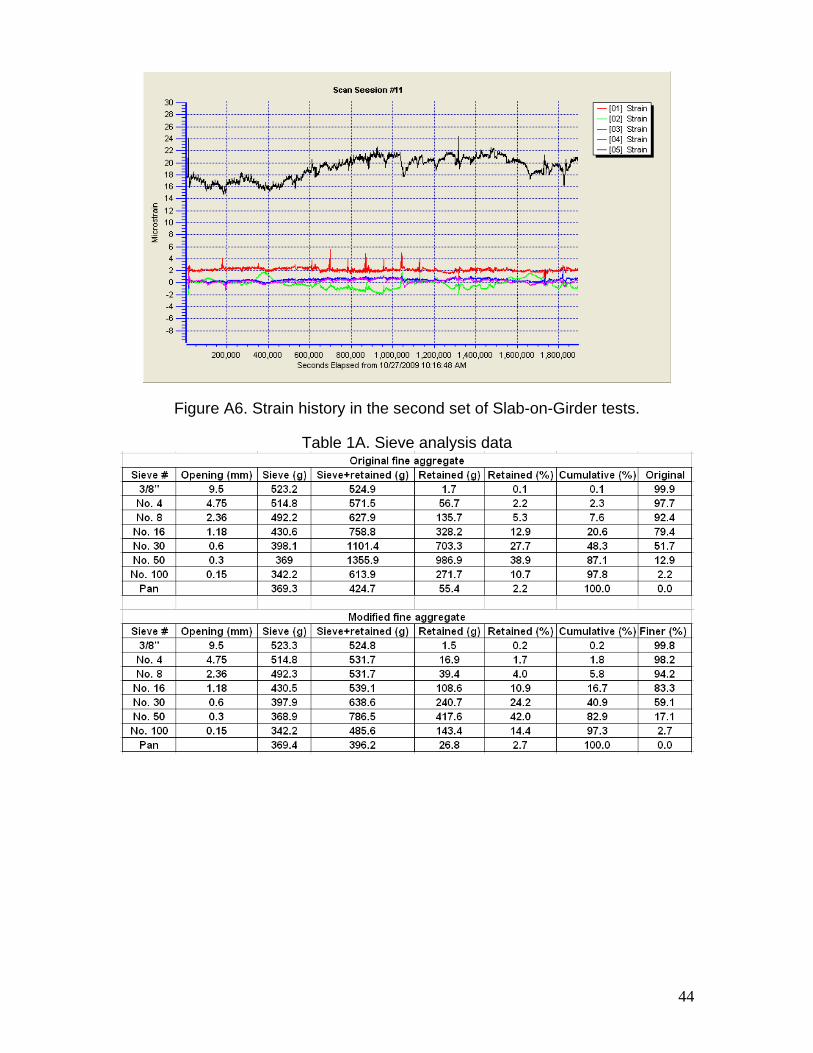
The original sand was not conforming to the definition of a “well-graded” fine aggregate based on Unified Soil Classification System. Therefore, it was manually adjusted to become “well-graded”. It is worth noting that in accordance with the Unified Soil Classification System, for a gravel to be classified as well graded, the following criteria must be met:
Cu > 6 & 1 < Cc < 3 (1)
If both of these criteria are met, the sand is classified as well graded or GW. In the above equations, Cu is the coefficient of uniformity and is defined as:
10
60
D
DCu (3)
where D60 is the grain diameter at 60% passing, and D10 is the grain diameter at 10% passing. Cc is the coefficient of curvature and is defined as:
6010
230 )(
DD
DCu
(4)

20
Where D30 is the grain diameter at 30% passing. The cC and uC for the original
and modified fine aggregate were calculated as below. It can be seen that after the adjustment, both cC and uC fall within the acceptable range.
67.63.0
0.2
10
60 D
DCu
67.13.00.2
)0.1()( 2
6010
230
DD
DCu
The 28-day compressive strength of the non-air-entrained Normal-Strength concrete was selected to be 4.5 ksi. In order to measure the moisture content and moisture absorption of the aggregates, ASTM D2216 - 05 Standard Test Methods for Laboratory Determination of Water (Moisture) Content of Soil and Rock by Mass and also ASTM D7263 - 09 Standard Test Methods for Laboratory Determination of Density (Unit Weight) of Soil Specimens are used, respectively. The design parameters are presented in Table 4. It should be noted that in order to increase the shrinkage a high water to cement ratio was adopted.
Table 4. Concrete mix deign parameters total moisture content in coarse aggregate (%) 0.3 total moisture content in fine aggregate (%) 1.2 moisture absorption of coarse aggregate (%) 0.5 moisture absorption of coarse aggregate (%) 0.9 nit weight of coarse aggregate (lb/yd3) 105 fineness modulus of fine aggregate 2.6
Figure 17. Sieve analysis of the fine aggregate used in concrete mixes.
21
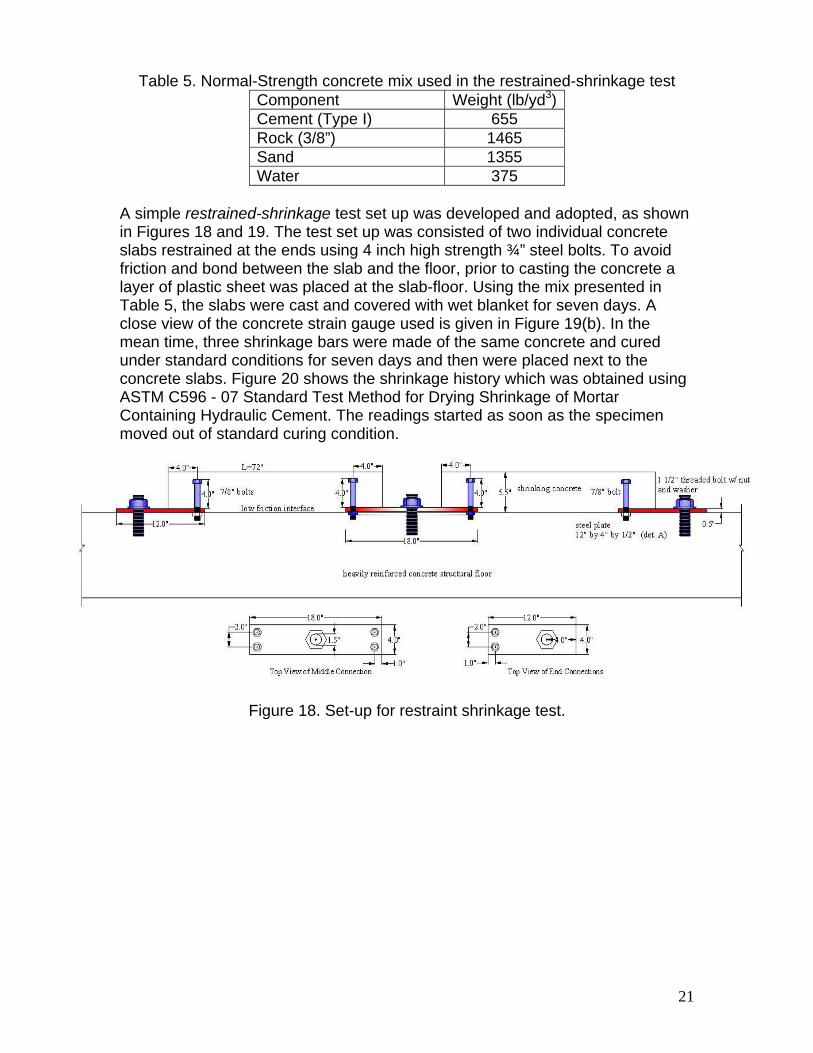
Table 5. Normal-Strength concrete mix used in the restrained-shrinkage test Component Weight (lb/yd3)Cement (Type I) 655 Rock (3/8”) 1465 Sand 1355 Water 375
A simple restrained-shrinkage test set up was developed and adopted, as shown in Figures 18 and 19. The test set up was consisted of two individual concrete slabs restrained at the ends using 4 inch high strength ¾” steel bolts. To avoid friction and bond between the slab and the floor, prior to casting the concrete a layer of plastic sheet was placed at the slab-floor. Using the mix presented in Table 5, the slabs were cast and covered with wet blanket for seven days. A close view of the concrete strain gauge used is given in Figure 19(b). In the mean time, three shrinkage bars were made of the same concrete and cured under standard conditions for seven days and then were placed next to the concrete slabs. Figure 20 shows the shrinkage history which was obtained using ASTM C596 - 07 Standard Test Method for Drying Shrinkage of Mortar Containing Hydraulic Cement. The readings started as soon as the specimen moved out of standard curing condition.
Figure 18. Set-up for restraint shrinkage test.
22
(a) (b)
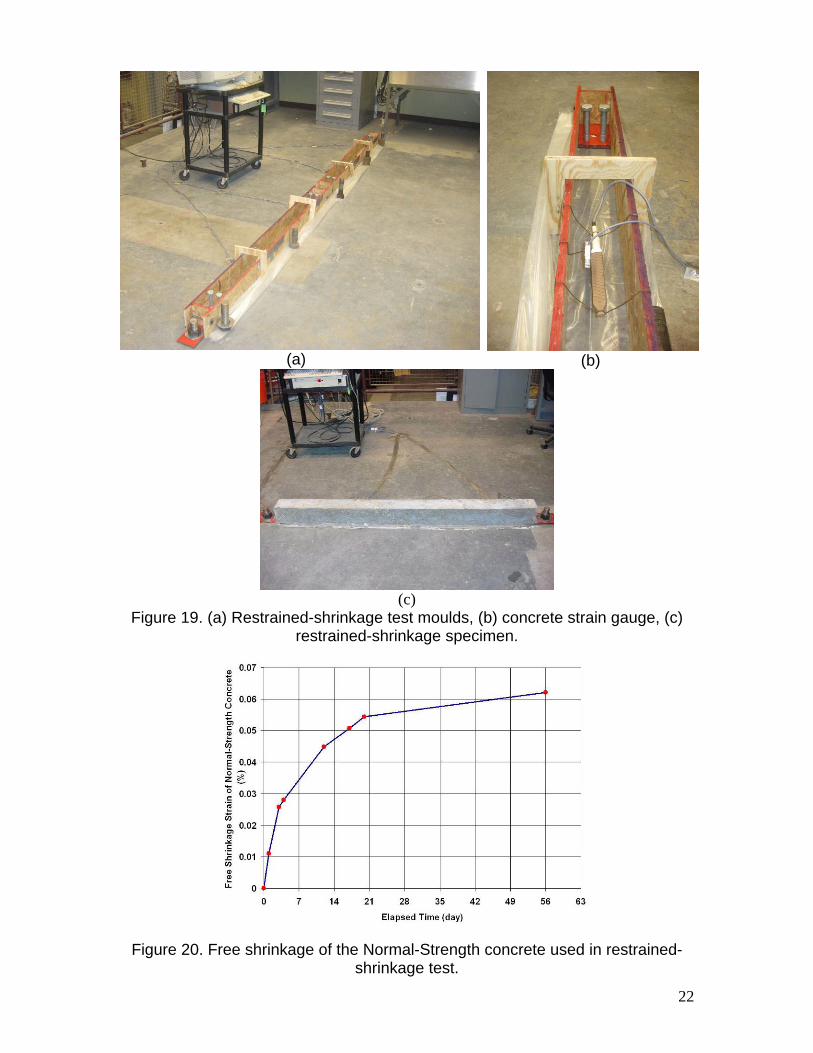
(c)
Figure 19. (a) Restrained-shrinkage test moulds, (b) concrete strain gauge, (c) restrained-shrinkage specimen.
Figure 20. Free shrinkage of the Normal-Strength concrete used in restrained-shrinkage test.

23
Since the concrete was fully restrained, it was expected that a crack would eventually happen in each of the slabs as a very high-shrinkage concrete mix was used. No drying shrinkage cracks were observed though. It was concluded that the real tensile strength of the concrete had actually been more than the estimated strength which was obtained using the ACI recommendations (Equation 6) and the strain history of the slabs. Based on this observation and in order to make the concrete more susceptible to shrinkage cracking, it was decided to use silica fume in the mix and also adopt a reasonably small deck thickness for the slabs.
The axial strains in the slabs were constantly monitored using two embedded strain gauges in each slab. The history of axial strain is presented in Figure 22. As it can be seen, an average of 200 microstrain occurred 8 weeks after the casting day. The tensile stress in the concrete was estimated as follows:
ct E (4)
Where is the average strain obtained from the strain gauges, which turned out to be 200 microstrains (Figure 22), and Ec is the concrete modulus of elasticity. The proposed ACI recommendations were used to estimate the concrete modulus of elasticity and tensile strength (all values in psi):
'57000 cc fE (5)
'5.7 ccr ff (6)
Five 3” by 6” cylinders were made and cured in for seven days. Compressive tests were performed based on ASTM C39 / C39M - 09 Standard Test Method for Compressive Strength of Cylindrical Concrete Specimens and an average compressive strength of 4,750 psi was obtained at the age of 28 days. Therefore, using the above ACI equation, the concrete modulus of elasticity, tensile stress and strength as:
475057000cE = 3.9x10⁶ psi
66 109.310200 t = 780 psi
47505.7crf = 517 psi
Examination of C2A
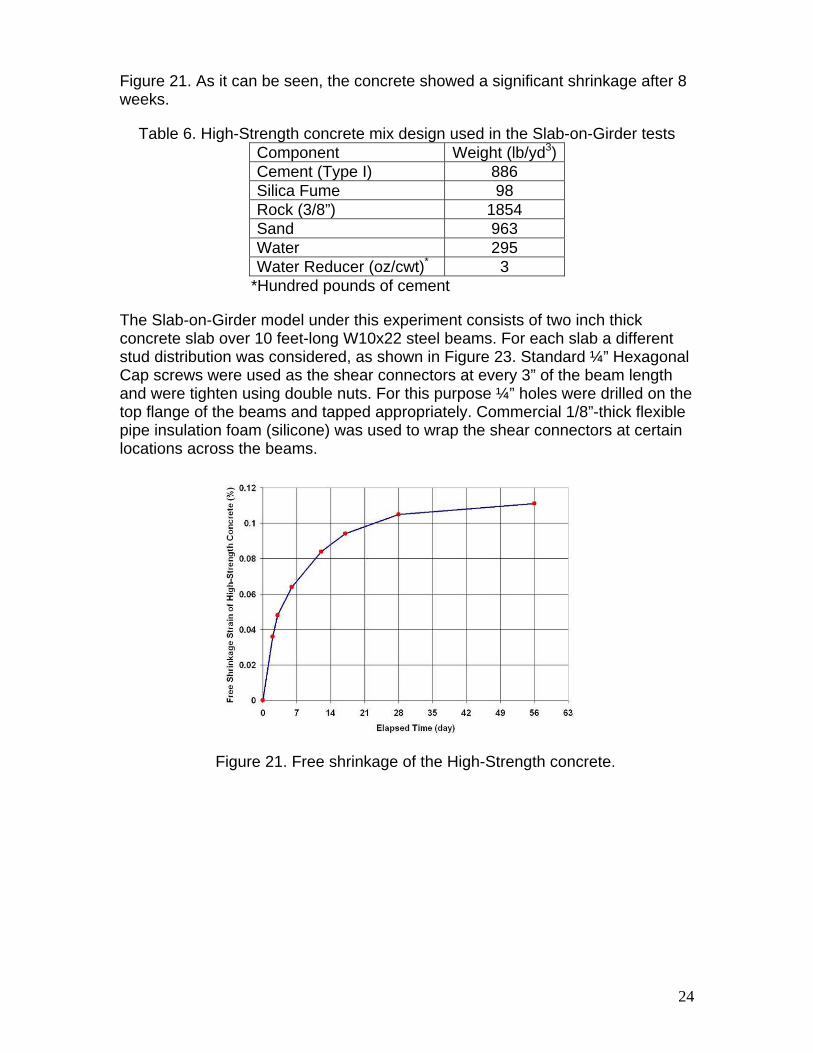
The objective of these tests was to find a configuration of shear connectors which might reduce the shrinkage cracking. A high-strength concrete mix was designed based on ACI 211.4R-08: Guide for Selecting Proportions for High-Strength Concrete Using Portland Cement and Other Cementitious Materials. The mix proportion is presented in Table 6. Three shrinkage bars were made and tested using appropriate standard procedures. Results of these tests are presented in
24
Figure 21. As it can be seen, the concrete showed a significant shrinkage after 8 weeks.
Table 6. High-Strength concrete mix design used in the Slab-on-Girder tests Component Weight (lb/yd3)Cement (Type I) 886 Silica Fume 98 Rock (3/8”) 1854 Sand 963 Water 295 Water Reducer (oz/cwt)* 3
*Hundred pounds of cement
The Slab-on-Girder model under this experiment consists of two inch thick concrete slab over 10 feet-long W10x22 steel beams. For each slab a different stud distribution was considered, as shown in Figure 23. Standard ¼” Hexagonal Cap screws were used as the shear connectors at every 3” of the beam length and were tighten using double nuts. For this purpose ¼” holes were drilled on the top flange of the beams and tapped appropriately. Commercial 1/8”-thick flexible pipe insulation foam (silicone) was used to wrap the shear connectors at certain locations across the beams.
Figure 21. Free shrinkage of the High-Strength concrete.
25
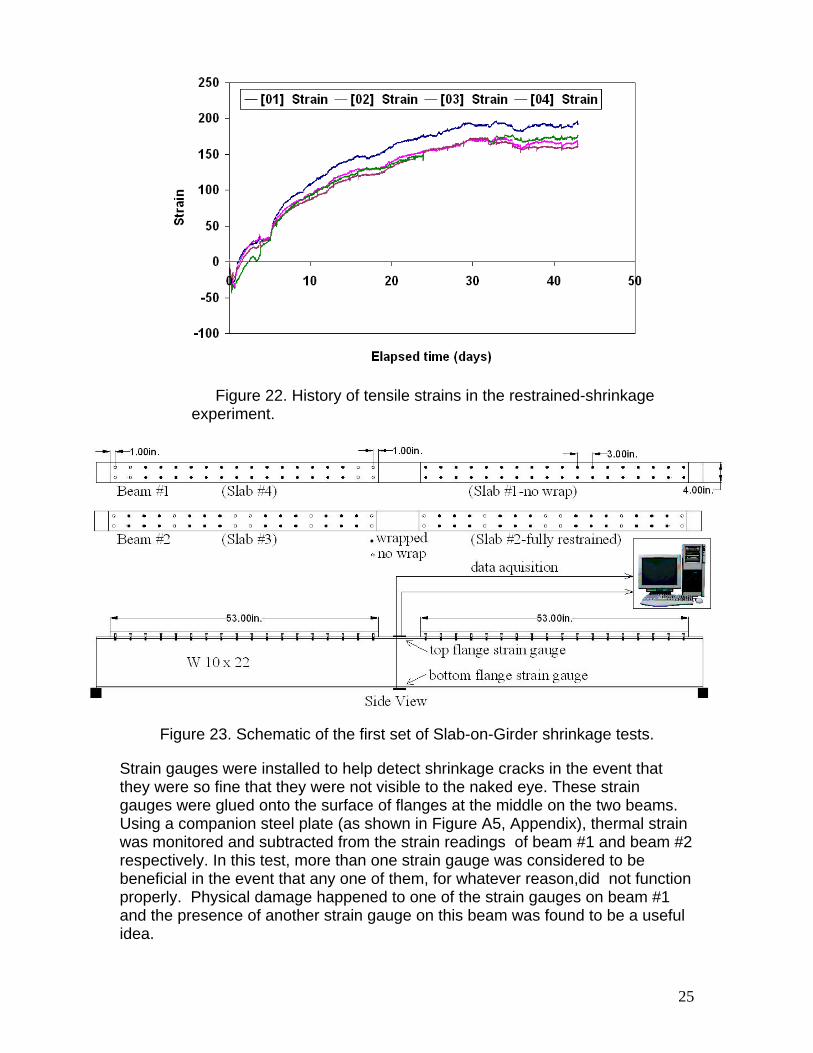
Figure 22. History of tensile strains in the restrained-shrinkage experiment.
Figure 23. Schematic of the first set of Slab-on-Girder shrinkage tests.
Strain gauges were installed to help detect shrinkage cracks in the event that they were so fine that they were not visible to the naked eye. These strain gauges were glued onto the surface of flanges at the middle on the two beams. Using a companion steel plate (as shown in Figure A5, Appendix), thermal strain was monitored and subtracted from the strain readings of beam #1 and beam #2 respectively. In this test, more than one strain gauge was considered to be beneficial in the event that any one of them, for whatever reason,did not function properly. Physical damage happened to one of the strain gauges on beam #1 and the presence of another strain gauge on this beam was found to be a useful idea.

26
Figure 24. Installation of shear connectors and strain gauge instrumentation.
Figure 25. Slab-on-Girder with different stud configurations.
Crack in Slab #3
Crack in Slab #2
Figure 26. Shrinkage cracking in Beam #1
27
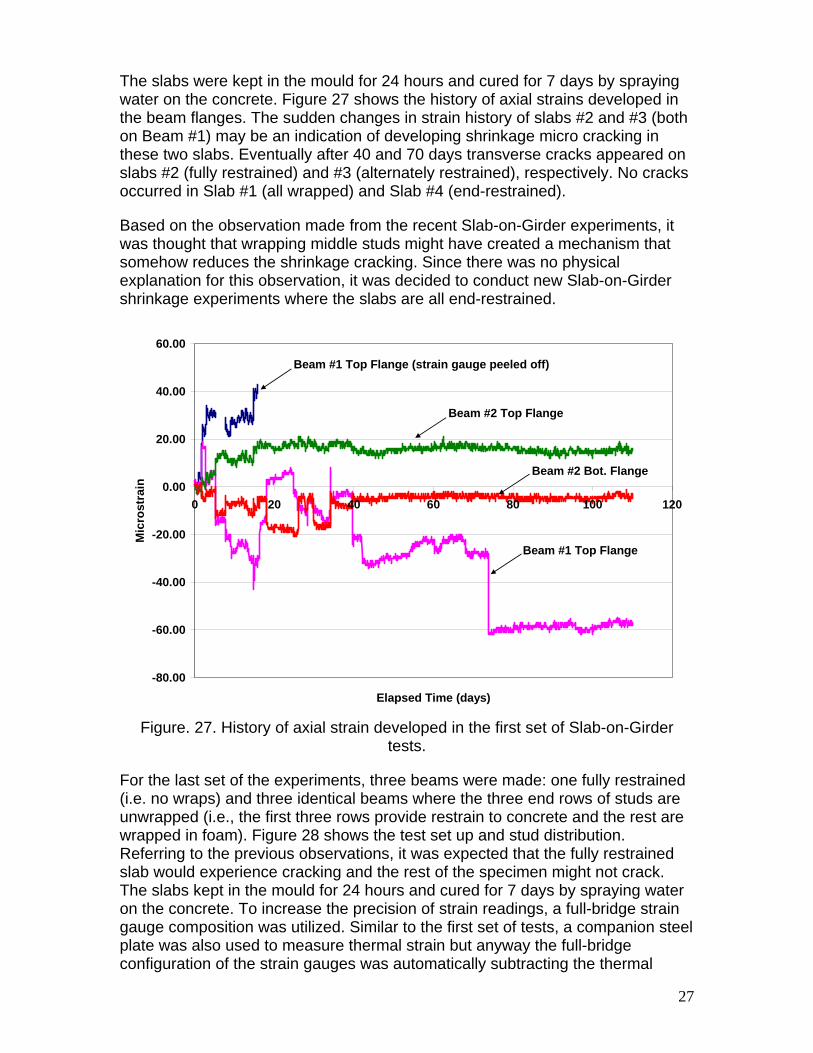
The slabs were kept in the mould for 24 hours and cured for 7 days by spraying water on the concrete. Figure 27 shows the history of axial strains developed in the beam flanges. The sudden changes in strain history of slabs #2 and #3 (both on Beam #1) may be an indication of developing shrinkage micro cracking in these two slabs. Eventually after 40 and 70 days transverse cracks appeared on slabs #2 (fully restrained) and #3 (alternately restrained), respectively. No cracks occurred in Slab #1 (all wrapped) and Slab #4 (end-restrained).
Based on the observation made from the recent Slab-on-Girder experiments, it was thought that wrapping middle studs might have created a mechanism that somehow reduces the shrinkage cracking. Since there was no physical explanation for this observation, it was decided to conduct new Slab-on-Girder shrinkage experiments where the slabs are all end-restrained.
-80.00
-60.00
-40.00
-20.00
0.00
20.00
40.00
60.00
0 20 40 60 80 100 120
Elapsed Time (days)
Mic
rost
rain
Beam #1 Top Flange (strain gauge peeled off)
Beam #2 Top Flange
Beam #2 Bot. Flange
Beam #1 Top Flange
Figure. 27. History of axial strain developed in the first set of Slab-on-Girder
tests.
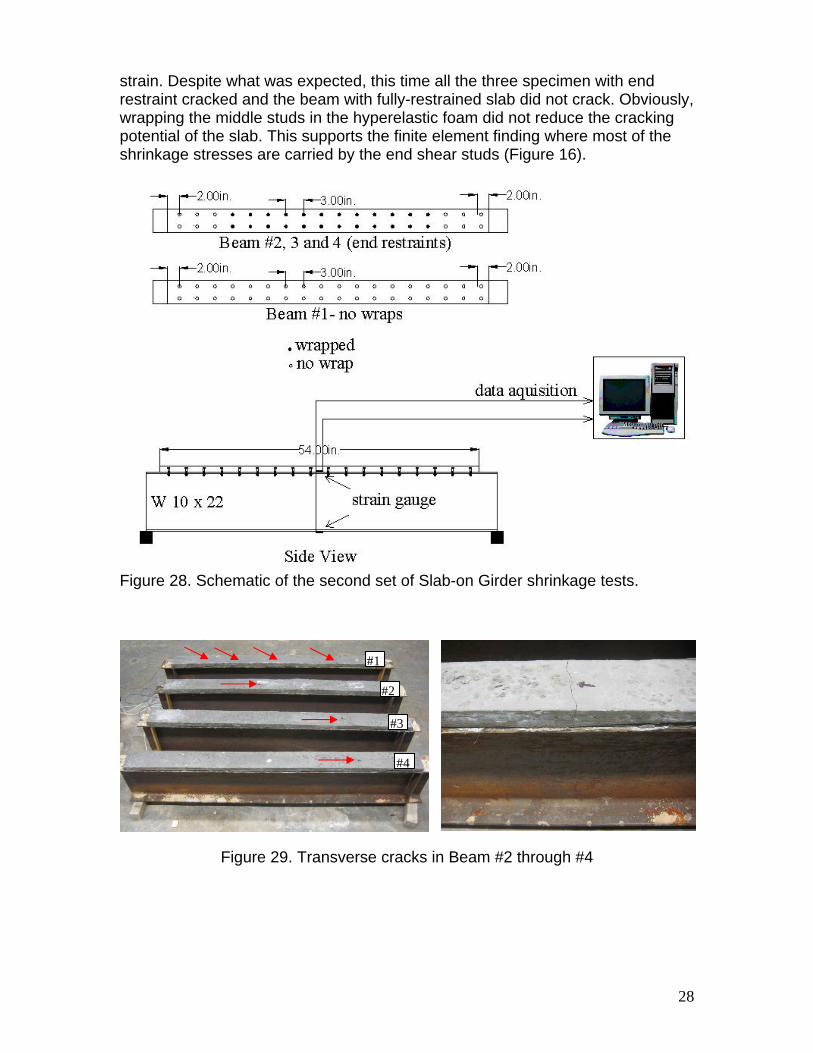
For the last set of the experiments, three beams were made: one fully restrained (i.e. no wraps) and three identical beams where the three end rows of studs are unwrapped (i.e., the first three rows provide restrain to concrete and the rest are wrapped in foam). Figure 28 shows the test set up and stud distribution. Referring to the previous observations, it was expected that the fully restrained slab would experience cracking and the rest of the specimen might not crack. The slabs kept in the mould for 24 hours and cured for 7 days by spraying water on the concrete. To increase the precision of strain readings, a full-bridge strain gauge composition was utilized. Similar to the first set of tests, a companion steel plate was also used to measure thermal strain but anyway the full-bridge configuration of the strain gauges was automatically subtracting the thermal
28
strain. Despite what was expected, this time all the three specimen with end restraint cracked and the beam with fully-restrained slab did not crack. Obviously, wrapping the middle studs in the hyperelastic foam did not reduce the cracking potential of the slab. This supports the finite element finding where most of the shrinkage stresses are carried by the end shear studs (Figure 16).
Figure 28. Schematic of the second set of Slab-on Girder shrinkage tests.
Figure 29. Transverse cracks in Beam #2 through #4
#4
#3
#2
#1

29
CONCLUSIONS AND RECOMMENDATIONS
Originally Proposed C2A
In the proposed C2A concept, the shear connectors were to be wrapped in hyperelastic materials which have very low stiffness under small loads but upon increasing the load show higher resistance and eventually become very stiff. Based on this behavior, upon ending major portion of the shrinkage, the total slip at the steel-concrete interface will be much more than the slip under even very significant gravity loads, so that the created gap between concrete and shear connectors can not be closed, hence leading to no composite action between deck and girder or cracking at the bottom of the slab. In other words, due to presence of the hyperelastic layers which are placed against the shrinkage, the concrete deck can have enough room to accommodate its shrinkage so that no stresses are developed. But, creation of the gap at stud-deck interfaces are so significant that prevents composite action.
The idea of C2A can be modified in order to eliminate its deficiency in maintaining full composite action. It may be possible to eliminate the shrinkage cracking if a delaying mechanism is developed such that it delays the composite action to the time that a significant portion of the free shrinkage takes place. This can be achieved by using threaded studs (Fig. 30) which are not fastened during the time concrete is shrinking, which can be limited to the time that the bridge is still not open to traffic. During this period the studs are freely slipping with the concrete and no tensile stresses are developed in the deck. Upon completing the bridge construction, all the studs are tightened so full composite action can be achieved.
Figure 30. Shear transferred through the shear connectors.
30
Shear Transfer Mechanism and Number of Shear Studs
Practicality of the proposed method (or modification to C2A) is a matter which requires further considerations. Reducing the number of shear studs is a major factor in determining the economic and practicality of the proposed modification. To this end, a simple analytical study was performed to determine the needed shear stud to develop composite action. It was determined that full composite action can be achieved (Jamali and Saadeghvaziri, 2010) with fewer shear stud connectors as compared to existing state-of-the-practice. The results of this analytical study are presented here.
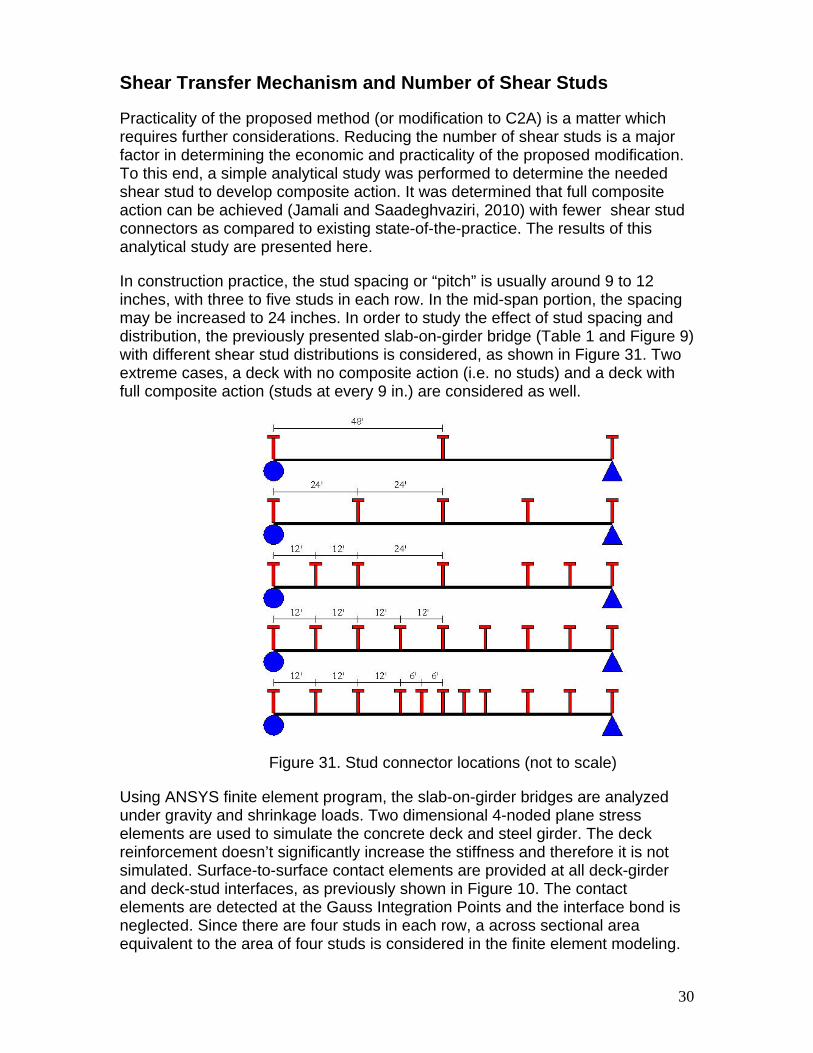
In construction practice, the stud spacing or “pitch” is usually around 9 to 12 inches, with three to five studs in each row. In the mid-span portion, the spacing may be increased to 24 inches. In order to study the effect of stud spacing and distribution, the previously presented slab-on-girder bridge (Table 1 and Figure 9) with different shear stud distributions is considered, as shown in Figure 31. Two extreme cases, a deck with no composite action (i.e. no studs) and a deck with full composite action (studs at every 9 in.) are considered as well.
Figure 31. Stud connector locations (not to scale)
Using ANSYS finite element program, the slab-on-girder bridges are analyzed under gravity and shrinkage loads. Two dimensional 4-noded plane stress elements are used to simulate the concrete deck and steel girder. The deck reinforcement doesn’t significantly increase the stiffness and therefore it is not simulated. Surface-to-surface contact elements are provided at all deck-girder and deck-stud interfaces, as previously shown in Figure 10. The contact elements are detected at the Gauss Integration Points and the interface bond is neglected. Since there are four studs in each row, a across sectional area equivalent to the area of four studs is considered in the finite element modeling.

31
(a)
Figure 32. (a) A strip of the bridge under concentrated gravity load at mid-span, (b) stresses developed in the deck with no composite action
Assuming concrete tensile strength of 600 psi (for high strength concrete), the maximum concentrated gravity load to cause deck cracking when there is no composite action was determined to be 70 kips at the mid-span (Fig. 32). This load was applied to other bridges as a reference load and the deflected shapes and the maximum stresses in the girder were compared versus the theoretical values obtained assuming a full composite action.
The results of finite element analyses (shown with subscript FE) of slab-on-girder bridges with different degrees of composite action are summarized in this section. In each case, the total shear forces transferred through the stud connectors are calculated, as well as the deflection and the maximum stresses in the girder. As it can be seen, upon increasing the density of stud distribution, the shear forces transferred quickly approach the theoretical value under the full composite action assumption. For instance, when there are only 11 rows of shear connectors, a shear force equivalent to 93 percent of the shear force of a full composite interaction is transferred. The shear force in the case of full composite interaction between deck and girder is obtained using the following equation:
LI
PQdx
I
VQ
composite
L
composite 4
2/
0 (7)
Where V is the maximum shear force, P is the concentrated load applied, Q is the first moment of inertia of the deck over the neutral axis of the composite section, Icomposite is the moment of inertia of the composite section and L is the
32
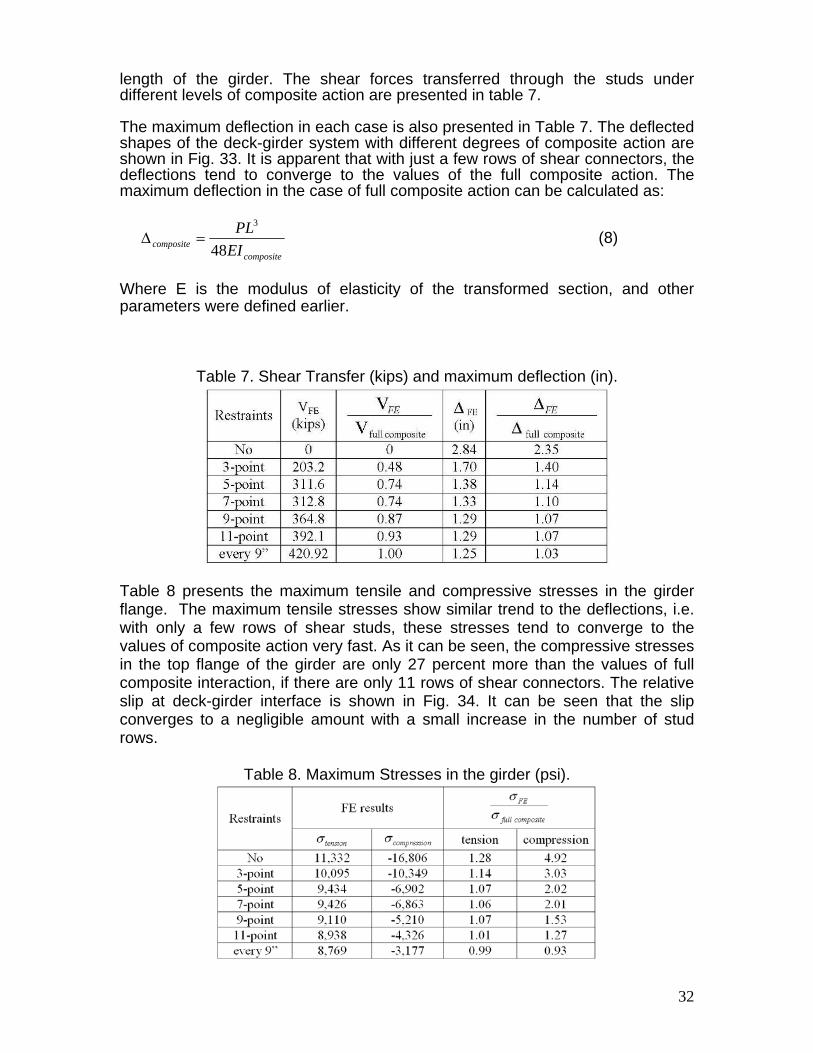
length of the girder. The shear forces transferred through the studs under different levels of composite action are presented in table 7.
The maximum deflection in each case is also presented in Table 7. The deflected shapes of the deck-girder system with different degrees of composite action are shown in Fig. 33. It is apparent that with just a few rows of shear connectors, the deflections tend to converge to the values of the full composite action. The maximum deflection in the case of full composite action can be calculated as:
compositecomposite EI
PL
48
3
(8)
Where E is the modulus of elasticity of the transformed section, and other parameters were defined earlier.
Table 7. Shear Transfer (kips) and maximum deflection (in).
Table 8 presents the maximum tensile and compressive stresses in the girder flange. The maximum tensile stresses show similar trend to the deflections, i.e. with only a few rows of shear studs, these stresses tend to converge to the values of composite action very fast. As it can be seen, the compressive stresses in the top flange of the girder are only 27 percent more than the values of full composite interaction, if there are only 11 rows of shear connectors. The relative slip at deck-girder interface is shown in Fig. 34. It can be seen that the slip converges to a negligible amount with a small increase in the number of stud rows.
Table 8. Maximum Stresses in the girder (psi).

33
Figure 33. Deformed shape under the gravity load.
Figure 34. Relative slip at deck-girder interface.
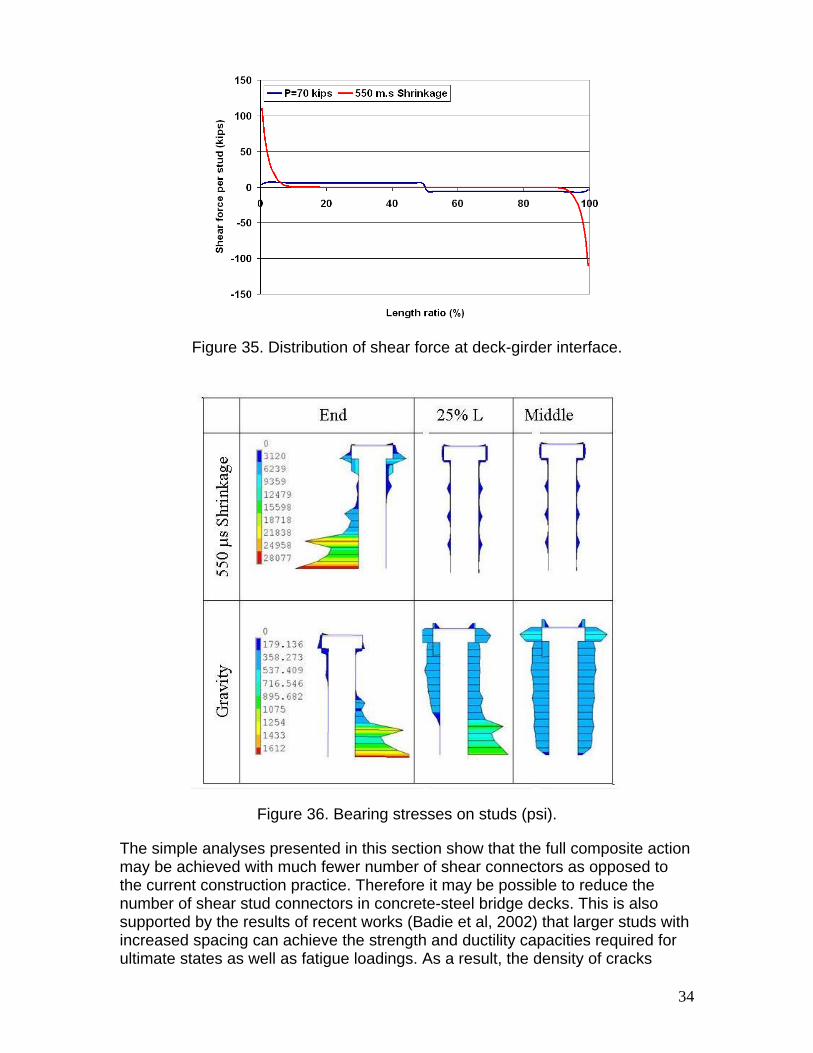
The shear forces due to shrinkage can be significant compared to the shear forces due to gravity loads, as can be seen from Figure 35 which shows the shear forces due to 550 microstrain shrinkage. A very interesting observation made here was that these forces are almost totally transferred through the end studs while, as expected, the shear forces due to the gravity load is fairly distributed among all of the studs. Table 8 shows the bearing stress distribution over the shank and head of shear connectors and as it can be seen, in the case of shrinkage loading, these stresses can be fairly significant. This can be better seen from Figure 36 which shows the shear force transfer in the case of shrinkage and the gravity load, when the studs are spaced at every 9 inches.
34
Figure 35. Distribution of shear force at deck-girder interface.
Figure 36. Bearing stresses on studs (psi).
The simple analyses presented in this section show that the full composite action may be achieved with much fewer number of shear connectors as opposed to the current construction practice. Therefore it may be possible to reduce the number of shear stud connectors in concrete-steel bridge decks. This is also supported by the results of recent works (Badie et al, 2002) that larger studs with increased spacing can achieve the strength and ductility capacities required for ultimate states as well as fatigue loadings. As a result, the density of cracks

35
could be significantly reduced by increasing the stud spacing since no more than one crack can occur between two adjacent rows of studs. It also facilitates application of the modified C2A concept. The analyses conducted in this work can be further enhanced by considering nonlinear behavior of materials. This will allow for studying the effect of stud distribution under ultimate load as well.
36
REFRENCES
1. American Concrete Institute. ACI Manual of Concrete Practice- Part 1: Materials and general Properties of Concrete, 2008.
2. American Society of Testing Materials Annual Book, Volume 04.02 Concrete and Aggregates, 2009.
3. M. A. Saadeghvaziri and R. Hadidi. Cause and Control of Transverse Cracking in Concrete Bridge Decks. Report No. FHWA-NJ-2002-19, Federal Highway Administration, Washington, DC, 2002.
4. A. Jamali and M. A. Saadeghvaziri. Shear Transfer Mechanism in Slab-on-Girder Bridges. The fifth International Conference on Bridge Maintenance, Safety and Management, Philadelphia, 2010.
5. S. S. Badie et al. Large Shear Studs for Composite Action in Steel Bidge Girders. ASCE Journal of Bridge Engineering, 7(3), pp. 195-203, 2002.
6. American Concrete Institute. ACI Manual of Concrete Practice- Part 1: Materials Winter and Nilson. Design of concrete structures. Mc-Graw Hill, 1986.
7. F.H. Dakhil, P.D. Cady and R.E. Carrier. Cracking of Fresh Concrete as Related to Reinforcement. ACI Structural Journal, 72(8), pp. 421-428, 1975.
8. C. French, L. Eppers, Q. Le, and J.F. Hajjar. Transverse cracking in concrete bridge decks. Transportation Research Record, Number 1688, pp. 21-29, 1999.
9. R.J. Frosch, R.D. Radabaugh and D.T. Blackman. Investigation of Transverse Deck Cracking. ASCE Structures Congress, Denver, April 2002.
10. P.D. Krauss, and E.A. Rogalla. Transverse Cracking in Newly Constructed Bridge Decks. NCHRP Report 380, Transportation Research Board, Washington, DC, 1995.
11. R.L. Purvis et al. Premature Cracking of Concrete Bridge Decks: Cause and Methods of prevention. 4th International Bridge Engineering Conference, San Francisco, Volume one, pp. 163-175, 1995.
12. ANSYS Finite Element Program, ANSYS Corporation, 1994-2009 13. www.studweldprod.com, last visited November, 2009.

37
APPENDIX
Figure A1. Measuring change in the length of a concrete shrinkage bars.
Figure A2. Electrical strain gauge installed on the girder flange.
Figure A3. First set of Slab-on-Girder shrinkage tests.

38
Figure A4. Second set of Slab-on-Girder shrinkage tests.
Figure A5. Companion steel plate to measure thermal strain.
39
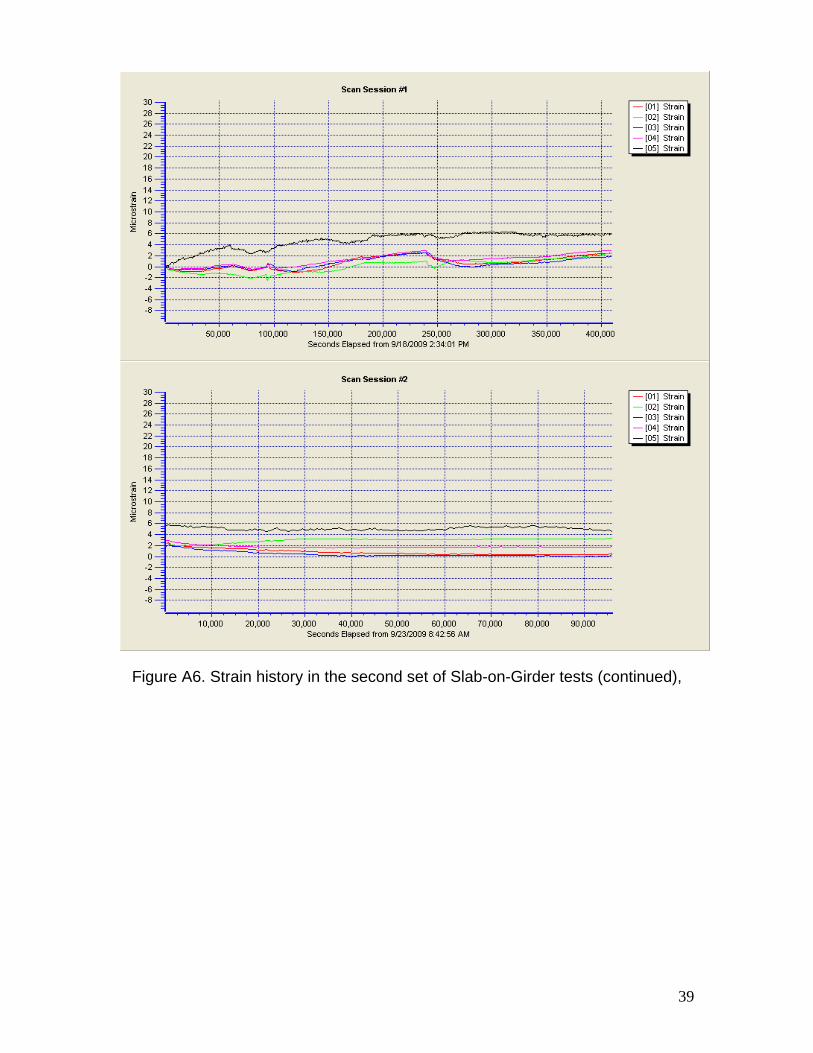
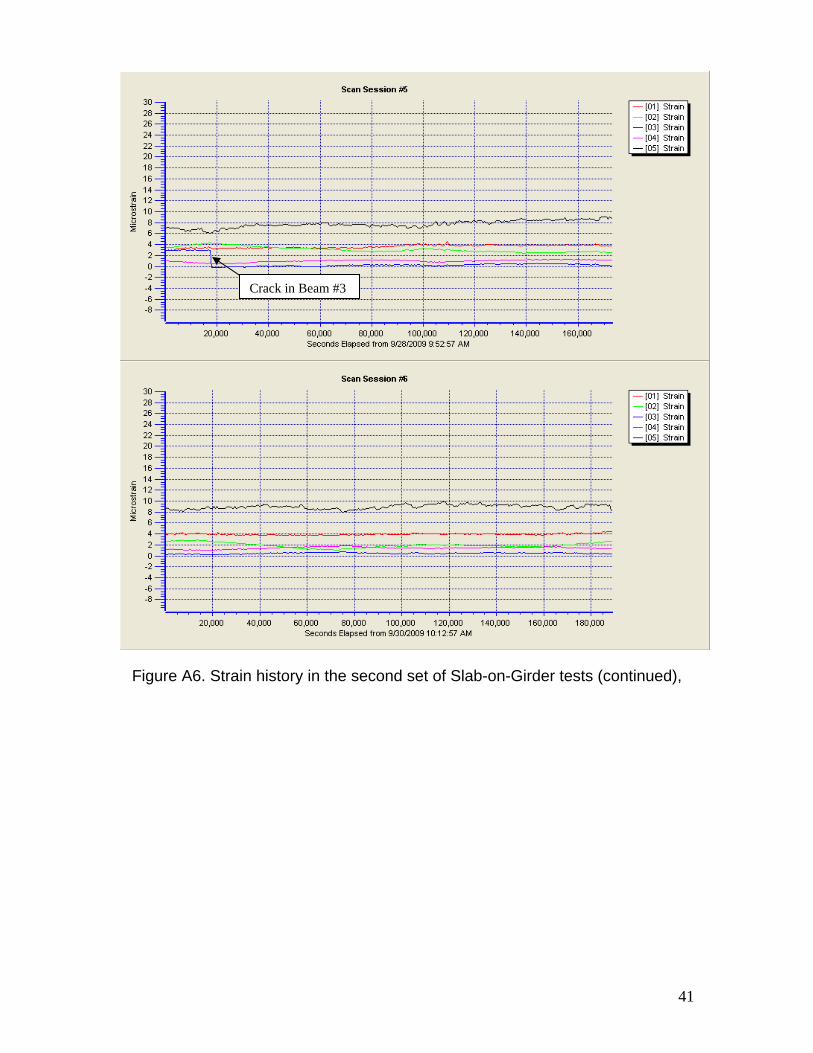
Figure A6. Strain history in the second set of Slab-on-Girder tests (continued),
40
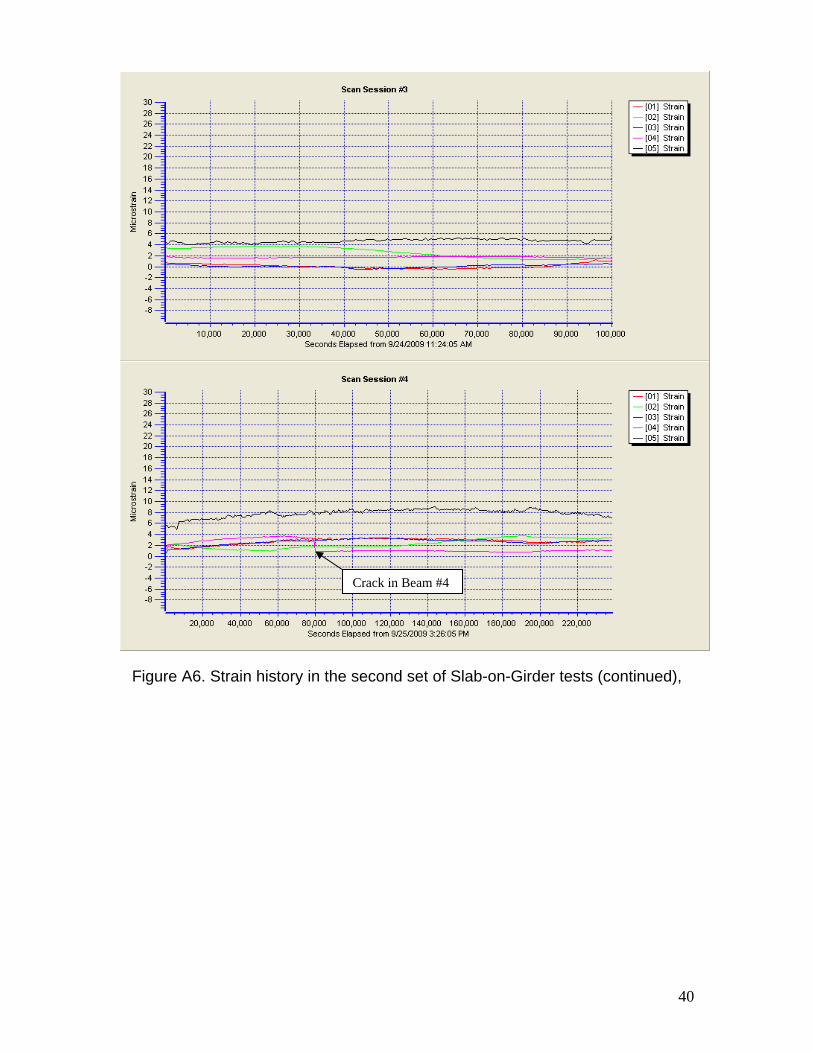
Figure A6. Strain history in the second set of Slab-on-Girder tests (continued),
Crack in Beam #4
41
Figure A6. Strain history in the second set of Slab-on-Girder tests (continued),
Crack in Beam #3

42

43
Figure A6. Strain history in the second set of Slab-on-Girder tests (continued),
Crack in Beam #2
44
Figure A6. Strain history in the second set of Slab-on-Girder tests.
Table 1A. Sieve analysis data

45
Table 2A. Shear force (in kips) transferred through shear studs in the finite
element analysis of SOG bridge under P=70 kips
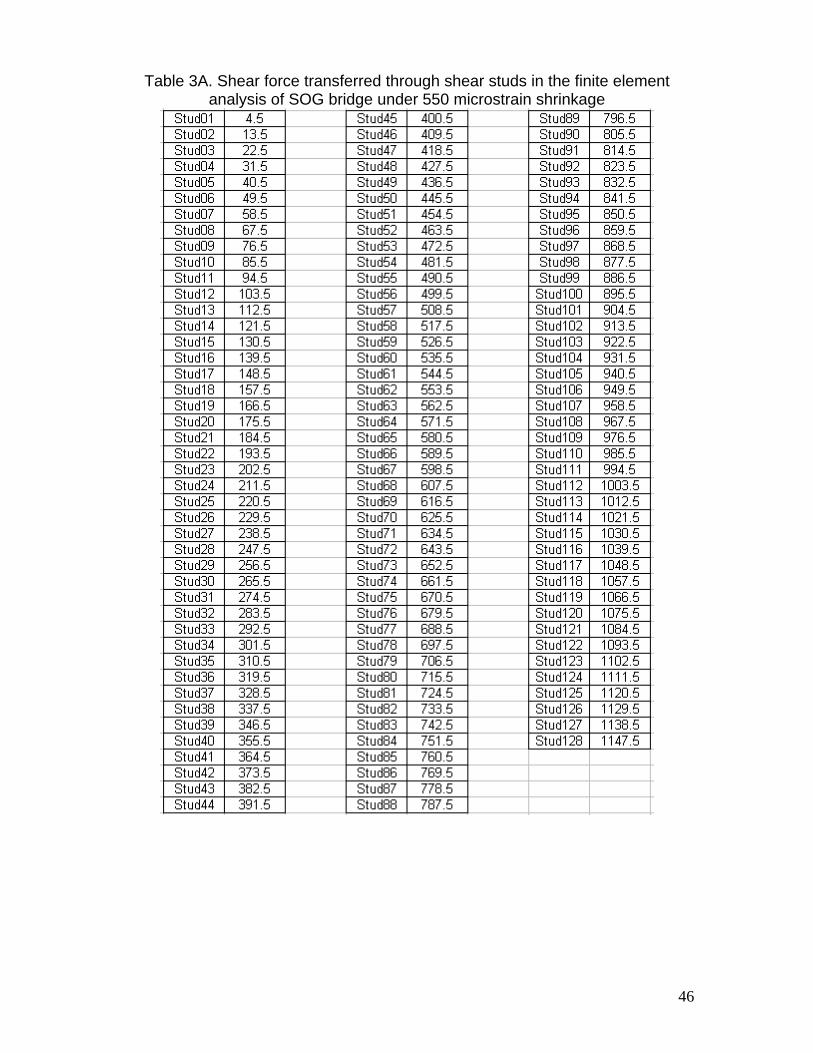
46
Table 3A. Shear force transferred through shear studs in the finite element analysis of SOG bridge under 550 microstrain shrinkage

47
Table 4A. Shrinkage readings for the normal-strength concrete Readings
Date of reading
Elapsed Time (day) Specimen
#1 Specimen
#2 Specimen
#3
Free Shrinkage of NSC (%)
11/19/2008 0 0.3761 0.1892 0.3056 0 11/20/2008 1 0.3801 0.1932 0.3096 0.011 11/22/2008 3 0.3853 0.1984 0.3148 0.0258 11/23/2008 4 0.3924 0.2055 0.3219 0.028 11/31/2008 12 0.4016 0.2147 0.3311 0.0448 12/17/2008 17 0.4120 0.2251 0.3415 0.0507 12/20/2008 20 0.4235 0.2366 0.353 0.0544 1/25/2009 56 0.4357 0.2488 0.3652 0.062
Table 5A. Shrinkage readings for the high-strength concrete Readings
Date of reading
Elapsed Time (day) Specimen
#1 Specimen
#2 Specimen
#3
Free Shrinkage of HSC (%)
4/18/2009 0 0.2769 0.5673 0.2298 0 4/20/2009 2 0.2781 0.5685 0.231 0.036 4/21/2009 3 0.2809 0.5713 0.2338 0.048 4/24/2009 6 0.2840 0.5744 0.2369 0.064 4/30/2009 12 0.2890 0.5794 0.2419 0.084 5/5/2009 17 0.2945 0.5849 0.2474 0.094 5/16/2009 28 0.3005 0.5909 0.2534 0.105 6/13/2009 56 0.3073 0.5977 0.2602 0.111