Regent Shanghai Pudong, Greater China Investor presentation
52
November 2020 © 2020 All Rights Reserved Proprietary and confidential – further reproduction or distribution is prohibited © 2020 All Rights Reserved Proprietary and confidential – further reproduction or distribution is prohibited Regent Shanghai Pudong, Greater China Investor presentation Post 2020 Q3 results
Transcript of Regent Shanghai Pudong, Greater China Investor presentation

November 2020 © 2020 All Rights Reserved Proprietary and confidential – further reproduction or distribution is prohibited© 2020 All Rights Reserved Proprietary and confidential – further reproduction or distribution is prohibited
Regent Shanghai Pudong, Greater China
Investor presentationPost 2020 Q3 results

November 2020 © 2020 All Rights Reserved Proprietary and confidential – further reproduction or distribution is prohibited
Cautionary note regarding forward-looking statements
This presentation may contain projections and forward looking statements. The words “believe”, “expect”,
“anticipate”, “intend” and “plan” and similar expressions identify forward-looking statements. All statements other
than statements of historical facts included in this presentation, including, without limitation, those regarding the
Company’s financial position, potential business strategy, potential plans and potential objectives, are forward-looking
statements. Such forward-looking statements involve known and unknown risks, uncertainties and other factors
which may cause the Company’s actual results, performance or achievements to be materially different from any
future results, performance or achievements expressed or implied by such forward-looking statements. Such
forward-looking statements are based on numerous assumptions regarding the Company’s present and future
business strategies and the environment in which the Company will operate in the future. Further, certain
forward-looking statements are based upon assumptions of future events which may not prove to be accurate.
The forward-looking statements in this document speak only as at the date of this presentation and the Company
assumes no obligation to update or provide any additional information in relation to such forward-looking statements.
The merits or suitability of investing in any securities previously issued or issued in future by the Company for
any investor’s particular situation should be independently determined by such investor. Any such determination
should involve, inter alia, an assessment of the legal, tax, accounting, regulatory, financial, credit and other
related aspects of the transaction in question.
2

November 2020 © 2020 All Rights Reserved Proprietary and confidential – further reproduction or distribution is prohibited
Strong portfolio of preferred brands, geographically diverse and asset light
Luxury
3
Mainstream Upscale
Strong portfolio
of brands
Asset light and
geographically
diverse
Franchised69%
Managed30%
Owned, Leased & Managed
Leases1%
Total
rooms:
890k
109k
38%
80k
28%
96k
34%
Pipeline
rooms:
286k
Mainstream
68%
Upscale
16%
Luxury
10%
Americas
EMEAA
Greater China
High quality fee
stream
~95% of profits from fee business
~80% of fee revenue linked to hotel revenues
~10% of fee revenue linked to hotel profits
Total
rooms:
890k
527k
59%
222k
25%
140k
16%
Total
rooms:
890k
November 2020 © 2020 All Rights Reserved Proprietary and confidential – further reproduction or distribution is prohibited
Procurement
Strength of brands
Strong loyalty and
enterprise contribution
Global Sales organisation
Technology Leadership
Investment in hotel lifecycle
management and operations
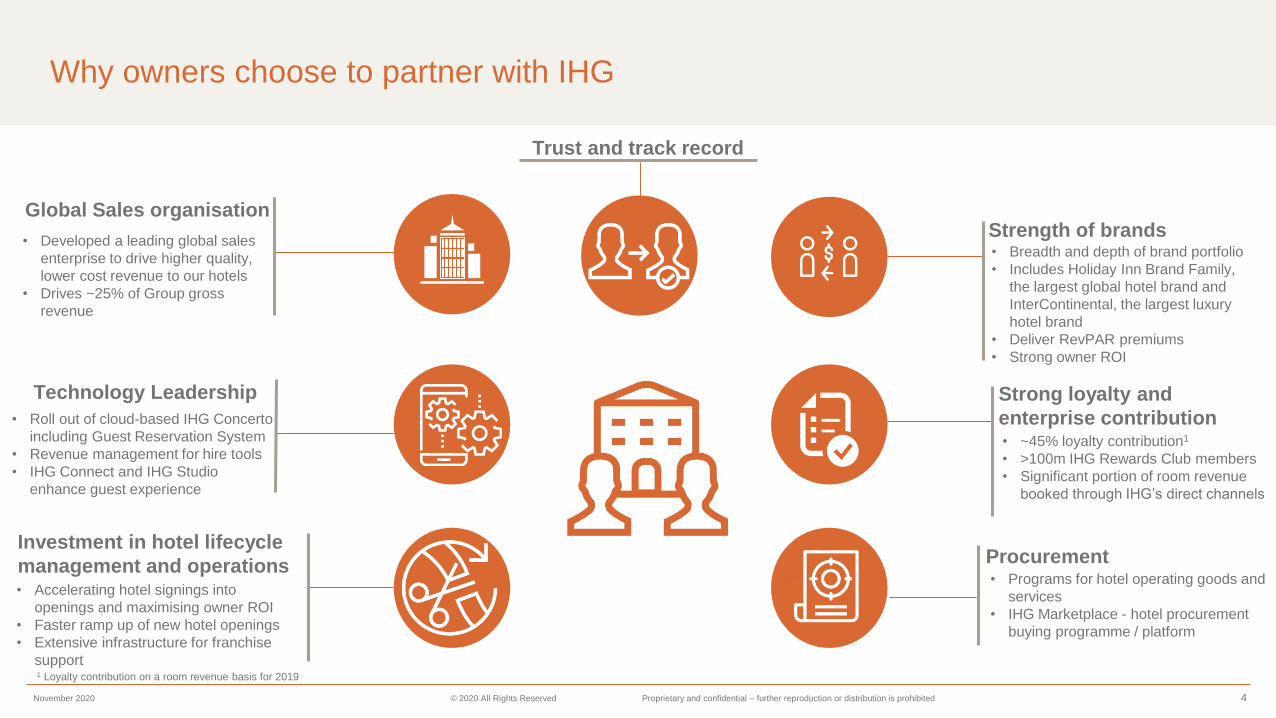
Why owners choose to partner with IHG
Trust
4
• Breadth and depth of brand portfolio
• Includes Holiday Inn Brand Family,
the largest global hotel brand and
InterContinental, the largest luxury
hotel brand
• Deliver RevPAR premiums
• Strong owner ROI
• ~45% loyalty contribution1
• >100m IHG Rewards Club members
• Significant portion of room revenue
booked through IHG’s direct channels
• Programs for hotel operating goods and
services
• IHG Marketplace - hotel procurement
buying programme / platform
• Accelerating hotel signings into
openings and maximising owner ROI
• Faster ramp up of new hotel openings
• Extensive infrastructure for franchise
support
• Roll out of cloud-based IHG Concerto
including Guest Reservation System
• Revenue management for hire tools
• IHG Connect and IHG Studio
enhance guest experience
• Developed a leading global sales
enterprise to drive higher quality,
lower cost revenue to our hotels
• Drives ~25% of Group gross
revenue
Trust and track record
1 Loyalty contribution on a room revenue basis for 2019

November 2020 © 2020 All Rights Reserved Proprietary and confidential – further reproduction or distribution is prohibited
Industry
IHG is well placed to capitalise on the long-term industry fundamentals
Shift to scale
brands
• Branded share2: 54% Open Rooms / 81% Pipeline
• Top 3 share2: 17% Open Rooms / 44% Pipeline
Growing
industry demand • Industry total revenue ↑ 5% CAGR1
• Attractive long-term structural growth drivers
• Near record absolute RevPAR in 2019
• Owners generating high ROI albeit against some
rising cost pressures
• Increasing demand for distinctive brands
• Integral to the entire guest journey
• Scale needed to support investment
Attractive
asset class
Consumer
trends shifting
Technology
IHG
Reallocated
resources• Embedded more effective regional structure
• Operating closer to market
Growing
market share• Accelerated net rooms growth from ~3% to 5.6%
in three years to 2019
• Continual innovation driving guest preference
• Cost effective build and operational prototypes
• Five new brands launched or acquired
• Targeting under-served segments
• Rolled out IHG Concerto across estate
• Enhanced Wi-Fi platform with IHG Connect
Strengthening
existing brands
Launched
new brands
Cloud-based
capabilities
1 Source: STR; 2016–19; 2 Source: STR census data; based on room share
• Increasingly informing guest preferences
• Scale helps owners seeking support Sustainability • Continuous focus on sustainable solutions
• Sustainability credentials facilitate owner needs
Responsible
Business focus
5

November 2020 © 2020 All Rights Reserved Proprietary and confidential – further reproduction or distribution is prohibited 6
Strong competitive position in an industry where branded players are gaining
market share
IHG has over 4% share of global
room supply
With a larger share of the active
pipeline
4.4%
10.9%
Share of global room supply Share of global active pipeline
In an industry where branded
players have gained share
19.8%
24.9%
2015 2019
Share of global room supply (%) IHG share of global rooms and
active pipeline (%)
Global share of top 5 branded
players
Source: STR
IHG is largely asset-light and weighted
towards mainstream select service~40% of IHG pipeline under construction
Strong conversion opportunity
potential to drive further share gains
7.2%
3.8%
75.3%
IHG
Marriott
Hilton
Wyndham
Other
Accor
5.1%
4.4%
4.2%

November 2020 © 2020 All Rights Reserved Proprietary and confidential – further reproduction or distribution is prohibited 7
IHG’s ~$1.4 bn1 System Fund supports our brand marketing
and our revenue delivery system
1For year ending December 2019
Marketing & Reservations
Assessment
~3.0% of gross rooms revenue
IHG Rewards Club Point Sales
~4.75% IHG Rewards Club bill
Advertising & Marketing
Distribution
(Reservation & Channels)
IHG Rewards Club
Other fees for value add services
e.g. pay for performance programmes
Brands Sources of Income Sources of Spend
Systems & Technology
November 2020 © 2020 All Rights Reserved Proprietary and confidential – further reproduction or distribution is prohibited 8
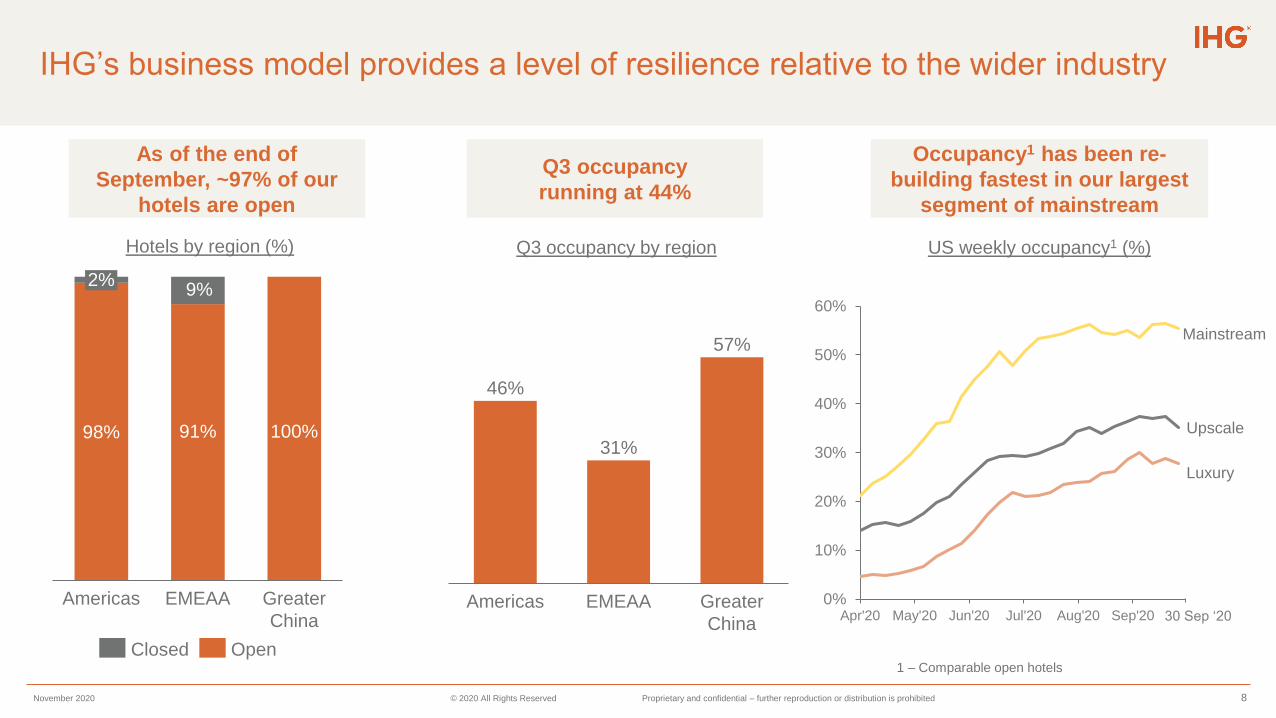
2%
EMEAA
98%
Americas
9%
91% 100%
Greater
China
Closed Open
Hotels by region (%)
As of the end of
September, ~97% of our
hotels are open
IHG’s business model provides a level of resilience relative to the wider industry
Q3 occupancy by region
Q3 occupancy
running at 44%
US weekly occupancy1 (%)
Occupancy1 has been re-
building fastest in our largest
segment of mainstream
46%
31%
57%
Greater
China
EMEAAAmericas
1 – Comparable open hotels
0%
10%
20%
30%
40%
50%
60%
Apr'20 May'20 Jun'20 Jul'20 Aug'20 Sep'20
Mainstream
Upscale
Luxury
30 Sep ‘20

November 2020 © 2020 All Rights Reserved Proprietary and confidential – further reproduction or distribution is prohibited 9
US rooms distribution
Mainstream, our largest
segment, is outpacing
overall industry RevPAR
Our mix places us well to benefit from the expected shape of demand recovery
Domestic travel is
leading the recovery
International
Domestic
Urban
Non Urban
Leisure
Groups
Business transient
Non-urban1 areas
strongly
outperforming urban
Groups is toughest
area of demand; IHG’s
lowest exposure
US demand mix US rooms distribution 2019 US guest stays
1Non-urban regions includes hotels located in small metro towns, suburban districts, interstate, airport and resort locations
84%
10%6%
Mainstream Upscale Luxury

November 2020 © 2020 All Rights Reserved Proprietary and confidential – further reproduction or distribution is prohibited 10
The Upper Midscale segment, which accounts for ~65% of our rooms in the
US, has historically recovered faster than other segments
-30.%
-25.%
-20.%
-15.%
-10.%
-5.%
0.%
5.%
10.%
15.%
198
8
198
9
199
0
199
1
199
2
199
3
199
4
199
5
199
6
199
7
199
8
199
9
200
0
200
1
200
2
200
3
200
4
200
5
200
6
200
7
200
8
200
9
201
0
201
1
201
2
201
3
201
4
201
5
201
6
201
7
201
8
201
9
Luxury Chains Upper Upscale Chains Upper Midscale Chains
Midscale Chains Economy Chains
US Industry Chain Scale RevPAR Change (12m rolling)US RevPAR Performance 2008 - 2015 (12m rolling)
Source: STR

November 2020 © 2020 All Rights Reserved Proprietary and confidential – further reproduction or distribution is prohibited
Shareholder returns 2003-19 ($bn)
Ordinary dividend progression 2014-2019 (¢ per share)
13.6
5.8
TotalAsset disposals Operational cash flows
7.9
Highly cash generative business, driving strong shareholder returns
• Strong cash flows driving consistent
shareholder returns
• Total returns of ~$13.6bn since
2003, ~40% from operations
• $2.4bn ordinary dividend
• $11.2bn additional returns
• Strong financial position:
• $2.75bn Bonds1
• $1.4bn RCF2
• $2.9bn available liquidity
1 Next bond maturity in November 2022 (£173m); 2 Maturity of the $1.35bn RCF extended by 18 months to September 2023; 3 2017 and 2018 Free Cash Flow Restated for the adoption of IFRS 16; 4 2019 final dividend recommendation withdrawn in
response to Covid-19
25 28 30 33 36 40
5258
6471
78
20172014 2018
77
2015
85
20192016
94104
114
40
+10% CAGR
Final Interim
11
321
466
551516
611
509
201720152014 20192016 2018
Strong free cash flow generation ($m)3
4

November 2020 © 2020 All Rights Reserved Proprietary and confidential – further reproduction or distribution is prohibited 12
Our commitment to operate a responsible business
Supporting our communities
through the crisis and beyond
Ensuring long-term environmental
resilience
Taking action to build a more
diverse & inclusive culture
• 2030 Science Based Target
• Task Force for Climate-related
Financial Disclosures
• Engaging in forums with other
business leaders and
governments
• Launch of new Americas D&I
commitments
• Creation of new ethnic diversity
network in Europe
• Developing a long term D&I
ambition for the Group
• Accommodation for the most
vulnerable in society
• Donation to food banks across
70+ countries
• Developing a new strategic
Communities approach
ESG
rankings
Responsible
business
credentials

November 2020 © 2020 All Rights Reserved Proprietary and confidential – further reproduction or distribution is prohibited 13
Q3 2020 and Covid-19 response

November 2020 © 2020 All Rights Reserved Proprietary and confidential – further reproduction or distribution is prohibited
Navigating the Covid-19 crisis effectively and responsibly
Q3 2020 Rooms & RevPAR H1 2020 Results
Focusing on growth
• Decisive cost action; robust liquidity and cash flow
• Providing support to owners to help keep hotels open, lower their costs and manage cash
• New operating procedures to protect colleagues and deliver guest safety
• Ensuring guests have confidence to stay with flexibility and rapid implementation of the IHG Clean Promise
Protecting the business
• 263 signings YTD (82 in Q3), 173 openings (82 in Q3)
• 27% signings from conversions, up from 20% last year
• ~40% of pipeline under construction; 43 ground breaks in Q3
• Leveraging investment in technology and loyalty
• Planning business recovery in a responsible way
• (83)% underlying H1 operating profit decline
• (90)% H1 adjusted EPS decline
• $(66)m H1 Free Cash Flow; broadly neutral FCF in Q2
(positive FCF in Q3)
• $2.1bn available liquidity at end September – rising to
$2.9bn on a PF basis for bonds repaid and issued
• 890k rooms (5,977 hotels), +2.9% net growth YoY
• Global RevPAR decline (53)% in Q3; (52)% YTD
• 97% of estate open as of 30th September
• Q3 occupancy ~44%, up from April trough ~20%
• RevPAR outperformance in key markets
14

November 2020 © 2020 All Rights Reserved Proprietary and confidential – further reproduction or distribution is prohibited 15
September 2020 US Occupancy distribution by brand segment (% of estate)
Americas – US
Our weighting to mainstream has helped drive market outperformance
US Industry IHG Weighted Segments Holiday Inn Express
IHG1 Industry2
Q3 2020 US RevPAR change – IHG vs industry (%)
1 Includes the adverse impact of hotels temporarily closed as a result of Covid-19. 2 Industry data per STR, which excludes hotels that have been closed for >1 month
10% 8%
39%46%
30%29%
35%
41%60% 63%
26%
13%
Total Mainstream Premium Luxury
Occ: <30%Occ: 30% - 50%Occ: >50%
-47% -47%
-38%
-49% -50%
-42%

November 2020 © 2020 All Rights Reserved Proprietary and confidential – further reproduction or distribution is prohibited
Colleagues Cost reduction
Liquidity and cash flow
Guests
Communities
IHG’s response to the Covid-19 pandemic
Trust
• Up to $150m cost reduction in
Fee Business
• ~50% sustainable into 2021
• System Fund cost base reduced
• $2.9bn available liquidity
• Cash preservation and
disciplined working capital
management
• New operating procedures for
frontline colleagues
• Support services to those affected by
job losses
• Aiding flexible and remote working
• Accommodation to frontline
workers
• Partnership with aid
organisations to fund
disaster relief
• Enable IHG Rewards Club
members to donate points
• Flexible cancellation policy
• Protecting membership
status of IHG Rewards
Club members
• Global IHG Clean Promise
Owners
• Temporary fee relief
• Relaxation of brand
standards
• Operational support
• Government advocacy
16

November 2020 © 2020 All Rights Reserved Proprietary and confidential – further reproduction or distribution is prohibited 17
Owners: the value of our rapid response, system scale and ongoing operating
and technology developments
Immediate support
Brand
standards
• Temporary relaxation of brand standards
• Help owners protect cash flow
Fee
relief
• Temporary discount on fees including
technology and System Fund
assessments
• Allow owners to manage cash flow
through utilisation of maintenance
reserves
• Support with closing and re-opening hotels
• Flexing operations and reducing costs
• Secure broader government support
• Help owners access government schemes
Cash
Flow
Operational
advice
Government
advocacy
• Enhanced demand driver mapping
• Coordinated Covid-related demand
Maximising
demand
Leveraging our scale
Payment
flexibility
• Case-by-case consideration of payment
plans
Procurement • Supporting supplier negotiations
• Scale leverage to secure improved terms
• Enhancement of IHG Way of Clean
• Introduction of new operating procedures
• Automating front desk operations such as
Contactless Check-in
• New Owner Engagement Portal
• Enhancement to revenue management
services
• Loyalty and mobile developments
Safety
standards
IHG
Concerto
Technology
development
• Reducing carbon footprint in line with our
Science Based Target
• Strengthened Diversity & Inclusion focus
Responsible
business focus

November 2020 © 2020 All Rights Reserved Proprietary and confidential – further reproduction or distribution is prohibited 18
Guests: the value of our branded flexibility and “stay safe” peace of mind
Immediate support
Loyalty
• Protected membership status
• Paused point expiry until end of year
• Reduced Elite status qualification
requirements
Cancellation
fees• Waived from the onset of the crisis
Leveraging our scale
Cleanliness &
Safety
• IHG Clean Promise
• Mobile check-in and check-out
Booking
flexibility• Extension of Book Now, Pay Later policies
• WebEx for 1,500 Corporate Travel
Managers to update on Covid-19
response
Global
Sales
• Providing corporate bookers with greater
flexibility
• Enhanced approach to health and safety
Meet with
Confidence
Personalisation• Targeted campaigns for individual guests
• Engagement and click through rate
doubled
• IHG’s Guest Satisfaction Index1 has been
net positive every month
• Each month showing sequential
improvement
Guest
satisfaction
Cleanliness &
Safety
• IHG Clean Promise
• Face coverings in Americas
• IHG’s Heroes room rate for key workers
• Key worker leisure rate introduced
Promotional
activity
1 Guest Satisfaction Index (GSI) is an IHG metric that uses third party aggregated social media review data to benchmark IHG guest satisfaction performance against that of our competitors

November 2020 © 2020 All Rights Reserved Proprietary and confidential – further reproduction or distribution is prohibited
Cleaning standards developed with industry-leading experts to enhance guest
safety and reassurance
InterContinental Mark Hopkins, San Francisco, United States
• New global standard of hotel cleanliness and hygiene
• Science-led protocols developed with the Cleveland Clinic, Ecolab and Diversey
• Provide assurance throughout the guest experience e.g. sanitiser stations, social distance floor markers, grab-and-go breakfast options
• Working with scientific advisors to determine appropriate new technologies to pilot
• Innovating food and beverage to incorporate new operating procedures, social distancing, contactless room service
• Protecting hotel colleagues with standards on PPE, installing shields at front desk, training and certification
• Supported by a new verification procedure
Over 30% uplift in percentage of positive third-party social review comments on cleanliness from guests following
launch of the IHG Clean Promise
Strengthening IHG Way of Clean
19
November 2020 © 2020 All Rights Reserved Proprietary and confidential – further reproduction or distribution is prohibited
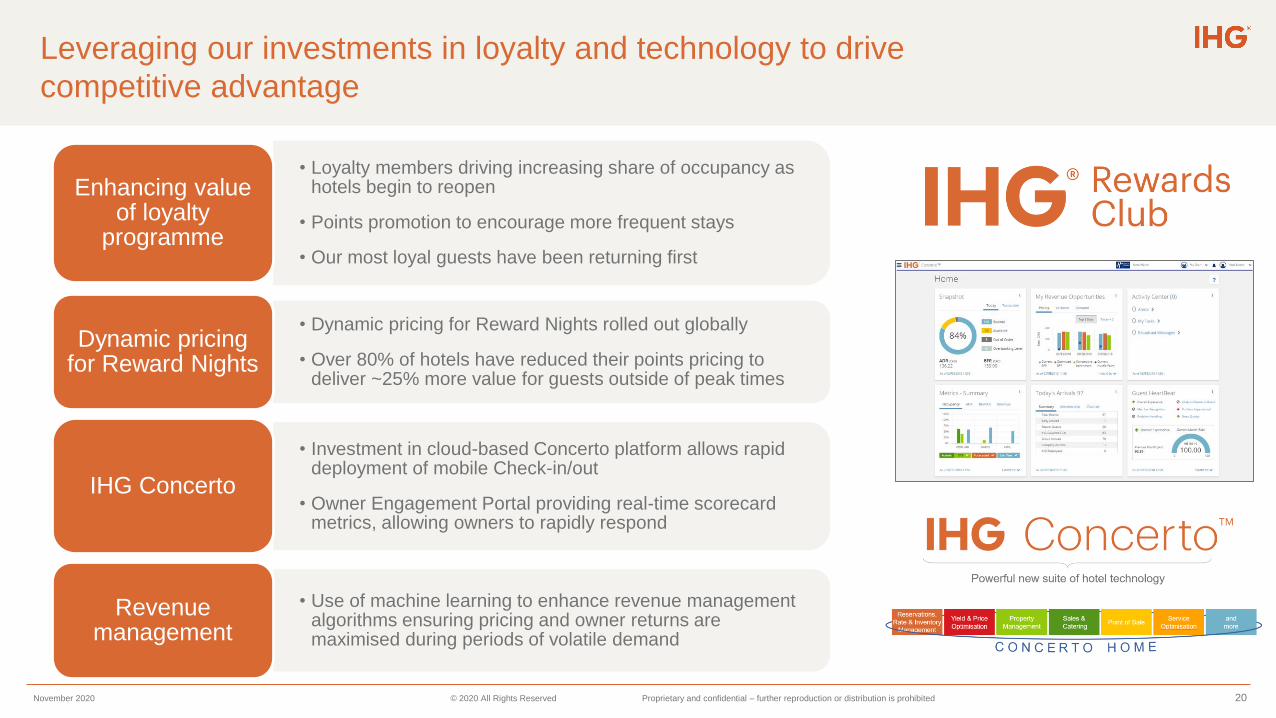
Leveraging our investments in loyalty and technology to drive
competitive advantage
• Loyalty members driving increasing share of occupancy as hotels begin to reopen
• Points promotion to encourage more frequent stays
• Our most loyal guests have been returning first
Enhancing value of loyalty
programme
• Dynamic pricing for Reward Nights rolled out globally
• Over 80% of hotels have reduced their points pricing to deliver ~25% more value for guests outside of peak times
Dynamic pricing for Reward Nights
• Investment in cloud-based Concerto platform allows rapid deployment of mobile Check-in/out
• Owner Engagement Portal providing real-time scorecard metrics, allowing owners to rapidly respond
IHG Concerto
• Use of machine learning to enhance revenue management algorithms ensuring pricing and owner returns are maximised during periods of volatile demand
Revenue management
20

November 2020 © 2020 All Rights Reserved Proprietary and confidential – further reproduction or distribution is prohibited 21
Measures to reduce costs, preserve cash and maintain liquidity
Cost actions and cash preservation
• On track to achieve ~$150m of fee business cost savings
in 2020, driven by salaries and wages reductions and
challenges to discretionary spend
• Targeting for ~50% of cost savings to be sustainable
beyond 2020, alongside continued investment in growth
initiatives
• Scaling down marketing spend across the System Fund,
reflecting lower levels of assessment income
• Taken cost containment action across our owned, leased
and managed lease hotels, with ~$130m overall
reduction to the cost base in H1
• Targeting a FY2020 reduction in gross capex of ~$100m
over FY2019
Liquidity profile
• ~$2.9bn of available liquidity at end September on PF
basis following bonds subsequently issued and repaid
• Secured covenant waivers over $1.35bn syndicated and
bilateral RCF until December 2021
• Extended maturity of our $1.35bn RCF by 18 months until
September 2023
• Issued £600m of commercial paper under UK
Government’s CCFF
• Have a staggered bond maturity profile, with next bond
maturity in November 2022 (£173m)

November 2020 © 2020 All Rights Reserved Proprietary and confidential – further reproduction or distribution is prohibited
• Decisive action taken to manage through Covid-19 crisis effectively and responsibly to protect our stakeholders
• Domestic mainstream demand returning first, with group and international travel taking more time
• Near-term outlook remains uncertain and the time period for market recovery is unknown
• Well placed with our industry-leading mainstream presence, and predominantly domestically-focused business
• Leveraging the benefit of our scale and strength of brands for owners and guests
• We have continued to sign and open new hotels, underscoring the confidence owners have in our system and brands
• The industry continues to have attractive structural growth drivers and IHG’s cash-generative, resilient fee-based
model, gives us confidence to emerge strongly when markets recover
Conclusions
22

November 2020 © 2020 All Rights Reserved Proprietary and confidential – further reproduction or distribution is prohibited 23
Optimise our preferred portfolio of brands for
owners & guests

November 2020 © 2020 All Rights Reserved Proprietary and confidential – further reproduction or distribution is prohibited
Our brand portfolio
- Breadth and depth of brand portfolio will drive future growth
Mainstream Upscale LuxuryE
sta
blis
hed
Bra
nd
s
Q3 hotel openings/signings 62/57 14/17 6/8
% of Q3 signings that are
conversions 25% 28% 11%
New
Bra
nd
s
24
Mainstream Upscale Luxury

November 2020 © 2020 All Rights Reserved Proprietary and confidential – further reproduction or distribution is prohibited 25
Mainstream1 Upscale Luxury
IHG’s New
Offering
Owner
Opportunity
• New build only
• Select service model
• Attractive returns enabled
by an efficient operating
model
• New build led
• Focused service model
• Attractive returns enabled
by an efficient operating
model
• Existing hotel owners
• Access to IHG systems
and revenue delivery
• Ideal for conversions
• New build and
conversions
• High-end specification
• Sizeable returns per
asset
• New build and
conversions
• Premium asset locations
• Sizeable returns per
asset
Guest
Opportunity
• The basics done
exceptionally well at a
price point ~$10-15 less
than Holiday Inn Express
• Streamlined and efficient
design
• Stylish experiences and
functional benefits at
mainstream price
• Options and flexibility for
longer stay guests
• Hotels connected by their
individual characters,
making memorable travel
dependable
• Top tier luxury offering
catering to our most
sophisticated guests
• Top tier luxury, leisure
focused offering
• World renowned, resort
locations
• Reputation for wellness
and sustainability
IHG’s
Competitive Offer
Industry leading midscale
brand expertise
Track record of delivery with
longer stay brands
Industry leading revenue
management & reservation
tools, strong B2B offer and
loyalty programme
Operator of largest global
Luxury brand2
Operator of largest global
Luxury brand2
Crite
ria
1. Mainstream classified as Midscale and Upper-Midscale; 2. As per STR data
Categories
Optimising our brand portfolio
- we have taken a strategic approach to identify opportunities
November 2020 © 2020 All Rights Reserved Proprietary and confidential – further reproduction or distribution is prohibited
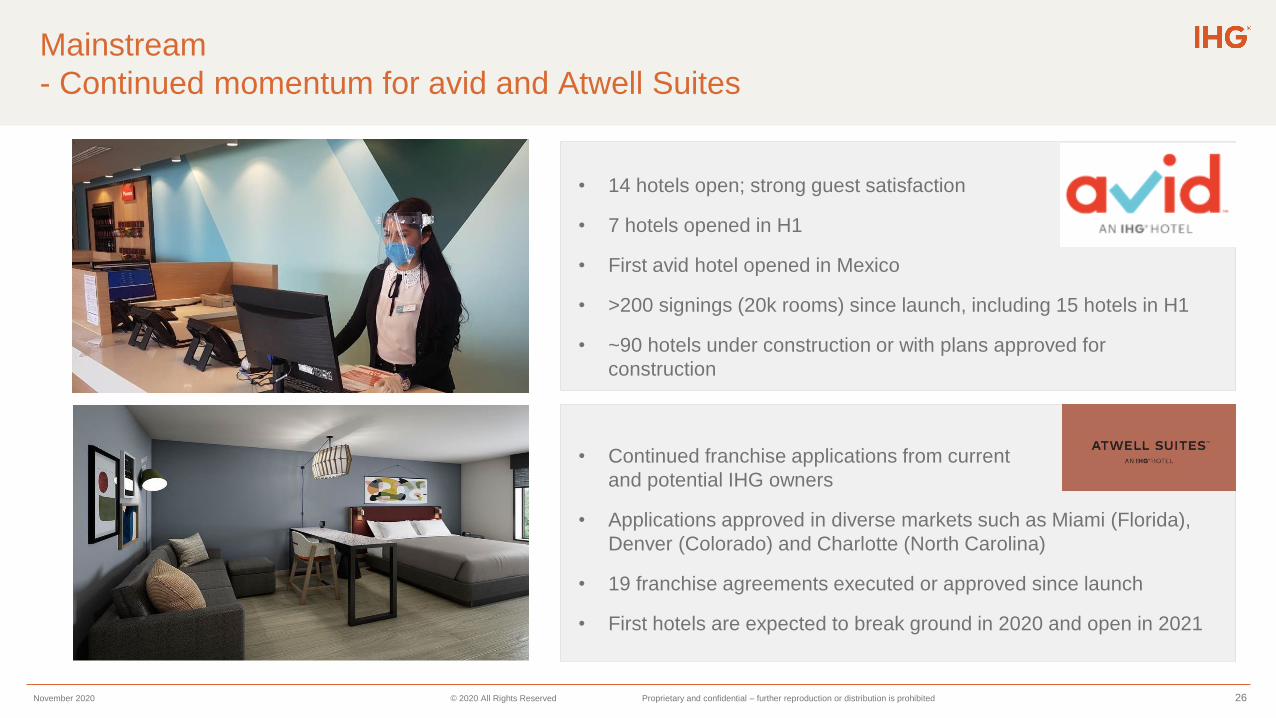
• 14 hotels open; strong guest satisfaction
• 7 hotels opened in H1
• First avid hotel opened in Mexico
• >200 signings (20k rooms) since launch, including 15 hotels in H1
• ~90 hotels under construction or with plans approved for
construction
• Continued franchise applications from current
and potential IHG owners
• Applications approved in diverse markets such as Miami (Florida),
Denver (Colorado) and Charlotte (North Carolina)
• 19 franchise agreements executed or approved since launch
• First hotels are expected to break ground in 2020 and open in 2021
Mainstream
- Continued momentum for avid and Atwell Suites
26
PIC

November 2020 © 2020 All Rights Reserved Proprietary and confidential – further reproduction or distribution is prohibited 27
Upscale
- Global expansion of voco to Americas and Greater China
voco Melbourne Central, Australia (due to open Q1 2021)
voco Hangzhou Minghao Bingjiang, Greater China (due to open Q3 2020)voco Paris Montparnasse, France (due to open Q3 2020)
• Signed 40 hotels since launch in June 2018
• Attractive option for the conversion of high-quality individual and
locally-branded hotels; numerous new-build opportunities
• Simplified hotel conversion process
• Following success of 36 open and pipeline hotels in EMEAA,
expansion of brand to Americas and Greater China
• First signings in Greater China in June
• Strong owner interest in the Americas with key signings in
landmark locations such as New York and Florida

November 2020 © 2020 All Rights Reserved Proprietary and confidential – further reproduction or distribution is prohibited 28
Continued signings across our luxury brands
InterContinental Grand Pacific Hotel, Fiji (due to open in 2022) Kimpton Shanghai New Bund, Greater China (due to open in 2023)
Regent Shanghai Pudong, Greater China (signed and opened in H1) Six Senses Antognolla, Italy (due to open in 2023)

November 2020 © 2020 All Rights Reserved Proprietary and confidential – further reproduction or distribution is prohibited 29
Strengthen Loyalty Programme
& Enhance Revenue Delivery

November 2020 © 2020 All Rights Reserved Proprietary and confidential – further reproduction or distribution is prohibited
Enhance revenue delivery
- Investment in technology and global sales driving low cost revenue for our owners
IHG’s revenue
delivery
enterprise
Global sales organisation • Centralised corporate negotiations
• Driving higher quality, lower cost
revenue to our hotels
IHG Connect• Implemented or being installed in
>4,500 hotels
• Driving Guest Love uplifts of >14%pts
Enhancements to GRS• Piloting attribute pricing functionality for
Guest Reservation System
• Trials commencing through H1 2020
Digital check out• Accounted for ~$5.6bn of revenue,
up 7% in 2019
Revenue Management for Hire• Adopted in >3,500 hotels
• Driving RGI uplift
OTAs• Renegotiated more favourable
terms on behalf of our owners
IHG Studio• New digital in-room entertainment solution
• Implemented or being installed in >100
hotels
IHG Mobile• App downloads up 11%, with $1.5bn
app revenue, up 18% YoY
• JD Power Best App award in 2019
30

November 2020 © 2020 All Rights Reserved Proprietary and confidential – further reproduction or distribution is prohibited
IHG Concerto™
- initial phase of rollout now complete
• IHG Concerto is our proprietary cloud based, hotel
technology platform
• Initial functionality is now live across all our 5,900+ hotels
• Includes our new Guest Reservations System, developed in
partnership with Amadeus
• Comprises industry-leading, plug and play architecture
• Gives IHG the flexibility to adapt to market demands
31
Today Future
Arrival, Departure,
Guest Folio
Management
Service Delivery
& OptimisationOwner Portal and more
Dashboard &
Insights
Reservations,
Rate & Inventory
Management
Yielding &
Price
Optimisation
Guest LoveEfficiencies
Industry
Leadership
Employee
Satisfaction
PerformanceScalability
Competitive
advantage

November 2020 © 2020 All Rights Reserved Proprietary and confidential – further reproduction or distribution is prohibited 32
Guest Reservation System
- Piloting enhanced functionality, including attribute pricing
From:
Hidden value To:
Highlighted value
King
Quiet Zone
+$
High floor
+$$
Ocean View
+$$$
Executive
$$$
King
+$
Room rate: $150+ Room rate: $150
Illustrative only Illustrative only
• The next phase for our GRS will involve
developing and piloting attribute
pricing
• At present, guests are typically offered a
choice of room type when making a
booking
• Attribute pricing will instead allow guests
to choose rooms based on specific
attribute type
• This will give guests a much greater
opportunity to customise their stay
• It will also give owners the ability to
unlock value through optimising pricing
for desirable attributes
• Functionality will only be available to
guests who book direct through IHG
channels

November 2020 © 2020 All Rights Reserved Proprietary and confidential – further reproduction or distribution is prohibited
Appendices
November 2020 © 2020 All Rights Reserved Proprietary and confidential – further reproduction or distribution is prohibited
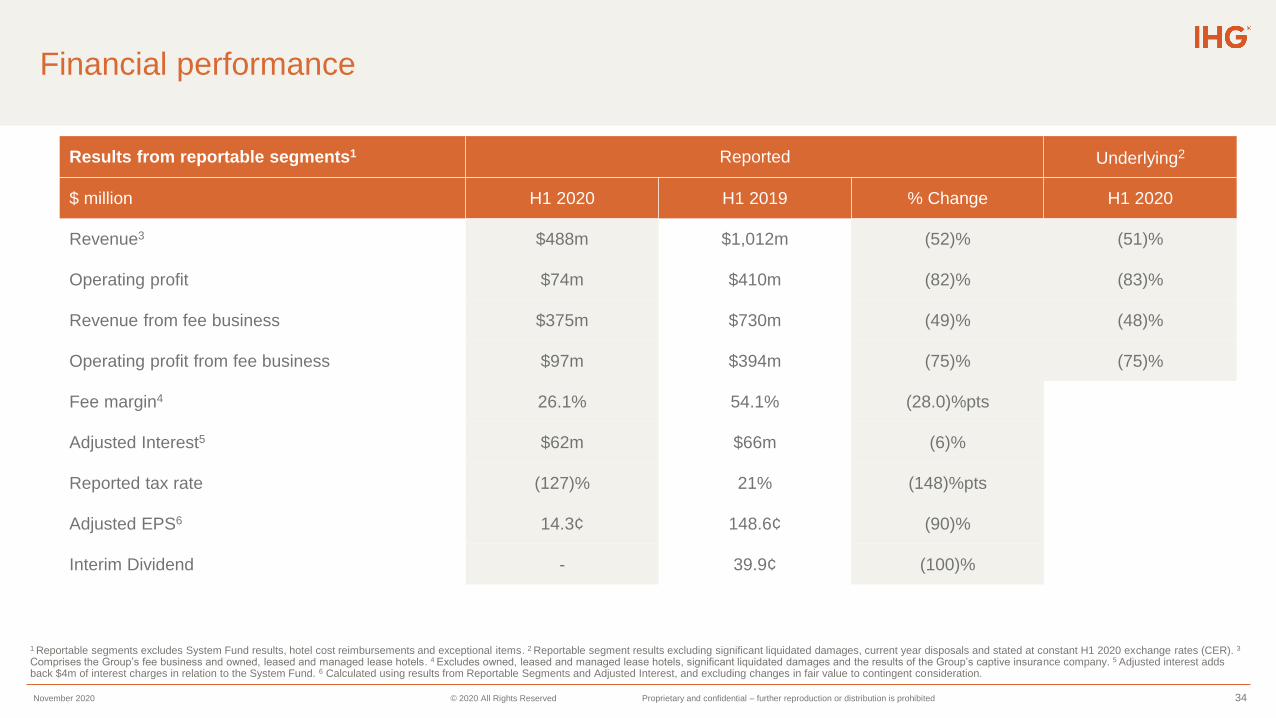
1 Reportable segments excludes System Fund results, hotel cost reimbursements and exceptional items. 2 Reportable segment results excluding significant liquidated damages, current year disposals and stated at constant H1 2020 exchange rates (CER). 3
Comprises the Group’s fee business and owned, leased and managed lease hotels. 4 Excludes owned, leased and managed lease hotels, significant liquidated damages and the results of the Group’s captive insurance company. 5 Adjusted interest adds back $4m of interest charges in relation to the System Fund. 6 Calculated using results from Reportable Segments and Adjusted Interest, and excluding changes in fair value to contingent consideration.
Results from reportable segments1 Reported Underlying2
$ million H1 2020 H1 2019 % Change H1 2020
Revenue3 $488m $1,012m (52)% (51)%
Operating profit $74m $410m (82)% (83)%
Revenue from fee business $375m $730m (49)% (48)%
Operating profit from fee business $97m $394m (75)% (75)%
Fee margin4 26.1% 54.1% (28.0)%pts
Adjusted Interest5 $62m $66m (6)%
Reported tax rate (127)% 21% (148)%pts
Adjusted EPS6 14.3¢ 148.6¢ (90)%
Interim Dividend - 39.9¢ (100)%
Financial performance
34
November 2020 © 2020 All Rights Reserved Proprietary and confidential – further reproduction or distribution is prohibited
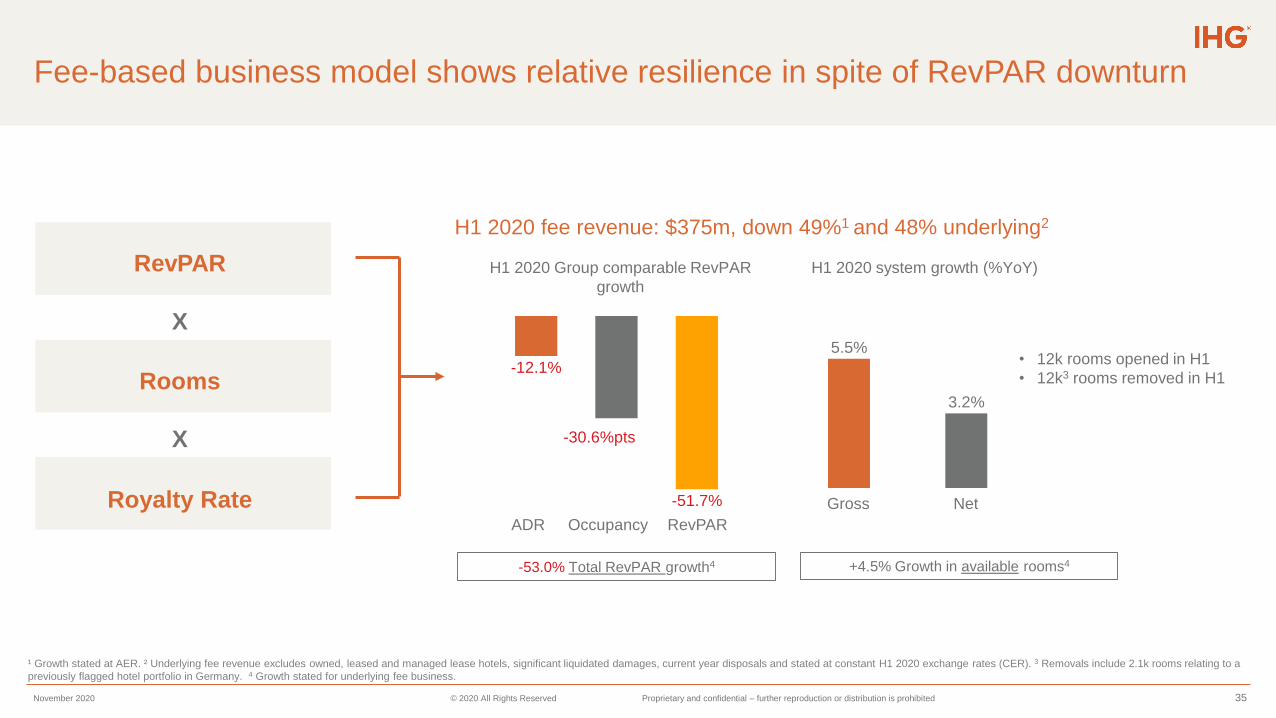
H1 2020 fee revenue: $375m, down 49%1 and 48% underlying2
• 12k rooms opened in H1
• 12k3 rooms removed in H1
H1 2020 Group comparable RevPAR
growth
H1 2020 system growth (%YoY)
5.5%
3.2%
NetGross
-12.1%
-51.7%
ADR Occupancy RevPAR
Fee-based business model shows relative resilience in spite of RevPAR downturn
RevPAR
Rooms
Royalty Rate
X
X
+4.5% Growth in available rooms4-53.0% Total RevPAR growth4
35
-30.6%pts
¹ Growth stated at AER. ² Underlying fee revenue excludes owned, leased and managed lease hotels, significant liquidated damages, current year disposals and stated at constant H1 2020 exchange rates (CER). 3 Removals include 2.1k rooms relating to a
previously flagged hotel portfolio in Germany. 4 Growth stated for underlying fee business.

November 2020 © 2020 All Rights Reserved Proprietary and confidential – further reproduction or distribution is prohibited
Growth rate analysis
RevPAR growth % Net rooms growth %Underlying Fee
Revenue1 Growth %Comments
H1 2020 Comparable Total2 YoY Available2
Hotels that have
traded in all
months being
compared (i.e.
steady state)
All hotels
that were open
in H1 2020 and
H1 2019 (incl
hotels that are
ramping up)
30 June 2020
vs 2019
Aggregate
number of
rooms available
for sale in
H1 2020 vs
H1 2019
Americas (47.6)% (47.6)% 1.7% 2.7% (45.7)%
EMEAA (58.9)% (59.0)% 2.9% 3.8% (62.9)%
Greater
China(61.7)% (65.1)% 9.9% 13.5% (71.9)%
• Total RevPAR impacted by number of properties in ramp up
and openings in less developed cities
• Fee revenue growth impacted by lower levels of incentive
management fee income
Total (51.7)% (52.6)% 3.2% 4.5% (47.9)%
1 Underlying fee revenue and excludes owned, leased and managed lease hotels, significant liquidated damages, current year disposals, System Fund results and hotel cost reimbursements at constant H1 2020 exchange rates (CER).2 Underlying fee business Total RevPAR and Available rooms.
36

November 2020 © 2020 All Rights Reserved Proprietary and confidential – further reproduction or distribution is prohibited
Americas
Q2 US RevPAR outperformance in the weighted segments in which we compete
5(6)
Exits
525
FY 2019 Openings H1 2020
523
H1 2020 Growth in fee revenue drivers1
H1 2020 Net rooms growth (‘000s)
• YoY net rooms growth 1.7% (gross: up 3.9%)
- Development continuing with >30 ground breaks in Q2
• Pipeline: 116k rooms; 9k signed
• Signings include 15 avid and 7 Atwell Suites hotels
• Underlying fee revenue1 down 46%, underlying fee operating profit2 down 49%:
- Impact from higher levels of temporary hotel closures in US managed estate
partially offset by fee business cost savings, a $4m payroll tax credit benefit and a
$4m litigation settlement benefit
• Owned, leased and managed lease profit down $31m to a loss of $10m, impacted by
the temporary closure of a number of hotels; results include a $4m benefit from
business interruption insurance
1 Underlying fee revenue excludes owned, leased and managed lease hotels, significant liquidated damages, current year disposals and stated at constant H1 2020 exchange rates (CER). 2 Underlying fee operating profit excludes owned, leased and
managed lease hotels, significant liquidated damages and current year disposals at constant H1 2020 exchange rates (CER). 3 Growth stated at CER.
• H1 Comparable RevPAR down 47.6%; US down 46.8%
• Q2 US RevPAR down 69.3%
- Franchised estate down 66% and Managed estate down 86%
- Upper Midscale and Extended Stay proving most resilient segments
-47.6%
1.7%
-45.9%
Comp. RevPAR Fee revenueNet rooms
37
• July RevPAR expected to be down ~54%; occupancy in comparable open hotels ~45%
• 97% of the estate open as of the end of the month

November 2020 © 2020 All Rights Reserved Proprietary and confidential – further reproduction or distribution is prohibited
Europe, Middle East, Asia and Africa
Challenging trading conditions with mandated closures and travel restrictions
H1 2020 Growth in fee revenue drivers1
H1 2020 Net rooms growth (‘000s)
• Comparable RevPAR down 58.9% (Q2 down 87.6%)
• UK down 59%; London down 63%; Provinces down 57%
• H1 trough in April, with small but sequential improvements through May and June
1 Underlying fee revenue excludes owned, leased and managed lease hotels, significant liquidated damages, current year disposals and stated at constant H1 2020 exchange rates (CER). 2 Underlying fee operating profit excludes owned,
leased and managed lease hotels, significant liquidated damages and current year disposals at constant H1 2020 exchange rates. (CER) 3 Growth stated at CER.
• YoY net rooms growth 2.9% (gross: up 5.6%)
• Removals include 2.1k rooms relating to a previously flagged hotel portfolio in
Germany
• Underlying fee revenue1 down 63% ($95m) and underlying fee operating profit2 down
$91m to a loss of $4m, impacted by lower incentive management fee income
• Owned, leased and managed lease loss3 increased $8m; hotel closures partially offset
by: significant cost reduction measures; rent reductions; $3m of disposal gains
• Rental payments relating to UK and German leased hotels now fully variable through
the income statement; no lease liability or right-of-use asset on the balance sheet
• Pipeline: 80k rooms; 4k signed
• Signings include 4 Hotel Indigo, 4 InterContinental and 2 Six Senses properties
3
Openings
(5)
FY 2019 Exits H1 2020
223
221
-58.9%
2.9%
-63.9%
Comp. RevPAR Fee revenue1Net rooms
38
• July RevPAR expected to be down ~74%; occupancy in comparable open hotels >30%
• 84% of the estate open as of the end of the month
November 2020 © 2020 All Rights Reserved Proprietary and confidential – further reproduction or distribution is prohibited
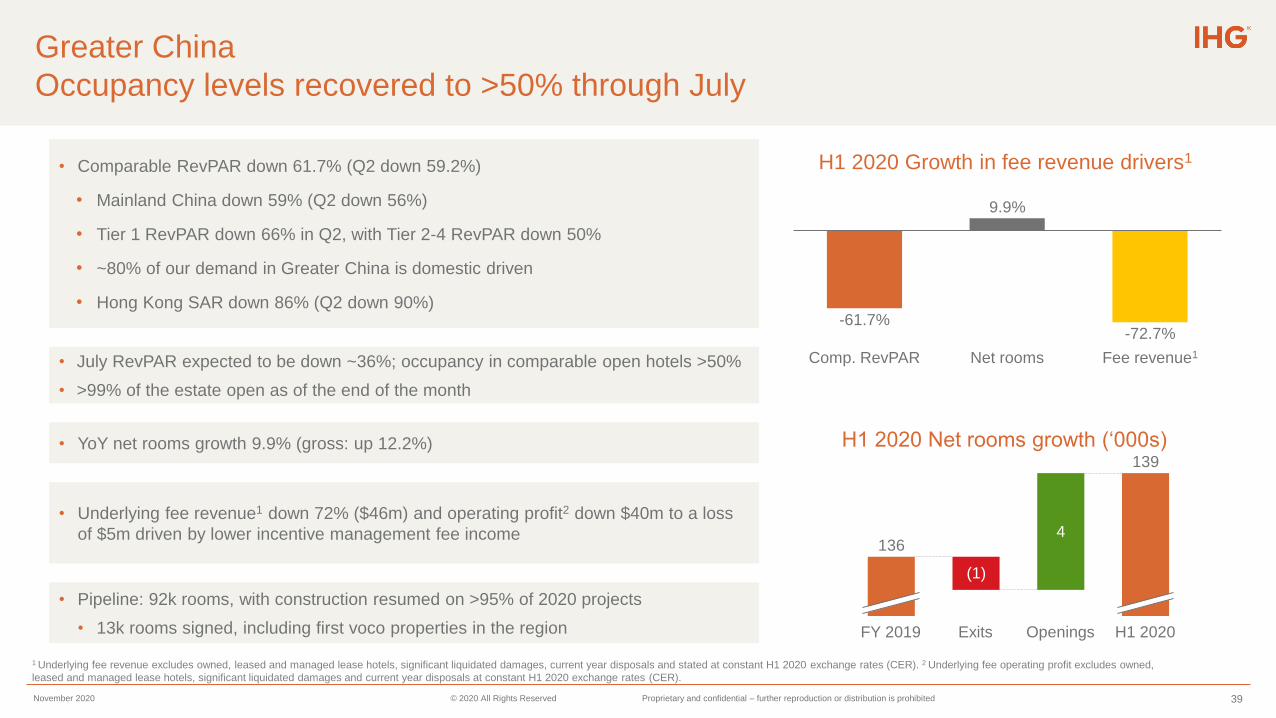
Greater China
Occupancy levels recovered to >50% through July
H1 2020 Growth in fee revenue drivers1
H1 2020 Net rooms growth (‘000s)
4
FY 2019 Openings
(1)
Exits H1 2020
136
139
1 Underlying fee revenue excludes owned, leased and managed lease hotels, significant liquidated damages, current year disposals and stated at constant H1 2020 exchange rates (CER). 2 Underlying fee operating profit excludes owned,
leased and managed lease hotels, significant liquidated damages and current year disposals at constant H1 2020 exchange rates (CER).
• Comparable RevPAR down 61.7% (Q2 down 59.2%)
• Mainland China down 59% (Q2 down 56%)
• Tier 1 RevPAR down 66% in Q2, with Tier 2-4 RevPAR down 50%
• ~80% of our demand in Greater China is domestic driven
• Hong Kong SAR down 86% (Q2 down 90%)
• YoY net rooms growth 9.9% (gross: up 12.2%)
• Underlying fee revenue1 down 72% ($46m) and operating profit2 down $40m to a loss
of $5m driven by lower incentive management fee income
• Pipeline: 92k rooms, with construction resumed on >95% of 2020 projects
• 13k rooms signed, including first voco properties in the region
-61.7%
9.9%
-72.7%
Comp. RevPAR Net rooms Fee revenue1
39
• July RevPAR expected to be down ~36%; occupancy in comparable open hotels >50%
• >99% of the estate open as of the end of the month

November 2020 © 2020 All Rights Reserved Proprietary and confidential – further reproduction or distribution is prohibited
Fee margin1 by region
Americas Europe, Middle East, Asia and Africa
Greater China Total IHG
1 Fee margin excludes owned, leased and managed lease hotels, significant liquidated damages and the results of the Group’s captive insurance company; is stated at AER. 2 H1 2019 fee margin updated to exclude the results of the Group’s captive
insurance company.
72.1%
77.3%
H1 2020
H1 20192
-7.1%H1 2020
H1 20192 57.8%
-27.8%
54.5%
H1 2020
H1 20192
26.1%
54.1%
H1 2020
H1 20192
40

November 2020 © 2020 All Rights Reserved Proprietary and confidential – further reproduction or distribution is prohibited 41
Exceptional Items
Category Detail Rationale Charge ($m)
Impairment
Property, plant and equipment• Carrying book value of owned, leased and managed leased assets in the Americas and
EMEAA(85)
Intangible assets • Acquired open and pipeline management agreements (47)
Trade deposits and loans • Discounted value of deposits and loans held by owners in connection to managed hotels (41)
Contract assets • Remaining undiscounted amount of trade deposits and loans (37)
Investment in associates• Stakes in associates held by IHG; shown net of a $13m fair value gain on a put option over
part of IHG’s investment in the New York Barclay associate(21)
Trade and other receivables • Impaired as a result of estimated expected credit losses arising from Covid-19 (22)
Right-of-use assets • Relates to the fixed element of an individual hotel lease agreement (5)
Cost of sales &
admin expenses
Derecognition of right of-use-assets• Resulting from leases now being recognised as fully variable
(49)
Derecognition of lease liabilities 71
Onerous expenditure provision • In respect of future contractual expenditure (10)
Reorganisation, acquisition and
integration costs• Relates to UK leased portfolio and Six Senses acquisition (7)
Provision for guarantees on 3rd
party debt• Commercially similar in nature to key money or trade deposits (2)
Total operating exceptional items (255)
Non-operating expenses: Fair value gains on contingent purchase consideration 21
Total exceptional items before tax (234)

November 2020 © 2020 All Rights Reserved Proprietary and confidential – further reproduction or distribution is prohibited 42
Exceptional Items: UK leased portfolio
• Leases now considered to be fully variable and so the
associated lease liabilities and right of use assets have been
derecognised from the balance sheet
• FY 2019 reported results benefited from charging $17m of rental
guarantee lease payments against the IFRS 16 liability held on
the balance sheet
• All remaining property, plant and equipment has been fully
impaired to nil
• Provision recognised against the estimated value of future
contractual expenditure
• Fair value adjustment to contingent purchase consideration
resulting in a reduction to the value of the liability to nil
H1 2020 Exceptional Items $m
Derecognition of right-of-use assets (22)
Derecognition of lease liabilities 40
Impairment of property, plant and equipment (50)
Provision for onerous contractual expenditure (10)
Reorganisation costs (4)
Fair value gains on contingent purchase
consideration21
Total (25)
Our total exceptional items before tax of $(234)m includes the below items in respect of the UK leased portfolio:

November 2020 © 2020 All Rights Reserved Proprietary and confidential – further reproduction or distribution is prohibited
2020 notable items
Significant items H1 2020 FY 2020
Payroll tax credits AMER $4m $11m
Litigation settlement in relation to a single hotel AMER $4m $4m
Individually significant Liquidated Damages1 EMEAA $1m $1m
Gain on disposal of Holiday Inn Melbourne Airport EMEAA $3m $3m
43
1 In February 2018, IHG received liquidated damages totalling $15m relating to the termination of a portfolio of 13 open hotels (2k rooms) and 6 pipeline hotels (1k rooms) in Germany, which exited IHG’s system in Q1 2020. Under IFRS15, the $15m was
recognised over the period from receipt until exit (H1 2018: $2.8m, FY 2018: $6.7m, FY 2019: $7.7m, H1 2020: $1.0m).

November 2020 © 2020 All Rights Reserved Proprietary and confidential – further reproduction or distribution is prohibited
Revenue & Operating Profit 2018-2019
2019 2018 2019 2018
Fee Business 853 853 663 638
Owned, Leased & Managed Leases 187 198 37 35
Total Americas 1,040 1,051 700 673
Fee Business 337 320 202 202
Owned, Leased & Managed Leases 386 249 15 4
Total EMEAA 723 569 217 206
Fee Business 135 143 73 70
Total Greater China 135 143 73 70
Central Results 185 170 (125) (117)
Total Reportable Segments 2,083 1,933 865 832
Reimbursement of Costs 1,171 1,171 - -
System Fund 1,373 1,233 (49) (146)
Total IHG 4,627 4,337 816 686
Full YearFull Year
Total Operating ProfitTotal Revenue *
**
44

November 2020 © 2020 All Rights Reserved Proprietary and confidential – further reproduction or distribution is prohibited
Free Cash Flow Generation
$m12 months to 31 Dec 2019
Restated for IFRS 16 Leases 12 months to 31 Dec 2018
Operating profit from reportable segments1 865 832
System Fund result2 (21) (99)
Depreciation & amortisation3 170 164
Working capital & other movements (82) 4
Loyalty programme deferred revenue net movement 52 124
Equity-settled share-based cost 42 38
Retirement benefit contributions, net of cost (3) (12)
Purchase of shares by employee share trusts (5) (3)
Cash flows relating to exceptional items4 (55) (137)
Net interest paid & similar charges (107) (85)
Tax paid5 (141) (66)
Principal element of lease payments (59) (35)
Capital expenditure: key money (net of repayments) (61) (54)
Capital expenditure: maintenance (86) (60)
Free cash flow 509 611
1. Before System Fund result and exceptional items.
2. System Fund result stated before exceptional cost of $28m (12 months to 31 December 2018 $47m) in relation to efficiency programme.
3. Includes System Fund depreciation & amortisation of $54m (12 months to 31 December 2018 $49m).
4. Includes $46m (12 months to 31 December 2018 $106m) relating to the efficiency programme ($28m in relation to the System Fund).
5. Excludes tax paid on disposals.
45

November 2020 © 2020 All Rights Reserved Proprietary and confidential – further reproduction or distribution is prohibited
Uses of Free Cash Flow
$m 12 months to 31 Dec 2019Restated for IFRS 16 Leases
12 months to 31 Dec 2018
Free cash flow 509 611
Capital expenditure: Recyclable investments (19) (38)
Capital expenditure: System Fund investment (98) (99)
Acquisitions (292) (34)
Payment of contingent purchase consideration (8) (4)
Distributions from associates and joint ventures - 32
Disposal receipts: Other 4 8
Tax paid – disposals - (2)
Ordinary dividend (211) (199)
Special dividend (510) -
Dividends paid to non-controlling interests (1) (1)
Currency swap proceeds - 3
Transaction costs relating to shareholder returns (1) -
Net cash inflow/(outflow) (627) 277
Exchange, lease repayments & other non-cash items (73) 11
Opening net debt (1,965) (2,253)
Closing net debt (2,665) (1,965)
46
November 2020 © 2020 All Rights Reserved Proprietary and confidential – further reproduction or distribution is prohibited
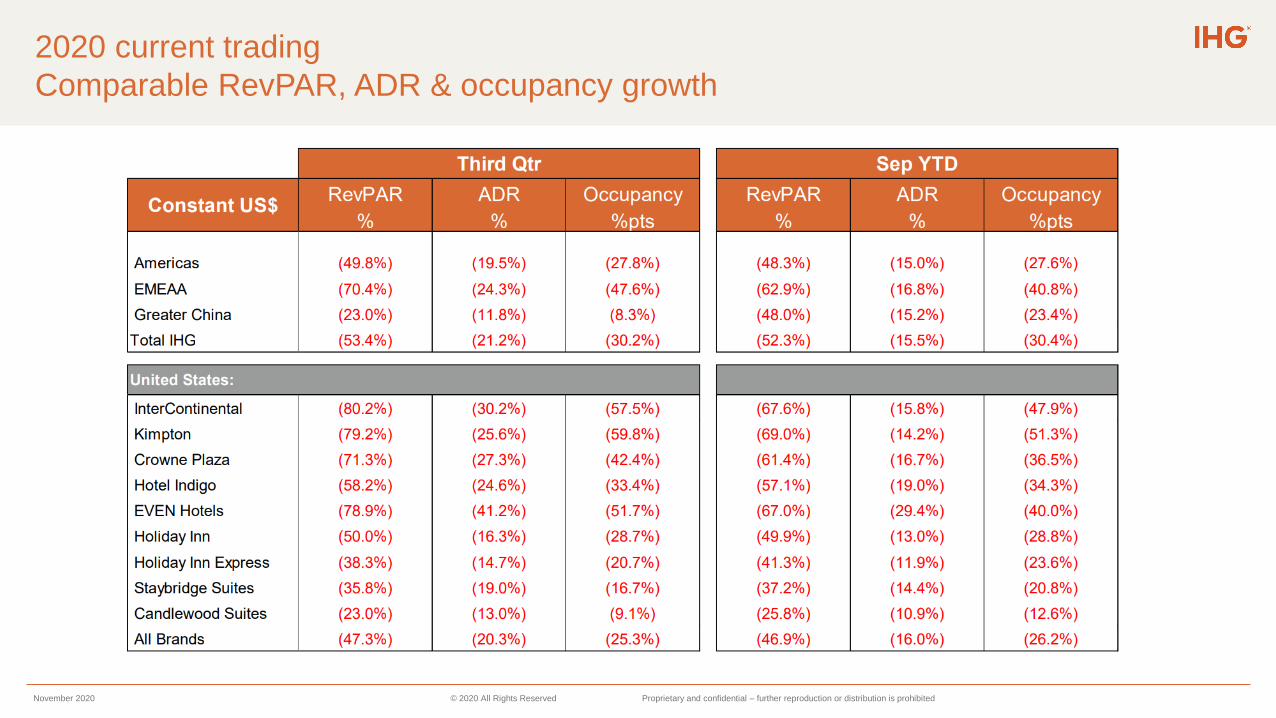
2020 current trading
Comparable RevPAR, ADR & occupancy growth

November 2020 © 2020 All Rights Reserved Proprietary and confidential – further reproduction or distribution is prohibited
Comparable RevPAR – 3 months to 30 September 2020
Fee business and owned, leased & managed leases
November 2020 © 2020 All Rights Reserved Proprietary and confidential – further reproduction or distribution is prohibited
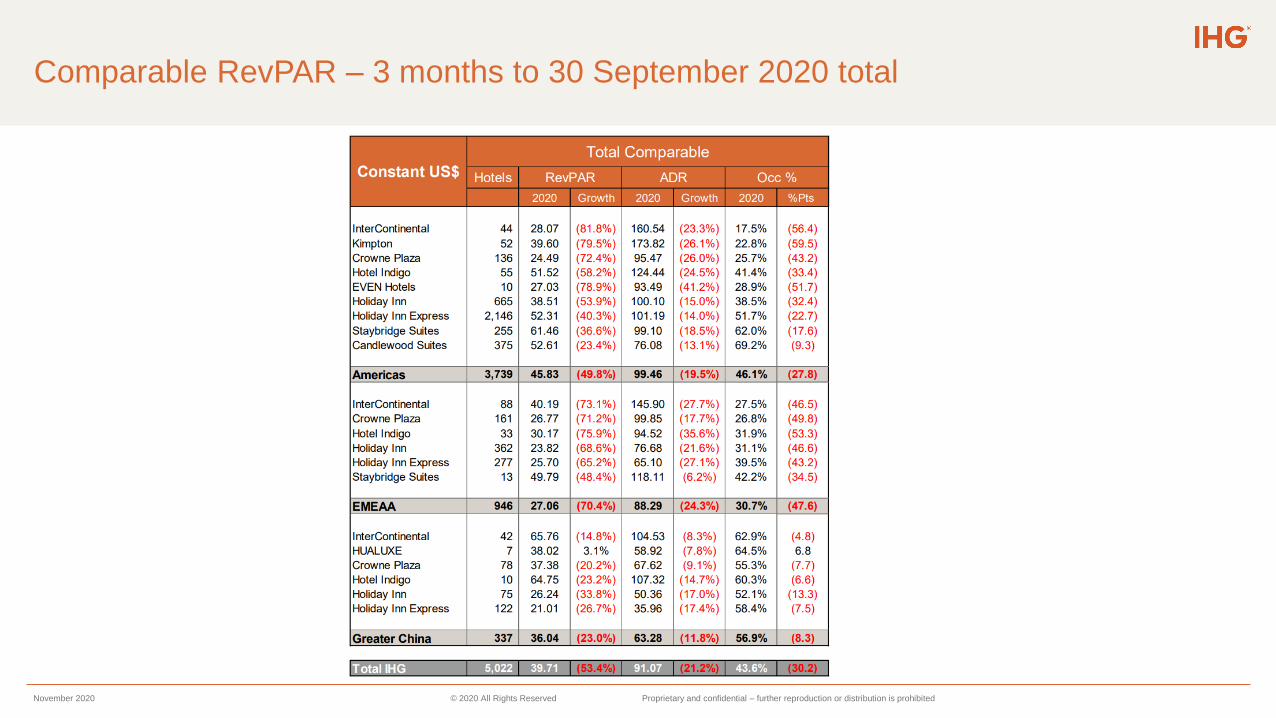
Comparable RevPAR – 3 months to 30 September 2020 total

November 2020 © 2020 All Rights Reserved Proprietary and confidential – further reproduction or distribution is prohibited
Hotel & room count as at 30 September 2020
*Does not include one open hotel that will be re-branded to voco.
*
*

November 2020 © 2020 All Rights Reserved Proprietary and confidential – further reproduction or distribution is prohibited
Pipeline as at 30 September 2020
*Does not include one pipeline hotel that will be re-branded to voco.** Includes one voco Pipeline hotel

November 2020 © 2020 All Rights Reserved Proprietary and confidential – further reproduction or distribution is prohibited
Investor Relations team contact details:
52
Stuart Ford
+44 (0)1895 512176
Karolina Nadolinska
+44 (0)1895 512176
Kavita Tatla
+44 (0)1895 512176
Rakesh Patel
+44 (0)1895 512176
![[XLS] · Web viewSayfa3 Shanghai Pudong General Bearing Co. Ltd. Shanghai PYC International Co. Ltd. Shanghai Rabbit Machiery Developing Co. Ltd. Shanghai Rabbit Machinery Development](https://static.fdocuments.us/doc/165x107/5ae614777f8b9a08778c9019/xls-viewsayfa3-shanghai-pudong-general-bearing-co-ltd-shanghai-pyc-international.jpg)