Regeneration Studies in the African Spiny Mouse · Regeneration Studies in the African Spiny Mouse...
66
Diogo Filipe Cabrita Prata Licenciatura em Genética e Biotecnologia Regeneration Studies in the African Spiny Mouse Dissertação para obtenção do Grau de Mestre em Genética Molecular e Biomedicina Orientador: Gustavo Tiscórnia, Professor Auxiliar, Departamento de Ciencias Biomédicas e Medicina, Center for Biomedical Research, University of Algarve Outubro, 2017
Transcript of Regeneration Studies in the African Spiny Mouse · Regeneration Studies in the African Spiny Mouse...
Diogo Filipe Cabrita Prata Licenciatura em Genética e Biotecnologia
Regeneration Studies in the African Spiny
Mouse
Dissertação para obtenção do Grau de Mestre em
Genética Molecular e Biomedicina
Orientador: Gustavo Tiscórnia, Professor Auxiliar, Departamento
de Ciencias Biomédicas e Medicina, Center for Biomedical
Research, University of Algarve
Outubro, 2017

Regeneration Studies in the African Spiny Mouse Diogo Prata
1

Regeneration Studies in the African Spiny Mouse Diogo Prata
2
Statement of Authorship
The experimental work presented in this thesis have been performed by the defendant of the
Master’s Thesis. All work was conducted in the University of Algarve, within the research group
of Molecular and Regenerative Medicine Laboratory.
Regeneration Studies in the African Spiny Mouse Diogo Prata
3
Acknowledgments
I must first express my gratitude to Dr. Gustavo Tiscornia, who accepted me into his research
group and helped me to better understand what a scientific career truly entails, all the sacrifices
and to savor the good aspects of science, although few and brief.
I am thankful to the Coordinator of the Master in Molecular Genetics and Biomedicine,
Professora Paula Gonçalves, for her guidance and patience.
Special thanks to Dr. Ashley Seifert and his colleague Dr. Thomas Gawriluk for his help and
materials provided.
I am very grateful to my mentor and close friend Dino Matias, for not only steering me in the
right way, but for also being a great contribution in turning dull moments into risible ones.
To the colleagues and friends that I’ve made during my stay in Gambelas, Gil Carraco, Ignasi
Casanellas, Daniel Oliveira, Susana Machado, Gonçalo Pinheiro, Om Rathore, Adélia Ova,
Marta Vitorino, Pedro Almeida, Neuton Gorjão, Daniela Baltazar, Om Rathore and Adélia Ova,
my sincerest apologies for addressing as a group, I am very thankful to each one of you for the
advice and the good times spent together, they made the hardest times more bearable and the
good times more enjoyable.
Last, but never least, I am thankful to my mother, sister and nephews, who have supported and
helped me throughout my academic progression, and always believed I could make it through the
hardships. And also to my closest friend Tom Miron, every man should be so fortunate to have
such a good friend to pick you up when things don’t work.

Regeneration Studies in the African Spiny Mouse Diogo Prata
4
Regeneration Studies in the African Spiny Mouse Diogo Prata
5
Abstract
Across the Metazoa, organisms vary in terms of how they respond to injury. The two basic
responses are regeneration or fibrotic scarring. While some groups such as axolotls, amphibians
and fish show high regenerative capacity, mammals tend to heal wounds by fibrotic scarring. The
African Spiny Mouse (Acomys) has been reported to have the capacity of closing 4-mm full
thickness wounds in the ear pinna with full regeneration of the original tissue architecture,
including dermis, epidermis, cartilage and hair follicles. In contrast, Mus musculus heals the
border wounds by fibrotic scarring. Therefore, Acomys and Mus constitute a powerful
comparative framework for the study of mammalian regeneration.
The goal in this work was to answer two independent questions.
First, we asked whether mesenchymal stem cells (MSC) were present in ear tissue of both
species and compared their differentiation capabilities in vitro. Primary cell cultures were
established from uninjured ears of both species, immune-phenotyped and cultured in vitro in
adipocyte, chondrocyte and osteocyte differentiation media. Differentiation was characterized by
staining and marker expression. We found that Mus cells tend to differentiate to adipocytes,
while Acomys cells tend to differentiate to chondrocytes.
Second, we asked whether telomerase was differentially upregulated in Acomys vs Mus in
response to wounding. Both species were subjected to ear wounds and allowed to heal or
regenerate. Tissues were harvested at different time points and analyzed for TERT expression by
RT-qPCR. Our results were inconclusive.
This work constitutes a further step in understanding the molecular and cellular mechanisms that
distinguish Acomys as an emerging mammalian regeneration model.
Keywords: wounding; regeneration; fibrotic scarring; mesenchymal stem cells; telomerase;
adipogenesis; chondrogenesis.

Regeneration Studies in the African Spiny Mouse Diogo Prata
6
Regeneration Studies in the African Spiny Mouse Diogo Prata
7
Resumo
Os organismos de todo o Metazoa diferem entre si em relação à resposta a ferimentos. As duas
respostas base são regeneração ou fibrose. Enquanto grupos como axolotle, anfíbios e peixe
demonstram capacidade regenerativa, mamíferos tendem a responder a ferimentos por fibrose.
Foi demonstrado que o Rato Espinhoso Africano (Acomys) fecha ferimentos na orelha com
diâmetro de 4 mm, com completa regeneração da arquitectura original do tecido, incluindo
derme, epiderme, cartilagem e folículos pilosos. Em contraste, o murganho (Mus Musuculus)
apenas é capaz de cicatrizar as fronteiras da ferida. Deste modo, o Acomys e o Mus constituem
um bom sistema comparativo para o estudo de regeneração em mamíferos.
O objectivo deste trabalho foi de responder a duas questões independentes.
Primeiro, colocámos a questão se existiam células estaminais mesenquimatosas (MSC) na orelha
de ambas as espécies, e comparamos o seu potencial de diferenciação in vitro. Culturas de
células primárias foram estabelecidas a partir de orelhas de ambas as espécies, o fenótipo
imunitário foi caracterizado e as células foram cultivadas em meios indutores de adipogênese,
condrogêndese e osteogênese. O potencial de diferenciação foi caracterizado por marcação
histológica e expressão de marcadores moleculares. Observamos que células de Mus têm
tendência em diferenciar para adipócitos, enquanto em Acomys a tendência é diferenciar para
condrócitos.
Em segundo lugar, colocámos a questão se a telomerase apresentava níveis de expressão
diferentes entre Acomys e Mus após lesão experimental na orelha. Ambas as espécies foram
sujeitas a ferimento experimental nas orelhas, e foi permitido o processo de regeneração ou
cicatrização. Os tecidos foram recolhidos em diferentes pontos no tempo e a expressão de TERT
foi feita por RT-qPCR. Os nossos resultados foram inconclusivos.
Este trabalho representa mais um passo na direcção de perceber os mecanismos moleculares e
celulares que destinguem o Acomys como um potencial modelo de regeneração em mamíferos.
Palavras-Chave: ferimento; regeneração; fibrose; células estaminais mesenquimais; telomerase;
adipogênese; condrogênese.

Regeneration Studies in the African Spiny Mouse Diogo Prata
8
Regeneration Studies in the African Spiny Mouse Diogo Prata
9
Index
Statement of Authorship…………………………………………………………………………..2
Acknowledgments…………………………………………………………………………………3
Abstract……………………………………………………………………………………………5
Resumo…………………………………………………………………………………………....7
Abbreviations…………………………………………………………………………………….15
Figure Index……………………………………………………………………………………...11
Table Index………………………………………………………………………………………13
Chapter 1 – General Introduction to Regeneration and the Acomys cahirinus Model
1.1 Regenerative Mechanisms and Animal Models of Regeneration…………………..…17
1.2 The African Spiny Mouse (Acomys cahirinus)…………………..……………………18
1.3 Bibliographical References…………………………………………………..………..20
Chapter 2 – In vitro Ear Cell Differentiation Capacity of Acomys cahirinus vs. Mus musculus
2.1 Introduction…………………………………….……………………………………..23
2.2 Materials and Methods………………….………………………………………...…25
2.2.1 Husbandry and handling of Acomys cahirinus……………………..…………......…25
2.2.2 Tissue Harvesting and Ear Cell Culture Establishment………………..…………….26
2.2.3 Flow Cytometry Analysis……………….…………………………………………...27
2.2.4 Differentiation Inducing Media………………..…………………………………….27
2.2.5 Cell Culture Staining Procedure…………………..…………………………………28
2.2.6 RNA Extraction………………..…………………………………………………….29
2.2.7 RT-qPCR Assay Procedure…………………….……………………………………29
2.3 Results and Discussion…………….……………………………………….………..29
2.3.1 Establishment of Ear Cell Primary Cultures……………………….………………...29
Regeneration Studies in the African Spiny Mouse Diogo Prata
10
2.3.2 In vitro Differentiation of Ear Cell Primary Cultures…………….…..……………..31
2.3.3 Identification of MSC by Flow Cytometry………………………………………….32
2.3.4 Multi-Lineage Differentiation of Adult Ear Primary Cultures………………………34
2.3.5 Analysis of Differentiation using Histological Stainings……..…………….………..34
2.3.6 Lineage Specific Marker Expression………………….……………………………...37
2.3.7 Validation of Primer Pairs…………………………………………………………...39
2.3.8 Gene Expression Analysis……………………………………………….…………..40
2.4 Conclusions……..……………………………………………………………………42
2.5 Bibliographical References…………………………………………………………..45
Chapter 3 – Is Telomerase involved in Ear Regeneration of Acomys cahirinus?
3.1 Introduction………………….……………..…………………………………………47
3.2 Materials and Methods……...………….....…………………………………………..49
3.2.1 Ear Wound Regeneration Assay…………………...…………………………………49
3.2.2 Tissue harvest and RNA Extraction………………………...………………………..50
3.2.3 RT-qPCR…………………...………………………………………………………...50
3.3 Results and Discussion……………………………………………………………….50
3.3.1 Optimization of a Total RNA Extraction from Ear Tissue …….……………..……...50
3.3.2 Validation of Primer Pairs………………………….………………………………...53
3.3.3 Gene Expression Analysis………………………………………..…………………..54
3.4 Conclusions………...…………………………………………………………………57
3.5 Bibliographical References….………………………………………………………..60
3.6 Annexes…………………………………………………….……..…………………..63
Regeneration Studies in the African Spiny Mouse Diogo Prata
11
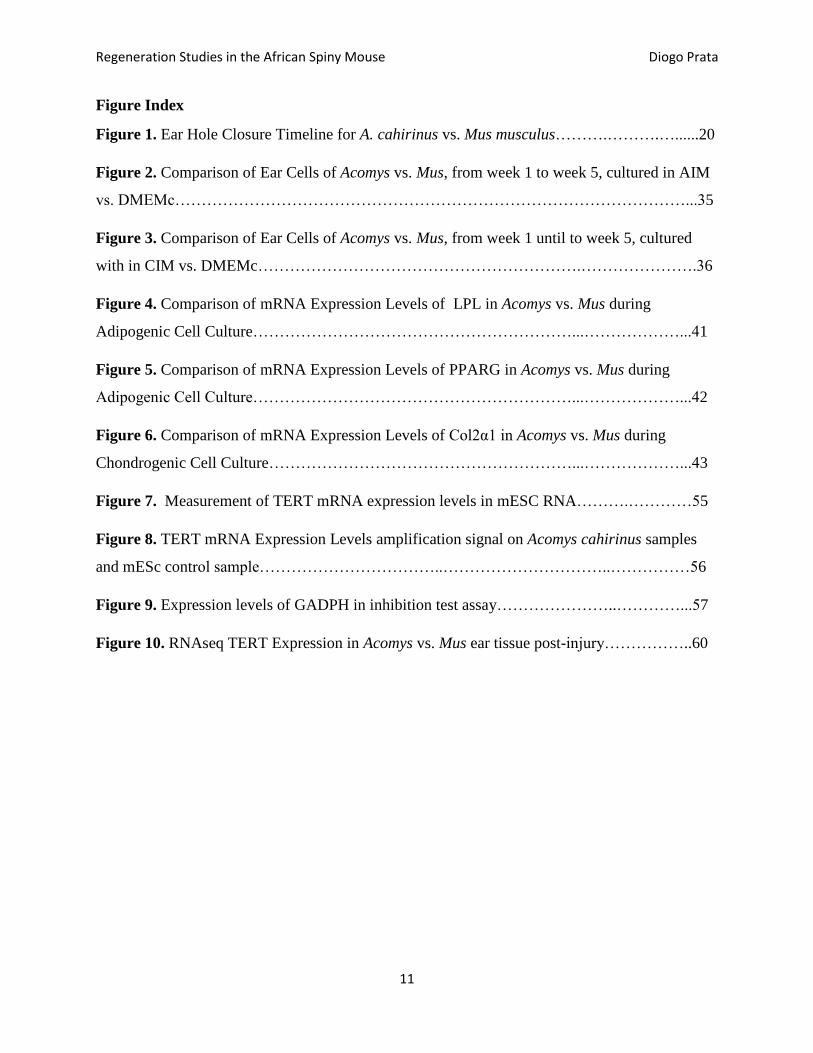
Figure Index
Figure 1. Ear Hole Closure Timeline for A. cahirinus vs. Mus musculus……….……….…......20
Figure 2. Comparison of Ear Cells of Acomys vs. Mus, from week 1 to week 5, cultured in AIM
vs. DMEMc……………………………………………………………………………………...35
Figure 3. Comparison of Ear Cells of Acomys vs. Mus, from week 1 until to week 5, cultured
with in CIM vs. DMEMc…………………………………………………….………………….36
Figure 4. Comparison of mRNA Expression Levels of LPL in Acomys vs. Mus during
Adipogenic Cell Culture……………………………………………………...………………...41
Figure 5. Comparison of mRNA Expression Levels of PPARG in Acomys vs. Mus during
Adipogenic Cell Culture……………………………………………………...………………...42
Figure 6. Comparison of mRNA Expression Levels of Col2α1 in Acomys vs. Mus during
Chondrogenic Cell Culture…………………………………………………...………………...43
Figure 7. Measurement of TERT mRNA expression levels in mESC RNA……….…………55
Figure 8. TERT mRNA Expression Levels amplification signal on Acomys cahirinus samples
and mESc control sample……………………………..…………………………..……………56
Figure 9. Expression levels of GADPH in inhibition test assay…………………..…………...57
Figure 10. RNAseq TERT Expression in Acomys vs. Mus ear tissue post-injury……………..60

Regeneration Studies in the African Spiny Mouse Diogo Prata
12
Regeneration Studies in the African Spiny Mouse Diogo Prata
13
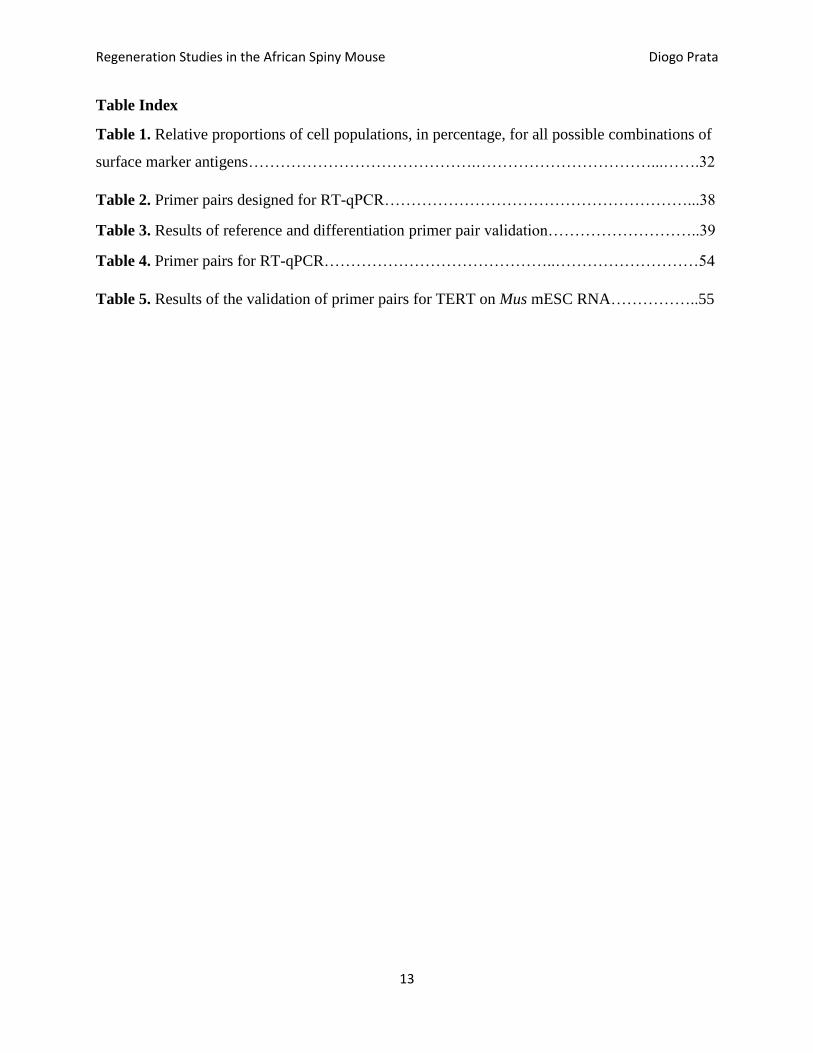
Table Index
Table 1. Relative proportions of cell populations, in percentage, for all possible combinations of
surface marker antigens…………………………………….……………………………...…….32
Table 2. Primer pairs designed for RT-qPCR…………………………………………………...38
Table 3. Results of reference and differentiation primer pair validation………………………..39
Table 4. Primer pairs for RT-qPCR……………………………………..………………………54
Table 5. Results of the validation of primer pairs for TERT on Mus mESC RNA……………..55

Regeneration Studies in the African Spiny Mouse Diogo Prata
14
Regeneration Studies in the African Spiny Mouse Diogo Prata
15
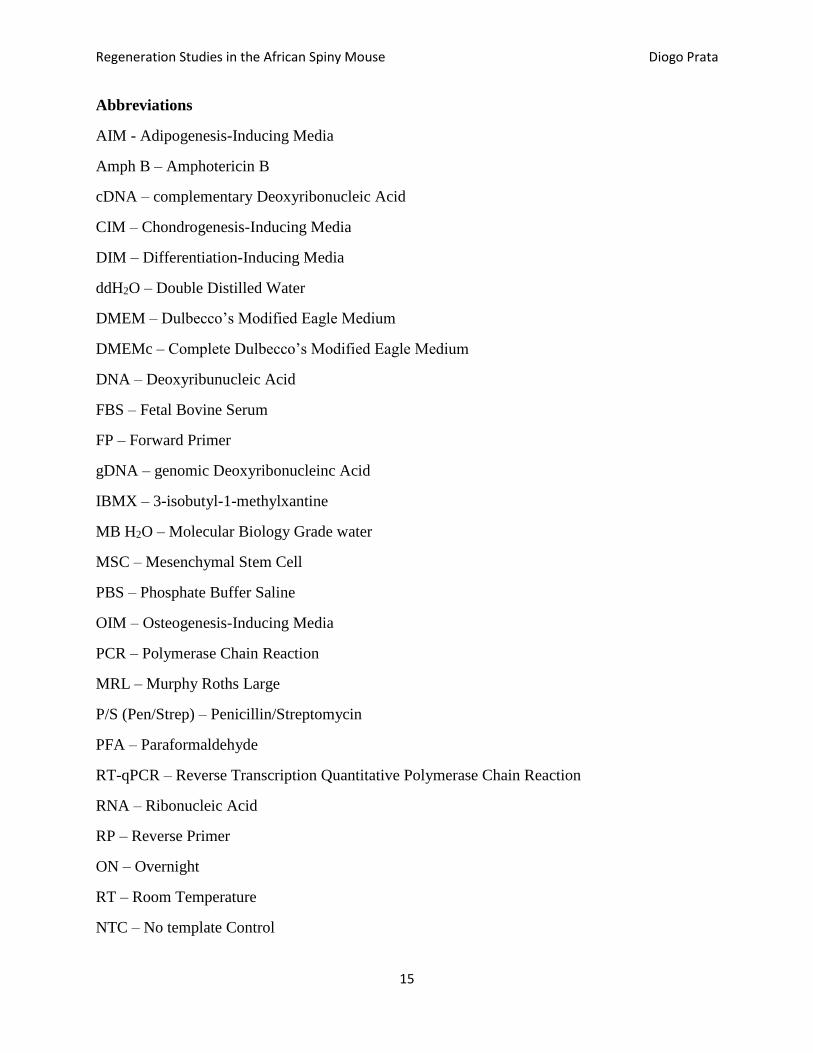
Abbreviations
AIM - Adipogenesis-Inducing Media
Amph B – Amphotericin B
cDNA – complementary Deoxyribonucleic Acid
CIM – Chondrogenesis-Inducing Media
DIM – Differentiation-Inducing Media
ddH2O – Double Distilled Water
DMEM – Dulbecco’s Modified Eagle Medium
DMEMc – Complete Dulbecco’s Modified Eagle Medium
DNA – Deoxyribunucleic Acid
FBS – Fetal Bovine Serum
FP – Forward Primer
gDNA – genomic Deoxyribonucleinc Acid
IBMX – 3-isobutyl-1-methylxantine
MB H2O – Molecular Biology Grade water
MSC – Mesenchymal Stem Cell
PBS – Phosphate Buffer Saline
OIM – Osteogenesis-Inducing Media
PCR – Polymerase Chain Reaction
MRL – Murphy Roths Large
P/S (Pen/Strep) – Penicillin/Streptomycin
PFA – Paraformaldehyde
RT-qPCR – Reverse Transcription Quantitative Polymerase Chain Reaction
RNA – Ribonucleic Acid
RP – Reverse Primer
ON – Overnight
RT – Room Temperature
NTC – No template Control
Regeneration Studies in the African Spiny Mouse Diogo Prata
16
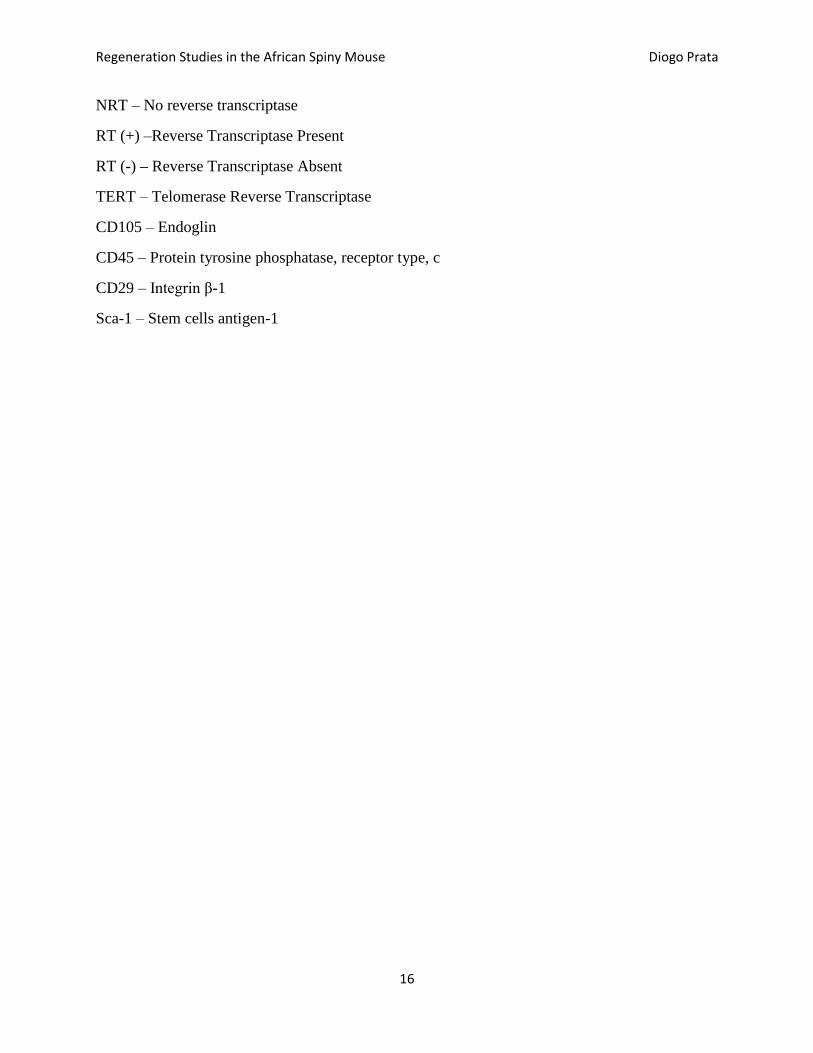
NRT – No reverse transcriptase
RT (+) –Reverse Transcriptase Present
RT (-) – Reverse Transcriptase Absent
TERT – Telomerase Reverse Transcriptase
CD105 – Endoglin
CD45 – Protein tyrosine phosphatase, receptor type, c
CD29 – Integrin β-1
Sca-1 – Stem cells antigen-1
Regeneration Studies in the African Spiny Mouse Diogo Prata
17
Chapter 1.
General Introduction to Regeneration and the Acomys cahirinus Model
1.1 Regenerative Mechanisms and Animal Models of Regeneration
In response to injury, a complex array of intracellular and intercellular pathways are activated
and coordinated in order to re-establish tissue integrity and homeostasis. Most commonly, the
response to injury across the Metazoa is through wound repair, which results in formation of a
fibrotic scar.
However, some organisms across the Metazoa display some degree of regenerative responses to
injury or trauma. Among the most robust regenerative systems are the Urodele amphibians
(axolotls, salamanders), which are capable of complete limb regeneration. Newts and axolotls are
also capable of regenerating brain, spinal cord and heart tissue (Brockes, 2002; Suzuki, 2006;
McCusker, 2014).
Regeneration proceeds through three classical mechanisms: epimorphic regeneration,
morphollaxis and compensatory regeneration (Brockes, 2002; Suzuki, 2006; McCusker, 2014).
Epimorphic regeneration involves the dedifferentiation of adult cells proliferate to form a mass
of undifferentiated cells. Subsequently, these cells differentiate, migrate and pattern themselves
to give rise to the missing organ or tissue, without drastic rearrangement of the structures
surrounding the wound bed. This type of regeneration is characteristic of regenerating limbs in
species such as froglets of Xenopus laevi (Gilbert SF, 2000; Suzuki, 2006) and Ambystoma
mexicanum (axolotl) (Seifert et al, 2012). The second mechanism (morphollaxis) is a response to
injury consisting of the re-patterning of existing tissues (with little proliferation) to give rise to
the missing structure. This type of regeneration is well characterized in the Hydra system, where
it is thought to be due to the high degree of plasticity of differentiated Hydra cells (Koizumi et al,
1991; Gilbert SF, 2000; Agata et al, 2007). The third mechanism is known as compensatory
regeneration. The best example of this mechanism is the regeneration of adult liver, where
differentiated cells enter the cell cycle without de-differentiating, resulting in new cells assuming
the functions of lost cells. This process usually occurs in normal physiological conditions, where
loss of structures is not a result of injury, but rather a process of tissue self-renewal so that tissue
functions are maintained (Chuong et al, 2012).
Regeneration Studies in the African Spiny Mouse Diogo Prata
18
Contrary to amphibians, mammals are more limited in their capacity for limb and organ
regeneration, and tend to respond to injury with fibrotic scarring. However, there are instances of
homeostatic mechanisms mediated by regeneration. Tissues such as blood, skin and bone can
continuously regenerate due to the existence of pools of multipotent stem cells. In adult humans,
liver has an impressive capacity or regeneration, being capable of regenerating up to 70% of its
mass after injury, which is achieved through hepatocyte hyperplasia (Miyaoka et al 2013).
Another instance of regeneration is observable for early fetuses of different species, namely
human, where skin regeneration proceeds in a way that results in repaired tissue devoid of scars.
This capacity, however, is lost at later stages of development, with wounds resulting in fibrotic
scar tissue (Rolfe et al, 2012; Satish et al, 2010).
In order to dissect the pathways and mechanisms underlying regeneration, there is the need for
good model organisms that display robust and reproducible regenerative phenotypes. Current
animal models in the field of regeneration include axolotls (Ambystoma mexicanum), the
zebrafish (Danio rerio), African clawed frog (Xenopus laevis) and the planaria (Schmidtea
mediterranea). However, regenerative phenotypes in mammals are uncommon and few models
exist, such as ear closure in the MRL strain of mice (Edwards, 2008) and rabbits (Eslaminejad et
al, 2013; Mahmoudi et al, 2011), digit tip regeneration in mice (Simkin et al, 2015) and the
annual regrowth of deer antlers (Kierdof, 2012). One recent and remarkable addition to this list is
the African Spiny Mouse, discussed in the following section.
1.2 The African Spiny Mouse (Acomys cahirinus)
The term ‘African Spiny Mouse’ is a collective reference to the genus Acomys, which owes its
etymology to the spiny hairs that emerge from their dorsum. According to the International
Union for the Conservation of Nature, there are currently 18 known Acomys species, habiting
arid environments across Africa, the Middle East and Southern of Asia. They are larger than the
common laboratory mouse, Mus musculus, with adults typically weighing between 40 and 50 g.
One of their most notable characteristics is their precocial nature (Supplementary Figure 1).
Newborn pups are born in an advanced stage of development compared to other murid rodents,
with a full coat of soft grey hair, opened eyes and ears unfolded. Remarkably, they are capable of
Regeneration Studies in the African Spiny Mouse Diogo Prata
19
locomotion and thermoregulation. Acomys have been used for studies of diabetes, perinatal
research and more recently, regeneration.
Acomys have been used as a model of nutrition induced diabetes mellitus type II. Whilst on a
high-energy diet, Acomys respond with obesity, low insulin levels and β-cell hyperplasia
(Shafrir, 2006).
Due to their long gestation period (39 days) and precocity, Acomys develop most organ systems
in utero, such as liver and kidneys (Dickinson et al, 2005), in contrast to altricial rodent pups,
making them good models for perinatal research (Lamers, 1985; Dickinson, 2005). As such,
spiny mice have been used to study the effect of maternal exposure to glucocorticoids, which
have deleterious effects on placental function (Iwaniak et al, 2015). More interestingly, they have
been used in studies to understand brain development in utero and the neural pathways of
behavior (Brunjes et al, 1989).
More recently, two species of spiny mice, Acomys percivali and Acomys kempi, were shown to
have a high degree of regenerative capacity. Both species show autotomy, a phenomenon by
which dorsal skin and tail sheath were easily lost when mice were manipulated, possibly owing
to the weak tensile strength of the tissues involved, presumably an antipredator adaptation.
Animals can suffer large full thickness wounds, which, remarkably, heal in 30 days. Importantly,
histological analysis of the affected region showed that animals reconstituted the original tissue
architecture, rather than respond with fibrotic scarring, as is the norm in mammals. Furthermore,
4 mm full thickness wounds in ear pinna fully closed within 60 days, displaying the same level
of robust regeneration as seen for the skin (Seifert et al, 2012).
In our group, we have shown that the regenerative phenotype extends to a third member of the
genus (Acomys cahirinus). Four-millimeter full thickness wound in the ear pinna showed
complete regeneration of tissue architecture, including dermis, epidermis, sebaceous glands,
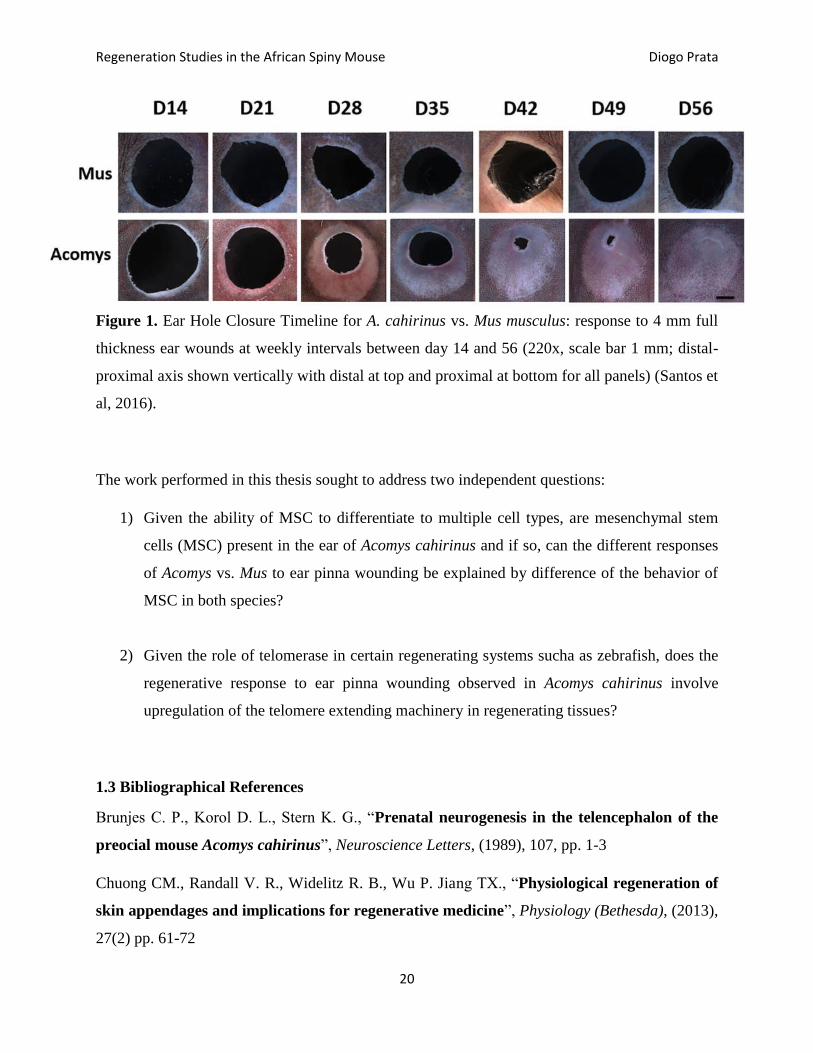
adipose tissue hair follicles, angiogenesis and nerve fiber regeneration (Figure 1). Muscle fibers
were also found in the regenerated region (Santos et al, 2016). A side-by-side comparison of 4-
mm full thickness ear pinna wounds in Acomys and Mus resulted in the Acomys ear wound full
closure within 60 days, in contrast to Mus, which merely healed the borders of the wound
through fibrotic scarring with no significant wound closure.
Regeneration Studies in the African Spiny Mouse Diogo Prata
20
Figure 1. Ear Hole Closure Timeline for A. cahirinus vs. Mus musculus: response to 4 mm full
thickness ear wounds at weekly intervals between day 14 and 56 (220x, scale bar 1 mm; distal-
proximal axis shown vertically with distal at top and proximal at bottom for all panels) (Santos et
al, 2016).
The work performed in this thesis sought to address two independent questions:
1) Given the ability of MSC to differentiate to multiple cell types, are mesenchymal stem
cells (MSC) present in the ear of Acomys cahirinus and if so, can the different responses
of Acomys vs. Mus to ear pinna wounding be explained by difference of the behavior of
MSC in both species?
2) Given the role of telomerase in certain regenerating systems sucha as zebrafish, does the
regenerative response to ear pinna wounding observed in Acomys cahirinus involve
upregulation of the telomere extending machinery in regenerating tissues?
1.3 Bibliographical References
Brunjes C. P., Korol D. L., Stern K. G., “Prenatal neurogenesis in the telencephalon of the
preocial mouse Acomys cahirinus”, Neuroscience Letters, (1989), 107, pp. 1-3
Chuong CM., Randall V. R., Widelitz R. B., Wu P. Jiang TX., “Physiological regeneration of
skin appendages and implications for regenerative medicine”, Physiology (Bethesda), (2013),
27(2) pp. 61-72
Regeneration Studies in the African Spiny Mouse Diogo Prata
21
Gilbert SF. Developmental Biology. 6th edition. Sunderland (MA): Sinauer Associates; 2000.
Regeneration. Available from: https://www.ncbi.nlm.nih.gov/books/NBK9971/
Gonzalez A., Costa T., Andrade Z., Medrado A., “Wound Healing – A literature review”, An
Bras Dermatol (2016), 91(5), 614-620
Gurtner G C., Werner S., Barrandon Y., Longaker M. T., “Wound Repair and Regeneration”,
Nature (2008), Vol. 453, 314-321
Iwaniak P., Dobrowolski P., Tomaszewska E., Hulas-Stasiak M., Tomcyk A., Gawron A., “The
influence of dexamethasone administered prenatally on cartilage of newborn spiny mouse
(Acomys cahirinus) offspring”, J Dev Orig Health Dis, (2015), 17, pp 1-8
Lamers W. H., Mooren P. G., Graaf A. D., Charles R., “Perinatal development of the liver in
rat and spiny mouse Its relation to altricial and precocial timing of birth”, Eur. J. Biochem.,
146, 475-480 (1985)
Miyaoka Y., Miyajima A., “To divide or not to divide: revisiting liver regeneration”. Cell
division 8: 8
Shaw T J., Martin P., “Wound Repair at a Glance”, Journal of Cell Science (2009), 122, pp.
3209-321

Regeneration Studies in the African Spiny Mouse Diogo Prata
22
Regeneration Studies in the African Spiny Mouse Diogo Prata
23
Chapter 2.
In vitro Ear Cell Differentiation Capacity of Acomys cahirinus vs. Mus
musculus
2.1 Introduction
Among adult stem cells, mesenchymal stem cells (MSCs) are multipotent stem cells that can
differentiate into various cell types, such as adipocytes, osteoblasts, chondrocytes, myocytes, β-
pancreatic islets cells, and potentially, neural cells (Nombela-Arrieta, 2011, Gao, 2016). In
addition, recent in vivo studies have demonstrated their capacity for self-renewal. They can be
cultured in vitro, show adherence to polystyrene surfaces, have low immunogenicity and can be
regulators of the immune response. MSCs have been reported to be capable to suppress the
activation and function of cells from the innate (such as macrophages, neutrophils and dendritic
cells) and adaptive systems (T lymphocytes and B-lymphocytes). This is due to an arrest of the
immune cells in G0/G1, thus preventing entry in the cell cycle. Furthermore, concrete
mechanisms, such as the inhibition of proliferation of B lymphocytes by IFN-γ-treated MSCs
have helped to understand the interactions that MSCs have with the immune system, information
that could prove valuable in the field of regenerative medicine (Mundra et al 2013; Kolluri et al
2013; Wang et al 2014).
The International Society of Cellular Therapy (ISCT) has defined minimal criteria for
mesenchymal stem cells (Horwitz et al., 2005). According to these criteria, MSCs Must:
• Adhere and grow in a plastic substrate when cultured in vitro;
• Be capable of multilineage differentiation to adipocytes, chondrocytes and osteoblasts
when subjected to Differentiation Inducing Media (DIM);
• Express a specific panel of surface markers. In humans, MSCs are positive for CD73,
CD90 and CD105 surface antigens, while lacking CD34 and CD45 leukocyte markers. In
mouse, MSC are positive for CD105, CD29 and Sca-1, while being negative for CD45.
The first to isolate and describe MSC cells was Friedenstein, who described the isolation of
spindle-shaped, clonogenic cells from bone marrow which he initially defined as colony-forming
unit fibroblasts (Uccelli et. al. 2008). After the characterization of these cells regarding their
Regeneration Studies in the African Spiny Mouse Diogo Prata
24
capacity of self-renewal and tri-lineage differentiation the term Mesenchymal Stem Cells started
to be used to refer to these precursor cells.
Although initial reports focused solely on bone marrow-derived MSCs, further reports have
demonstrated that MSCs can be derived from other tissues such as adipose, umbilical cord, cord
blood, dental pulp and the amniotic membrane (Rohban et al 2017). Furthermore, depending on
the tissue of origin, MSCs have shown differential regenerative capabilities. Bone marrow
derived MSCs possess a higher potential to give rise to chondrocytes and osteoblasts when
compared to MSCs derived from adipose tissue, who have a higher tendency for capillary
formation and vasculogenesis in vivo. The variability and extent in regenerative potential of
MSC populations are still unknown, but it is believed that stem cell niche influence over cell
fate, genetic variability and/or epigenetic factors are major contributors to the differences seen
between MSCs derived from different tissues (Rohban et al 2017).
Since their discovery, MSCs applications and possible translation into clinical therapies has
steadily risen. According to Squillaro et al. 2016, the number of MSC-based clinical trials as
nearly doubled in the past three years, pointing to the potential of MSC-based therapeutics in
cases of injury or disease.
Interest in MSCs was initially focused on their application on cellular therapies, but research has
indicated that the potential of MSCs for other applications is due in great part to their
immunosuppression capability and lack of immunogenicity (Mundra et al, 2013; Wang et al,
2014). MSCs do not express the class II major histocompatibility complex (MHC) on their cell
surface, nor do they present the classical co-stimulatory molecules, such as CD80, CD86, and
CD40, thus making them prime candidates for allogenic transplantation (Mundra et al, 2013)
The reduced immunogenicity and the tropism of MSC towards wound beds and regions of new
stroma formation are also of interest for delivery system therapies. MSCs have used as vectors
for delivery of therapeutic compounds, such as pro-apoptotic agents into tumor micro-
environment (Kolluri et al 2013), or in gene therapy applications (Mundra et al 2013).
MSC have also been reported to have clinical application in the treatment of immune-mediated
diseases, such as Type 1 Diabetes. Murine MSC delay the onset of diabetes development when
transplanted into diabetes prone mice prone (Fiorina et al. 2009). Given their plasticity, MSCs
Regeneration Studies in the African Spiny Mouse Diogo Prata
25
have been transdifferentiated into functional pancreatic β-cells, which could improve the current
therapeutic approaches for type 1 diabetes. This transdifferentiation of MSC to insulin producing
cells can be achieved by reprogramming MSCs with adenoviruses expressing pancreatic specific
transcription factors (Mundra et al, 2013). It is also possible to induce differentiation of MSCs
into a pancreatic endocrine phenotype by manipulating the culture conditions (Santos et al, 2010)
In the field of regenerative medicine, MSCs have been employed in clinical trials with the goal
of regeneration of tissues, such as bone and cartilage, the treatment of disorder such as spinal
cord injury, Crohn’s disease and graft-versus-host disease. The coculture of MSC with
endothelial colony forming cells resulted in the formation of stable and perfused microvessels,
pointing out to a potential role of MSCs in neovasculogenesis (Rohban et al, 2017). In other
reports, MSCs served as pericytes, wrapping around blood vessels and offering support to their
structure and stability.
In our lab, we are interested in understanding whether MSC play a role in the robust regenerative
response of Acomys cahirinus. Ear MSCs could proliferate and migrate to the wound bed,
undergo differentiation to one or more cell types present in the regenerated tissue, or have an
immunoregulatory effect. Differences in the MSC compartment might partially explain the
different responses to ear punch injury in Acomys cahirinus and Mus musculus.
We therefore attempted to identify MSC in the ear tissue of Acomys and Mus. To do so, we
harvested cells for these tissues, immunophenotyped them and analyzed their in vitro
differentiation capacity.
2.2 Materials and Methods
2.2.1 Husbandry and handling of Acomys cahirinus
All procedures in laboratory animals were done in accordance with the guidelines by the
Sociedade Portuguesa de Ciência em Animais de Laboratório (SPCAL). All animals selected for
experimentation were at approximately 2 months of age for both species.
Regeneration Studies in the African Spiny Mouse Diogo Prata
26
Laboratory animals were kept in plastic cages. Room temperature was kept at 25ºC, with
automated light-dark cycles of 12 hours of light and 12 hours of dark. Animals were fed with a
high protein and fiber diet and fresh fruit, with ad libitum access to bottled water.
Handling of animals was done with proper hand protection. Animals to be subjected to
experimentation were anesthetized with isofluorane (Abbott, IsoFlo). Animals were closely
observed for signs of anesthesia, such as inaction, decrease of respiratory rate, lack of response
to external stimuli, relaxation of tail, etc. Animals were placed on a clean warm surface, to
prevent sources of infection and rapid decrease of body temperature leading to hypothermia.
Before starting any procedure, tail and paw pinch were performed to confirm the animal was
under a deep state of anesthesia and there was no pain and/or discomfort for the animal.
All surgery material used was previously sterilized. Post experimentation, animals were placed in
clean cages with fresh bedding in order to decrease sources of infection and to help recovery.
2.2.2 Tissue Harvesting and Ear Cell Culture Establishment
Ears were excised with sterile scissors and placed in 70% Et-OH for 30 seconds, in order to clean
the tissue surface of possible sources of contamination before proceeding for in vitro procedures.
Ears were then submerged in cold 1X PBS + 2X P/S (Gibco) + 2X Amph β (Gibco, Cat No.
15290018) in a 50 ml Falcon tube (Sarstedt, 62.547.254) and kept on ice for transportation to the
Tissue Culture Unit; transportation time was under 5 minutes.
Samples were placed on a petri dish on top of ice and sectioned into small pieces with a surgical
blade. The resulting “pulp” was transferred into a 15 ml Falcon tube (Sarstedt, 62.554.502).
Depending on the tissue volume, 1 to 5 mL of 0.25% Trypsin (Gibco) was added, and the sample
incubated at 37ºC. After 15 minutes, the suspension was centrifuged at 1000 RPM for 2 minutes,
supernatant was taken and passed by a 70 µm strainer (VWR, 21008-952) to a 50 ml Falcon tube
and at least double the volume of warm culture media (DMEM+ 1X GlutaMAX + 20% FBS +
2X P/S + 2X Amph) was added. After passage of the suspension through the strainer, 2 ml of
0.25% Trypsin was added to the digested tissue pellet that remained at the bottom of the first
Falcon tube, and again placed in a water bath for 15 minutes, after which the procedure was
repeated until all tissue was digested. From the resulting cell suspension, an aliquot of 10 µl was
Regeneration Studies in the African Spiny Mouse Diogo Prata
27
taken and placed on a Neubauer chamber for cell counting. Given that the flow cytometry
protocol (detailed further down) set the minimum concentration of 1x10⁶ cells per ml of media, if
concentration was too low, cell suspension was centrifuged at 1000 RPM for 5 minutes, the
supernatant removed and the cell pellet resuspended in an adequate amount of media. The
resulting cell suspension was fractioned, with one fraction being seeded unto 10-cm polystyrene
culture dishes (Sarstedt), and incubated at 37ºC and 5% CO2 for expansion while the second
fraction was subjected to flow cytometry analysis.
2.2.3 Flow Cytometry Analysis
Flow cytometry analysis was performed on two cell populations: cells directly harvested from
the ear tissue and not yet seeded unto a polystyrene surface (P0), and to the resulting cell
population after in vitro expansion up to the point of confluency (P1). Flow cytometry analysis
was performed for both Mus musculus and Acomys cahirinus cells using the same Multi-Color
Flow cytometry kit (FCK) (R&D Systems, FMC003). Cells were washed in 5 ml of pre-warmed
1X PBS, centrifuged at 1000 RPM during 5 minutes, and the cell pellet resuspended to a final
concentration of 1 million cells per ml in FCK resuspension buffer. Aliquots of 1 million cells of
the resulting cell suspension were transferred to cytometry tubes and 10 µl of an individual
antibody (CD105, CD29, Sca1 and CD45 respectively) added. Additionally, a tube with no
addition of antibody (negative control) and addition of all four antibodies were set up.
Samples where then incubated for 45 minutes at room temperature protected from light. After the
incubation period, the tubes were centrifuged at 1000 RPM for 5 minutes, supernatant was
removed and 1X PBS was added. Tubes proceeded for flow cytometry analysis and data
analyzed with InfinicytTM software.
2.2.4 Differentiation Inducing Media
All culture media described were prepared in sterile conditions and filtered through a 0.22 µm
filter. The media compositions were as follows:
Adipogenesis Induction Medium (AIM) (Baghaban-Eslaminejad, 2013)
• DMEM + 10% FBS + 1X P/S + 1X Glutamax
Regeneration Studies in the African Spiny Mouse Diogo Prata
28
• 100 nM dexamethasone (Sigma-Aldrich, D4902)
• 50 µg/ml indomethacin (Sigma-Aldrich, I7378)
• 500 µM IBMX (TORIS Bioscience, 2845)
• 10 µg/ml insulin (Sigma-Aldrich, I2643 1001561376)
Chondrogenesis Induction Medium (CIM) (Newman, 2001)
• DMEM/Hams’ F12 + Glutamax (1:1) (Sigma-Aldrich, 10565-018) + 5% FBS + 1X P/S
• 10 µg·ml-1 insulin (Sigma-Aldrich, I2643 1001561376)
• 10 µg·ml-1 transferin (Sigma-Aldrich, T8158 101316524)
• 30 nM sodium selenite (Sigma-Aldrich, S5261 1001543979)
Osteogenesis Induction Medium (OIM) (Herlofsen, 2011)
• DMEM + 20% FBS + 1X P/S + 1X Glutamax
• 50 µg·ml-1 sodium ascorbate (Sigma Aldrich, A7631)
• 10 nM dexamethasone
• 10 mM β-glicerophosphate (Sigma-Aldrich, G9422)
2.2.5 Cell Culture Staining Procedure
Prior to staining, cell cultures were washed with pre-warmed 1X PBS, fixed with 1X PBS 4%
PFA (Sigma-Aldrich, P6148) overnight at 4C, changed to cold 1X PBS and stored at 4ºC until
staining.
Oil Red O staining
A stock solution was prepared by dissolving 60 mg of Oil Red O powder (Sigma-Aldrich,
O0625), in 20 ml isopropanol, and left rocking for at least 20 minutes. This solution is stable for
1 year. Working solution was prepared by mixing 3 volumes of the stock solution with 2
volumes of ddH2O, and filtered through a Whatman paper to eliminate non-dissolved solids. Oil
Red O working solution was added to the cell culture and left for 20 minutes at RT with gentle
rocking. Samples were then washed with ddH2O two times and observed under the optical
microscope.
Regeneration Studies in the African Spiny Mouse Diogo Prata
29
Alcian Blue Staining
A working solution of 0.5% (w/v) Alcian Blue 8GX (Sigma-Aldrich, A5268) in 0.1 N
hydrochloric acid (Sigma-Aldrich, 258148) was prepared and filtered through a Whatman paper.
Cell cultures were stained overnight at 4ºC with gentle rocking. Samples were then washed with
ddH2O two times and observed under the microscope.
Alizarin Red Staining
A working solution of 40 mM Alizarin Red was prepared by dissolving 274 mg of Alizarin Red
powder (Sigma-Aldrich A5533) in 19 mL of ddH2O. pH was adjusted to 4.2 with 1% ammonium
hydroxide, ddH2O was then added to a final volume of 20 ml and the solution was filtered
through a Whatman paper. Samples were stained for 5 minutes and washed two times with
ddH2O before observation under the microscope.
2.2.6 RNA Extraction
Total RNA from frozen cell pellets was extracted using the Zymo Research Quick-RNATM
MiniPrep kit (Zymo Research, R1054).
2.2.7 RT-qPCR Assay and Procedure
Total RNA (1 ug) was reverse transcribed (resulting in a RT+ cDNA fraction) using an iScript
cDNA Synthesis Kit (Bio-Rad, 170-8891), following the manufacturer’s instructions. A control
reaction was set up without reverse transcriptase (RT- cDNA fraction). Reactions were
conducted in a C1000 Touch Thermal Cycler (Bio-Rad).
qPCR was performed using SSoFast EvaGreen Supermix (Bio-Rad, 172-5201) in a 96 well plate
format on a CFX96 Real-Time PCR System (Bio-Rad).
2.3 Results and Discussion
2.3.1 Establishment of Ear Cell Primary Cultures
Regeneration Studies in the African Spiny Mouse Diogo Prata
30
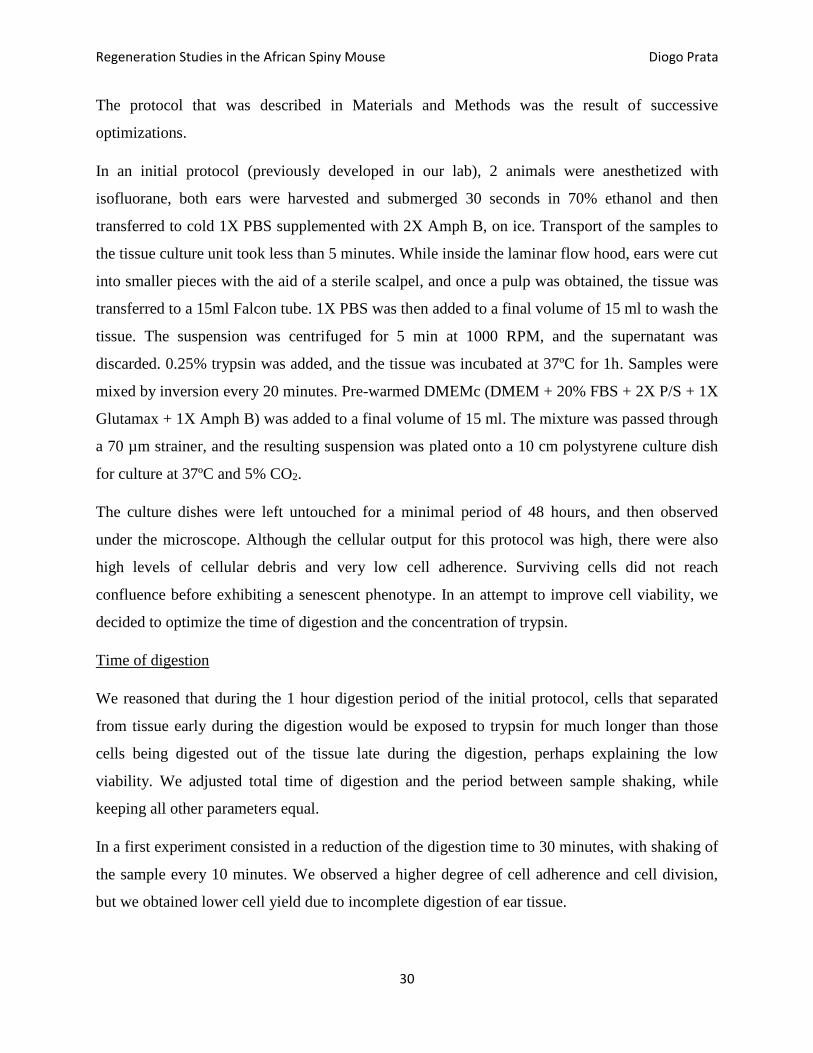
The protocol that was described in Materials and Methods was the result of successive
optimizations.
In an initial protocol (previously developed in our lab), 2 animals were anesthetized with
isofluorane, both ears were harvested and submerged 30 seconds in 70% ethanol and then
transferred to cold 1X PBS supplemented with 2X Amph B, on ice. Transport of the samples to
the tissue culture unit took less than 5 minutes. While inside the laminar flow hood, ears were cut
into smaller pieces with the aid of a sterile scalpel, and once a pulp was obtained, the tissue was
transferred to a 15ml Falcon tube. 1X PBS was then added to a final volume of 15 ml to wash the
tissue. The suspension was centrifuged for 5 min at 1000 RPM, and the supernatant was
discarded. 0.25% trypsin was added, and the tissue was incubated at 37ºC for 1h. Samples were
mixed by inversion every 20 minutes. Pre-warmed DMEMc (DMEM + 20% FBS + 2X P/S + 1X
Glutamax + 1X Amph B) was added to a final volume of 15 ml. The mixture was passed through
a 70 µm strainer, and the resulting suspension was plated onto a 10 cm polystyrene culture dish
for culture at 37ºC and 5% CO2.
The culture dishes were left untouched for a minimal period of 48 hours, and then observed
under the microscope. Although the cellular output for this protocol was high, there were also
high levels of cellular debris and very low cell adherence. Surviving cells did not reach
confluence before exhibiting a senescent phenotype. In an attempt to improve cell viability, we
decided to optimize the time of digestion and the concentration of trypsin.
Time of digestion
We reasoned that during the 1 hour digestion period of the initial protocol, cells that separated
from tissue early during the digestion would be exposed to trypsin for much longer than those
cells being digested out of the tissue late during the digestion, perhaps explaining the low
viability. We adjusted total time of digestion and the period between sample shaking, while
keeping all other parameters equal.
In a first experiment consisted in a reduction of the digestion time to 30 minutes, with shaking of
the sample every 10 minutes. We observed a higher degree of cell adherence and cell division,
but we obtained lower cell yield due to incomplete digestion of ear tissue.
Regeneration Studies in the African Spiny Mouse Diogo Prata
31
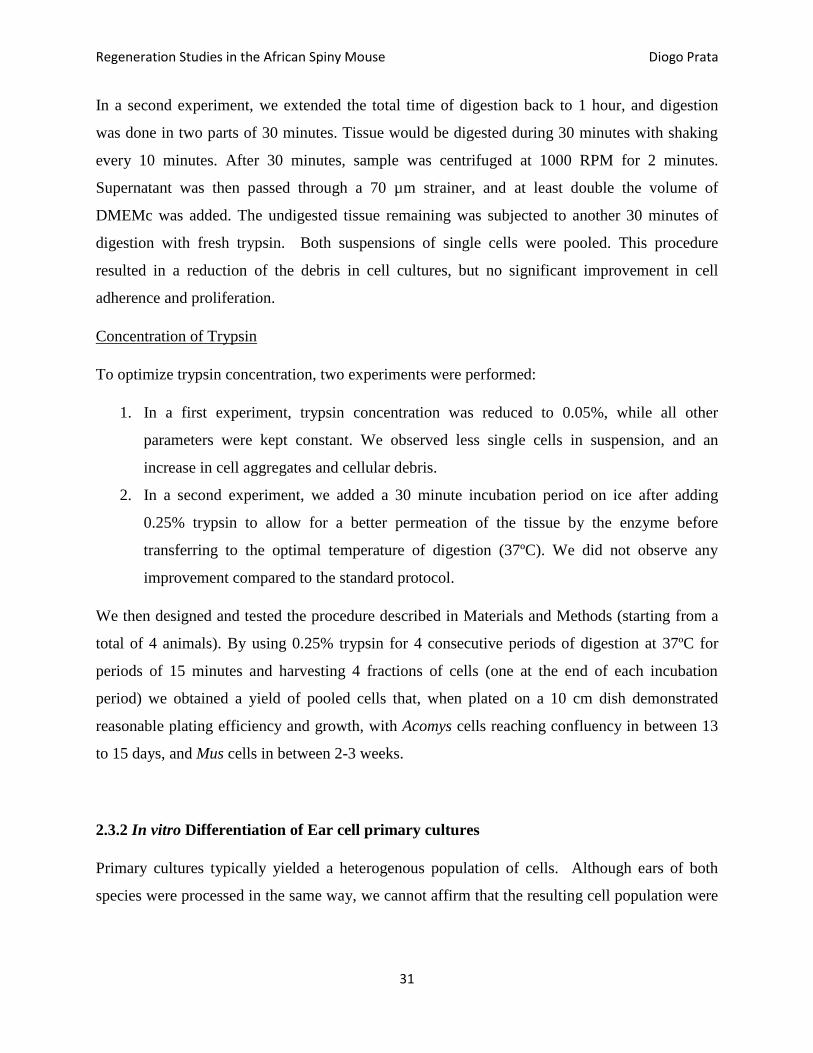
In a second experiment, we extended the total time of digestion back to 1 hour, and digestion
was done in two parts of 30 minutes. Tissue would be digested during 30 minutes with shaking
every 10 minutes. After 30 minutes, sample was centrifuged at 1000 RPM for 2 minutes.
Supernatant was then passed through a 70 µm strainer, and at least double the volume of
DMEMc was added. The undigested tissue remaining was subjected to another 30 minutes of
digestion with fresh trypsin. Both suspensions of single cells were pooled. This procedure
resulted in a reduction of the debris in cell cultures, but no significant improvement in cell
adherence and proliferation.
Concentration of Trypsin
To optimize trypsin concentration, two experiments were performed:
1. In a first experiment, trypsin concentration was reduced to 0.05%, while all other
parameters were kept constant. We observed less single cells in suspension, and an
increase in cell aggregates and cellular debris.
2. In a second experiment, we added a 30 minute incubation period on ice after adding
0.25% trypsin to allow for a better permeation of the tissue by the enzyme before
transferring to the optimal temperature of digestion (37ºC). We did not observe any
improvement compared to the standard protocol.
We then designed and tested the procedure described in Materials and Methods (starting from a
total of 4 animals). By using 0.25% trypsin for 4 consecutive periods of digestion at 37ºC for
periods of 15 minutes and harvesting 4 fractions of cells (one at the end of each incubation
period) we obtained a yield of pooled cells that, when plated on a 10 cm dish demonstrated
reasonable plating efficiency and growth, with Acomys cells reaching confluency in between 13
to 15 days, and Mus cells in between 2-3 weeks.
2.3.2 In vitro Differentiation of Ear cell primary cultures
Primary cultures typically yielded a heterogenous population of cells. Although ears of both
species were processed in the same way, we cannot affirm that the resulting cell population were
Regeneration Studies in the African Spiny Mouse Diogo Prata
32
equivalent in identity or characteristics. In particular, we were interested in determining what
percentage of cells isolated by our procedure were MSC.
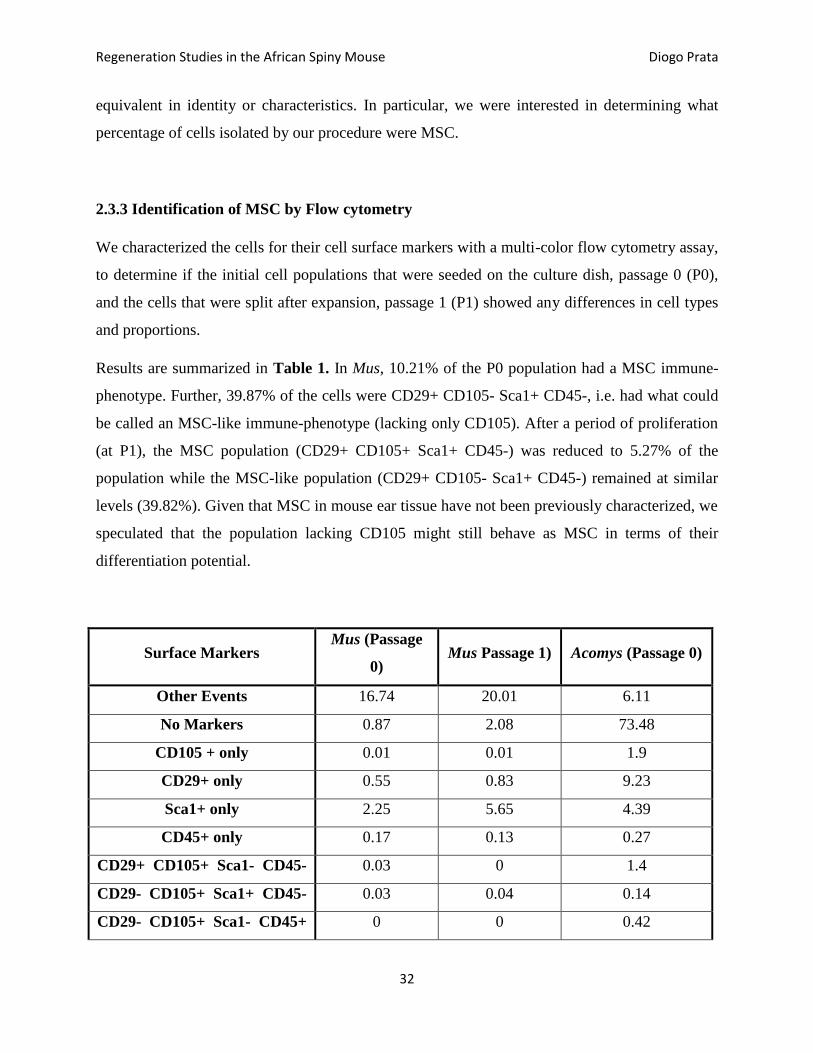
2.3.3 Identification of MSC by Flow cytometry
We characterized the cells for their cell surface markers with a multi-color flow cytometry assay,
to determine if the initial cell populations that were seeded on the culture dish, passage 0 (P0),
and the cells that were split after expansion, passage 1 (P1) showed any differences in cell types
and proportions.
Results are summarized in Table 1. In Mus, 10.21% of the P0 population had a MSC immune-
phenotype. Further, 39.87% of the cells were CD29+ CD105- Sca1+ CD45-, i.e. had what could
be called an MSC-like immune-phenotype (lacking only CD105). After a period of proliferation
(at P1), the MSC population (CD29+ CD105+ Sca1+ CD45-) was reduced to 5.27% of the
population while the MSC-like population (CD29+ CD105- Sca1+ CD45-) remained at similar
levels (39.82%). Given that MSC in mouse ear tissue have not been previously characterized, we
speculated that the population lacking CD105 might still behave as MSC in terms of their
differentiation potential.
Surface Markers Mus (Passage
0) Mus Passage 1) Acomys (Passage 0)
Other Events 16.74 20.01 6.11
No Markers 0.87 2.08 73.48
CD105 + only 0.01 0.01 1.9
CD29+ only 0.55 0.83 9.23
Sca1+ only 2.25 5.65 4.39
CD45+ only 0.17 0.13 0.27
CD29+ CD105+ Sca1- CD45- 0.03 0 1.4
CD29- CD105+ Sca1+ CD45- 0.03 0.04 0.14
CD29- CD105+ Sca1- CD45+ 0 0 0.42
Regeneration Studies in the African Spiny Mouse Diogo Prata
33
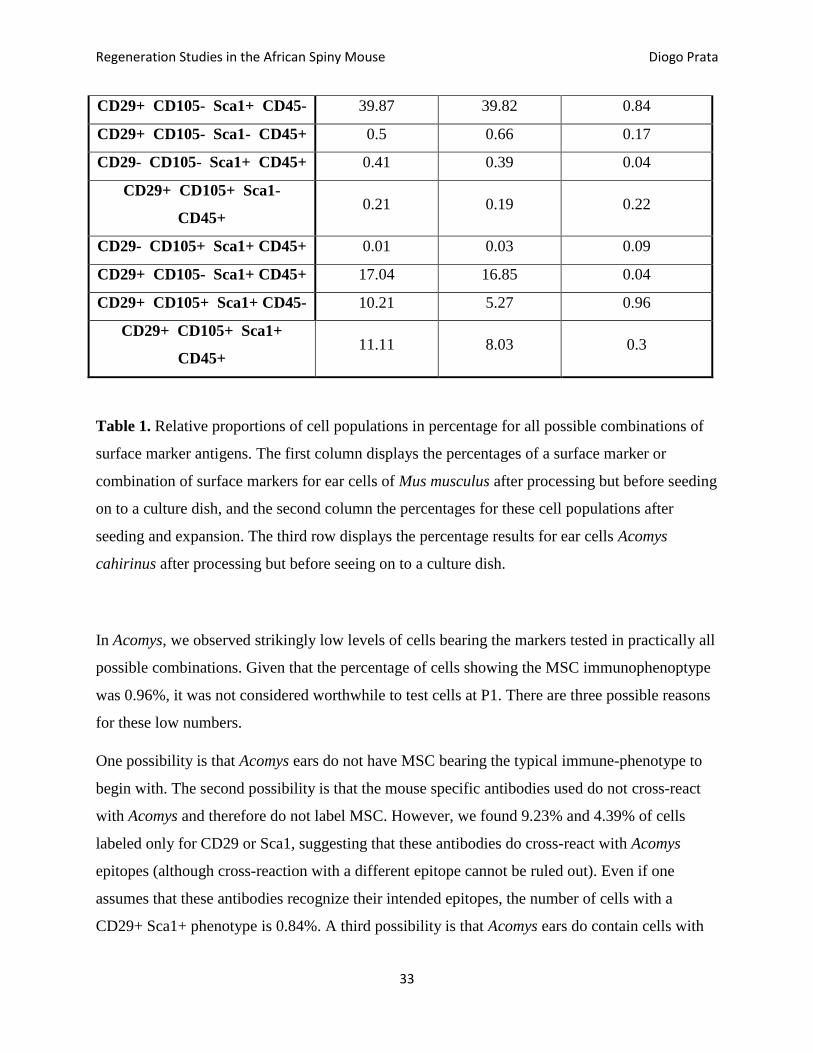
CD29+ CD105- Sca1+ CD45- 39.87 39.82 0.84
CD29+ CD105- Sca1- CD45+ 0.5 0.66 0.17
CD29- CD105- Sca1+ CD45+ 0.41 0.39 0.04
CD29+ CD105+ Sca1-
CD45+ 0.21 0.19 0.22
CD29- CD105+ Sca1+ CD45+ 0.01 0.03 0.09
CD29+ CD105- Sca1+ CD45+ 17.04 16.85 0.04
CD29+ CD105+ Sca1+ CD45- 10.21 5.27 0.96
CD29+ CD105+ Sca1+
CD45+ 11.11 8.03 0.3
Table 1. Relative proportions of cell populations in percentage for all possible combinations of
surface marker antigens. The first column displays the percentages of a surface marker or
combination of surface markers for ear cells of Mus musculus after processing but before seeding
on to a culture dish, and the second column the percentages for these cell populations after
seeding and expansion. The third row displays the percentage results for ear cells Acomys
cahirinus after processing but before seeing on to a culture dish.
In Acomys, we observed strikingly low levels of cells bearing the markers tested in practically all
possible combinations. Given that the percentage of cells showing the MSC immunophenoptype
was 0.96%, it was not considered worthwhile to test cells at P1. There are three possible reasons
for these low numbers.
One possibility is that Acomys ears do not have MSC bearing the typical immune-phenotype to
begin with. The second possibility is that the mouse specific antibodies used do not cross-react
with Acomys and therefore do not label MSC. However, we found 9.23% and 4.39% of cells
labeled only for CD29 or Sca1, suggesting that these antibodies do cross-react with Acomys
epitopes (although cross-reaction with a different epitope cannot be ruled out). Even if one
assumes that these antibodies recognize their intended epitopes, the number of cells with a
CD29+ Sca1+ phenotype is 0.84%. A third possibility is that Acomys ears do contain cells with
Regeneration Studies in the African Spiny Mouse Diogo Prata
34
MSC-like differentiation capabilities, but their cell surface markers are different from those
found in mouse MSC.
Therefore, our results suggest that Mus ears contain relatively low numbers of MSC but were
inconclusive for Acomys.
2.3.4 Multi-Lineage Differentiation of Adult Ear Primary Cultures
Regardless of the immunophenotyped profiles found in our cultures, we set out to test the
differentiation potential of cells present in the ear of Acomys, in comparison to Mus. P1 cells of
both species were passaged on to 60 cm polystyrene culture dishes (1.5x10⁵ cells per dish) in
DMEMc media and incubated at 37ºC and 5% CO2 for a period of 24 hours. Once cells had
attached to the substrate, the media was carefully removed, and specific differentiation media for
adipocyte, chondrocyte and osteocyte differentiation was added to the plates. One set of plates
were maintained in DMEMc as a non-differentiation control.
To test the differentiation potential of cells of a given species (Acomys vs. Mus) for a given fate
(adipogenic, chondrogenic or osteogenic), or in DMEMc (as a non-differentiation medium
control), cells were cultured for 5 weeks. Culture media was changed every 3 days. Cultures
were set up in duplicate, with one complete set reserved to perform staining for adipocytes,
chondrocytes or osteocytes. The second set was reserved for RNA extraction in order to view
differences in the genetic expression of differentiation markers. Cultures were harvested at 7, 14,
21, 28 and 35 days after differentiation media was added to the plates. During this time, cell
cultures were observed daily in order to check for contamination, monitor possible pH changes
due to media exhaustion and observe any obvious morphological change in the population.
2.3.5 Analysis of Differentiation using Histological Stains
Cell differentiation throughout the time course of culture was assessed by morphology, by
histological staining for specific cell types (adipocytes, chondrocytes and osteocytes).
Histological stains were quantified by counting stained cells in representative regions of the
culture.
Regeneration Studies in the African Spiny Mouse Diogo Prata
35
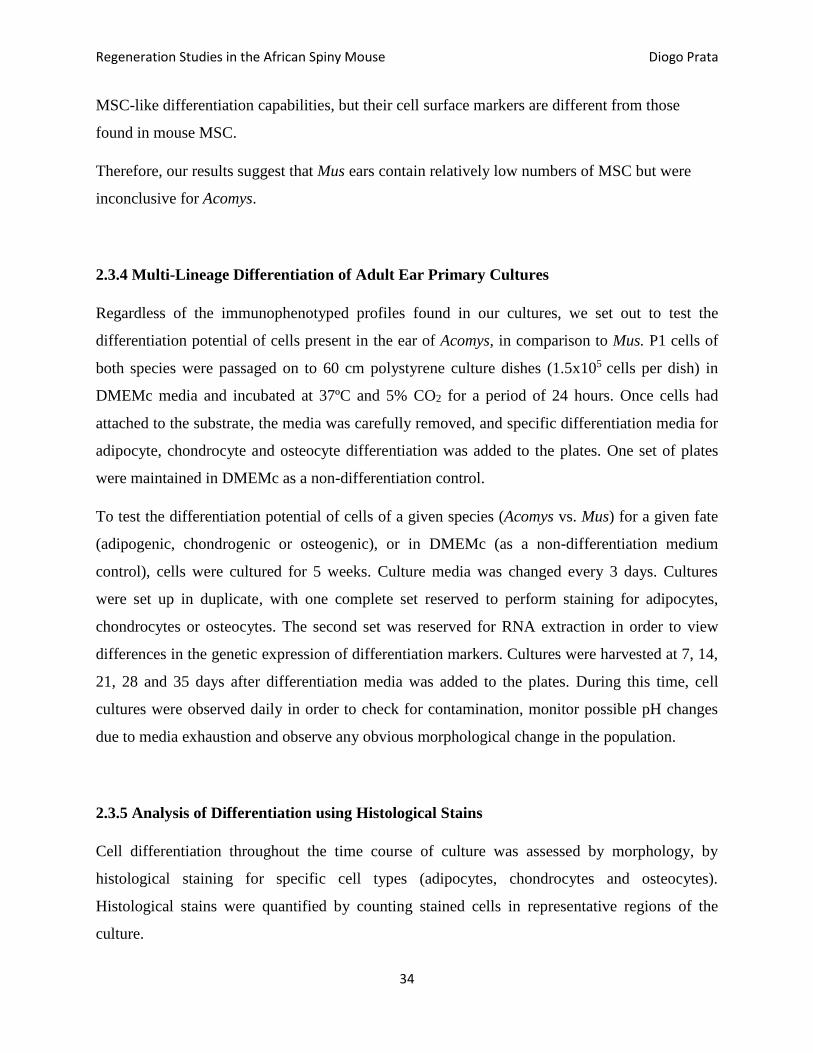
Adipogenesis
A well established method to evaluate differentiation to adipocytes is Oil Red staining, which
stains fat cell lipid deposits with an intense red coloring.
Figure 2. Comparison of adipogenesis in ear cells of Acomys vs Mus, from week 1 through week
5, cultured in AIM vs. DMEMc, (100x) and stained with Oil Red O.
Results are shown in Figure 2. Oil red staining shows a significantly greater propensity towards
the adipocyte fate for Mus cells compared to Acomys cells, confirming preliminary results
obtained previously in our lab (I. Casanellas). The difference was particularly noticeable at
weeks 4 and 5. Cell cultured in DMEMc did not show staining.
Regeneration Studies in the African Spiny Mouse Diogo Prata
36
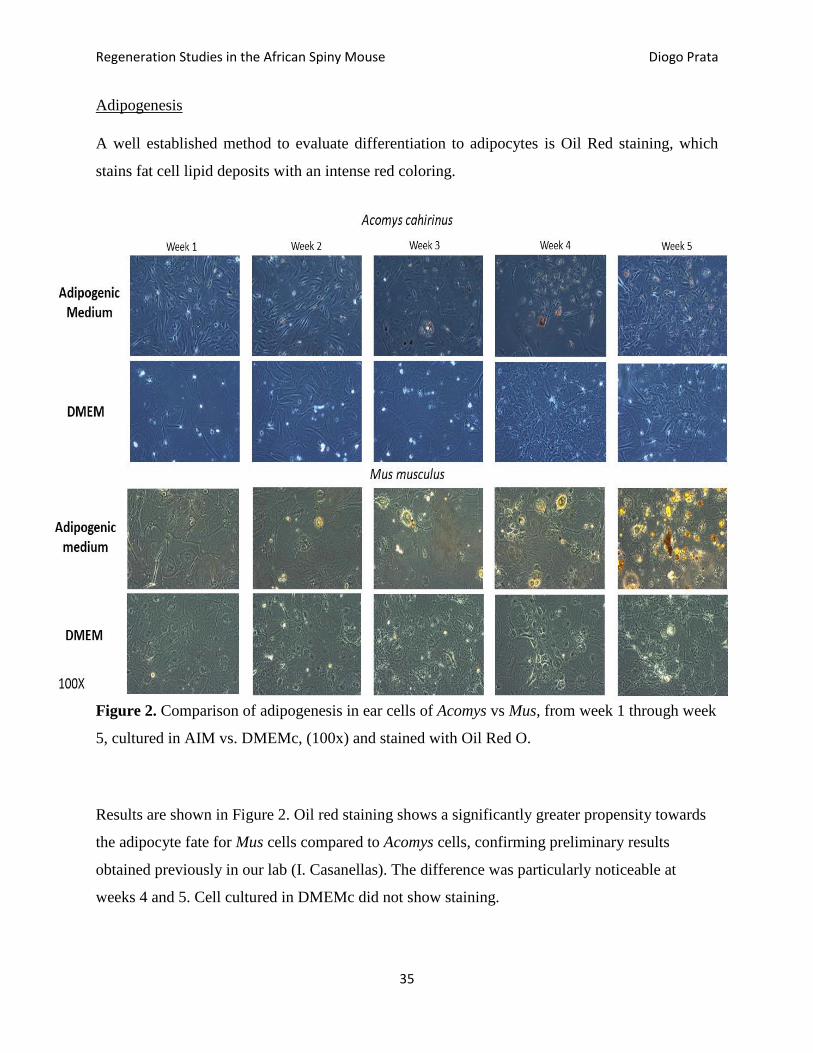
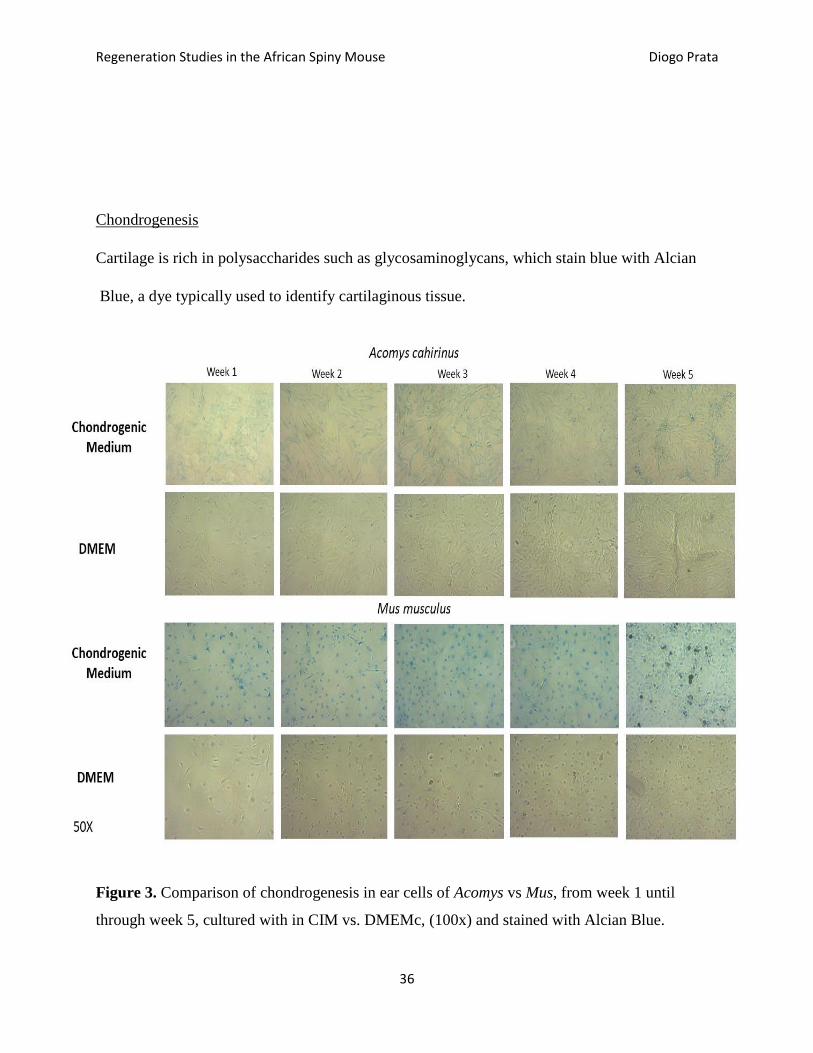
Chondrogenesis
Cartilage is rich in polysaccharides such as glycosaminoglycans, which stain blue with Alcian
Blue, a dye typically used to identify cartilaginous tissue.
Figure 3. Comparison of chondrogenesis in ear cells of Acomys vs Mus, from week 1 until
through week 5, cultured with in CIM vs. DMEMc, (100x) and stained with Alcian Blue.
Regeneration Studies in the African Spiny Mouse Diogo Prata
37
Results are shown in Figure 3. Mus cell cultured in CIM seemed to show faint cytoplasmic blue
stain at week 1, but the stain did not increase during culture up to week 5. To the contrary,
Acomys cells cultured in CIM showed a faint level of patchy Alcian Blue staining which
increased progressively up to week 5. Mus or Acomys cells cultured in DMEMc did not stain
with Alcian Blue. We conclude that Alcian Blue staining suggests that Acomys ear cultures have
a greater propensity to differentiate to the chondrocyte fate than Mus cells.
Osteogenesis
Primary ear cultures for both Acomys and Mus were cultured under osteogenic conditions and
stained with Alizarin Red S to determine the degree of differentiation to the osteogenic fate over
the time course of 5 weeks. However, we did not observe Alizarin Red staining or morphological
differences between species or culture conditions, suggesting that osteogenic cells are not present
in either species (data not shown).
In conclusion, staining of differentiated Acomys and Mus cells with Oil Red and Alcian Blue
suggested that (at least) subpopulations contained in the culture of Mus are capable of adipogenic
differentiation while subpopulations contained in the culture of Acomys are capable of
chondrogenic differentiation.
2.3.6 Lineage Specific Marker Expression
Our initial observations using Oil Red and Alcian Blue stains suggested a that Acomys cultures
contained a subpopulation capable of differentiating to the chondrogenic fate (while not such
subpopulation was apparent in Mus), while Mus cultures seemed to contain a higher proportion
(compared to Acomys) capable of differentiating to the adipogenic fate. We sought to confirm
these differences by measuring expression of a number of marker genes specific for adipogenesis
or chondrogenesis during our 5 weeks differentiation protocol. Candidate marker genes are listed
in Table 3.
For all these genes, we designed primers that would amplify both Mus and Acomys genes. To do
so we aligned cDNA sequences from Mus (available in Genebank) with cDNA sequences of
Regeneration Studies in the African Spiny Mouse Diogo Prata
38
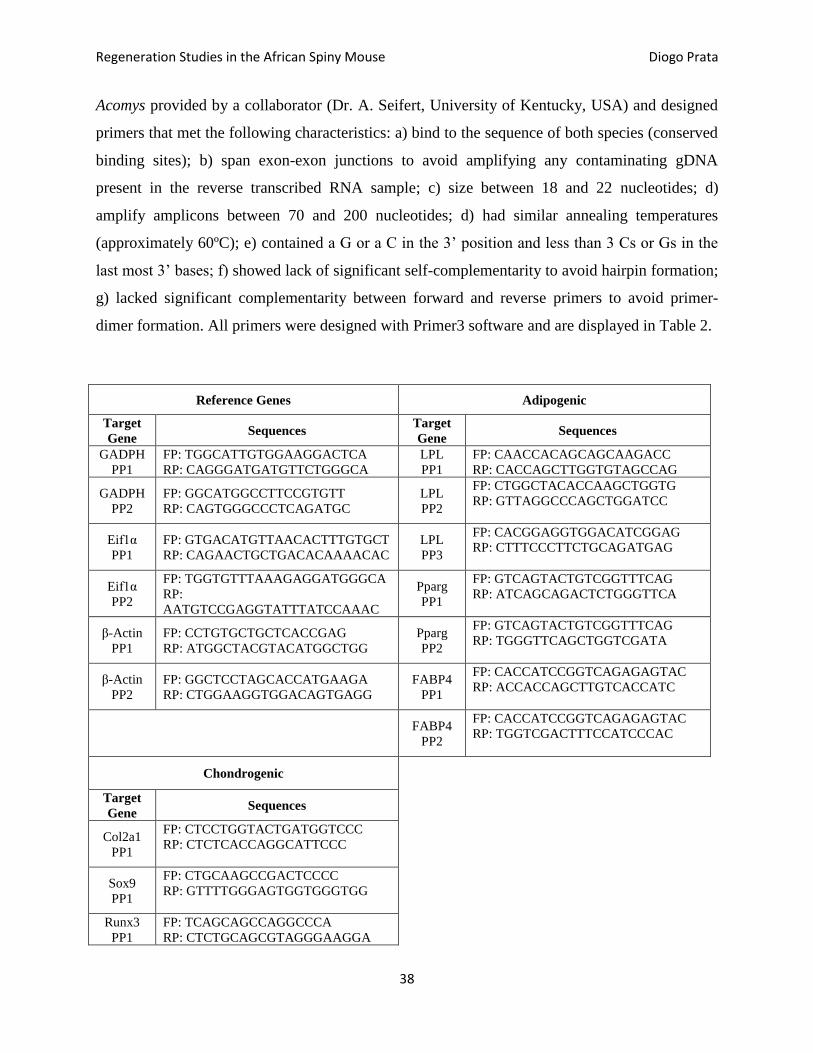
Acomys provided by a collaborator (Dr. A. Seifert, University of Kentucky, USA) and designed
primers that met the following characteristics: a) bind to the sequence of both species (conserved
binding sites); b) span exon-exon junctions to avoid amplifying any contaminating gDNA
present in the reverse transcribed RNA sample; c) size between 18 and 22 nucleotides; d)
amplify amplicons between 70 and 200 nucleotides; d) had similar annealing temperatures
(approximately 60ºC); e) contained a G or a C in the 3’ position and less than 3 Cs or Gs in the
last most 3’ bases; f) showed lack of significant self-complementarity to avoid hairpin formation;
g) lacked significant complementarity between forward and reverse primers to avoid primer-
dimer formation. All primers were designed with Primer3 software and are displayed in Table 2.
Reference Genes Adipogenic
Target
Gene Sequences
Target
Gene Sequences
GADPH
PP1
FP: TGGCATTGTGGAAGGACTCA
RP: CAGGGATGATGTTCTGGGCA
LPL
PP1
FP: CAACCACAGCAGCAAGACC
RP: CACCAGCTTGGTGTAGCCAG
GADPH
PP2
FP: GGCATGGCCTTCCGTGTT
RP: CAGTGGGCCCTCAGATGC
LPL
PP2
FP: CTGGCTACACCAAGCTGGTG
RP: GTTAGGCCCAGCTGGATCC
Eif1α
PP1
FP: GTGACATGTTAACACTTTGTGCT
RP: CAGAACTGCTGACACAAAACAC
LPL
PP3
FP: CACGGAGGTGGACATCGGAG
RP: CTTTCCCTTCTGCAGATGAG
Eif1α
PP2
FP: TGGTGTTTAAAGAGGATGGGCA
RP:
AATGTCCGAGGTATTTATCCAAAC
Pparg
PP1
FP: GTCAGTACTGTCGGTTTCAG
RP: ATCAGCAGACTCTGGGTTCA
β-Actin
PP1
FP: CCTGTGCTGCTCACCGAG
RP: ATGGCTACGTACATGGCTGG
Pparg
PP2
FP: GTCAGTACTGTCGGTTTCAG
RP: TGGGTTCAGCTGGTCGATA
β-Actin
PP2
FP: GGCTCCTAGCACCATGAAGA
RP: CTGGAAGGTGGACAGTGAGG
FABP4
PP1
FP: CACCATCCGGTCAGAGAGTAC
RP: ACCACCAGCTTGTCACCATC
FABP4
PP2
FP: CACCATCCGGTCAGAGAGTAC
RP: TGGTCGACTTTCCATCCCAC
Chondrogenic
Target
Gene Sequences
Col2a1
PP1
FP: CTCCTGGTACTGATGGTCCC
RP: CTCTCACCAGGCATTCCC
Sox9
PP1
FP: CTGCAAGCCGACTCCCC
RP: GTTTTGGGAGTGGTGGGTGG
Runx3
PP1
FP: TCAGCAGCCAGGCCCA
RP: CTCTGCAGCGTAGGGAAGGA
Regeneration Studies in the African Spiny Mouse Diogo Prata
39
Adamts5
PP1
FP: GCAAATGGCAGCACCAA
RP: CTGCCATTCCCAGGGTG
Table 2. Primer pairs designed for RT-qPCR (FP: forward primer; RP: reverse primer)
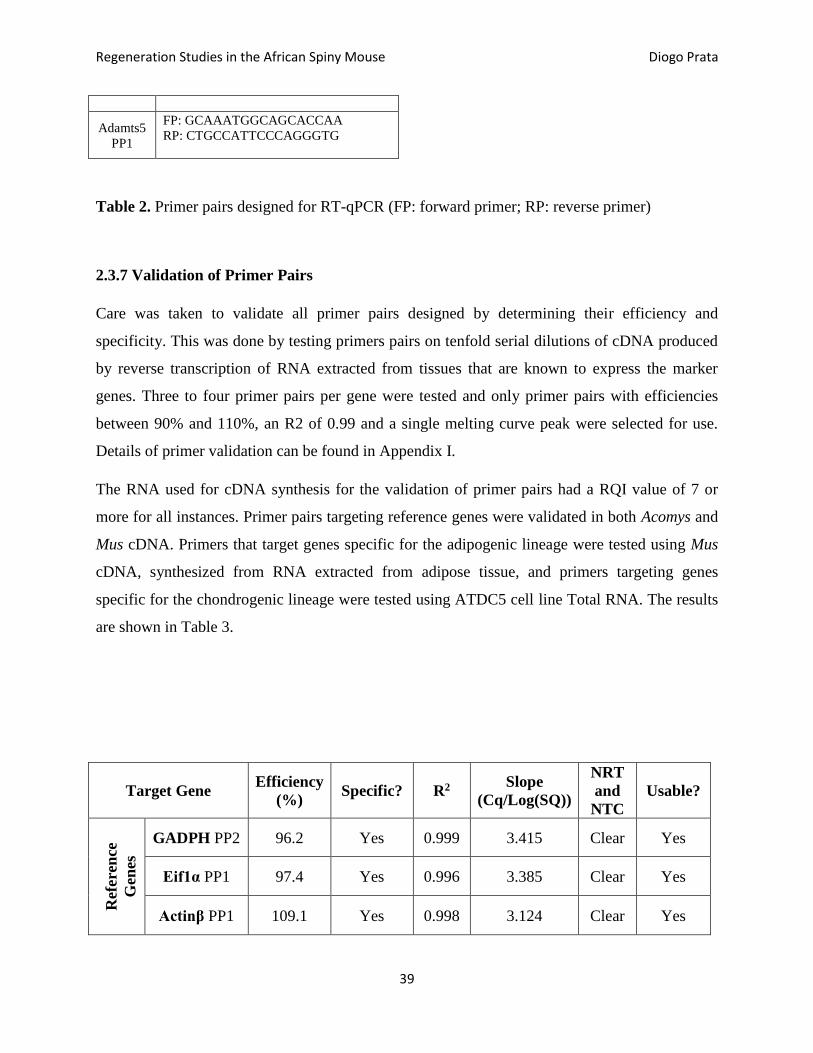
2.3.7 Validation of Primer Pairs
Care was taken to validate all primer pairs designed by determining their efficiency and
specificity. This was done by testing primers pairs on tenfold serial dilutions of cDNA produced
by reverse transcription of RNA extracted from tissues that are known to express the marker
genes. Three to four primer pairs per gene were tested and only primer pairs with efficiencies
between 90% and 110%, an R2 of 0.99 and a single melting curve peak were selected for use.
Details of primer validation can be found in Appendix I.
The RNA used for cDNA synthesis for the validation of primer pairs had a RQI value of 7 or
more for all instances. Primer pairs targeting reference genes were validated in both Acomys and
Mus cDNA. Primers that target genes specific for the adipogenic lineage were tested using Mus
cDNA, synthesized from RNA extracted from adipose tissue, and primers targeting genes
specific for the chondrogenic lineage were tested using ATDC5 cell line Total RNA. The results
are shown in Table 3.
Target Gene Efficiency
(%) Specific? R2
Slope
(Cq/Log(SQ))
NRT
and
NTC
Usable?
Ref
eren
ce
Gen
es
GADPH PP2 96.2 Yes 0.999 3.415 Clear Yes
Eif1α PP1 97.4 Yes 0.996 3.385 Clear Yes
Actinβ PP1 109.1 Yes 0.998 3.124 Clear Yes
Regeneration Studies in the African Spiny Mouse Diogo Prata
40
Ad
ipogen
ic G
enes
LPL PP2 99.7 Yes 0.965 3.329 Clear Yes
PPARG PP1 158.1.0 Yes 0.880 2.071 Clear No
PPARG PP2 107.7 Yes 0.955 3.151 Clear Yes
FABP4 PP1 109.7 Yes 0.994 3.005 Clear Yes
Ch
on
dro
gen
ic
Gen
es
Sox9 PP1 338.5 Yes 0.626 1.558 Clear No
Sox9 PP2 98.9 No 0.308 0.513 Clear No
Col2α1 PP1 100,4 Yes 0.926 3.313 Clear No
Col2α1 PP2 103.4 Yes 0.985 3.243 Clear Yes
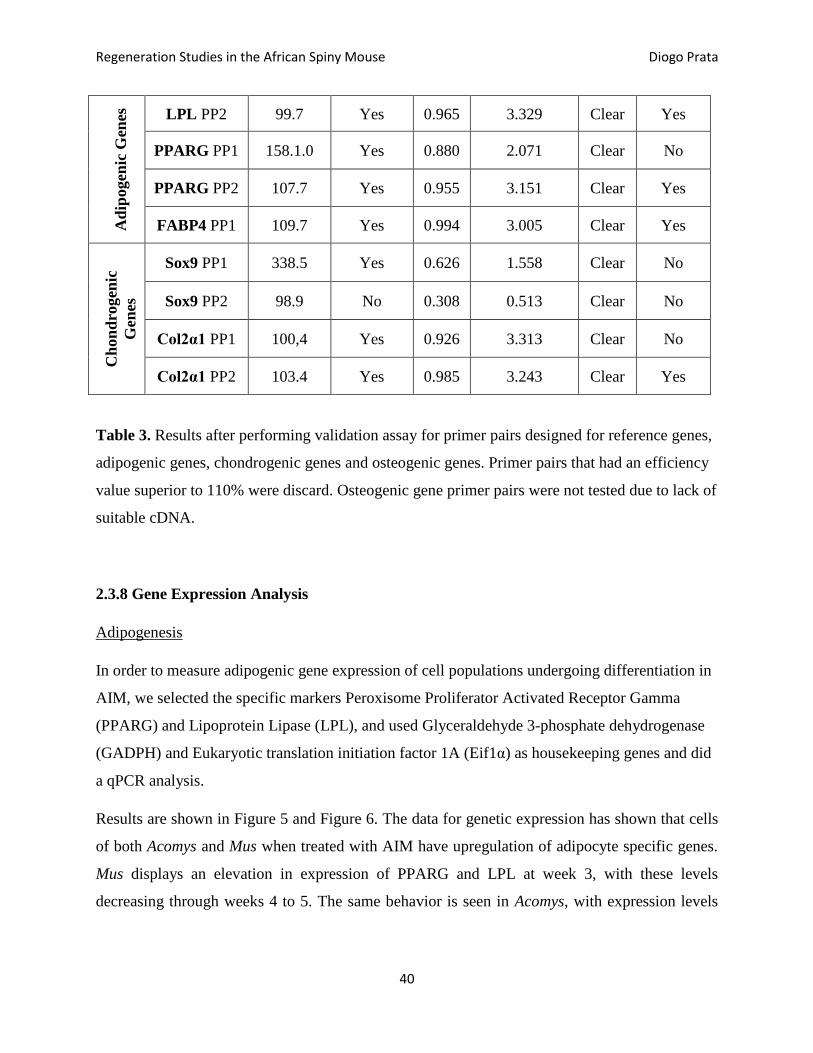
Table 3. Results after performing validation assay for primer pairs designed for reference genes,
adipogenic genes, chondrogenic genes and osteogenic genes. Primer pairs that had an efficiency
value superior to 110% were discard. Osteogenic gene primer pairs were not tested due to lack of
suitable cDNA.
2.3.8 Gene Expression Analysis
Adipogenesis
In order to measure adipogenic gene expression of cell populations undergoing differentiation in
AIM, we selected the specific markers Peroxisome Proliferator Activated Receptor Gamma
(PPARG) and Lipoprotein Lipase (LPL), and used Glyceraldehyde 3-phosphate dehydrogenase
(GADPH) and Eukaryotic translation initiation factor 1A (Eif1α) as housekeeping genes and did
a qPCR analysis.
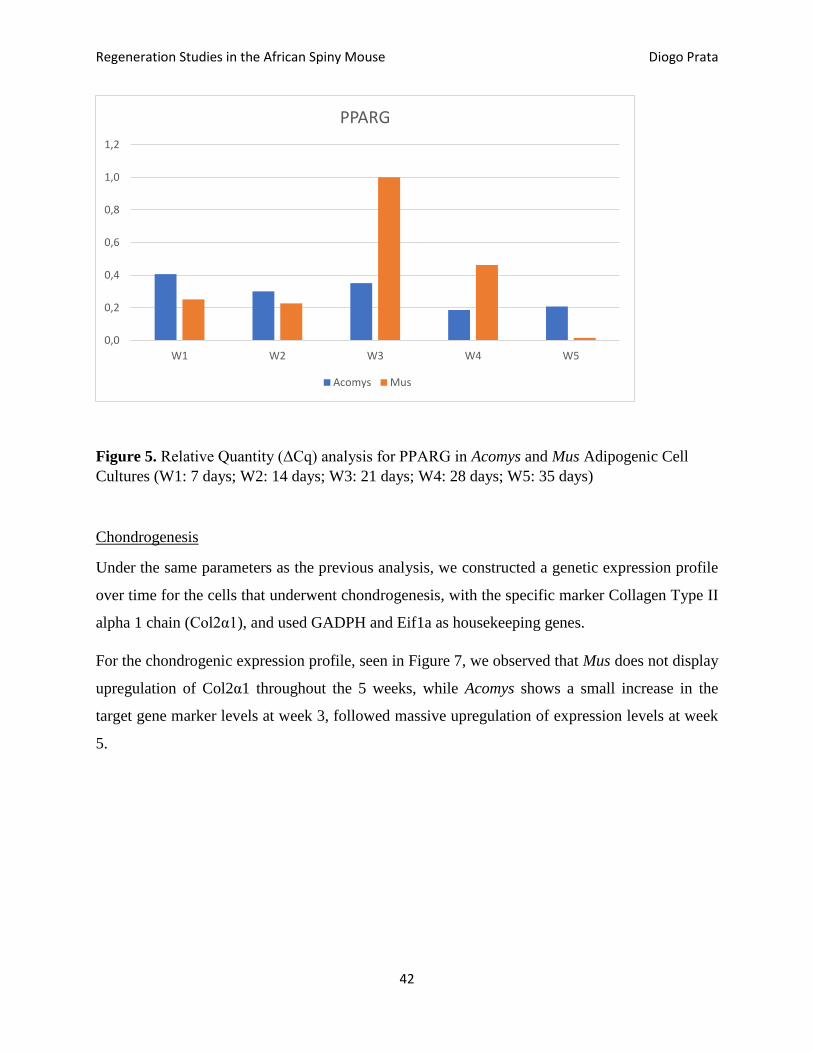
Results are shown in Figure 5 and Figure 6. The data for genetic expression has shown that cells
of both Acomys and Mus when treated with AIM have upregulation of adipocyte specific genes.
Mus displays an elevation in expression of PPARG and LPL at week 3, with these levels
decreasing through weeks 4 to 5. The same behavior is seen in Acomys, with expression levels
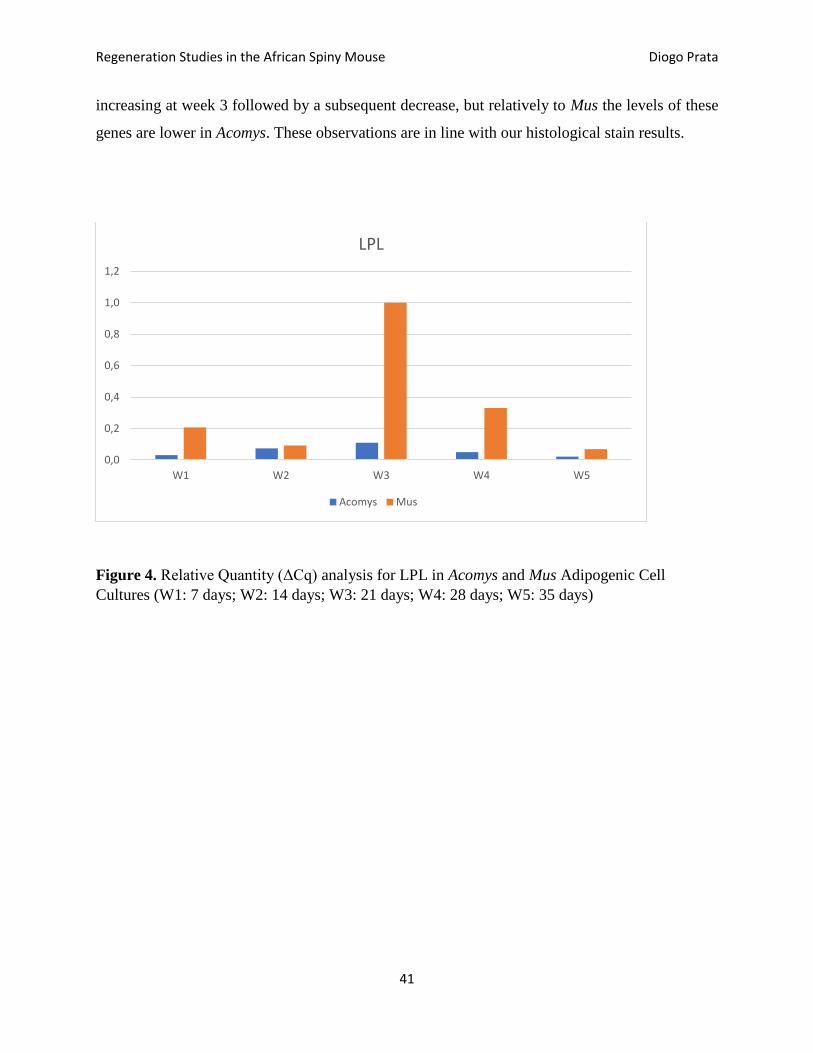
Regeneration Studies in the African Spiny Mouse Diogo Prata
41
increasing at week 3 followed by a subsequent decrease, but relatively to Mus the levels of these
genes are lower in Acomys. These observations are in line with our histological stain results.
Figure 4. Relative Quantity (ΔCq) analysis for LPL in Acomys and Mus Adipogenic Cell
Cultures (W1: 7 days; W2: 14 days; W3: 21 days; W4: 28 days; W5: 35 days)
0,0
0,2
0,4
0,6
0,8
1,0
1,2
W1 W2 W3 W4 W5
LPL
Acomys Mus
Regeneration Studies in the African Spiny Mouse Diogo Prata
42
Figure 5. Relative Quantity (ΔCq) analysis for PPARG in Acomys and Mus Adipogenic Cell
Cultures (W1: 7 days; W2: 14 days; W3: 21 days; W4: 28 days; W5: 35 days)
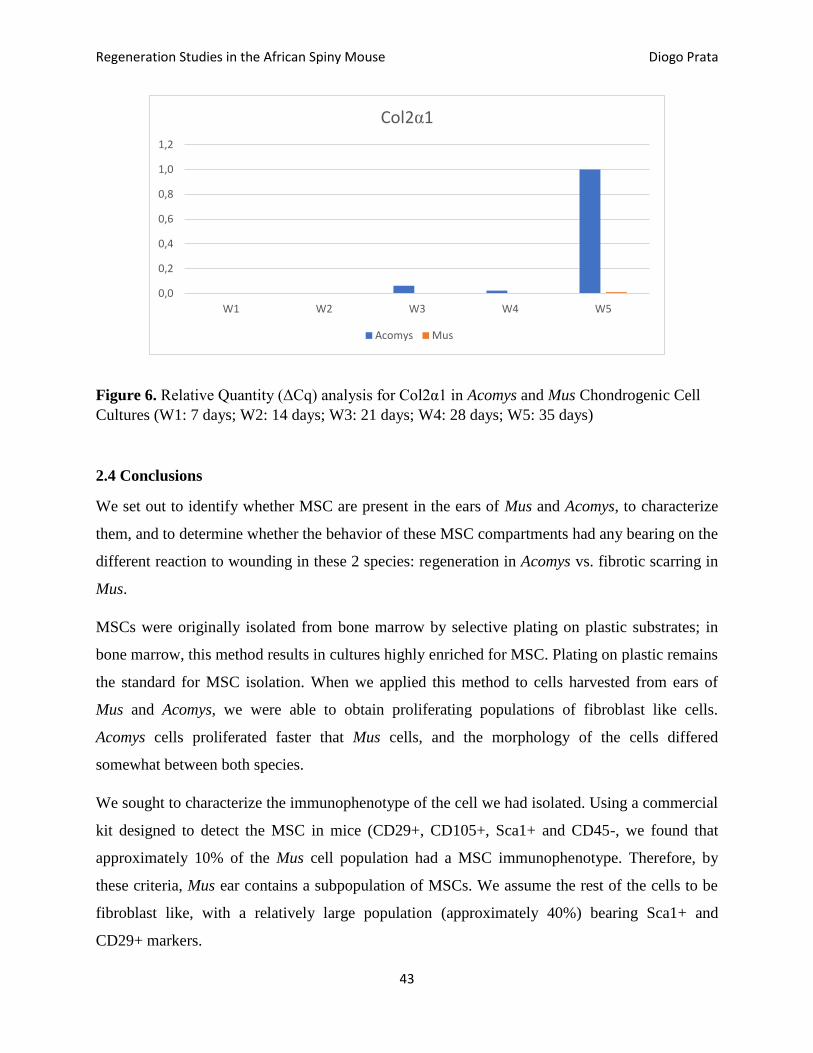
Chondrogenesis
Under the same parameters as the previous analysis, we constructed a genetic expression profile
over time for the cells that underwent chondrogenesis, with the specific marker Collagen Type II
alpha 1 chain (Col2α1), and used GADPH and Eif1a as housekeeping genes.
For the chondrogenic expression profile, seen in Figure 7, we observed that Mus does not display
upregulation of Col2α1 throughout the 5 weeks, while Acomys shows a small increase in the
target gene marker levels at week 3, followed massive upregulation of expression levels at week
5.
0,0
0,2
0,4
0,6
0,8
1,0
1,2
W1 W2 W3 W4 W5
PPARG
Acomys Mus
Regeneration Studies in the African Spiny Mouse Diogo Prata
43
Figure 6. Relative Quantity (ΔCq) analysis for Col2α1 in Acomys and Mus Chondrogenic Cell
Cultures (W1: 7 days; W2: 14 days; W3: 21 days; W4: 28 days; W5: 35 days)
2.4 Conclusions
We set out to identify whether MSC are present in the ears of Mus and Acomys, to characterize
them, and to determine whether the behavior of these MSC compartments had any bearing on the
different reaction to wounding in these 2 species: regeneration in Acomys vs. fibrotic scarring in
Mus.
MSCs were originally isolated from bone marrow by selective plating on plastic substrates; in
bone marrow, this method results in cultures highly enriched for MSC. Plating on plastic remains
the standard for MSC isolation. When we applied this method to cells harvested from ears of
Mus and Acomys, we were able to obtain proliferating populations of fibroblast like cells.
Acomys cells proliferated faster that Mus cells, and the morphology of the cells differed
somewhat between both species.
We sought to characterize the immunophenotype of the cell we had isolated. Using a commercial
kit designed to detect the MSC in mice (CD29+, CD105+, Sca1+ and CD45-, we found that
approximately 10% of the Mus cell population had a MSC immunophenotype. Therefore, by
these criteria, Mus ear contains a subpopulation of MSCs. We assume the rest of the cells to be
fibroblast like, with a relatively large population (approximately 40%) bearing Sca1+ and
CD29+ markers.
0,0
0,2
0,4
0,6
0,8
1,0
1,2
W1 W2 W3 W4 W5
Col2α1
Acomys Mus
Regeneration Studies in the African Spiny Mouse Diogo Prata
44
The use of this commercial kit on Acomys cells had the uncertainty of the possibility that the
antibodies raised against Mus markers would not react against the same markers in Acomys.
Indeed, our FACS analysis labeled very few cells of Acomys with any combination of antibodies.
However, we did detect Acomys cells that were marked with either Sca1 or CD29, suggesting
that these antibodies may be recognizing their intended epitopes in Acomys. However, very few
cells (0.84%) had both markers. It therefore follows that there is no population bearing the MSC
immunophenotype in Acomys. However, it is possible that the Sca1 and CD29 antibodies (raised
against and validated for Mus epitopes) are cross-reacting with other, unknown epitopes in
Acomys. In this case, our immunophenotyping results in Acomys would be inconclusive.
While there is a generally accepted immunophenotype for MSC, this population is operationally
defined by their ability to differentiate into adipocytes, chondrocytes and osteocytes. Considering
the possibility that Mus or Acomys ears could contain cells with multilineage differentiation
potential regardless of whether their immunophenotype conforms to the accepted profile, we
sought to test and compare the ability of Mus and Acomys ear cells to differentiate to these three
cell fates.
Our in vitro differentiation experiments show that Mus and Acomys ear cell populations have
different differentiation biases. Mus cells (but not Acomys cells) tend to differentiate to the
adipocyte lineage when cultured in AIM, while Acomys cells (but not Mus cells) tend to
differentiate to the chondrocyte lineage when cultured in CIM. These results were suggested first
by analyzing the differentiated culture using commonly used histological stains (Oil Red and
Alcian Blue). No staining for osteocytes (Alizarin Red) was detected for either species when
cultured in OIM. The level of staining observed with Oil Red and Alcian Blue after 5 weeks of
differentiation was relatively weak, suggesting that only a fraction of the cells in the starting
culture were differentiating. It would be interesting to see the differentiation potential of a Mus
populations sorted for the MSC immunophenotype in order to test and confirm whether this
population has a strong MSC like differentiation behavior. In any case, our results were by
expression analysis of adipocyte (LPL and PPARG) and chondrocyte (Col2α1) markers.
Adipocyte markers were upregulated at later time points in Mus compared to Acomys when
cultured in AIM. There was a slight discrepancy in our staining vs. expression analysis results in
that maximum Oil Red staining was seen at 5 weeks, while maximum expression of adipocyte
Regeneration Studies in the African Spiny Mouse Diogo Prata
45
markers was seen at week 3 and decreased thereafter. Similarly, the chondrocyte marker
Col2α1was upregulated in week 3 of differentiation in Acomys cells, but not in Mus cells, when
cells were cultured in CIM. In this case, maximum staining and maximum marker expression
coincided at 5 weeks of culture in CIM.
Overall, we conclude that
1) a subpopulation of cells with the canonical MSC immunophenotype exists in Mus ears.
However, we did not test whether this population is can indeed differentiate to the 3 fates
(adipogenic, chondrogenic and osteogenic) required to confirm that they are indeed MSC.
2) We cannot confirm or rule out whether there is a population bearing the canonical MSC
immunophenotype in Acomys ears.
3) Cultures obtained from Mus ears contain cells capable of differentiating into adipocytes.
4) Cultures obtained from Acomys ears contain cells capable of differentiating into
chondrocytes. This observation is completely consistent with the confirmed ability of
Acomys to regenerated cartilage in response to wounding.
2.5 Bibliographical References
Baghaban E. M., Bordbar S., “Isolation and Characterization of the Progenitor Cells from
the Blastema Tissue Formed at Experimentally-Created Rabbit Ear Hole”. Iranian Journal
of Basic Medical Sciences, (2013) 16(2), pp. 109-115
Casanellas I., “The in vitro differentiation potential of Mus musculus vs. Acomys cahirinus ear
cell populations” (Master Thesis, University of Algarve, 2015).
Dominici M., Le Blanc K., Mueller I., Slaper-Cortenbach I., Marini F. C., Krause D. S., Deans
R. J., Keating A., Prockop D. J., Horwitz E. M., “Minimal criteria for defining multipotent
mesenchymal stromal cells”. The International Society for Cellular Therapy position statement,
Cytotherapy, (2006), Vol. 8, No. 4, 315-317
Fiorina P., Jurewicz M., Augello A., Vergani A., Dada S., Selig M., Godwin J., Law K., Placidi
R. N., Capella C., Rodig S., Adra C. N., Atkinson M., Sayegh M. H., Abdi R.,
Regeneration Studies in the African Spiny Mouse Diogo Prata
46
“Immunomodulatory function of bone marrow-derived mesenchymal stem cells in
experimental autoimmune type 1 diabetes”, Journal Immunology, (2009), 183(2), pp. 993-
1004
Herlofsen S. R., Kuchler A. M., Melvik J. E., Brinchmann J.E., “Chondrogenic Differentiation
of Human Bone Marrow-Derived Mesenchymal Stem Cells in Self-Gelling Alginate Discs
Reveals Novel Chondrogenic Signature Gene Clusters”, Tissue Engineering Part A, 17(7-8),
pp. 1003-1013
Keating A., “Mesenchymal Stromal Cells: New Directions”, Cell Stem Cell (2012), 10, 709-
716
Kolluri K. K., Laurent G. J., Janes S. M., “Mesenchymal Stem Cells as Vectors for Lung
Cancer Therapy”, Respiration, (2013), 85, pp. 443-451
Mundra V., Gerling C. I., Mahato R. I, “Mesenchymal Stem Cell-Based Therapy”, Mol.
Pharm., (2013), 10(1), pp.77-89
Newman B., Gigout L. I., Sudre L., Grant M. E., Wallis G. A., “Coordinated expression of
matrix GLA protein is required during ossification for chondrocyte survival”. The Journal
of Cell Biology, 153(3), pp. 659-666
Nombela-Arrieta C., Ritz J., Silberstein L. E., “The elusive nature and function of
mesenchymal stem cells”, Nat Rev Mol Cell Biol., (2011), 12(2), pp.126-131
Rohban R., Pieber T. R., “Mesenchymal Stem and Progenitor Cells in Regeneration: Tissue
Specificity and Regenerative Potential”, Stem Cells International, (2017), pp. 1-16
Santos T. M., Percegona L. S., González P., Faucz F. R., Câmara N. O., Aita C. A., “Expression
of pancreatic endocrine markers by mesenchymal stem cells from umbilical cord vein”,
Transplant Proc, (2010), 42(2), pp.563--5
Uccelli A., Moretta L., Pistoia V., “Mesenchymal Stem Cells in Health and Disease”, Nature
Reviews Immunology (2008), Vol. 8, 726-736
Vater C., Kasten P., Stiehler M., “Culture Media for differentiation of mesenchymal stromal
cells”, Acta Biomaterialia, (2011), 7, 463-477
Wang Y., Chen X., Cao W. Shi Y., “Plasticity of mesenchymal stem cells in
immunomodulation: pathological and therapeutic implications”, Nature Immunology,
(2014), 15(11), pp. 1009-1016

Regeneration Studies in the African Spiny Mouse Diogo Prata
47
Wei X., Yang X., Han Z., Qu F., Shao L., Shi Y., “Mesenchymal stem cells: a new trend for
cell therapy”, Acta Pharmacologica Sinica, (2013), 34, pp. 747-754
Regeneration Studies in the African Spiny Mouse Diogo Prata
48
Chapter 3.
Is Telomerase involved in Ear Regeneration of Acomys cahirinus?
3.1 Introduction
In species with linear chromosomes, DNA ends are protected from genomic instability by
telomeres. Telomeres are long complex ribonucleoprotein structures formed by extensive
TACGGG hexameric repeats. In order to divide, a cell Must first replicate its entire genome.
Organisms with linear chromosomes face the problem of how to replicate chromosome ends.
During replication, DNA polymerase catalyzes the addition of a nucleotide to the 3’OH of the
preceding nucleotide in a 5’ to 3’ direction using the complementary DNA strand as a template.
Because DNA replication of the lagging strand uses Okazaki fragments to provide 3’OH termini,
the replication machinery cannot replicate the 3’ end of the chromosome, leaving a 3’ single
strand overhang at the end of the chromosome that is degraded. As a result, the chromosome is
shortened by an average of 50 kb per cycle. This is known as the end-replication problem. The
observation that normal, differentiated cells in culture enter replicative senescence after a
characteristic number of cell divisions (Hayflick limit) (Calado et. al. 2013, Shay et. al. 2000), a
phenomenon that is explained by telomeres shortening to the point that chromosome stability can
no longer be sustained. Telomere attrition can result in chromosomal instability and aneuploidy,
which can contribute to the development of cancer if tumor suppressor alleles are lost and/or
generation of fusion genes with altered functions (Li et. al. 2009).
In most adult somatic cells undergoing continuous replication, telomere shortening is
unavoidable. However, in certain cell types, such as stem/progenitor cells and some cancer cells,
telomere length is maintained due to upregulation of expression of the enzyme telomerase.
Telomerase is a holoenzyme formed by two main components, the telomerase reverse
transcriptase (TERT, encoded by the gene Tert (Blasco et al 2005), and an RNA component
(TERC).
Telomerase catalyzes telomere extension; TERC provides a template for hexameric repeats.
Telomerase recognizes the 3-OH group of the G-band overhang as a binding region, and it is
from there that it initiates de novo addition of TCAGGG repeats, thus elongating chromosome
ends (Blasco et al 2005). Telomeres also prevent the double strand break repair machinery from
Regeneration Studies in the African Spiny Mouse Diogo Prata
49
recognizing DNA chromosome ends as breaks (Li et al 2009, Flores et al 2006). The telomere
maintenance system, or more accurately telomerase, have been proposed to play a major role in
organism ageing, cancer development and, of more relevance for our line of work, in
regeneration events (REF).
Tert gene up-regulation is essential in proliferating cell populations, and it has been observed
that in species with strong regenerative capability, such as in the zebrafish (Danio rerio), there is
a constitutively abundant telomerase activity in somatic tissues from embryos to aged adults. In
many invertebrate and vertebrate aquatic species that show increased regenerative capacity, such
as the Japanese medaka fish (Oryzias latipes), a well characterized model for studies of the
telomere maintenance system there is an upregulation of TERT during regeneration events
(Anchelin et al 2010, Elmore et al 2008).
Zebrafish regenerates many of its tissues and structures after physical injury, and the process
results in a functional structure without evidence of fibrotic scar. This regenerative event
proceeds through a transient blastema stage, a hallmark of epimorphic regeneration. It has been
show in Zebrafish (danio rerio) that TERT is upregulated during tissue regeneration events
(Anchelin et al 2010, Elmore et al 2008).
The importance of telomerase for regeneration is not limited to skin tissue, but other vital organs,
such as heart, where reports indicate that after heart injury, absence of telomerase activity
drastically impairs proliferation, there is a lack of apoptosis protection and cells display a
senescent phenotype (Flores et al 2015). Another study in mice heart regeneration determined
that telomere shortening negatively impacts cardiomyocyte cell-cycle arrest, and results in
impaired repair of heart lesions (Aix et al 2016). In this study, it was seen that telomere
shortening results in up-regulation of cell-cycle inhibitor p21, and inhibition of cardiomyocyte
proliferation. In contrast, mice with a knockout for p21 (p21-/-) displayed robust proliferation of
cardiomyocytes, whilst mice with the RNA template knockout (Terc-/-) showed severe telomere
shortening, shorter lifespans, upregulation of p21 and significantly lower proliferation of
cardiomyocytes when compared to wild-type mice. These findings highlight an important role of
the telomere maintenance system in injury response events in mammalian heart (Aix et al 2016).
Regeneration Studies in the African Spiny Mouse Diogo Prata
50
We set out to answer a simple question: is TERT upregulated during regeneration of full
thickness ear pina wounds in Acomys cahirinus?
3.2 Materials and Methods
3.2.1 Ear Wound Regeneration Assay
In order to obtain tissue samples representative of key points in the regenerative process, animals
we anesthetized with isofluorane, and 4 mm full thickness circular ear wounds were made
bilaterally to Acomys or Mus individuals using a Biopsy Punch (Miltex 33-34). The resulting ear
pinna tissue disc was flash frozen and stored at -80C, or, alternatively, processed immediately.
This sample provided TERT expression levels in uninjured tissue.
Animals were kept in isolated clean boxes and allowed to regenerate (Acomys) or heal (Mus)
their wounds. After 30 days, Acomys wounds had formed a clearly visible blastema, while Mus
wounds had healed the borders of their wounds with fibrotic scarring.
A group of animals for each species were chosen randomly, anesthetized and their ears
harvested. These samples were further microdisected into 2 compartments called ‘ring’ and
‘rest’. A 1 mm thick circular ring of tissue encompassing the blastema (in Acomys) or the fibrotic
scar (in Mus) was harvested by microdissection, flash frozen and stored at -80C (‘ring’), or,
alternatively, processed immediately. These samples provided a measure of TERT levels in the
blastema of during Acomys regeneration and in the corresponding region in Mus ears (which
presented scarred tissue) at the 30 day after injury time-point. The remaining ear tissue (after the
‘ring’ tissue was microdissected was also harvested (‘rest) and were used to measure TERT
levels in tissue neighboring the wound but not itself undergoing regeneration or scarring.
A second group of animals were allowed to continue regenerating (Acomys) until the wound was
completely closed (approximately 60 days after injury). At this time, ears were harvested and
further microdisected into 2 compartments called ‘regenerated disc’ and ‘rest’. The regenerated
disc consisted in the 4-mm diameter circle of regenerated tissue corresponding to the original
disc cut to create the initial wound. The remaining ear was called ‘rest’. Both samples were flash
frozen and stored at -80C.
Regeneration Studies in the African Spiny Mouse Diogo Prata
51
We did not collect a 60 day time point equivalent for Mus, as, due to the fact that Mus does not
regenerate and healing is complete at 30 days post-injury, the resulting compartment would be
similar to those already obtained at 30 days post-injury.
3.2.2 Tissue Harvest and RNA Extraction
Final optimized protocol is extensively described in the Results and Discussion section, under
“Optimization of a Total RNA Extraction protocol from tissues of Acomys cahirinus”
3.2.3 RT-qPCR
Total RNA (500 µg) was reverse transcribed (resulting in a RT+ cDNA fraction) using an iScript
cDNA Synthesis Kit (Bio-Rad, 170-8891), following the manufacturer’s instructions. A control
reaction was set up without reverse transcriptase (RT- cDNA fraction). Reactions were
conducted in a C1000 Touch Thermal Cycler (Bio-Rad). Quantitative PCR was performed using
SSoFast EvaGreen Supermix (Bio-Rad, 172-5201) in a 96 well plate format on a CFX96 Real-
Time PCR System (Bio-Rad).
3.3 Results and Discussion
3.3.1 Optimization of a Total RNA Extraction from Ear Tissue
In an initial attempt at total RNA extraction from Acomys tissue, two commercial column kits
were used: NZYTech (NZY Total RNA Isolation kit, MB13402) and Qiagen (RNeasy Mini Kit,
Cat. No. 74104).
Prior to initiating the column kit extraction protocol, fresh tissue or frozen tissue was placed in a
petri dish, on ice, and cut into a ‘pulp’ using sterile scalpel blades. The tissue was transferred
into a DEPC-treated Eppendorf and the lysis buffer from the column kit was added, with volume
varying depending on protocol and volume of tissue and manufacturers instruction were
followed exactly. An aliquot of 2 µl was taken to analyze RNA quality and quantity, and the
remainder of the RNA extract was stored at -80ºC. These procedures resulted in
Regeneration Studies in the African Spiny Mouse Diogo Prata
52
An average RNA concentration of 300 ng/µl and an acceptable absorbance ratio A260/A280 (1.9
- 2.2), measured by NanoDrop (Thermo Scientific 2000c), subsequent analysis by Experion
(Bio-Rad, #700-7000) showed that the samples were very degraded, with RQI varying between
4.0 and 5.0.
Given that the acceptable RQI value for genetic expression analysis by RT-qPCR is of 7.0 or
above, we set out to optimize a protocol for the total extraction of RNA from Acomys tissue. We
therefore varied a number of parameters of the extraction protocol.
Initially we reasoned that because ear tissue is highly fibrous, incomplete disruption of the tissue
prior to addition of the extraction buffer might be resulting in incomplete neutralization of
endogenous RNAses and therefore, RNA degradation.
Several procedures were devised and tested:
Procedure 1: Mechanical maceration of the tissue with scalpels followed by proteinase K
digestion during 30 minutes.
Procedure 2: Freezing of tissue with liquid nitrogen, mechanical maceration with mortar and
pestle, followed by proteinase K digestion for 30 minutes.
Procedure 3: Mechanical maceration of the tissue with scalpels, followed by further maceration
using a Mini Potter Tissue Grinder 0,1 mL (GPE Scientific 20404F), while tissue is submerged
in the column kit’s lysis buffer.
Procedure 4: Mechanical maceration of the tissue with scalpel blades followed by NZYol
(nzytech, Cat No. MB18501) RNA extraction (a phenol based extraction followed by
precipitation with isopropanol).
Procedures 1, 2 and 3 resulted in complete digestion of the tissue but high levels of RNA
degradation. We concluded that prolonged incubation in proteinase K, or use of a Mini Potter
Tissue Grinder 0,1 mL (GPE Scientific 20404F), while efficiently digesting the tissue, allowed
an ample window for RNAses to act.
Procedure 4, a phenol based RNA extraction method, was the only method that resulted in a
larger yield of RNA with better quality. However, Experion analysis indicated that RIN values (5
to 6.5), while improved, were still relatively low. Furthermore, initial RT-qPCR assays using
Regeneration Studies in the African Spiny Mouse Diogo Prata
53
these samples indicated gDNA contamination. Procedure 4 was therefore modified into
Procedure 5.
Procedure 5: Mechanical maceration of the tissue using scalpel blades, followed by phenol
extraction (NZYol). However, the aqueous phase was not precipitated with isopropanol as in
Procedure 4, but loaded onto a RNA affinity binding column (Quick-RNA MiniPrep, Cat. No.
R1054). DNAse I solution was added to the column, after which the column was washed and
RNA eluted.
Procedure 5 resolved our issues with gDNA contamination, and provided RQI levels > 6 in
Experion analysis, which was closer (although did not meet) the level of RQI = 7 recommended
by MIQUE.
Procedure 6: We therefore developed a final procedure based on a newly acquired equipment
called a Bullet Blender. This procedure involves putting the sample in a tube with a phenol based
extraction buffer and a small number of solid beads that are machine vibrates at high speed,
resulting in quick and thorough homogenization of the samples and reducing time of extraction.
Both metallic and ceramic beads were tested. Ceramic beads proved preferable to metallic beads
in several ways: a) they disrupted the tissue more efficiently; b) leftover sample ‘sticked’ less to
ceramic beads than metallic beads and c) the aqueous phase was translucent (as opposed to
yellowish when metallic beads were used). The aqueous phase was subject to isopropanol
precipitation and the RNA resuspended in DEPc treated water. Finally, DNAse I was added to
the preparation, incubated at 37C for 10 minutes and inactivated by adding 0.1 mM EDTA and
incubating at 75C FOR 15 minutes. This procedure consistently gave good yields and RIN
values between 6.6 and 8.7.
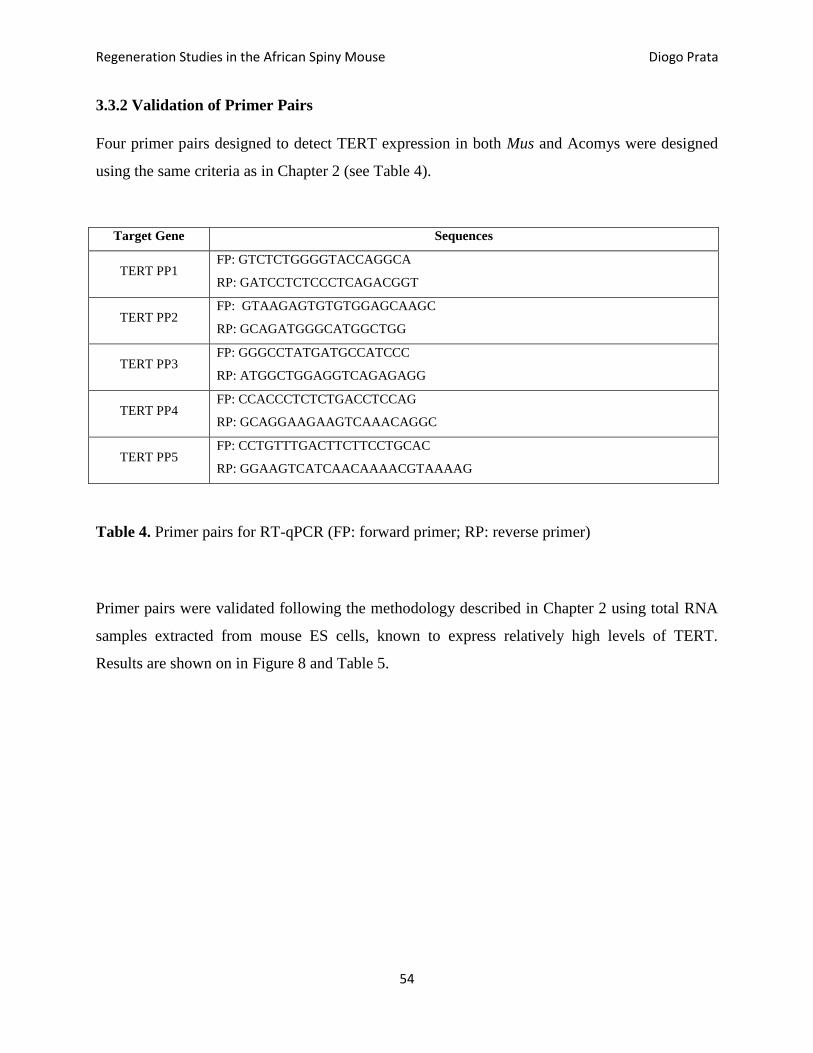
Regeneration Studies in the African Spiny Mouse Diogo Prata
54
3.3.2 Validation of Primer Pairs
Four primer pairs designed to detect TERT expression in both Mus and Acomys were designed
using the same criteria as in Chapter 2 (see Table 4).
Table 4. Primer pairs for RT-qPCR (FP: forward primer; RP: reverse primer)
Primer pairs were validated following the methodology described in Chapter 2 using total RNA
samples extracted from mouse ES cells, known to express relatively high levels of TERT.
Results are shown on in Figure 8 and Table 5.
Target Gene Sequences
TERT PP1 FP: GTCTCTGGGGTACCAGGCA
RP: GATCCTCTCCCTCAGACGGT
TERT PP2 FP: GTAAGAGTGTGTGGAGCAAGC
RP: GCAGATGGGCATGGCTGG
TERT PP3 FP: GGGCCTATGATGCCATCCC
RP: ATGGCTGGAGGTCAGAGAGG
TERT PP4 FP: CCACCCTCTCTGACCTCCAG
RP: GCAGGAAGAAGTCAAACAGGC
TERT PP5 FP: CCTGTTTGACTTCTTCCTGCAC
RP: GGAAGTCATCAACAAAACGTAAAAG
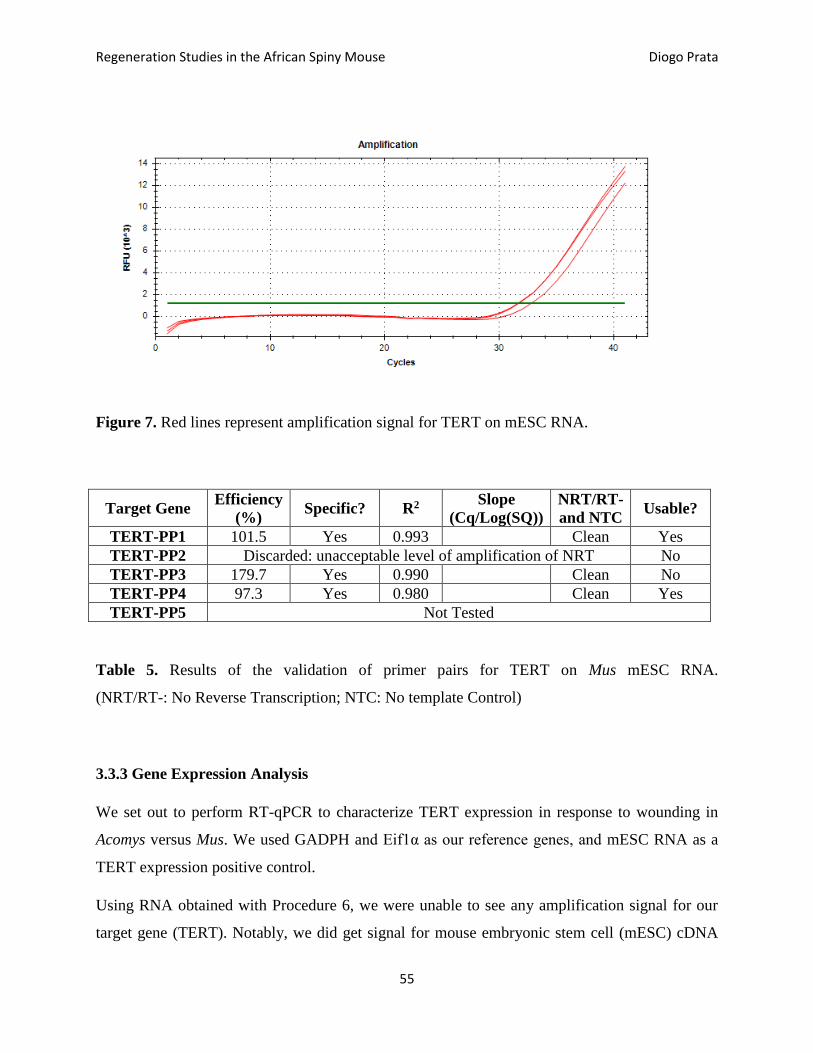
Regeneration Studies in the African Spiny Mouse Diogo Prata
55
Figure 7. Red lines represent amplification signal for TERT on mESC RNA.
Target Gene Efficiency
(%) Specific? R2
Slope
(Cq/Log(SQ))
NRT/RT-
and NTC Usable?
TERT-PP1 101.5 Yes 0.993 Clean Yes
TERT-PP2 Discarded: unacceptable level of amplification of NRT No
TERT-PP3 179.7 Yes 0.990 Clean No
TERT-PP4 97.3 Yes 0.980 Clean Yes
TERT-PP5 Not Tested
Table 5. Results of the validation of primer pairs for TERT on Mus mESC RNA.
(NRT/RT-: No Reverse Transcription; NTC: No template Control)
3.3.3 Gene Expression Analysis
We set out to perform RT-qPCR to characterize TERT expression in response to wounding in
Acomys versus Mus. We used GADPH and Eif1α as our reference genes, and mESC RNA as a
TERT expression positive control.
Using RNA obtained with Procedure 6, we were unable to see any amplification signal for our
target gene (TERT). Notably, we did get signal for mouse embryonic stem cell (mESC) cDNA
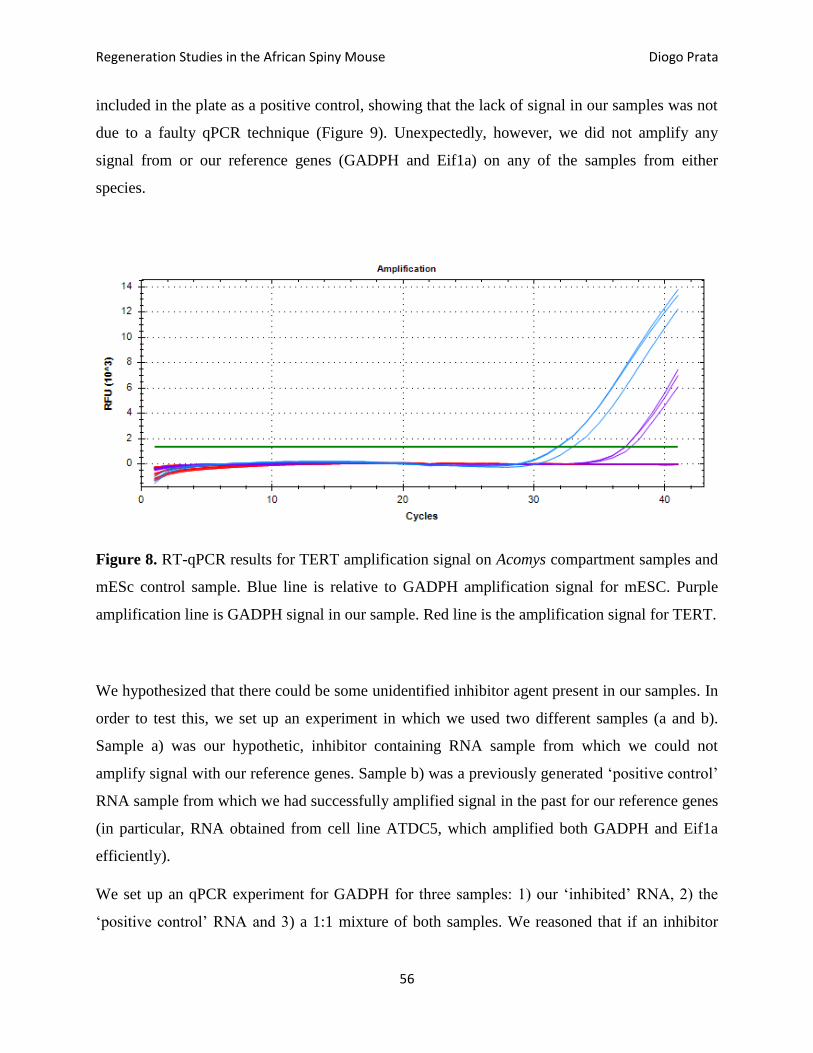
Regeneration Studies in the African Spiny Mouse Diogo Prata
56
included in the plate as a positive control, showing that the lack of signal in our samples was not
due to a faulty qPCR technique (Figure 9). Unexpectedly, however, we did not amplify any
signal from or our reference genes (GADPH and Eif1a) on any of the samples from either
species.
Figure 8. RT-qPCR results for TERT amplification signal on Acomys compartment samples and
mESc control sample. Blue line is relative to GADPH amplification signal for mESC. Purple
amplification line is GADPH signal in our sample. Red line is the amplification signal for TERT.
We hypothesized that there could be some unidentified inhibitor agent present in our samples. In
order to test this, we set up an experiment in which we used two different samples (a and b).
Sample a) was our hypothetic, inhibitor containing RNA sample from which we could not
amplify signal with our reference genes. Sample b) was a previously generated ‘positive control’
RNA sample from which we had successfully amplified signal in the past for our reference genes
(in particular, RNA obtained from cell line ATDC5, which amplified both GADPH and Eif1a
efficiently).
We set up an qPCR experiment for GADPH for three samples: 1) our ‘inhibited’ RNA, 2) the
‘positive control’ RNA and 3) a 1:1 mixture of both samples. We reasoned that if an inhibitor
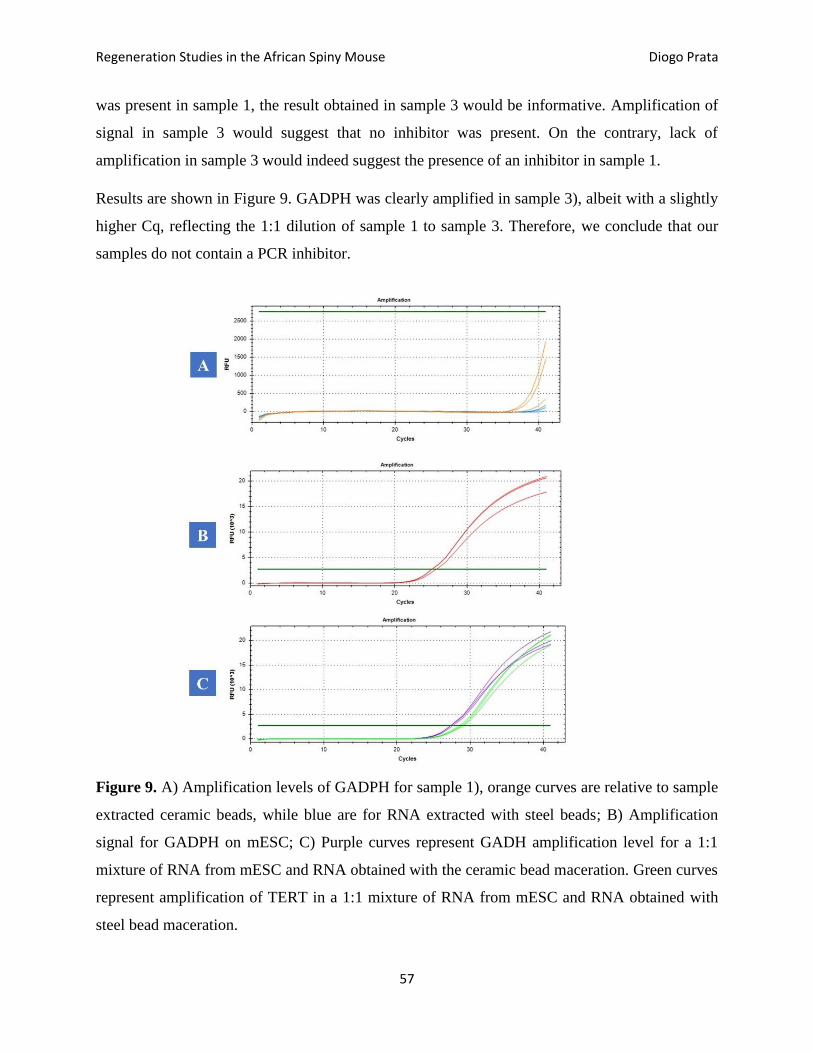
Regeneration Studies in the African Spiny Mouse Diogo Prata
57
was present in sample 1, the result obtained in sample 3 would be informative. Amplification of
signal in sample 3 would suggest that no inhibitor was present. On the contrary, lack of
amplification in sample 3 would indeed suggest the presence of an inhibitor in sample 1.
Results are shown in Figure 9. GADPH was clearly amplified in sample 3), albeit with a slightly
higher Cq, reflecting the 1:1 dilution of sample 1 to sample 3. Therefore, we conclude that our
samples do not contain a PCR inhibitor.
Figure 9. A) Amplification levels of GADPH for sample 1), orange curves are relative to sample
extracted ceramic beads, while blue are for RNA extracted with steel beads; B) Amplification
signal for GADPH on mESC; C) Purple curves represent GADH amplification level for a 1:1
mixture of RNA from mESC and RNA obtained with the ceramic bead maceration. Green curves
represent amplification of TERT in a 1:1 mixture of RNA from mESC and RNA obtained with
steel bead maceration.
Regeneration Studies in the African Spiny Mouse Diogo Prata
58
These results led us to discard the presence of inhibiting agents in our RNA extracts since signal
was observed for both mixtures of working cDNA with RNA from the metallic bead extract and
the mixture of working cDNA and ceramic bead RNA extract.
3.4 Conclusions
Despite intense effort and repeated attempts, we were unable to measure expression of TERT by
RT-qPCR in ear tissues of Mus and Acomys subject to wounds and allowed to heal for 30 days
(Mus) or regenerate for 60 days (Acomys). Ultimately, we do not have a satisfactory explanation
for this, but a number of points are worth highlighting.
First, we cannot interpret our lack of signal to be due to the fact that TERT is not expressed at all
in uninjured, regenerating, healed or regenerated tissue due to the fact that signal was not
obtained either when using primers against housekeeping genes such as GADPH, ACTB and
EIF1a, which can be reasonably be expected to be expressed at high levels in ear tissue.
Therefore, the question of whether TERT is (or not) expressed in ear tissue remains unanswered.
Second, the lack of qPCR signal is not due to faulty technical execution of the qPCR procedure,
as all primer validation experiments and all measurements carried out in Chapter 2 were
successful.
Third, failure to detect TERT in ear tissue was not due to an unexpected problem in a particular
experiment. The measurement was attempted multiple times with several RNA preparations
performed independently. In particular, in our attempt to detect TERT in ear tissue, we added
cDNA obtained from mouse ES cells to our qPCR plates as a positive control and obtained good
amplification.
Third, the results are not due to poorly designed TERT primers, as these primers were
successfully used to detect TERT expression and validated in mouse ES cells. The same can be
said of the primers used to detect expression of housekeeping genes, which were the same used
successfully in Chapter 2.
We suspect that the problem lies in the quality of the RNA extract obtained from ear tissue. As
described above, we invested significant time and effort in fine-tunning a RNA extraction
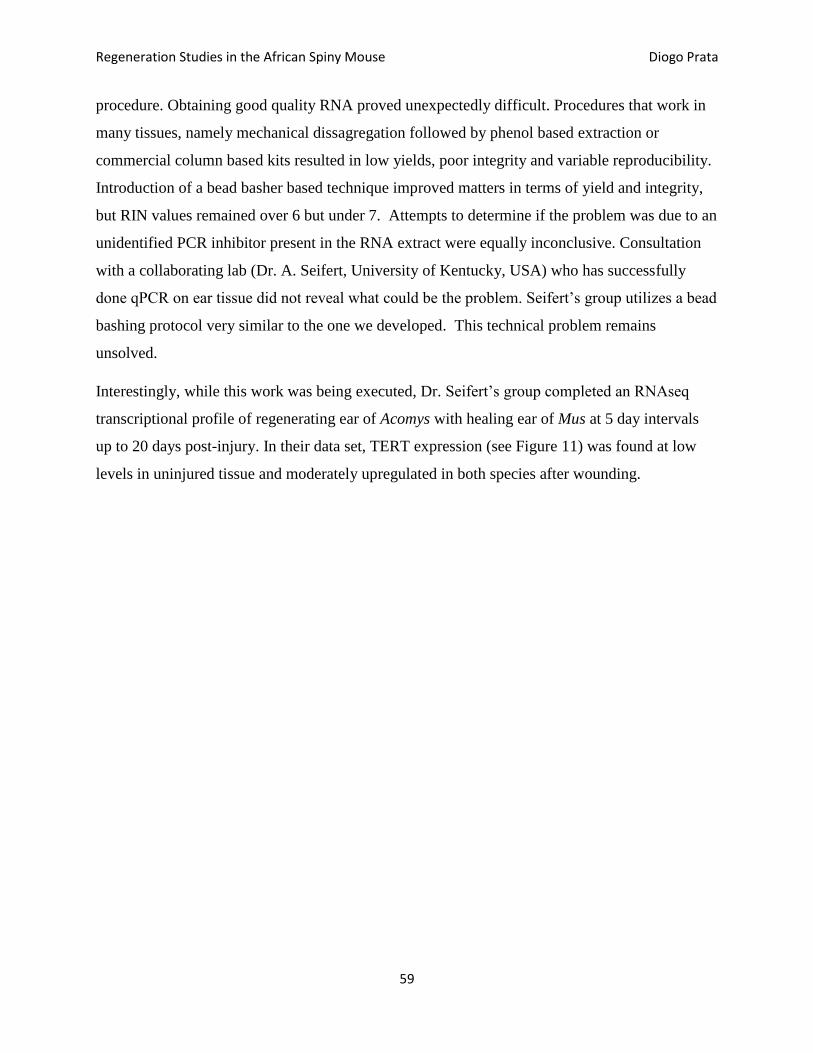
Regeneration Studies in the African Spiny Mouse Diogo Prata
59
procedure. Obtaining good quality RNA proved unexpectedly difficult. Procedures that work in
many tissues, namely mechanical dissagregation followed by phenol based extraction or
commercial column based kits resulted in low yields, poor integrity and variable reproducibility.
Introduction of a bead basher based technique improved matters in terms of yield and integrity,
but RIN values remained over 6 but under 7. Attempts to determine if the problem was due to an
unidentified PCR inhibitor present in the RNA extract were equally inconclusive. Consultation
with a collaborating lab (Dr. A. Seifert, University of Kentucky, USA) who has successfully
done qPCR on ear tissue did not reveal what could be the problem. Seifert’s group utilizes a bead
bashing protocol very similar to the one we developed. This technical problem remains
unsolved.
Interestingly, while this work was being executed, Dr. Seifert’s group completed an RNAseq
transcriptional profile of regenerating ear of Acomys with healing ear of Mus at 5 day intervals
up to 20 days post-injury. In their data set, TERT expression (see Figure 11) was found at low
levels in uninjured tissue and moderately upregulated in both species after wounding.
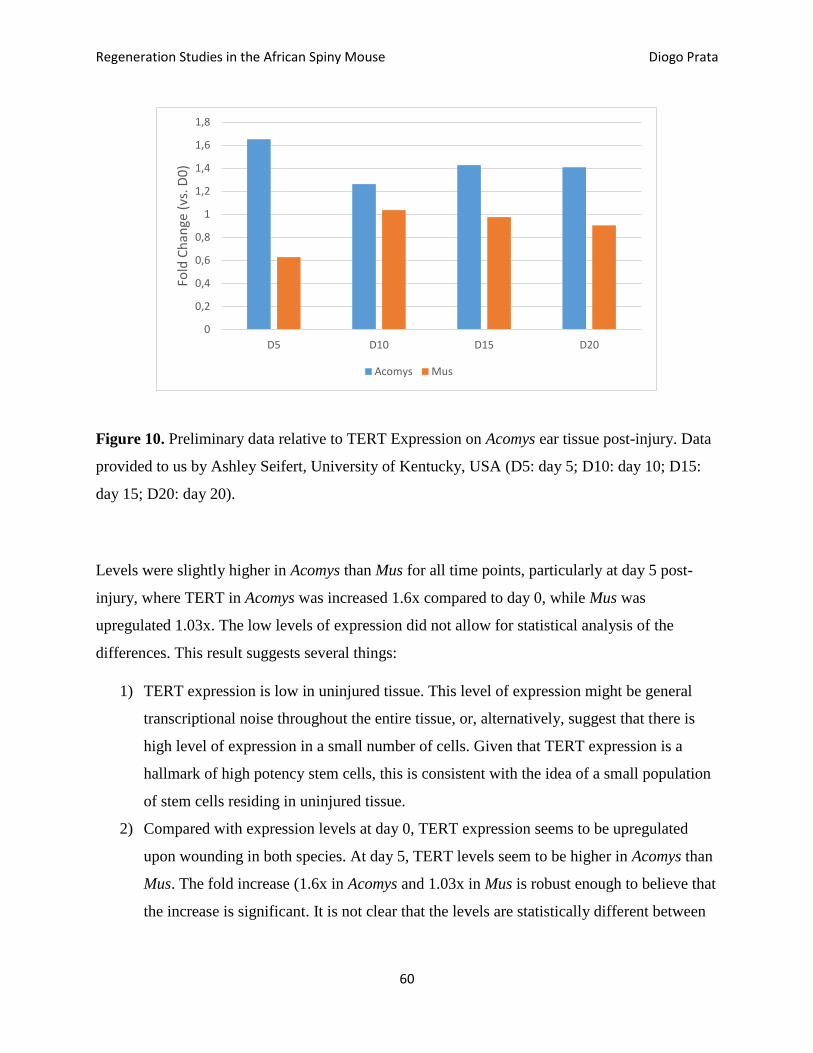
Regeneration Studies in the African Spiny Mouse Diogo Prata
60
Figure 10. Preliminary data relative to TERT Expression on Acomys ear tissue post-injury. Data
provided to us by Ashley Seifert, University of Kentucky, USA (D5: day 5; D10: day 10; D15:
day 15; D20: day 20).
Levels were slightly higher in Acomys than Mus for all time points, particularly at day 5 post-
injury, where TERT in Acomys was increased 1.6x compared to day 0, while Mus was
upregulated 1.03x. The low levels of expression did not allow for statistical analysis of the
differences. This result suggests several things:
1) TERT expression is low in uninjured tissue. This level of expression might be general
transcriptional noise throughout the entire tissue, or, alternatively, suggest that there is
high level of expression in a small number of cells. Given that TERT expression is a
hallmark of high potency stem cells, this is consistent with the idea of a small population
of stem cells residing in uninjured tissue.
2) Compared with expression levels at day 0, TERT expression seems to be upregulated
upon wounding in both species. At day 5, TERT levels seem to be higher in Acomys than
Mus. The fold increase (1.6x in Acomys and 1.03x in Mus is robust enough to believe that
the increase is significant. It is not clear that the levels are statistically different between
0
0,2
0,4
0,6
0,8
1
1,2
1,4
1,6
1,8
D5 D10 D15 D20
Fold
Ch
ange
(vs
. D0
)
Acomys Mus
Regeneration Studies in the African Spiny Mouse Diogo Prata
61
Mus and Acomys. If indeed the observed upregulation reflects a mobilization of a small
stem cell compartment, said mobilization occurs in both species.
3) Levels of TERT continue upregulated throughout days 10, 15 and 20. Levels between
Mus and Acomys seem similar. Therefore, there is no correlation of the behavior of TERT
expression with regeneration in Acomys vs fibrotic scarring in Mus.
Overall, the transcriptomic profiling results obtained by Seifert’s group seem to suggest that the
proliferation required to regenerate missing tissue in Acomys is not dependent on a massive
upregulation of TERT, as observed in the zebrafish system. TERT expression is high in ES cells,
induced pluripotent stem cells, spermatogonial stem cells (or somatic stem cells in general). If it
is accepted that TERT is a marker of highly potent cells, then we would conclude that
regeneration in Acomys is not based on the mobilization of an endogenous compartment of
quiescent stem cells of high potency. If one hypothesizes that Acomys regeneration involves de-
differentiation, said de-differentiation does not result in the creation of a cell compartment with
high potency. It would be interesting to solve our qPCR technical problems to complete our
measurement and compare our results with Seifert’s transcriptional profile for TERT. Another
interesting avenue would be to detect TERT by immunohistochemistry to determine the
existence of possible ‘clusters’ of TERT positive cells in particular regions or niches of the
tissue, and analyze their behavior in response to wounding.
3.5 Bibliographical References
Aix E., Gutiérrez- Gutiérrez Ó., Sánchez-Ferrer C., Aguado T., Flores I., “Postnatal telomere
dysfunction induces cardiomyocyte cell-cycle arrest through p21 activation”, The Journal of
Cell Biology (2016), Vol. 213 (5), pp. 571-583
Anchelin, M., Murcia, L., Alcaraz-Pérez, F. A., García-Navarro, E. M., Cayuela, M. L., (2010)
“Behaviour of Telomere and Telomerase during Aging and Regeneration in Zebrafish”
PLoS ONE 6(2): e16966. Doi:10.1371/journal.pone.0016955
Armstrong, L., Lako, M., Lincoln, J., Cairns, P. M., Hole, N. “mTert expression correlates
with telomerase activity during the differentiation of murine embryonic stem cells”
Mechanisms of Development, (200) 97, pp. 109-116
Regeneration Studies in the African Spiny Mouse Diogo Prata
62
Blackburn, E. H. and Gall J. G.,”A Tandemly Repeated Sequence at the Termini of the
Extrachromosomal Ribosomal RNA Genes in Tetrahymena”. Journal of Molecular Biology
(1978) 120, pp. 33-53
Blasco, M. A. “Telomeres and Human Disease: Ageing, Cancer and Beyond”. Nature
Reviews Genetics (2005) Vol. 6, pp 611-620
Bustin S. A., Benes V., Garson J. A., Hellemans J., Huggett J., Kubista M., Mueller R., Nolan T.,
Pfaffl m. W., Shipley G. L., Vandesompele J., Wittwer C. T., “The MIQE Guidelines:
Minimun Information for Publication of Quantitative Real-Time PCR Experiments”,
Clinical Chemistry (2009), 55:4, 611-622
Calado T.R., Dumitriu B. “Telomere Dynamics in Mice and Humans”, Seminars in
Hematology (2013) Vol 50 (2), pp 165-174
Elmore L. W., Norris M. W., Sircar S., Bright A. T., McChesney P. A., Winn R. N., Holt S. E.,
(2008) “Upregulation of Telomerase Function During Tissue Regeneration”. Society for
Experimental Biology and Medicine, pp 958-967, doi:10.3181/0712-RM-345
Flores I., “Telomerase is Essential for Zebrafish Heart Regeneration”. Cell Reports (12)
(2015), pp. 1691-1703
Flores I., Benetti R., Blasco M. A., “Telomerase regulation and stem cell behavior”. Current
Opinion in Cell Biology (2006), 18, pp. 254-460
Greider, C. W. and Blackburn E. H. “Identification of a Specific Telomere Terminal
Transferase Activity in Tetrahymena Extracts”. Cell (1985) 43, pp. 403-413
Haubner B. J., “Functional Recovery of a Human Neonatal Heart After Severe Myocardial
Infarction” Circ. Res. (2016) (!!!)
Kumar M., Lechel A., Gunes Ç., “Telomerase: The Devil Inside”. Genes (2016), 7, 43,
doi:10.3390/genes/7080043
Lange T., “Shelterin: the protein complex that shapes and safeguards human telomeres”
Genes & Development (2005), 19, pp. 2100-2110
Regeneration Studies in the African Spiny Mouse Diogo Prata
63
Li P. L. and Norbury C. J. “Telomere Maintenance: all’s well that ends well”. Arch Toxicol
(2009) 83, pp. 407-416
Marión R. M., Blasco M. A., “Telomeres and Telomerase in Adult Stem Cells and
Pluripotent Embryonic Stem Cells” The Cell Biology of Stem Cells (9), (2010), pp. 118-131
Martínez, P., Blasco, M. A. “Replicating through telomeres: a means to an end”. Trends in
Biochemical Sciences (2015) Vol. 40(9), pp 504-515
Poss, K. D. “Advances in understanding tissue regenerative capacity and mechanisms in
animals”. Nature Reviews, (2010), Vol 11, pp 710-722
Rodríguez A., Rodríguez M., Córdoba J. J., Andrade M. J., “PCR Primer Design”, Methods in
Molecular Biology, Vol. 1275 (Chp. 3), 31-56
Shay J. W., Wright W. E., “Hayflick, his limit, and cellular ageing” Nature Reviews Molecular
Cell Biology (2000), pp. 72-76
Trivanovic D., Krstic J., Jaukovic A., Popovic B., Djordjevic I., O., Kukojl T., Obradovic H.,
Mojsilovic S., Santibanez J. F., Bugarski D., “Correlation between telomere maintenance and
stemness of mesenchymal stem/stromal cells” Telomere and Telomerase (2016) (3) e1184.
Doi:10.14800//tt.1184
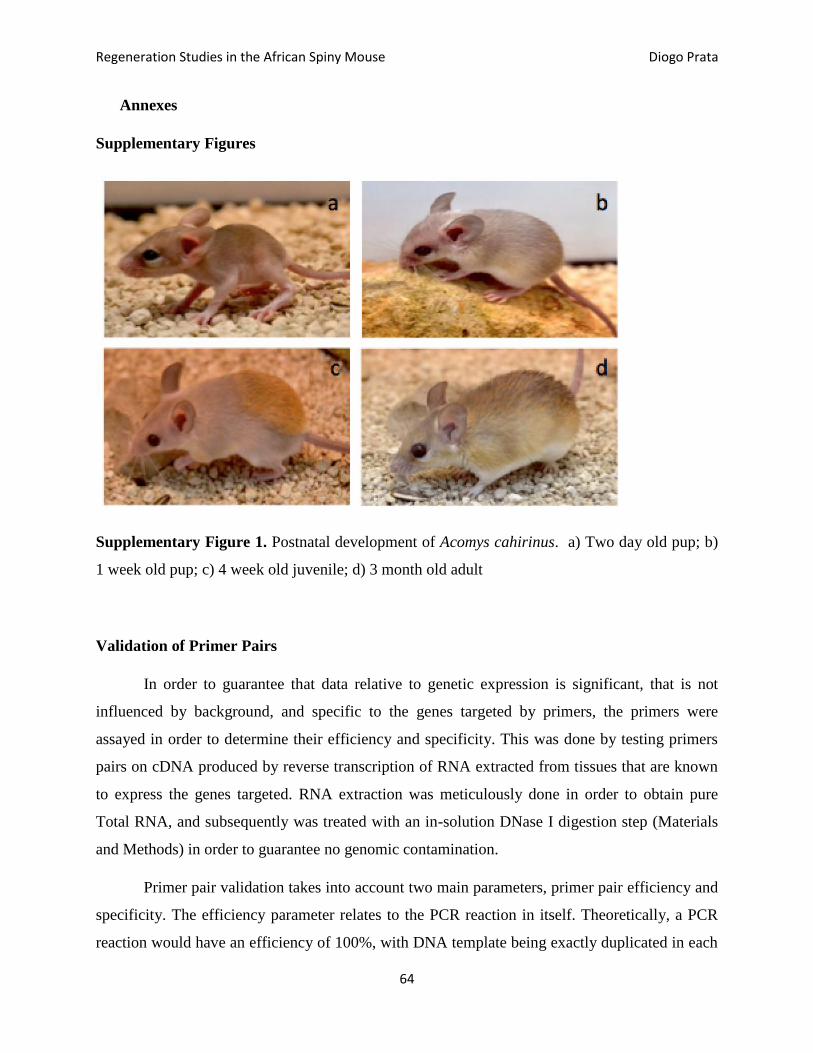
Regeneration Studies in the African Spiny Mouse Diogo Prata
64
Annexes
Supplementary Figures
Supplementary Figure 1. Postnatal development of Acomys cahirinus. a) Two day old pup; b)
1 week old pup; c) 4 week old juvenile; d) 3 month old adult
Validation of Primer Pairs
In order to guarantee that data relative to genetic expression is significant, that is not
influenced by background, and specific to the genes targeted by primers, the primers were
assayed in order to determine their efficiency and specificity. This was done by testing primers
pairs on cDNA produced by reverse transcription of RNA extracted from tissues that are known
to express the genes targeted. RNA extraction was meticulously done in order to obtain pure
Total RNA, and subsequently was treated with an in-solution DNase I digestion step (Materials
and Methods) in order to guarantee no genomic contamination.
Primer pair validation takes into account two main parameters, primer pair efficiency and
specificity. The efficiency parameter relates to the PCR reaction in itself. Theoretically, a PCR
reaction would have an efficiency of 100%, with DNA template being exactly duplicated in each
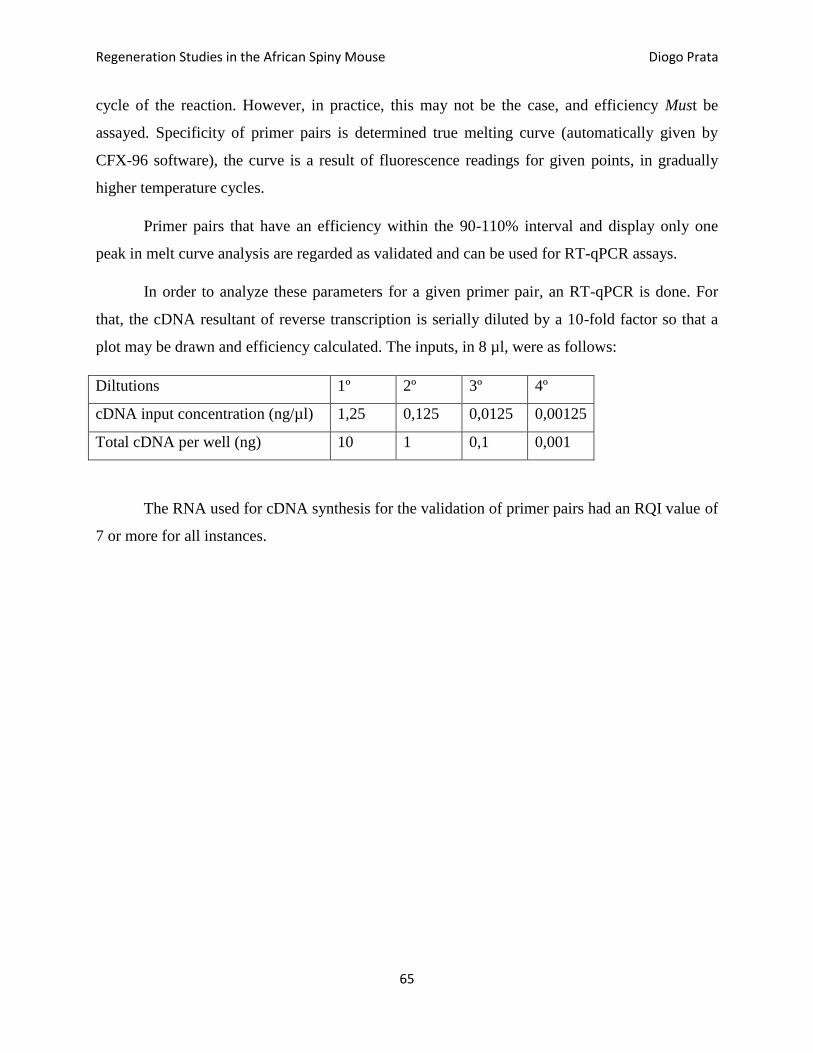
Regeneration Studies in the African Spiny Mouse Diogo Prata
65
cycle of the reaction. However, in practice, this may not be the case, and efficiency Must be
assayed. Specificity of primer pairs is determined true melting curve (automatically given by
CFX-96 software), the curve is a result of fluorescence readings for given points, in gradually
higher temperature cycles.
Primer pairs that have an efficiency within the 90-110% interval and display only one
peak in melt curve analysis are regarded as validated and can be used for RT-qPCR assays.
In order to analyze these parameters for a given primer pair, an RT-qPCR is done. For
that, the cDNA resultant of reverse transcription is serially diluted by a 10-fold factor so that a
plot may be drawn and efficiency calculated. The inputs, in 8 µl, were as follows:
Diltutions 1º 2º 3º 4º
cDNA input concentration (ng/µl) 1,25 0,125 0,0125 0,00125
Total cDNA per well (ng) 10 1 0,1 0,001
The RNA used for cDNA synthesis for the validation of primer pairs had an RQI value of
7 or more for all instances.