Regecova e poster
7
CLUSTERING OF CARDIO-VASCULAR RISK FACTORS IN SLOVAK ADOLESCENTS . Regecová V, 1 Šimurka P, 2 Baráková A 3 1 Institute of Normal and Pathological Physiology, Slovak Academy of Sciences Bratislava, 2 University Hospital in Trenčín, 3 National Health Information Center Bratislava
-
Upload
valeria-regecova -
Category
Health & Medicine
-
view
49 -
download
0
Transcript of Regecova e poster

CLUSTERING OF CARDIO-VASCULAR RISK FACTORS IN SLOVAK ADOLESCENTS
.
Regecová V,1 Šimurka P,2 Baráková A3
1Institute of Normal and Pathological Physiology, Slovak Academy of Sciences Bratislava, 2University Hospital in Trenčín, 3National Health Information Center Bratislava

The data were collected at preventive health examinations by the out-patient units across the country . The first survey (2001) consisted of 8850, the second (2011) of 2165 participants.
Overweight and obesity were classified according the National reference values of body mass index (BMI). For prehypertension (PHT) and hypertension (HT) ESH (2009) recommendations were used. Cut off value for total cholesterol (TC) concentration was set at 5.2 mmol/L. For the statistical evaluation ANOVA, Chi-square tests and odds ratios (OR) were computed.
THE OBJECTIVE was to investigate 10-year trends of the main cardiovascular (CV) risk factors (RF) in Slovakia among adolescents aged 16 to 17 years.
SUBJECTS and METHODS
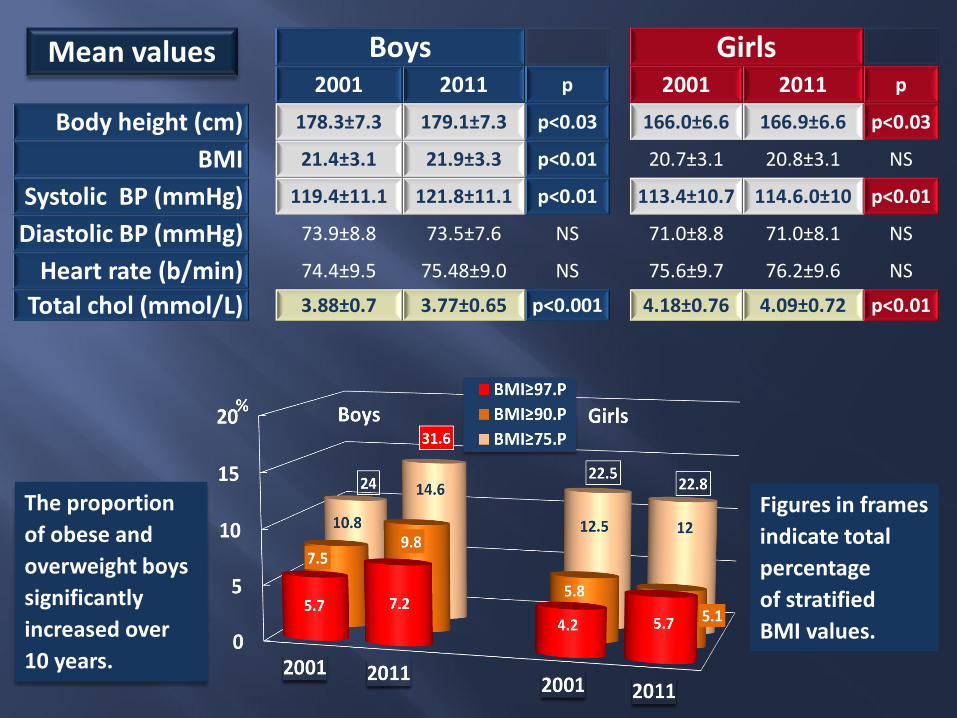
The proportion of obese and overweight boys significantly increased over 10 years.
Boys Girls 2001 2011 p 2001 2011 p
Body height (cm) 178.3±7.3 179.1±7.3 p<0.03 166.0±6.6 166.9±6.6 p<0.03
BMI 21.4±3.1 21.9±3.3 p<0.01 20.7±3.1 20.8±3.1 NS
Systolic BP (mmHg) 119.4±11.1 121.8±11.1 p<0.01 113.4±10.7 114.6.0±10 p<0.01
Diastolic BP (mmHg) 73.9±8.8 73.5±7.6 NS 71.0±8.8 71.0±8.1 NS
Heart rate (b/min) 74.4±9.5 75.48±9.0 NS 75.6±9.7 76.2±9.6 NS
Total chol (mmol/L) 3.88±0.7 3.77±0.65 p<0.001 4.18±0.76 4.09±0.72 p<0.01
Mean values
Figures in frames indicate total percentage of stratified BMI values.
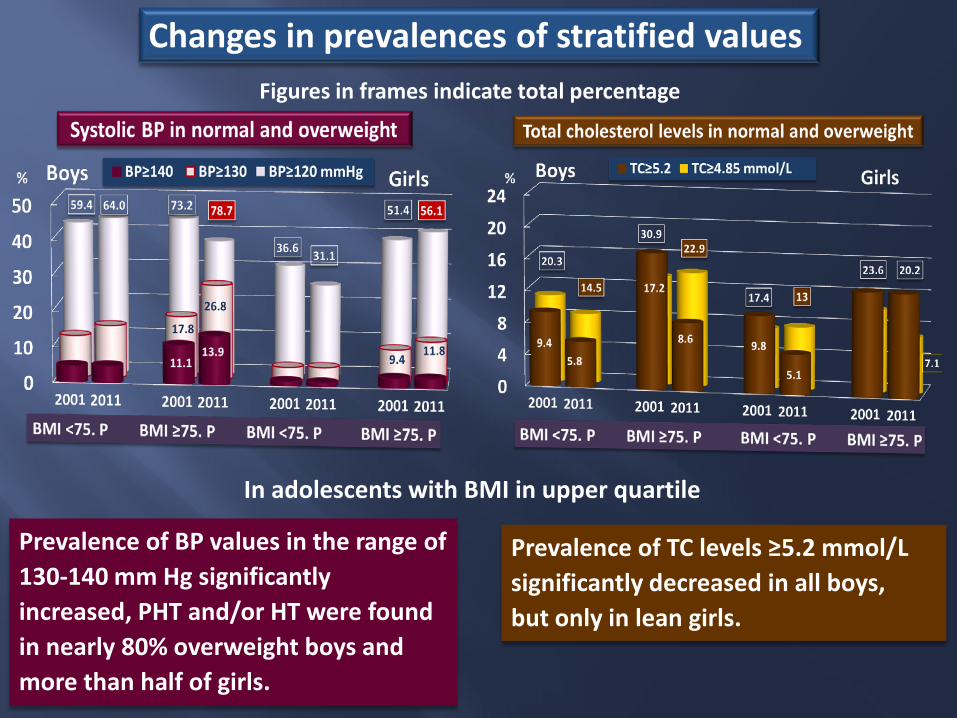
Changes in prevalences of stratified values
Prevalence of BP values in the range of 130-140 mm Hg significantly increased, PHT and/or HT were found in nearly 80% overweight boys and more than half of girls.
In adolescents with BMI in upper quartile
Figures in frames indicate total percentage
Prevalence of TC levels ≥5.2 mmol/L significantly decreased in all boys, but only in lean girls.
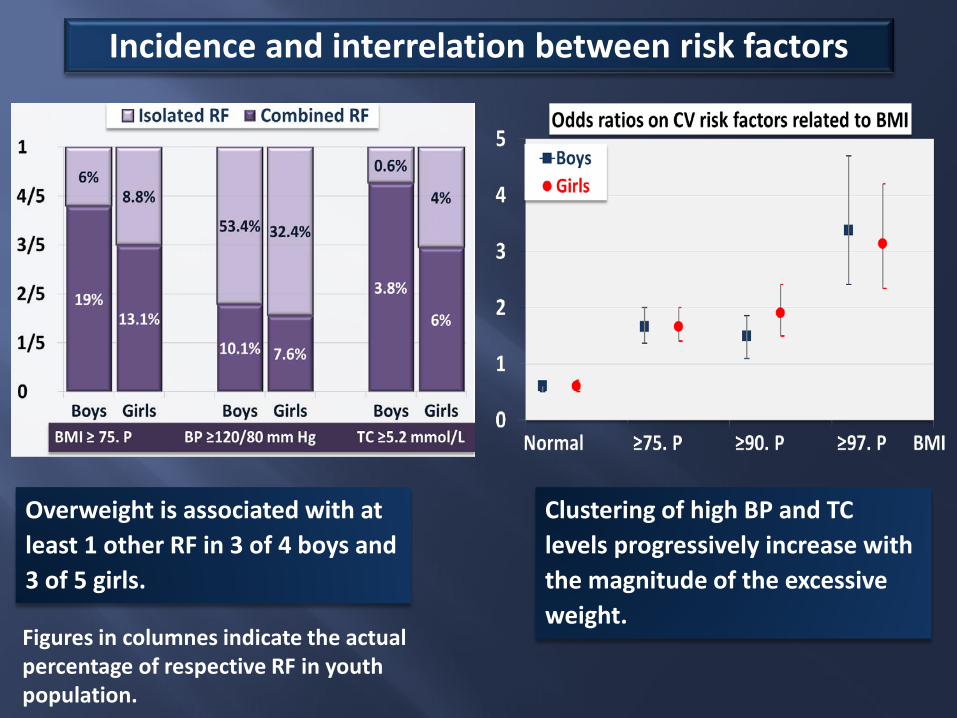
Figures in columnes indicate the actual percentage of respective RF in youth population.
Overweight is associated with at least 1 other RF in 3 of 4 boys and 3 of 5 girls.
Incidence and interrelation between risk factors
Clustering of high BP and TC levels progressively increase with the magnitude of the excessive weight.

30.8
44.7
18.5 6
2001
24.7
44
24.5 6.8
2011
46 30.3
14.7 9
2001
47.5
27.8
16.4 8.3
2011
Trends in clustering of risk factors in boys and girls
Number of boys free of RF reduced to less than ¼
Boys
Girls
No significant change was found in girls

Thank you for your attention