Refund to SavingS - Center for Social Developmentcsd.wustl.edu/Publications/Documents/RR14-03.pdf4...
22
2013 REFUND TO SAVINGS: EVIDENCE OF TAX-TIME SAVING IN A NATIONAL RANDOMIZED CONTROL TRIAL
Transcript of Refund to SavingS - Center for Social Developmentcsd.wustl.edu/Publications/Documents/RR14-03.pdf4...

I t ’s easy. First , choose how much of your refund to set as ide: We suggest saving at least 50% ($1,100), but you can enter any amount up to your total refund amount of $2,200.
2013
Refund to SavingS: evidence of tax-time Saving in a national Randomized contRol tRial


2 0 1 3 E v i d e n c e o f Ta x - T i m e S a v i n g i n a N a t i o n a l R a n d o m i z e d C o n t r o l Tr i a l // 1
Refund to SavingS: 2013 evidence of tax-time Saving in a national Randomized contRol tRial
Research funded by the Ford Foundation, the Annie E. Casey Foundation,
Intuit, Inc., the University of North Carolina at Chapel Hill,
and an anonymous donor.
Michal Grinstein-Weiss Center for Social Development
Krista Comer Center for Social Development
Blair Russell Center for Social Development
Clinton Key The Pew Charitable Trusts
Dana C. Perantie Center for Social Development
Dan Ariely Duke University

2 // R e f u n d t o S a v i n g s
acknowledgments
The Center for Social Development at Washington University in St. Louis gratefully acknowledges the funders who made the Refund to Savings (R2S) initiative possible: the Ford Foundation, the Annie E. Casey Foundation, Intuit, Inc.,
the Intuit Financial Freedom Foundation, the University of North Carolina at Chapel Hill, and an anonymous donor. The research team would like to give special thanks to Amy Brown and Frank DeGiovanni with the Ford Foundation and Beadsie Woo with the Annie E. Casey Foundation. We appreciate your invaluable feedback,
direction, and support at every stage of this process.
R2S would not exist without the commitment of Intuit, Inc., and its Consumer Tax Group in particular. We appreciate the executive sponsorship of Phillip Poirier and
the efforts of key contributors from the TurboTax development, marketing, and analytics teams who have worked diligently on the planning and implementation of the experiment: Sacha Adams, Piritta Luoto, Julia Zhuang, Topher Stevenson,
Joe Lillie, Annette Hoffard, and Kathy Kirkendall. We also thank the Intuit Freedom Foundation for providing the TurboTax Freedom Edition platform and Susan Mason
for her contributions.
Our Advisory Committee, which includes Ray Boshara, Amy Brown, Keith Ernst, Tim Flacke, Julian Jamison, David Rothstein, Michael Sherraden, Jennifer Tescher,
and Beadsie Woo, has provided outstanding advice throughout the initiative.
Lastly, we thank the thousands of taxpayers who consented to participate in the research surveys and shared their personal financial information with us. We hope this research will generate evidence for developing policies aimed at helping low- and moderate-income households increase their financial security and mobility.
disclaimer
Statistical compilations disclosed in this document relate directly to the bona fide research of and public policy discussions concerning the use of the IRS “split refund” capability and promotion of increased savings in connection with the tax
compliance process. All compilations are anonymous and do not disclose cells containing data from fewer than ten tax returns. IRS Reg. 301.7216
the center for Social development
The Center for Social Development (CSD) at Washington University in St. Louis creates and studies innovations that enable individuals, families, and communities
to formulate and achieve life goals and contribute to the economy and society. Through innovation and research, CSD makes intellectual and applied contributions
in social development theory, evidence, community projects, and public policy.
Visit http://csd.wustl.edu for more information.

2 0 1 3 E v i d e n c e o f Ta x - T i m e S a v i n g i n a N a t i o n a l R a n d o m i z e d C o n t r o l Tr i a l // 3
executive SummaryThe Refund to Savings (R2S) initiative, a collaboration between academic and industry partners, seeks to use low-cost, low-touch, scalable interventions to help low- and moderate-income (LMI) households increase savings at tax time and improve financial security and mobility. In 2013, the R2S team conducted a national randomized control trial testing the effectiveness of techniques informed by insights from behavioral economics to increase deposits of tax refunds into savings vehicles.
The large-scale experiment was followed by a two-wave, longitudinal survey to gain deeper insight into the financial lives of LMI households and to better understand how tax refunds are used over time. The R2S initiative, which involved approximately 900,000 research participants, has produced valuable findings that can inform ongoing policy discussions about improving the financial well-being of LMI households.
R2S interventions consist of combinations of suggested savings amounts (i.e., anchors) and motivational messages (i.e., prompts) embedded in the TurboTax Freedom Edition software in connection with the IRS’s split refund capability. Participants not assigned to the control group saw an anchor/prompt combination when they had to decide how they would receive their refunds. The goal of the intervention is to encourage tax filers to allocate more of the refund to a savings vehicle (e.g., savings account or savings bond) and test which combinations of anchors and prompts encouraged the highest rates of saving and amounts of savings.
Anchors tested include percentages of the refund (i.e., 25%, 50%, and 75%) and specific amounts (i.e., $100 or $250). Further, in some cases, suggested savings amounts were prepopulated and participants could opt out of splitting part of their tax refunds into a savings vehicle. Motivational prompts included messages that encouraged participants to consider saving for an emergency, their family, and the future. The emergency prompt incorporated the behavioral concept of “social proof,” or the human tendency to conform to the behavior of typical people.
The 2013 R2S initiative examined several primary research questions, including the following:
• Do LMI households deposit their tax refunds into savings vehicles?
• Does using behavioral economics techniques (e.g., anchoring and motivational prompts) increase savings deposits at tax time?
• Do low-income filers actually keep tax refund savings for at least six months? How does that compare to their intention at tax time?
• Which factors make it easier or more difficult to save?
• Do the financial products used by participants affect financial outcomes?
• What types of savings vehicles do LMI tax filers want to use?
Results of the R2S experiment demonstrate that low-cost, low-touch behavioral interventions can be used to increase both the proportion of tax filers who deposit their refunds into savings vehicles and the amounts of those deposits. Though the effects of the various interventions tested are modest, the project highlights the potential for large-scale impact. We estimate that R2S interventions encouraged more than 4,800 additional households to deposit part of their refunds into a savings product than otherwise would have been expected to do so and that an additional $5.92 million of savings deposits and savings bond purchases occurred as a result of the experimental treatments.
Follow-up surveys show that LMI households are interested in and able to save at least part of their tax refunds for at least six months. Data show that tax filers save their refunds in a number of ways, including outside of traditional saving vehicles. Importantly, we find that the impact of R2S interventions lasts for at least six months. Statistical analyses demonstrate that the most effective R2S interventions are associated with increases in both the likelihood of saving and the amount of the tax refund saved for six months. The estimated probability of saving a portion of the refund for six months was increased from 25% for control group members to 30% for participants assigned to a 50% anchor group, while assignment to a 50% and 75% anchor group was associated with 2.6 and 5 percentage point increases, respectively, in the amount of refund saved for six months.
The surveys reveal that there are a number of barriers to saving, including holding outstanding debt, having difficulty covering ongoing expenses, using alternative financial services, and fearing the loss of government benefits because of asset limits. The surveys also find that respondents—especially those in unbanked households—are interested in alternative means of receiving tax refunds.
While the R2S initiative focuses on saving at tax time, lessons learned are much broader and can be used to encourage saving in general. Infrastructural improvements are likely to impact key decisions outside of tax time (e.g., the point in time when employees choose how and where to receive their pay). Similarly, behavioral economics techniques (e.g., motivational prompts and anchors) can be repurposed for use in other savings or asset-building opportunities, including retirement savings decisions. Opt-out and other behavioral techniques are likely to have an even greater impact.

4 // R e f u n d t o S a v i n g s
intRoductionThe Refund to Savings (R2S) initiative has a two-fold objective. First, we aim to help low- and moderate-income (LMI) households increase savings, financial security, and financial mobility. Second, we hope to gain a deep understanding of the behaviors and decision making of LMI households through a set of rigorously designed and scalable tax refund savings interventions and surveys.
The R2S initiative team—including researchers from Washington University in St. Louis, Duke University, and Intuit, Inc., a leading technology company and creator of TurboTax tax preparation software—built a saving-promotion experiment into the TurboTax Freedom Edition software offered during the 2013 filing season through the Internal Revenue Service (IRS) Free File program. This program is a public/private partnership between the IRS and the tax software industry that enables LMI households to prepare and file their federal tax returns at no charge. As part of the experiment, the R2S team conducted an in-depth, longitudinal Household Financial Survey (HFS1) with a subset of tax filers and evaluated the impact of the experiment six months later with a follow-up survey (HFS2).
The 2013 R2S initiative examined several primary research questions, including the following:
• Do LMI households deposit their tax refunds into savings vehicles?
• Does using behavioral economics techniques (e.g., anchoring and motivational prompts) increase savings deposits at tax time?
• Do low-income filers actually keep tax refund savings for at least six months? How does that compare to their intention at tax time?
• Which factors make it easier or more difficult to save?
• Do the financial products used by participants affect financial outcomes?
• What types of savings vehicles do LMI tax filers want to use?
Between January 31 and April 17, 2013, approximately 900,000 TurboTax Freedom Edition users participated in the R2S initiative. Each tax filer was assigned randomly to the control group or one of several treatment conditions aimed at increasing the rate at which consumers save a portion of their tax refund using the IRS split refund feature. The experiment was rolled out in three periods during the 2013 filing season to test different intervention strategies.
In addition, as part of the experiment, 20,000 tax filers completed the voluntary HFS1 by following an
invitation link shown to all experiment participants at the end of the TurboTax Freedom Edition filing process. Approximately six months later, participants who completed HFS1 were invited to complete the follow-up HFS2, which 8,324 respondents completed. HFS2 allows us to assess the impact of the intervention over time and the economic impact of tax-time saving behavior. The surveys also allow us to identify the obstacles that LMI households face as they try to accumulate contingency savings.
in-Product intervention designThe R2S team designed the saving intervention to use low-cost, low-touch behavioral economic techniques to motivate LMI tax filers to save a portion of their federal tax refunds. The experiment tested three behavioral mechanisms: (1) an automatic savings opportunity, (2) motivational prompts, and (3) default savings amounts. The team consciously chose to build the intervention to take advantage of the IRS split refund Form 8888, which is aligned behaviorally with and included functionally in the existing TurboTax infrastructure.
AutomAtic SAvingS opportunity
The TurboTax Freedom Edition program assigned tax filers randomly to a treatment or control condition. Those assigned to the treatment condition were given an explicit choice to save their refunds in an existing savings account or purchase U.S. Series I Savings Bonds. For example, those who opted for a paper check refund automatically saw their refunds allocated to a paper check and a savings bond (Figure 1).
Tax filers who opted for direct deposit had a similar automatic savings experience but could choose to save by purchasing a U.S. Series I Savings Bond or depositing any savings amount into an existing savings account (Figure 2). In both situations, the user could choose not to save by clicking the “I don’t need to save” button.
motivAtionAl promptS
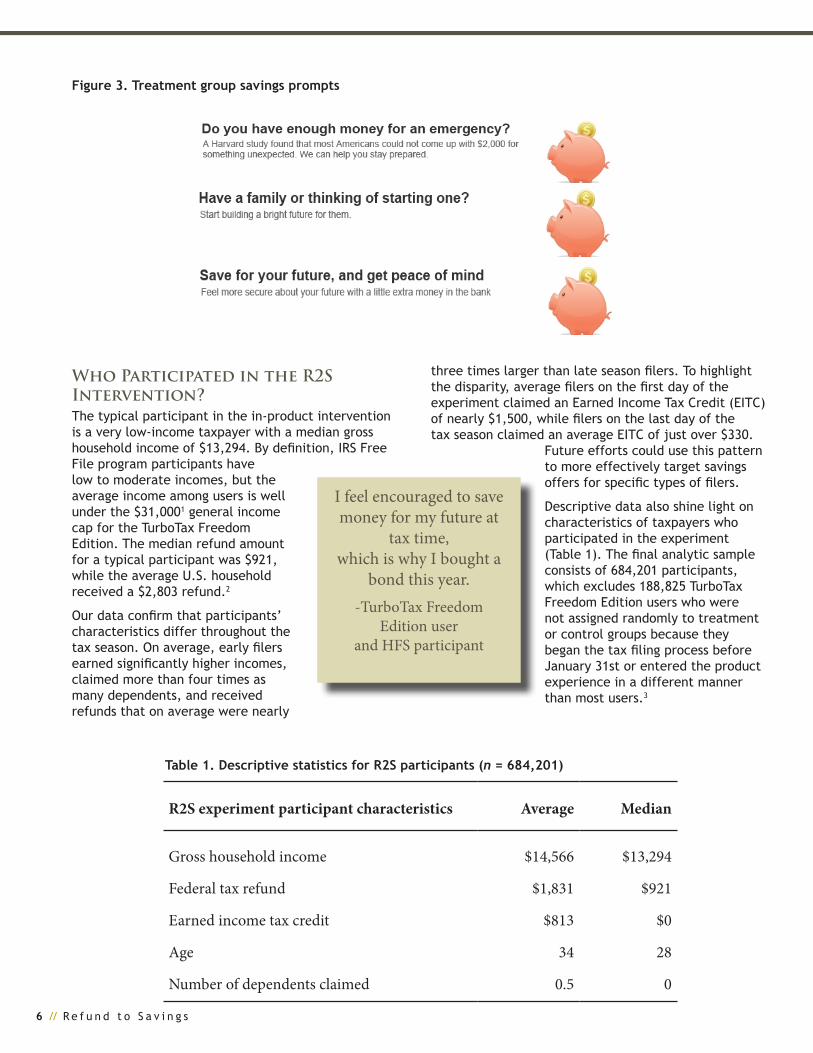
Participants assigned to the treatment condition could see one of three motivational prompts designed to increase their desire to save (Figure 3).
DefAult SAvingS AmountS
In addition to providing prompts, the intervention varied the suggested savings amount and prepopulated a field in the software to encourage filers to make the recommended split (see Figures 1 and 2). This feature was designed to anchor participants to a target savings amount. Anchor amounts tested were 25%, 50%, and 75% of the refund amount, $100, and $250. To assess the effect of each prompt and anchor, some treatment conditions included a generic prompt (see Figure 2) with a recommended savings portion in the prepopulated field.

2 0 1 3 E v i d e n c e o f Ta x - T i m e S a v i n g i n a N a t i o n a l R a n d o m i z e d C o n t r o l Tr i a l // 5
figure 2. Direct deposit savings experience with a generic prompt
figure 1. paper check refund savings experience with generic prompt showing the automatic allocation of the refund to a u.S. Series i Savings Bond and paper check (users can adjust amounts allocated to each)
6 // R e f u n d t o S a v i n g s
Who Participated in the R2S intervention?The typical participant in the in-product intervention is a very low-income taxpayer with a median gross household income of $13,294. By definition, IRS Free File program participants have low to moderate incomes, but the average income among users is well under the $31,0001 general income cap for the TurboTax Freedom Edition. The median refund amount for a typical participant was $921, while the average U.S. household received a $2,803 refund.2
Our data confirm that participants’ characteristics differ throughout the tax season. On average, early filers earned significantly higher incomes, claimed more than four times as many dependents, and received refunds that on average were nearly
three times larger than late season filers. To highlight the disparity, average filers on the first day of the experiment claimed an Earned Income Tax Credit (EITC) of nearly $1,500, while filers on the last day of the tax season claimed an average EITC of just over $330.
Future efforts could use this pattern to more effectively target savings offers for specific types of filers.
Descriptive data also shine light on characteristics of taxpayers who participated in the experiment (Table 1). The final analytic sample consists of 684,201 participants, which excludes 188,825 TurboTax Freedom Edition users who were not assigned randomly to treatment or control groups because they began the tax filing process before January 31st or entered the product experience in a different manner than most users.3
figure 3. treatment group savings prompts
I feel encouraged to save money for my future at
tax time, which is why I bought a
bond this year.-TurboTax Freedom
Edition user and HFS participant
table 1. Descriptive statistics for r2S participants (n = 684,201)
R2S experiment participant characteristics Average Median
Gross household income $14,566 $13,294
Federal tax refund $1,831 $921
Earned income tax credit $813 $0
Age 34 28
Number of dependents claimed 0.5 0

2 0 1 3 E v i d e n c e o f Ta x - T i m e S a v i n g i n a N a t i o n a l R a n d o m i z e d C o n t r o l Tr i a l // 7
Primary Research QuestionsDo low-income HouSeHolDS DepoSit tHeir tAx refunDS into SAvingS veHicleS?
R2S data show that tens of thousands of tax filers across income levels and refund amounts decided to put all or a part of their federal tax returns directly into a savings vehicle by depositing them into a savings account or purchasing a U.S. Series I Savings Bond. Among the control group, 6.8% of filers put at least part of their refunds directly into savings. Deciding to deposit into savings varied significantly based on when in the tax season the person filed. Significantly higher rates of saving occurred earlier in the tax season.
cAn employing BeHAviorAl economicS tecHniqueS increASe SAvingS DepoSitS At tAx time?
Data demonstrate that the low-cost, low-touch behavioral economics techniques used in the R2S intervention increased deposits into savings vehicles by treatment group members relative to the control group. Across a number of outcome measures,
participants exposed to behavioral interventions (i.e., a combination of anchoring to specific saving amounts and motivational prompts) demonstrated increased savings behaviors. R2S resulted in more people depositing into a savings product and got savers to deposit higher amounts.
Period 1 of the in-product experiment tested six treatment conditions that used various behavioral economics techniques (Figure 4). All treatment conditions show statistically significant increases in the proportion of participants who deposited at least a portion of their refunds into savings. Anchoring to recommended savings amounts and combining anchors with motivational prompts led to higher rates of depositing. Results in Periods 2 and 3—which occurred later in the tax season—show similar results. However, in Period 3—when overall savings deposits are lower—the treatments appear to have less of an effect. Across all three periods, 7.6% of treatment recipients deposited their refunds into savings vehicles. This is a statistically significant increase over control group members, 6.8% of whom deposited into savings.
“I was happy to see TurboTax offer information at the end urging people to save a certain percentage of their return. And also the option to deposit to 2 different accounts was helpful. I was going to have everything deposited into one account with the intention of moving some to savings at another bank.
Instead I could put it in both places now and there is no danger of not following through on that ‘intent’ due to unexpected circumstances. I can always take money from either account if NEEDED
but getting into that account helps me save.”-TurboTax Freedom Edition user and HFS participant
figure 4. percentages of those who deposited refunds in savings vehicles during period 1 (n = 228,828)
*Statistically different from the control group at 95% confidence level.
0%
2%
4%
6%
8%
10%
12%
Family 25%*
Future 25%*
Emergency 50%*
Emergency 25%*
Anchor only (no prompt)
50%*
Anchor only (no prompt)
25%*
Control
Control
25% anchor
50% anchor
8 // R e f u n d t o S a v i n g s
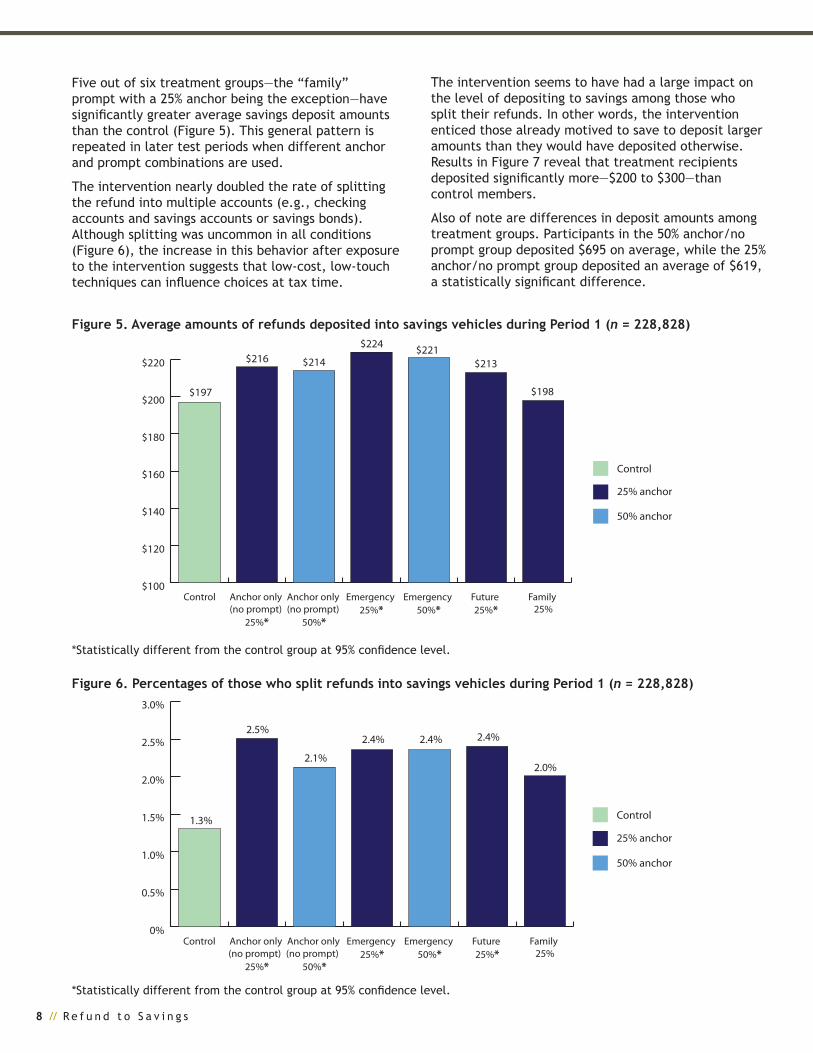
Five out of six treatment groups—the “family” prompt with a 25% anchor being the exception—have significantly greater average savings deposit amounts than the control (Figure 5). This general pattern is repeated in later test periods when different anchor and prompt combinations are used.
The intervention nearly doubled the rate of splitting the refund into multiple accounts (e.g., checking accounts and savings accounts or savings bonds). Although splitting was uncommon in all conditions (Figure 6), the increase in this behavior after exposure to the intervention suggests that low-cost, low-touch techniques can influence choices at tax time.
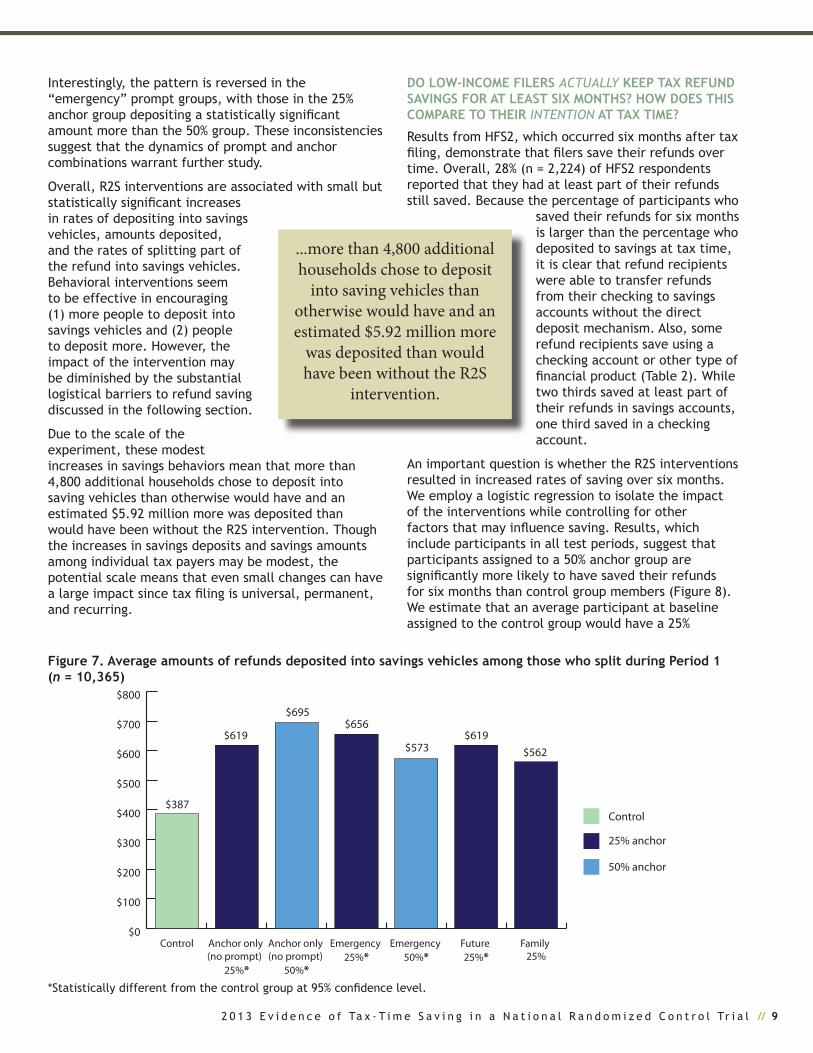
The intervention seems to have had a large impact on the level of depositing to savings among those who split their refunds. In other words, the intervention enticed those already motived to save to deposit larger amounts than they would have deposited otherwise. Results in Figure 7 reveal that treatment recipients deposited significantly more—$200 to $300—than control members.
Also of note are differences in deposit amounts among treatment groups. Participants in the 50% anchor/no prompt group deposited $695 on average, while the 25% anchor/no prompt group deposited an average of $619, a statistically significant difference.
figure 5. Average amounts of refunds deposited into savings vehicles during period 1 (n = 228,828)
*Statistically different from the control group at 95% confidence level.
figure 6. percentages of those who split refunds into savings vehicles during period 1 (n = 228,828)
*Statistically different from the control group at 95% confidence level.
$100
$120
$140
$160
$180
$200
$220
Family 25%
Future 25%*
Emergency 50%*
Emergency 25%*
Anchor only (no prompt)
50%*
Anchor only (no prompt)
25%*
Control
Control
25% anchor
50% anchor
$197
$216 $214
$224 $221$213
$198
0%
0.5%
1.0%
1.5%
2.0%
2.5%
3.0%
Family 25%
Future 25%*
Emergency 50%*
Emergency 25%*
Anchor only (no prompt)
50%*
Anchor only (no prompt)
25%*
Control
Control
25% anchor
50% anchor
1.3%
2.5%
2.1%
2.4% 2.4% 2.4%
2.0%
2 0 1 3 E v i d e n c e o f Ta x - T i m e S a v i n g i n a N a t i o n a l R a n d o m i z e d C o n t r o l Tr i a l // 9
Interestingly, the pattern is reversed in the “emergency” prompt groups, with those in the 25% anchor group depositing a statistically significant amount more than the 50% group. These inconsistencies suggest that the dynamics of prompt and anchor combinations warrant further study.
Overall, R2S interventions are associated with small but statistically significant increases in rates of depositing into savings vehicles, amounts deposited, and the rates of splitting part of the refund into savings vehicles. Behavioral interventions seem to be effective in encouraging (1) more people to deposit into savings vehicles and (2) people to deposit more. However, the impact of the intervention may be diminished by the substantial logistical barriers to refund saving discussed in the following section.
Due to the scale of the experiment, these modest increases in savings behaviors mean that more than 4,800 additional households chose to deposit into saving vehicles than otherwise would have and an estimated $5.92 million more was deposited than would have been without the R2S intervention. Though the increases in savings deposits and savings amounts among individual tax payers may be modest, the potential scale means that even small changes can have a large impact since tax filing is universal, permanent, and recurring.
Do low-income filerS ActuAlly Keep tAx refunD SAvingS for At leASt Six montHS? How DoeS tHiS compAre to tHeir IntentIon At tAx time?
Results from HFS2, which occurred six months after tax filing, demonstrate that filers save their refunds over time. Overall, 28% (n = 2,224) of HFS2 respondents reported that they had at least part of their refunds still saved. Because the percentage of participants who
saved their refunds for six months is larger than the percentage who deposited to savings at tax time, it is clear that refund recipients were able to transfer refunds from their checking to savings accounts without the direct deposit mechanism. Also, some refund recipients save using a checking account or other type of financial product (Table 2). While two thirds saved at least part of their refunds in savings accounts, one third saved in a checking account.
An important question is whether the R2S interventions resulted in increased rates of saving over six months. We employ a logistic regression to isolate the impact of the interventions while controlling for other factors that may influence saving. Results, which include participants in all test periods, suggest that participants assigned to a 50% anchor group are significantly more likely to have saved their refunds for six months than control group members (Figure 8). We estimate that an average participant at baseline assigned to the control group would have a 25%
figure 7. Average amounts of refunds deposited into savings vehicles among those who split during period 1 (n = 10,365)
*Statistically different from the control group at 95% confidence level.
$0
$100
$200
$300
$400
$500
$600
$700
$800
Family 25%
Future 25%*
Emergency 50%*
Emergency 25%*
Anchor only (no prompt)
50%*
Anchor only (no prompt)
25%*
Control
Control
25% anchor
50% anchor
$387
$619
$695$656
$573$619
$562
...more than 4,800 additional households chose to deposit
into saving vehicles than otherwise would have and an estimated $5.92 million more
was deposited than would have been without the R2S
intervention.

10 // R e f u n d t o S a v i n g s
probability of having part of the refund still in savings at the six-month follow-up. However, if the same participant were assigned to a 50% anchor group, the probability of having part of the refund still in savings after six months is 30%, a statistically significant increase (p < .05).
In terms of the percentage of the refund saved at six months, regression analysis reveals that being assigned to a 75% anchor group (Table 3) is associated with having a higher percentage saved than the control group. On average, participants assigned to a 75% anchor group saved 5 percentage points more than those in the control group, who saved an average of 15% of their refunds after six months (p < .05). Being assigned to a 50% anchor group is marginally significant (p < .1) and associated with having saved 2.6 percentage points more of the refund for six months relative to control group members.
After filing their returns, participants in HFS1 were asked what they planned to do with their refunds. Choices included short-term spending, paying down debt, medium-term saving (i.e., “a few months”), and longer term saving. Within the control group, the average respondent indicated that 12.4% of the refund was allocated to longer term saving. Thirty-two percent of respondents planned to save at least some of their refunds for longer than a few months.
Data from HFS2 can be used to compare participants’ intentions for their refunds versus the reality six months later. Average percentages of refunds allocated to different purposes are shown in Figure 9 and reveal that participants’ long-term savings behaviors closely match their intentions (as measured in HFS1). Participants reported significantly less short-term spending and significantly more debt repayment in HFS2 than they had intended six months earlier in HFS1.
Table 2. Vehicles in which filers saved their tax refunds (n = 2,224)*
*Participants were allowed to choose more than one type of account. **Includes certificates of deposit (CDs), money market accounts, and cash.
figure 8. predicted probability of saving refund for six months by anchor amount**
Type of account Percentage of respondents
Savings account 66%
Checking account 33%
Prepaid debit card 1%
IRA 5%
Educational savings account 1%
U.S. Series I Savings Bond 2%
Other** 6%
0%
5%
10%
15%
20%
25%
30%
35%
Anchor $100 or $250
Anchor 75%
Anchor 50%*
Anchor 25%
Control
25% 26%
30% 30%
23%
*Statistically different from the control group at 95% confidence level. **All other factors (i.e., date of filing, age, number of dependents, and exposure to financial shock [unemployment, hospitalization, auto repair, legal fees] in six months after tax filing) held constant at their means.

2 0 1 3 E v i d e n c e o f Ta x - T i m e S a v i n g i n a N a t i o n a l R a n d o m i z e d C o n t r o l Tr i a l // 11
table 3. olS regression results: Dv = percentage of tax refund saved for six months (treatment effects relative to control group) (n = 4,833) (r-squared = 0.0473)
figure 9. Allocation of refund: intention at tax-time versus reality six months later (n = 5,227)
Variable Coefficient Robust standard
error
P-value
Treatment
Anchor 25% 0.664 1.322 0.616
Anchor 50%* 2.565 1.465 0.080
Anchor 75%** 5.034 2.431 0.038
Anchor $100 or $250 -1.226 2.455 0.617
Number of days from January 30 0.171 0.028 0.000
Age -0.011 0.038 0.773
Number of dependents -1.817 0.421 0.000
Financial shock in last six months (Yes = 1) -10.060 1.028 0.000
Constant 19.210 1.955 0.000
*Significant at 90% confidence level. **Significant at 95% confidence level.
*Time 1 and time 2 proportions are statistically different from each other at 95% confidence level.
0%
5%
10%
15%
20%
25%
30%
35%
40%
45%Time 2: Follow-up
Time 1: Intention
Save long term
Save medium term*
Pay down debt*
Spend short term*
32%
24%
31%
41%
22%20%
15% 15%

12 // R e f u n d t o S a v i n g s
Figure 10. Percentages of participants that experienced financial shocks in the six months after filing taxes (n = 5,552)
wHicH fActorS mAKe it eASier or more Difficult to SAve?
Many factors affect households’ ability to save tax refunds over time, and the HFS shows these barriers’ impacts on saving. HFS data illustrate the financial stress felt by millions of low-income households. During the six months after filing their taxes, two thirds of
Figure 11. Percentages of participants that saved part of their refunds for six months by incidence of financial shock (n = 5,556)
0%
5%
10%
15%
20%
25%
30%
35%
40%
45%
Faced legal fees/expenses
Needed a major vehicle
repair
Had to make one or more trips
to the hospital
Experienced a period of
unemployment
34%
26%
37%
9%
0%
5%
10%
15%
20%
25%
30%
35% No
Yes
Faced legal fees/expenses*
Needed a major vehicle
repair*
Had to make one or more trips
to the hospital*
Experienced a period of
unemployment*
20%
30%
19%
29%
23%
29%
18%
28%
all households experienced a period of unemployment (34%), had a health event that required hospitalization (26%), needed major automotive repairs (37%), or incurred legal expenses (9%) (Figure 10). Experiencing these financial shocks is associated with decreased likelihood of households’ saving part of the refund for six months (Figure 11).
*Percentages are statistically different at the 95% confidence level.
2 0 1 3 E v i d e n c e o f Ta x - T i m e S a v i n g i n a N a t i o n a l R a n d o m i z e d C o n t r o l Tr i a l // 13
*Proportions are statistically different at the 95% confidence level.
0%
5%
10%
15%
20%
25%
30%
35%
40%
45%
50%
Very di�cult*
Somewhat di�cult*
Not at all di�cult*
46%
23%
11%
figure 12. percentages of participants who saved part of their refunds after six months by difficulty covering typical expenses (n = 8,267)
figure 13. percentages of participants with debt by type of debt (n = 18,956)
0%
10%
20%
30%
40%
50%
60%
70%
80%
Payday loan
Past due bill
Owe friends/f
amily
Other b
ank loan
Other
Negative balance
s
Medical
Educatio
n
Credit card
Property
HomeCar
Secured debt
68%
16%
1%
Unsecured debt
56%
51%
42%
8% 7%
14%
24%
33%
8%
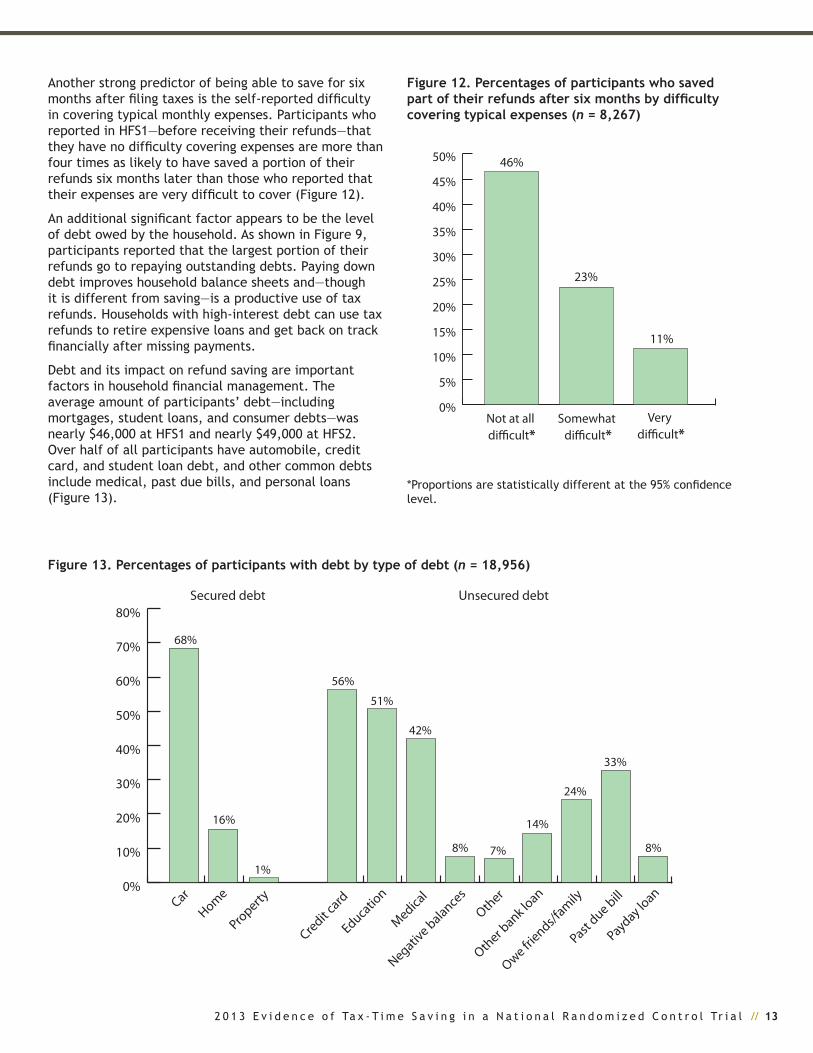
Another strong predictor of being able to save for six months after filing taxes is the self-reported difficulty in covering typical monthly expenses. Participants who reported in HFS1—before receiving their refunds—that they have no difficulty covering expenses are more than four times as likely to have saved a portion of their refunds six months later than those who reported that their expenses are very difficult to cover (Figure 12).
An additional significant factor appears to be the level of debt owed by the household. As shown in Figure 9, participants reported that the largest portion of their refunds go to repaying outstanding debts. Paying down debt improves household balance sheets and—though it is different from saving—is a productive use of tax refunds. Households with high-interest debt can use tax refunds to retire expensive loans and get back on track financially after missing payments.
Debt and its impact on refund saving are important factors in household financial management. The average amount of participants’ debt—including mortgages, student loans, and consumer debts—was nearly $46,000 at HFS1 and nearly $49,000 at HFS2. Over half of all participants have automobile, credit card, and student loan debt, and other common debts include medical, past due bills, and personal loans (Figure 13).
14 // R e f u n d t o S a v i n g s
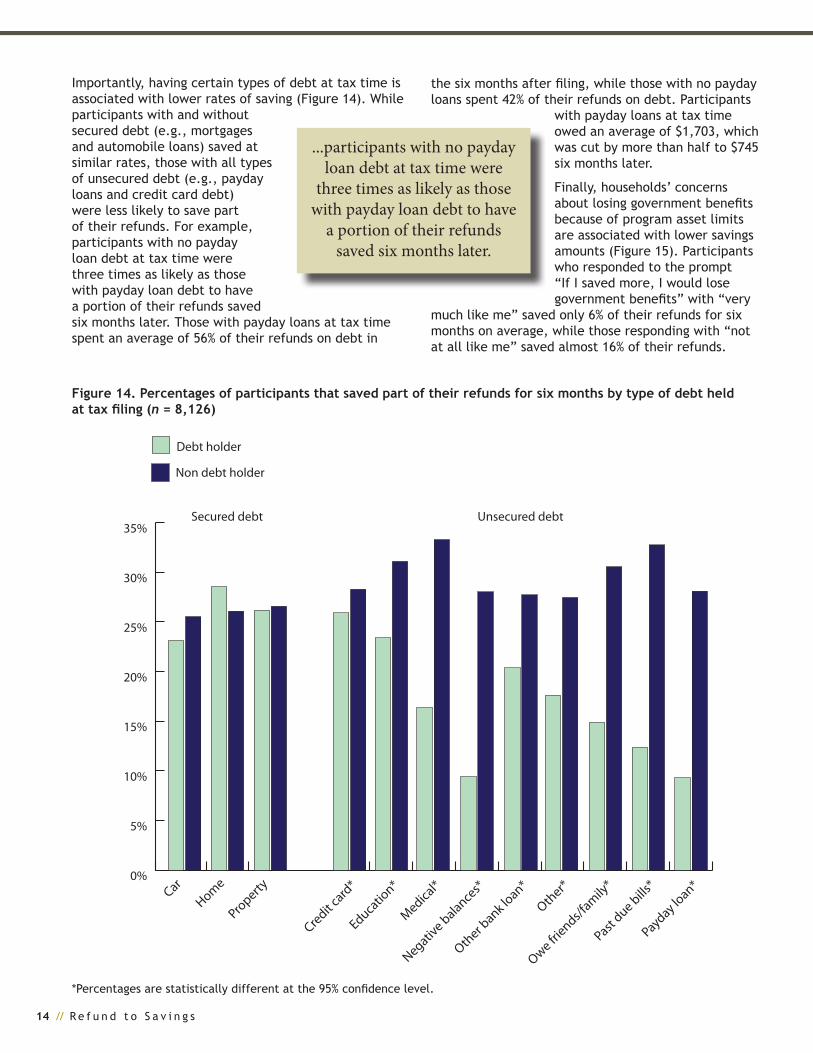
Importantly, having certain types of debt at tax time is associated with lower rates of saving (Figure 14). While participants with and without secured debt (e.g., mortgages and automobile loans) saved at similar rates, those with all types of unsecured debt (e.g., payday loans and credit card debt) were less likely to save part of their refunds. For example, participants with no payday loan debt at tax time were three times as likely as those with payday loan debt to have a portion of their refunds saved six months later. Those with payday loans at tax time spent an average of 56% of their refunds on debt in
figure 14. percentages of participants that saved part of their refunds for six months by type of debt held at tax filing (n = 8,126)
*Percentages are statistically different at the 95% confidence level.
0%
5%
10%
15%
20%
25%
30%
35%
Non debt holder
Debt holder
Payday loan*
Past due bills
*
Owe friends/f
amily*
Other*
Other b
ank loan*
Negative balance
s*
Medical*
Educatio
n*
Credit card
*
Property
HomeCar
Secured debt Unsecured debt
...participants with no payday loan debt at tax time were
three times as likely as those with payday loan debt to have
a portion of their refunds saved six months later.
the six months after filing, while those with no payday loans spent 42% of their refunds on debt. Participants
with payday loans at tax time owed an average of $1,703, which was cut by more than half to $745 six months later.
Finally, households’ concerns about losing government benefits because of program asset limits are associated with lower savings amounts (Figure 15). Participants who responded to the prompt “If I saved more, I would lose government benefits” with “very
much like me” saved only 6% of their refunds for six months on average, while those responding with “not at all like me” saved almost 16% of their refunds.

2 0 1 3 E v i d e n c e o f Ta x - T i m e S a v i n g i n a N a t i o n a l R a n d o m i z e d C o n t r o l Tr i a l // 15
figure 15. percentages of refunds saved after six months by concern over losing government benefits due to asset limits (n = 8,300)
*Statistically different proportions compared to neighboring category at 95% confidence level.
0%
2%
4%
6%
8%
10%
12%
14%
16%
18%
Very much like me*
Mostly like me
Somewhat like me
Not much like me
Not at all like me*
16%
11%10%
9%
6%
0%
5%
10%
15%
20%
25%
30%
35%
40%
45%
50%
Deposit
No deposit
Declined cr
edit card*
Overdrafte
d bank account
Skipped food*
Skipped prescriptio
n drugs*
Skipped dental care*
Skipped medica
l care*
Skipped a bill*
Skipped rent*
*Percentages are statistically different at the 95% confidence level.
Figure 16. Prevalence of financial hardship during the six months after tax filing by whether or not a participant deposited part of the tax refund (n = 7,624)
Experiencing financial shocks, having difficulty covering typical monthly expenses, holding high rates of debt, and being concerned about losing government benefits are challenges to helping LMI households save. These households have very little, if any, discretionary income available for saving. Yet, as this research shows, many households with financial constraints want to use their tax refunds in productive ways (e.g., paying down debt and setting aside savings), and some are able to do so.
do financial Products affect financial outcomes? Although causal direction is difficult to identify, there is a strong association between where participants put their tax refunds and several financial outcomes. Participants who deposited their refunds directly into a savings vehicle were significantly less likely to experience financial hardship in the six months after tax filing (Figure 16) and were significantly more likely to say they “certainly could” access at least $2,000 if an emergency arose in the next month (Figure 17).

16 // R e f u n d t o S a v i n g s
figure 18. percentages of participants that saved part of their refunds for six months by use of AfSs in the year before tax filing (n = 5,825)
Figure 17. Percentages of participants (in HFS2) confident in their ability to access $2,000 in a month for an emergency by whether or not they deposited part of the tax refund (n = 7,645)
*Percentages are statistically different at the 95% confidence level.
0%
5%
10%
15%
20%
25%
30%
35%
40%
Deposit
No Deposit
Certainly could*
Probably could
Probably could not
Certainly could not
31%
27%
24%
19% 20% 20%
25%
34%
*Percentages are statistically different at the 95% confidence level.
0%
5%
10%
15%
20%
25%
30%
35%
40%
Did not use AFS*
Used AFS*
17%
33%
Participants who reported using alternative financial services (AFSs) (e.g., payday lenders, check cashers, and pawn shops) in the 12 months before filing taxes (38%) were significantly less likely to have saved part of their refunds for six months than those who did not use AFSs. Among AFS users, 17% saved their refunds for six months, while 33% of those who had not used AFSs saved for six months (Figure 18).
wHAt typeS of SAvingS veHicleS Do tAx filerS wAnt to uSe?
The HFS asked participants which alternative methods for receiving their federal refunds they would like to have available. Thirty-nine percent of participants selected at least one alternative that they preferred to the method they actually used. The most popular option (chosen by 15% of participants) among the alternatives provided (Figure 19) is to pay debt directly with the refund. Other popular options include directing the refund to an existing retirement account (13%) or a new savings account (12%).
Figure 20 shows that the unbanked, about 6% of respondents, have different preferences from their banked counterparts when it comes to alternative ways of receiving refunds. Receiving refunds on prepaid debit cards is the option least attractive to the banked population but the option most attractive to unbanked filers. Over one third of unbanked respondents would
prefer prepaid debit cards to the method they used for receiving their refunds. Other popular options for unbanked respondents include new checking accounts (30%) and new savings accounts (23%).

2 0 1 3 E v i d e n c e o f Ta x - T i m e S a v i n g i n a N a t i o n a l R a n d o m i z e d C o n t r o l Tr i a l // 17
figure 19. percentages of participants interested in receiving their tax refunds in alternative ways (n = 17,901)
0%
2%
4%
6%
8%
10%
12%
14%
16%
Pay debt dire
ctly
New prepaid debit card
Add to exist
ing retir
ement acc
ount
New educatio
n account
New retir
ement acc
ount
New savings a
ccount
New check
ing account
6%
12%11%
9%
13%
6%
15%
Figure 20. Percentages of participants (in HFS1) interested in financial products by banked or unbanked status (n = 17,901)
0%
5%
10%
15%
20%
25%
30%
35%
Unbanked
Banked
Pay debt dire
ctly
New prepaid debit card*
Add to exist
ing retir
ement account*
New education account
New retir
ement account
New savings a
ccount*
New checking account*
*Percentages are statistically different at the 95% confidence level.

18 // R e f u n d t o S a v i n g s
conclusionThe R2S initiative, a collaboration between academic and industry partners, seeks to use low-cost, low-touch, scalable interventions to help LMI households increase tax-time saving and improve financial security and mobility. In 2013, the R2S team conducted a national randomized control trial testing the effectiveness of techniques informed by insights from behavioral economics to increase deposits of tax refunds into savings vehicles. A two-wave, longitudinal HFS followed the large-scale experiment to test the persistence of the impact over 6 months. In addition, further goals of the HFS were to help researchers gain deeper insight into the financial lives of LMI households and to better understand how tax refunds are used over time. The R2S experiment implemented in the TurboTax Freedom Edition software, HFS1, and HFS2 have produced important findings that can inform ongoing policy discussions about improving the financial well-being of LMI households.
Results suggest that low-cost, low-touch behavioral interventions can increase both the proportion of tax filers who deposit refunds directly into savings vehicles and the amounts of those deposits. Though these effects are modest, the project highlights the potential for large-scale impact. We estimate that R2S interventions encouraged more than 4,800 additional households to deposit part of their refunds into savings products than otherwise would have been expected to do so and generated a total of $5.92 million in additional savings deposited.
We also find that the impact of R2S interventions lasts for at least six months. Statistical analyses demonstrate that certain R2S interventions are associated with a greater likelihood of saving and higher savings amounts six months later. The estimated probability of saving a portion of the refund for six months was increased from 25% for control group members to 30% for participants
assigned to a 50% anchor group, while assignment to a 50% and 75% anchor group was associated with approximately 3 and 5 percentage point increases, respectively, in the amount of refund saved for six months.
The surveys reveal that there are a number of barriers to saving, including holding outstanding debt, having difficulty covering ongoing expenses, using AFSs, and fearing the loss of government benefits because of asset limits. The surveys also find that respondents—especially those in unbanked households—are interested in alternative means of receiving tax refunds.
While the R2S experiment focuses on saving at tax time, lessons learned are much broader and can be used to encourage saving in general. Infrastructural improvements are likely to impact key decisions outside of tax time (e.g., the point in time when employees choose how and where to receive their pay). Similarly, behavioral economics techniques (e.g., motivational prompts and anchors) can be repurposed for use in other savings or asset-building opportunities, including retirement savings decisions. Opt-out and other behavioral techniques are likely to have an even greater impact.
endnotes1. In tax year 2013, a taxpayer must have had an adjusted gross income (AGI) of less than $31,000, be active duty military with an AGI of less than $57,000, or qualify for the EITC to use the TurboTax Freedom Edition.
2. Data from Internal Revenue Service. (2012). 2012 IRS databook. Retrieved from http://www.irs.gov/pub/irs-soi/12databk.pdf
3. Tax filers could not be randomly assigned to treatment condition if they began their tax filing in another version of TurboTax and later moved to Freedom Edition.

2 0 1 3 E v i d e n c e o f Ta x - T i m e S a v i n g i n a N a t i o n a l R a n d o m i z e d C o n t r o l Tr i a l // 19
authorsmichal grinstein-weiss Associate Director Center for Social Development
Krista comer Program Manager Center for Social Development
Blair russell Senior Statistical Data Analyst Center for Social Development
clinton Key Research Officer The Pew Charitable Trusts
Dana c. perantie Project Manager Center for Social Development
Dan Ariely James B. Duke Professor of Psychology and Behavioral Economics Duke University
Suggested citationGrinstein-Weiss, M., Comer, K., Russell, B., Key, C., Perantie, D. C., & Ariely, D. (2014). Refund to Savings: 2013 evidence of tax-time saving in a national randomized control trial (CSD Research Report 14-03). St. Louis: Washington University, Center for Social Development.

Washington University in St. LouisCampus Box 1196One Brookings DriveSt. Louis, MO 63130
P: 314.935.7433F: 314.935.8661http://csd.wustl.edu